Article

Optimizing Solar-Powered EV Charging: A Techno-Economic Assessment Using Horse Herd Optimization

1
Department of Electrical Engineering, Malaviya National Institute of Technology, Jaipur 302017, India
2
Department of Electrical and Electronics Engineering Technology, University of Johannesburg, Johannesburg 2006, South Africa
*
Author to whom correspondence should be addressed.
Energies 2025, 18(17), 4556; https://doi.org/10.3390/en18174556
Submission received: 31 July 2025 / Revised: 18 August 2025 / Accepted: 19 August 2025 / Published: 28 August 2025
(This article belongs to the Special Issue Solar Energy and Resource Utilization—2nd Edition)

Abstract

Mass market adoption of EVs is critical for decreasing greenhouse gas emissions and dependence on fossil fuels. However, this transition faces significant challenges, particularly the limited availability of public charging infrastructure. Expanding charging stations and renewable integrated EV parking lots can accelerate the adoption of EVs by enhancing charging accessibility and sustainability. This paper introduces an integrated optimization framework to determine the optimal siting of a Residential Parking Lot (RPL), a Commercial Parking Lot (CPL), and an Industrial Fast Charging Station (IFCS) within the IEEE 33-bus distribution system. In addition, the optimal sizing of rooftop solar photovoltaic (SPV) systems on the RPL and CPL is addressed to enhance energy sustainability and reduce grid dependency. The framework aims to minimize overall power losses while considering long-term technical, economic, and environmental impacts. To solve the formulated multi-dimensional optimization problem, Horse Herd Optimization (HHO) is used. Comparative analyses on IEEE-33 bus demonstrate that HHO outperforms well-known optimization algorithms such as genetic algorithm (GA) and particle swarm optimization (PSO) in achieving lower energy losses. Case studies show that installing a 400-kW rooftop PV system can reduce daily energy expenditures by up to 51.60%, while coordinated vehicle scheduling further decreases energy purchasing costs by 4.68%. The results underscore the significant technical, economic, and environmental benefits of optimally integrating EV charging infrastructure with renewable energy systems, contributing to more sustainable and resilient urban energy networks.

1. Introduction

Electric vehicles (EVs) are a crucial solution for reducing greenhouse gas emissions from transportation and decreasing dependence on fossil fuels. As an environmentally friendly alternative to traditional vehicles, EVs have seen rapid adoption, with U.S. sales growing from 20,000 in 2010 to over 2 million by 2018 [1]. However, widespread adoption is still hindered by the limited availability of public charging infrastructure [2]. Although most EV charging occurs at home, public charging stations are crucial for overcoming range anxiety and enabling long-distance travel. With an estimated 100 million parking spaces at business locations across the U.S. [1], parking lots represent a promising opportunity for the deployment of electric vehicle supply equipment (EVSE). However, the strategic placement of EVCS and parking lots is crucial for minimizing power losses and ensuring grid stability. Recent studies have employed advanced optimization techniques to determine optimal locations for various types of EV charging infrastructure. For instance, a study by Li et al. [3] proposed the whale optimization algorithm for EVCS locations aiming to minimize overall costs and carbon emissions, demonstrating the importance of incorporating dynamic demand patterns into location planning. Altaf et al. [4] utilized Particle Swarm Optimization (PSO) for the optimal placement of EVCS and effectively reduced both real and reactive power losses, improving voltage stability and unbalanced generation, highlighting the significance of optimally integrating EV charging stations in a radial distribution system. H Asghari Rad et al. proposed a model in [5] to determine the optimum location and capacity of a parking lot to maximize the benefit of the parking lot owner. However, these studies primarily focus on either residential or commercial zones and often do not simultaneously consider I-FCS. A study by Chakraborty et al. [6] focused on planning a fast-charging infrastructure for EVs employing a multi-objective PSO approach to minimize power loss and voltage deviations. The authors demonstrated that by using real time dynamic pricing, the benefit of the owner increased significantly. Other studies have focused on the grid impact and control strategies: In [7], the author used solar power in the EV parking lot so that the power drawn from the grid can be reduced in order to maximize the profit of the parking lot owner. The impact of a renewable integrated EV residential parking lot is analyzed in [8], and the effectiveness of the results is obtained by the PSO algorithm based on a parking lot. In [9], a study was conducted on a commercial parking lot, and results show the impact of the load of the parking lot on the distribution system. The importance of EV fast charging stations (FCSs) is analyzed in [10], and techno-economic comparison of FCSs is also performed. The impact of both home and public EVCS on the distribution system can be mitigated by smart charging [11]. In [12], Citroni, R. et al. highlight the potential for integrating self-sufficient, energy-efficient devices into urban energy networks, which can further reduce reliance on grid power and enhance the overall system sustainability. It may be worth noting that unplanned placement of an EV charging station may adversely affect the distribution system with consequent substantial power loss and an unsatisfactory voltage profile.
The exploration of the possible integration of solar photovoltaic (SPV) systems into the charging station is another important aspect. Integrating SPV systems into a charging station offers additional benefits as solar energy production aligns closely with daytime EV charging demand. The PV also reduces reliance on the utility grid, and provides shade and protection through solar canopies. While the initial investment remains significant, the value proposition of solar-powered EVSE in parking lots strengthens as EV adoption increases. Oruganti et al. [1] conducted extensive studies on solar PV and level 2 EV charging installation cost benefit design for a commercial workplace parking lot in Texas. The authors demonstrated that the financial viability of the project is not secure when assessed solely on the basis of direct cash flows. Deshmukh and Pearce [2] evaluated the viability of installing solar charge parking PV awnings over parking spaces with integrated EV chargers. The study also showed that the projects do not yet provide enough direct profits as power costs increase. Junid et al. [13] propose a model that has excess solar energy at telecom base stations to power public EV charging stations. This may provide considerable additional revenue for telecom operators in addition to cutting consumer charging costs. However, comprehensive cost–benefit analyses (CBAs) that simultaneously consider optimal location, PV sizing, and integration across different zones are scare in the current literature. In [14], A. Varone et al. presents an Al-designed software platform to efficiently power management at an SPV-powered parking lo; however, the study lacks in optimum location of the parking lot. Despite these insights, the literature lacks comprehensive studies that integrate PV sizing with the optimal placement of EVCS, particularly in diverse zones such as residential, commercial, and industrial areas. Conducting a cost–benefit analysis is also vital for assessing the economic viability of integrating rooftop solar PV systems into commercial EV parking lots. Such analyses consider capital expenditures, operational costs, energy savings, and potential revenue streams.
The objectives of this paper are as follows:
  • Develop an optimization framework that determines the best locations for residential, commercial, and industrial EV charging infrastructure based on power loss minimization in the distribution systems.
  • Develop an optimization framework to determine the optimal size of rooftop solar PV systems for integration into residential and commercial parking lots.
  • In the literature, many algorithms such as PSO and GA have been applied to solve the above optimization problems. In this paper, HHO has been explored to solve the optimization problem.
  • Carry out a thorough cost–benefit analysis of the commercial EV parking lot in order to maximize the profit of the parking lot owner.
This study explores the potential of parking garages as sites for solar-powered EV charging, focusing on key factors such as economic feasibility, system design challenges, and long-term viability. Drawing from recent research, we present a cost–benefit analysis from the owner’s perspective over a 30-year timeframe. The findings offer quantitative insights into the financial performance and design considerations necessary for implementing effective solar PV EVSE systems. In this research work, the HHO technique is employed to determine the optimal placement of various EV loads and the appropriate sizing of rooftop PV panels on parking lots. To the best of our knowledge, this optimization technique has not yet been applied in the context of power distribution systems, and therefore, we aim to explore its potential in this domain.
The HHO algorithm is a population-based, nature-inspired metaheuristic that emulates the social behavior and dynamics observed in horse herds. In the natural world, horses rely on cooperative group behavior, individual decision making, and strategic movement to achieve goals such as locating food sources, avoiding threats, and maintaining group cohesion. These behaviors are mathematically modeled in HHO to effectively balance exploration (global search) and exploitation (local search) in solving complex optimization problems. In this study, using the HHO algorithm, we propose a novel methodology for identify the most suitable locations for installing RPL, CPL, and I-FCS within a power distribution system along with the optimal sizing of rooftop solar PV systems at RPL and CPL. The motivation for utilizing HHO lies in its superior ability to handle complex, high-dimensional optimization problems. It demonstrates high efficiency in both the exploration of the global search space and the exploitation of local optima, achieving optimal solutions rapidly with low computational cost and complexity. Comparative results indicate that the proposed approach outperforms conventional optimization techniques such as GA and PSO in terms of both accuracy and efficiency.
The remainder of this paper is structured as follows: Section 2 describes the problem overview and formulation, including the objective function, constraints, and details of the solar rooftop photovoltaic system with its energy, economic, and environmental performance assessments. Section 3 outlines the proposed HHO methodology. Section 4 presents the case study, simulation results, and comparative analyses. Finally, Section 5 concludes the paper and outlines possible directions for future work. Nomenclatures and List of Acronyms presents the list of nomenclatures and list of acronyms.

2. Problem Overview and Formulation

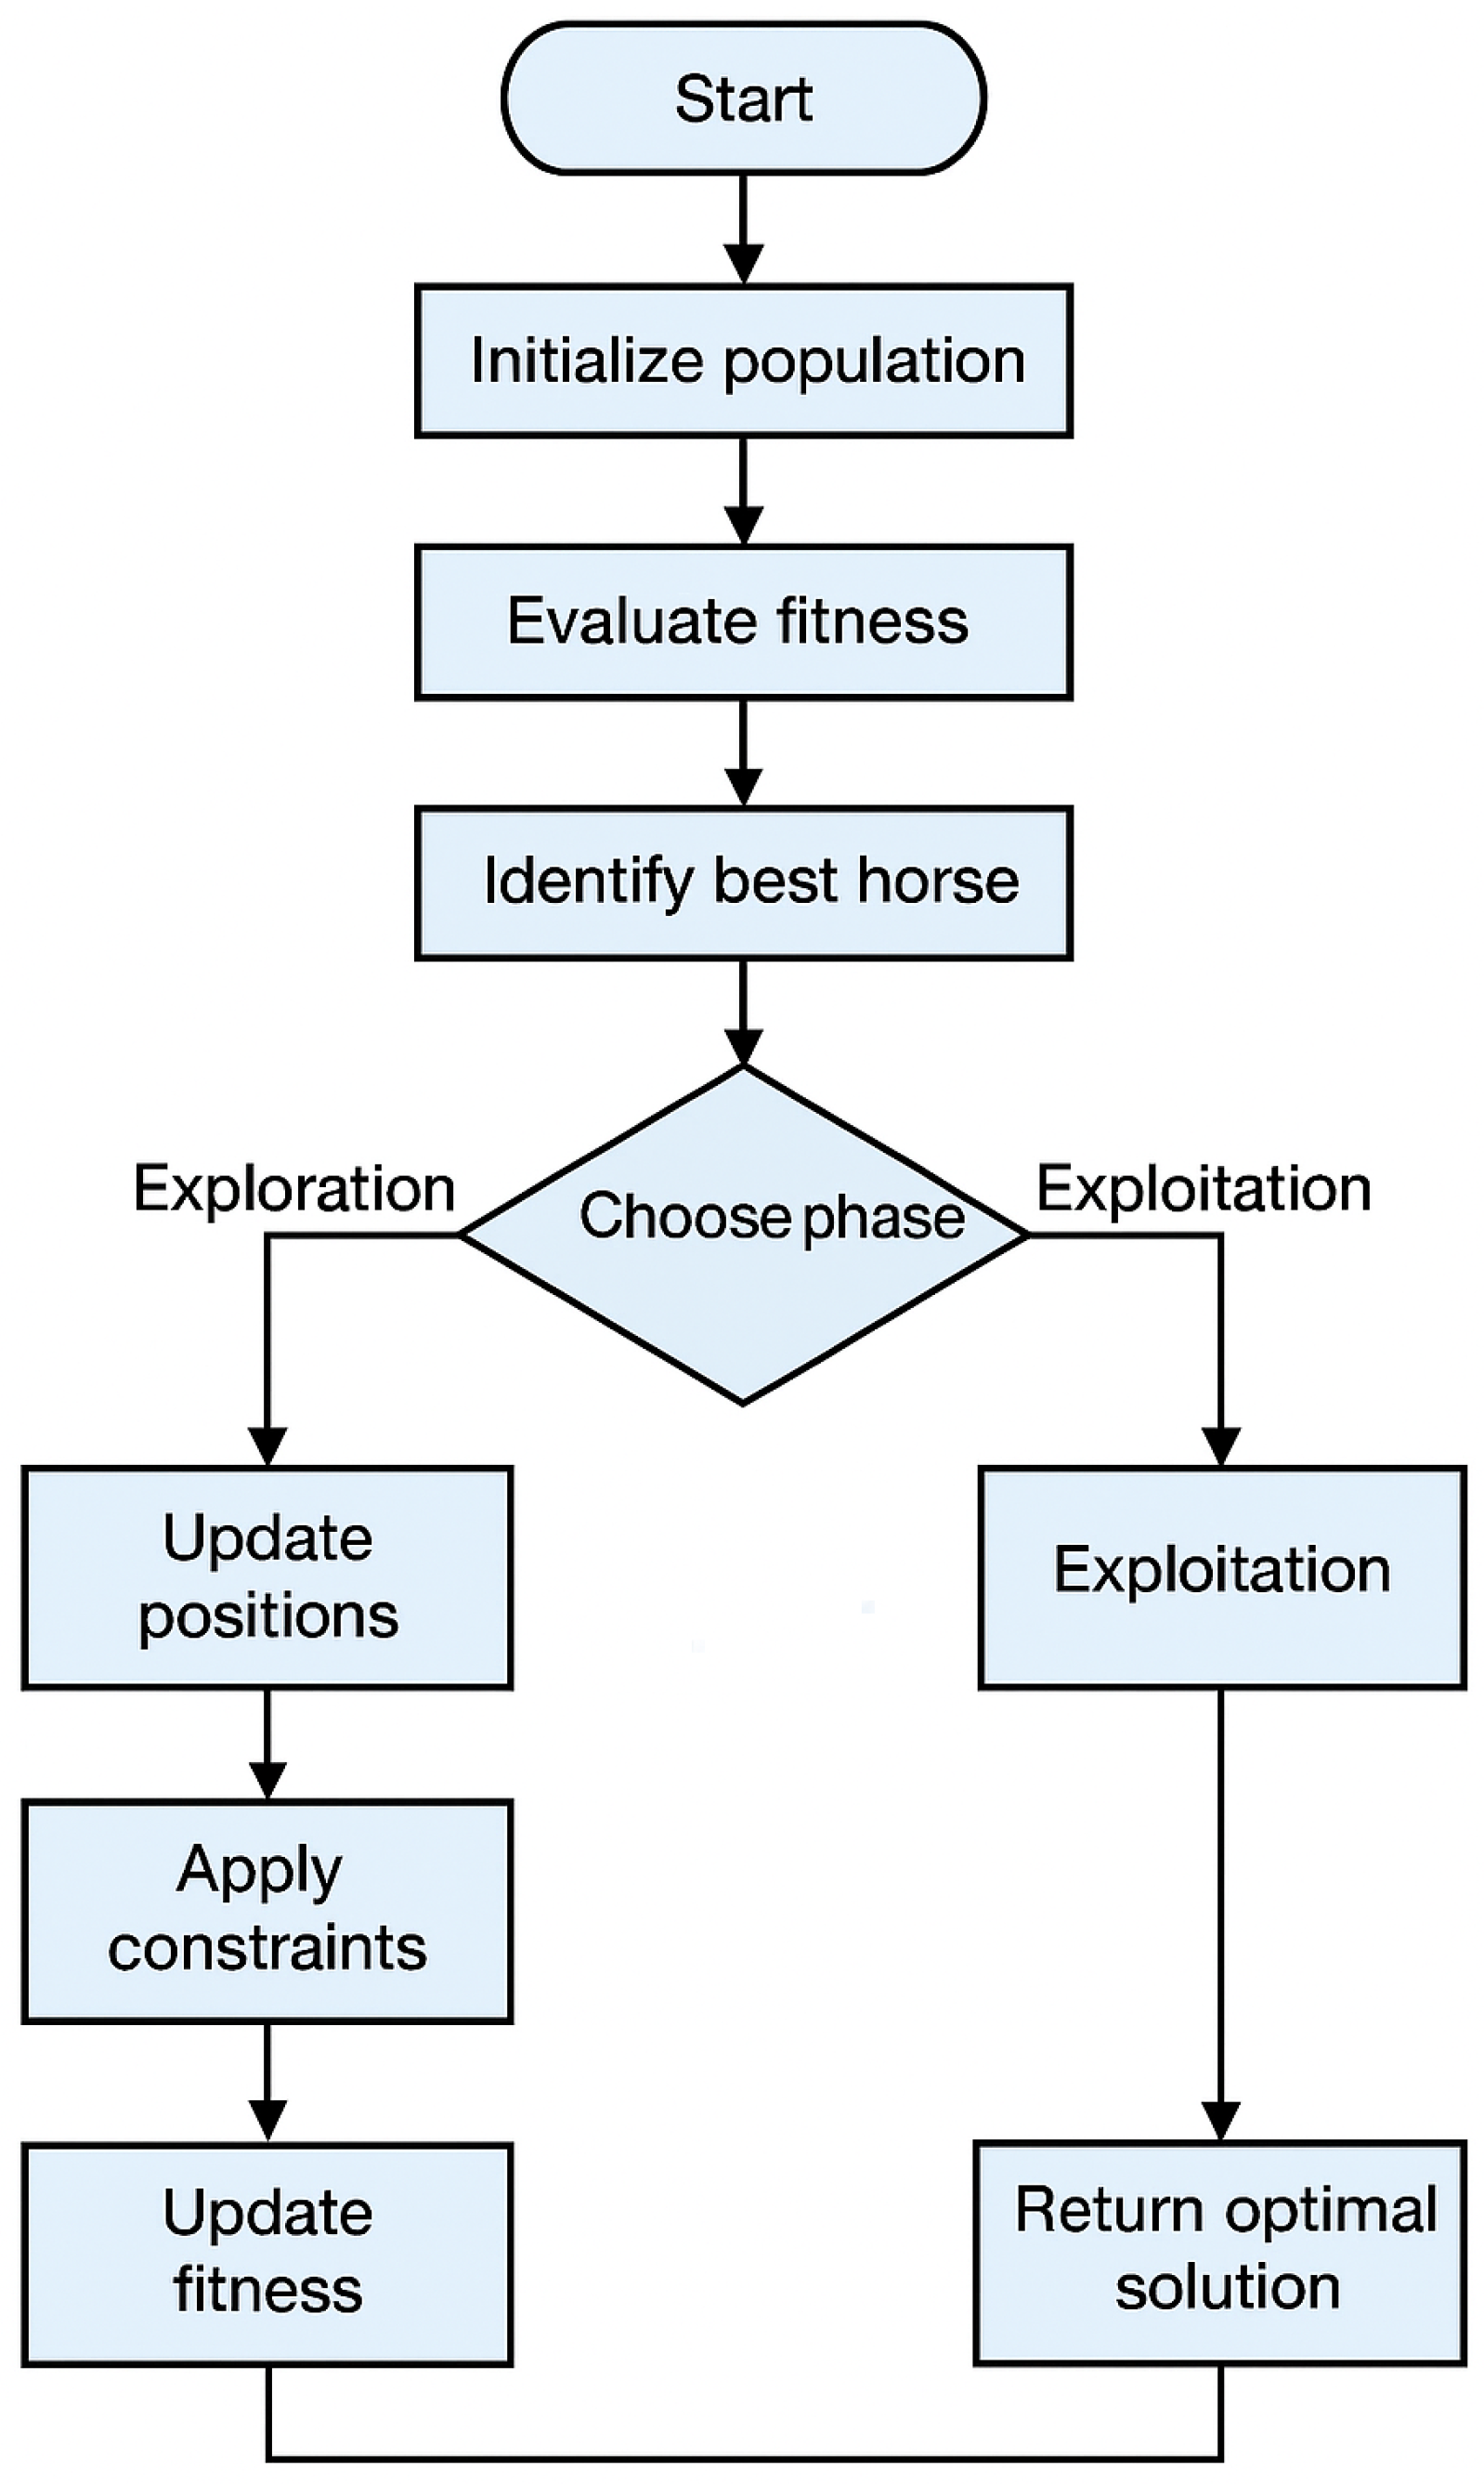
In this paper, the IEEE 33 bus system is divided into three distinct zones: residential area, commercial area, and industrial area. Residential and commercial areas both have an EV parking lot, whereas FCS is installed in an industrial area. HHO (the flowchart is given in Figure 1) is used to find the optimal location for both EVPL and FCS. Both parking lots also have a rooftop SPV, and the optimum size for the SPV is also determined by the HHO. Analysis of energy performance, economic performance, and environmental performance for the rooftop SPV system is performed in Section 2.3. Cost–benefit analysis for the CPL is performed from the perspective of the parking lot. The summarized contributions of this study are as follows:
  • Proposed a framework to determine optimal locations where I-FCS, CPL, and RPL should be placed to minimize losses;
  • Developed HHO to solve the proposed optimization problem;
  • Provided the energy, economic, and environmental benefits of integrating PV with EVs in the distribution system.

2.1. Objective Function

The optimal locations of I-FCS, CPL, and RPL are determined through optimization of power loss. The objective function is represented mathematically by
P Loss = 1 2 k = 1 24 i = 1 N j = 1 N G i , j V i , k 2 + V j , k 2 2 V i , k V j , k cos ( δ j , k δ i , k )

2.2. Constraints

The power balance and voltage constraint equations [15] are essential to power flow analysis because they guarantee that the system runs within stable bounds. Usually, power injections and bus admittance matrices are used to formulate these equations expressed as follows:
S i = P i + j Q i
P i = V i k = 1 N V k Y i k cos ( θ i k + δ k δ i )
Q i = V i k = 1 N V k Y i k sin ( θ i k + δ k δ i )
V min , i V i V max , i
where S i is complex power, P i and Q i are real and reactive power injected at bus i, V i and V k are voltage magnitudes at buses i and k, δ i and δ k are voltage phase angles at buses i and k, | Y i k | and θ i k are magnitude and phase angle of the admittance matrix element Y i k , V m i n , i and V m a x , i are lower and upper voltage limits at bus i, and N is the number of total buses.

2.3. Solar Rooftop Photovoltaic System

The SPV system is assumed to install on the roof of a commercial parking lot in Jaipur, India. The system has a nominal capacity of 400 kW and comprises 1455 PV modules, all installed oriented southwards with a tilt angle of 25° and an azimuth angle of 180°. The modules are based on multi-crystalline silicon technology, specifically the ASP-7-320 model manufactured by Mundra Solar Pvt. Ltd. (Mundra, India). Each module has a rating of 275 Wp and has an efficiency of 16.32% under Standard Test Conditions (STCs). Collectively, the modules occupy a total surface area of 2850 sq. m, covering 1.96 m2 by each individual module, which is approximately 90% of the total available area. Table 1 represents the Specifications of solar PV system.

2.3.1. Energy Performance

(i)
Performance ratio (PR)
It serves as a PV system’s energy-generating performance indicator. It explains all of a PV system’s losses while it operates under actual circumstances.
P R = E actual E theoretical
E theoretical = Installed Capacity × Solar Irradiance
where E a c t u a l is actual energy output and E t h e o r e t i c a l is theoretical energy output.
The performance ratio of a PV system reflects its operational efficiency. A higher PR indicates that the system is operating near its rated capacity, while a lower PR points to energy losses or potential faults within the system. Typically, the PR ranges between 60% and 90%, depending on varying environmental conditions [16].
(ii)
Energy density ( E d )
It is described as the yearly power produced by a PV system’s array per unit area. The available area’s energy generation can be approximated using this parameter. It can also be used to contrast how well various PV systems perform in terms of energy. It is given by [17].
E d = E a , out A a
(iii)
Energy payback time (EPBT)
“It refers to the amount of time required for the SPV system to recover the energy used in its manufacturing, installation, and maintenance over the course of its whole life.” The net energy (NE) of the system is evaluated annually to determine the EPBT. The EPBT is the amount of time needed for the system’s net energy to drop to zero.
E a , out / year · t = 1 n ( 1 d ) t 1 = E em
Here, d denotes the degradation rate of the polycrystalline silicon modules, n represents the total lifespan of the system, and t indicates the time elapsed (in years).
The PV system’s annual degradation rate was determined to be 0.6% in the current investigation [18]. The concept of NE has been established to determine the system’s EPBT. The system’s net energy is calculated annually until it equals zero, at which point the system’s EPBP is determined.
(iv)
Energy return on energy invested (EROI)
The ratio of the PV system’s total power production to the total energy input used during its lifetime. It forecasts how well the installed PV system will use electricity.
EROI = n EPBT

2.3.2. Economic Performance

(i)
Cost of electricity (COE)
It is defined as the ratio of the whole life-cycle costs (LCCs) of the PV system to its lifetime energy production.
COE = LCC Energy production over its lifetime
Energy production over its lifetime = t = 1 n E a , out · ( 1 d ) t 1
LCC = C + C M R + C R C S
C M R = M · ( i + 1 ) n 1 i ( i + 1 ) n
for a 15-year life of PCU,
C R = R 15 · 1 ( i + 1 ) 15
The salvage value of SPV systems is projected to be 20% of their capital cost at the end of their operational life. The value of capital cost after n years,
P n = P o · ( 1 d ) n
C S = 20 % of P n
where d is the depreciation rate and i is the annual interest rate/ inflation rate.
(ii)
Payback period (PBP)
The calculation of the entire duration for the system to recover its initial investment serves as an assessment indication. The system’s PBP has been computed using the net present value (NPV). The payback period is the amount of time required to bring the system’s net present value to zero.
NPV = t = 0 n Annual Cash Flow ( 1 + i ) t Initial Investment
Annual Cash Flow = j = 0 n E a , out kWh year ( 1 + d ) j · C E INR kWh

2.3.3. Environmental Performance

(i)
Carbon footprint emission ( C F e )
It includes the net greenhouse gas emissions produced throughout the manufacturing process of the various components of the photovoltaic system. The C O 2 discharge in India varies in the range of 0.82–0.91 kg per unit of energy generated by the thermal power plant [19]. Here, for approximation, the average is taken, i.e., 0.865 kg/kWh. In India, transmission and distribution losses are approximately 20.7% [19]. These losses raise the average emission per unit C O 2 to 1.09 kg.
Carbon footprint emission by the system in the entire life = E em ( kWh ) × 1.09 ( in kg )
CF e = E em ( kWh ) × 1.09 n ( years ) ( in kg per year )
(ii)
Carbon footprint mitigation ( C F m )
It is defined as the reduction in C O 2 emission achieved by electricity generation from the photovoltaic system, compared with the emissions produced by a coal-fired thermal power plant to generate an equivalent amount of electricity.
Annual CO 2 mitigation = E a , out kWh year E em ( kWh ) n ( years ) × 1.09 ( in kg )
The difference between C O 2 emissions and mitigation over the system’s lifetime is used to determine the installed rooftop solar system’s net mitigation of C O 2 .
Net carbon footprint mitigation:
C F m = t = 1 n E a , out kWh yr · ( 1 d ) t 1 E em ( kWh ) × 1.09 × 10 3 ( in tons )
1 Ton = 10 3 kg
Carbon footprint emission(before implying solar):
C F b s = P b s × 1.09 ( kg / day )
Carbon footprint emission(after implying solar):
C F a s = P a s × 1.09 + C F e ( per day )
Net carbon footprint savings:
C F N e t = CF bs CF as CF bs × 100 ( in   % )

2.4. Mathematical Modeling of Cost–Benefit Analysis

2.4.1. EV Charging

The EV battery’s State of Charge (SOC) determines how much energy is needed to charge it. A mathematical expression for charging and discharging an EV battery can be written as
E req = V c SOC req SOC cr
E T = E req
E avl = V c SOC cr SOC min
T c = E req P ch
T c = SOC 2 SOC cr SOC 2 SOC cr t 1 + ( t 3 t 1 ) + SOC req SOC 4 SOC 5 SOC 4 t 4 t 3
P L , k = V c , k SOC 2 SOC 1 t 1 + SOC 3 SOC 2 t 2 t 1 + SOC 4 SOC 3 t 3 t 2 + SOC 5 SOC 4 t 4 t 3

2.4.2. Cost–Benefit Analysis

Following equations are used to perform cost benefit analysis at the CPL.
C bs = i = 1 24 P bs , i · σ i
C as = i = 1 24 P as , i · σ i + C s

2.5. Scheduling of Vehicles

Efficient scheduling of electric vehicle (EV) charging from high-price periods to low-price periods is essential to maximize the profitability of an EVPL operator. In this study, any time slot where the electricity price exceeds 90% of the peak price is classified as a High Real-Time Pricing (RTP) Zone. If a vehicle is initially scheduled to charge during a high RTP zone, the charging schedule will be adjusted to shift charging from high RTP periods to low RTP periods—provided that there is sufficient remaining time before the vehicle’s scheduled departure to complete the required charging. If such a shift is not feasible due to time constraints, charging will proceed even during high RTP periods to ensure that the vehicle is adequately charged. The classification of a high RTP zone is defined by the following condition:
P H ( t ) = 1 , if P ( t ) 0.9 · P max 0 , otherwise
where
  • P H ( t ) : indicator for high RTP at time t;
  • P ( t ) : electricity price at time t;
  • P max : peak electricity price over the scheduling horizon;
  • P H ( t ) = 1 : indicates a high RTP zone;
  • P H ( t ) = 0 : indicates a low RTP zone.

Constraints

  • Charging or discharging of an EV should be in between arrival and departure time of that vehicle.
  • The SOC of an EV at any instant neither goes below the minimum SOC nor exceeds the required SOC value.
  • The charging rate of a battery at any instant should not exceed the charger rating.
  • The utilized solar power at any instant should not exceed the solar generation at that instant.
T ar , k T d , k T dep , k
SOC min SOC k , t SOC req , k
Ch r , t Ch r max , t
P s , t P s max , t

3. Methodology

In this section, we will illustrate the detailed steps of the Horse Herd Optimization (HHO). Then, the proposed method based on HHO is used to solve the problem of optimal location of EVPLs and FCS, later on the optimal size of SPV at the rooftop of EVPLs in a radial distribution network.
  • Horse Herd Optimization (HHO)
HHO is a metaheuristic optimization algorithm that draws inspiration from the social behaviors of horse herds. Horses exhibit group dynamics, cooperation, and individual decision making to achieve objectives such as finding food, avoiding predators, or maintaining group cohesion. These principles are abstracted and applied to optimization problems.
  • Algorithm Summary
  • Initialize the positions of horses randomly.
  • Evaluate fitness for all horses.
  • Repeat until termination:
    • Apply exploration or exploitation based on iteration progress.
    • Update positions using herd dynamics.
    • Evaluate fitness and update x best .
  • Return x best as the optimal solution.

3.1. Initialization

A population of horses is represented as
X = { x 1 , x 2 , , x n }
where x i is the position of the ith horse in a d-dimensional search space, as follows:
x i = { x i , 1 , x i , 2 , , x i , d }

3.2. Fitness Evaluation

The fitness of each horse is assessed based on the value obtained from the objective function f ( x ) . The best position in the herd is
x best = arg min x X f ( x ) ( for minimization problems )

3.3. Exploration Phase

In the exploration phase, the movement of a horse is given by
x i ( t + 1 ) = x i ( t ) + r 1 · ( x j ( t ) x i ( t ) ) + r 2 · ( x k ( t ) x i ( t ) )
where
  • x j ( t ) and x k ( t ) are random positions of other horses in the herd;
  • r 1 and r 2 are random variables between [ 0 , 1 ] .

3.4. Exploitation Phase

In the exploitation phase, horses move towards the best-known position, as follows:
x i ( t + 1 ) = x i ( t ) + s · ( x best ( t ) x i ( t ) ) + ϵ
where
  • s is a scaling factor that decreases over iterations;
  • ϵ is a small random value to avoid local optima.

3.5. Herd Dynamics

The influence of the leader ( x best ) and social interactions is modeled as
x i ( t + 1 ) = α · x best ( t ) + ( 1 α ) · x i ( t ) + β · Δ
where
  • α , β are weight factors
  • Δ is a perturbation caused by neighboring horses.

3.6. Boundary Handling

To ensure that horses stay within the search space,
x i , j ( t + 1 ) = lower _ bound j , if x i , j ( t + 1 ) < lower _ bound j upper _ bound j , if x i , j ( t + 1 ) > upper _ bound j x i , j ( t + 1 ) , otherwise

3.7. Termination Criteria

The algorithm stops if any of the following conditions are satisfied:
  • A predefined maximum number of iterations is reached;
  • The fitness reaches an acceptable error threshold.

4. Case Study and Results

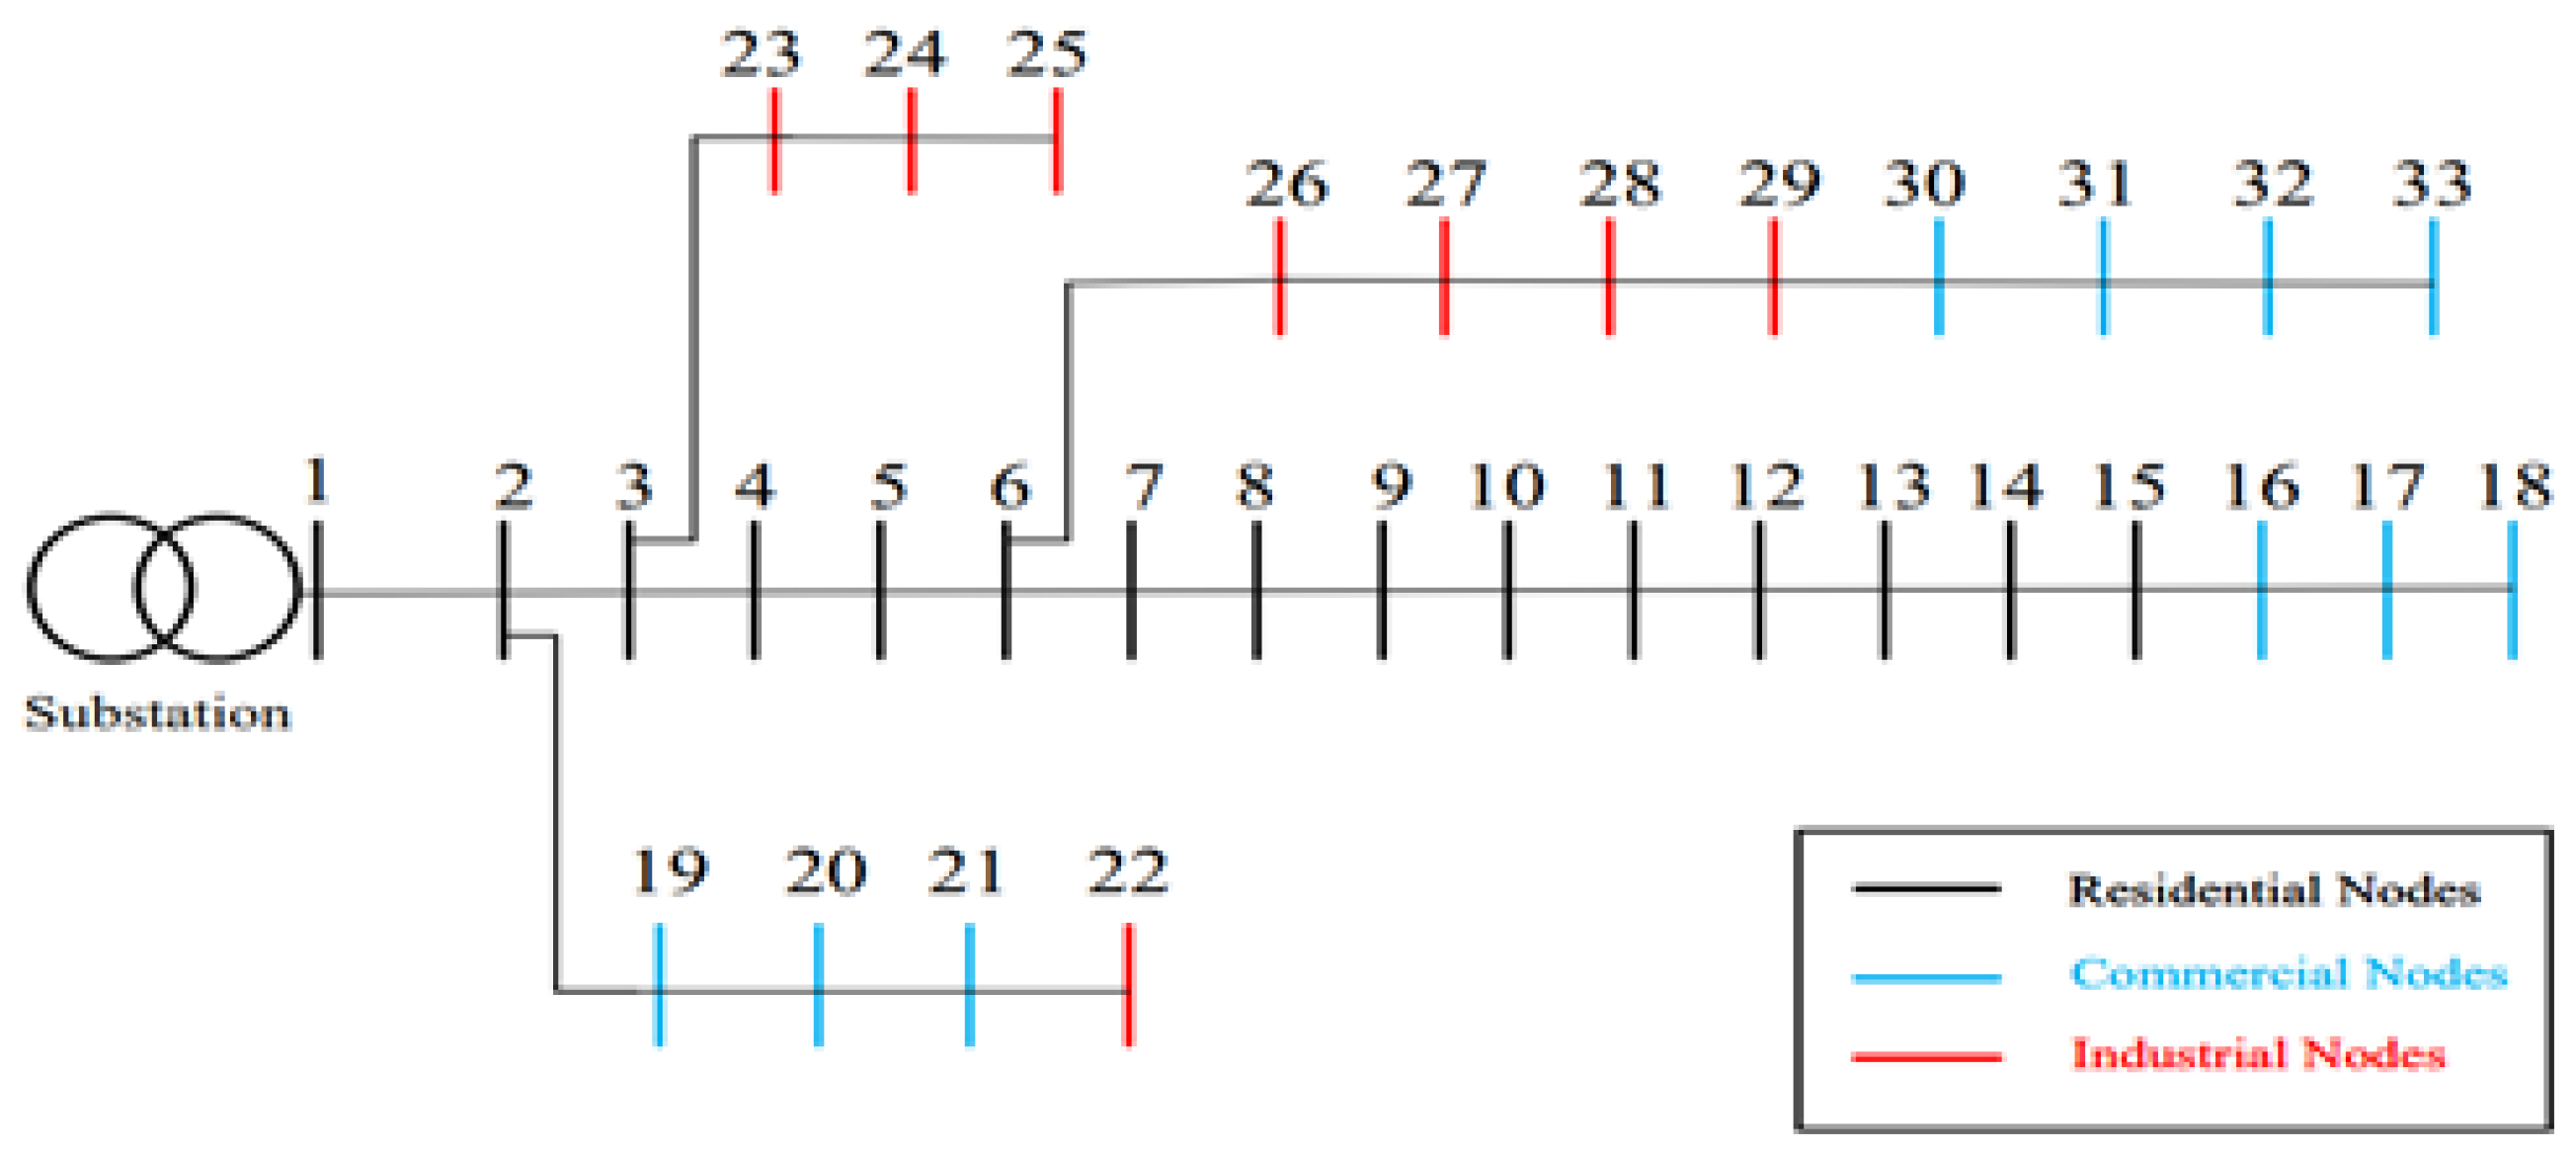
In this section, the results obtained using the Horse Herd Optimization (HHO) algorithm for the IEEE 33-bus distribution network are presented. The system’s peak load demand is 3.715 MW, and Figure 2 illustrates a single-line diagram of the system [20]. Simulations were carried out in MATLAB R2023b on a Windows 10-based personal laptop equipped with an Intel(R) Core(TM) i5 CPU @2.53 GHz and 6 GB of RAM. For this analysis, the distribution network is categorized into three consumer classes: residential (R), commercial (C), and industrial (I), as shown in Figure 2. Table 2 shows allocated nodes and class-specific demand.
System Description: The 33-bus distribution system was divided into the following three distinct zones:
Residential Area: contains an EVPL with a rooftop SPV;
Commercial Area: includes an EVPL equipped with a rooftop SPV;
Industrial Area: hosts a fast-charging station (FCS).
As shown in Figure 2, feeders 1 to 15 are dedicated for residential users; similarly, feeders from 22 to 29 are specified for industrial users, and feeders from 16 to 21 and 30 to 33 are allocated to commercial users. The line voltage of the system is 12.66 kV, whereas the nominal active and reactive demand of the system are 3715 kW and 2300 kVA, respectively.
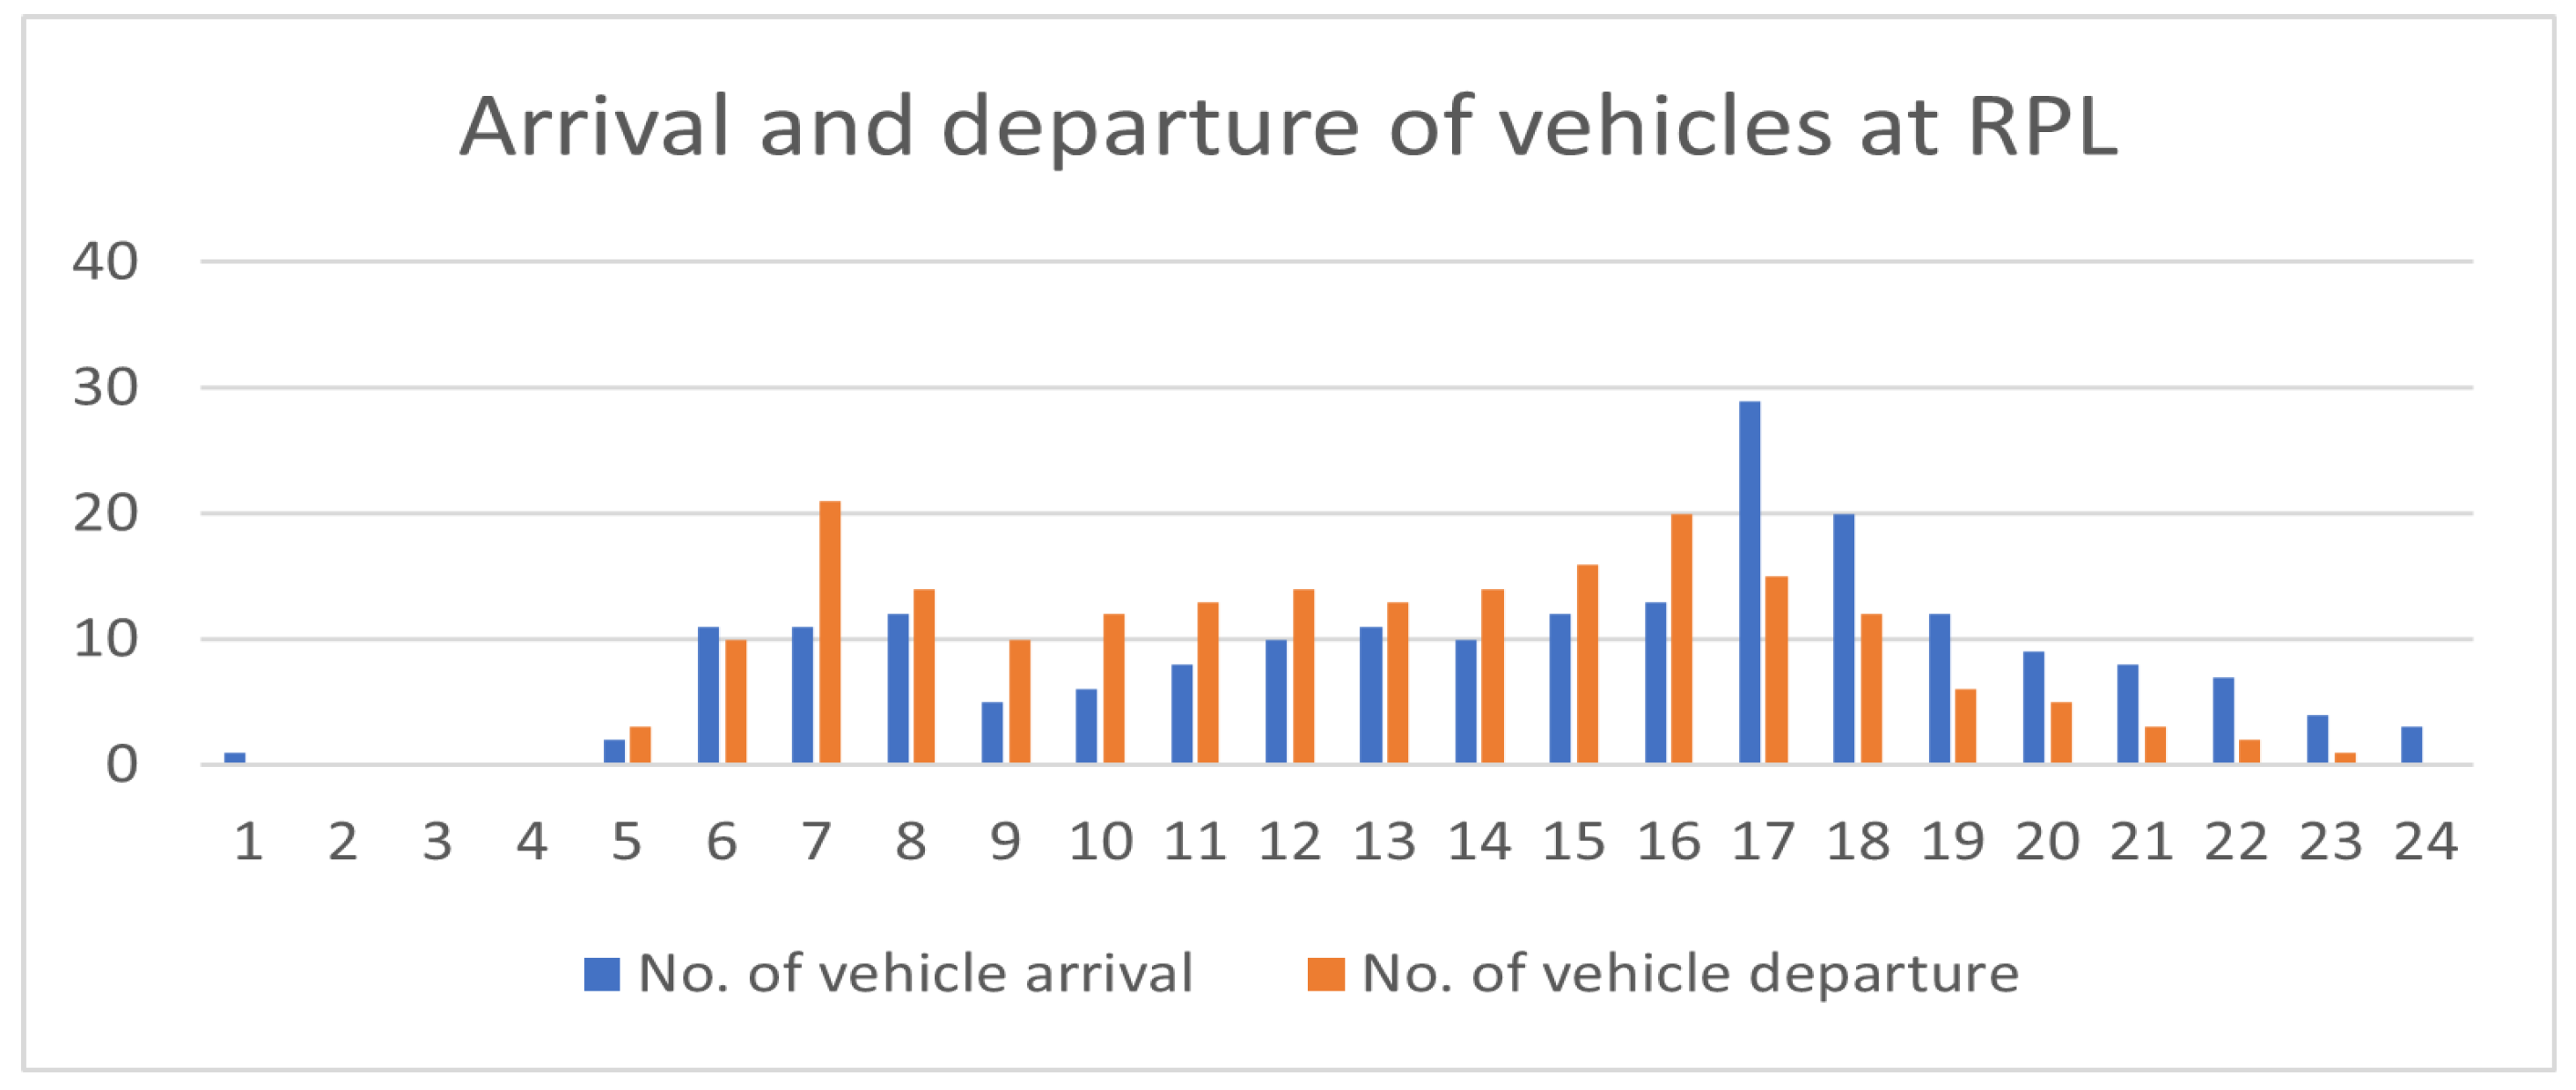
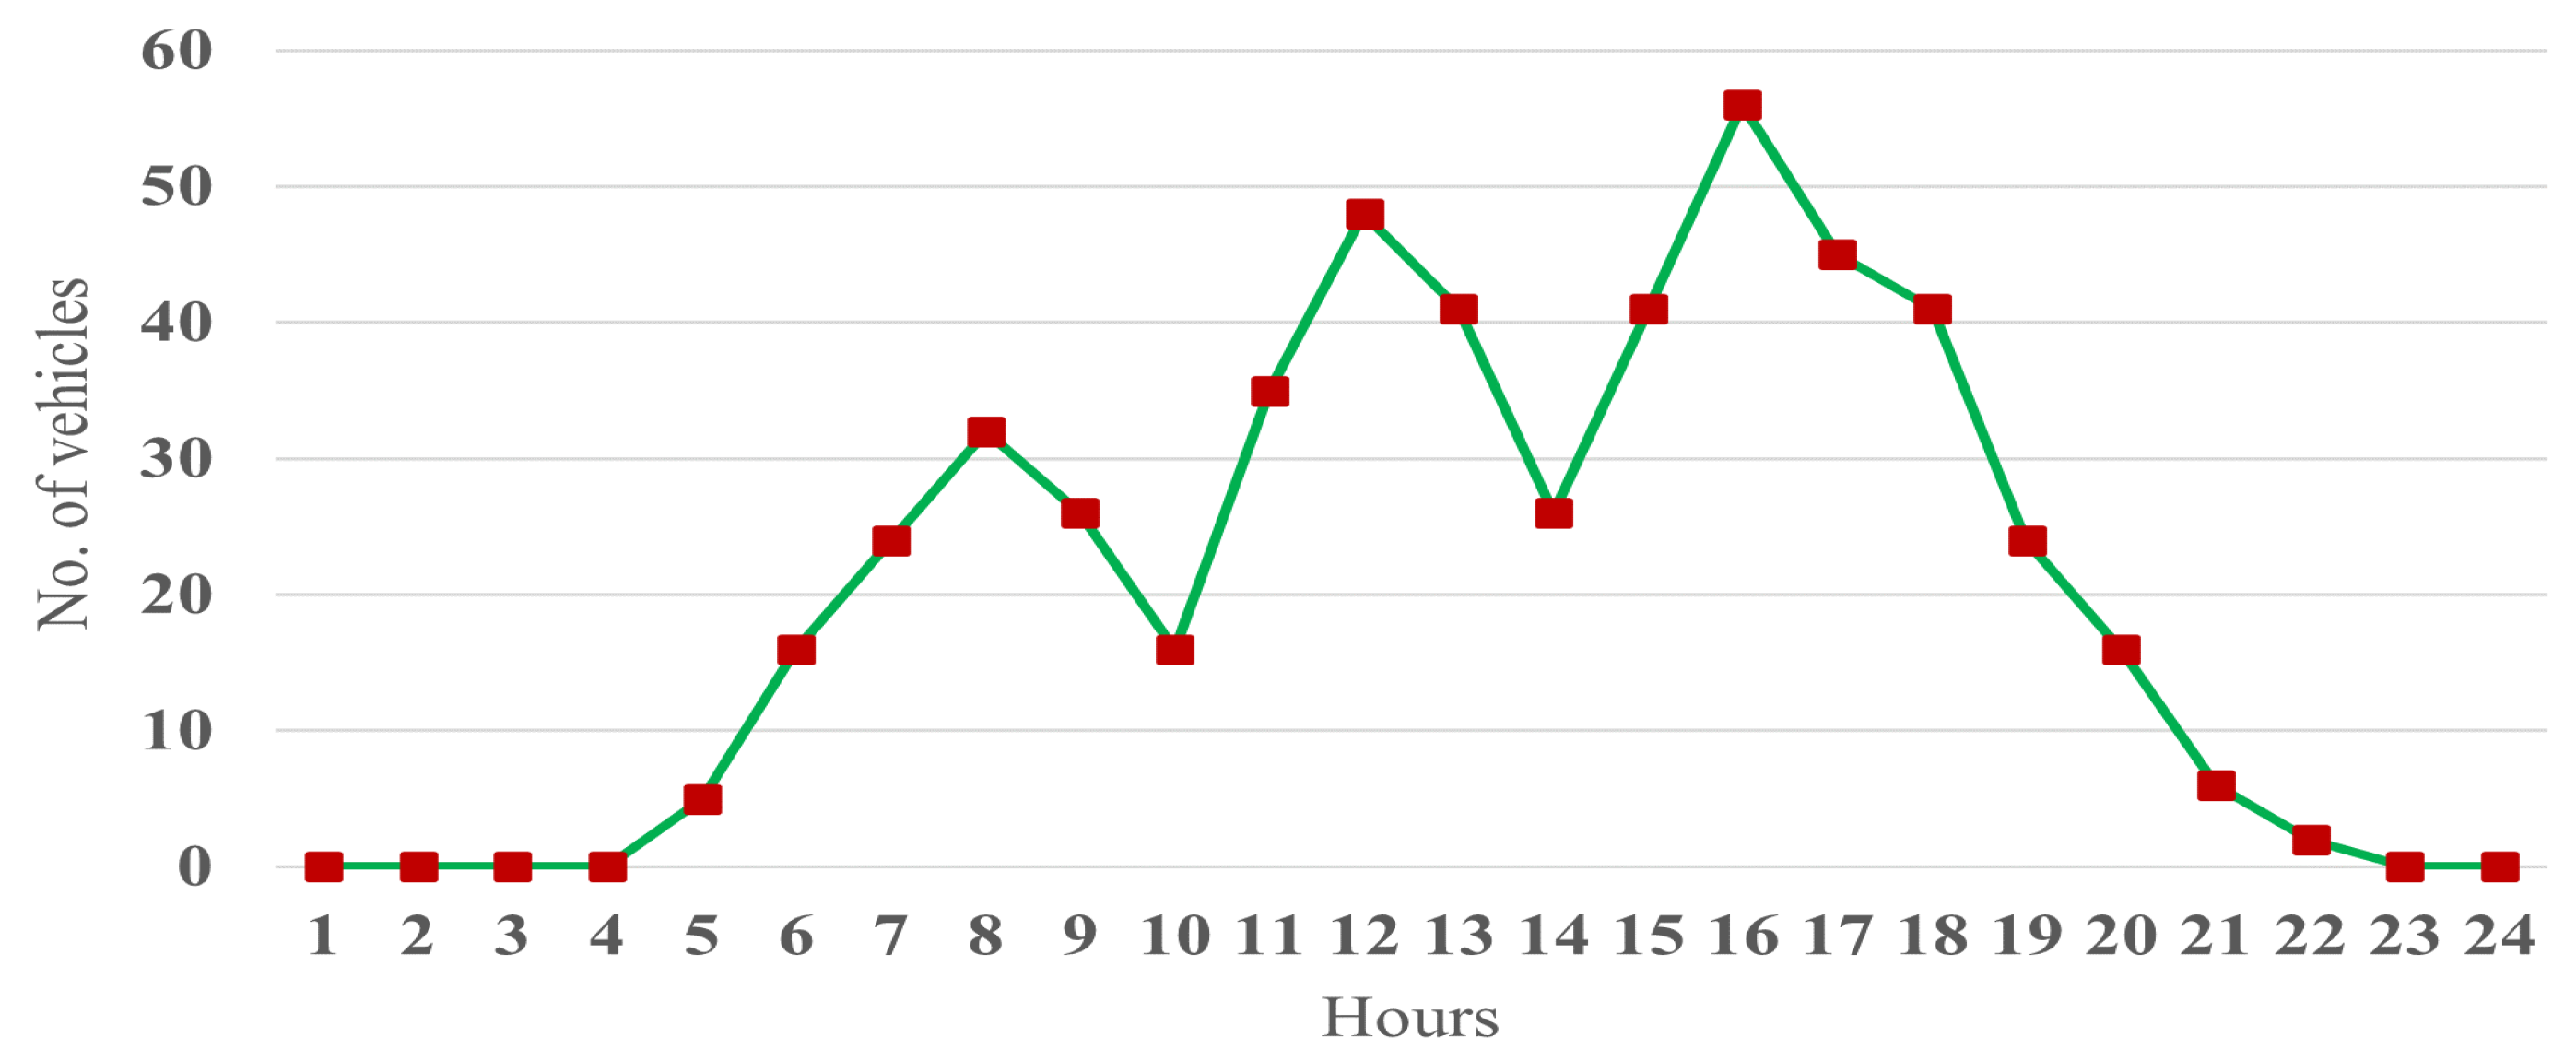
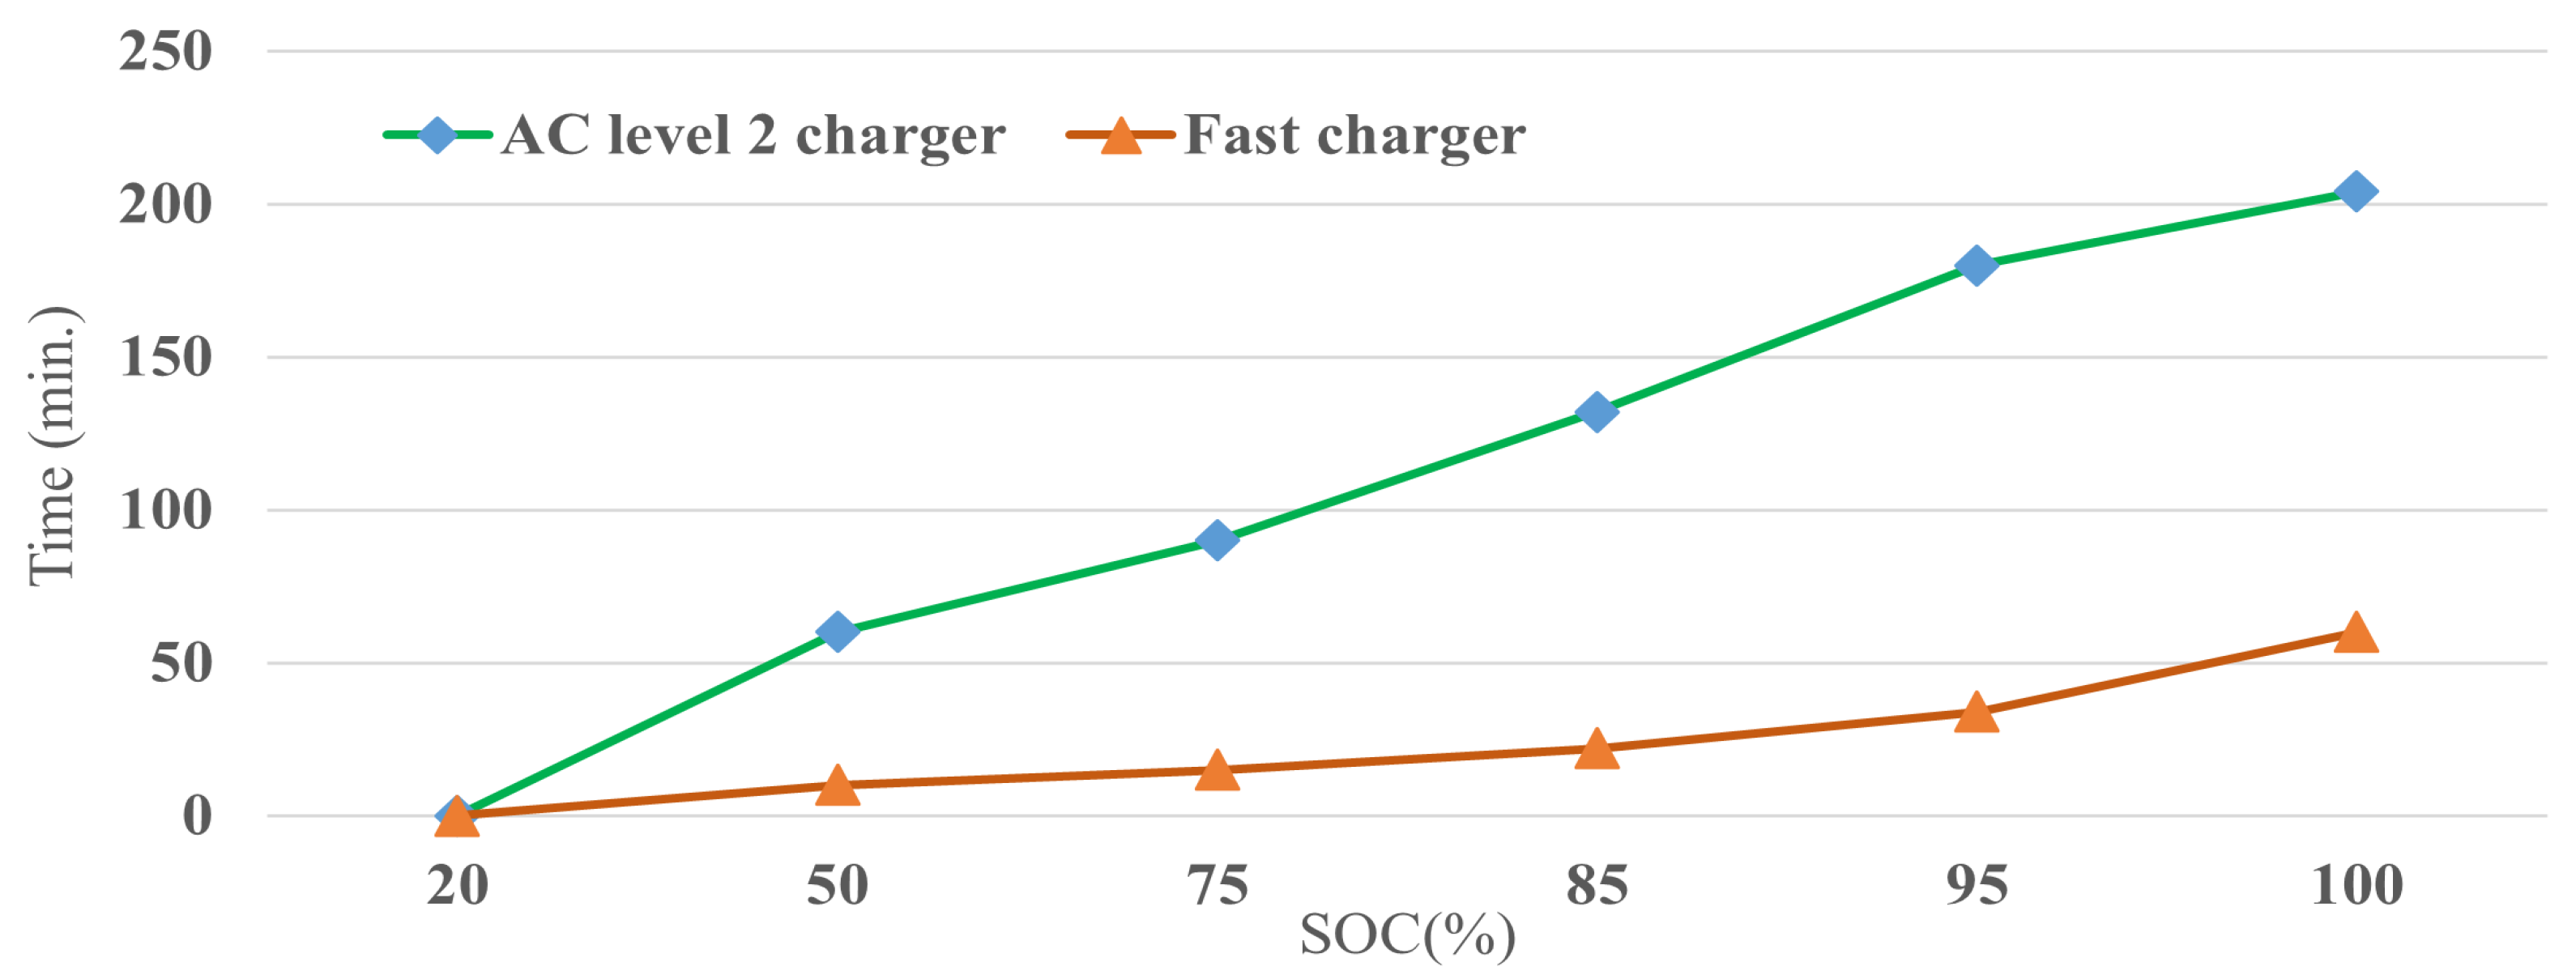
It is assumed that an EV parking lot with a capacity of 200 vehicles is located in a mixed-use area serving both residential and commercial purposes, while a fast-charging station is situated in an industrial zone. This study analyzes data from 204 vehicles at the Residential Parking Lot (RPL), 178 vehicles at the Commercial Parking Lot (CPL), and 500 vehicles at the Industrial Fast-Charging Station (I-FCS). Figure 3 and Figure 4 illustrate the vehicle arrival and departure patterns at CPL [21] and RPL [22], respectively, whereas Figure 5 shows the arrival pattern of EVs at FCS [23]. At the RPL, peak vehicle arrivals occur in the evening, with departures predominantly in the morning. In contrast, the CPL experiences peak arrivals in the morning and departures in the evening. Details regarding battery capacity, initial and final State of Charge (SOC), charging efficiency, charger types, and quantities, as well as power ratings, are provided in Table 3. The battery charging behavior curves for AC level-2 chargers and fast chargers [24] are presented in Figure 6.
The IEEE 33-bus distribution system is utilized to analyze the impact of EVPLs on the distribution grid. The objective function is formulated to minimize total power losses in the network. An Optimal Power Flow (OPF) approach, integrated with the Horse Herd Optimization (HHO) algorithm, is employed to determine the siting for the RPL, CPL, I-FCS, and sizing of a rooftop SPV on RPL and CPL. Table 4 presents the impact of EVPLs on system power losses and voltage profiles under various load scenarios. These results are obtained by placing EV loads at optimal locations identified using the HHO algorithm. The flowchart for the HHO is shown in Figure 7. To analyze the effectiveness of HHO, the formulated objective is solved by the GA and PSO algorithm also. The results, as shown in Table 5, verifies the superiority of HHO over GA and PSO, as through HHO, we found minimum power losses and lower computation time.
HHO works better than GA and PSO because it can adaptively balance exploration and exploitation. HHO changes its movement methods based on how the herd behaves, which helps it get away from local optima more easily. GA, on the other hand, uses crossover and mutation, which can cause premature convergence in complex search spaces. HHO is better than PSO because it uses random movements and adaptive parameter tweaking to keep the solution population diverse throughout the optimization process. PSO uses fixed velocity updates that might induce stalling near suboptimal solutions. This allows HHO to better explore in the solution space in the early phases and take advantage of favorable areas in later stages. Because of this, HHO obtains a solution faster and with better quality, as seen by the significant drops in power loss, better voltage stability, and shorter computing time. Table A1 presents the Sensitivity of HHO results to population size and iterations.
This study focuses on the analysis of a commercial and residential parking lot, each with a capacity for 200 electric vehicles (EVs). By concentrating on individual parking lots, the research enables a more detailed and comprehensive approach to modeling solar PV system sizing, EV charging demand, vehicle coordination algorithms, and financial feasibility from the perspective of a small corporate parking lot owner. Selecting a fleet size of 200 EVs—rather than generalizing to smaller or larger corporate fleets—highlights the economic viability and potential benefits for a medium-sized retail complex or business facility. As the capital costs of EVs and charging infrastructure continue to decrease, parking lot owners may scale the system further and increase the share of electrified staff vehicles over time. Additionally, modeling on a per-vehicle basis allows for a more accurate representation of arrival behavior, charging requirements, and alignment with solar generation, as opposed to analyzing aggregate fleet-wide charging loads. A standard single parking space in the U.S. measures approximately 9 ft by 18 ft, equating to a total area of about 32,400 square feet (or roughly 3010 square meters) for a 200-vehicle lot. Solar PV panels are installed on the rooftop, utilizing approximately 90% of the available area.
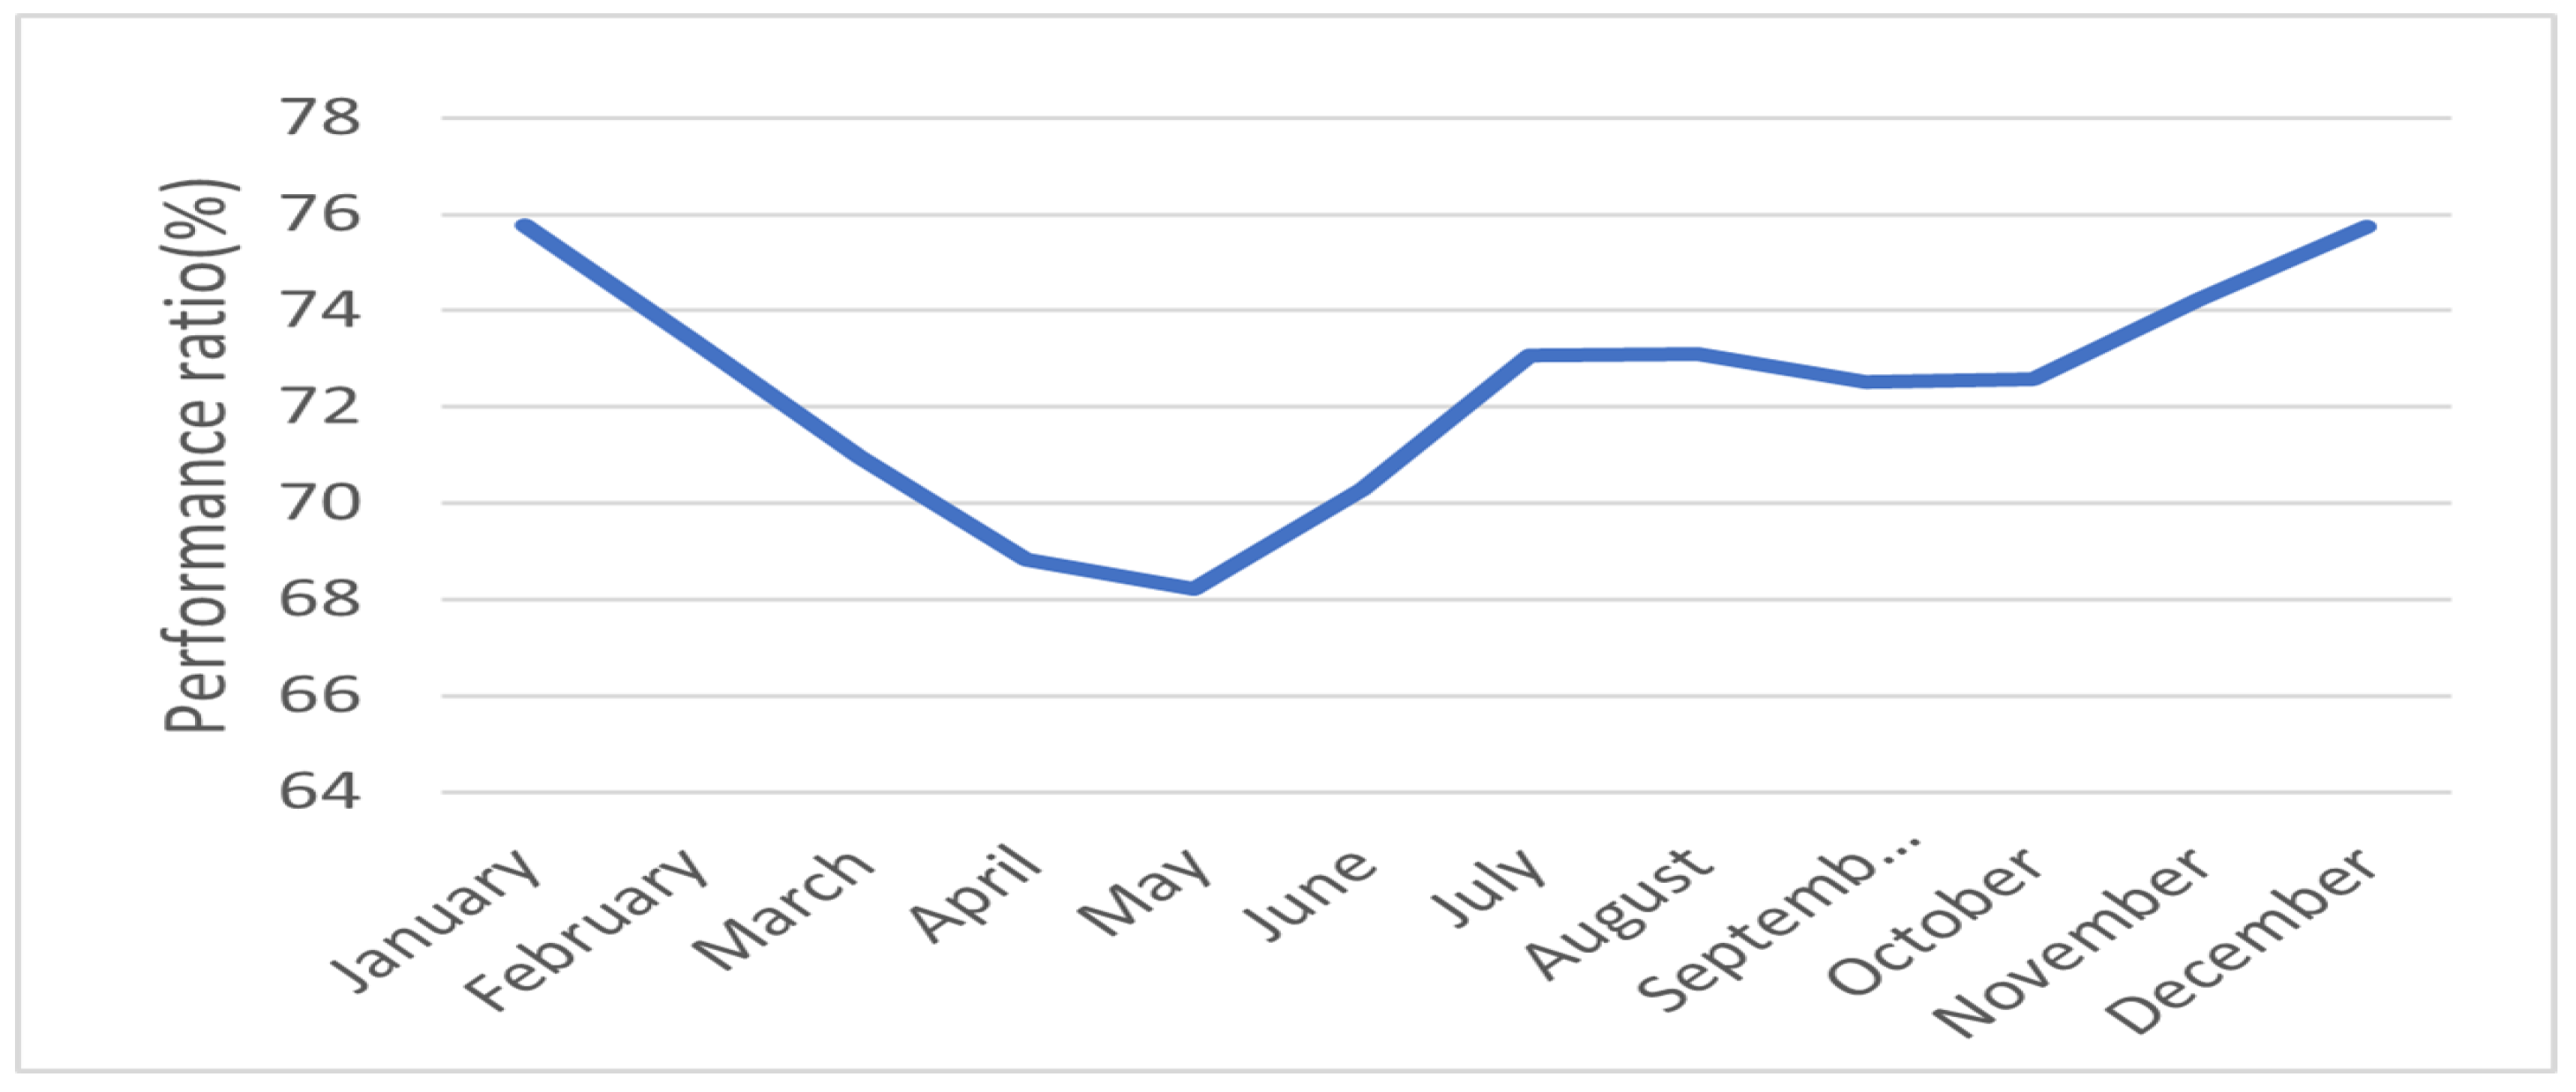
An SPV system is assumed to be installed on the roof of RPL and CPL. The optimal size of the PV system is determined using the HHO algorithm. Annual solar generation data have been sourced from the National Renewable Energy Laboratory (NREL) [25], and the analysis is performed using the average daily generation profile. The daily solar generation pattern is illustrated in Figure 8. Calculations related to area requirements, energy performance, economic viability, and environmental impact of the PV system are discussed in the preceding section. Monthly electricity generation data are used to calculate the PR of SPV. As shown in Figure 9, the annual average PR of the rooftop SPV is calculated to be 72.38%, with monthly values ranging from a low of 68.22% in May to a high of 75.77% in January. The selection of the optimal PV technology for the rooftop is based on energy density as a performance metric, with the system in this study achieving an energy density of 231.53 kWh/m2. The Energy Payback Time (EPBT) is evaluated by determining the net energy output of the system each year until the cumulative energy generated equals the energy invested. The estimated EPBT for the rooftop PV system is 5.25 years. The EROI, a measure of system efficiency and productivity, is calculated using Equation (10), resulting in a value of 5.71. The Cost of Energy (COE) is evaluated based on a 30-year life cycle. Capital costs are calculated excluding land acquisition, as the system is installed on an existing rooftop. A 5% annual discount rate, as currently offered by the Indian government to promote renewable energy adoption, is applied in the economic analysis. Annual maintenance and repair costs are estimated at 1% of the capital cost, with the NPV of these expenses presented in Table 6. Replacement costs are also considered using NPV, with Power Conditioning Units (PCUs) assumed to require replacement twice during the 30-year lifespan due to their 15-year operational life. Salvage value is calculated at 20% of the initial capital cost at the end of the system’s life, including PCU components. The life-cycle cost of the rooftop SPV, in terms of NPV, is summarized in Table 6. The total lifetime electricity output is determined by accounting for PV module degradation over time. Using the NREL-generated annual electricity data and applying the degradation rate across the 30-year period, the COE is calculated. The resulting cost of electricity from the SPV is estimated at 1.45 INR/kWh.
As previously discussed, calculating the EPBT of a photovoltaic system requires an assessment of its embodied energy—which includes the total energy consumed in the process of manufacturing, transportation, installation, and commissioning of the system components. For a 5 kW SPV system, the embodied energy is estimated to be 42,719.0 kWh [16]. To determine the energy consumed per kilowatt of installed capacity, this value is divided by the system’s rated power, resulting in 8543.8 kWh/kW. This specific energy value is used to estimate the embodied energy for other rooftop PV systems in this study, which are similarly mounted on building rooftops and use identical polycrystalline silicon (poly-Si) PV modules. Based on this, the total embodied energy for the studied SPV is calculated to be 3,417,520 kWh. To assess the EPBT, the system’s net annual energy generation is computed year by year until the cumulative energy output equals the total embodied energy. Using this approach, the EPBT for the SPV is estimated at 5.25 years.
Photovoltaic (PV) systems do not emit C O 2 during their operational phase. However, carbon emissions are associated with the embodied energy required for manufacturing, transporting, and installing the system components. The net C O 2 emissions of rooftop PV systems are therefore assessed based solely on their embodied energy. Using this approach, the rooftop PV system in this study is estimated to offset approximately 862.64 tons of C O 2 emissions annually. The net carbon footprint mitigation over the system’s lifetime is calculated using Equation (22), which considers the annual energy output adjusted for a degradation rate of 0.6% per year. This accounts for the gradual decline in energy production due to PV module aging. Over a 30-year operational life, the net C O 2 mitigation achieved by an SPV system is estimated to be 23,306.5 tons of C O 2 .
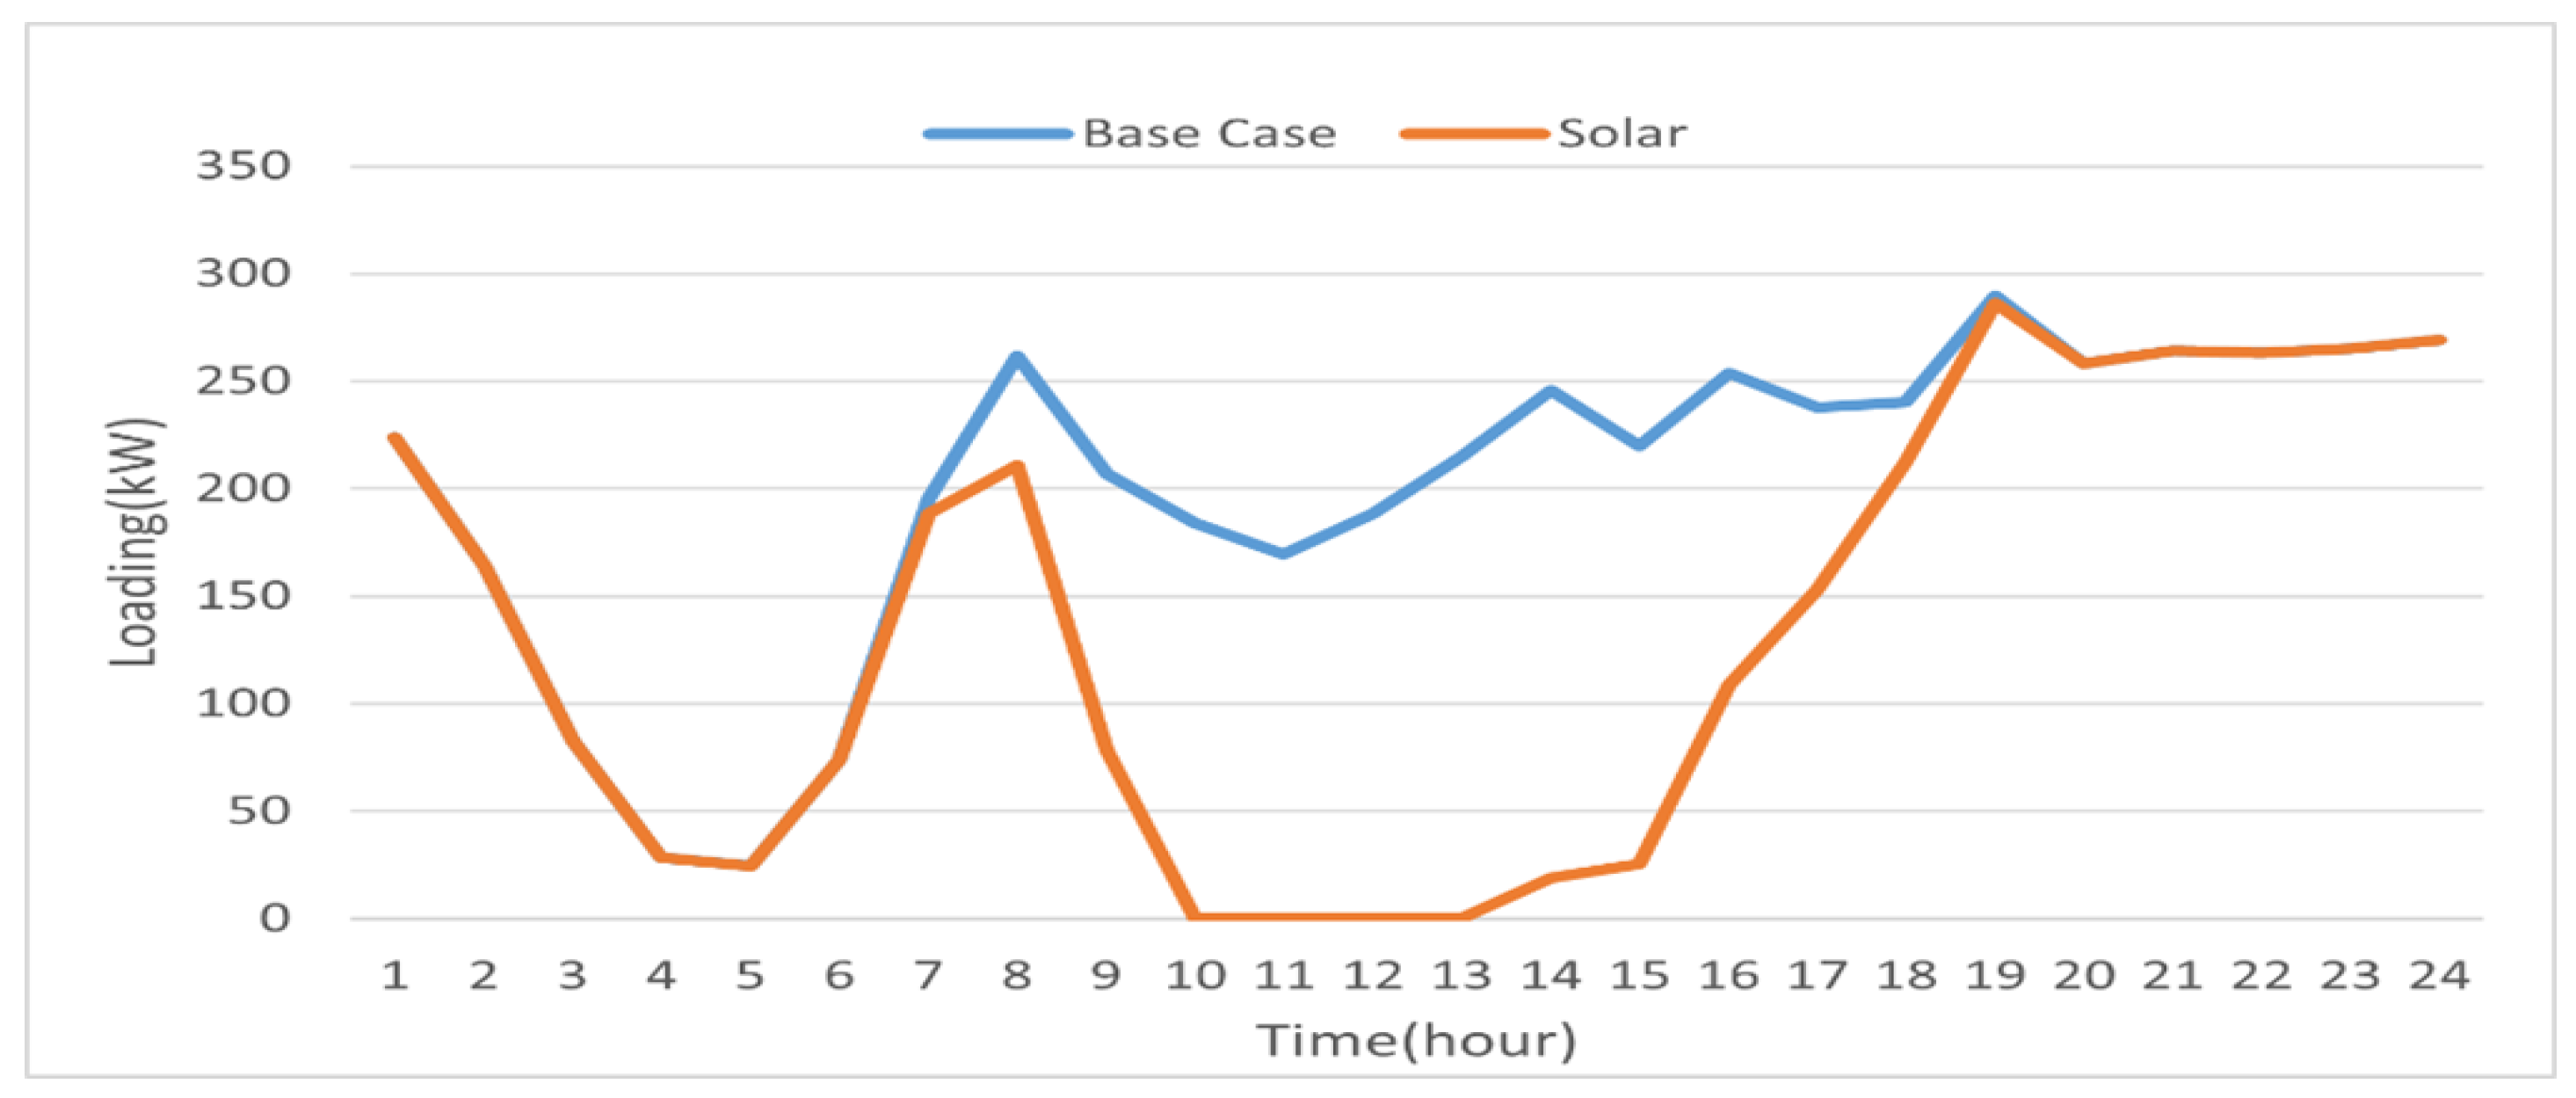
This study also includes a cost–benefit analysis of the CPL from the perspective of the EVPL owner. Electric vehicles are charged using solar energy when available; otherwise, electricity is drawn from the grid. Figure 10, Figure 11, and Figure 12 represent the power drawn from the grid in different scenarios at RPL, CPL, and I-FCS, respectively. The economic evaluation is based on real-time electricity pricing, as described in [26] and illustrated in Figure 13. Any hour during which the electricity price exceeds 95% of the peak rate is categorized as a high Real-Time Pricing (RTP) zone. Vehicle charging is scheduled to avoid these high-RTP periods, thereby minimizing electricity costs. As shown in Table 7, the integration of a 400 kW solar PV system at the CPL substantially reduces the average daily energy cost from USD 218.52 to USD 105.72, representing a 51.60% reduction. Furthermore, implementing a vehicle charging schedule based on RTP zones results in an additional 4.68% cost savings. The cost–benefit analysis clearly demonstrates the significant economic advantage of incorporating solar PV systems and intelligent charging strategies in EV parking lots.

5. Conclusions

This work addresses multi-zone optimization across residential, commercial, and industrial areas for a combined siting of FCS, CPL, and RPL. In addition, PV sizing is also determined. The optimization problem is solved using HHO to optimize power loss. Comparative analyses on IEEE-33 bus demonstrate that it outperforms well-known optimization algorithms such as GA and PSO in achieving lower energy losses and computation time. In addition, the techno-economic evaluation of a 400 kW rooftop PV system in Jaipur indicated a promising performance ratio of 72.38%, EPBT of 5.25 years, EROI of 5.71, and COE of Rs. 1.45/kWh. The rooftop photovoltaic system reduced carbon footprint by 59.21%, which shows the significant impact on the environment. In this study, cost–benefit analysis of CPL is also performed from the prospective of the EVPL owner. Results show that 400 kW of the solar PV system in CPL significantly reduced the per-day energy cost from USD 218.52 to USD 105.72, i.e., 51.60%. The per-day energy purchasing cost is further reduced by 4.68% by using vehicle scheduling. The efficacy of the proposed work is demonstrated on a 33-bus distribution system.
Policy Implications: The results have direct implications for policymakers and utility planners aiming to accelerate EV adoption while maintaining grid stability. The demonstrated cost reductions and carbon footprint mitigation from optimally sited, solar-integrated charging infrastructure support policies that incentivize rooftop PV deployment at commercial and residential parking facilities. Furthermore, the integration of intelligent charging scheduling aligns with demand-response programs and dynamic pricing schemes, which can help flatten peak loads and defer costly grid reinforcements. Regulatory frameworks that encourage coordinated planning between transport and power sectors, coupled with targeted subsidies for renewable-powered EVSE, can leverage the demonstrated techno-economic benefits for large-scale implementation.
Limitations and future scope: While the proposed framework demonstrates strong performance for the IEEE-33 bus system, several limitations should be noted. The case study is based on a single test network with fixed demand profiles and does not account for seasonal or stochastic variations in EV arrival patterns, solar irradiance, or electricity prices. Additionally, the analysis assumes ideal communication and control infrastructure without considering implementation delays or uncertainties. Future research could extend the model to larger and meshed distribution systems, incorporate real-time adaptive control under variable conditions, and evaluate hybrid renewable-storage integration. Exploring multi-objective formulations that also include reliability indices, user satisfaction metrics, and regulatory constraints would further enhance practical applicability.

Author Contributions

Conceptualization, K.C., M.K.S. and K.R.N.; methodology, K.C. and K.R.N.; software, K.C.; validation, K.R.N., P.N.B. and G.S.; formal analysis, K.R.N. and M.K.S.; investigation, K.C.; resources, M.K.S. and G.S.; data curation, K.C.; writing—original draft preparation, K.C.; writing—review and editing, M.K.S. and K.R.N.; visualization, K.C.; supervision, K.R.N., M.K.S. and G.S.; project administration, P.N.B.; funding acquisition, P.N.B. All authors have read and agreed to the published version of the manuscript.

Funding

This research received no external funding.

Data Availability Statement

The raw data supporting the conclusions of this article will be made available by the authors upon reasonable request.

Conflicts of Interest

The authors declare no conflicts of interest.

Nomenclatures

IndexDefinition
E a , o u t PV system’s annual energy generation (kWh)
A a Total area of array (m2)
E e m Embodied energy (kWh)
CCapital cost (Rs.)
C M R Maintenance and repair cost (Rs.)
C R Replacement cost (Rs.)
C S Salvage cost (Rs.)
MThe SPV system’s average yearly maintenance and repair costs
R 15 Replacement cost of PCU at 15 years’ interval
P o Capital cost
C E Cost of grid electricity (INR/kWh)
E r e q Energy required to charge the battery to desired SOC
V c Battery capacity of the vehicle
S O C r e q Required SOC of EV battery
S O C c r Current SOC of EV battery
E T Total energy required for charging all the vehicles
E a v l Energy available for discharging scenario
S O C m i n Minimum SOC limit that the battery can discharge
T c Charging time
P c h Charging power
P L , k Loading by the k t h vehicle
V c , k Battery capacity of the k t h vehicle
C b s Cost of charging before implying solar (USD/day)
P b s Energy extracted from grid before implying solar (kWh/day)
σ i Real-time price at i t h hour (USD/kWh)
C a s Cost of charging after implying solar (USD/day)
P a s Energy extracted from grid after implying solar (kWh/day)
C s Cost of generating solar power (USD/day)
T a r , k Arrival time of the k t h vehicle
T d , k Charging duration of the k t h vehicle
T d e p , k Departure time of the k t h vehicle
S O C k , t SOC of the k t h vehicle at any t instant
C h r , t Charging rate of the battery at any t instant
C h r m a x , t Maximum charging rate of the charger at any t instant
P s , t Solar energy utilization at any t instant
P s m a x , t Maximum solar energy available at any t instant

List of Acronyms

AcronymDefinition
RPLResidential Parking Lot
CPLCommercial Parking Lot
I-FCSIndustrial Fast Charging Station
SPVSolar Photovoltaic
EVElectric Vehicle
PLParking Lot
PVPhotovoltaic
HHOHorse Herd Optimization
SOCState of Charge
RTPReal-Time Pricing
PRPerformance Ratio
EPBTEnergy Payback Time
COECost of Electricity
LCCLife-Cycle Cost
PCUPower Conditioning Unit
CFeCarbon Footprint Emission
CFmCarbon Footprint Mitigation

Appendix A. Sensitivity of HHO Parameter

The performance of the Horse Herd Optimization (HHO) algorithm was evaluated under different parameter settings to assess robustness. In particular, the herd size (population) and maximum iterations were varied, and their impact on feeder real power losses and CPU time was recorded for the IEEE-33 bus test case. Table A1 summarizes the results.
Table A1. Sensitivity of HHO results to population size and iterations.
Population SizeMax
Iterations
Best Fitness
(MW)
Mean Fitness
(MW)
Std. Dev.
(MW)
CPU Time
(s)
201002.65542.66180.007215.42
30 (baseline)1002.65182.65450.004820.76
401002.65152.65390.004526.94
30802.65212.65530.005117.10
301202.65172.65430.004824.92
301502.65172.65420.004730.31

References

  1. Oruganti, K.S.P.; Vaithilingam, C.A.; Rajendran, G.; Ramasamy, A. Cost-benefit analysis of sustainable solar-powered workplace electric vehicle charging station. In Theoretical, Modelling and Numerical Simulations Toward Industry 4.0; Springer: Singapore, 2020; pp. 71–86. [Google Scholar]
  2. Deshmukh, S.S.; Pearce, J.M. Electric vehicle charging potential from retail parking lot solar photovoltaic awnings. Renew. Energy 2021, 169, 608–617. [Google Scholar] [CrossRef]
  3. Li, Y.; Pei, W.; Zhang, Q.; Xu, D.; Ma, H. Optimal layout of electric vehicle charging station locations considering dynamic charging demand. Electronics 2023, 12, 1818. [Google Scholar] [CrossRef]
  4. Altaf, M.; Yousif, M.; Ijaz, H.; Rashid, M.; Abbas, N.; Khan, M.A.; Waseem, M.; Saleh, A.M. PSO-based optimal placement of electric vehicle charging stations in a distribution network in smart grid environment incorporating backward forward sweep method. IET Renew. Power Gener. 2024, 18, 3173–3187. [Google Scholar] [CrossRef]
  5. Asghari Rad, H.; Jafari-Nokandi, M.; Hosseini, S.M. Optimal Allocation of Plug-in Electric Vehicle Parking Lots for Maximum Serviceability and Profit in the coupled distribution and transportation networks. Sci. Iran. 2024, 31, 1178–1196. [Google Scholar] [CrossRef]
  6. Babu, K.V.S.M.; Chakraborty, P.; Pal, M. Planning of fast charging infrastructure for electric vehicles in a distribution system and prediction of dynamic price. Int. J. Electr. Power Energy Syst. 2024, 155, 109502. [Google Scholar]
  7. Prajapati, S.; Fernandez, E. Solar PV parking lots to maximize charge operator profit for EV charging with minimum grid power purchase. Energy Sources Part A Recover. Util. Environ. Eff. 2025, 47, 3319–3329. [Google Scholar] [CrossRef]
  8. Mudgal, Y.; Tiwari, R. Residential Parking Lot Pricing Strategy Considering Scheduling of Electric Vehicles. J. Inst. Eng. (India) Ser. 2024, 106, 1129–1141. [Google Scholar] [CrossRef]
  9. Baherifard, M.A.; Kazemzadeh, R.; Yazdankhah, A.S.; Marzband, M. Intelligent charging planning for electric vehicle commercial parking lots and its impact on distribution network’s imbalance indices. Sustain. Energy Grids Netw. 2022, 30, 100620. [Google Scholar] [CrossRef]
  10. Nafeh, A.E.S.A.; Omran, A.E.F.A.; Elkholy, A.; Yousef, H.M. Optimal economical sizing of a PV-battery grid-connected system for fast charging station of electric vehicles using modified snake optimization algorithm. Results Eng. 2024, 21, 101965. [Google Scholar] [CrossRef]
  11. Khalid, M.; Thakur, J.; Bhagavathy, S.M.; Topel, M. Impact of public and residential smart EV charging on distribution power grid equipped with storage. Sustain. Cities Soc. 2024, 104, 105272. [Google Scholar] [CrossRef]
  12. Citroni, R.; Mangini, F.; Frezza, F. Efficient integration of ultra-low power techniques and energy harvesting in self-sufficient devices: A comprehensive overview of current progress and future directions. Sensors 2024, 24, 4471. [Google Scholar] [CrossRef] [PubMed]
  13. Junid, A.; Yap, E.H.; Ng, P.K. Electric vehicle charging at telco base station and bidirectional charging at hillslope descent technical-commercial cost-benefit study and scheduling-reservation system. In Proceedings of the 2018 International Conference on Smart Grid and Clean Energy Technologies (ICSGCE), Kajang, Malaysia, 29 May–1 June 2018; pp. 137–144. [Google Scholar]
  14. Varone, A.; Heilmann, Z.; Porruvecchio, G.; Romanino, A. Solar parking lot management: An IoT platform for smart charging EV fleets, using real-time data and production forecasts. Renew. Sustain. Energy Rev. 2024, 189, 113845. [Google Scholar] [CrossRef]
  15. Sharma, S.; Niazi, K.; Verma, K.; Rawat, T. Coordination of different DGs, BESS and demand response for multi-objective optimization of distribution network with special reference to Indian power sector. Int. J. Electr. Power Energy Syst. 2020, 121, 106074. [Google Scholar] [CrossRef]
  16. Yadav, S.K.; Bajpai, U. Performance evaluation of a rooftop solar photovoltaic power plant in Northern India. Energy Sustain. Dev. 2018, 43, 130–138. [Google Scholar] [CrossRef]
  17. Quansah, D.A.; Adaramola, M.S.; Appiah, G.K.; Edwin, I.A. Performance analysis of different grid-connected solar photovoltaic (PV) system technologies with combined capacity of 20 kW located in humid tropical climate. Int. J. Hydrogen Energy 2017, 42, 4626–4635. [Google Scholar] [CrossRef]
  18. Jordan, D.C.; Kurtz, S.R. Photovoltaic degradation rates—An analytical review. Prog. Photovoltaics Res. Appl. 2013, 21, 12–29. [Google Scholar] [CrossRef]
  19. Government of India. CEA Annual Report 2022–23. 2023. Available online: https://cea.nic.in/annual-report/?lang=en (accessed on 15 May 2025).
  20. Kanwar, N.; Gupta, N.; Niazi, K.; Swarnkar, A. Optimal distributed generation allocation in radial distribution systems considering customer-wise dedicated feeders and load patterns. J. Mod. Power Syst. Clean Energy 2015, 3, 475–484. [Google Scholar] [CrossRef]
  21. Guner, S.; Ozdemir, A. Stochastic energy storage capacity model of EV parking lots. IET Gener. Transm. Distrib. 2017, 11, 1754–1761. [Google Scholar] [CrossRef]
  22. Anggraini, D.; Amelin, M.; Söder, L. Electric Vehicle Charging Considering Grid Limitation in Residential Areas. In Proceedings of the 2024 IEEE Transportation Electrification Conference and Expo (ITEC), Chicago, IL, USA, 19–21 June 2024; pp. 1–6. [Google Scholar]
  23. Zhang, Y.; You, P.; Cai, L. Optimal charging scheduling by pricing for EV charging station with dual charging modes. IEEE Trans. Intell. Transp. Syst. 2018, 20, 3386–3396. [Google Scholar] [CrossRef]
  24. Vashisth, S.; Agrawal, P.K.; Gupta, N.; Niazi, K.; Swarnkar, A. Multi-stage planning of fast charging stations for PEVs using traffic-based approach. Sustain. Energy, Grids Netw. 2022, 30, 100662. [Google Scholar] [CrossRef]
  25. NREL. NREL Solar Calculator. 2025. Available online: https://pvwatts.nrel.gov/ (accessed on 1 May 2025).
  26. Sharma, B.; Gupta, N.; Niazi, K.; Swarnkar, A. Estimating impact of price-based demand response in contemporary distribution systems. Int. J. Electr. Power Energy Syst. 2022, 135, 107549. [Google Scholar] [CrossRef]
Figure 1. Flowchart of the proposed work using HHO.
Energies 18 04556 g001
Figure 2. Radial distribution network of 33 buses.
Energies 18 04556 g002
Figure 3. Arrival and departure pattern of EVs at CPL.
Energies 18 04556 g003
Figure 4. Arrival and departure pattern of EVs at RPL.
Energies 18 04556 g004
Figure 5. Arrival pattern of EVs at FCS.
Energies 18 04556 g005
Figure 6. Battery charging behavior curve for AC level-2 chargers and fast chargers.
Energies 18 04556 g006
Figure 7. Horse Herd Optimization flowchart.
Energies 18 04556 g007
Figure 8. Solar generation curve.
Energies 18 04556 g008
Figure 9. Monthly variation in PR of the SPV system.
Energies 18 04556 g009
Figure 10. Power drawn from grid at RPL in different scenarios.
Energies 18 04556 g010
Figure 11. Power drawn from grid at CPL in different scenarios.
Energies 18 04556 g011
Figure 12. Power drawn from grid at I-FCS.
Energies 18 04556 g012
Figure 13. Real-time pricing.
Energies 18 04556 g013
Table 1. Specifications of solar PV system.
ParticularSpecification
LocationJaipur
Latitude26.95
Longitude75.85
DC System Size (kW)400
Module TypeStandard
Array TypeFixed
Tilt Angle 25
Azimuth Angle 180
System Losses (%)14.08
DC-to-AC Size Ratio1.2
Type of InverterGrid-tied string inverter
Inverter Efficiency (%)96
Table 2. Customer’s class-wise details.
ClassAllocation Demand (%)Allocation Demand (kW)Allocated Nodes
R34.8612951 to 15
C29.60110016 to 21, 30 to 33
I35.54132022 to 29
Table 3. Input parameters.
ParametersValue
Capacity of RPL/CPL200
No. of vehicles at CPL178
No. of vehicles at RPL204
No. of vehicles at IFCS500
No. of chargers at CPL35
No. of chargers at RPL30
No. of chargers at IFCS10
Initial SOC range of vehicles at CPL20–50
Final SOC range of vehicles at CPL85–95
Initial SOC range of vehicles at RPL20–40
Final SOC range of vehicles at RPL85–95
Initial SOC range of vehicles at IFCS20–50
Final SOC range of vehicles at IFCS75–85
Battery capacity of vehicles at RPL24–40
Battery capacity of vehicles at CPL24/30
Battery capacity of vehicles at IFCS30/50
Table 4. Optimization (HHO) results.
LoadOptimum LocationPower LossMinimum Voltage
Base load-2.38 MW0.9131
Case study2, 19, 222.65 MW0.9125
2* Case study2, 19, 233.26 MW0.9120
3* Case study2, 19, 233.88 MW0.9110
4* Case study2, 19, 234.64 MW0.9109
Table 5. Different optimization results.
Optimization
Method
Worst Fitness
(MW)
Best Fitness
(MW)
Mean FitnessCPU Time
(s)
Standard
Deviation
GA2.68832.67462.683036.530.0054
PSO2.68032.66592.672125.310.0053
HHO2.66632.65182.654520.760.0048
Table 6. Various costs of the rooftop PV system.
ParticularValue
Capital cost (Rs.)24,669,090
Maintenance and repair cost (Rs.)3,791,716
Replacement cost (Rs.)2,126,969
Salvage cost (Rs.)4,118,837
Life-cycle cost (Rs.)26,468,938
Cost of electricity (Rs.⁄kWh)1.45
System cost (Rs.⁄ W p )61.67
Table 7. Cost–benefit analysis at CPL.
Scenario →
Cost ↓
Before SolarAfter SolarAfter Solar +
Scheduling
Power purchased from grid (USD/day)218.5275.3870.43
Solar generation (USD/day)-30.3430.34
Total purchasing cost (USD/day)218.52105.72100.77
Disclaimer/Publisher’s Note: The statements, opinions and data contained in all publications are solely those of the individual author(s) and contributor(s) and not of MDPI and/or the editor(s). MDPI and/or the editor(s) disclaim responsibility for any injury to people or property resulting from any ideas, methods, instructions or products referred to in the content.