1. Introduction
Recently, solar energy has experienced significant and rapid global expansion, driven by technological advancements, declining production costs, and favorable regulatory reforms that facilitate its integration into the electricity grid. Solar photovoltaic (PV) has become the second most widely deployed renewable energy source, surpassed only by hydropower [
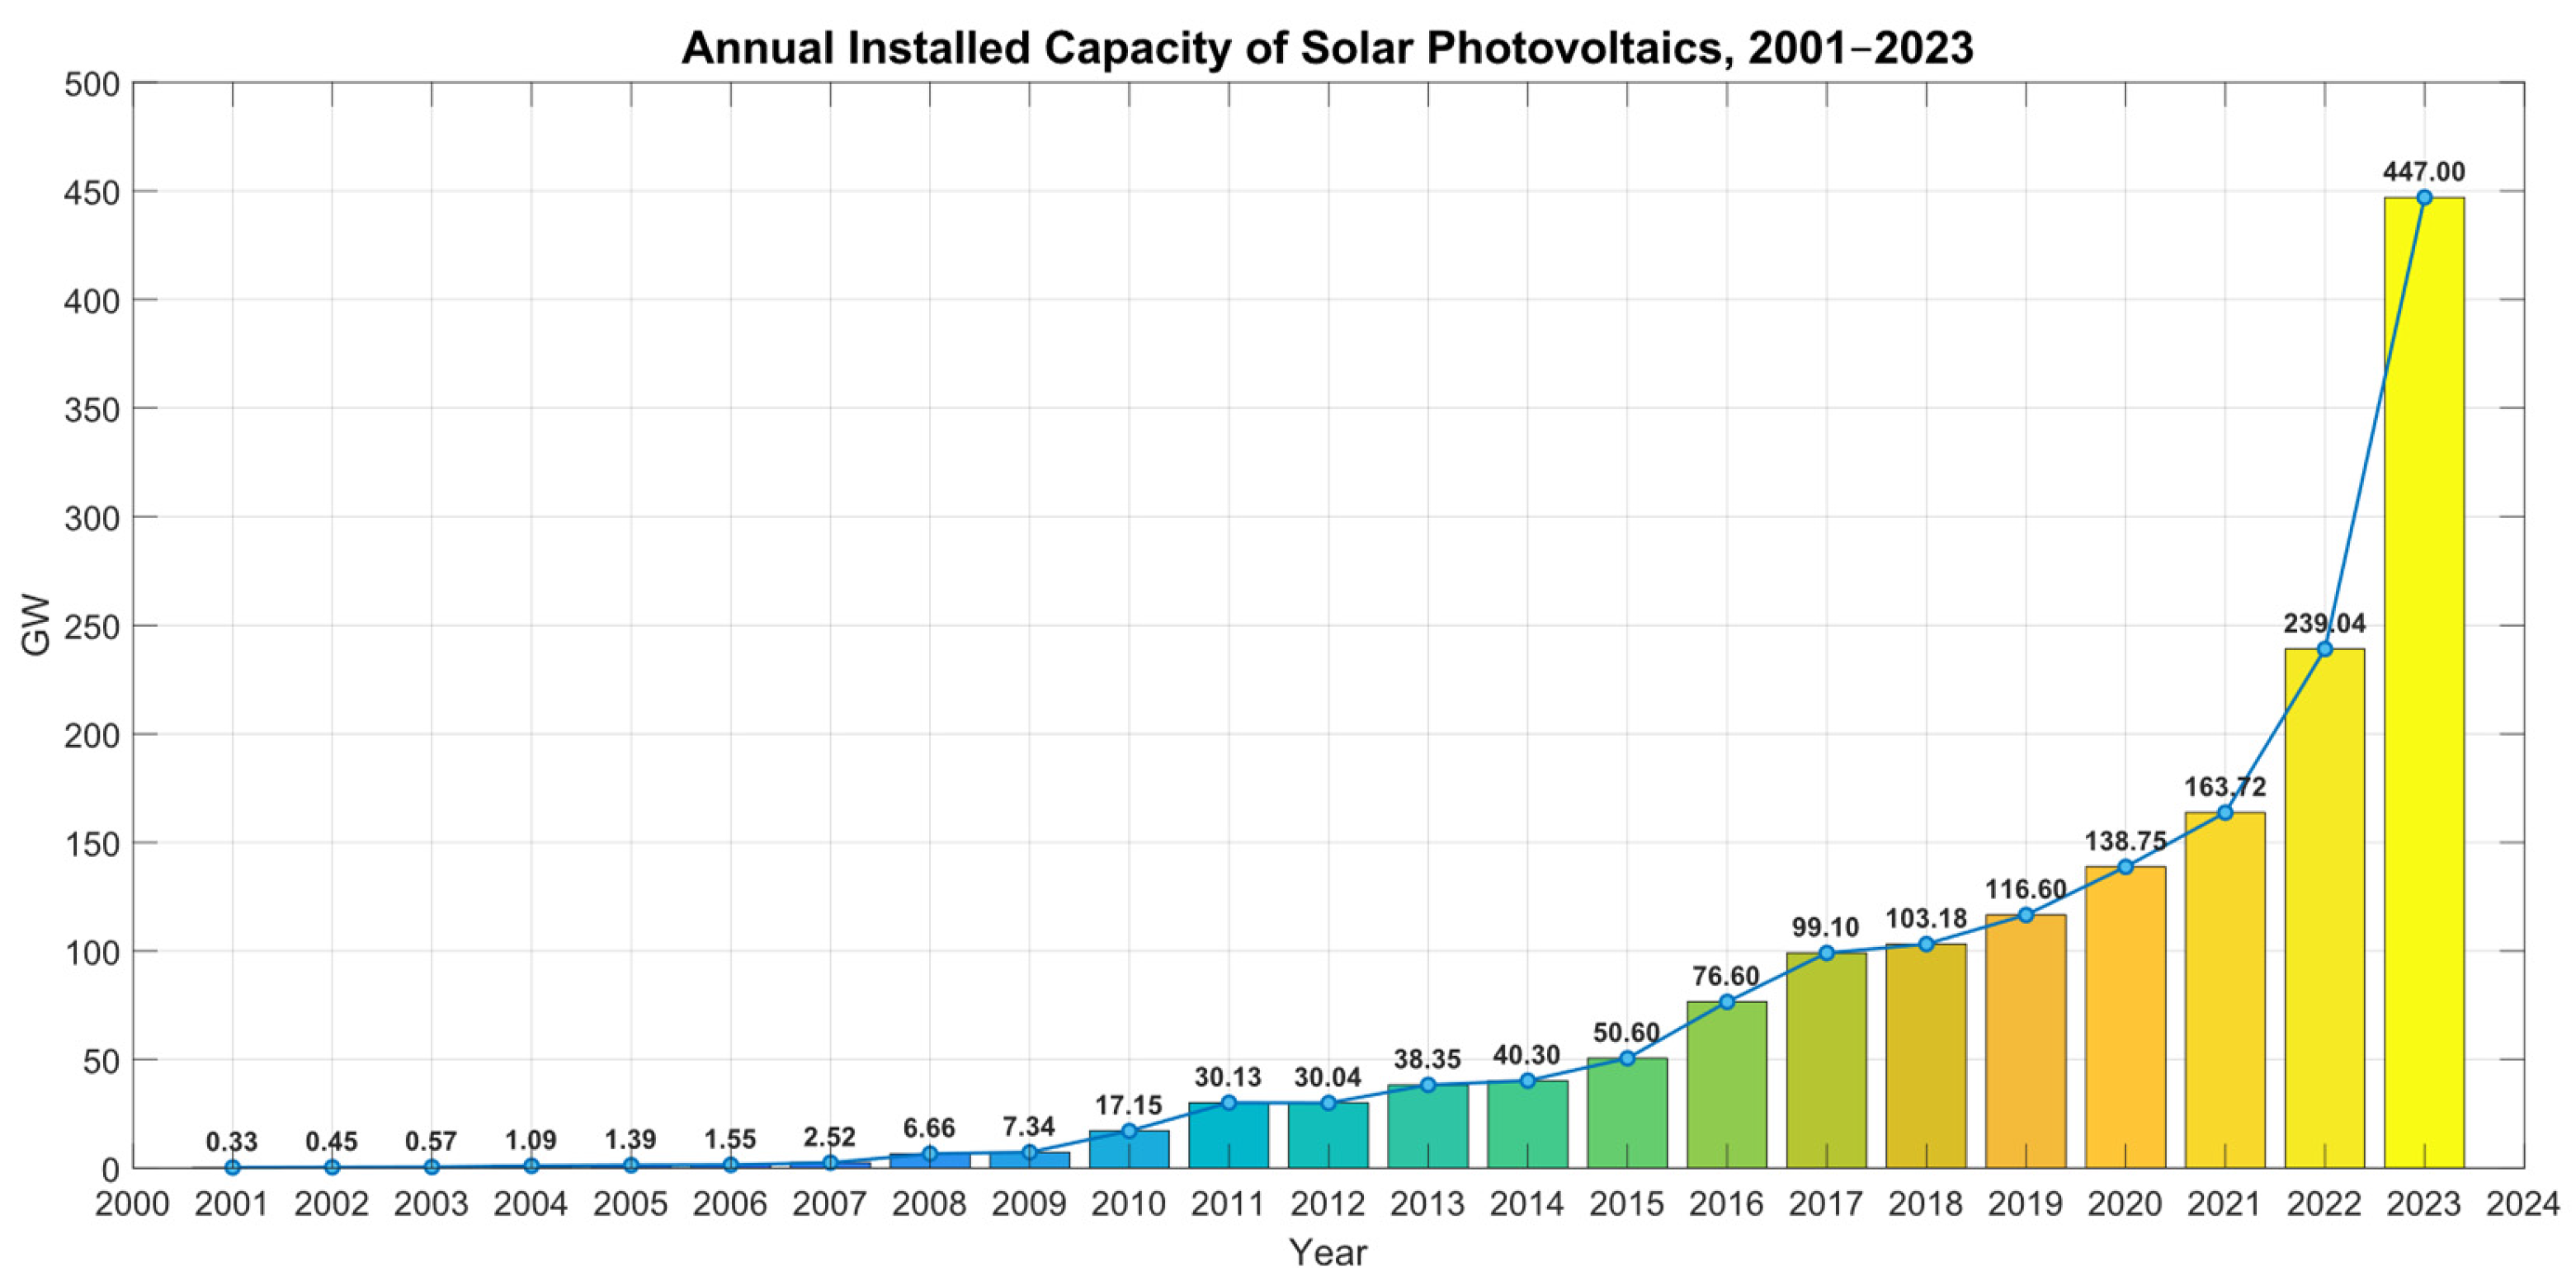
1]. In 2023, the global solar PV sector saw substantial growth, with 447 GW of newly installed capacity, accounting for 78% of the 576 GW of new renewable energy capacity added that year. This surge solidifies solar PV as the leading renewable power generation technology, far surpassing the combined contributions of other renewable sources, with a capacity more than three times greater. Over the past few years, solar’s share of newly added renewable capacity has increased significantly, rising from 56% in 2021 to 66% in 2022 and reaching 78% in 2023. These figures underscore the rapid development and growing importance of solar energy within the global energy landscape (see
Figure 1) [
2]. Despite these advancements, the renewable energy sector continues to face challenges arising from geopolitical conflicts, protectionist policies, and persistent risks within the global energy landscape. China, the United States, India, Japan, and Germany currently lead in total installed solar power capacity. However, the global energy transition remains uneven, particularly in comparison with countries that continue to rely heavily on fossil fuels for energy security [
3].
Electricity generation from solar photovoltaic (PV) systems fundamentally differs from conventional sources such as thermal power plants, which utilize fossil fuels (e.g., natural gas, diesel, or coal) to produce alternating current (AC) electricity. In contrast, PV panels directly convert solar energy into direct current (DC) electricity. Thermoelectric power plants operate with generators that are synchronized with the power grid, typically running at 50 Hz or 60 Hz to maintain system stability and synchronization. PV plants, however, lack the rotating mass that characterizes conventional generators. Instead, they rely on power electronic inverters to convert DC output into AC, enabling seamless integration into the electrical grid [
4].
The transition to a greenhouse gas (GHG)-free energy matrix presents significant challenges to power grid stability. The integration of renewable energy sources, such as solar photovoltaic (PV) systems, introduces variability and intermittency due to fluctuations in solar irradiance and the inherently low inertia of these technologies [
5,
6]. Unlike conventional generation systems, these sources do not contribute rotational inertia, leading to a decrease in the overall system inertia as renewable penetration increases (see
Figure 2) [
7,
8]. This reduction in inertia can compromise grid stability, as PV systems, unlike wind power, cannot leverage the mechanical inertia of rotating wind turbines to help regulate system frequency, even temporarily [
9,
10]. Consequently, it has become increasingly important for PV power plants to provide essential grid support services [
11]. Specifically, they must be capable of contributing to voltage and frequency regulation in a manner comparable to conventional synchronous generators.
Traditionally, PV systems operate using maximum power point tracking (MPPT) techniques [
12,
13], which prioritize maximizing energy output over grid frequency regulation. However, the development of flexible maximum power point tracking (FPPT) strategies has emerged to address this limitation [
14]. FPPT enables PV systems to operate below their maximum power point, thereby creating an active power reserve. Although solar PV plants inherently lack rotational inertia, it is possible to emulate the kinetic energy of synchronous generator rotors through appropriate control strategies [
15,
16]. One such approach involves the deliberate creation of power reserves using various control methods, including adaptive control schemes that respond to adverse environmental conditions, such as shading from cloud cover [
17]. Another solution involves the integration of energy storage systems (ESS) with PV plants, which can further enhance frequency regulation capabilities and improve overall economic efficiency [
18]. In this context, Ref. [
19] identifies two primary challenges related to frequency stability. The first is the lack of inertia, as PV technologies are static generation systems that do not provide rotational inertia, complicating their coordination with conventional generation sources. The second challenge involves frequency fluctuations; due to their low inertia, PV systems pose a risk to the mechanical inertia balance of the power system. Inverter-based power systems with low inertia are particularly vulnerable to disturbances, as the rate of change of frequency (ROCOF) increases rapidly following a contingency, potentially resulting in significant frequency deviations and even cascading system failures [
20,
21,
22]. To mitigate these adverse effects, several solutions have been proposed, including energy storage systems, advanced power electronics, improved control strategies, and, fundamentally, comprehensive grid planning.
Consequently, several research projects have been undertaken, including those led by the National Renewable Energy Laboratory (NREL) and First Solar [
23]. The primary objective of these initiatives has been the development of control strategies for photovoltaic systems integrated with battery energy storage systems (BESS), enabling the demonstration of their effectiveness in various scenarios, such as:
Adaptation of generation to load through time-shifting, thereby reducing constraints imposed on photovoltaic energy;
Facilitation of higher levels of PV penetration in the power grid;
Application of PV-BESS systems in swing damping control;
Implementation of grid-forming capabilities using BESS to enable black start and islanded operation of PV-BESS systems.
The results obtained demonstrate that the PV-BESS system exhibits robust primary frequency regulation (PFR) capabilities at droop settings of 5% and 3%. In [
24], the authors propose and evaluate a BESS with droop control and droop coefficient design to mitigate the impacts of high PV penetration under various types of disturbances. State of charge (SOC) and frequency deviation operating bands are considered in [
25] to optimize both the sizing of the BESS and its operation as a frequency support system for PV power plants. In [
26], a control strategy is presented in which the BESS operation incorporates specific consideration of disturbance types, applying SOC constraints based on the nature of the event. In [
27], an adaptive droop control strategy based on a logistic function, dependent on the SOC, is implemented for a large-scale BESS. Notably, the BESS is proposed to be distributed in modular units within a centralized storage facility, operating in coordination with thermal power plants. In [
28], a coordinated control for energy storage participating in the PFR, considering the rate of change of frequency (ROCOF), is incorporated. The utilization of fuzzy logic for the computation of the droop control coefficient and the optimization of the coefficients for the two control modes, virtual inertia or virtual droop, are among the contributions.
Recent advances in adaptive frequency regulation for photovoltaic systems with battery energy storage systems (PV-BESS) have investigated various control strategies, including fuzzy logic-based controllers, with the goal of enhancing grid stability and addressing the inherent challenges posed by high renewable energy penetration. For instance, Ref. [
29] proposes an interval type-2 fuzzy logic controller (IT2FLC) for optimal energy management in hybrid microgrids, demonstrating its adaptability to different modes of electric vehicle integration, with a focus on cost reduction and energy balance. Similarly, the authors in [
30] examine the optimal battery management in wind and solar-based microgrids using a Modified Slime Mould Algorithm (MSMA) combined with a fuzzy-PID controller, emphasizing its real-time applicability and robust state of charge (SOC) prediction. In [
31], a robust type-2 fuzzy logic controller is presented for photovoltaic systems connected to microgrids with battery storage, demonstrating its effectiveness in enhancing power quality under conditions of solar irradiance variability and nonlinear loads through the use of a multifunctional inverter. Another relevant study is presented in [
32], which discusses and evaluates an optimal strategy for DC bus voltage regulation in photovoltaic systems with battery storage, employing an adaptive fuzzy logic controller alongside a novel supervisory energy management approach. This strategy focuses on ensuring power flow stability and maintaining component operating limits. Finally, the authors in [
33] investigate the control of active and reactive power in a battery storage system using fuzzy logic to sustain voltage and frequency stability in an islanded microgrid, demonstrating a rapid return to steady-state conditions.
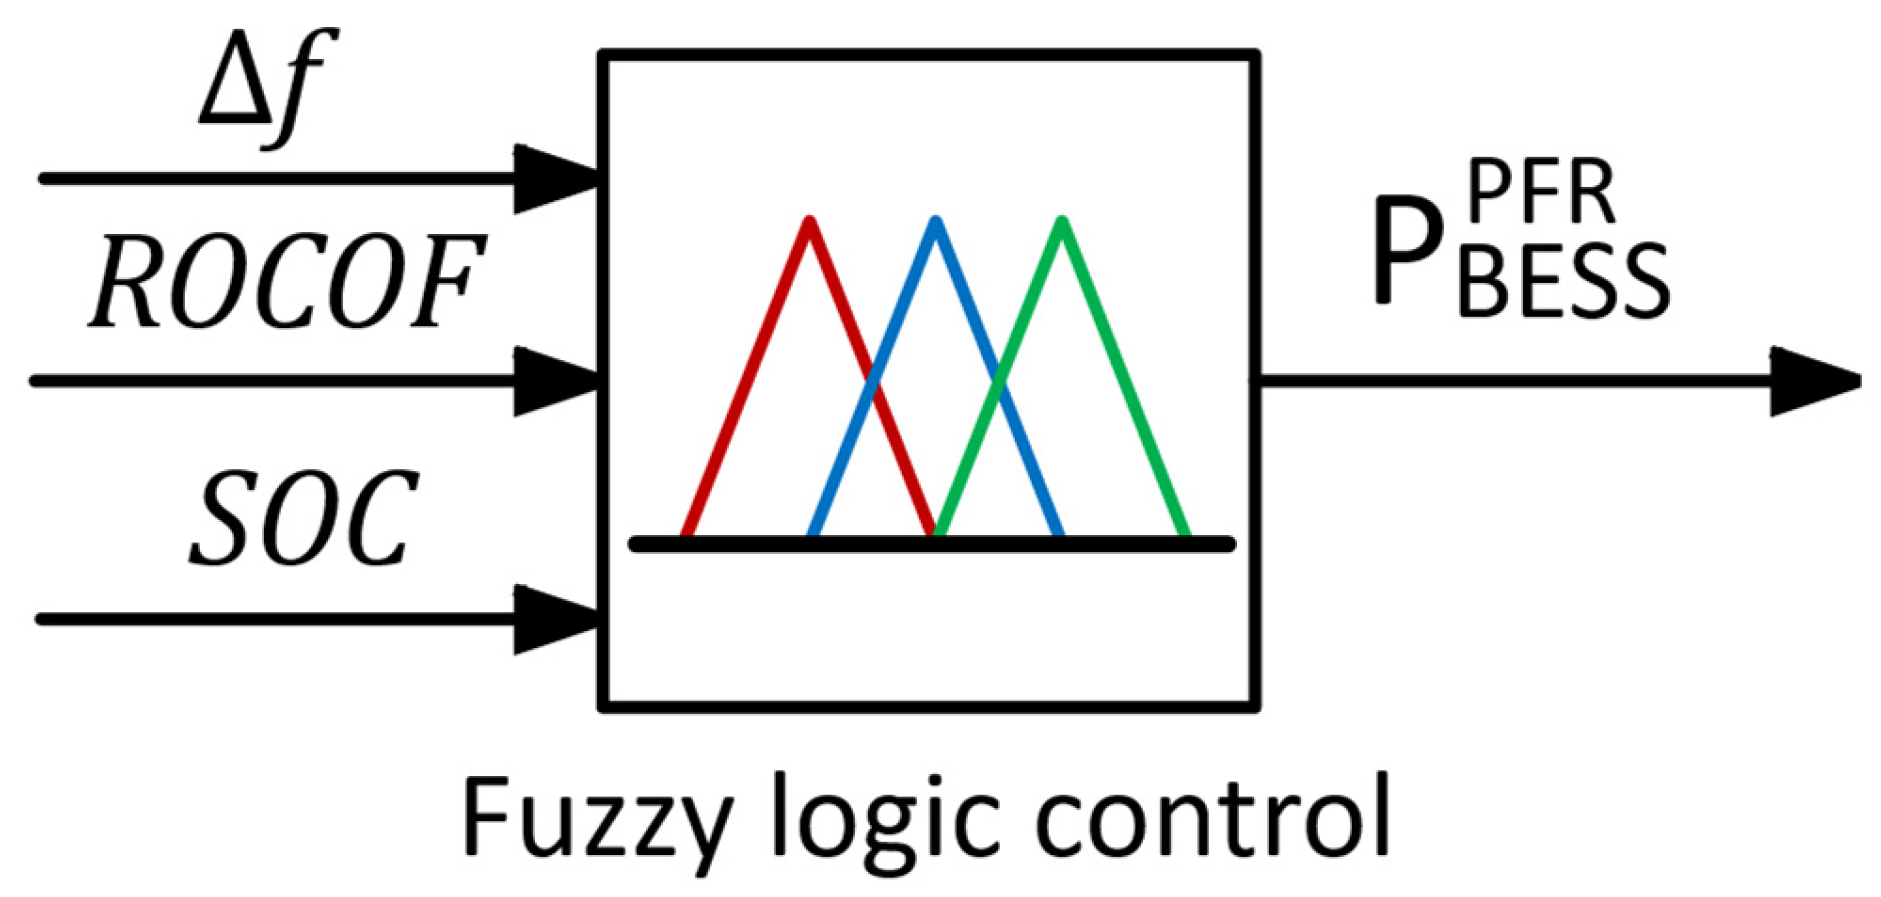
Although previous studies have established a solid foundation for the application of fuzzy logic-based controllers in PV-BESS systems aimed at enhancing frequency stability and energy management, the controller proposed in this work introduces key innovations that set it apart from prior contributions. This study presents an adaptive control strategy based on fuzzy logic applied to a battery energy storage system (BESS), utilizing three input variables: frequency deviation (Δf), rate of change of frequency (ROCOF), and the state of charge (SOC) of the batteries. These variables enable the provision of synthetic inertia and primary frequency regulation in response to various types of disturbances in the electrical system. The combination of these three input variables enables a more accurate and efficient control response while preserving the state of charge of the BESS. The control strategy is implemented using a Barbell strategy, also known as convex transformation, which facilitates rapid recovery of frequency stability without requiring prior knowledge of the exact timing of disturbances. Instead, this strategy focuses on avoiding operating conditions that could compromise the stability of the electrical system. Within this framework, fuzzy logic emerges as a versatile and effective tool due to its ability to model complex nonlinear systems and its ease of integration with conventional control schemes. The performance of the proposed controller was compared against three alternative approaches: conventional droop control, droop control with a hybrid strategy, and droop control based on a logistic function. The evaluation was conducted using three key performance indicators: the impact of the control on frequency deviation, the root mean square (RMS) of the BESS state of charge (SOC), and the level of non-compliance (NCL). The results demonstrate that the proposed controller achieves the lowest maximum frequency deviation across all evaluated scenarios when the initial SOC is set at 50%, significantly outperforming the benchmark methods.
Likewise, the proposed controller was validated by verifying its compliance with the primary frequency regulation (PFR) requirements, in accordance with Technical Procedure PR-21 on spinning reserve, issued by the Peruvian System Economic Operation Committee (COES, by its acronym in Spanish). Finally, the mathematical models of the photovoltaic plant, the BESS, and the fuzzy control system were developed and implemented in the MATLAB/Simulink version 2024a environment.
The remainder of this paper is organized as follows.
Section 2 presents the frequency dynamics of the power system, with emphasis on conventional generation units and the photovoltaic power plant.
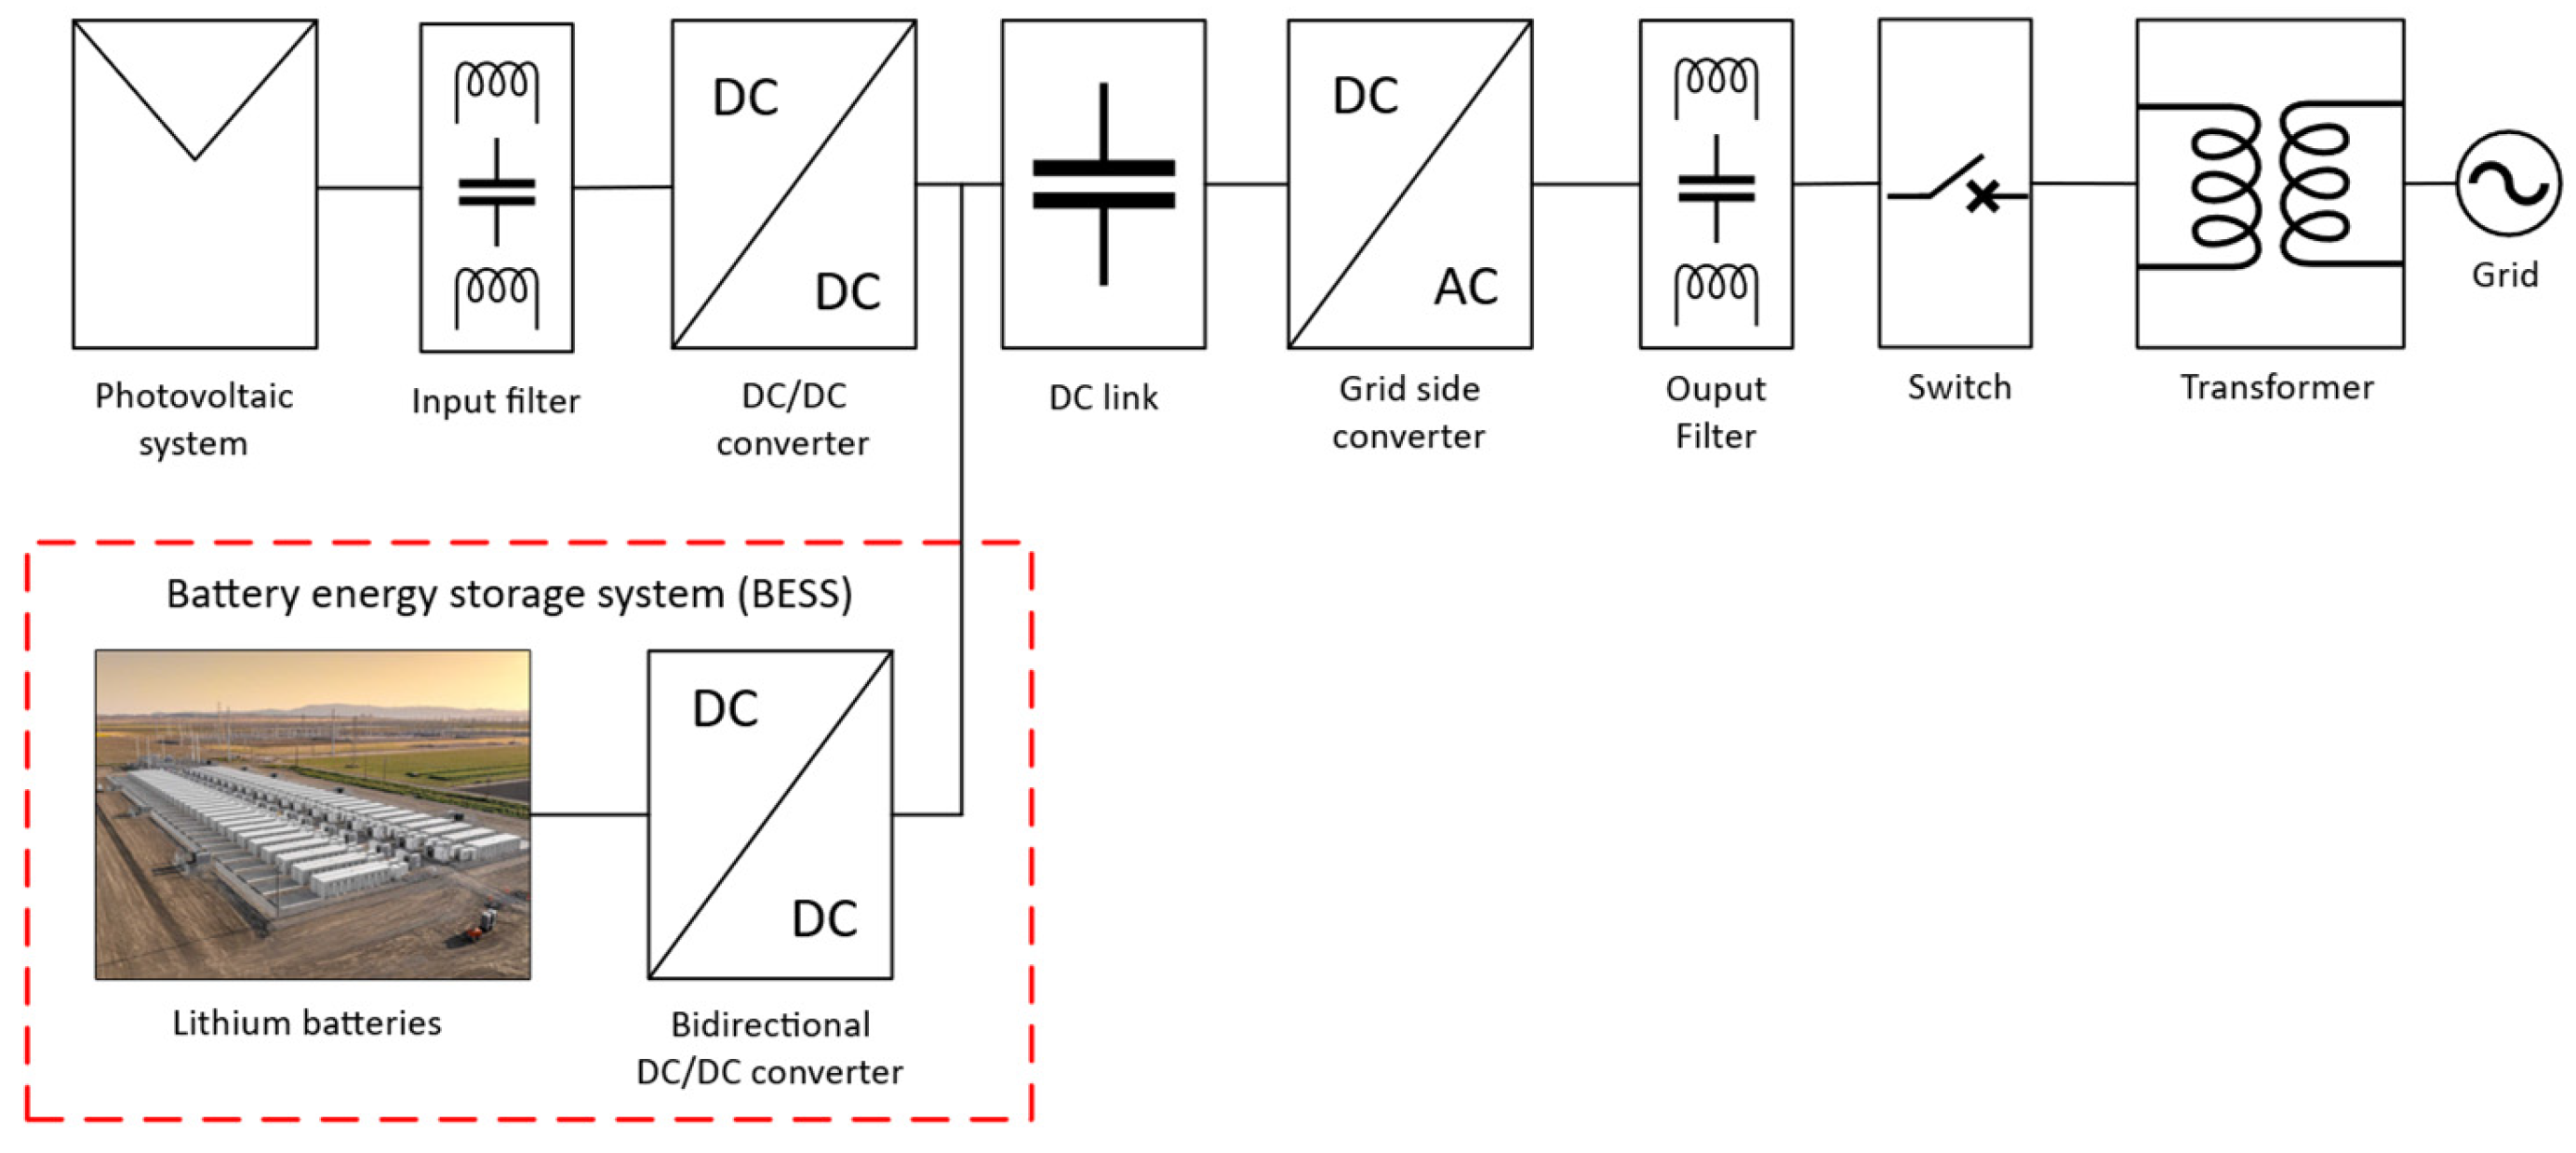
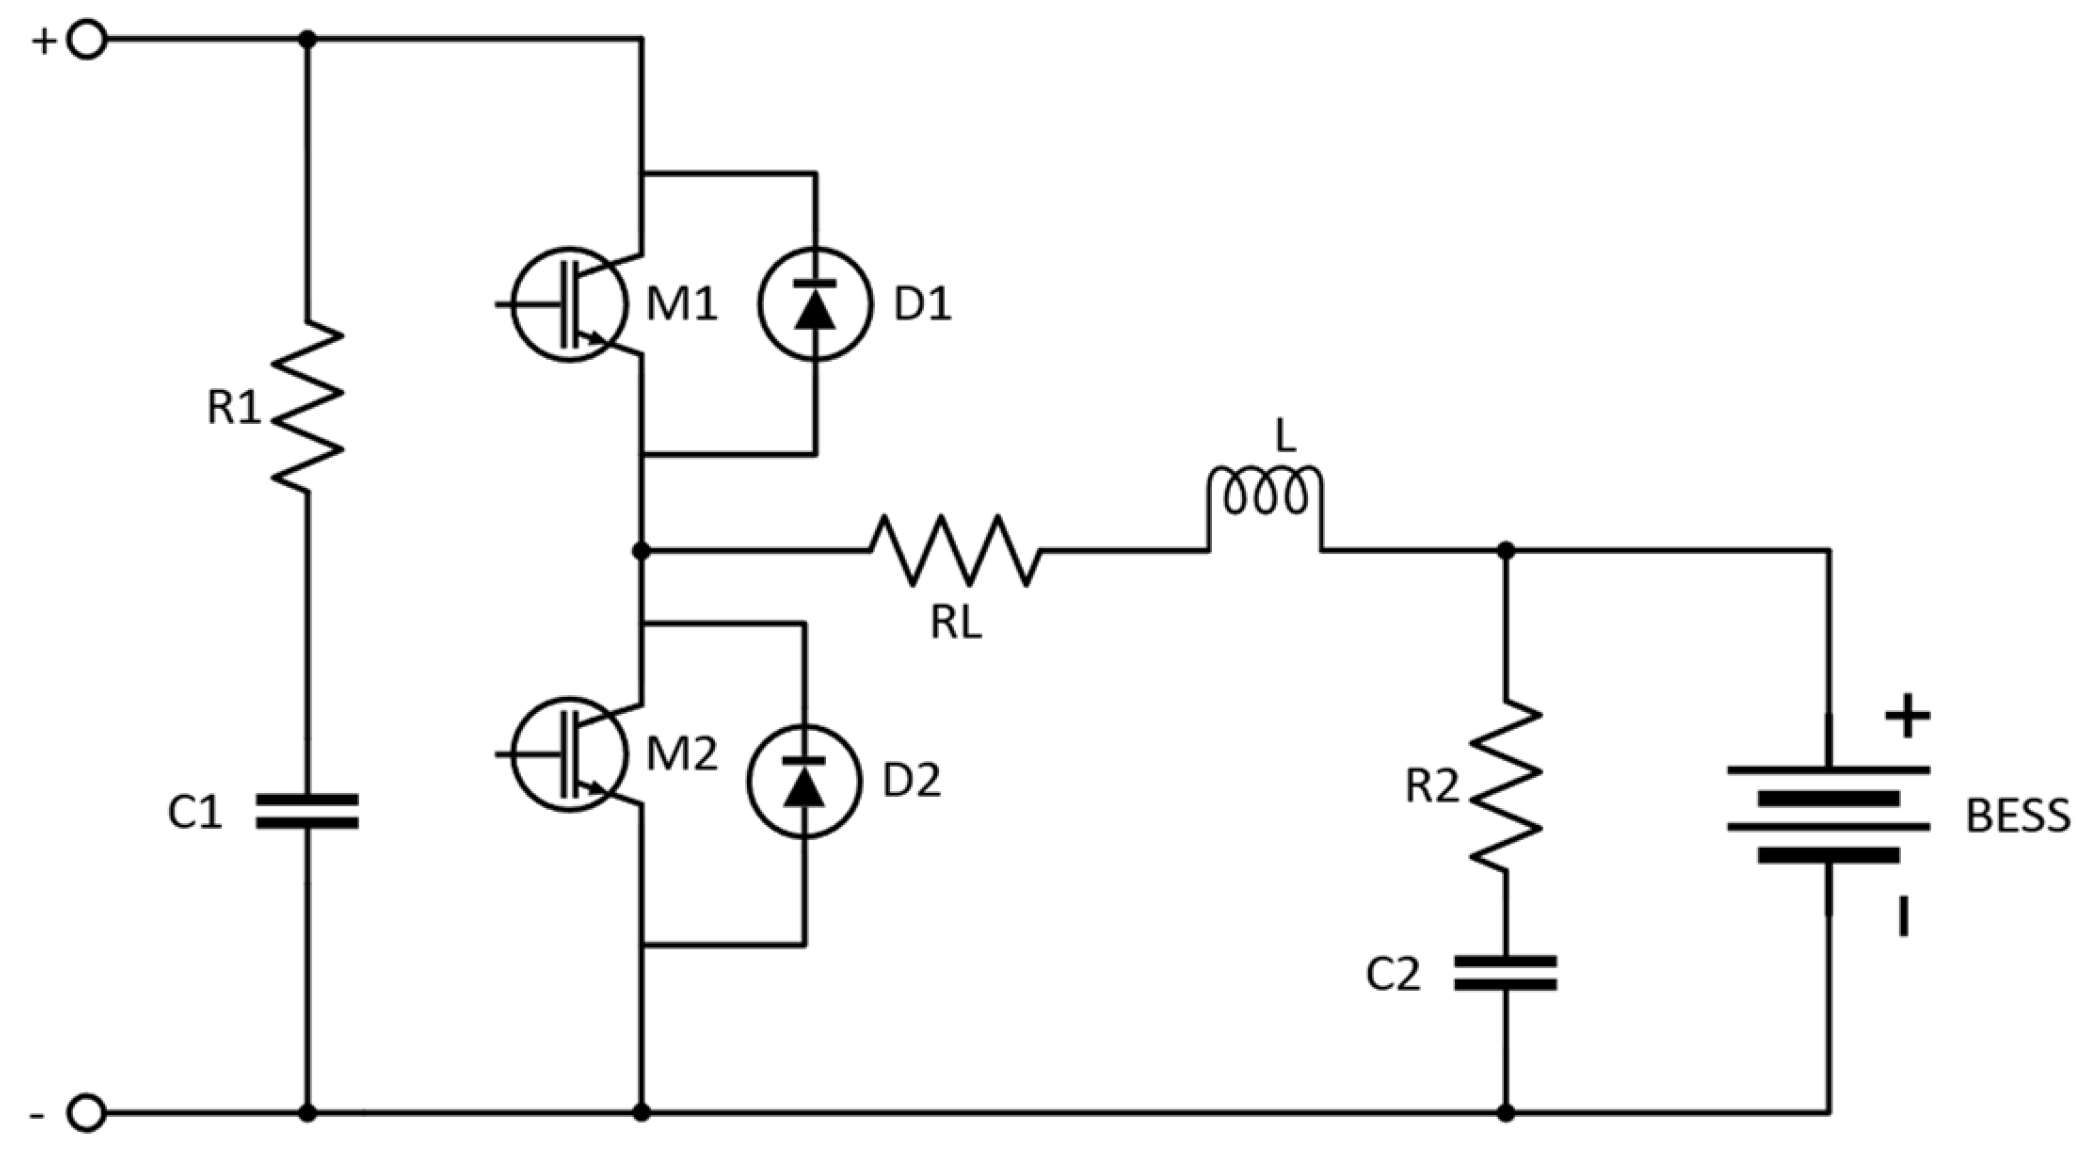
Section 3 describes the connection scheme of the BESS within the PV plant and the operation of the bidirectional converter. The droop control strategies that were implemented for the BESS for primary frequency regulation are delineated in
Section 4. In
Section 5, the operating regions of the BESS and the SOC recovery strategy are explained.
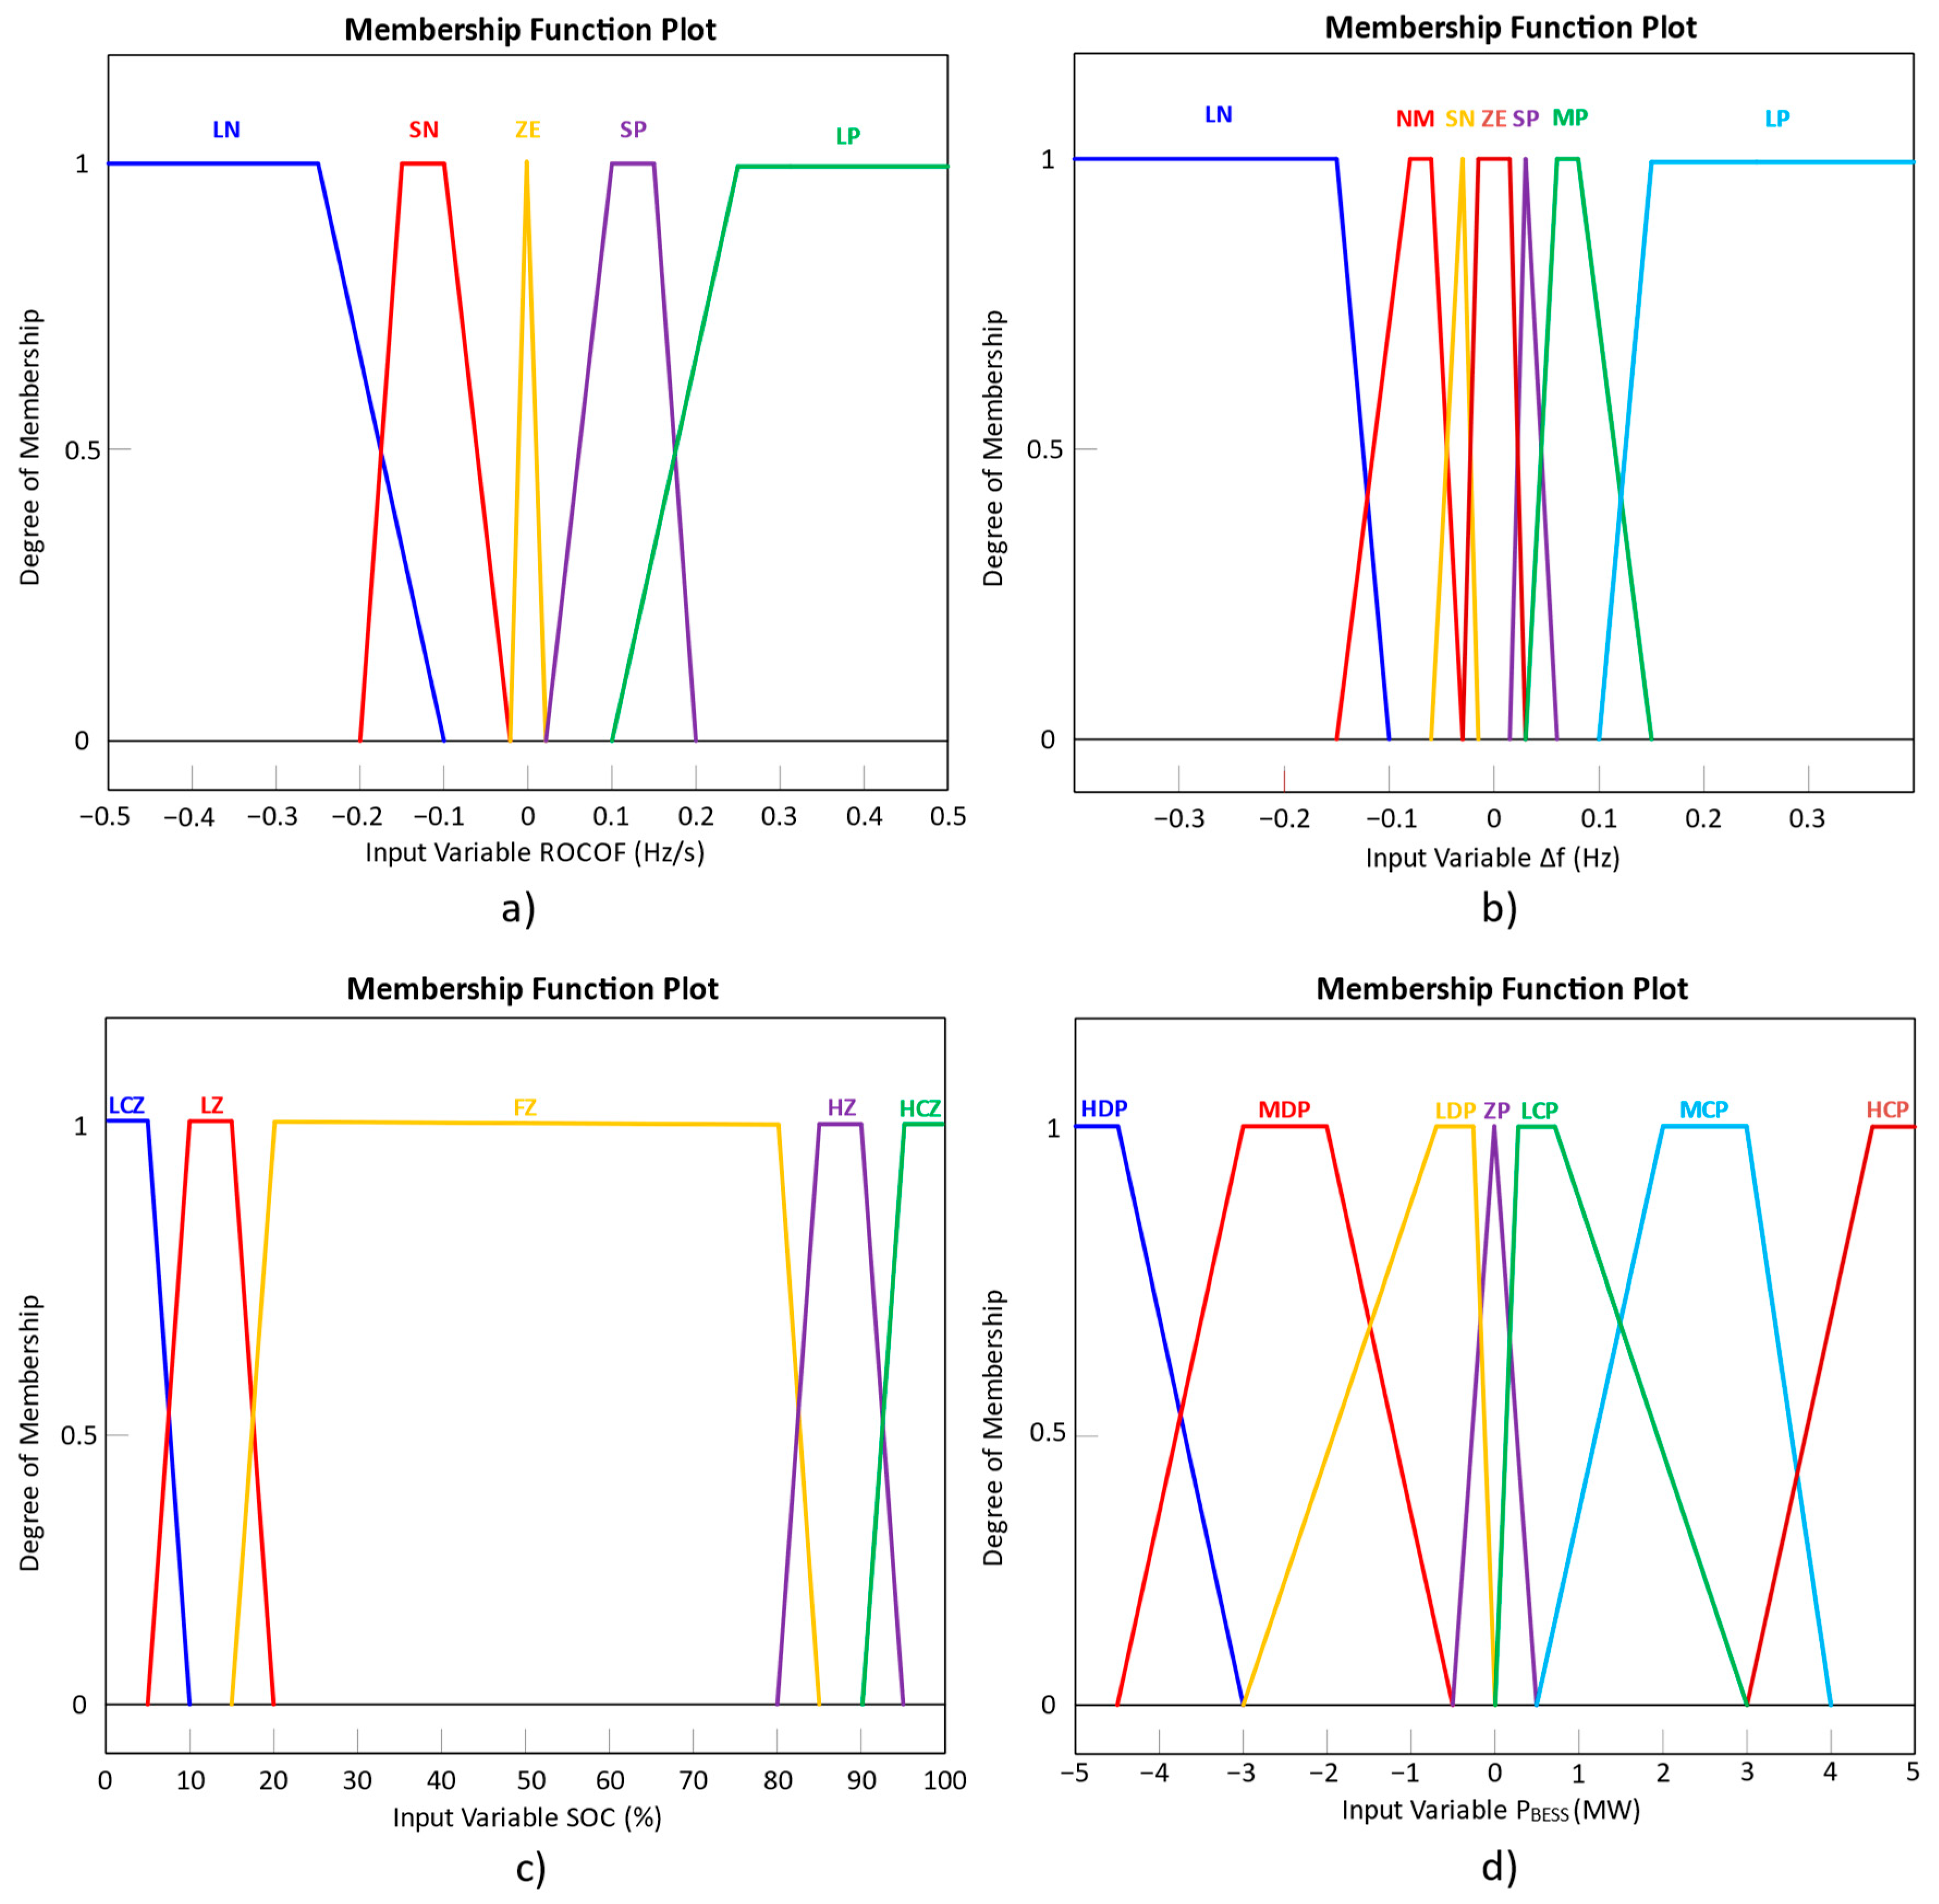
Section 6 introduces the proposed adaptive droop control method, along with the membership functions associated with the input and output variables of the fuzzy logic controller.
Section 7 presents the mathematical formulations of the indicators used to evaluate the adaptive droop control, aiming to verify its effectiveness in terms of frequency and SOC performance. The simulation results of the proposed controller under various scenarios are discussed in
Section 8. Additionally, its validation is presented through compliance with the primary frequency regulation (PFR) requirements outlined in Technical Procedure PR-21 regarding the spinning reserve, which was issued by the Peruvian Committee for Economic Operation of the System. Finally,
Section 9 provides the conclusions and recommendations of this work.
2. System Frequency Dynamics
To maintain the balance between electricity generation and demand, power systems implement multiple levels of control operating at different time intervals, as illustrated in
Figure 3. When a mismatch between generation and demand occurs, generators are unable to adjust their output instantaneously. In such instances, the kinetic energy stored in the rotating masses of conventional synchronous generators provides an immediate inertial response, temporarily mitigating the imbalance until primary control is activated (typically within 1 to 5 s). The speed governor then initiates the primary control action within the first few seconds following a frequency disturbance (generally between 10 and 40 s), aiming to reduce the initial frequency deviation. Subsequently, Automatic Generation Control (AGC) engages as a secondary control mechanism, operating over several minutes (typically between 10 and 30 min) to restore system frequency to its nominal value. Finally, tertiary control is deployed to manage power reserves once the system has identified the need for sustained frequency regulation, generally after 30 min or more.
As conventional generators are gradually replaced by renewable energy sources, the system’s ability to provide inertial response diminishes. This reduction leads to an increased rate of change of frequency (ROCOF) and a more pronounced drop in the nadir frequency over a short time span. In this context, primary control does not have sufficient time, typically less than 10 s, to respond effectively and halt the frequency decline. As a result, the power system becomes more susceptible to frequency instabilities.
To evaluate the stability of frequency in relation to inertia and PFR control, it is essential to develop the dynamic models of the generation and load units.
Figure 4 shows a simplified control model of a speed governor for a conventional synchronous generator connected to a basic load.
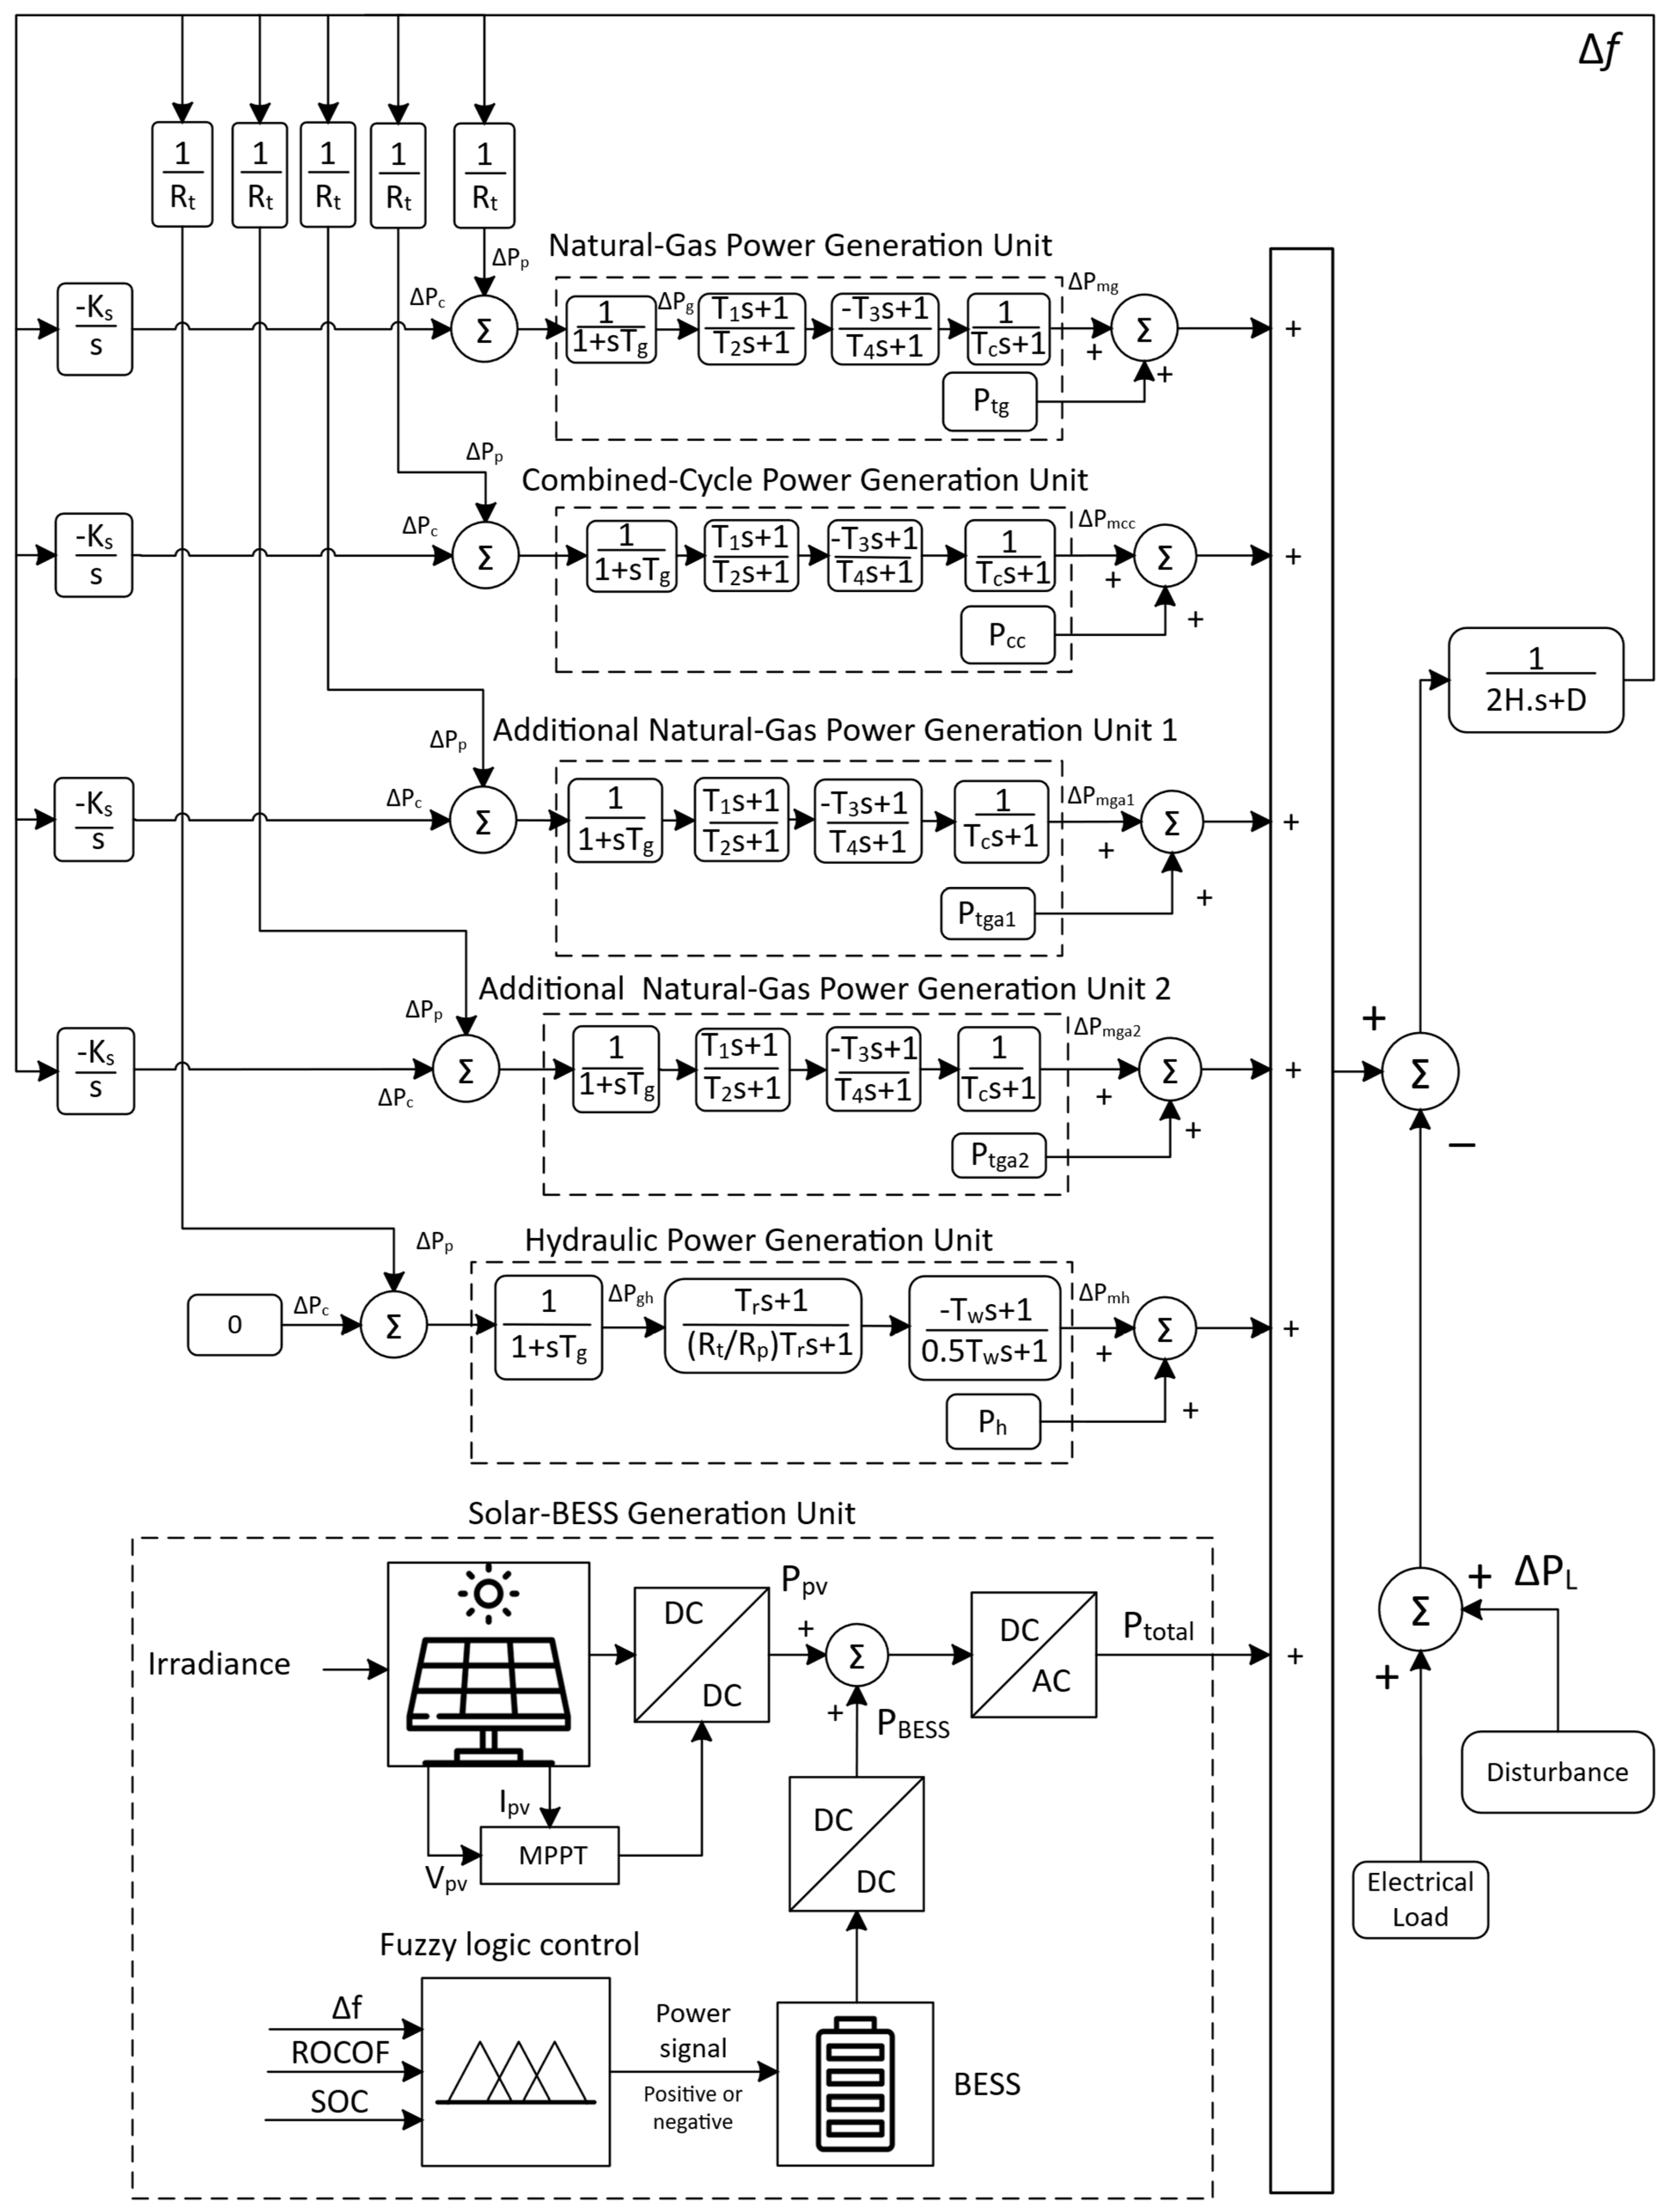
This work is based on a simplified schematic power–frequency control model of the electrical power system in a given area. It consists of a combined cycle thermal generation unit, three thermal generation units at gas, and a hydraulic generation unit, which make up the conventional electric generation, and, finally, a solar photovoltaic power plant integrated into the BESS. Three fundamental schemes are used for control of frequency, such as control due to inertia, primary control, and secondary control. The BESS is responsible for providing synthetic inertia to through the action of the ROCOF variable, reacting to this variable with an appropriate power, in addition to performing the primary control. The primary control is responsible for the stabilization of the frequency to a new value within a 10 to 40 s interval by all thermal generation units, whether gas or combined cycle, as well as the hydro generation unit. Secondary control, on the other hand, is carried out exclusively through the thermal generation units, whether gas or combined cycle. The gas-fired thermal generating units, combined-cycle units, and hydroelectric generating units are modeled mathematically. It is important to note that the models for the combined-cycle and simple gas-fired thermal generating units are considered equivalent, as the simple gas cycle plays the primary role in power generation and frequency control. Consequently, the combined-cycle unit is represented by the simple gas cycle (Brayton cycle), and it is not necessary to include the Rankine cycle model for steam turbines in this study.
By linearizing the dynamic behavior of the generation and load blocks, as illustrated in
Figure 5 of the study system, the frequency deviation in the power system can be expressed by Equation (1).
where
,
,
, and
refer to the mechanical power variations of the combined-cycle thermal generation units, the simple gas-fired cycle, and two additional gas-fired units that are scheduled to be replaced by the solar PV plant, respectively.
corresponds to the mechanical power variation of the hydroelectric generation unit.
denotes the power injected into the system by the PV plant based on solar irradiance, while
represents the power injected or absorbed by the battery energy storage system (BESS) to enhance frequency stability. Finally,
represents the load variation.
Figure 5 illustrates the power–frequency control model [
34], in which the synchronous generators and the solar PV plant are integrated. In this scheme,
represents the secondary control signal,
indicates the change in the primary control action, and
corresponds to the initial variation in the power generated by the PV plant.
5. Definition of BESS Operating Regions for Fuzzy Logic Control
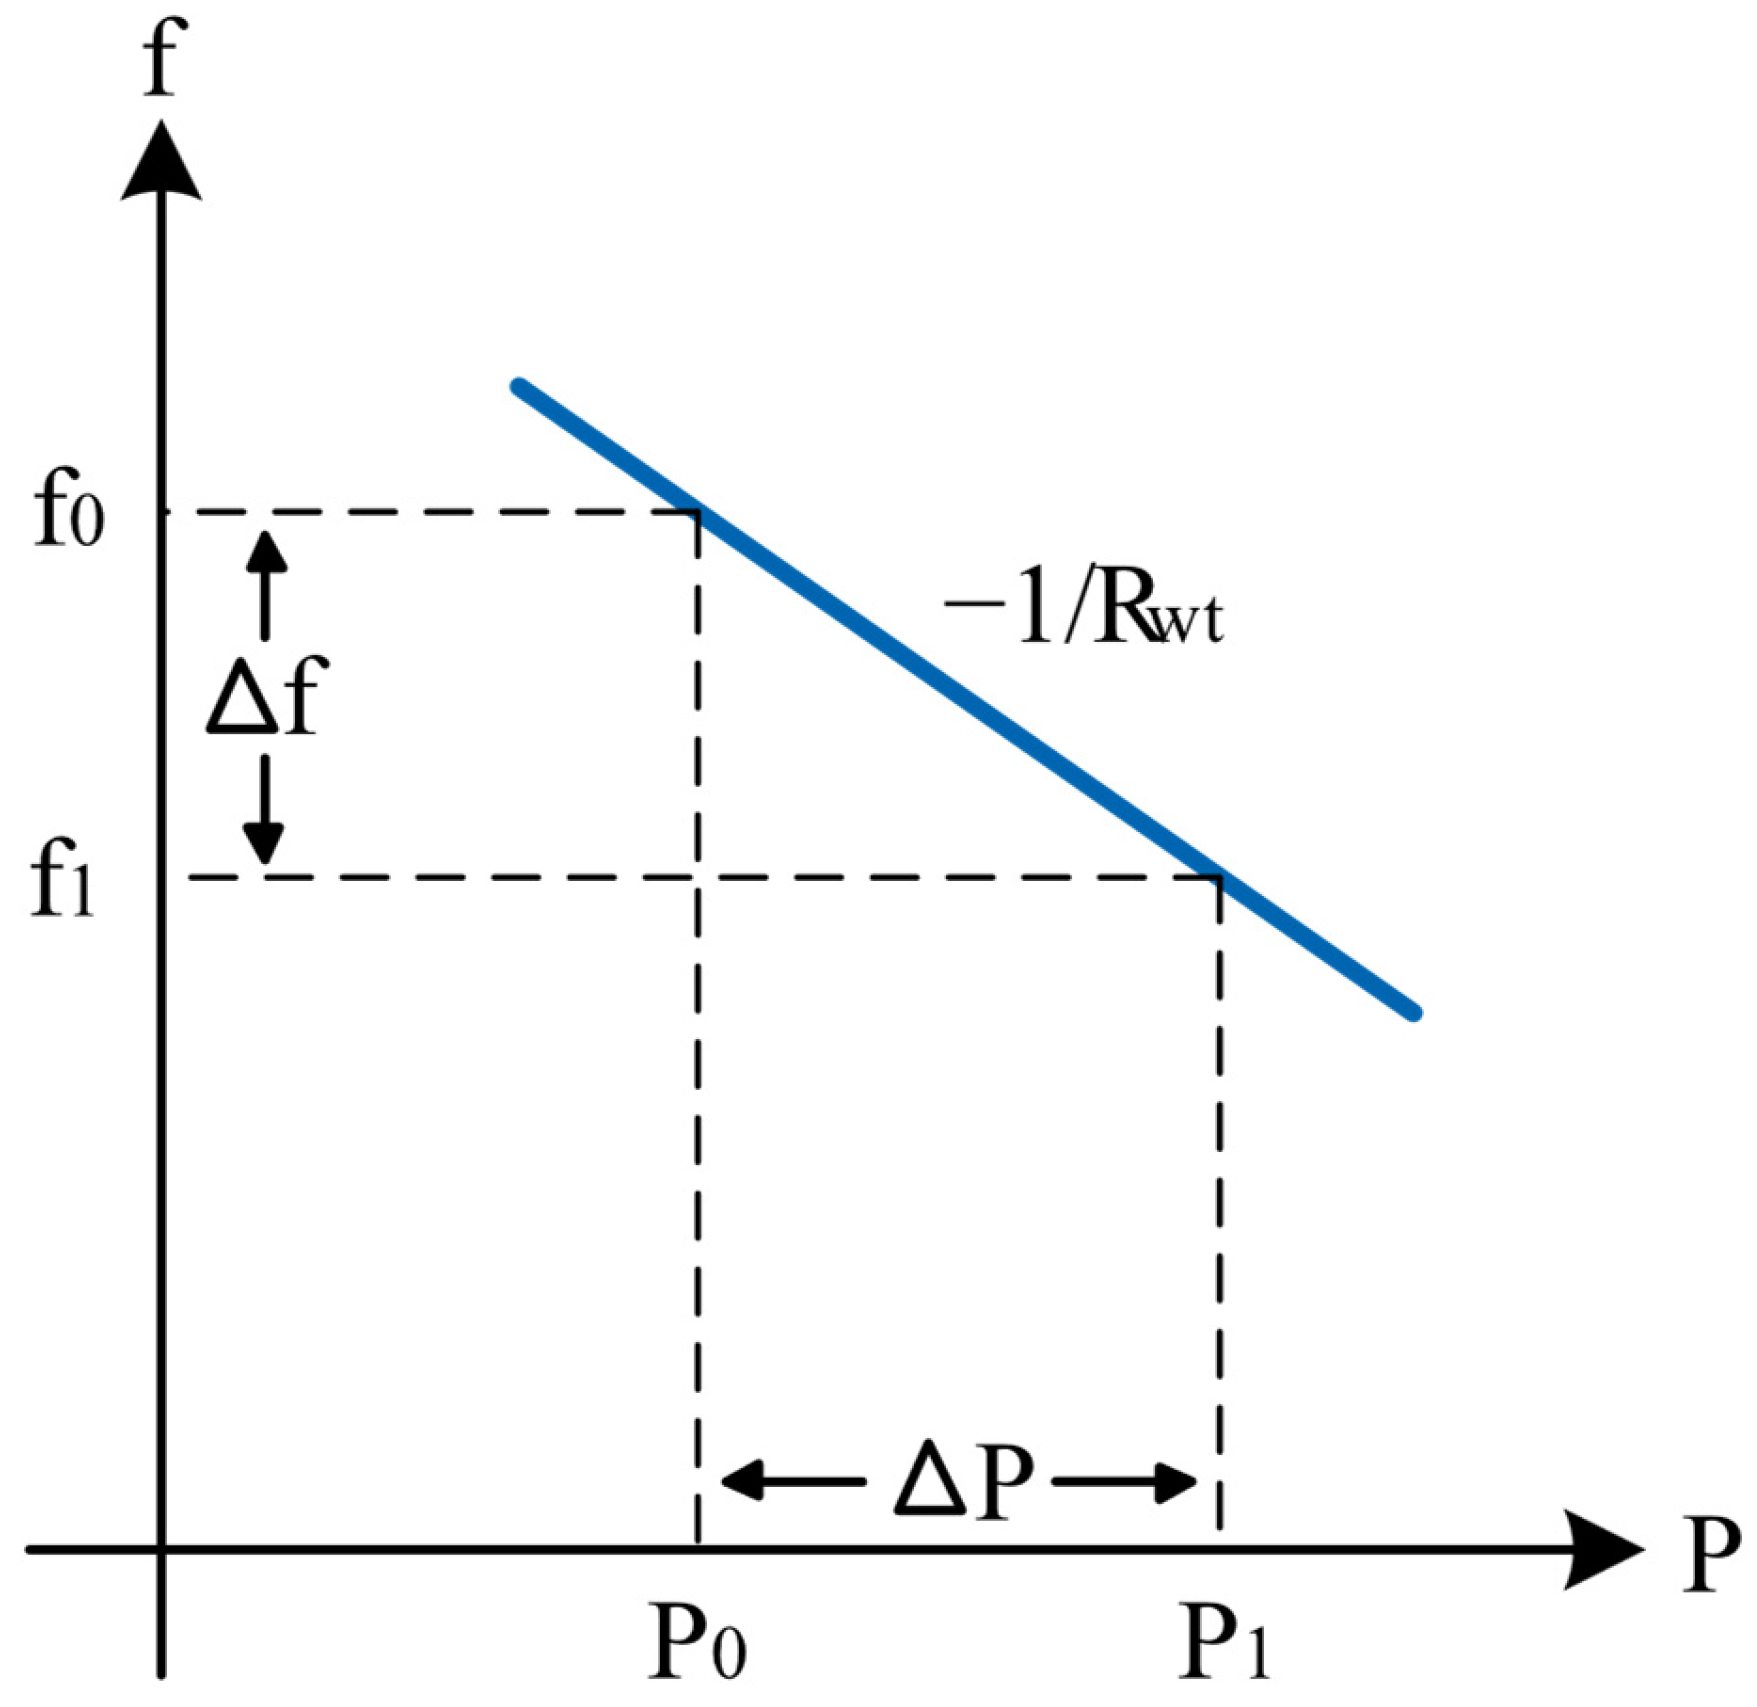
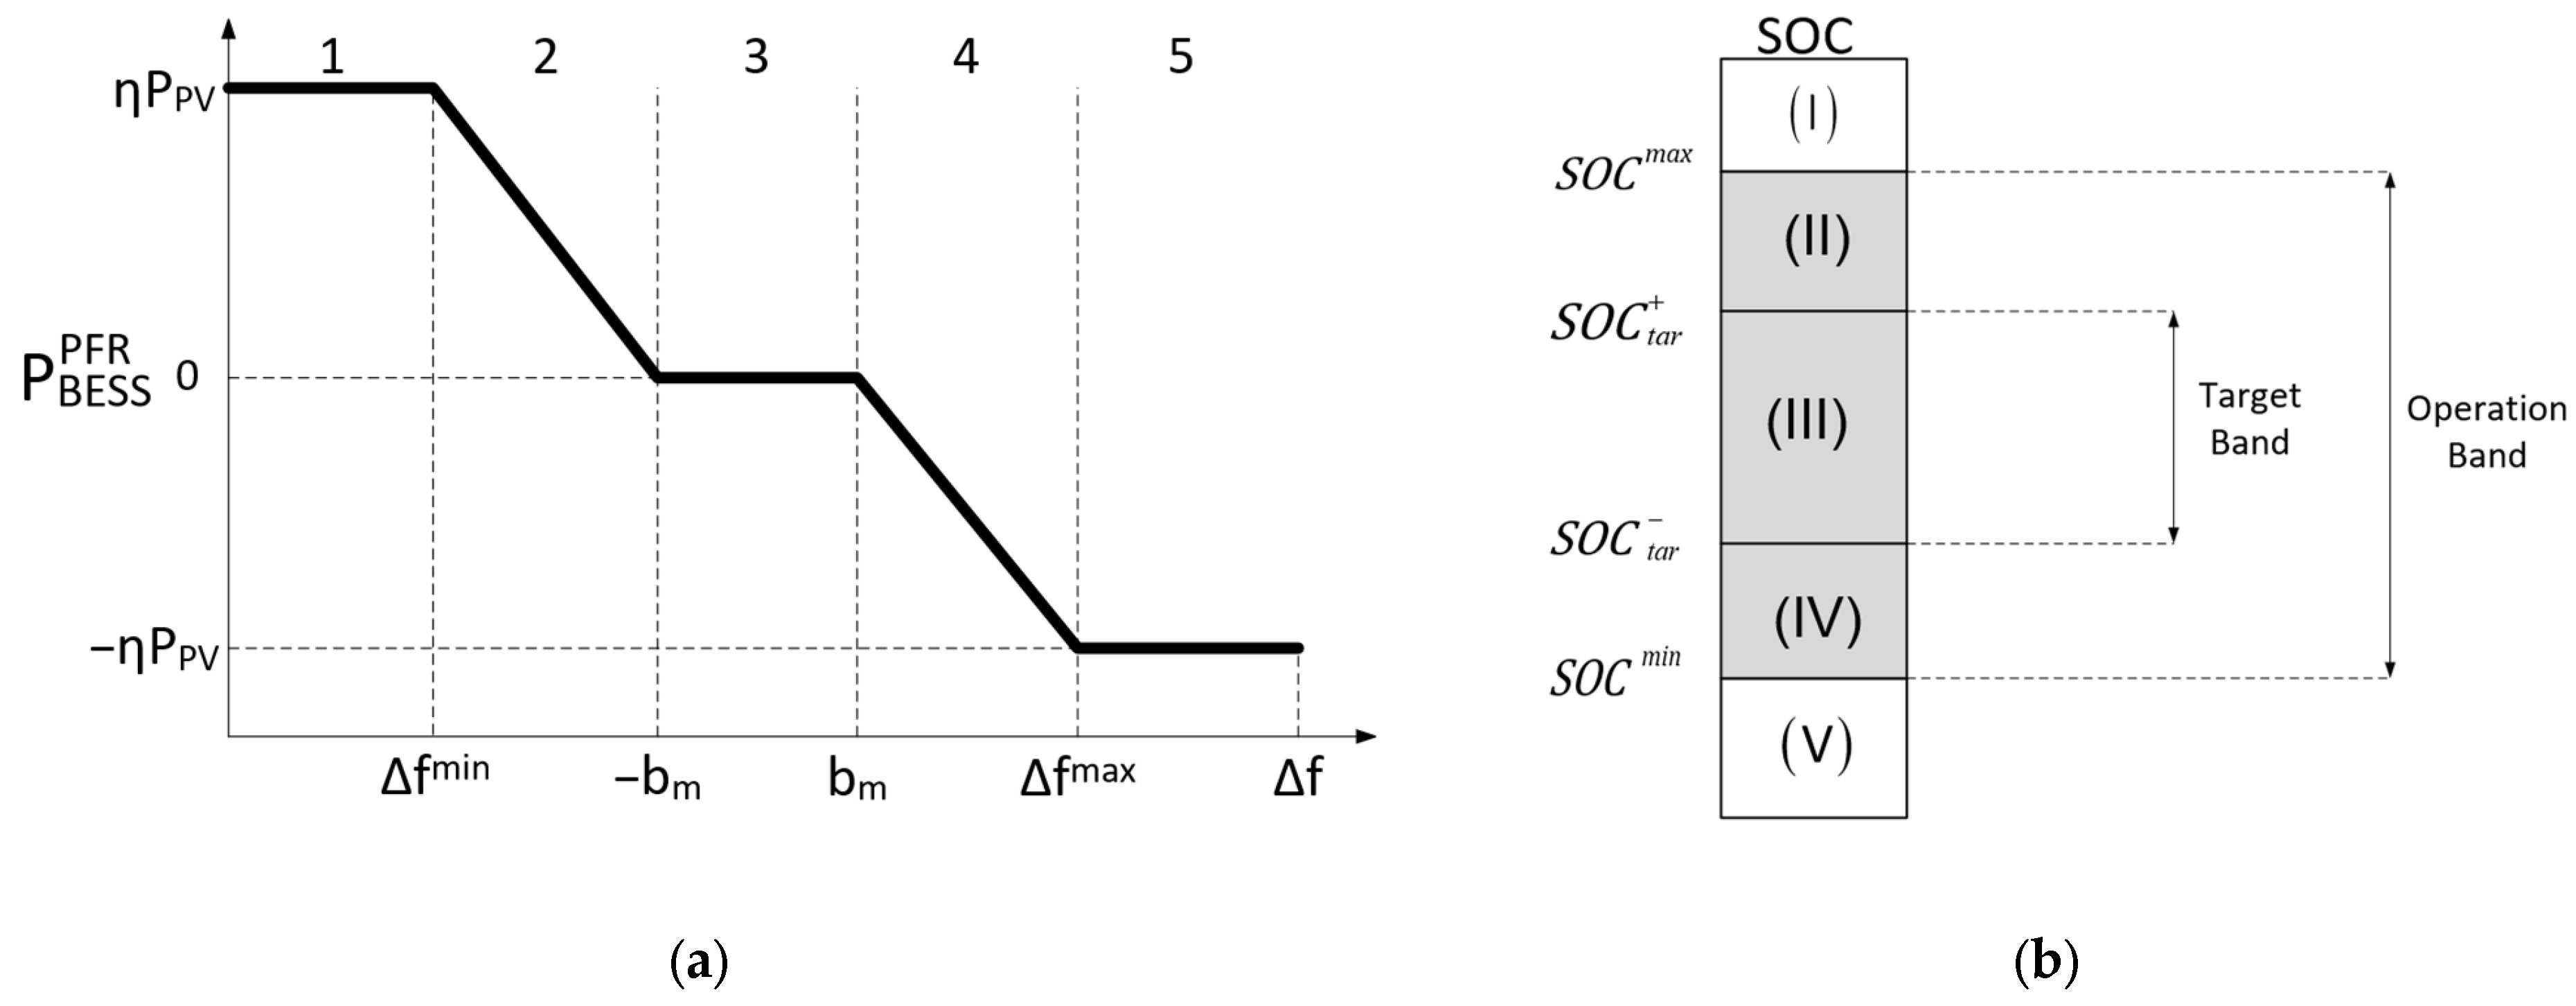
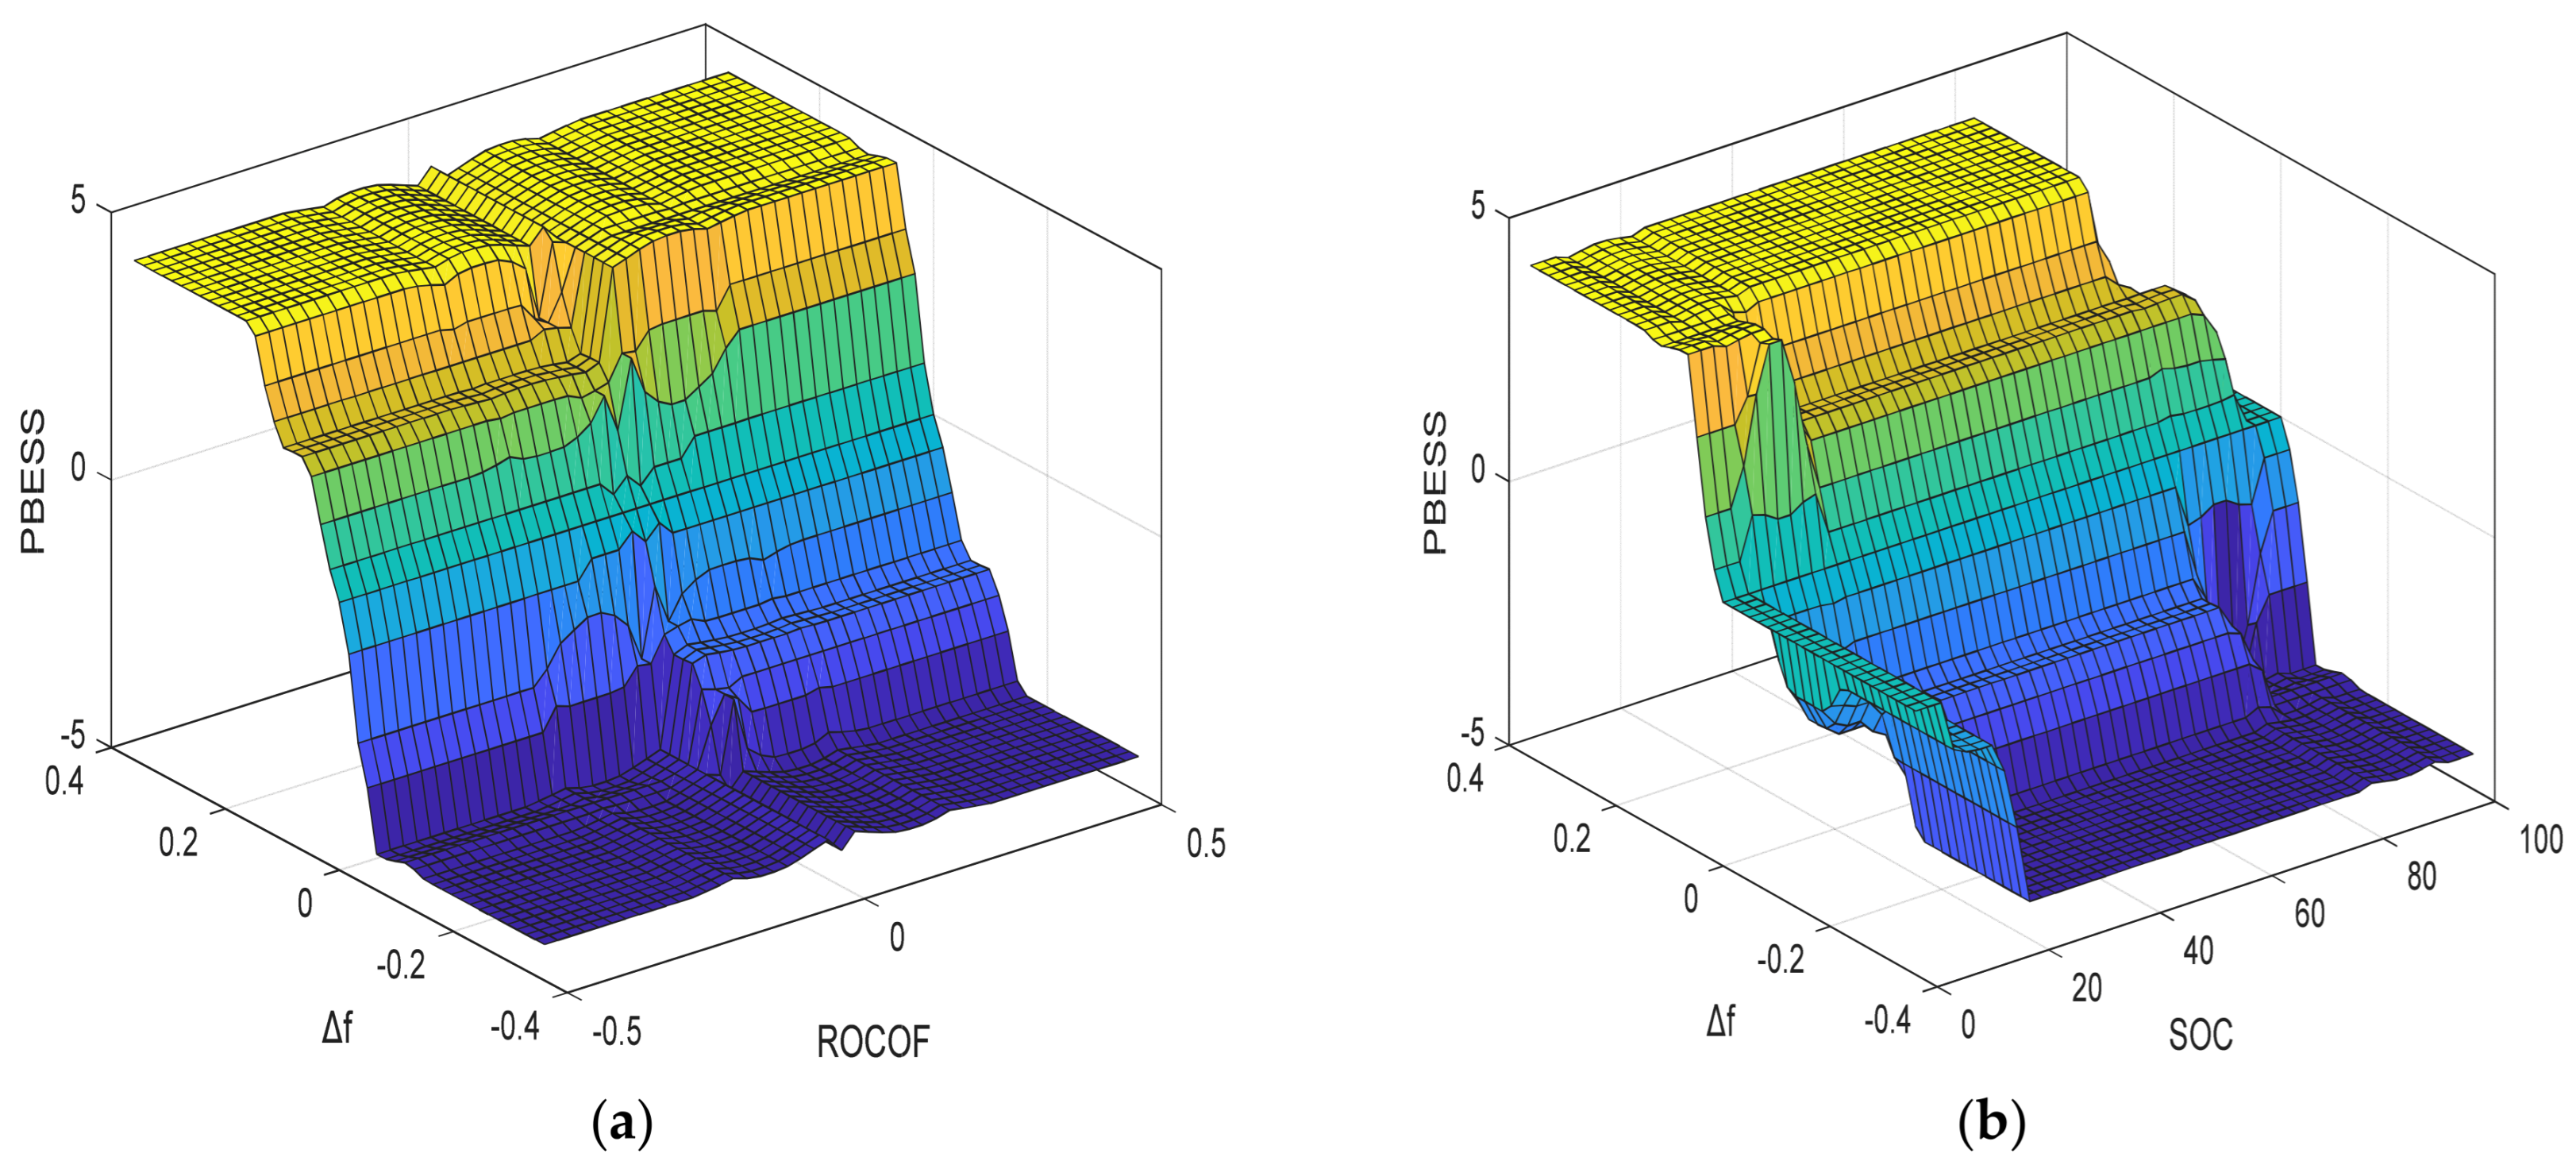
To define the regions of operation, the ROCOF variable is not considered as an initial criterion for BESS activation. Instead, power management is based on the frequency deviation and SOC variables, which determine when BESS participation in PFR is both necessary and feasible. Under PFR operation, BESS power primarily depends on , , and the droop control coefficient (). For modeling purposes, BESS power is divided into two distinct components: , representing the instantaneous power at time t allocated to support frequency regulation, and , representing the power allocated to SOC recovery. Additionally, the maximum BESS power is defined as a percentage () of the PV plant power, such that .
Figure 9a illustrates the BESS operational regions under conventional droop control, serving as the foundation for the proposed control strategy. The horizontal axis represents the frequency deviation
, while the vertical axis indicates the BESS power allocated to PFR. The operational regions are labeled as 1 through 5. Regions 1 and 5 correspond to BESS saturation, where the system exchanges its maximum power
with the grid. Regions 2 and 4 represent the linear response zones, where
is proportional to
, forming a straight line with a slope equal to the inverse of the droop coefficient. Region 3 defines the dead band, where no power is exchanged for PFR purposes; instead, a small amount of power is exchanged to restore the SOC to its target range.
Figure 9b presents the operational regions considering the BESS state of charge, which must be considered during PFR. This ensures appropriate energy management and protects the BESS from deep discharge or overcharging, both of which can lead to degradation and reduced lifespan.
The state of charge (SOC) of the battery energy storage system (BESS) is defined as the ratio between the currently stored energy
and its nominal capacity
.
Figure 9b illustrates five operating regions of the BESS based on
, labeled (I) through (V).
Region (I) corresponds to battery overcharge , where the system cannot absorb additional energy from the grid.
Region (V) represents excessive discharge , which prevents the battery from supplying power to the grid.
Regions (II) and (IV) define operating conditions where the SOC allows both charging and discharging, enabling the full provision of primary frequency regulation (PFR) services, although the SOC may lie outside its preferred target band.
In regions (I), (II), (IV), and (V), it is essential for the BESS to either absorb or supply energy through the control action to bring the SOC back to its target band, provided the frequency deviation remains within the dead band. In contrast, region (III), defined by , requires no intervention and enables the unconstrained provision of primary frequency regulation (PFR) services.
As illustrated in
Figure 9a,
represents the portion of power that responds linearly to the frequency deviation
and is defined by Equation (18). The coefficient
takes a positive value when the frequency deviation is negative (
) and a negative value when the frequency deviation is positive (
).
In this study, the thermal limits of the batteries were not considered. This represents a critical omission, as maintaining the cells within a safe temperature range is essential under real-world operating conditions. Failure to do so may lead to disconnections due to overheating and accelerate the degradation of internal components such as the electrolyte and electrodes. Conversely, low temperatures can reduce battery capacity and even cause charging failures. Additionally, electrochemical degradation curves, vital for modeling the evolution of capacity and internal resistance over time, were not included. The absence of these curves limits the accuracy of the predictive model, as the fuzzy control response may degrade, thereby compromising the efficiency of the primary frequency reserve (PFR) service. It is important to emphasize that battery lifespan is closely tied to charge and discharge profiles. In PFR applications, where energy throughput is significant, system aging is accelerated. Therefore, a comprehensive analysis must account for these factors not only from a technical standpoint but also from an economic perspective, as timely module replacement will be necessary.
Figure 10 illustrates the calculation of
(
Figure 10a) and
(
Figure 10b), both determined according to the operating regions defined in
Figure 9. A sign convention is adopted whereby power is considered positive when the BESS absorbs energy from the power grid and negative when the BESS delivers energy through the DC link. It is important to note that
is configured to be non-zero only when the frequency lies within the dead band (region III), as illustrated in
Figure 10a. In this context,
can be interpreted as either a power injection into or absorption from the system, depending on its sign. The magnitude of this power must be kept small to avoid significant imbalances between generation and demand, which could otherwise lead to further frequency deviations. Limiting the power also enables a gradual charging and discharging of the storage system. It is worth noting that
is defined as proportional to the maximum power capacity of the BESS, a fixed percentage of the nominal power, determined by a low-power SOC recovery factor, denoted by
β.
Figure 10b illustrates the theoretical operation of the BESS based on SOC regions and Δ
f for providing primary frequency regulation (PFR). However, this model presents three main limitations:
Thermal limit not considered: By ignoring the thermal limit, the safe operating temperature range remains unknown. In practice, this could affect both the efficiency and safety of the system.
Nonlinear degradation: The actual degradation of batteries follows a nonlinear behavior. Over time, this could render the proposed operating regions for the BESS inaccurate, compromising service efficiency and overestimating the available energy.
Ignored cycle impact: The dependence on the number of cycles (charging and discharging) has not been considered. This omission could lead to inadequate controller optimization, as the cost associated with the battery’s lifespan is disregarded.
The proposed operational model of the battery energy storage system (BESS) does not account for the physical constraints imposed by the battery charger and the Battery Management System (BMS). Nevertheless, the fuzzy control strategy designed for this system demonstrates effective regulation of the charging and discharging processes. This methodological design prevents operation under critical conditions and ensures continuous monitoring of the state of charge (SOC), thereby fulfilling the objective of safeguarding the battery. However, the implementation of this strategy is currently conditioned by the need for a BMS with a broader set of functionalities, which is essential for operation in practical scenarios. Therefore:
Safety and Physical Performance: There is a significant risk of overvoltage or overcurrent, which could cause permanent damage to the system. In cases of overcharging, cell venting leads to the release of flammable gases, posing a serious safety hazard. Moreover, insufficient voltage or current would negatively affect battery performance, while inadequate monitoring would further increase operational risks. High temperatures, excessive heat, and other anomalies can degrade the battery system [
37].
Lack of Protection and Reliability: The battery system is exposed to multiple risks due to the absence of the protections ensured by a BMS. This deficiency limits its operability and leaves it vulnerable to any failure.
Efficiency and Economic Feasibility: The efficiency of the charging and discharging procedures is not guaranteed. Furthermore, the SOC has not been optimized to maximize the battery’s lifespan. Therefore, a comprehensive economic assessment is required to determine the system’s feasibility.
Controller Diagnosis and Adaptability: The absence of fault diagnosis [
38] and the monitoring of changes in battery parameters reduces the efficiency of the fuzzy controller. This lack of information prevents ensuring optimal battery performance.
System Integration and Adaptation: There is no communication with other systems, which prevents optimizing the battery’s performance. Without such integration, it is not possible to adjust the fuzzy controller strategy based on the batteries’ future states [
39].
8. Results and Simulations
This section presents the results and analysis of the simulations performed to evaluate the proposed fuzzy droop control strategy for battery energy storage systems (BESS) integrated into photovoltaic power plants. The performance is examined under various scenarios, including increasing levels of PV penetration, variations in system inertia, and different types of disturbances. Additionally, a comparative evaluation of the proposed method against both conventional and advanced droop control strategies is provided, along with an assessment of primary frequency response compliance in accordance with established regulatory standards. Simulations were performed with MATLAB R2024a software on a computer with the following characteristics: an Intel(R) Core (TM) i5-9400F microprocessor, 16 GB of DDR4 RAM, an NVIDIA GeForce GTX 1660 graphics card, and the Windows 10 Pro operating system.
The operational parameters of all components within the simulated system—including conventional power plants, the photovoltaic power plant, and the battery energy storage system (BESS)—were precisely defined to ensure consistency with their respective modeling characteristics. Detailed specifications for each component are provided in the
Appendix A, specifically in
Table 8,
Table 9 and
Table 10.
8.1. Evaluation of the Proposed Fuzzy Logic Control
To evaluate the proposed fuzzy control strategy, two scenarios, Scenario A and Scenario B, were simulated under identical initial conditions: an irradiance of 1000 W/m2, a state of charge of 50%, and a step load of 48 MW.
8.1.1. Scenario A: Impact of Increasing Photovoltaic Penetration
Scenario A examines the gradual increase in photovoltaic penetration while maintaining constant system inertia. The details of these scenarios are presented in
Table 11.
8.1.2. Scenario B: System Inertia Variation with PV Participation
Scenario B evaluates the replacement of conventional generation with photovoltaic sources and the resulting changes in system inertia, as detailed in
Table 12. In this context, a 60 MW PV plant is capable of providing primary frequency regulation (PFR) in Scenario B3. It is important to note that the disconnection of two 30 MW gas-fired power plants in Scenarios B2 and B3 leads to a reduction in the system’s equivalent inertia.
Figure 15 presents the simulation results for Scenarios A and B. In
Figure 15a, it can be observed that increasing photovoltaic (PV) penetration and BESS capacity leads to higher frequency nadir values (the minimum frequency reached following a disturbance in the power system), while the quasi-steady-state frequency decreases.
Figure 15b illustrates how variations in system inertia, caused by the loss of thermal units and their replacement with a PV-BESS plant, can compensate for deficiencies and enhance frequency stability. Notably, Scenario B3 significantly outperforms Scenarios B1 and B2.
8.2. Comparative Analysis of the Performance of Droop Control Methods
Three types of disturbances were applied to evaluate frequency stability using BESS technology. According to [
26], these disturbances are categorized as follows: a step-type disturbance; a continuous, low-magnitude, long-duration disturbance; and a combined disturbance involving both a high-magnitude transient and a continuous, low-magnitude, long-duration component. To enable a fair comparison and analysis under identical operating conditions, several control strategies were implemented, namely, the proposed method, Method 1, Method 2, and Method 3, as detailed in
Table 13.
8.2.1. Case Study 1: Large-Magnitude Step-Type Disturbance
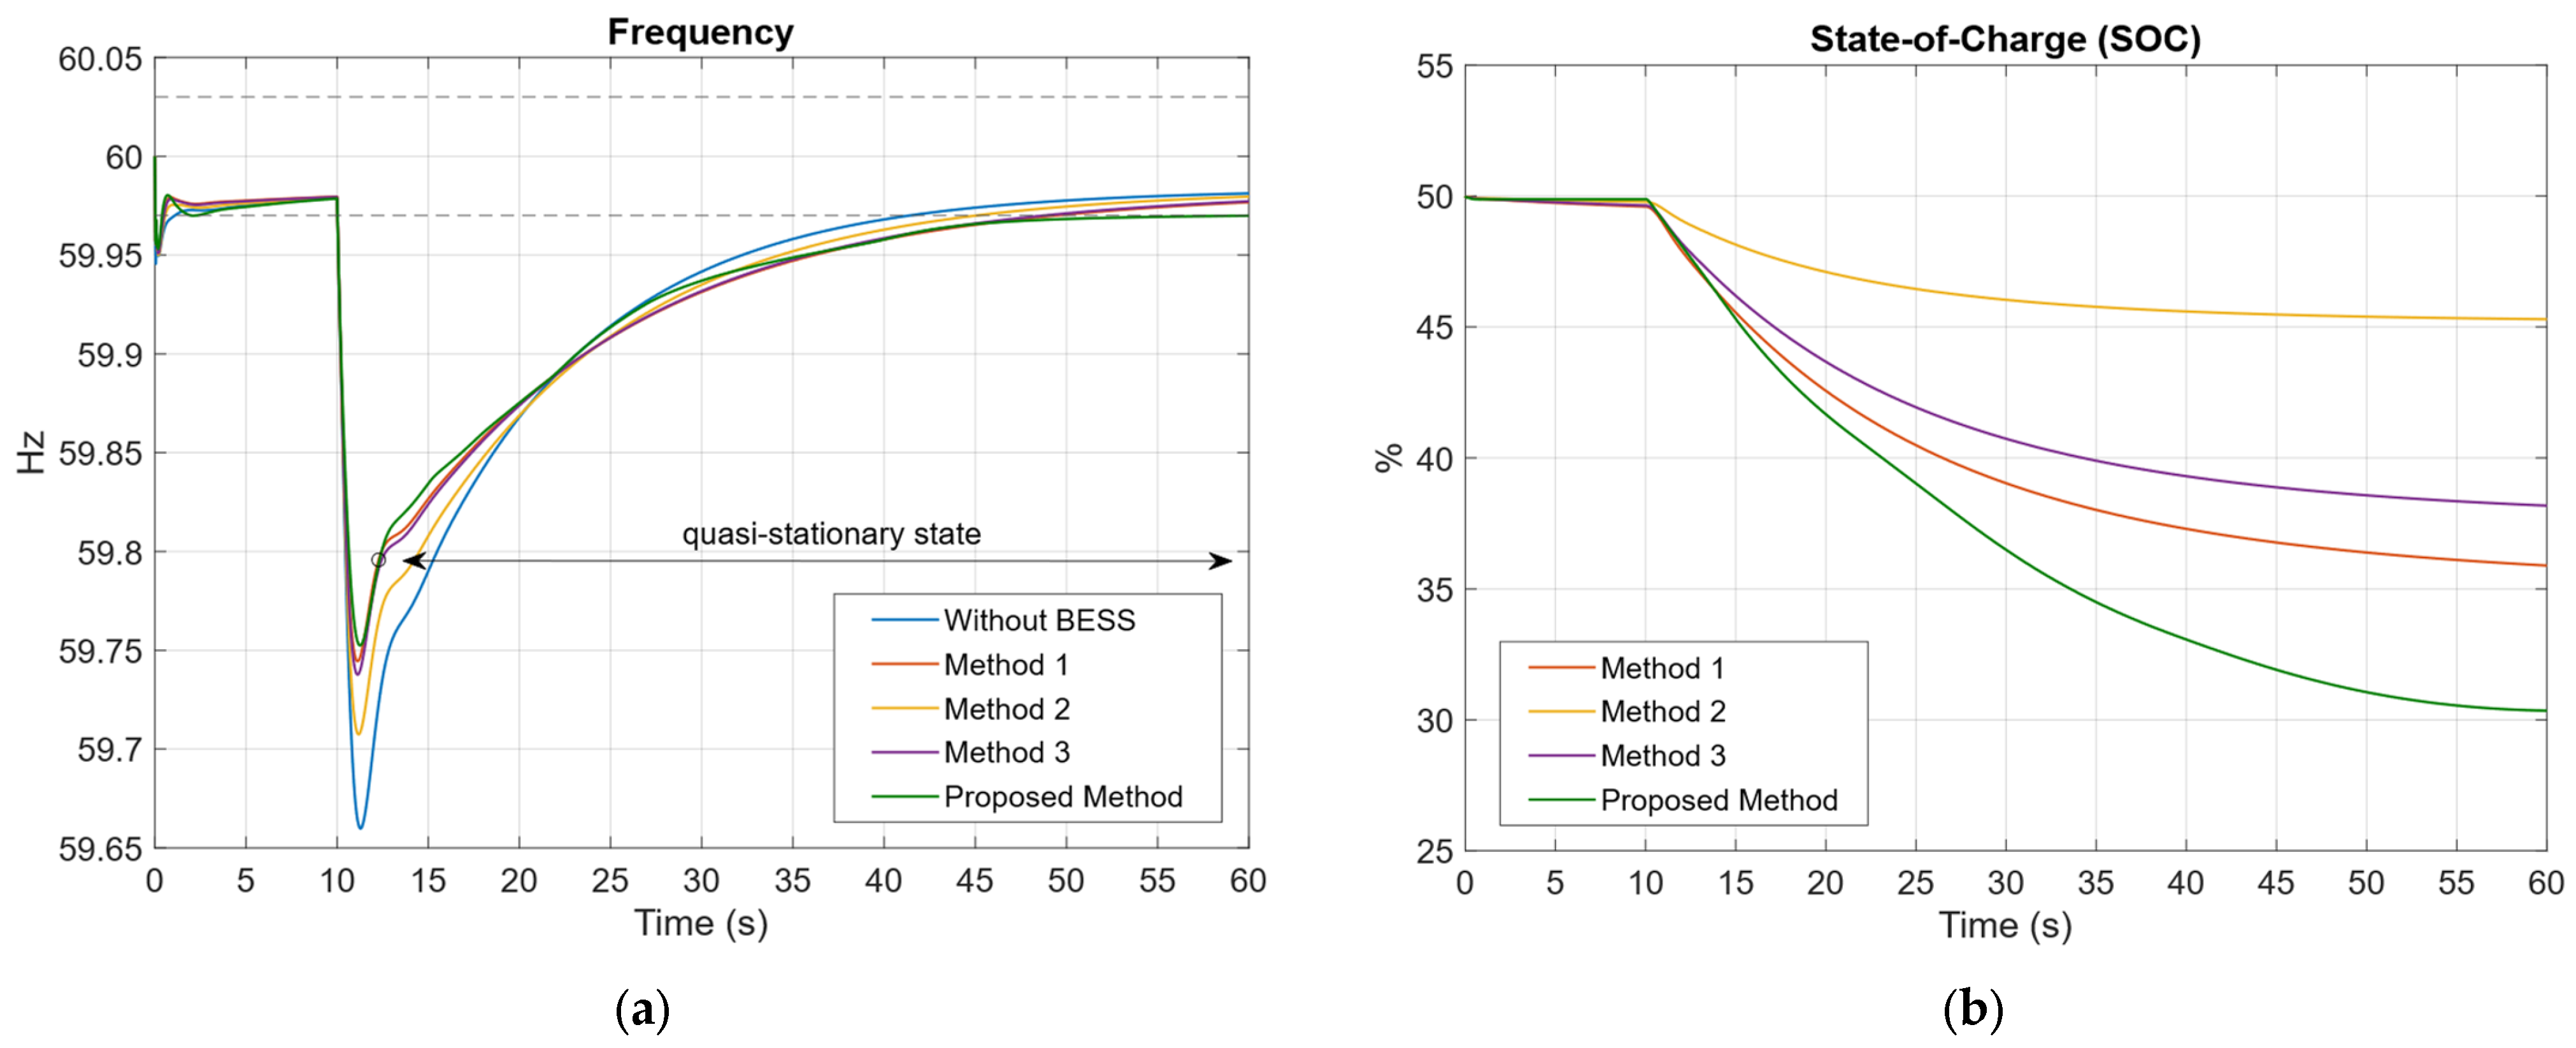
A 60 MW step-type load disturbance, representing a critical load for the power system, was simulated. In this simulation, this load is connected 10 s after the start of the simulation and remains active for the following 50 s.
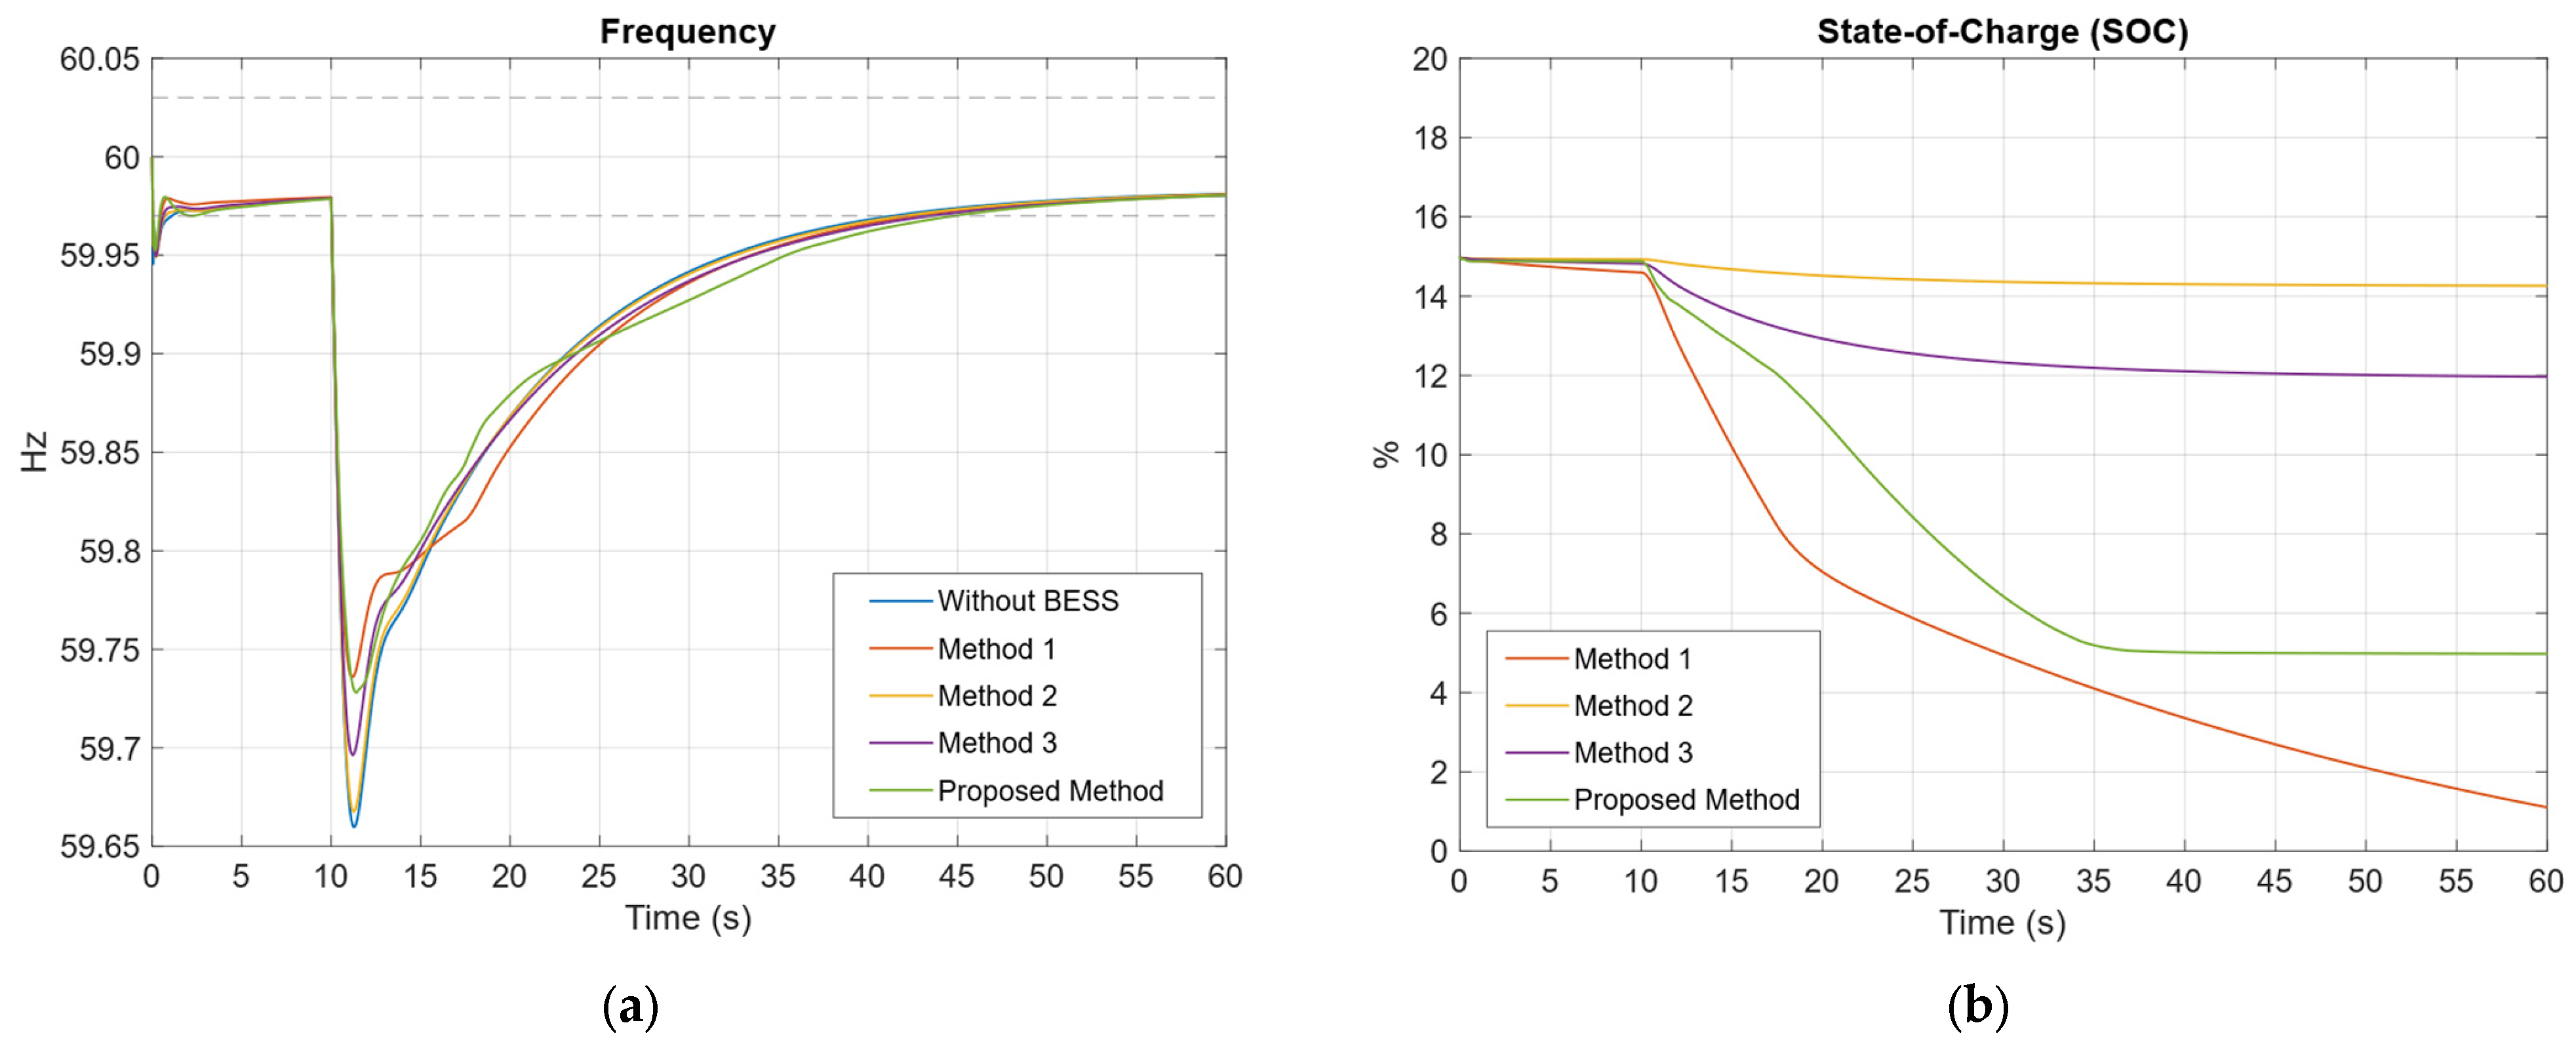
Figure 16a shows that the proposed method is capable of maintaining a higher frequency nadir compared to the other methods. However, in the quasi-steady-state phase, it exhibits the lowest frequency value. This suggests that, while the proposed method is effective in enhancing frequency stability following a disturbance, alternative frequency control methods achieve higher quasi-steady-state frequency levels.
Figure 16b presents the BESS state of charge curves for the different control methods. The proposed method exhibits the greatest SOC drop, indicating higher energy consumption. Method 1 shows the second-largest SOC drop, with an
, value of 10.1827%. It is important to highlight that, in this method, the droop control coefficient is not dependent on the SOC, which may negatively impact battery lifespan and compromise frequency stability at critical SOC levels.
In the case of Method 2, greater SOC stability is observed, as indicated by a curve with a smaller drop, resulting in an of 3.56%. However, this method exhibits the poorest frequency response among the tested approaches, due to a more pronounced frequency drop. Finally, Method 3 shows a smaller SOC drop than the proposed method, indicating improved SOC stability. Nevertheless, in terms of frequency stability, its performance is slightly inferior, with a difference of 0.0032 Hz compared to the proposed method, though this difference is relatively minor.
Table 14 presents the evaluation indices established for each droop control method, based on frequency and SOC. The most favorable results are shaded, indicating that the proposed method is superior in almost all indices, with the exception of SOC stability. This method enables a more effective action and a considerable reduction in
, resulting in the lowest value among all methods. However, it also corresponds to the highest energy consumption, calculated at 0.0948 MWh.
8.2.2. Case Study 2: Continuous Disturbance of Low Magnitude and Long Duration
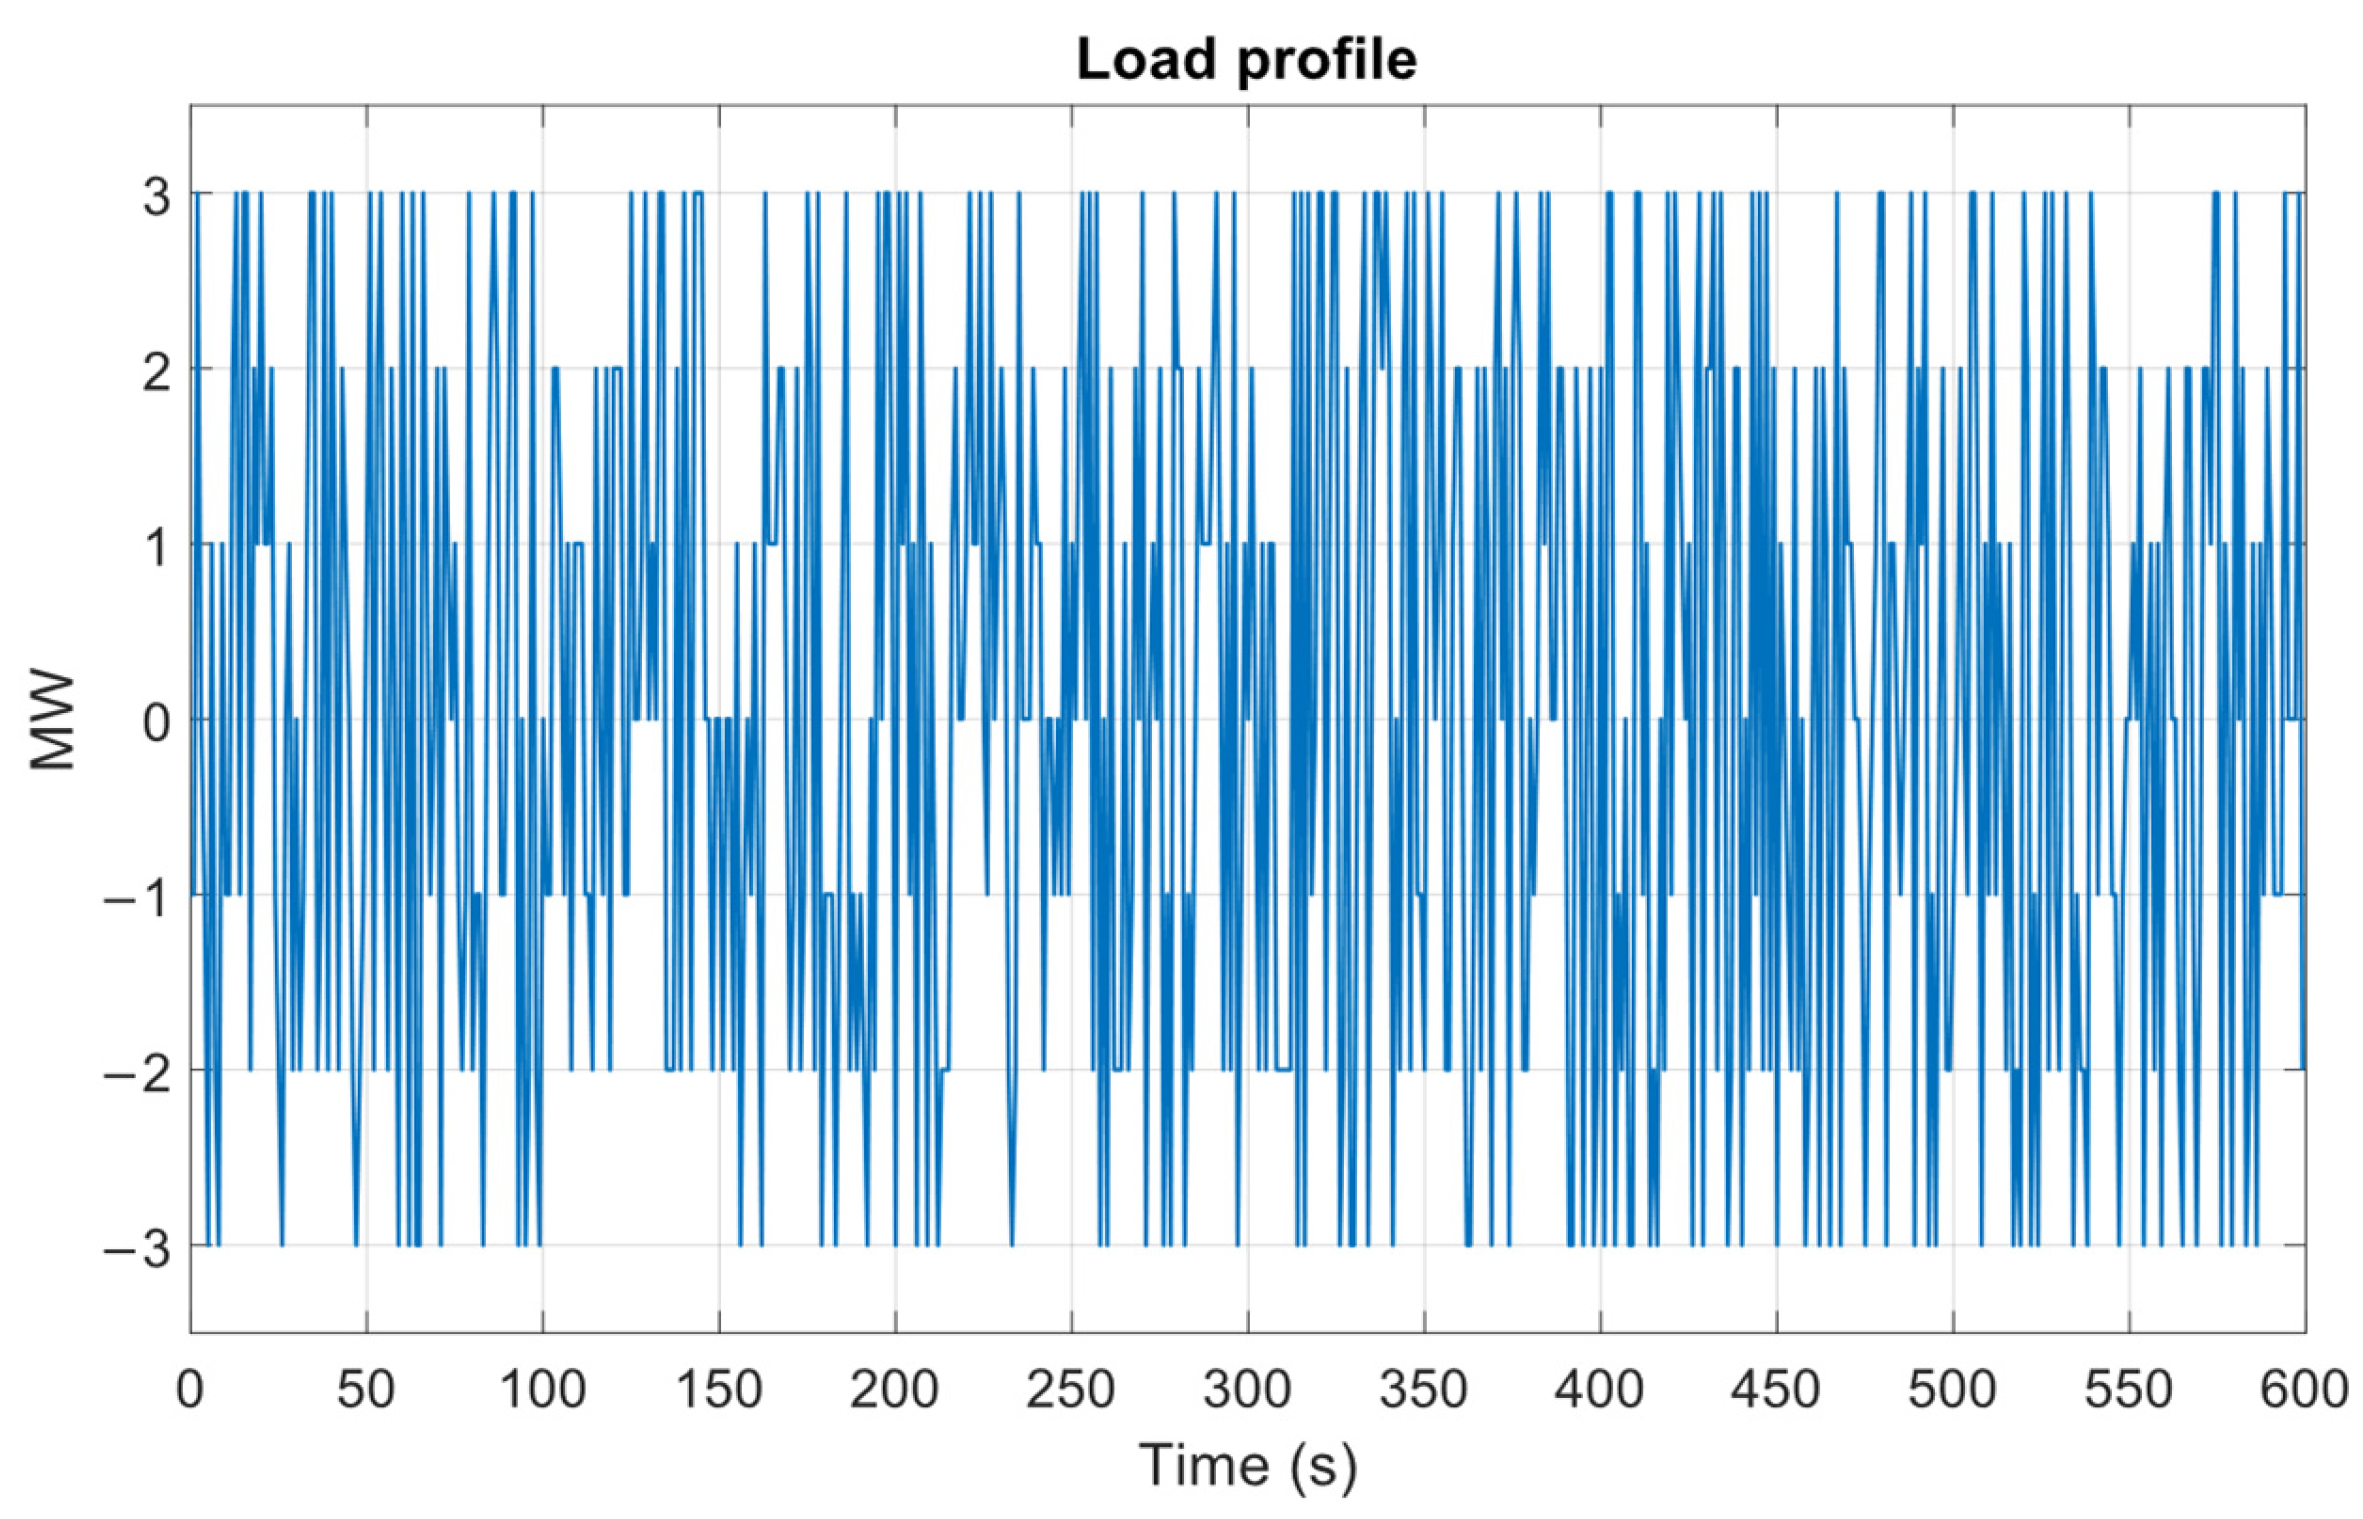
For this study, a load disturbance profile was defined, characterized by small, random fluctuations generated from a discrete uniform distribution, with connection and disconnection magnitudes not exceeding 3 MW. This configuration results in a continuous disturbance of low magnitude and extended duration.
Figure 17 shows the applied load profile, which varies between –3 MW and 3 MW. A simulation time window of 10 min (600 s) was used for this analysis.
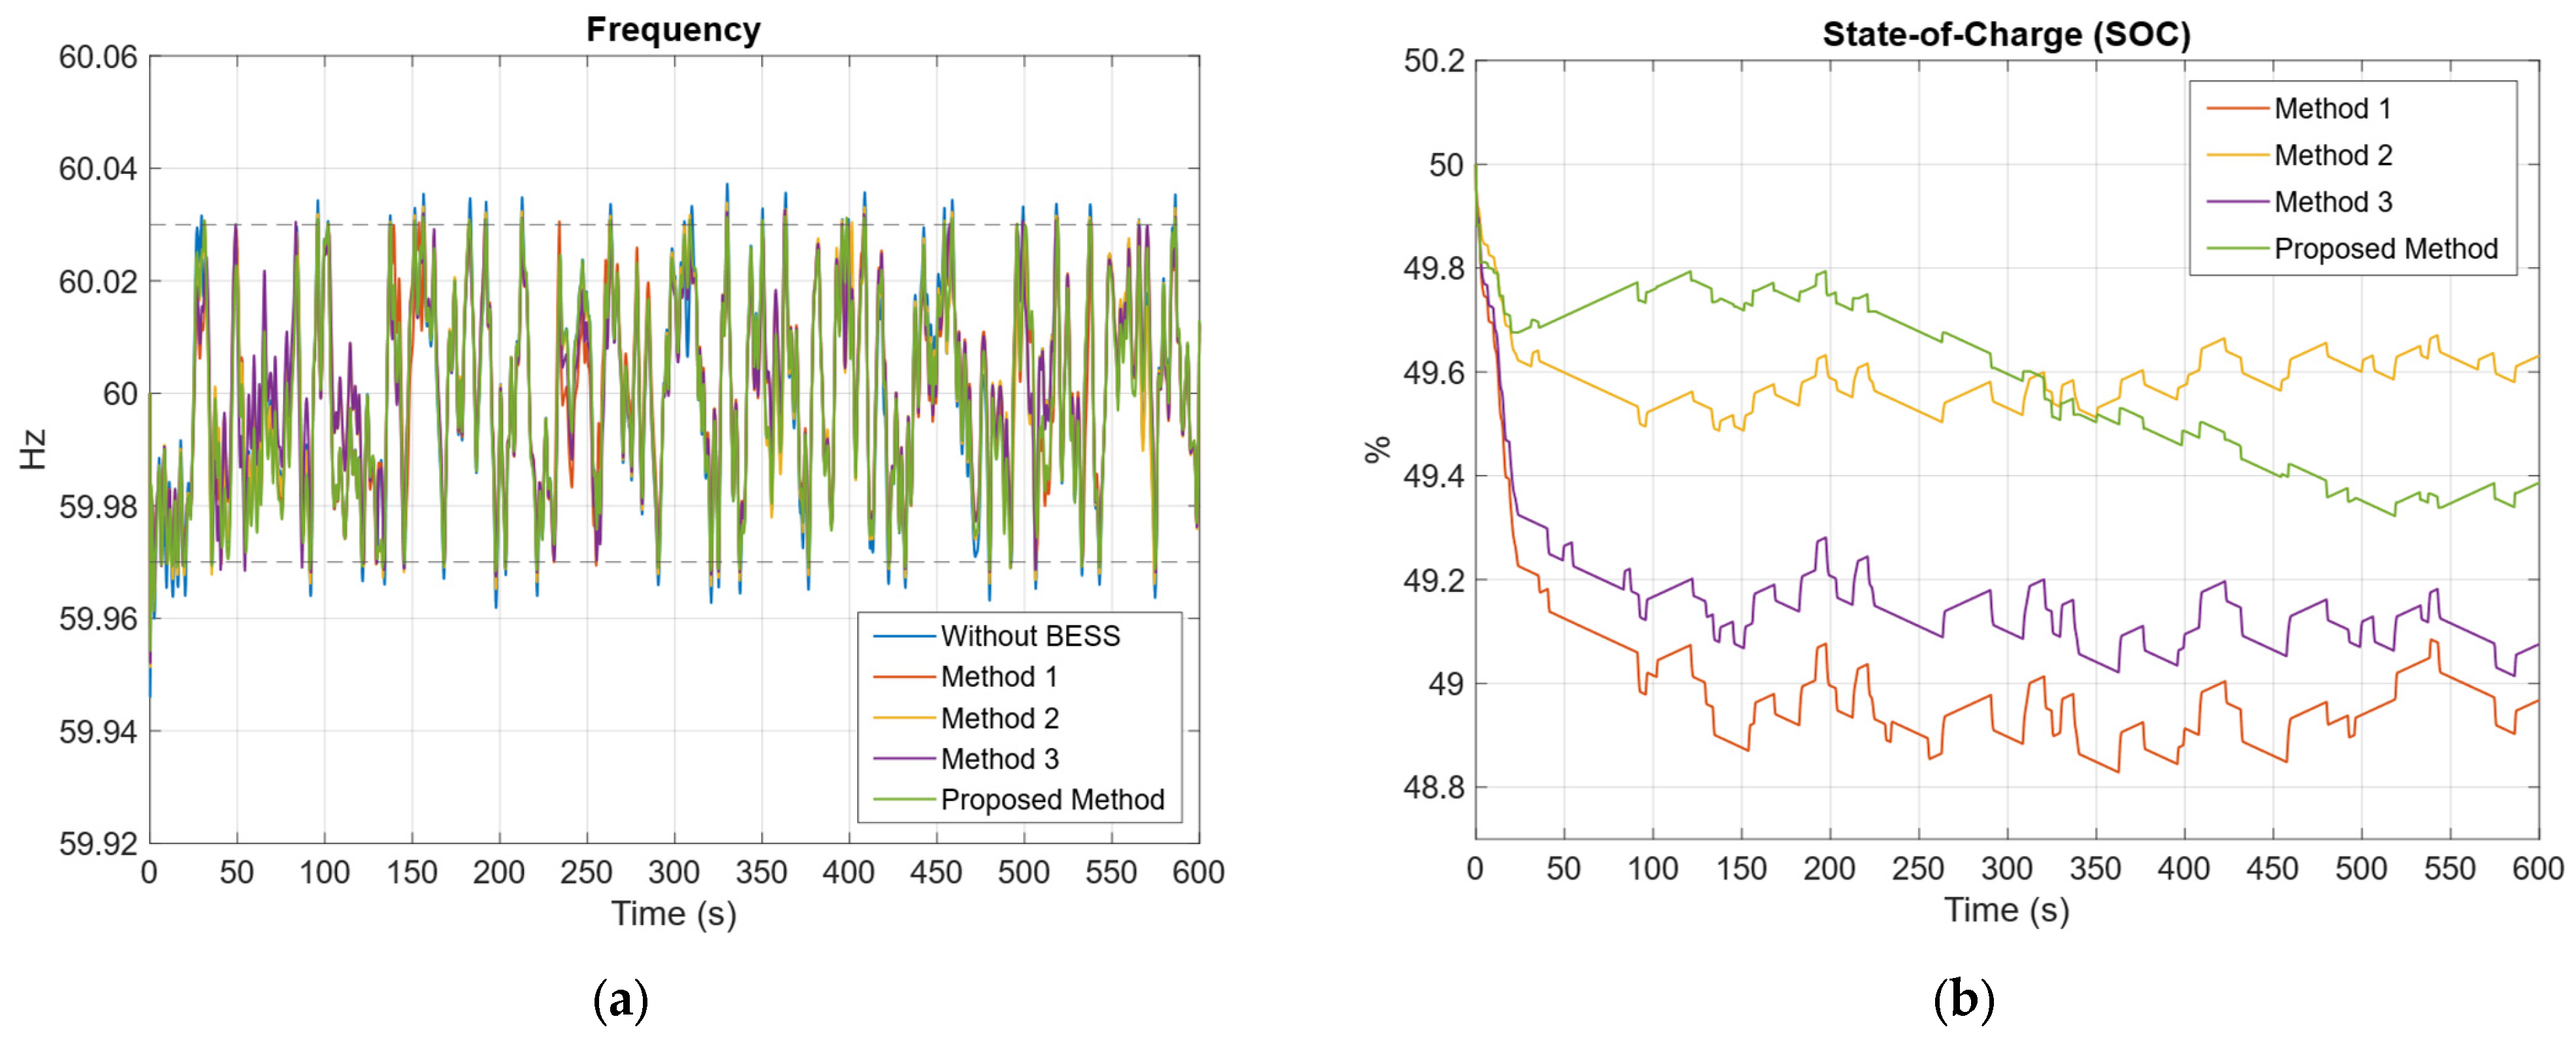
As shown in
Figure 18a, the frequency simulation results indicate that the scenario without the BESS exhibits the most significant deviations, with frequency values exceeding the dead band limits (60.03 Hz and 59.97 Hz). In contrast, the proposed method maintains a substantially higher percentage of frequency samples within the dead band, an essential factor for ensuring frequency stability. These results highlight the superior performance of the proposed method in mitigating the effects of continuous low-magnitude disturbances compared to the other methods evaluated. Given that such disturbances are among the most common in real-world power system operations, their simulation and evaluation using various adaptive droop control strategies are of critical importance.
Figure 18b shows the BESS SOC curves for the various droop control methods. The proposed method ranks second in terms of SOC stability. In contrast, Method 3 and Method 1, respectively, exhibit the least favorable SOC performance. The best results are achieved by Method 2, which adopts the most conservative approach to maintaining the SOC near its optimal value. These graphical findings are supported by the SOC stability indicators summarized in
Table 12.
It is important to emphasize that superior state of charge (SOC) stability refers to maintaining the SOC value as close as possible to the 50% reference level. This target is critical for ensuring sufficient energy capacity to support the PFR, allowing the system to either inject or absorb power during over-frequency or under-frequency events. As shown in
Table 15, SOC variations remain within a narrow range of 0% to 1.5%. These minor deviations are primarily caused by small load fluctuations, which vary depending on the type of disturbance applied.
Table 15 summarizes the evaluation indices for each droop control method in terms of frequency response and SOC performance. The proposed method achieves the best result for the
indicator, with a value of −0.045754 Hz. For the
, indicator, Method 3 performs best, followed by Method 1, while the proposed method ranks second to last. In terms of the
indicator, Method 2 proves to be the most effective in maintaining SOC stability, although it is the least effective in terms of frequency regulation. The most adverse indicators emerge when the BESS is not utilized in the operation of the photovoltaic power plant. Consequently, even a small difference of 0.0063 Hz in the indicator between Method 2 and “Without BESS” operation leads to significant effects on the power system. This highlights the BESS’s capacity for rapid action to dampen frequency oscillations, effectively increasing system inertia and contributing to a more robust system.
8.2.3. Case Study 3: Combined Large-Magnitude Step Disturbance and Continuous Low-Magnitude, Long-Duration Disturbance
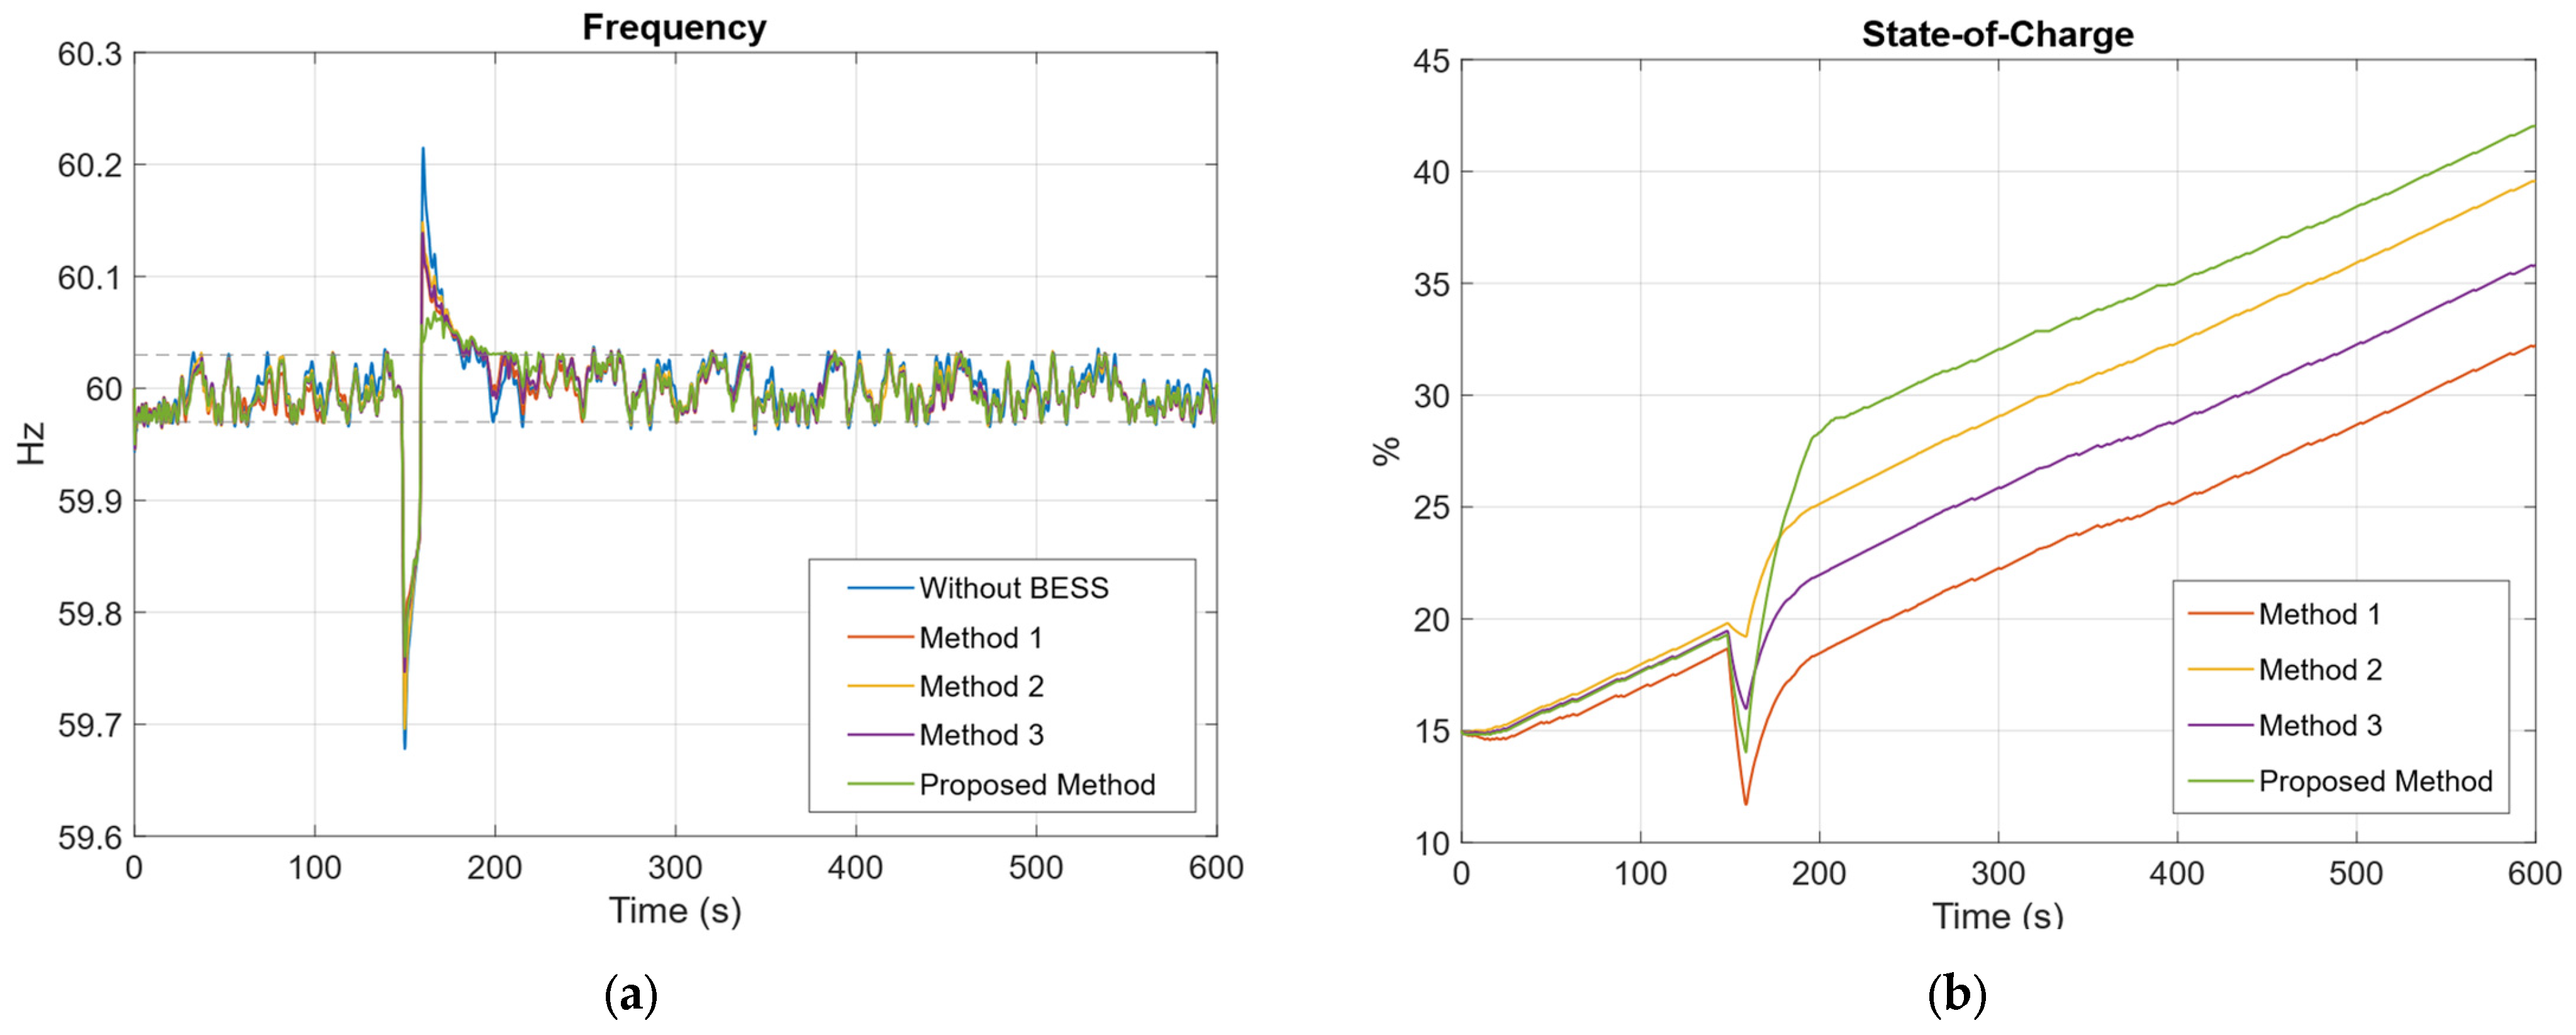
Figure 19 presents a load profile that combines two types of disturbances: a continuous, low-magnitude, long-duration disturbance (ranging from −3 to 3 MW) and a superimposed step disturbance of 60 MW. The step disturbance is applied at the 150 s mark and lasts for 10 s. After this event, the system returns to the continuous low-magnitude disturbance profile for the remainder of the simulation.
Figure 20a shows that the proposed method delivers the most effective damping of frequency variations, remaining closest to the dead band limits in most cases when compared to the other methods.
Figure 20b presents the BESS state of charge (SOC) curves for the various control methods, offering a comparative illustration of their SOC stability. The proposed method exhibits the most significant SOC drop during the 60 MW load event; however, it demonstrates a greater capacity to deliver energy during extreme conditions compared to Methods 1 and 3. Method 2, by contrast, stands out for its superior performance in maintaining SOC stability, highlighting its more conservative energy management strategy.
Table 16 presents the evaluation results of the frequency and SOC indices based on the profile shown in
Figure 20. The outcomes are compared, with the best results for each indicator highlighted in bold. The proposed method demonstrates superior performance in terms of both
and
, achieving values of –0.23235 Hz and 0.029522 Hz, respectively. However, this method exhibits reduced SOC stability, as indicated by the
value, which deviates by 2.5221% above the reference over the 10 min simulation period. Conversely, Method 2 maintains the SOC reference value more effectively, though it performs the worst in terms of frequency-related indicators, outperforming only the scenario where the PV power plant operates without BESS participation.
8.3. Performance Comparison Under Critical SOC Conditions
The same case studies as in the previous section are evaluated, with the exception that the simulations now begin with an initial SOC value of 15%.
8.3.1. Case Study 1: Large Step-Type Disturbance
Figure 21a shows that all frequency control methods improve frequency stability compared to the simulation scenario without energy storage. The proposed method is capable of maintaining a higher frequency nadir than the other methods, with the exception of Method 1.
Figure 21b shows the SOC curves for all methods, each starting from an initial SOC of 15%. Method 1 does not incorporate a droop control coefficient that depends on the battery SOC; as a result, the SOC drops below 5% and continues decreasing until full discharge. Methods 2 and 3 adjust the droop control coefficient to reduce energy discharge and prevent the SOC from reaching critical levels, resulting in a less steep decline. In the case of the proposed method, the SOC decreases to 5%, which is the lower limit established for this method, thereby avoiding full discharge of the BESS.
Table 17 shows that the proposed method yields the lowest values for both
and
, while
is the second lowest, following Method 1. Although Method 1 achieves the smallest
value, the proposed method is able to mitigate frequency deterioration more rapidly. However, Method 1 lacks control over SOC limit values, which poses a significant operational drawback. With respect to the
indicator, the proposed method exhibits the worst performance, while the best result corresponds to the scenario without energy storage. Finally, the proposed method achieves the second-lowest
value, after Method 1, which is consistent with the observed
values.
8.3.2. Case Study 2: Low-Magnitude, Long-Duration Continuous Disturbance
As shown in
Figure 22a, all frequency control methods have a greater positive impact on frequency stability compared to the simulation scenario without energy storage. The proposed method maintains the frequency within, or very close to, the dead band limits. Additionally, the most significant frequency deviations are observed in the case without BESS participation.
Figure 22b shows the SOC profiles, all exhibiting an increasing trend. This behavior is attributed to the fact that the small disturbances seldom exceed the dead band threshold, enabling the SOC to recover toward the nominal value of 50%. Under these conditions, all methods facilitate favorable BESS operation. The proposed method yields the second-weakest SOC recovery performance, outperforming only Method 1, while Method 2 proves to be the most effective in restoring SOC.
Table 18 shows that the Proposed Method achieves the lowest
value, indicating superior performance in halting the frequency drop rapidly compared to the other methods. However, it exhibits the highest
value, which can be attributed to its fuzzy control design optimized for handling large frequency deviations. Nonetheless, its
value is only exceeded by that of Method 1.
8.3.3. Case Study 3: High-Magnitude Disturbance Combined with a Low-Magnitude, Long Duration Continuous Disturbance
As shown in
Figure 23a, all frequency control methods outperform the scenario without energy storage, resulting in improved frequency regulation. Among them, the proposed method is the most effective, minimizing deviations and maintaining the frequency within the dead band. In contrast, the “Without BESS” scenario exhibits the largest frequency deviations.
Figure 23b illustrates the SOC curve for all control methods, displaying a pattern of increase, decrease, and subsequent recovery. This behavior is attributed to the impact of the disturbance on the SOC profile. The proposed method turns out to be the most efficient in SOC management, achieving a recovery of over 40% following the disturbance, outperforming the other methods. Moreover, once the high-magnitude disturbance subsides, the proposed method captures the most energy, facilitating greater SOC recovery.
Table 19 shows that the proposed method outperforms the other approaches, exhibiting lower
and
values, which indicate superior performance in both frequency stability and state of charge management. In terms of
, the proposed method achieves the second-lowest value, closely trailing Method 1, reaffirming its effectiveness in arresting frequency decay. The performance of the proposed method is closely tied to the SOC; under optimal conditions, its results could be even more favorable, as demonstrated in the previous section for this type of disturbance.
8.4. Sensitivity Analysis of the Membership Functions in the Proposed Fuzzy Controller
For the sensitivity analysis, the simulation parameters from Scenario A3 in
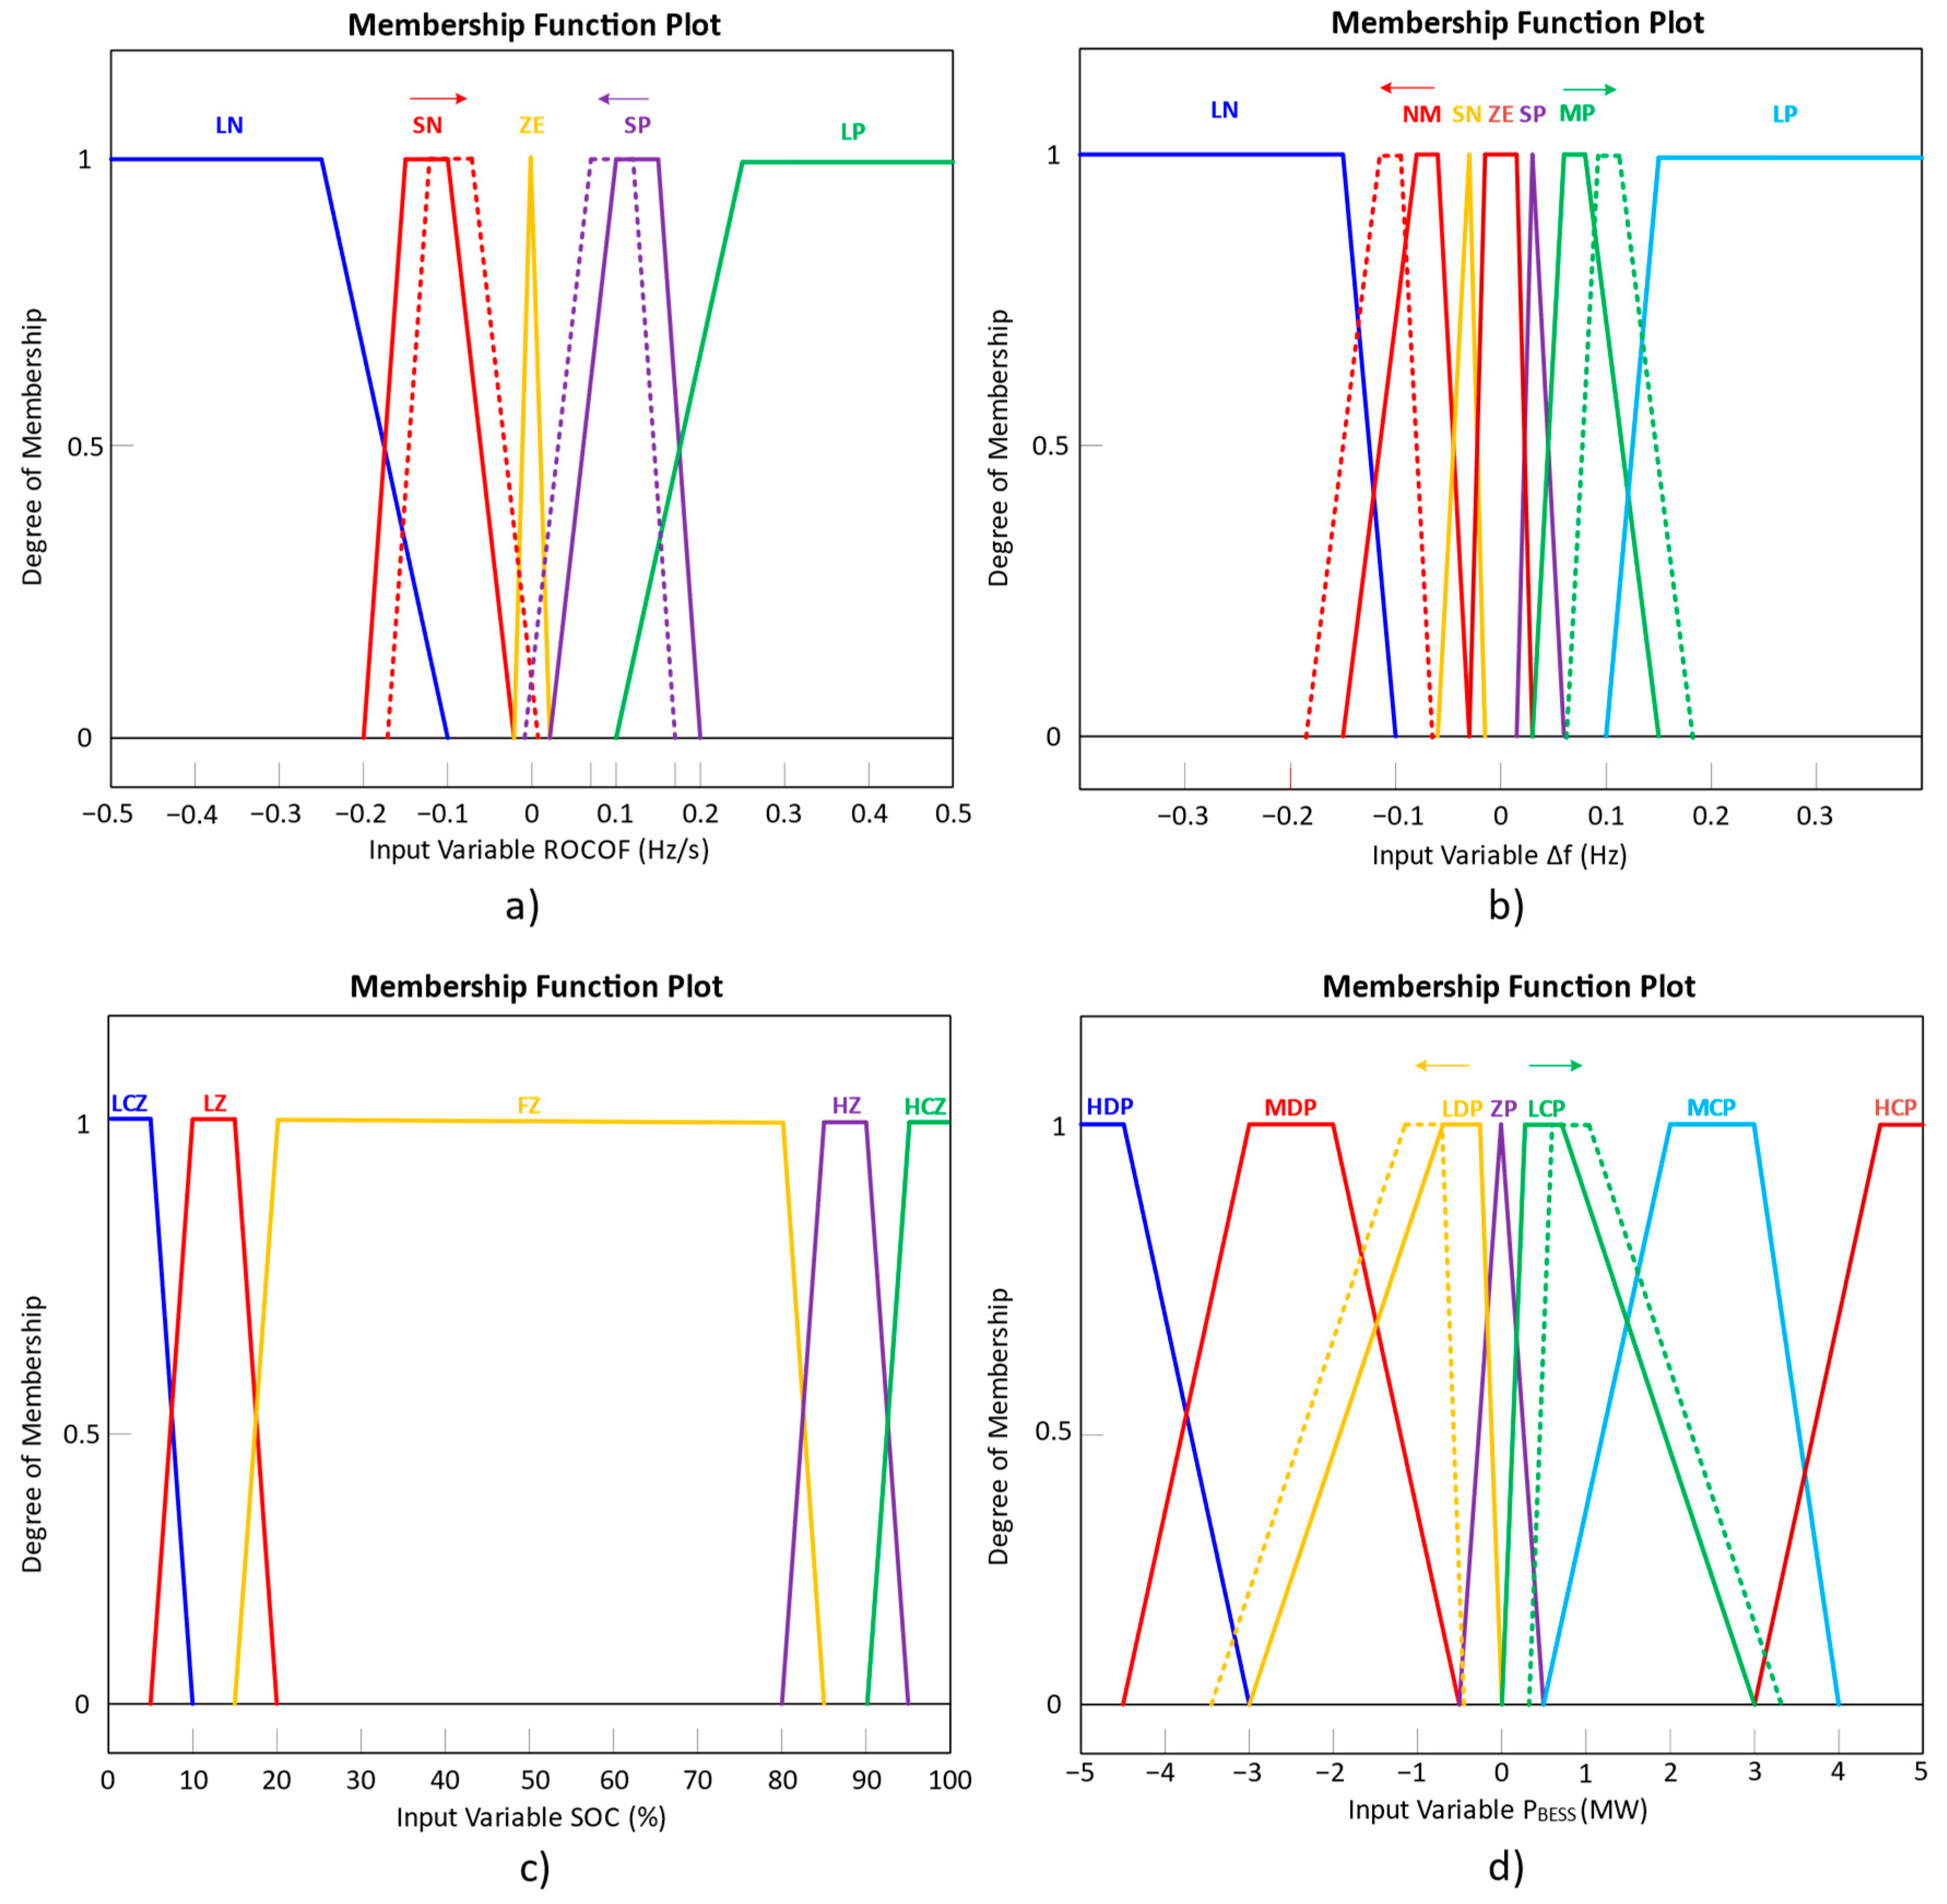
Table 11 were used. A slight shift was applied to the membership functions of frequency deviation (Δ
f), ROCOF, and BESS power output
. These modifications, representing 20% of the maximum variation range for each variable, are illustrated in
Figure 24. The SOC membership functions remained unchanged from the original design.
Figure 25 presents and compares the simulation results for each modified membership function. As observed, no significant differences are evident, which aligns with the inherently robust nature of fuzzy control. By design, this type of controller is tolerant to variations in its internal parameters. The overlap of membership functions and the smooth transitions defined by fuzzy rules help prevent small shifts in inflection points from causing abrupt changes in the control surface. Consequently, the adaptive fuzzy logic controller exhibits a natural resilience to such variations without compromising system performance.
8.5. Evaluation of the Imprecision and Time Delay of the ROCOF Sensor for the Proposed Fuzzy Controller
An analysis was performed of the impact of measurement inaccuracy and signal delay from the ROCOF sensor. The study evaluated how band-limited white noise and different delay times affect the primary frequency regulation (PFR). Both cases were analyzed separately using Scenario A3 in
Table 11.
8.5.1. Inaccuracy of the Measurement of the ROCOF Variable
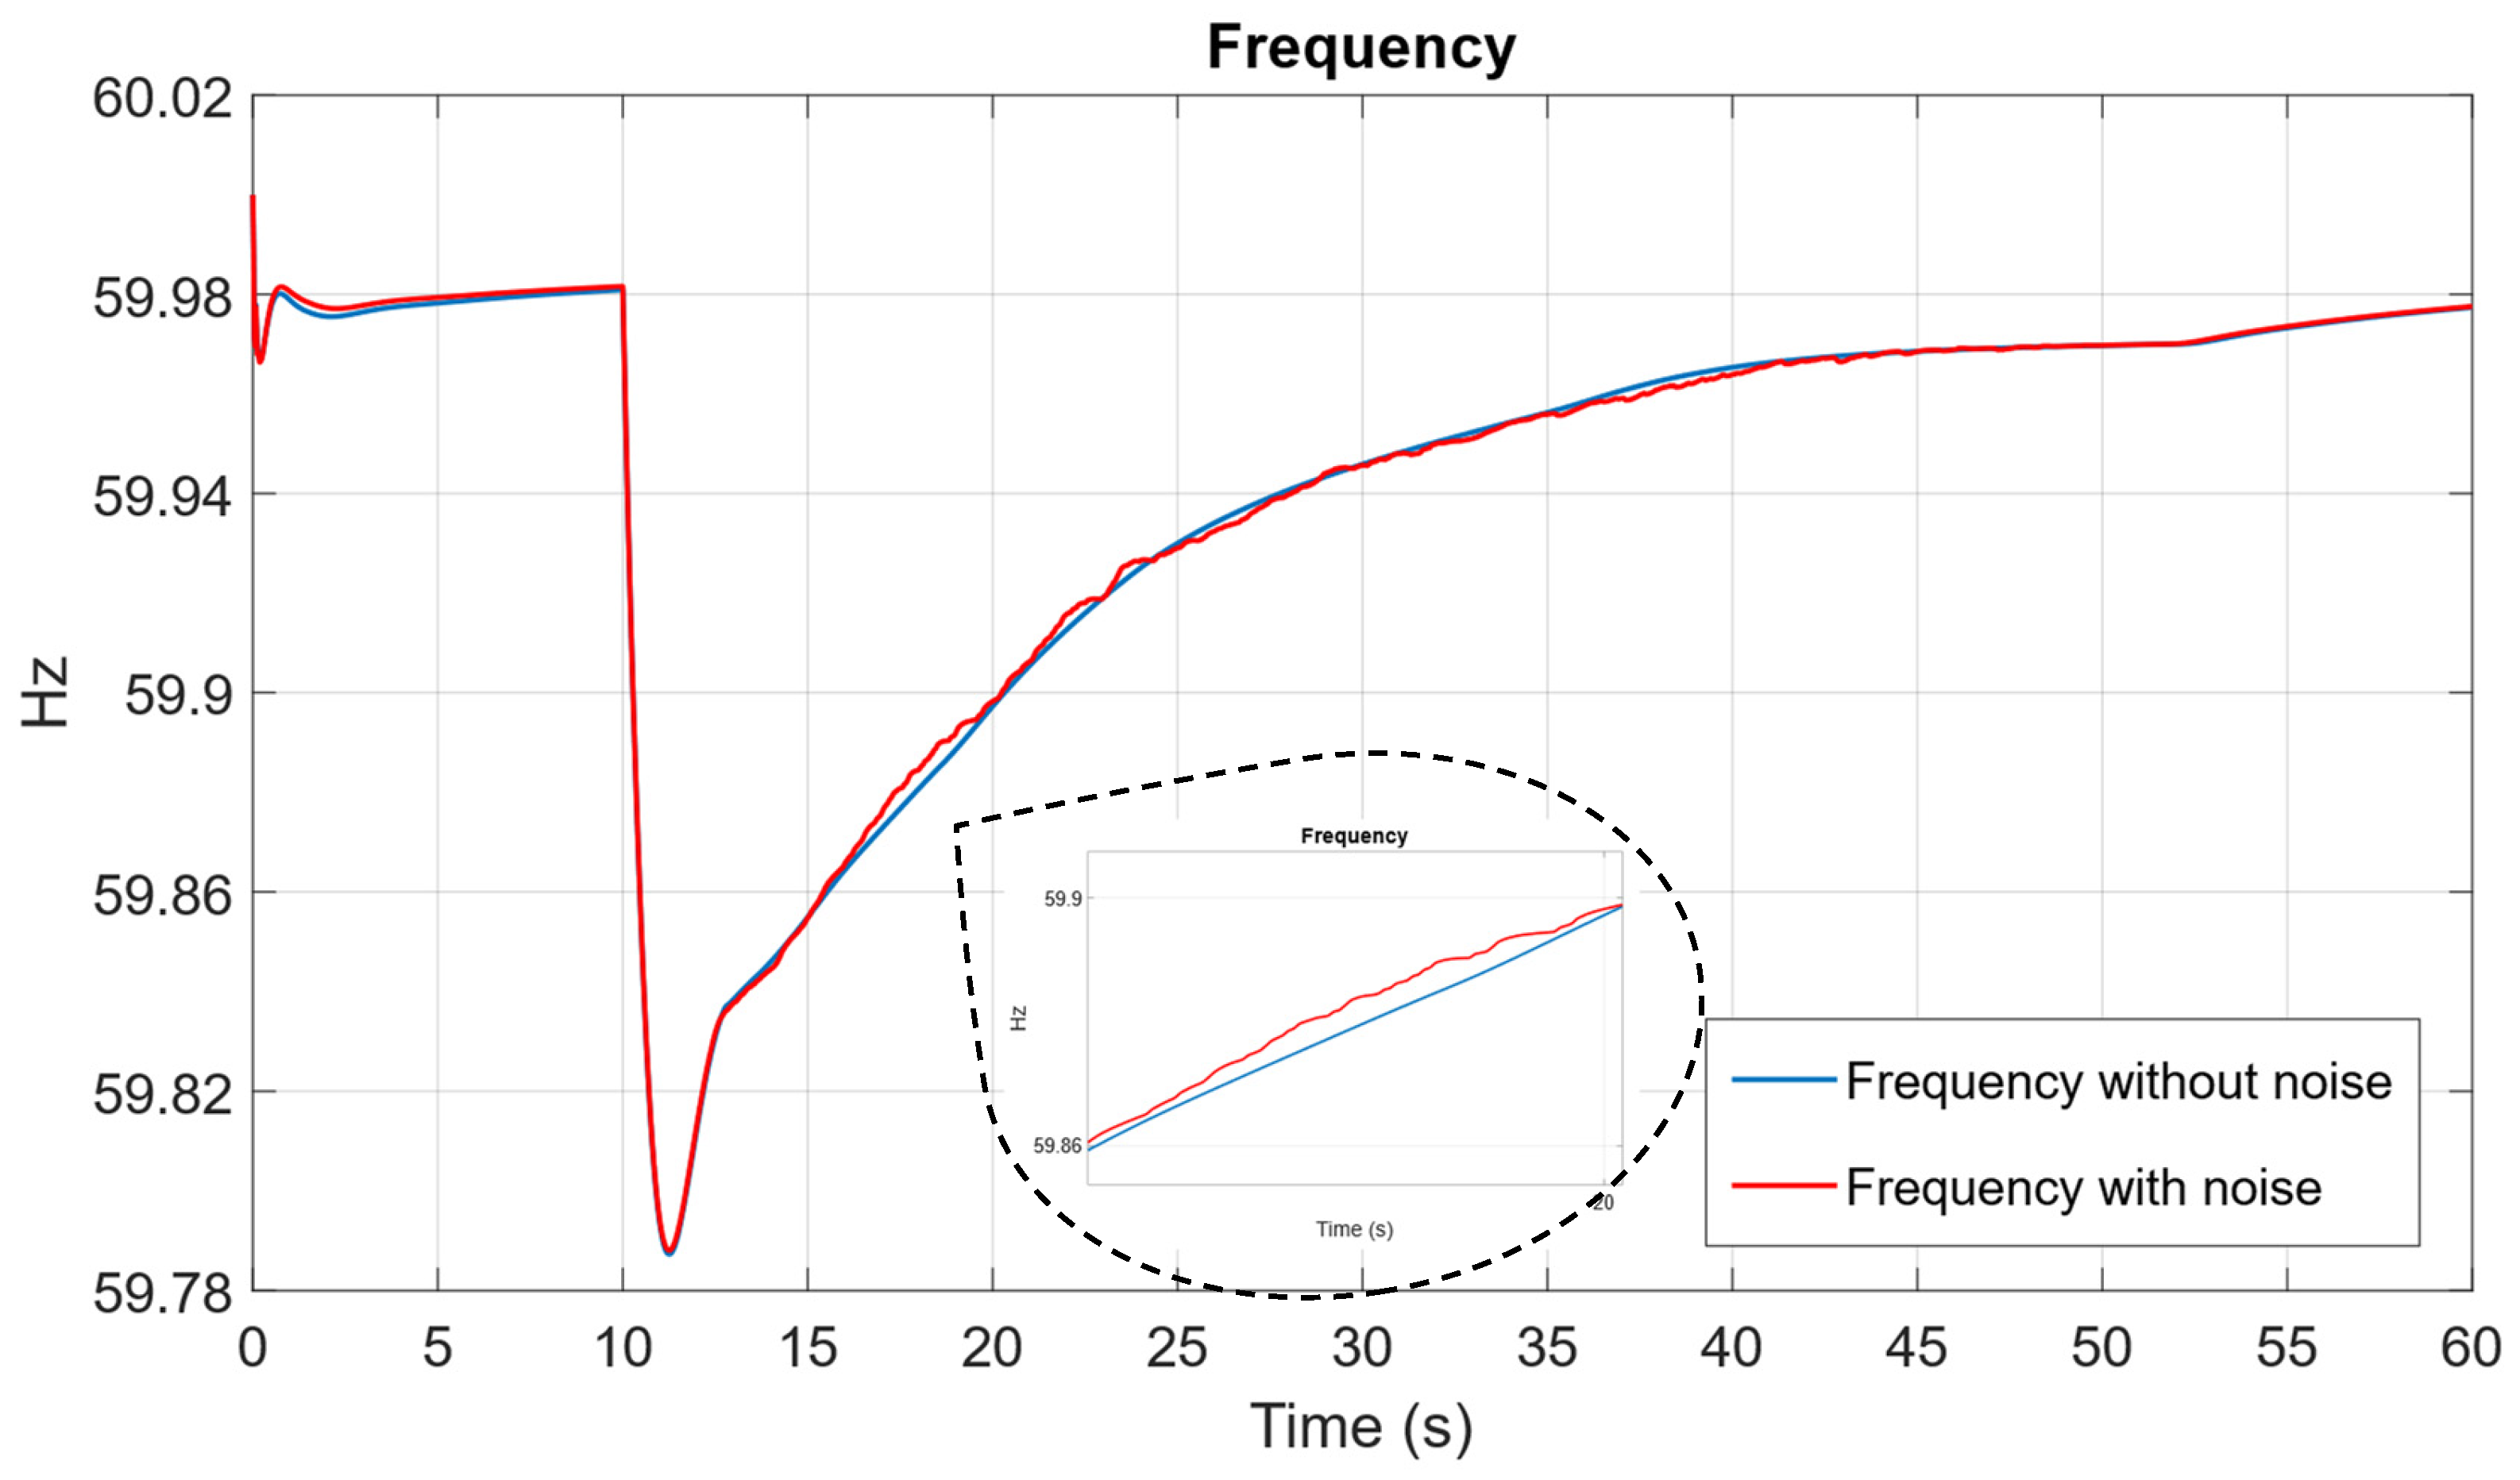
To simulate measurement inaccuracy, band-limited white noise was added to the ROCOF input variable.
Figure 26 depicts the noise signal, including its variation and maximum amplitude.
Figure 27 shows that white noise in the ROCOF variable does not significantly affect the dynamics of frequency deviation. Furthermore, despite the presence of noise and measurement inaccuracies in the ROCOF variable, the proposed fuzzy controller preserves satisfactory control performance across the entire operating range.
8.5.2. Delay in ROCOF Sensor Measurement
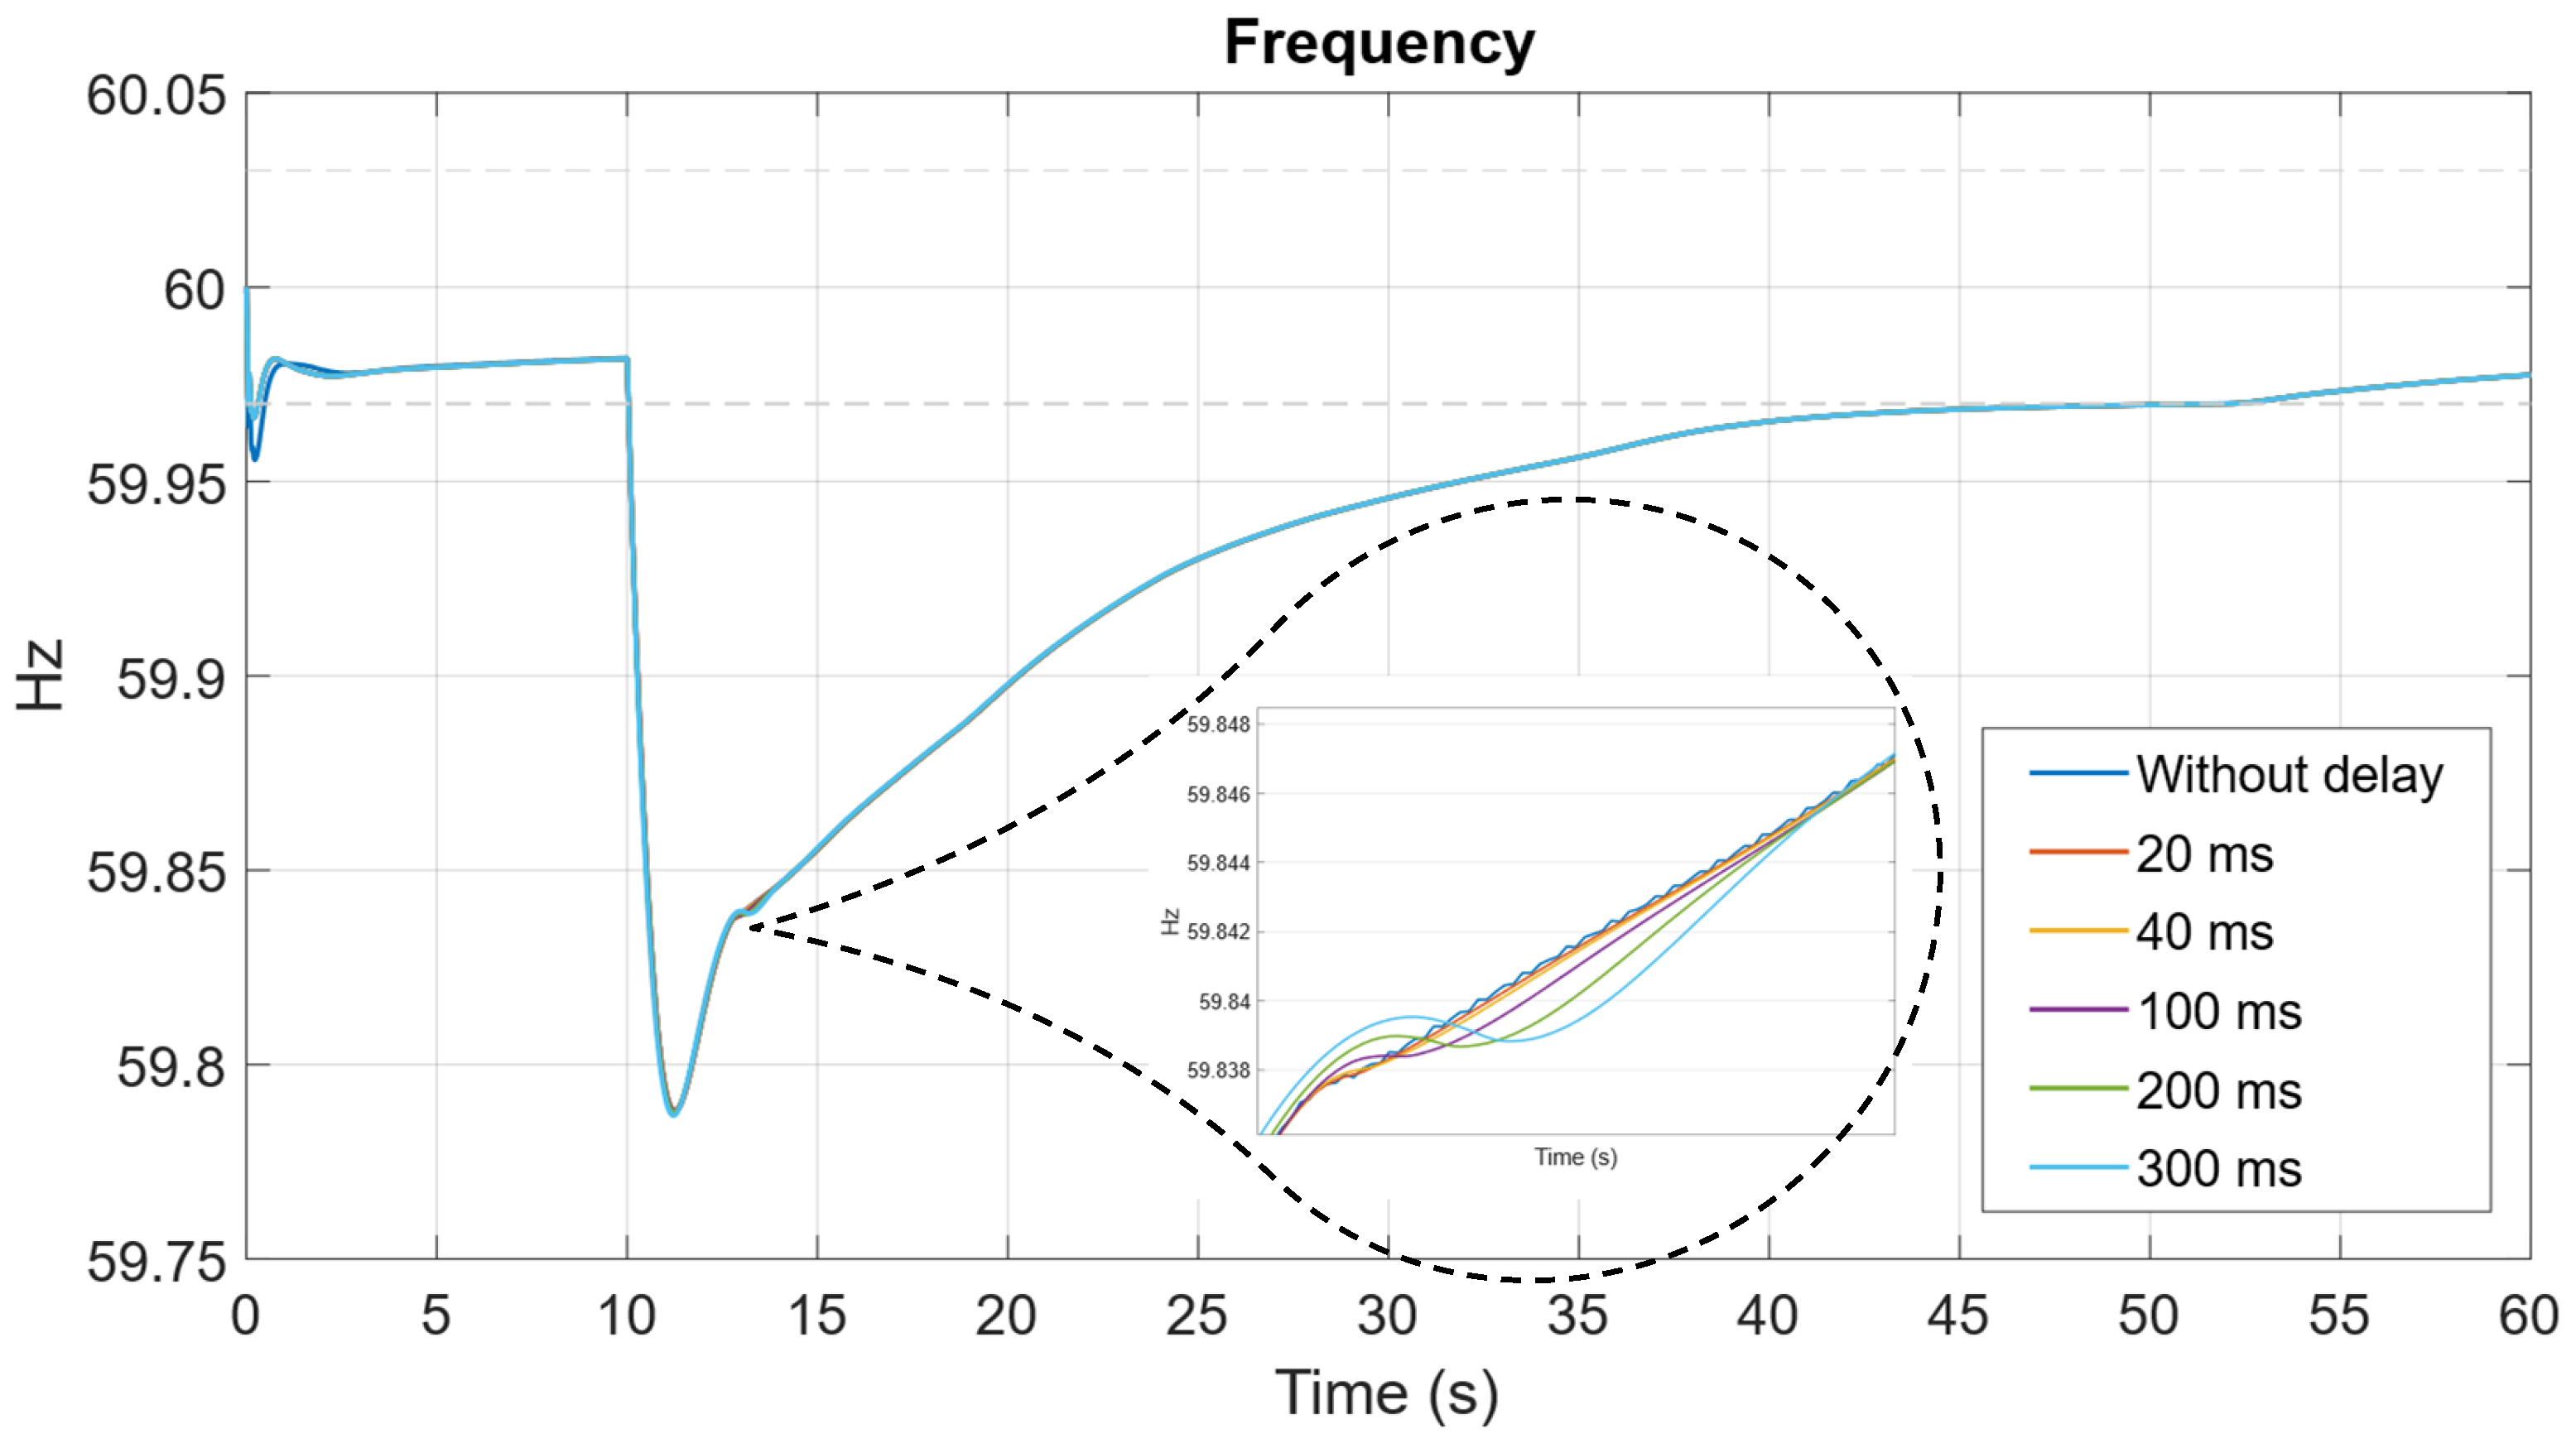
The simulation was conducted using three specific delay times in the measurement of the ROCOF variable: 20 ms, 40 ms, 100 ms, 200 ms, and 300 ms.
Figure 28 shows the variation of the ROCOF variable due to different delays in the sensor input.
Figure 28 illustrates the frequency variation dynamics resulting from the introduction of these delays. It can be seen that there is no appreciable error in the frequency dynamics due to a delay in the ROCOF sensor, even with a delay of 300 ms. Likewise,
Figure 29 illustrates that delays of up to 300 ms exert no significant influence on the frequency deviation dynamics.
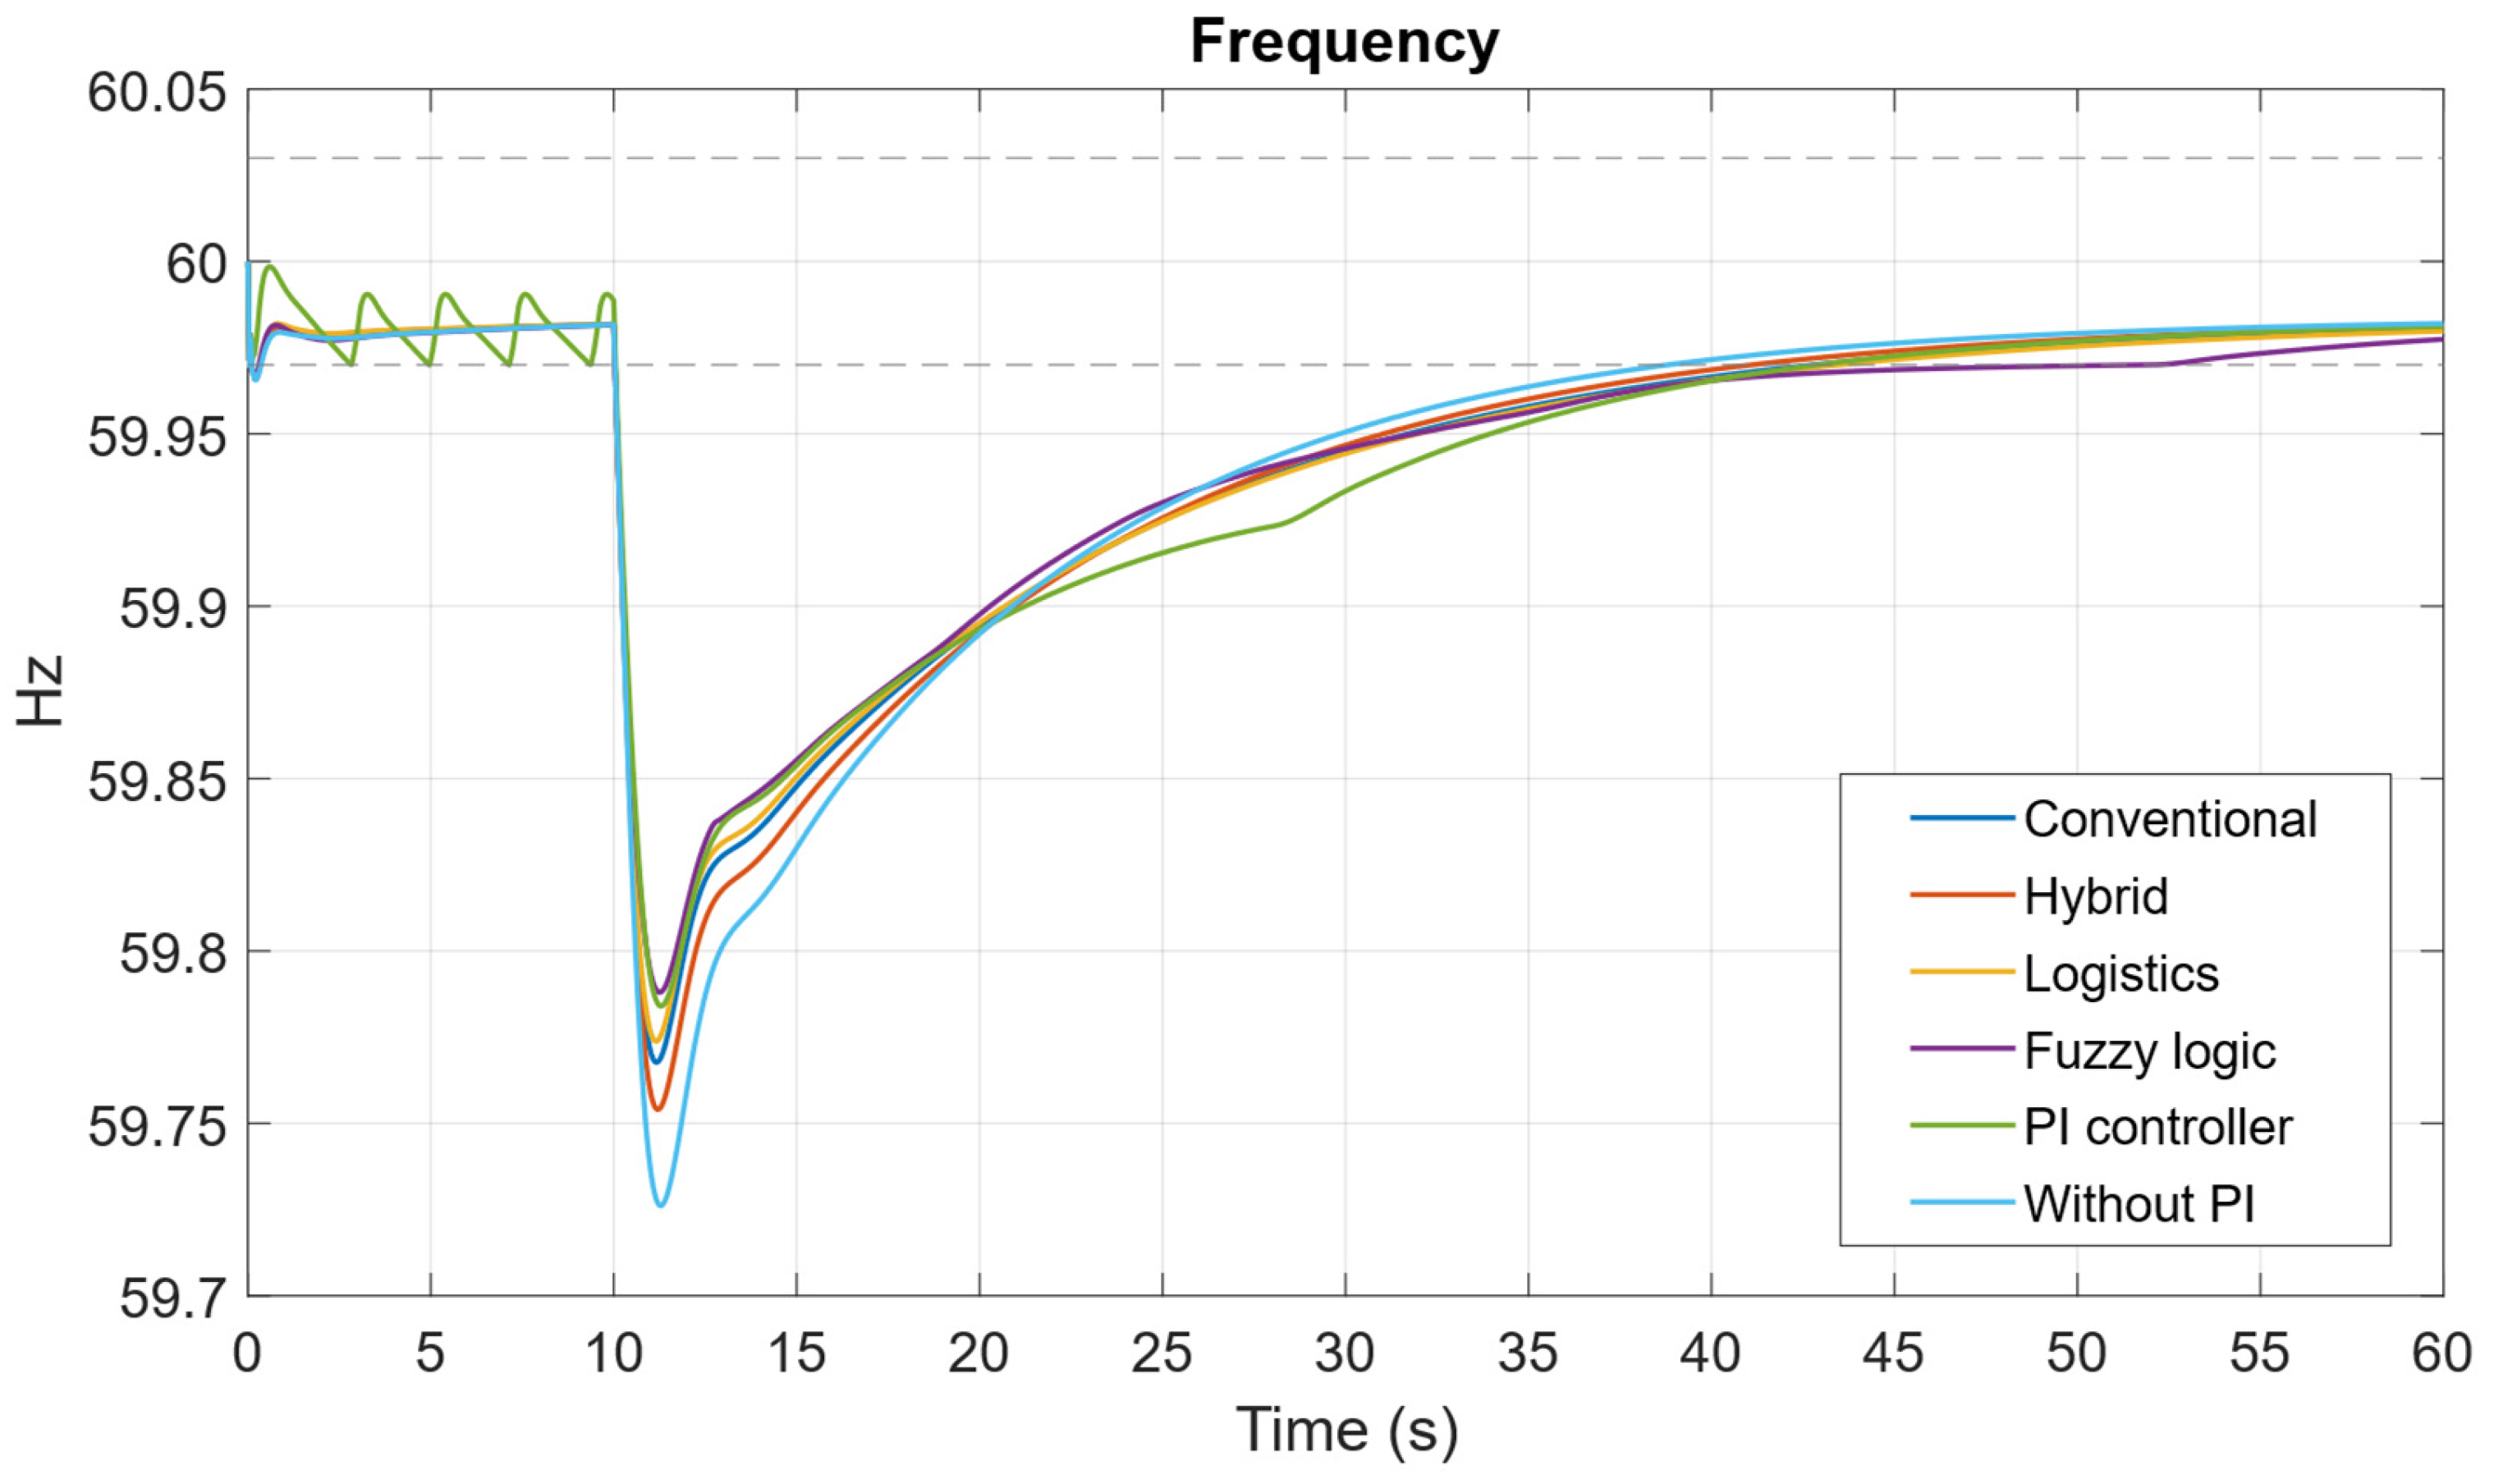
8.6. Comparative Analysis of Fuzzy Control and PI Controllers
The PI controller used for comparison with the proposed fuzzy controller is based on a model proposed in [
43], a novel concept for virtual inertia control design. This model employs a derivative technique to simultaneously emulate both virtual inertia and damping, thereby improving frequency response and preventing system instability and collapse. Its primary objective is to support synchronous generators in systems with low inertia and damping, particularly under high penetration of renewable energy sources. This concept can be implemented using a battery energy storage system (BESS), an inverter, and a virtual inertia control technique. The most important feature of this method is inertia emulation, achieved by using the rate of change of frequency (ROCOF) to adjust the BESS reference power during a contingency. This equivalent mechanical control model is known as VISMA.
For the synthesis of virtual inertia in the BESS system, a PI controller was employed. This allows the system to operate similarly to a synchronous generator by emulating both virtual inertia and virtual damping. The results of this implementation are clear: although PI control reduces frequency transients, its frequency nadir is higher than that achieved with fuzzy logic. This demonstrates that fuzzy logic exhibits more robust performance in this aspect, although it is still outperformed by the proposed controller, which delivers the best overall result. Furthermore, in terms of settling time, measured at 20 s, the fuzzy controller shows a slight advantage over PI control, indicating a faster stabilization of the system.
Figure 30 shows the comparison of the system’s frequency variation and response for six types of controllers, including the PI controller and the proposed fuzzy controller.
To quantify the comparative performance of the frequency control methods, the following key indicators have been defined:
Maximum frequency deviation (Δf)
Quasi-steady-state deviation (Δfs)
Root mean square frequency deviation (frms) (Equation (19))
Frequency nadir rate (Vm) (Equation (20))
Frequency recovery rate (Vr) (Equation (21))
These indicators enable a comprehensive assessment of the response time, overshoot, and robustness of each strategy, highlighting the advantages of fuzzy control in nonlinear dynamic scenarios.
Table 20 presents a comparison of the indicators, where the proposed fuzzy control stands out with a slight advantage over the virtual inertia control that employs a PI regulator to improve the calculation of the virtual inertia constant. All simulations were conducted for a load of 48 MW, a state of charge (SOC) of 50%, and an irradiance of 1000 W/m
2.
8.7. Evaluation of PFR Compliance According to PR-21 of the Economic System Operation Committee of Peru
In Peru, the operation of the power system is governed by specific technical procedures. PR-21, in particular, focuses on the Rotating Reserve for primary frequency regulation (PFR). This procedure includes a defined methodology for the “Evaluation of Compliance with the PFR” (Annex 3), which applies to the various generation units operating within the national interconnected electric system. The methodology covers the determination of the evaluation period, the modeling of the PFR power response, the assessment of power contribution for PFR, and, finally, the verification of compliance [
44].
The Peruvian System Economic Operation Committee (COES, for its acronym in Spanish) has published a standard plant model and computational code in MATLAB/Simulink for conducting this evaluation. The current version, dated December 2018 and aligned with Annex 3 of PR-21, is used to assess the droop control methods considered in this study.
A scenario combining a high-magnitude disturbance with a low-magnitude, long-duration continuous disturbance, previously illustrated in
Figure 19, was selected for the evaluation. The simulation runs for a total of 10 min, from which a continuous 5 min segment of power and frequency data is extracted from the generating units, in accordance with COES requirements.
These data are processed in MATLAB, and the output parameters are computed using the algorithms defined by the COES methodology.
Ultimately, the PFR compliance evaluation results are presented for each droop control method proposed in this study, as well as for the operation of a solar photovoltaic power plant without a BESS, which implies the absence of PFR contribution in the latter scenario. These results, based on the COES methodology and simulation outcomes, are summarized in
Table 21.
All the droop control methods presented (Method 1, Method 2, Method 3, and the proposed method) achieve a noncompliance level of zero. However, as discussed in
Section 7, each method presents its set of advantages and limitations.
It is crucial to highlight certain output parameters, such as statism (%E). The “Without BESS” control method records the highest value, reaching an extraordinary 9527.5%, which is far above the typical 5% expected for droop control. In contrast, the proposed method presents the lowest droop value, at just 1.04%. Regarding the dead band (DB), all methods provide acceptable estimates, remaining below the 30 mHz limit established by COES. The only exception is the “Without BESS” operation, which yields a value of 58.68 mHz, significantly exceeding the standard.
