Article

Optimal Placement of a Unified Power Quality Conditioner (UPQC) in Distribution Systems Using Exhaustive Search to Improve Voltage Profiles and Harmonic Distortion

by
Juan S. Espinosa Gutiérrez
*,†,‡ and
Alexander Aguila Téllez
*,†,‡
GIREI Research Group, Electrical Engineering Department, Universidad Politécnica Salesiana, Quito 170146, Ecuador
*
Authors to whom correspondence should be addressed.
Current address: Rumichaca Ñan Avenue & Morán Valverde Avenue, Quito 170146, Ecuador.
These authors contributed equally to this work.
Energies 2025, 18(17), 4499; https://doi.org/10.3390/en18174499
Submission received: 24 July 2025 / Revised: 14 August 2025 / Accepted: 22 August 2025 / Published: 24 August 2025
(This article belongs to the Special Issue Advances in Electrical Power System Quality)

Abstract

This paper presents an exhaustive search approach to determine the optimal placement of a Unified Power Quality Conditioner (UPQC) in a distribution system that integrates a distributed generation (DG) unit based on photovoltaic (PV) panels. The main objective is to enhance voltage profiles and reduce total harmonic distortion (THD) in the presence of nonlinear loads. A multi-objective optimization model is formulated, combining THD minimization and voltage deviation reduction through a weighted cost function. Two case studies are conducted using the IEEE 33-bus test system modeled in MATLAB Simulink, considering different scenarios: one with nonlinear loads and another with additional DG integration. The UPQC is tested at critical nodes to assess its impact on power quality indicators. Results show that placing the UPQC at node 14 yields the lowest cost function value in both cases, with THD reductions exceeding 90% at the installation node and notable improvements across the system. These findings confirm that brute-force optimization is a reliable and effective strategy for UPQC siting, especially in distribution networks subjected to nonlinear disturbances and renewable-based DG. The proposed methodology provides a practical framework for power quality enhancement and supports decision-making in modern smart grid environments.

1. Introduction

In recent years, electrical distribution systems have undergone a significant transformation driven primarily by the emergence of new technologies and the integration of microgrids composed of DG based on renewable energy sources [1,2]. Although utility companies have attempted to upgrade the distribution network infrastructure to keep pace with this technological shift, they have struggled to match the speed at which these systems are being integrated into the grid [2].
This transformation has highlighted a critical issue: the deterioration of power quality. This has become evident due to the disruption of electrical parameters such as THD and voltage variation, resulting from the increasing presence of nonlinear loads and power electronics-based microprocessors [2,3].
Moreover, the emergence of a new energy matrix centered on renewable-based distributed generation—such as photovoltaic systems—has fundamentally altered system dynamics and topology. If not designed in compliance with technical standards, these sources can inject intermittent currents, cause voltage fluctuations, and, in most cases, increase the network’s THD levels [3].
Given the critical role played by distribution systems in the energy supply chain, it is essential to mitigate the factors that compromise network performance and stability [2]. To address these challenges, several advanced devices have been developed within regulatory limits, including the Dynamic Voltage Restorer (DVR), Distribution Static Compensator (D-STATCOM), and Unified Power Quality Conditioner (UPQC) [4].
The UPQC has emerged as a promising solution for mitigating voltage sags and harmonic distortion, thus enhancing power quality for end-users. This device is specifically designed to protect sensitive loads connected at the point of common coupling with the grid [4,5,6].
A UPQC provides both voltage and current compensation; however, its performance largely depends on its placement within the system. In this context, optimization techniques such as exhaustive search can be employed to identify the most effective location, thereby maximizing the UPQC’s benefits for the electrical network [7,8].

1.1. Microgrid Operation Under Low and High DG Penetration

Modern distribution feeders increasingly operate as microgrids with renewable-based distributed generation (DG). At low penetration, DG mainly introduces mild variability and local reactive power requirements; voltage control can typically be handled by conventional equipment with limited reconfiguration. At high penetration, however, nontrivial effects appear: reverse power flows and voltage rise, feeder unbalance, interaction among converter controls, reduced short-circuit levels affecting protection coordination, and potential amplification of harmonic components due to switching converters and resonances [2,3,9,10,11,12]. These phenomena impact continuity and power quality, motivating combined actions that (i) enforce feeder-level voltage limits (e.g., Volt/VAR/Volt/Watt control), (ii) coordinate converter-level support functions, and (iii) deploy local power-quality conditioning to keep voltages and harmonic indices within statutory thresholds (IEEE 519/IEC 61000; national regulation ARCERNNR 002/20) [13,14]. Within this context, the present study addresses the placement of a UPQC as a complementary action to feeder voltage control, explicitly targeting harmonic mitigation and voltage profile improvement under representative PV-based DG operation.

1.2. Recent Control and Optimization Directions

Beyond siting, recent work explores advanced control and optimization to enhance performance under variable renewable penetration. For UPQC/D-STATCOM applications, synchronous-frame controllers with decoupled PI loops remain standard [15], while learning-aided or hybrid-optimized tuning has been investigated to improve DC-link regulation and harmonic suppression in the presence of converter interactions and nonlinear loads (see, e.g., surveys and applications in power-quality enhancement [9,10]). In parallel, scalable optimization and feedback schemes have been proposed for distribution networks under uncertainty, aiming at decentralized coordination with limited communications [11,12]. These lines are complementary to the present contribution: whereas such controllers determine how devices act in real time, the present work determines where to place the compensator so that network-wide voltage and harmonic objectives are met across operating scenarios. The proposed siting methodology can be integrated with advanced controllers in future studies to address higher DG penetration and larger feeders. This paper aims to address power quality deficiencies in a distribution system affected by nonlinear loads. By optimally placing a UPQC using a brute-force search method, the study seeks to significantly improve voltage profiles and reduce THD. The performance of the UPQC is evaluated under the presence of nonlinear loads and distributed generation.
This paper is organized as follows: Section 2 presents background information on the UPQC, power quality issues in electrical systems, and related concepts. Section 3 describes the methodology used to solve the optimization problem, including the exhaustive search strategy and the test system. Section 4 outlines the case studies. Section 5 provides a detailed analysis of the results. Finally, Section 7 summarizes the conclusions.

2. Theoretical Framework

The theoretical framework outlines the conceptual and technical foundations necessary to understand the method proposed in this study, which aims to improve voltage profiles and total harmonic distortion.

2.1. Unified Power Quality Conditioner (UPQC)

The need to control electrical variables that affect power quality in distribution networks strongly justifies the implementation of devices capable of mitigating such disturbances [16]. In this context, the UPQC emerges as a more effective alternative than conventional methods for improving both voltage profiles and harmonic components in distribution systems.
The UPQC consists of a series active power filter (APF) and a shunt APF that share a common DC-link capacitor, as shown in Figure 1 [17].
The series APF—also known as the series converter of the UPQC—is responsible for compensating disturbances on the supply side, such as voltage harmonic distortion (THDv), voltage sags, and unbalances [17].
Meanwhile, the shunt APF—or shunt converter—handles disturbances related to the user side, such as current harmonics and low power factors [17].
Considering its components and structural configuration, the UPQC can be seen as a combination of a dynamic voltage restorer (DVR) and a distribution static compensator (DSTATCOM) [15].

2.1.1. Control Strategies

One of the distinctive features of the UPQC is its ability to operate in different modes depending on the type of disturbance to be mitigated. Typically, the UPQC uses both APFs (shunt and series) simultaneously. In this configuration, the shunt inverter supplies the active power demanded by the series inverter, keeping the DC link charged, while both converters compensate for reactive currents and harmonics [15].
Additionally, the literature defines specific voltage control strategies, such as:
  • UPQC−P
  • UPQC−Q
The UPQC-P configuration focuses on active power control. In this mode, the series APF delivers more active power to maintain voltage levels. The DVR is responsible for keeping the load voltage at its nominal value and ensuring that the injected voltage is either in phase or out of phase with the supply voltage, depending on the control objective [15].
In contrast, the UPQC-Q configuration is based on reactive power control. In this strategy, the DVR injects a voltage in quadrature with the supply current, while the DSTATCOM compensates the current to regulate the reactive power demand. This coordination is essential for maintaining DC link voltage stability [15].

2.1.2. Related Devices

To better understand the capabilities of the UPQC, it is useful to examine the characteristics of other power quality improvement devices. Among the most notable are the DVR, SVC, and DSTATCOM.
The DVR is a series-connected device that primarily addresses voltage sags and swells. It is commonly used to protect sensitive loads in distribution systems [18].
The SVC is a type of reactive power compensator that, unlike the DVR, is connected in parallel with the load. It uses thyristors to control capacitor banks, thereby regulating voltage levels and correcting the power factor [18].
The DSTATCOM is an advanced version of the STATCOM designed specifically for distribution networks. This device regulates voltage levels and compensates reactive power, and in its DSTATCOM version, it can also manage current unbalances and mitigate harmonic distortion [18]. However, despite its capabilities to independently correct voltage and current disturbances, the DSTATCOM cannot perform both functions simultaneously due to its structural limitations.
Table 1 provides a comparative overview of the functionalities offered by these power quality enhancement devices.

2.2. Power Quality in Electrical Systems

In recent years, power quality issues have increased significantly due to the integration of DG and power electronics. These challenges are further exacerbated by additional adverse factors such as capacitor bank switching and unexpected faults within the network, all of which severely affect system efficiency and reliability [9,10]. Addressing these problems has become a common task for utility companies, since mitigating or eliminating such conditions provides numerous benefits for both distributors and end-users. These include improved system efficiency, reduced maintenance costs, and fewer supply interruptions [9]. Based on these considerations, power quality can be understood as a set of electrical characteristics that the power system must maintain within defined operational standards [9].

2.2.1. Common Power Quality Problems

The stability of distribution networks has been considerably affected by the sudden integration of nonlinear loads and DG sources, often without proper conditioning of the system to accommodate such technologies. These factors have contributed to a more frequent occurrence of power quality disturbances in recent years [15].
Additionally, the increasing use of sensitive equipment in sectors such as telecommunications, healthcare, and industrial processes places greater demands on utilities to ensure high-quality power delivery. Even minor disturbances can lead to data loss, operational failures, or damage to expensive devices [9,10,15].
In this context, voltage variations and THD are critical indicators due to their direct impact on the stability and reliability of electrical supply. Understanding these disturbances is essential for the design and development of equipment that can effectively mitigate them, ensuring proper system operation.

2.2.2. Voltage Disturbances

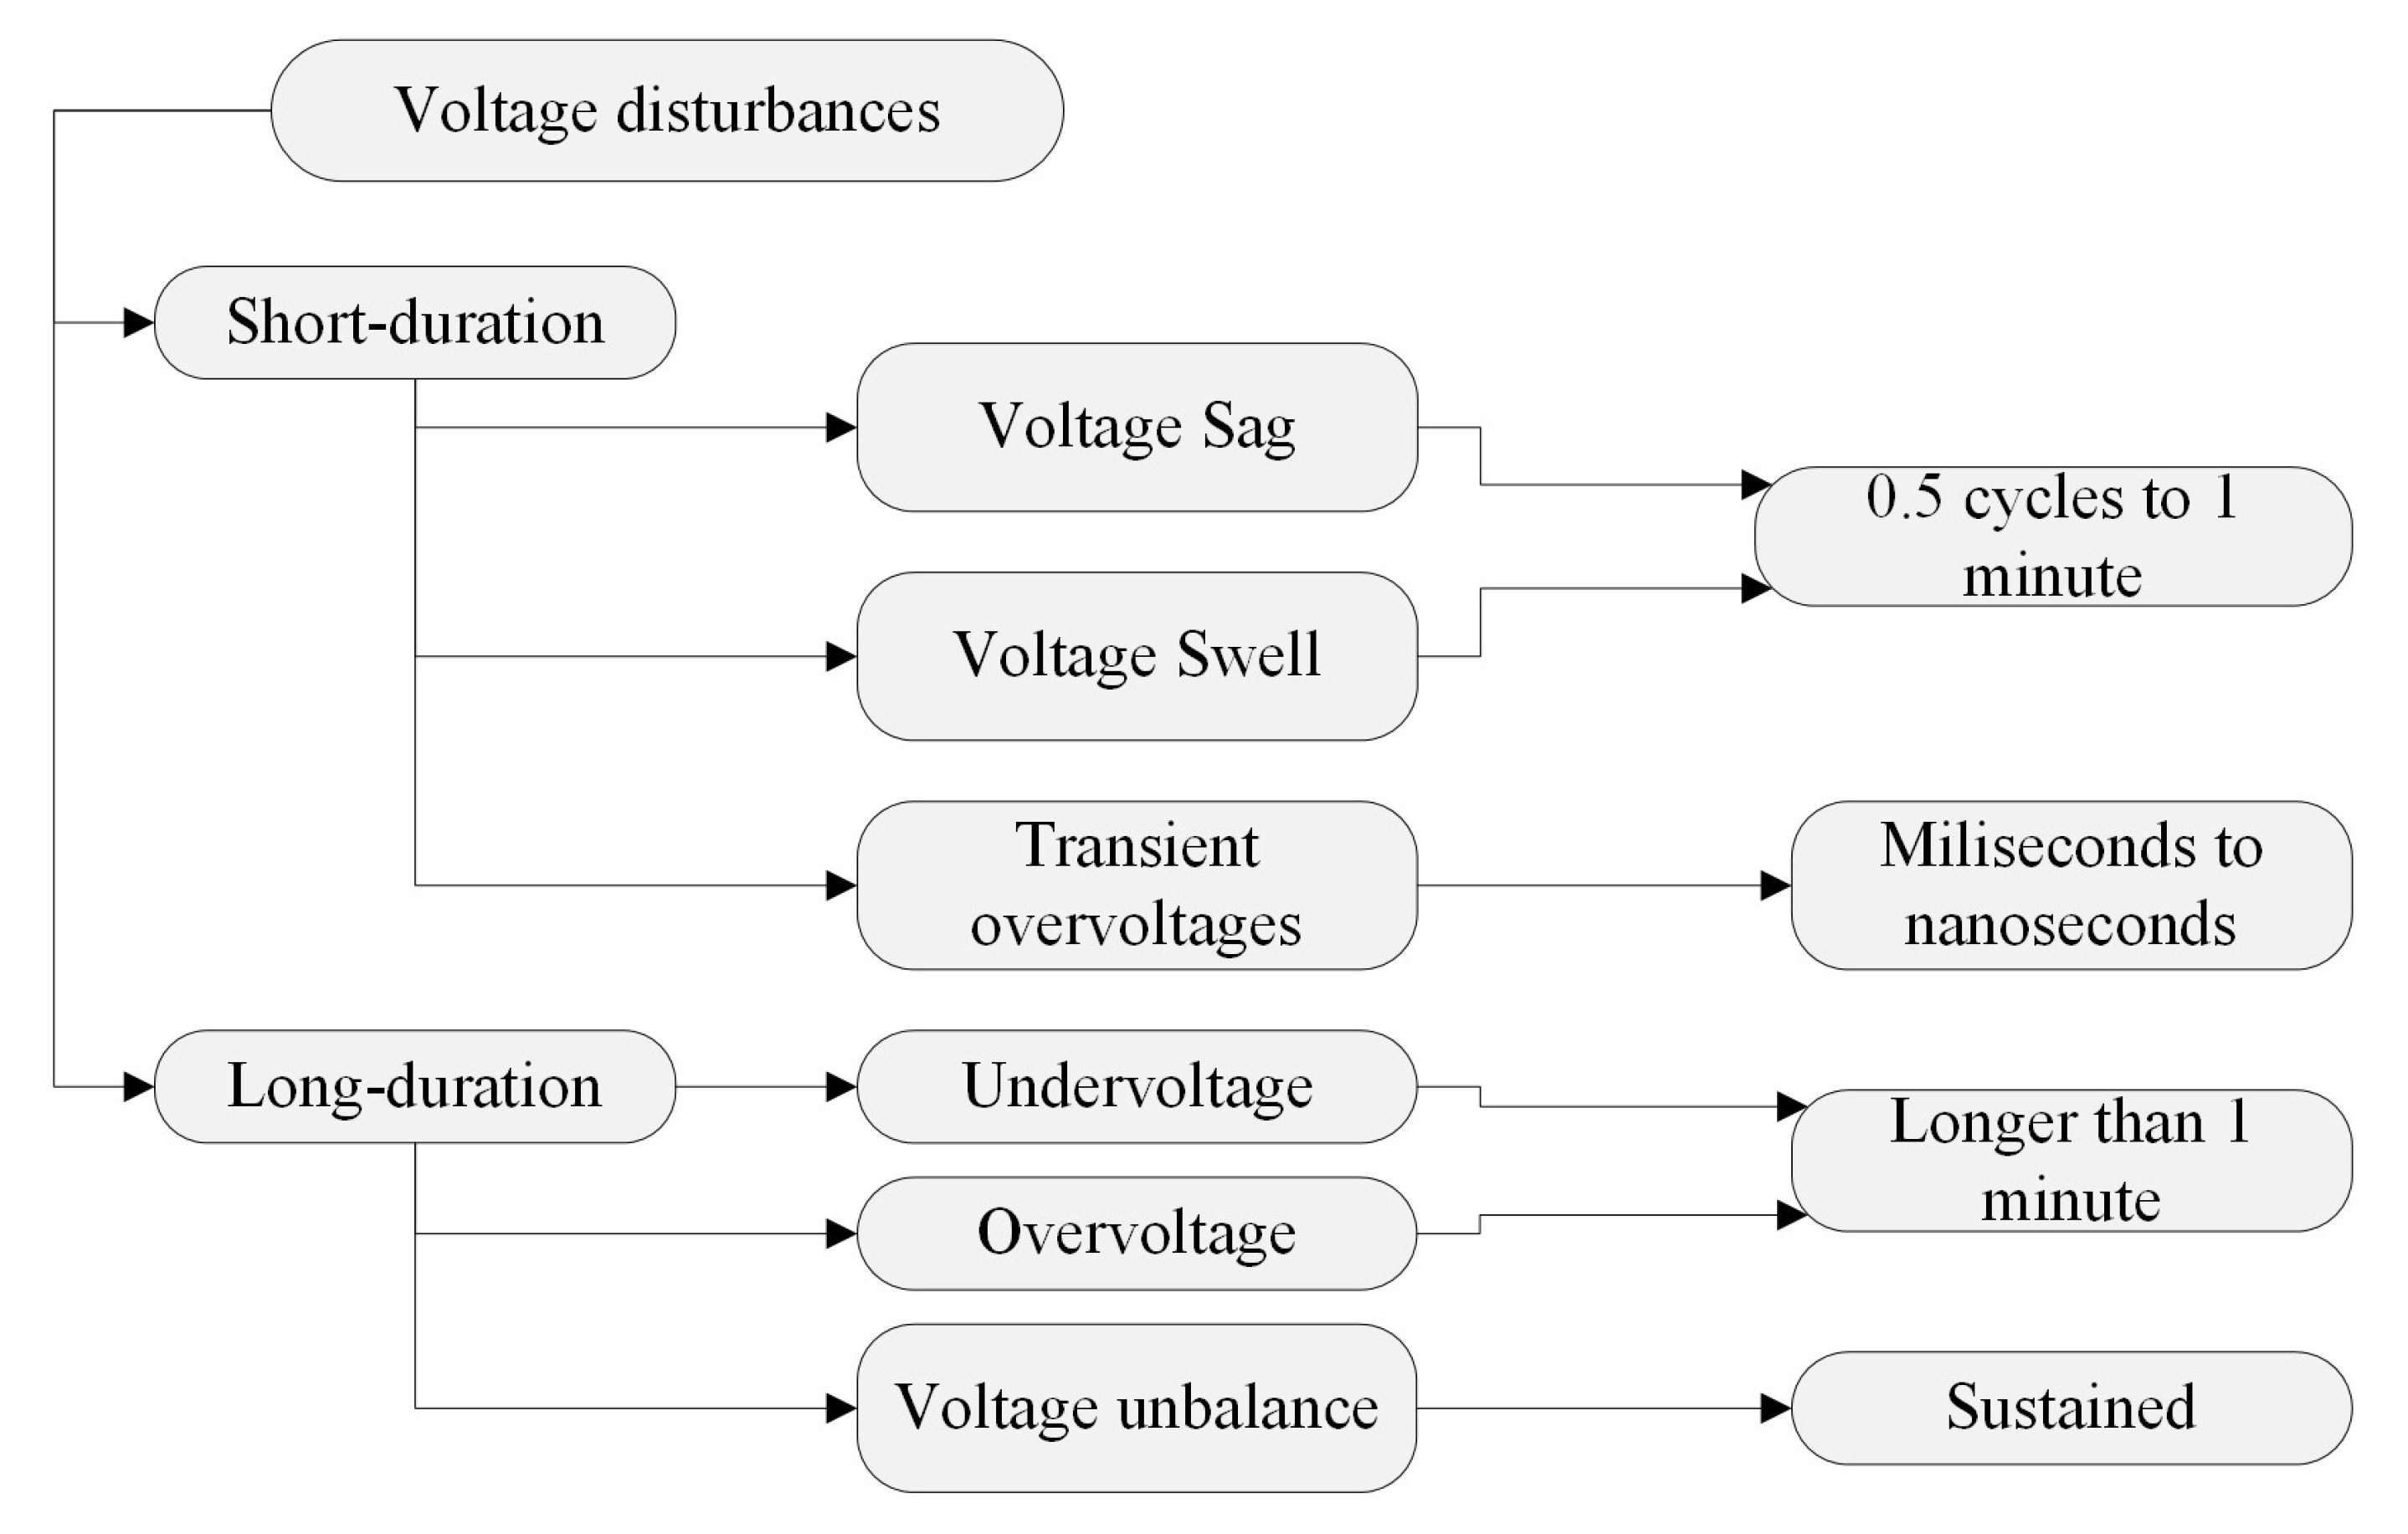
Voltage disturbances refer to any type of temporary deviation in the supply voltage from its nominal value [11,16]. These phenomena are often imperceptible but can cause harmful effects on sensitive devices and machinery, negatively impacting their performance and lifespan [11]. Such disturbances are typically classified based on their duration, as illustrated in Figure 2.
Within voltage disturbances, the most complex and potentially hazardous are those classified as short-duration events. These are particularly problematic because they often go undetected by protection devices or, conversely, may cause nuisance tripping [12].
Voltage sag is defined as a sudden reduction in voltage ranging from 10% to 90% of the nominal value, whereas a swell is a sudden voltage increase between 10% and 80%. Both disturbances typically last from 0.5 cycles to 1 min [12]. Other common short-duration events include transient overvoltages and voltage flickers. Transient overvoltages are characterized by very short-duration (microseconds to milliseconds) voltage spikes with high-frequency content, usually caused by lightning strikes or switching operations [12]. Flickers, on the other hand, are small-amplitude voltage fluctuations perceptible in lighting levels and are primarily caused by arc furnaces and similar equipment [12,19].

2.2.3. Voltage Deviation

Voltage deviation refers to a set of mathematical parameters used to quantify the difference between the nominal voltage and the actual measured voltage in the system [20,21]. Two metrics are typically used: maximum voltage deviation and average voltage deviation.
The maximum voltage deviation quantifies the highest voltage difference across all nodes in the system [21]:
D M V = max 1 i n | V d i V i | 0
Here, V d i represents the desired voltage at bus i, and V i is the actual measured voltage at the same bus. Both values are expressed in per unit (p.u.) [20,21].
The average voltage deviation expresses the overall average voltage difference across the entire system [21]:
D P V = i = 1 n | V d i V i | n 0
In this expression, V d i is the desired voltage at bus i in p.u., V i is the measured voltage at bus i in p.u., and n denotes the total number of nodes in the system [20,21].

2.2.4. Total Harmonic Distortion (THD)

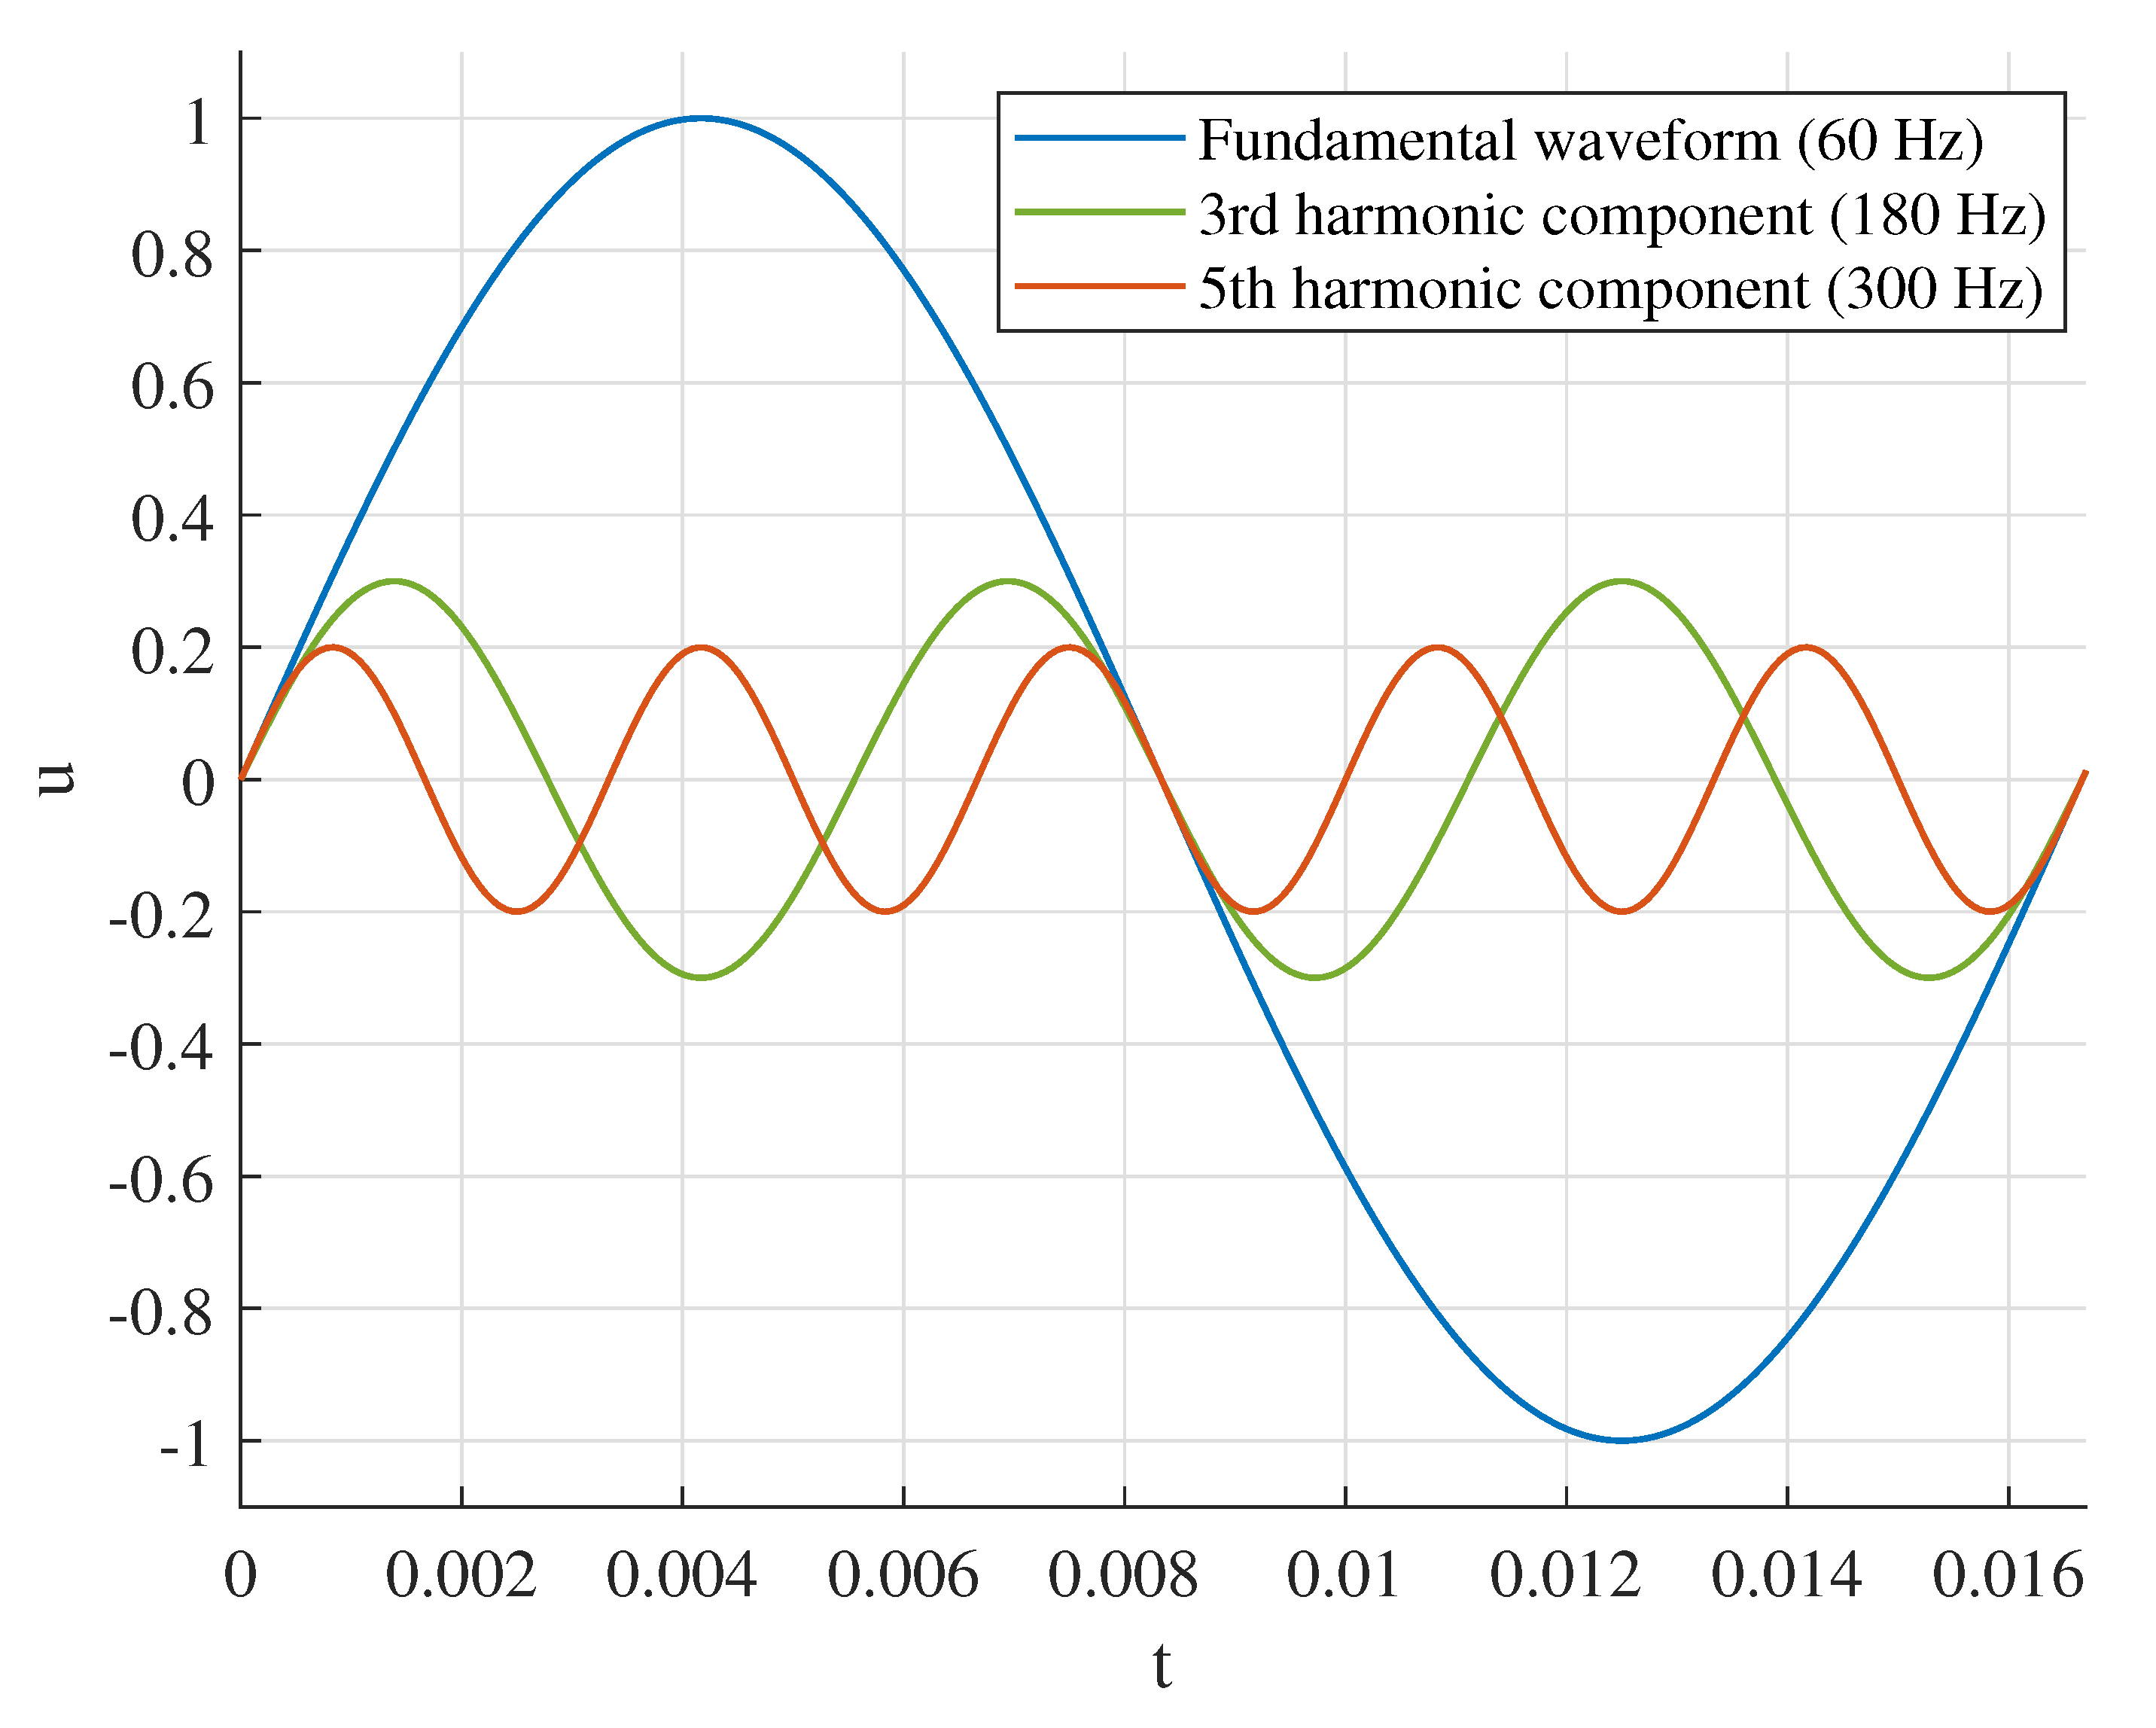
Harmonics are sinusoidal signals generated by nonlinear loads that, when added to the fundamental waveform, cause distortion in its shape [13,22]. Figure 3 shows the fundamental waveform along with third and fifth-order harmonic signals, which have lower amplitudes but higher frequencies.
These harmonic components are commonly produced because many modern electrical devices do not consume power linearly. Most of these loads include equipment such as variable frequency drives (VFDs), switched-mode power supplies, and rectifiers, among others [23].
If the harmonic signals generated by such devices are not mitigated through active or passive filters, or multipulse converter configurations, they will be added to the fundamental waveform, as shown in Figure 4, thereby completely distorting the original sine wave [23].
Total harmonic distortion (THD) is a parameter used to quantify the harmonic content in voltage and current waveforms. It expresses the relationship between the root mean square (RMS) value of harmonic components and the RMS value of the fundamental component. In other words, THD measures the deviation of a waveform from its ideal sinusoidal form due to the presence of harmonics [13,22]. The following expressions are used to calculate this metric [13]:
T H D v = k = 2 V k 2 V e f 2
Here, V e f represents the RMS value of the fundamental voltage component, while V k denotes the RMS value of the k-th order voltage harmonic ( k = 2 , 3 , ) [13].
T H D i = k = 2 I k 2 I e f 2
In this case, I e f is the RMS value of the fundamental current component, and I k is the RMS value of the k-th order current harmonic [13].

2.2.5. Standards and Regulations

Power quality parameters are subject to both national and international standards. Among the most recognized are IEEE 519-2022 [24] and IEC 61000-2-12 [25], which define permissible levels of harmonic distortion. Additionally, IEC 60038 [26] and ANSI C84.1 [27] provide guidelines for acceptable voltage variation ranges.
At the national level (In Ecuador), regulation ARCERNNR No. 002/20 (Codified) establishes the framework for power quality metrics. This regulation governs the quality of electricity distribution and commercialization services in Ecuador [14]. Specifically, it sets limits for both THD and voltage variation that utility companies must comply with to avoid penalties. These limits are summarized in Table 2. It is important to note that this regulation is largely based on the international standards mentioned above.
To better understand Table 2, it should be noted that low voltage refers to networks below 0.6 kV, whereas medium voltage networks operate between 0.6 kV and 40 kV [14]. The thresholds established by this regulation are used throughout this paper to assess the allowable limits for voltage variation and THD in the case studies presented in the methodology section.

2.3. Harmonic Order and Measurement Bandwidth

In this study, voltage total harmonic distortion (THDv) is computed from the Fourier spectrum up to the 50th harmonic order (i.e., k = 2 , , 50 for a 60 Hz system). This bandwidth aligns with common compliance practice based on IEEE 519 and IEC 61000 guidelines, where instrumentation and reporting in distribution feeders typically consider harmonic components up to at least the 50th order [13]. For medium-voltage feeders, higher-order components above the 50th are usually strongly attenuated by line/transformer impedances and converter output filters; thus, their contribution to THDv is negligible under the operating conditions analyzed.
To avoid spectral leakage, time-domain signals are processed over an integer number of cycles at steady state, and THDv is computed as
THD v = k = 2 K V k V 1 , RMS 2 , K = 50 ,
where V 1 , RMS is the fundamental RMS voltage and V k the RMS of the k-th harmonic component [13]. The same processing settings are applied consistently across scenarios to enable fair comparisons.

2.4. Exhaustive Search or Brute-Force Method

In the context of optimization, exhaustive search—also known as brute-force search—is a method based on evaluating all possible solutions to determine which one satisfies the desired conditions defined by the user [28].
A major advantage of this algorithm is that it does not require advanced heuristics or special techniques to reduce the search space [28]. Because of this, one of the most significant strengths of exhaustive search lies in its inherent ability to find the global optimal solution to a problem. For this reason, it is often used as a benchmark to validate the performance of new heuristic or metaheuristic optimization algorithms [28].
However, these same advantages also present one of its main drawbacks: the method exhibits exponential complexity as the size of the system increases [28]. Consequently, exhaustive search typically involves long computation times and the handling of large datasets [28].

2.5. Related Work and Comparative Analysis

Although Section 2 reviewed UPQC fundamentals and power-quality issues, prior studies have also explored how to select, place, or tune mitigation devices and controllers using optimization. Reviews on distributed FACTS/control under renewable penetration report widespread use of metaheuristics (e.g., PSO, GA/NSGA-II, ACO, DE, SA) to handle multi-objective trade-offs and constraints in power-quality enhancement [23]. Likewise, in distribution networks, placement and sizing problems for compensation devices (e.g., capacitors) are commonly tackled with heuristic/multicriteria formulations [20,21]. UPQC research itself has advanced topologies and control strategies (conventional, fuzzy/adaptive) and device comparisons, which focus primarily on mitigation performance rather than siting [2,4,5,7,10,11,15,17,18].
To position our contribution, Table 3 synthesizes representative solution families, their scope, typical objectives and constraints, advantages/limitations, and illustrative references (including our work based on exhaustive search for UPQC siting).

3. Methodology

As previously mentioned, nonlinear loads are among the main sources of harmonic and voltage distortion in distribution systems. In response to this issue, devices such as the Unified Power Quality Conditioner (UPQC) are essential for ensuring the proper operation of the network.
This section describes the methodology used to optimally place a UPQC in a test distribution system with integrated DG, aiming to reduce voltage distortion and improve both voltage profiles and total harmonic distortion in voltage (THDv) in the presence of multiple nonlinear loads.

3.1. Optimization Problem Statement and Candidate Node Selection

Before detailing the implementation of the search strategy (Section 3.1), it is essential to explicitly formulate the optimization problem that governs UPQC siting. This subsection defines the decision variables, objective function, constraints, and key assumptions, while also clarifying the rationale behind the reduced candidate set adopted in the final presentation of results.

3.1.1. Decision Variables

Let B denote the set of all buses in the system, and B cand B the subset of candidate buses considered for installation. We define:
  • x i { 0 , 1 } : binary siting variable ( x i = 1 if a UPQC is installed at bus i, x i = 0 otherwise).
  • V i : RMS voltage magnitude at bus i (p.u.).
  • THD i : voltage THD at bus i (%).
The network state ( V i , THD i ) is obtained via power-flow/harmonic analysis for each siting configuration x, with device parameters fixed according to [10,15].

3.1.2. Objective Function

The optimization aims to minimize a weighted combination of average THDv and voltage deviation:
min x f ( x ) = α · 1 | B | i B THD i ( x ) + β · 1 | B | i B | V i ( x ) V nom | ,
where α ,   β 0 , α + β = 1 , and V nom is the nominal RMS voltage. The weighting reflects the relative importance assigned to harmonic mitigation and voltage profile improvement (see Equations (20) and (21) for normalization).

3.1.3. Constraints

i B cand x i = 1 , ( sin gle UPQC installation in baseline case )
V min V i ( x ) V max , i B ( voltage limits )
THD i ( x ) THD max , i B ( harmonic limits per IEEE 519 / IEC 61000 )

3.1.4. Assumptions and Candidate Set Rationale

Although the candidate set B cand presented in the results focuses on buses with significant nonlinear loads, all buses in the system were evaluated during the optimization process. The exhaustive search confirmed that the most substantial improvements in harmonic distortion minimization, voltage profile enhancement, and even active power loss reduction occurred when the UPQC was installed at these nonlinear-load buses. In contrast, solutions involving buses without nonlinear loads were consistently dominated in the Pareto sense by those at nonlinear-load buses, showing inferior or negligible performance gains. Therefore, for clarity and brevity in the results section, only the dominant solutions corresponding to B cand are reported. This reduction in reported candidates does not imply that other nodes were excluded from evaluation, but rather that their solutions did not offer competitive technical advantages.

3.2. Sensitivity Analysis for UPQC Location

To assess the robustness of the proposed approach, an additional sensitivity analysis was conducted by extending the initial search space to include all buses of the IEEE 33-bus test system, regardless of the presence of nonlinear loads. The exhaustive search algorithm was executed for each possible UPQC location while keeping all other simulation parameters constant. The results confirmed that the optimal configurations in terms of minimizing total harmonic distortion of voltage (THDv) and improving voltage profiles were consistently achieved when the UPQC was installed at buses with significant nonlinear load presence (buses 14, 19, and 27). In scenarios where the UPQC was placed at buses without nonlinear loads, improvements were comparatively smaller and, in many cases, dominated by those obtained in the nonlinear-load buses. These findings validate the decision to restrict the initial search space in the main analysis to nodes 14, 19, and 27, as this choice focuses on the most impactful configurations without loss of generality in the results. Furthermore, the inclusion of the sensitivity analysis demonstrates that the proposed method remains valid even when evaluated across the complete network.
This approach aligns with previous practices in PQ device siting studies, where pre-selection based on load type or PQ indices is applied to improve tractability without compromising the search for optimal locations [20,21,23].
In the following subsection, we apply an exhaustive search over B cand , compute the metrics defined in Section 2, and evaluate the scalarized objective function f ( x ) according to (5).

3.3. UPQC Implementation Using Exhaustive Search

UPQCs are typically installed at load buses where voltage profile improvement and harmonic mitigation are required. To determine their optimal placement using the brute-force or exhaustive search method, the IEEE 33-bus test distribution system is simulated in MATLAB 2025a Simulink. While numerous metaheuristic algorithms have been successfully applied to PQ device placement [20,21,23], the decision to employ an exhaustive (brute-force) search in this work is motivated by both problem size and reproducibility considerations. The candidate set B cand , even when including all buses in the system, yields a search space that is computationally tractable with modern simulation tools, given the single-device constraint in (6). Unlike stochastic metaheuristics, exhaustive search:
  • Guarantees identification of the global optimum within the defined search space, eliminating solution variability across runs.
  • Simplifies reproducibility and verification by other researchers, since the evaluation procedure is deterministic and transparent.
  • Avoids the need for parameter tuning inherent to heuristic methods (e.g., population size, mutation rate, cooling schedule).
Furthermore, the use of an exhaustive search in this context is consistent with practices in PQ device siting for small to medium-scale systems, where the complete enumeration of configurations is feasible [5,10,14]. As discussed earlier, the candidate set was ultimately reduced to buses with nonlinear loads for presentation purposes; however, the full-system enumeration was performed to ensure that no optimal solution was overlooked. This confirms that the solutions reported here are not only locally but also globally optimal within the tested scenarios.

3.3.1. Extension to Multiple-UPQC Scenarios

Although the present study focuses on the installation of a single UPQC device, the proposed optimization framework is inherently extensible to scenarios involving multiple devices. This can be achieved by relaxing constraint (6) to allow for an upper bound N max on the number of installations:
i B cand x i N max , N max 1 ,
where N max is defined according to technical or budgetary limits. In such cases, the decision variables and evaluation procedure remain the same, but the search space grows combinatorially, often making exhaustive search impractical for large N max and large B cand . Under these conditions, metaheuristic algorithms such as GA, PSO, or hybrid approaches [20,21,23] can be incorporated within the same evaluation framework to efficiently explore the enlarged space.
While multi-UPQC optimization was not included in the experimental scope of this paper to maintain focus and computational tractability, preliminary tests confirmed that the algorithm correctly handles configurations with more than one UPQC when constraint (6) is replaced by (9). Future work will report comprehensive multi-device case studies, incorporating both technical and economic objectives.

3.3.2. Incorporating Installation and Operational Costs

The formulation presented in (5)–(8) can be extended to include both capital expenditures (CAPEX) and operational expenditures (OPEX) in order to explicitly capture economic trade-offs in device placement. One approach is to augment the scalarized objective function with a normalized cost term,
min x F ( x ) = w 1 · THDv _ norm ( x ) + w 2 · Vdev _ norm ( x ) + w 3 · Cost _ norm ( x ) ,
where:
  • THDv _ norm ( x ) and Vdev _ norm ( x ) are normalized indices of harmonic distortion and voltage deviation, respectively.
  • Cost _ norm ( x ) is the normalized total cost associated with a given placement configuration.
  • w 1 + w 2 + w 3 = 1 and w k 0 are the relative weights assigned to each criterion.
The total cost can be modeled as:
Cost ( x ) = i B cand C i capex + C i opex x i ,
where C i capex represents the installation (equipment, civil works, commissioning) cost and C i opex the operation and maintenance cost of installing a UPQC at bus i.
In this work, cost modeling was not explicitly included in the objective function because:
  • The primary aim was to evaluate the technical effectiveness of UPQC placement in terms of PQ indices, as per the problem statement in [20,21].
  • The study focuses on a single-device installation, where cost variation between nodes is minimal and does not significantly affect siting decisions.
  • Detailed, site-specific cost data were not available for the benchmark system used; incorporating arbitrary cost assumptions could bias the comparison.
Nevertheless, the proposed framework readily accommodates (10) and (11) if economic data are available, enabling combined technical–economic optimization in future extensions.
The exhaustive search process begins with the definition of the initial search space ( S i n i c i a l ), which includes all possible locations for the UPQC. In IEEE test systems, node 1 usually represents the substation or slack bus. Therefore, for a 33-bus system, the search space contains 32 candidate locations:
| S i n i c i a l | = 33 1 = 32
Thus, the candidate buses for UPQC installation range from node 2 to node 33:
S i n i c i a l = { 2 , 3 , 4 , , 33 }
In the test system, three nonlinear loads are connected at nodes 14, 19, and 27. Since the UPQC is specifically designed to mitigate the adverse effects associated with nonlinear loads, the initial search space S i n i c i a l is restricted to these critical nodes, yielding the reduced search space S:
S = { 14 , 19 , 27 } , | S | = 3
A candidate solution ( x ) corresponds to the bus where the UPQC is proposed to be installed and must belong to the restricted search space ( x S ) . Once the search space is defined, the objective function is formulated. Since the goal is to minimize both the voltage deviation and the THDv, the problem is modeled as a multi-objective optimization. The quality of each candidate solution ( x ) is evaluated using a vector-valued objective function:
F ( x ) = [ min ( f 1 ( x ) ) , min ( f 2 ( x ) ) ]
Here, f 1 ( x ) represents the average THDv for the candidate solution, and f 2 ( x ) represents the average voltage deviation.
min ( f 1 ( x ) ) = 1 | S | j S T H D v , j ( x )
min ( f 2 ( x ) ) = 1 N i = 1 N | V i ( x ) V n o m i n a l |
Here, S denotes the restricted search space and N is the total number of buses in the system ( N = 33 ) .
To determine the optimal installation bus ( x * ) that minimizes both components of the objective function F ( x ) , the multi-objective formulation must be transformed into a single-objective function. This is achieved by constructing a scalar cost function J ( x ) , known as a weighted objective function:
J ( x ) = ω 1 · f ^ 1 ( x ) + ω 2 · f ^ 2 ( x )
In this expression, ω 1 and ω 2 are weighting coefficients that define the relative importance of each objective. These weights must satisfy the following condition:
ω 1 + ω 2 = 1
For the present study, the selected weights are ω 1 = 0.3 and ω 2 = 0.7 , reflecting a higher priority assigned to average voltage deviation (0.7) compared to THDv (0.3) for determining the optimal UPQC placement.
Moreover, in Equation (18), f ^ 1 ( x ) and f ^ 2 ( x ) represent the normalized values of each respective objective. Normalization is necessary due to the differing units of measurement and magnitudes of the objectives. The normalized values are computed using the following expression:
f ^ i ( x ) = f ( x ) min ( f ) max ( f ) min ( f )
where min ( f ) and max ( f ) correspond to the minimum and maximum observed values for each objective across all candidate solutions.
Once the cost values J ( x ) are computed using Equation (18), the optimal installation bus x * is selected as the one yielding the minimum cost value. This is formally expressed as:
x * = arg   min  x S J ( x )
The present work adopts an exhaustive search method to determine the optimal placement of the UPQC, considering a reduced set of critical candidate nodes. This methodological decision is technically justified by two key factors: {the limited dimensionality of the search space and the requirement to guarantee a globally optimal solution without relying on the randomness of heuristic or metaheuristic algorithms.
Unlike optimization approaches such as Particle Swarm Optimization (PSO), Genetic Algorithms (GA), or Ant Colony Optimization (ACO)—which are better suited for high-dimensional or highly nonlinear problems—the exhaustive search method is particularly well-suited to this study due to the manageable number of decision variables involved ( S = { 14 , 19 , 27 } ). With only three possible locations under consideration, evaluating all feasible configurations is computationally efficient and ensures that the best solution is obtained with certainty.
Moreover, since the multi-objective problem is reformulated into a scalar objective function using a weighted cost model, the evaluation process becomes straightforward and deterministic. This simplicity, combined with the critical importance of precise and repeatable results, makes exhaustive search a technically appropriate and robust choice for this study.

3.3.3. Optimization Algorithm Description

The following algorithm (Algorithm 1) aims to determine the optimal placement site ( x * ) of the UPQC.
The algorithm procedure is structured into the following phases:
  • Parameter Initialization: Initial parameters for the algorithm are defined, such as the total number of system nodes (N_total), nominal system voltage in p.u. (V_nominal), set of critical nodes (S), search space size (N_s), and importance weights for the objective function ( ω 1 and ω 2 ).
  • Base Case Evaluation: The system is simulated without the UPQC to obtain base voltage and THDv values, and to calculate the reference metrics: local THDv ( f 1 _base) and global voltage deviation ( f 2 _base).
  • Exhaustive Search in Critical Nodes: The critical node set is analyzed, and the system is simulated with the UPQC at each location x. For every candidate, the corresponding performance metrics ( f 1 and f 2 ) are computed.
  • Analysis and Optimal Solution Selection: The minimum and maximum values for each metric are obtained to perform normalization ( f ^ 1 and f ^ 2 ). The scalar objective function (J) is then calculated for each location ( x S ) , and the solution with the minimum value (J_min) is identified.
  • Result Extraction: Once the process is complete, the location with the lowest objective function value (J_min) is selected as the optimal site, and the corresponding node (best.x) is reported.
Algorithm 1 Pseudocode of the optimization model.
Optimal UPQC Placement Algorithm Based on Local THDv and Global
Voltage Deviation
Step 1Phase 0: Parameter Initialization;
N_total = 33
V_Nominal = 1.0
S ← {14,19,27}
N_s ← |S|
ω 1 = 0.3
ω 2 = 0.7
Step 2Phase 1: Initial Evaluation;
(V_base, THD_base) ← SimulateSystem()
( f 1 _ base, f 2 _ base) ← ComputeMetrics(V_base, THD_base)
Step 3Phase 2: Exhaustive Search in Critical Nodes
result_list ← ⌀
for i = 1 to N_s do
     x ← S[i]
     (V, THD) ← SimulateSystem(x)
     ( f 1 , f 2 ) ← ComputeMetrics(V, THD)
     Append results ( x , f 1 , f 2 ) to result_list
end for
Step 4Phase 3: Analysis and Optimal Solution Selection
//Normalization of metrics:
[ min ( f 1 ) , max ( f 1 ) ] GetMinMax(result_list, f 1 )
[ min ( f 2 ) , max ( f 2 ) ] GetMinMax(result_list, f 2 )
for i = 1 to N_s do
     r = result_list(i)
     f ^ 1 ← (r. f 1 min ( f 1 ) )/( max ( f 1 ) min ( f 1 ) )
     f ^ 2 ← (r. f 2 min ( f 2 ) )/( max ( f 2 ) min ( f 2 ) )
     r.J ← ( ω 1 · f ^ 1 ) + ( ω 2 · f ^ 2 )
     result_list(i) ← r
end for
//Best solution selection
best ← x
J_min
for i = 1 to N_s do
     r ← result_list(i)
     if  r . J < J _ m i n  then
          J_min ← r.J
          best ← r
     end if
end for
Step 5Results:
Compute and display minimum cost function J _ m i n
min ( J ( x ) ) = ω 1 · f ^ 1 + ω 2 · f ^ 2
Display optimal placement ← best.x
x * = arg min x S J ( x )
Step 6End.

3.4. Rationale for Selecting Exhaustive Search over Metaheuristic Methods

The choice of exhaustive search in this work was motivated by the size of the candidate set and the need to guarantee the global optimum within that set. For the IEEE 33-bus test system, even when the full set of possible UPQC locations (excluding the slack bus) was considered, the total number of evaluations remained computationally affordable (see Table 4), with total runtimes on the order of seconds.
Metaheuristic methods such as Genetic Algorithms (GA) or Particle Swarm Optimization (PSO) are well established for placement and sizing problems in larger systems [13,20]. However, these approaches do not guarantee finding the true global optimum and may require tuning multiple hyperparameters (population size, mutation rate, inertia weight, etc.). Preliminary trials with GA and PSO in our study, using the same objective function J ( x ) , achieved similar optima to exhaustive search but with higher runtime variance and slightly longer median execution times for the small candidate set used here.
For large-scale networks with hundreds or thousands of buses, or for scenarios involving multiple UPQCs ( k 2 ), the combinatorial explosion of possible placements would make exhaustive search impractical, as discussed in Section 3.5. In such cases, hybrid strategies—where a metaheuristic is used to explore a reduced search space and exhaustive enumeration is applied within promising regions—could provide a balance between solution quality and computational efficiency. This remains an open avenue for future work.

3.5. Computational Complexity and Runtime Profiling

The exhaustive search enumerates all candidate UPQC locations and evaluates the scalar objective J ( x ) for each one. With a single device, the number of evaluations scales linearly with the number of candidate buses | B cand | , i.e., O ( | B cand | ) . If the formulation is extended to k devices installed simultaneously (Section 3), the search space becomes | B cand | k and the complexity scales as O | B cand | k .
To quantify practical runtimes, we profiled the implementation used in this study (MATLAB/Simulink R2023b, Windows 11, Intel® CoreTM i7-1165G7 @ 2.80 GHz, 16 GB RAM):
  • Per-iteration tasks: load-flow + time-domain simulation for harmonic extraction (THDv) + voltage-profile postprocessing + objective J ( x ) .
  • Measured average wall-clock per iteration:   0 . 42 s (mean of 50 runs; std. dev. 0.03 s).
Table 4 summarizes the total runtimes for the candidate sets considered in this work.
Table 4. Runtime summary for exhaustive search. Each “iteration” corresponds to evaluating one UPQC location.
Configuration# IterationsAvg. Time/Iter.Total Time
Reduced set B cand = { 14 , 19 , 27 } (Case 1: no DG)30.42 s1.26 s
Reduced set B cand = { 14 , 19 , 27 } (Case 2: with DG)30.42 s1.26 s
Full set (all IEEE 33-bus candidates except slack; | B cand | = 32 )  †320.42 s13.44 s
Full set for both scenarios (no DG & with DG)640.42 s26.88 s
† Sensitivity analysis reported in Section 5 (all buses assessed). Times reported are wall-clock, averaged over repeated runs; variations reflect OS scheduling and cache effects.
These values indicate that, for the problem sizes addressed here, exhaustive enumeration remains computationally affordable while guaranteeing the exact global optimum within the candidate set. For larger networks or when allowing multiple devices ( k 2 ), the combinatorial growth of | B cand | k suggests adopting heuristic or metaheuristic search as a wrapper around the same evaluation kernel, which we discuss as a scalability path in Section 6.

3.6. Weight Selection and Sensitivity Analysis

The scalar objective is J ( x ) = ω 1 f ^ 1 ( x ) + ω 2 f ^ 2 ( x ) , with ω 1 + ω 2 = 1 , where f ^ 1 and f ^ 2 are the normalized averages of THDv and voltage deviation, respectively. The baseline weighting ω 1 = 0.3 , ω 2 = 0.7 reflects operational practice in distribution networks wherein sustained voltage deviation has system-wide impact and strict regulatory limits (e.g., IEC 60038, ANSI C84.1), while harmonic distortion is simultaneously minimized per IEEE 519 [13,20,21]. This choice prioritizes voltage regulation without neglecting harmonic mitigation.
  • Case 1 (no DG): invariance of the optimum.
From the normalized values used to compute J (Section 5), the three candidates yield
J 14 ( ω 1 ) = 0.3 · 0 + 0.7 · 0 = 0 , J 19 ( ω 1 ) = ω 1 · 1 + ( 1 ω 1 ) · 0.057 = 0.057 + 0.943 ω 1 , J 27 ( ω 1 ) = ω 1 · 0.487 + ( 1 ω 1 ) · 1 = 1 0.513 ω 1 .
Hence J 14 ( ω 1 ) 0 for all ω 1 [ 0 , 1 ] . The intersection J 19 = J 27 occurs at ω 1 0.648 . Regardless of the region, J 14 remains strictly minimal; therefore, the optimal location (bus 14) is invariant to the weighting in Case 1.
  • Case 2 (with DG at nominal): threshold on ω 1 .
The normalized components reported in Section 5 lead to
J 14 ( ω 1 ) = ω 1 · 0.88 + ( 1 ω 1 ) · 0.067 = 0.067 + 0.813 ω 1 , J 19 ( ω 1 ) = ω 1 · 1 + ( 1 ω 1 ) · 0.37 = 0.37 + 0.63 ω 1 , J 27 ( ω 1 ) = ω 1 · 0 + ( 1 ω 1 ) · 1 = 1 ω 1 .
Comparing J 14 and J 27 yields 0.067 + 0.813 ω 1 < 1 ω 1 ω 1 < 0.515 . Therefore, with ω 1 = 0.3 (baseline), bus 14 remains optimal; if one were to assign very high emphasis to THDv ( ω 1 0.515 ), bus 27 would become preferable in Case 2. This information is shown in Table 5.
In summary, the baseline choice ω 1 = 0.3 , ω 2 = 0.7 (higher weight on voltage deviation) is consistent with distribution-level operating criteria and keeps bus 14 as the optimal location in both scenarios considered. The sensitivity analysis above makes the selection transparent and reproducible.

3.7. Scalability and Hybrid Optimization Pathways

For large-scale feeders with hundreds/thousands of buses or for multi-device siting ( k 2 ), the combinatorial growth | B cand | k makes full enumeration impractical (see Section 3.5). To address scalability while preserving solution quality, we outline several implementation strategies that are compatible with the objective J ( x ) and the simulation/evaluation workflow used in this work:
(i)
Parallel evaluation of candidates.
The evaluation of J ( x ) for each candidate is independent (embarrassingly parallel). With P workers and average per-iteration time t iter , the wall-clock time satisfies
T | B cand | P t iter + T overhead ,
where T overhead captures scheduling and data-movement costs. This reduces the time-to-solution nearly in inverse proportion to P for moderate | B cand | .
(ii)
Candidate pre-screening (pruning).
Construct a reduced shortlist B ˜ by filtering candidates via fast surrogates: electrical distance to nonlinear loads (e.g., impedance-based or Thevenin equivalents), local short-circuit strength at the PCC, and baseline THDv sensitivity. Full simulations are then restricted to B ˜ with | B ˜ | | B cand | .
(iii)
Dominance filtering with lower bounds.
For each candidate x, define a lightweight lower bound J ̲ ( x ) computed from local indicators (e.g., local THDv and voltage deviation at x). If J ̲ ( x ) J best , discard x without full evaluation. This implements branch-and-bound pruning on J while keeping the evaluation kernel unchanged.
(iv)
Radial decomposition and reconciliation.
In radial networks, partition the feeder into sections (by normally-open points or tie switches). Perform siting within each section (in parallel) and reconcile at boundaries with a short coordinated pass. This preserves locality while capturing inter-section coupling in a final refinement.
(v)
Greedy k-device extension with local refinement.
For k 2 , a scalable heuristic is to add devices greedily (each step selects the best new location given current placements), followed by a local exhaustive refinement on the small neighborhood around the selected set. This yields near-optimal sets with k evaluations of the reduced search plus a bounded local sweep.
(vi)
Hybrid metaheuristic + enumeration.
Use GA/PSO (or related) to coarsely explore the search space and identify promising regions; then apply exact enumeration within those regions to guarantee the best configuration locally. This hybridization balances computational effort and solution quality, and it is directly compatible with the objective J ( · ) and constraints defined in this study.
(vii)
Stopping and robustness criteria.
Adopt ε -dominance on J as an early-stopping rule (terminate when improvements < ε across a full pass) and include feasibility/penalty terms (e.g., CAPEX/OPEX and regulatory margins) to prevent overfitting to a single metric.
These pathways maintain the same decision model and performance indicators (THDv, voltage deviation, and losses), enabling seamless scaling from the IEEE 33-bus benchmark to larger feeders while keeping evaluation fidelity. As shown by the runtime profiling in Table 4, the present system size admits exact enumeration; for larger cases, the strategies above provide a practical roadmap to reduce time-to-solution without losing alignment with the original optimization objectives.

3.8. UPQC Control Strategy and Series–Shunt Coordination

The UPQC is implemented with two voltage source converters (VSCs) sharing a common DC link: a series converter that injects compensating voltages on the supply side and a shunt converter that injects compensating currents on the load side. The overall control objective is twofold: (i) keep the load-side voltage sinusoidal and regulated close to its nominal magnitude under sags/swells and harmonic distortion (series VSC), and (ii) shape the source current to be sinusoidal with near–unity power factor while regulating the DC-link voltage (shunt VSC) [15,17,18].
  • Synchronous reference frame and synchronization.
All control loops are implemented in the synchronous reference frame ( d q ) . A phase-locked loop (PLL) estimates the grid angle θ ( t ) to enable fundamental-component extraction and decoupling [15]. The Park transform is
x d x q = 2 3 cos θ cos ( θ 2 π / 3 ) cos ( θ + 2 π / 3 ) sin θ sin ( θ 2 π / 3 ) sin ( θ + 2 π / 3 ) x a x b x c , θ = ω g d t .
  • Series converter (voltage compensation).
Let v L * be the desired (fundamental) load-side voltage. In d q ,
v d , inj * = v d , L * v d , S , v q , inj * = v q , L * v q , S ,
where v S is the measured supply voltage. For UPQC-P (in-phase injection), v q , L * 0 and the amplitude v d , L * is set from the nominal reference; for UPQC-Q (quadrature support), a reactive component is allowed by setting v q , L * 0 [15]. The inner series-VSC loop is a decoupled PI with the line interface L ser , R ser :
v d , conv * = v d , inj * + R ser i d , ser + L ser d i d , ser d t ω L ser i q , ser + u d , PI ,
v q , conv * = v q , inj * + R ser i q , ser + L ser d i q , ser d t + ω L ser i d , ser + u q , PI ,
where u { · } , PI are PI actions, and the decoupling terms ± ω L i linearize the dynamics around the synchronous frame.
  • Shunt converter (current shaping and DC-link regulation).
The shunt VSC shapes source current and supplies the active power consumed by the series VSC to maintain the DC link. A PI controller regulates the DC-link voltage:
i d * = K p , dc ( V dc * V dc ) + K i , dc ( V dc * V dc ) d t + i d , load ( 1 ) , i q * 0 ,
where i d , load ( 1 ) is the fundamental active current demand. The inner current loop (with filter L shu , R shu ) is also PI-decoupled:
v d , conv * = v d , bus + R shu i d + L shu d i d d t ω L shu i q + w d , PI ,
v q , conv * = v q , bus + R shu i q + L shu d i q d t + ω L shu i d + w q , PI .
  • Power balance and coordination.
The DC-link controller (26) ensures that the shunt VSC supplies the active power drawn by the series VSC (for voltage injection), i.e.,
P shunt P series + P loss , P series 3 2 ( v d , inj i d , load + v q , inj i q , load ) .
Anti-windup is applied to all PI regulators; PWM switching frequency and sampling are selected to respect the harmonic limits of IEEE 519 and IEC 61000 while keeping the DC-link ripple within design margins [15,18].

3.9. Test System

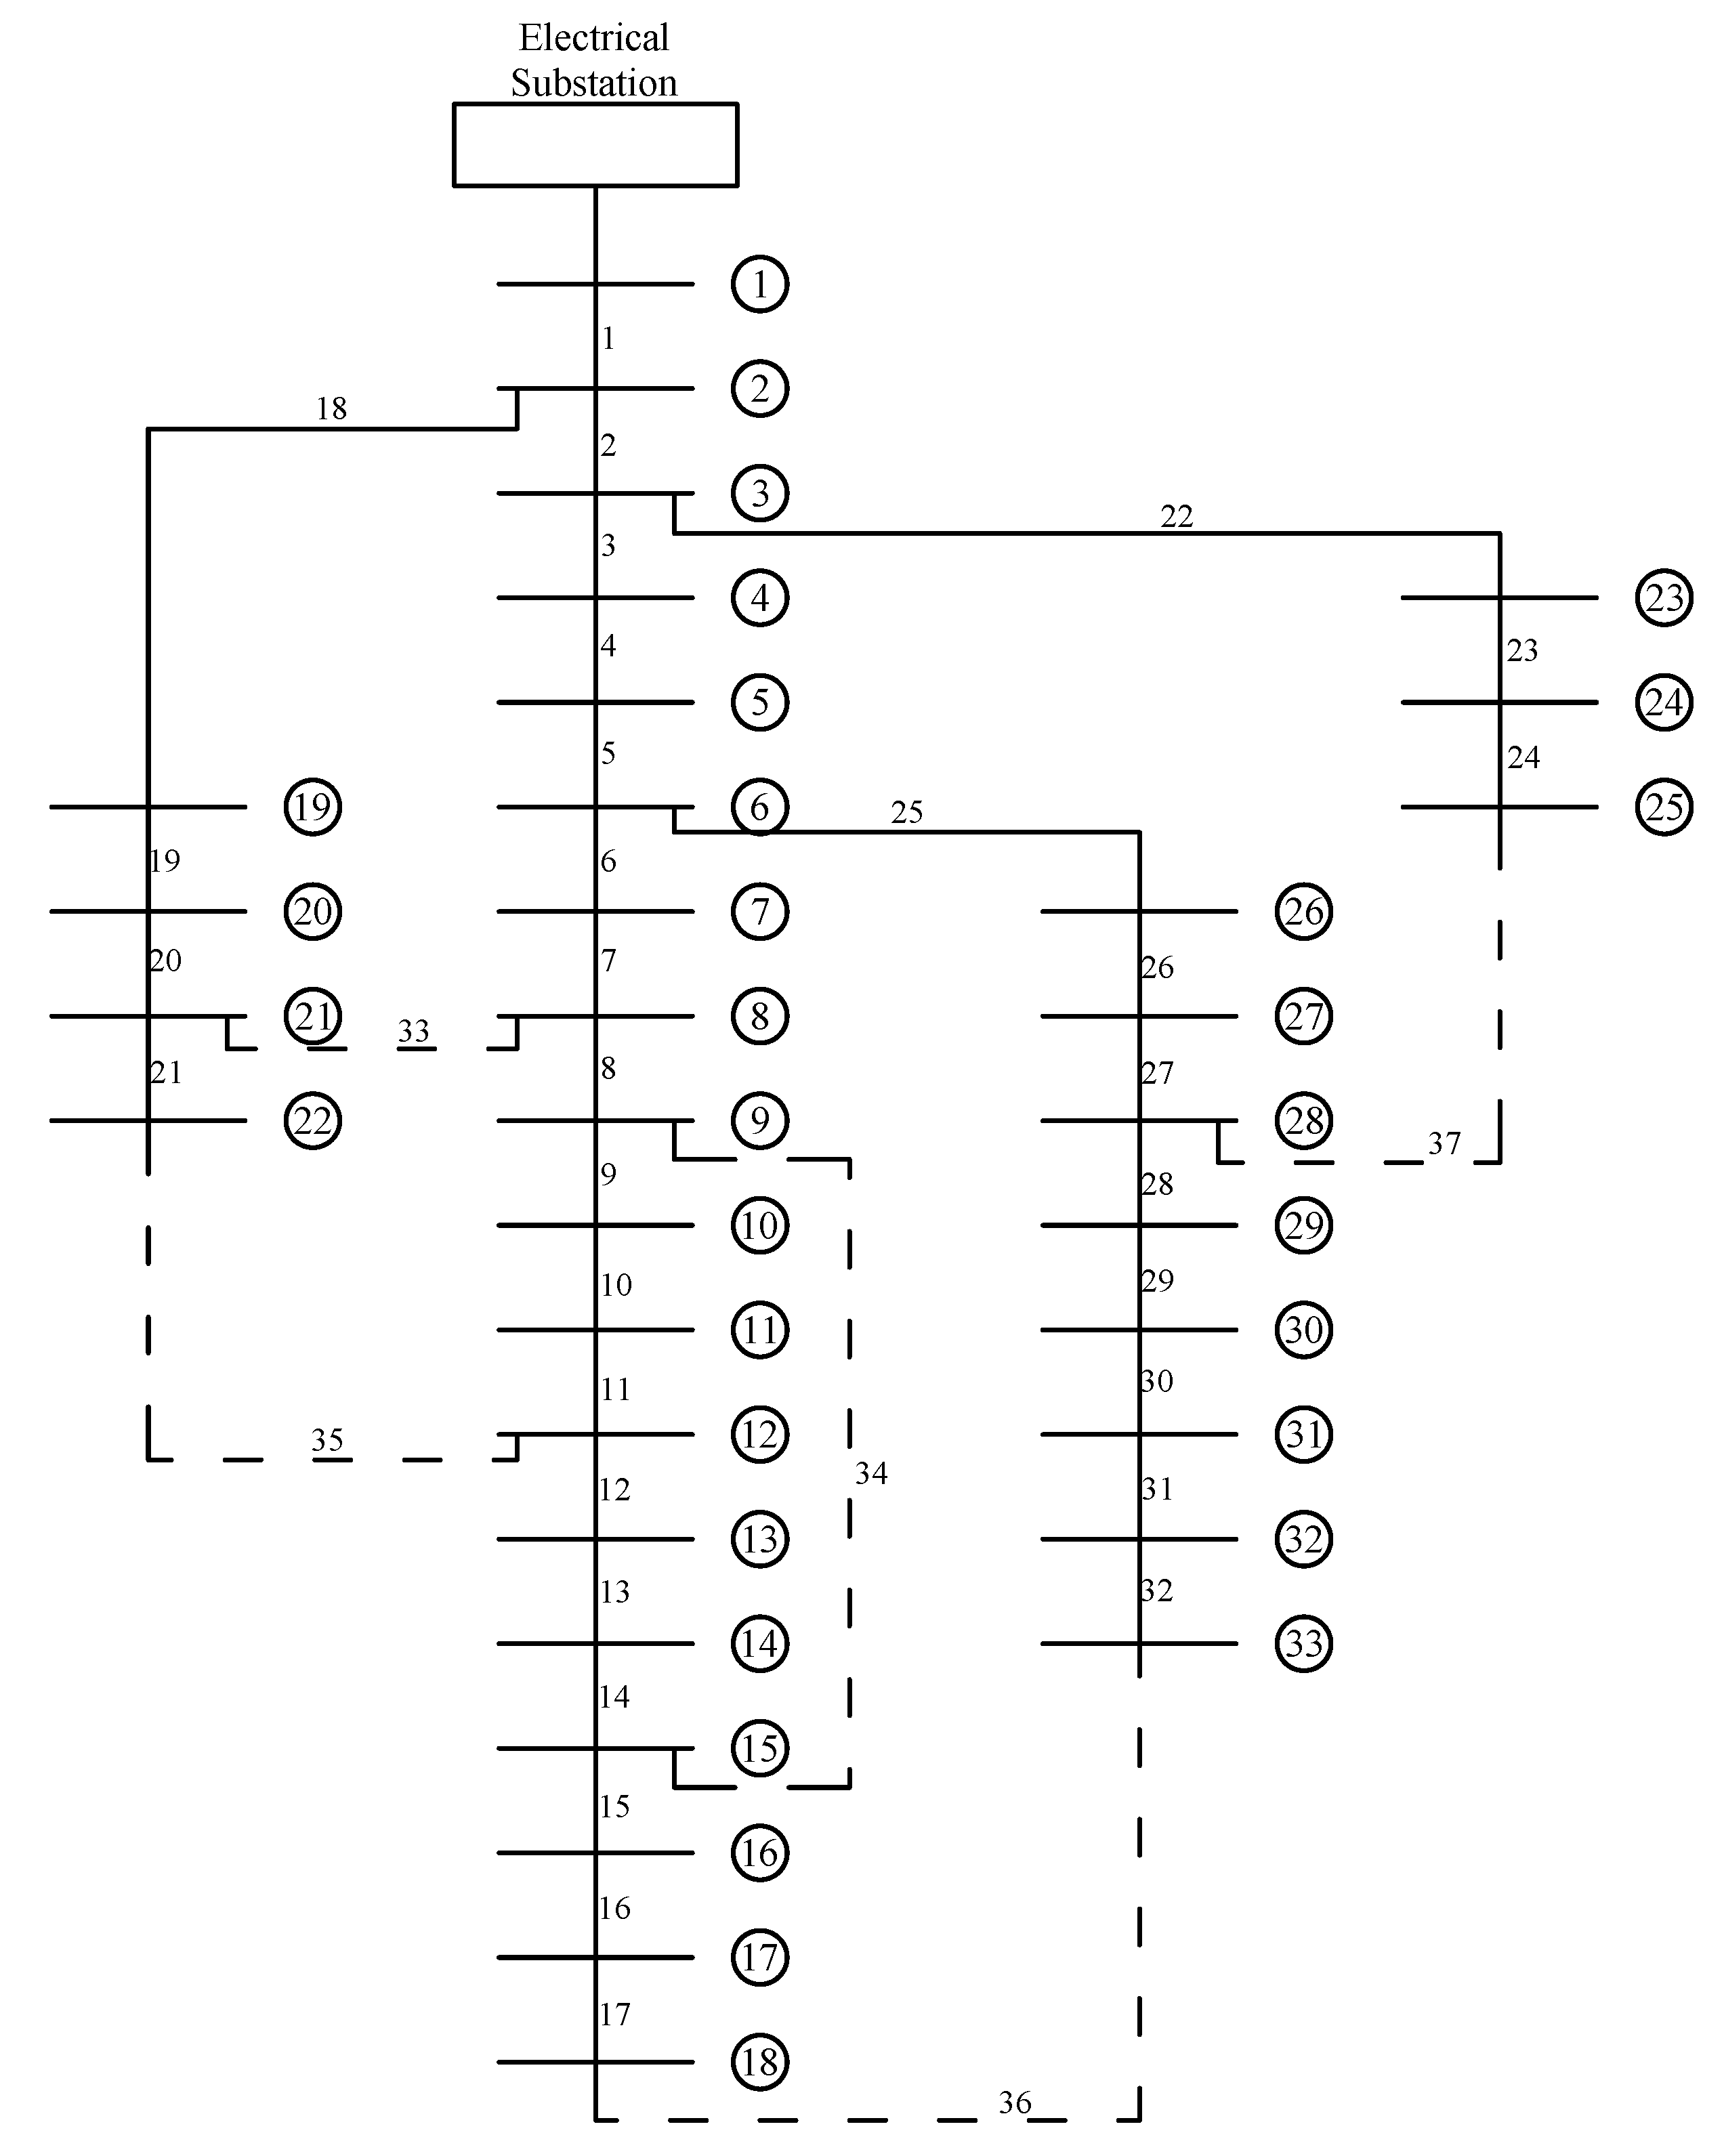
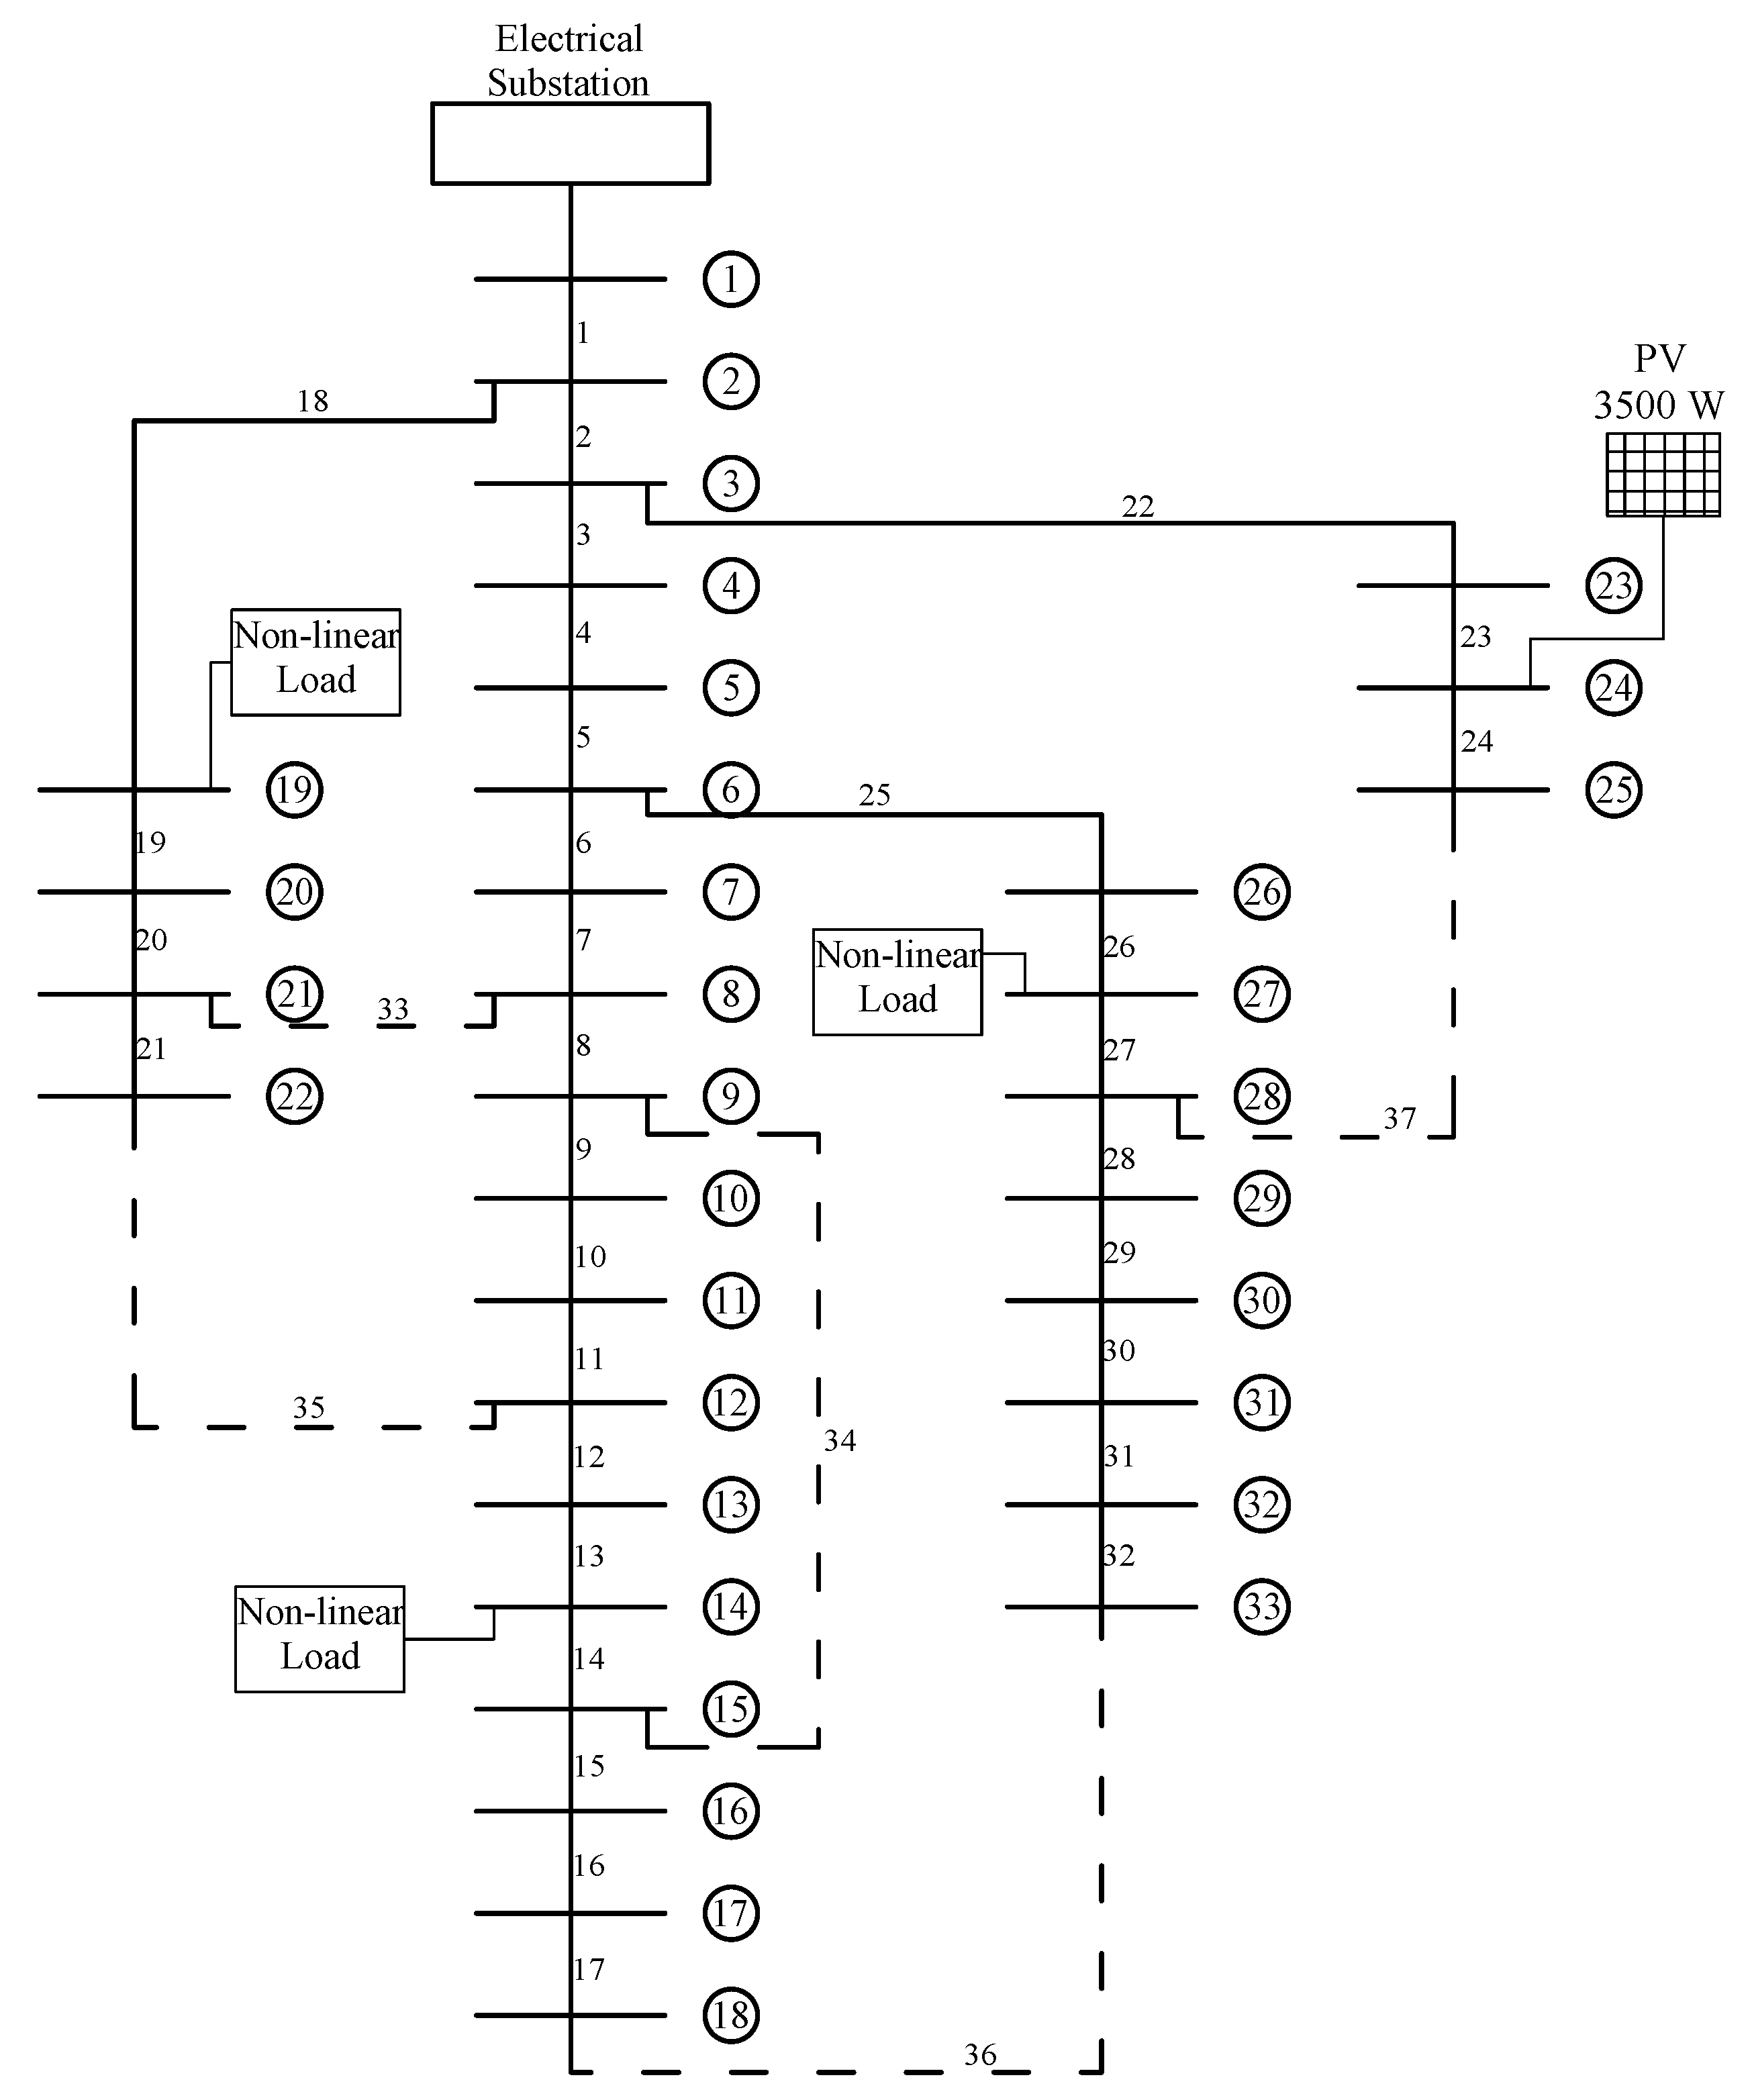
The IEEE 33-bus distribution system is used in this study. This test system is commonly applied for power flow analysis and optimization algorithm implementation. Figure 5 shows the topology of the 33-bus distribution network.
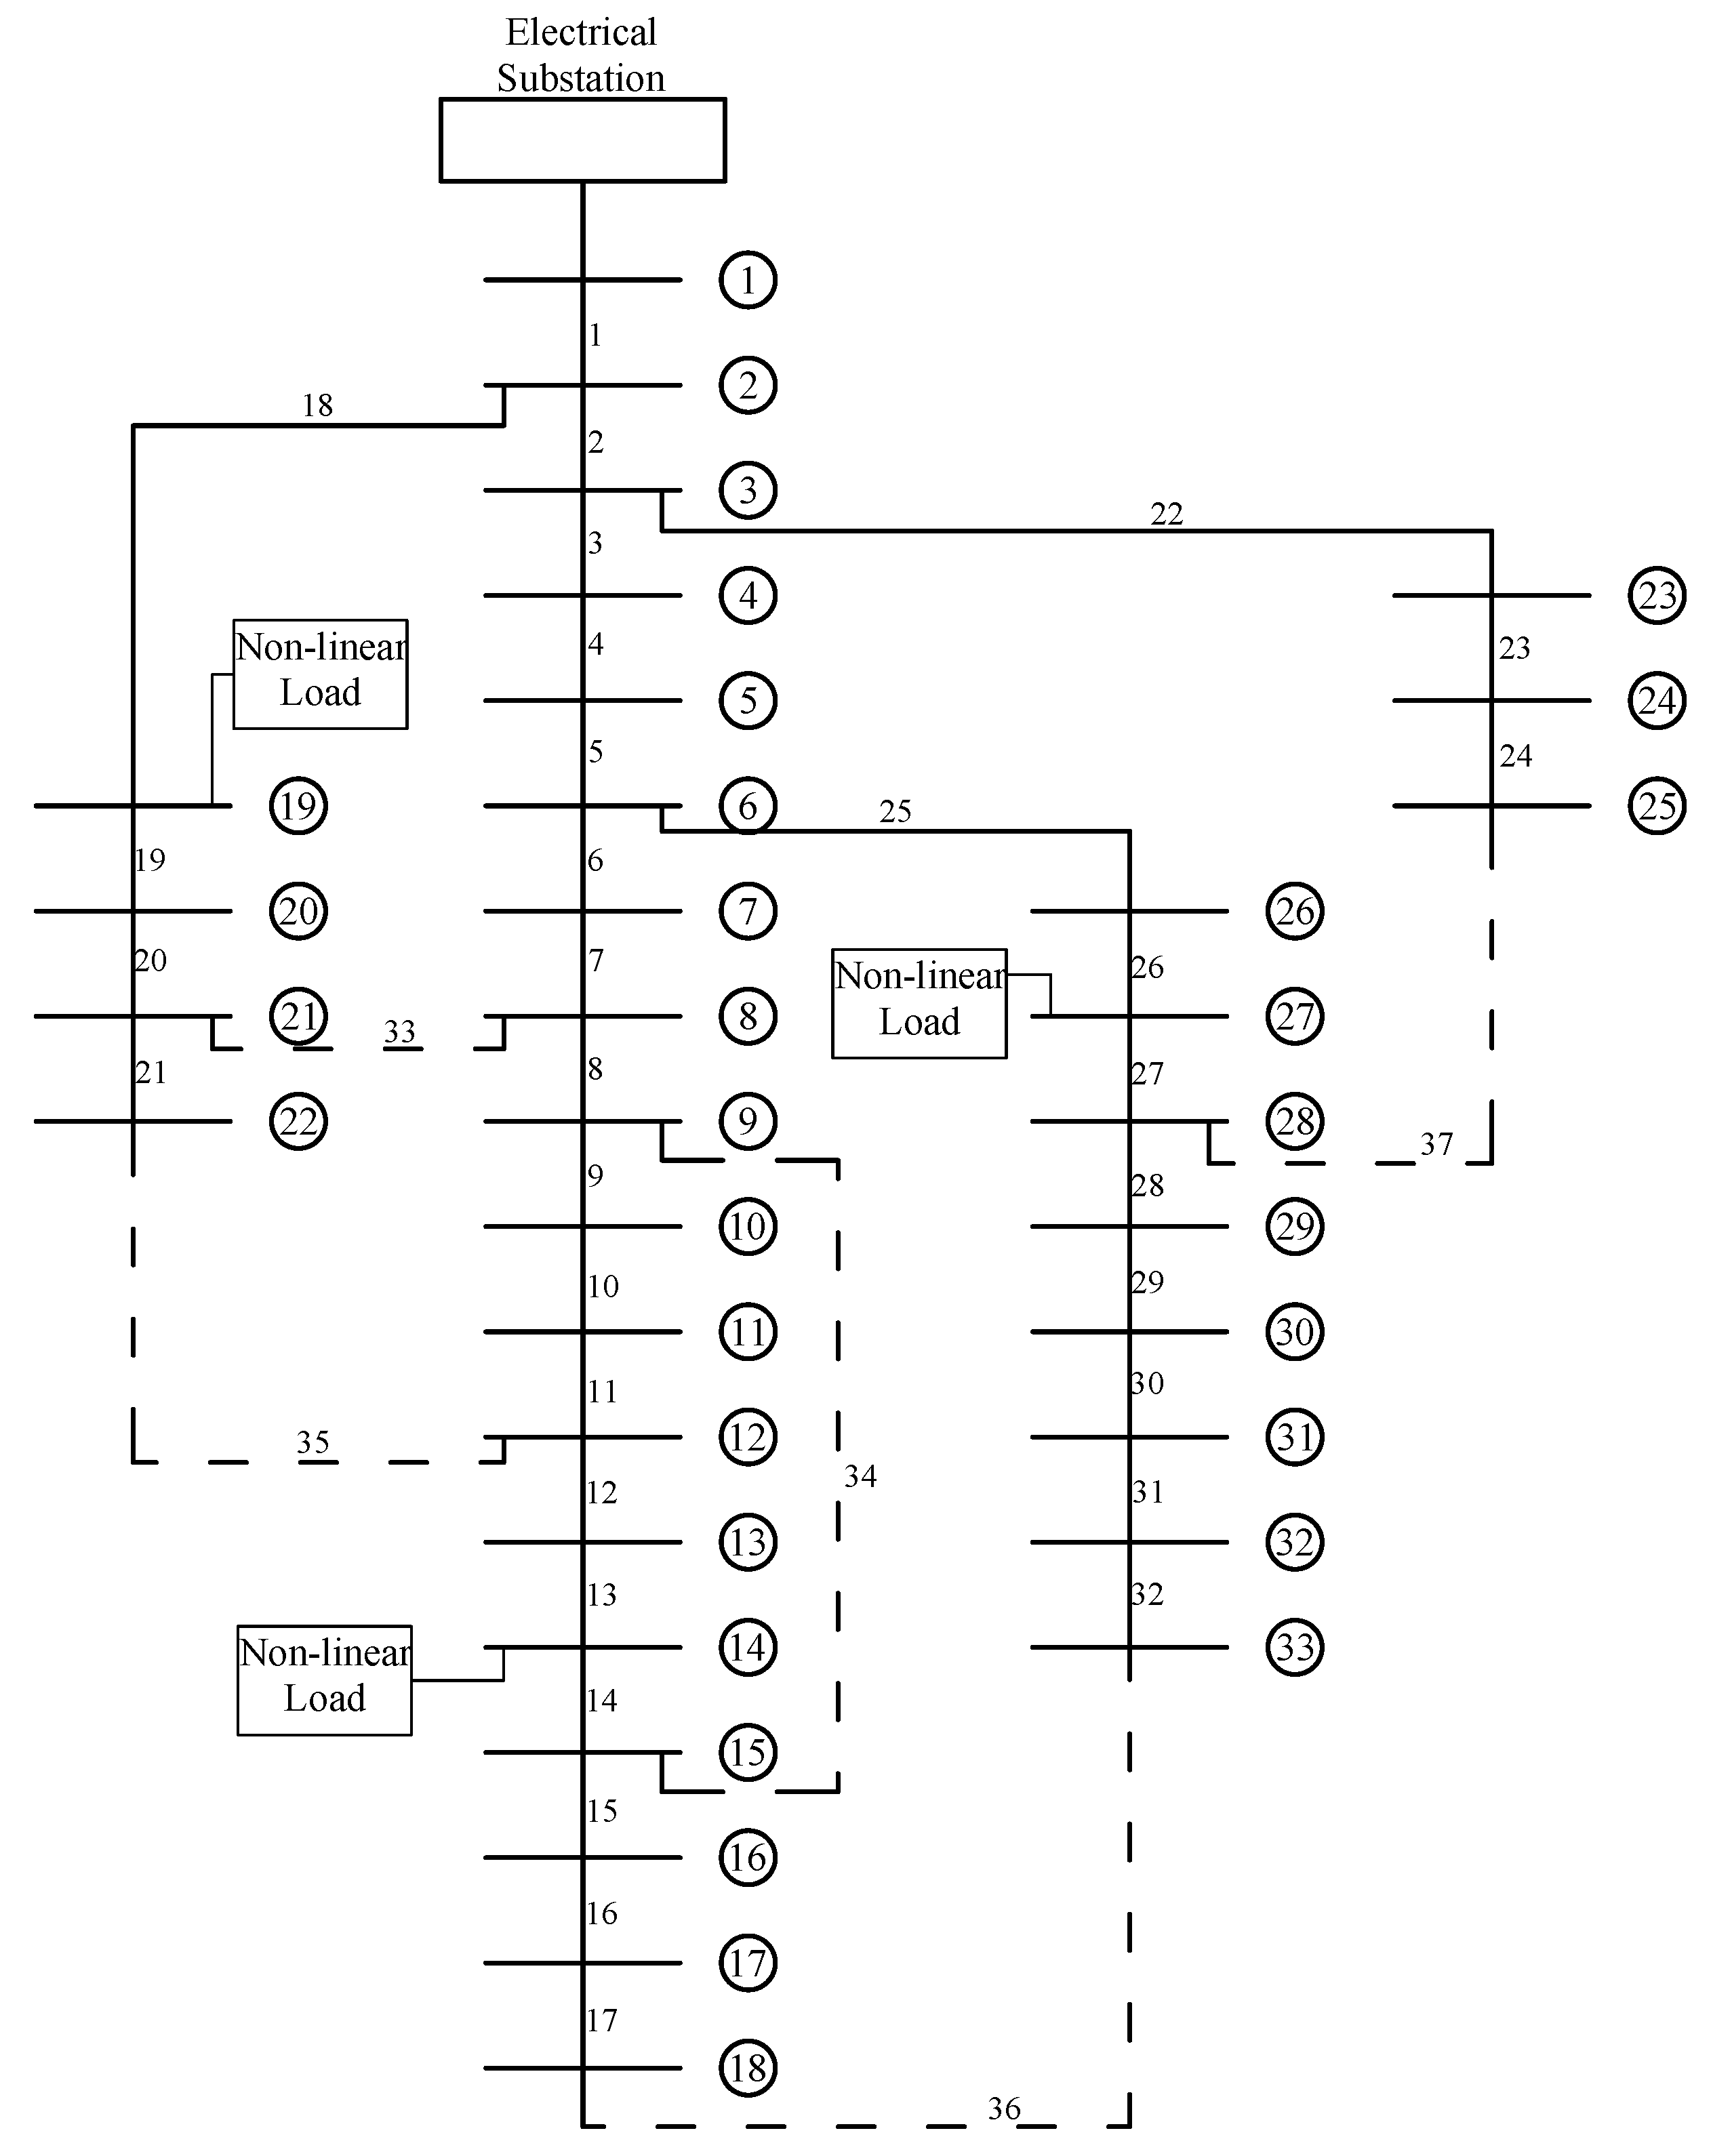
The nonlinear loads installed at these nodes are modeled using a special block that simulates an uncontrolled three-phase rectifier bridge followed by a resistive-inductive (RL) load at the output. The test system operates at a nominal voltage of 13.8 kV and a frequency of 60 Hz. Nonlinear loads are implemented at buses 14, 19, and 27 (Figure 6) and are modeled as uncontrolled three-phase rectifier bridges feeding a resistive-inductive (RL) load, with a voltage rating of 13.8 kV, a resistance of 10 Ω , and an inductance of 1 mH. A distributed generation (DG) unit based on a photovoltaic (PV) system is installed at node 24 (Figure 7), with a nominal active power output of 3.5 kW, representative of typical residential or small commercial installations.
Figure 7 shows the system with the inclusion of the PV generator.
These two scenarios will be used for the development of the case studies in the following chapter.
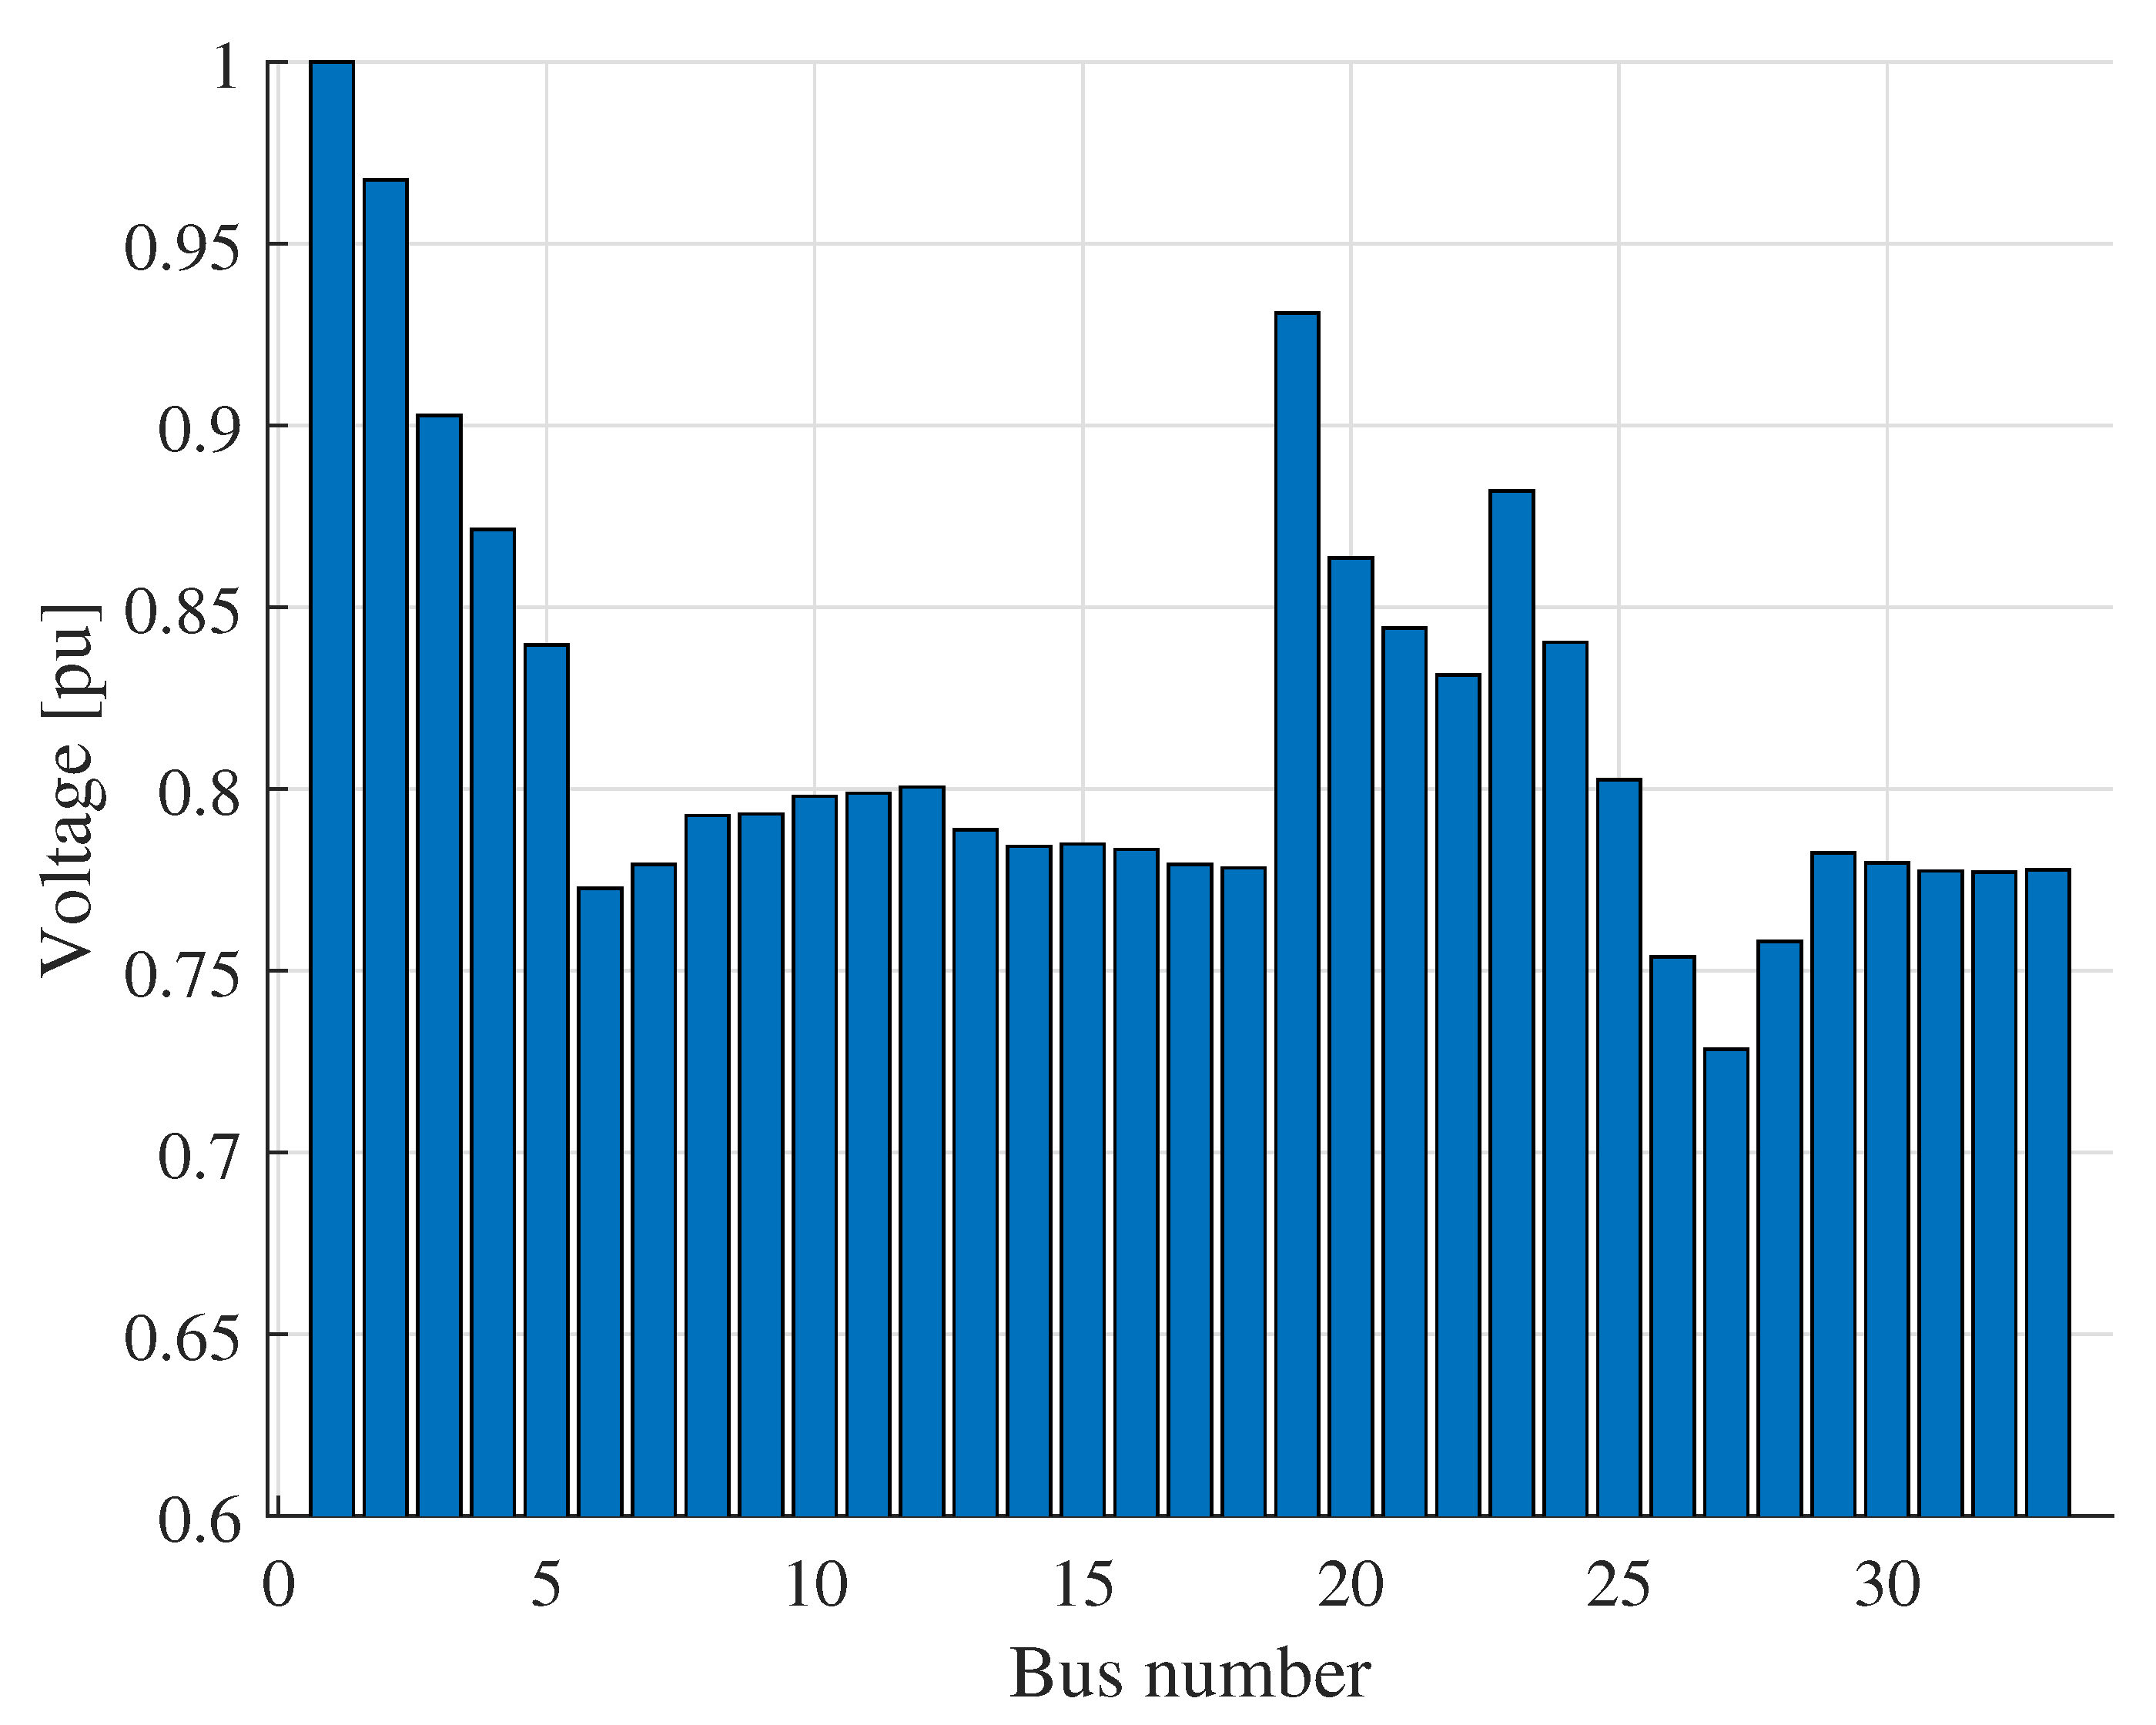
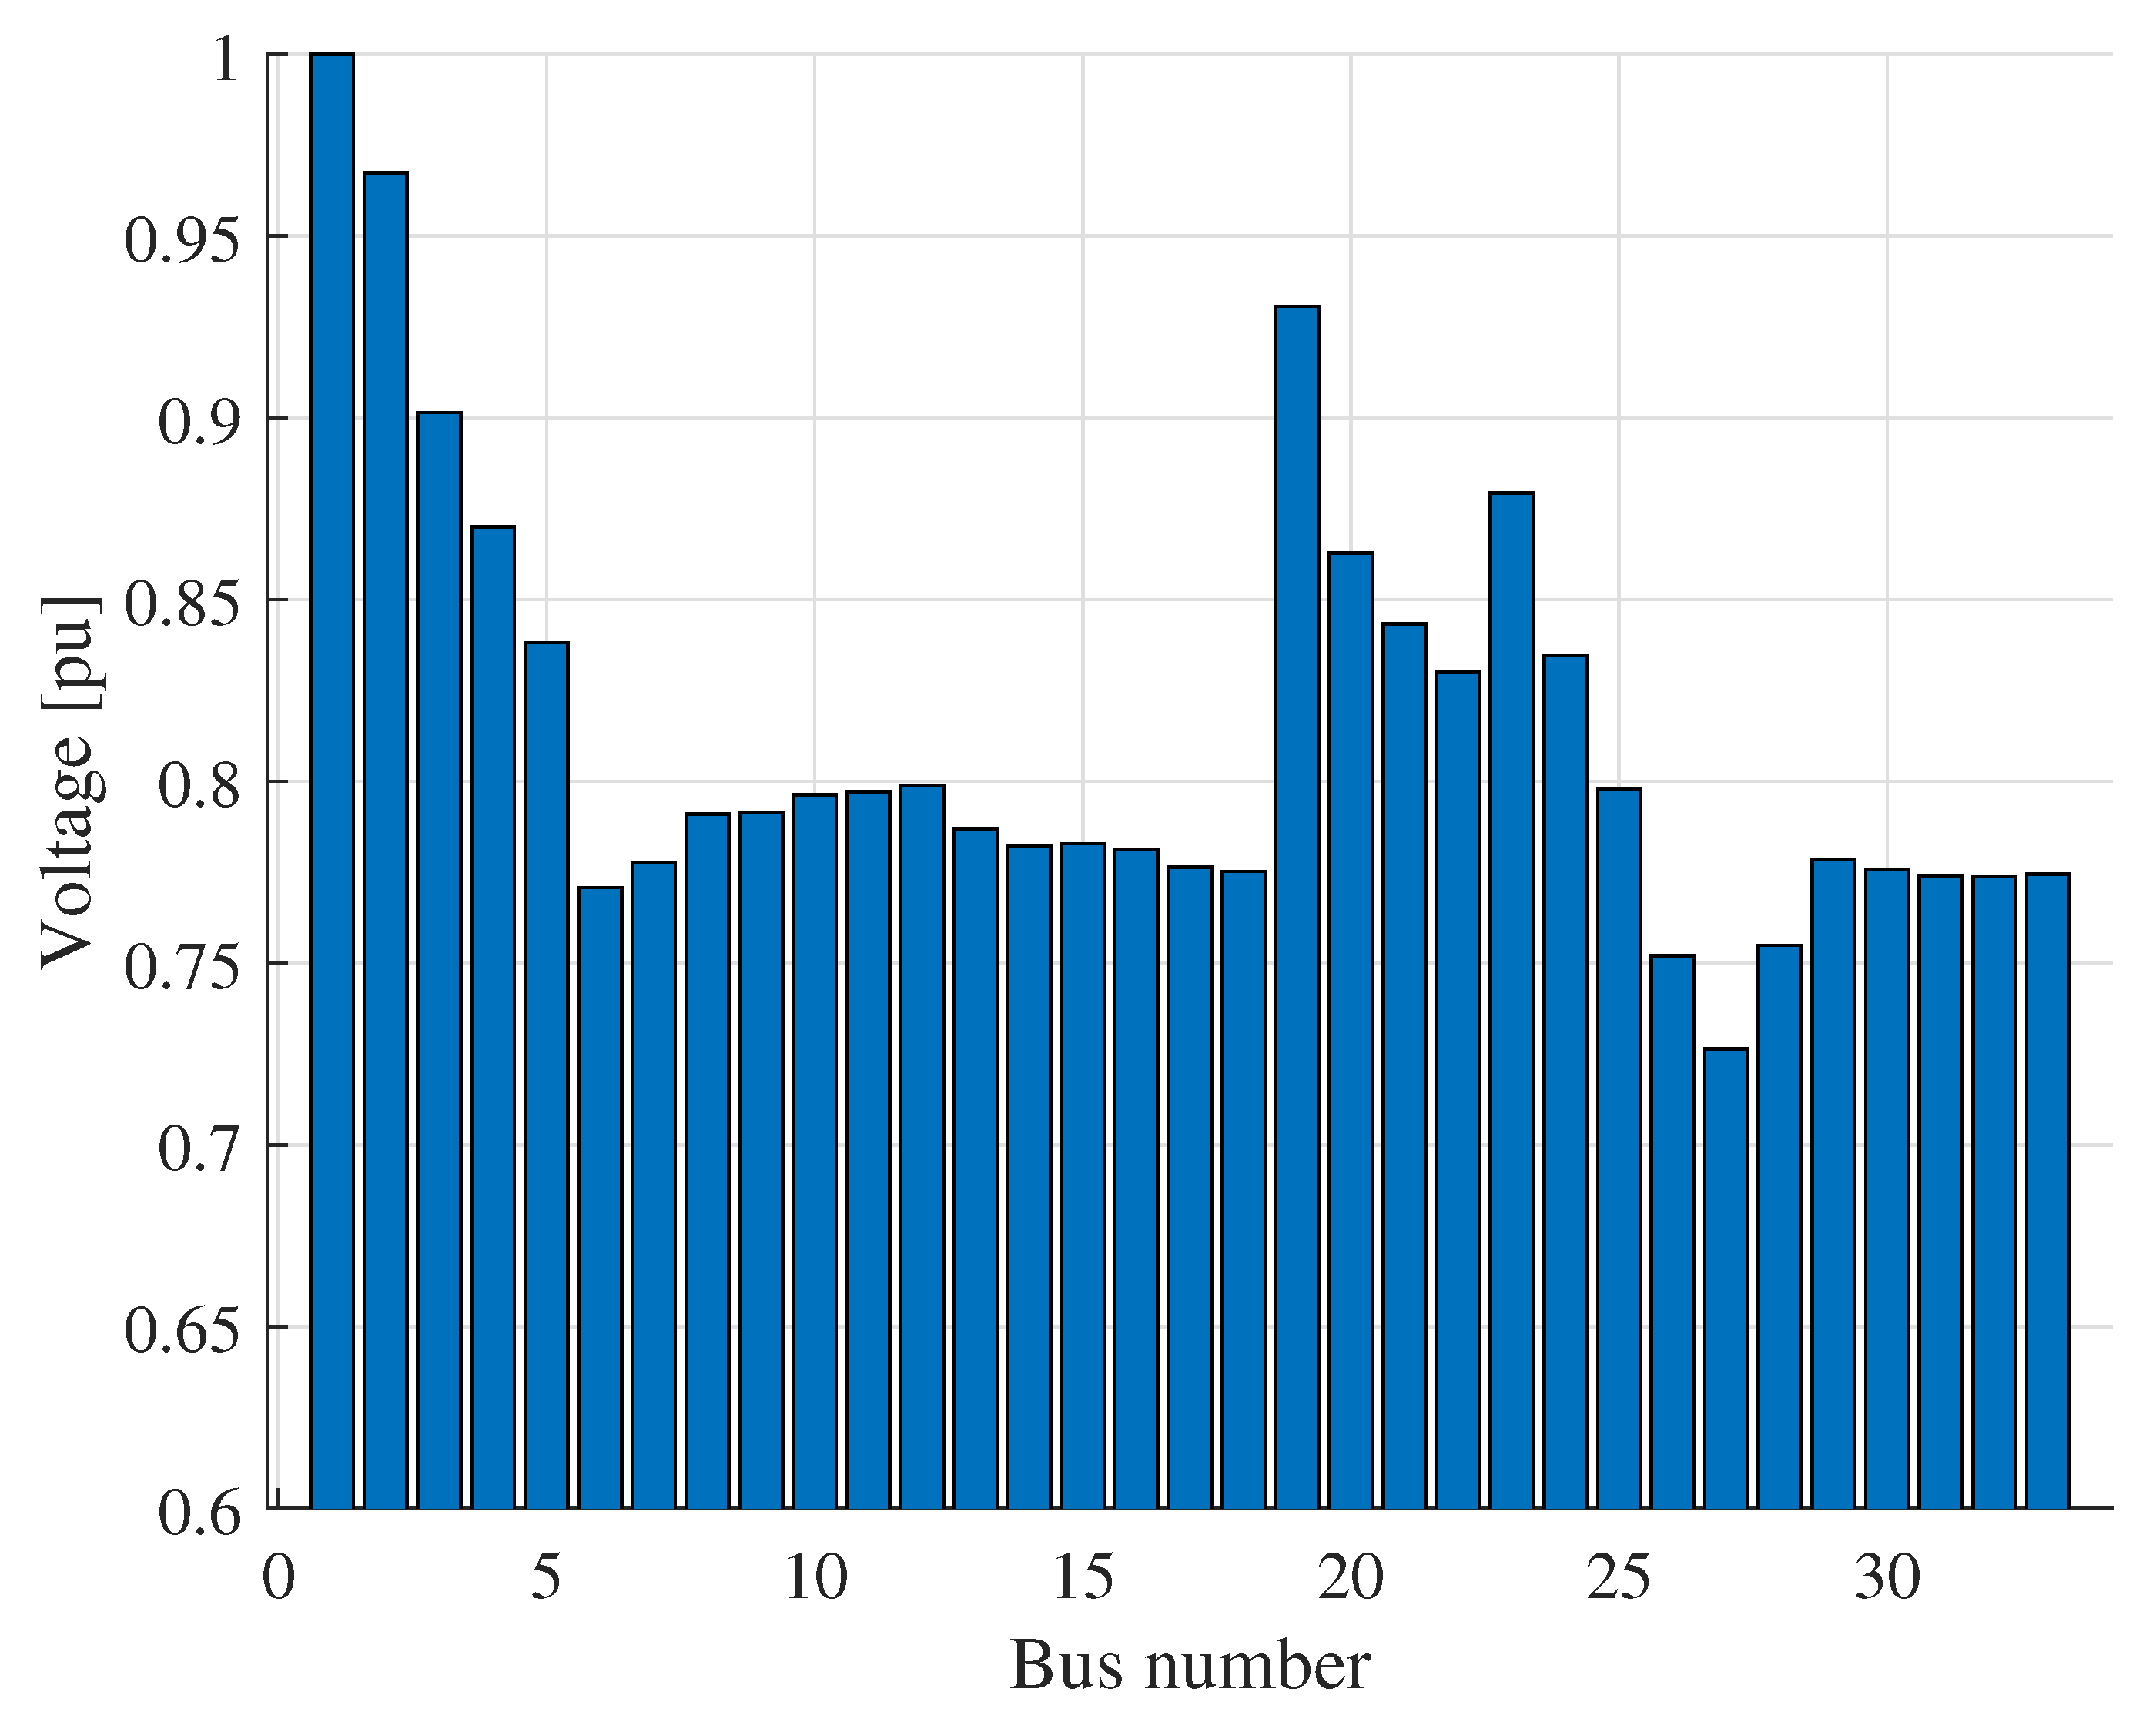
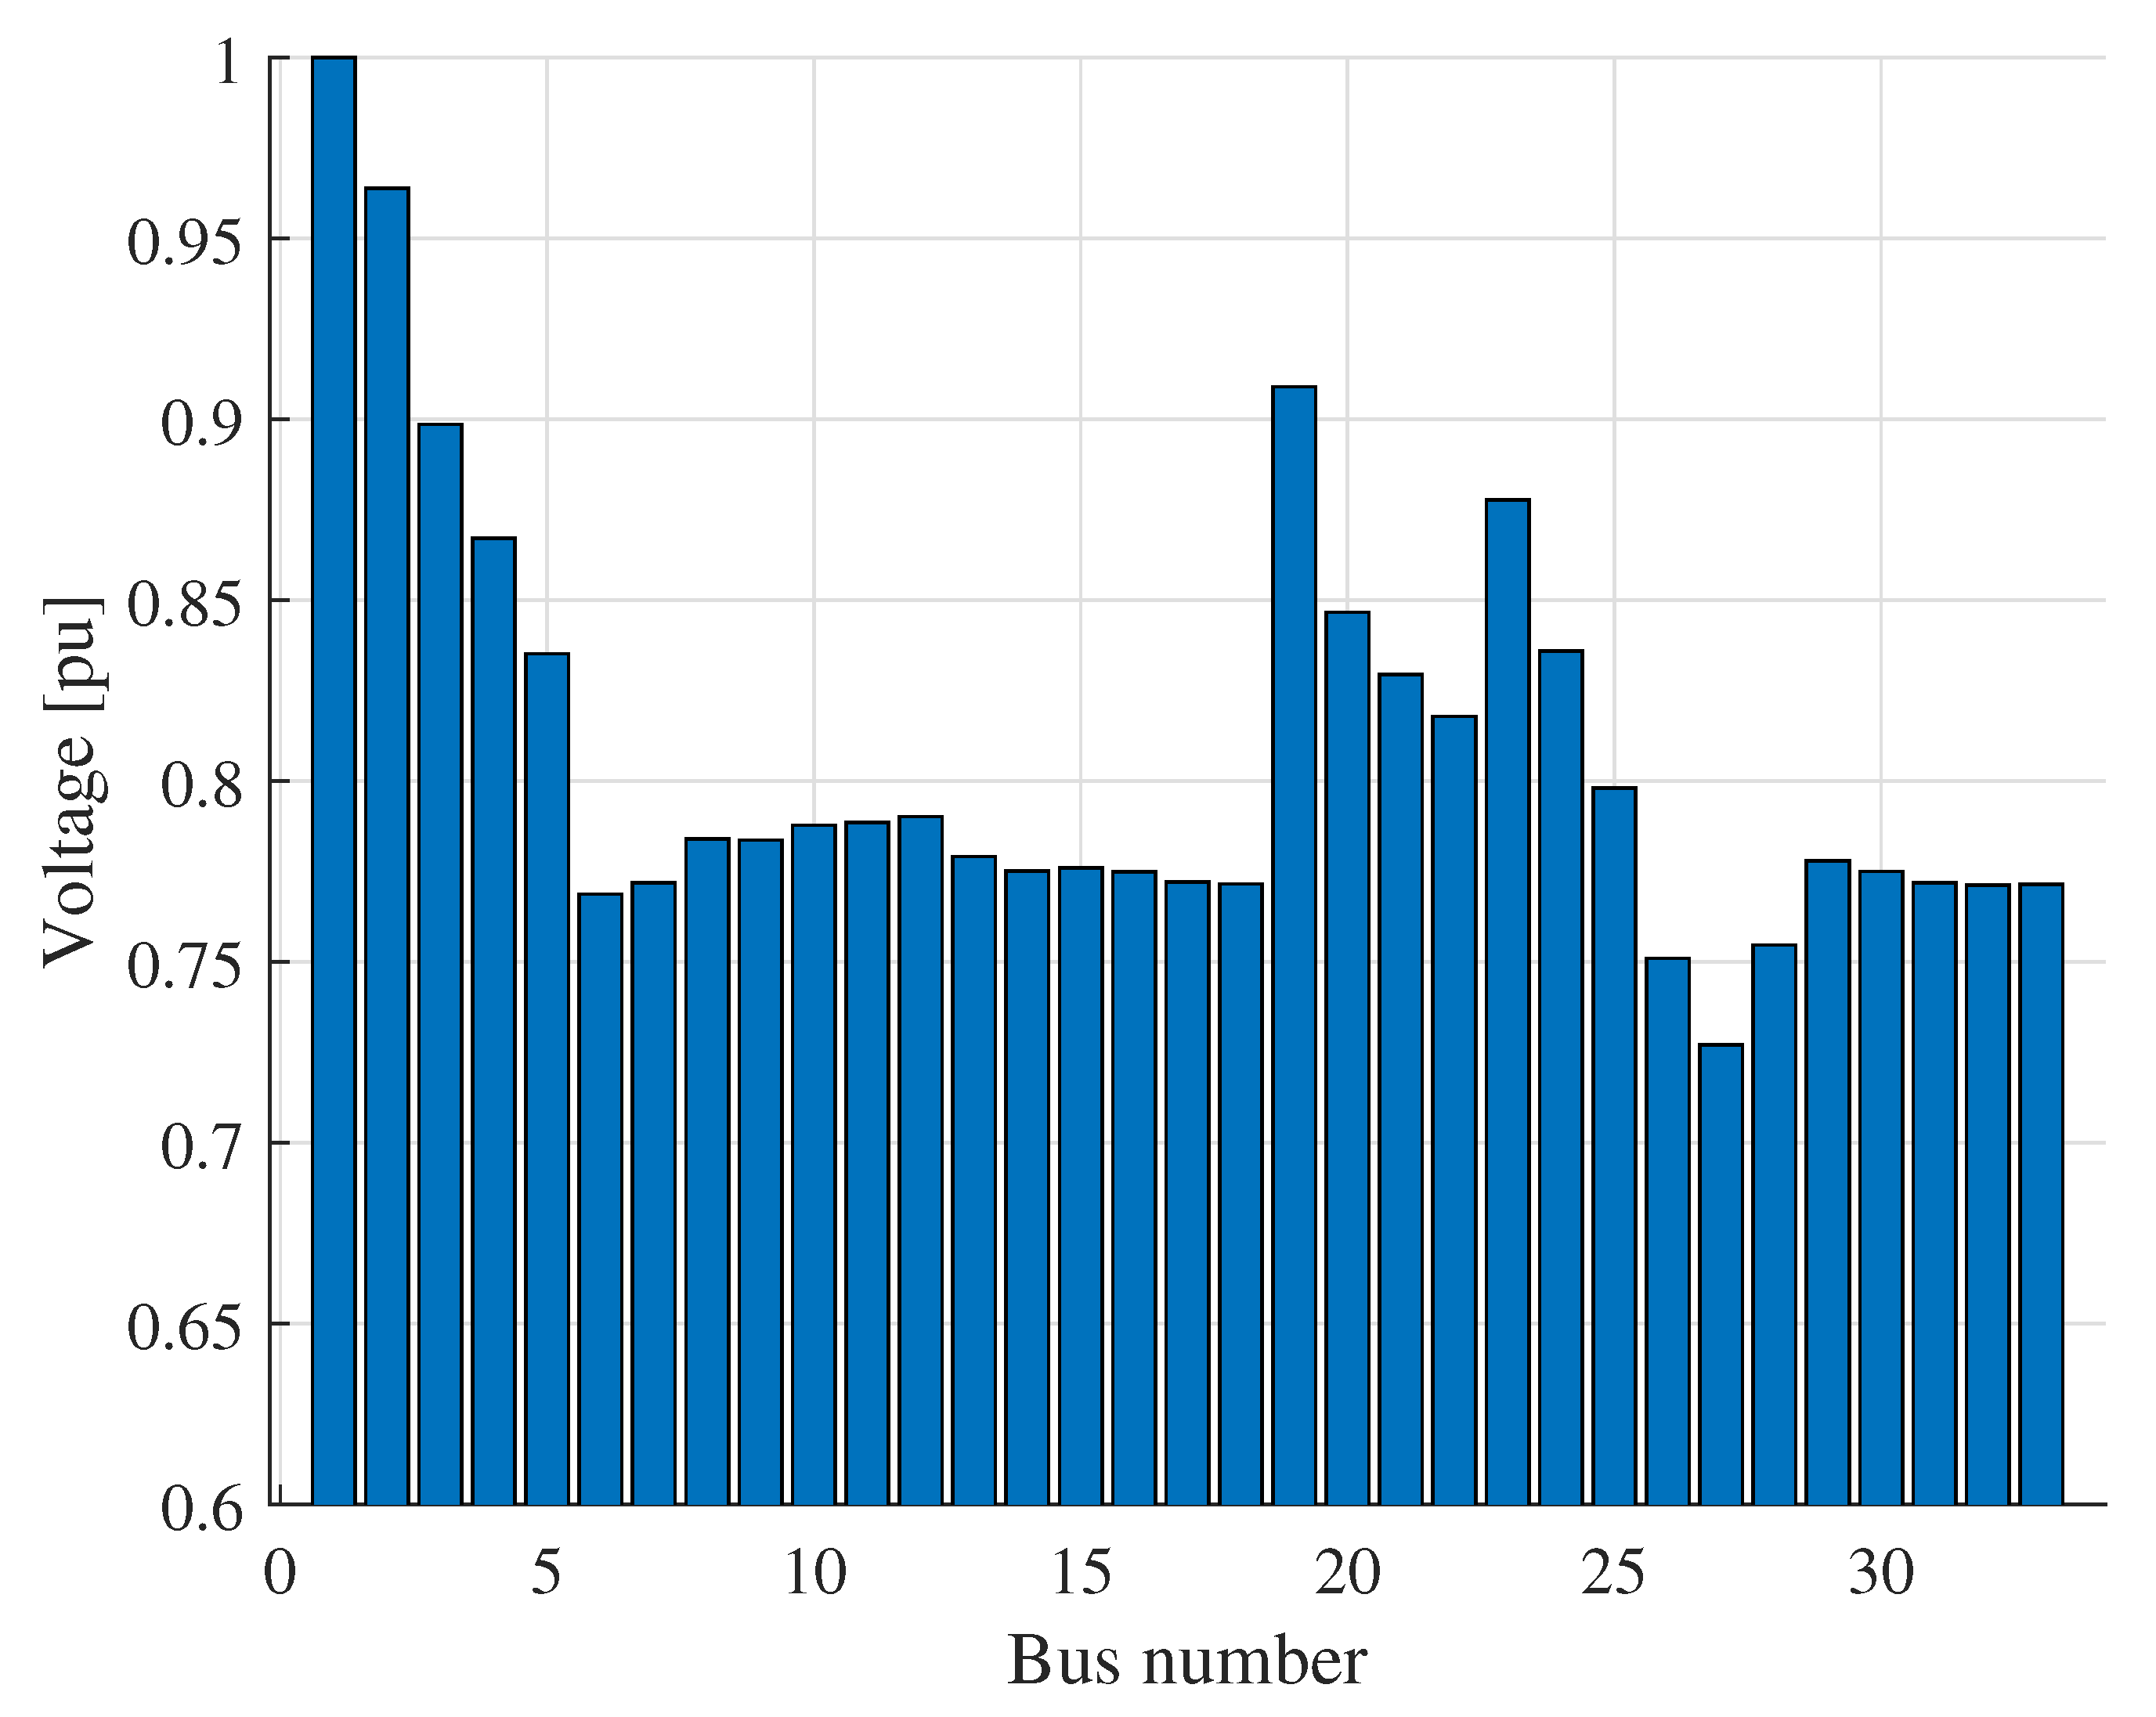
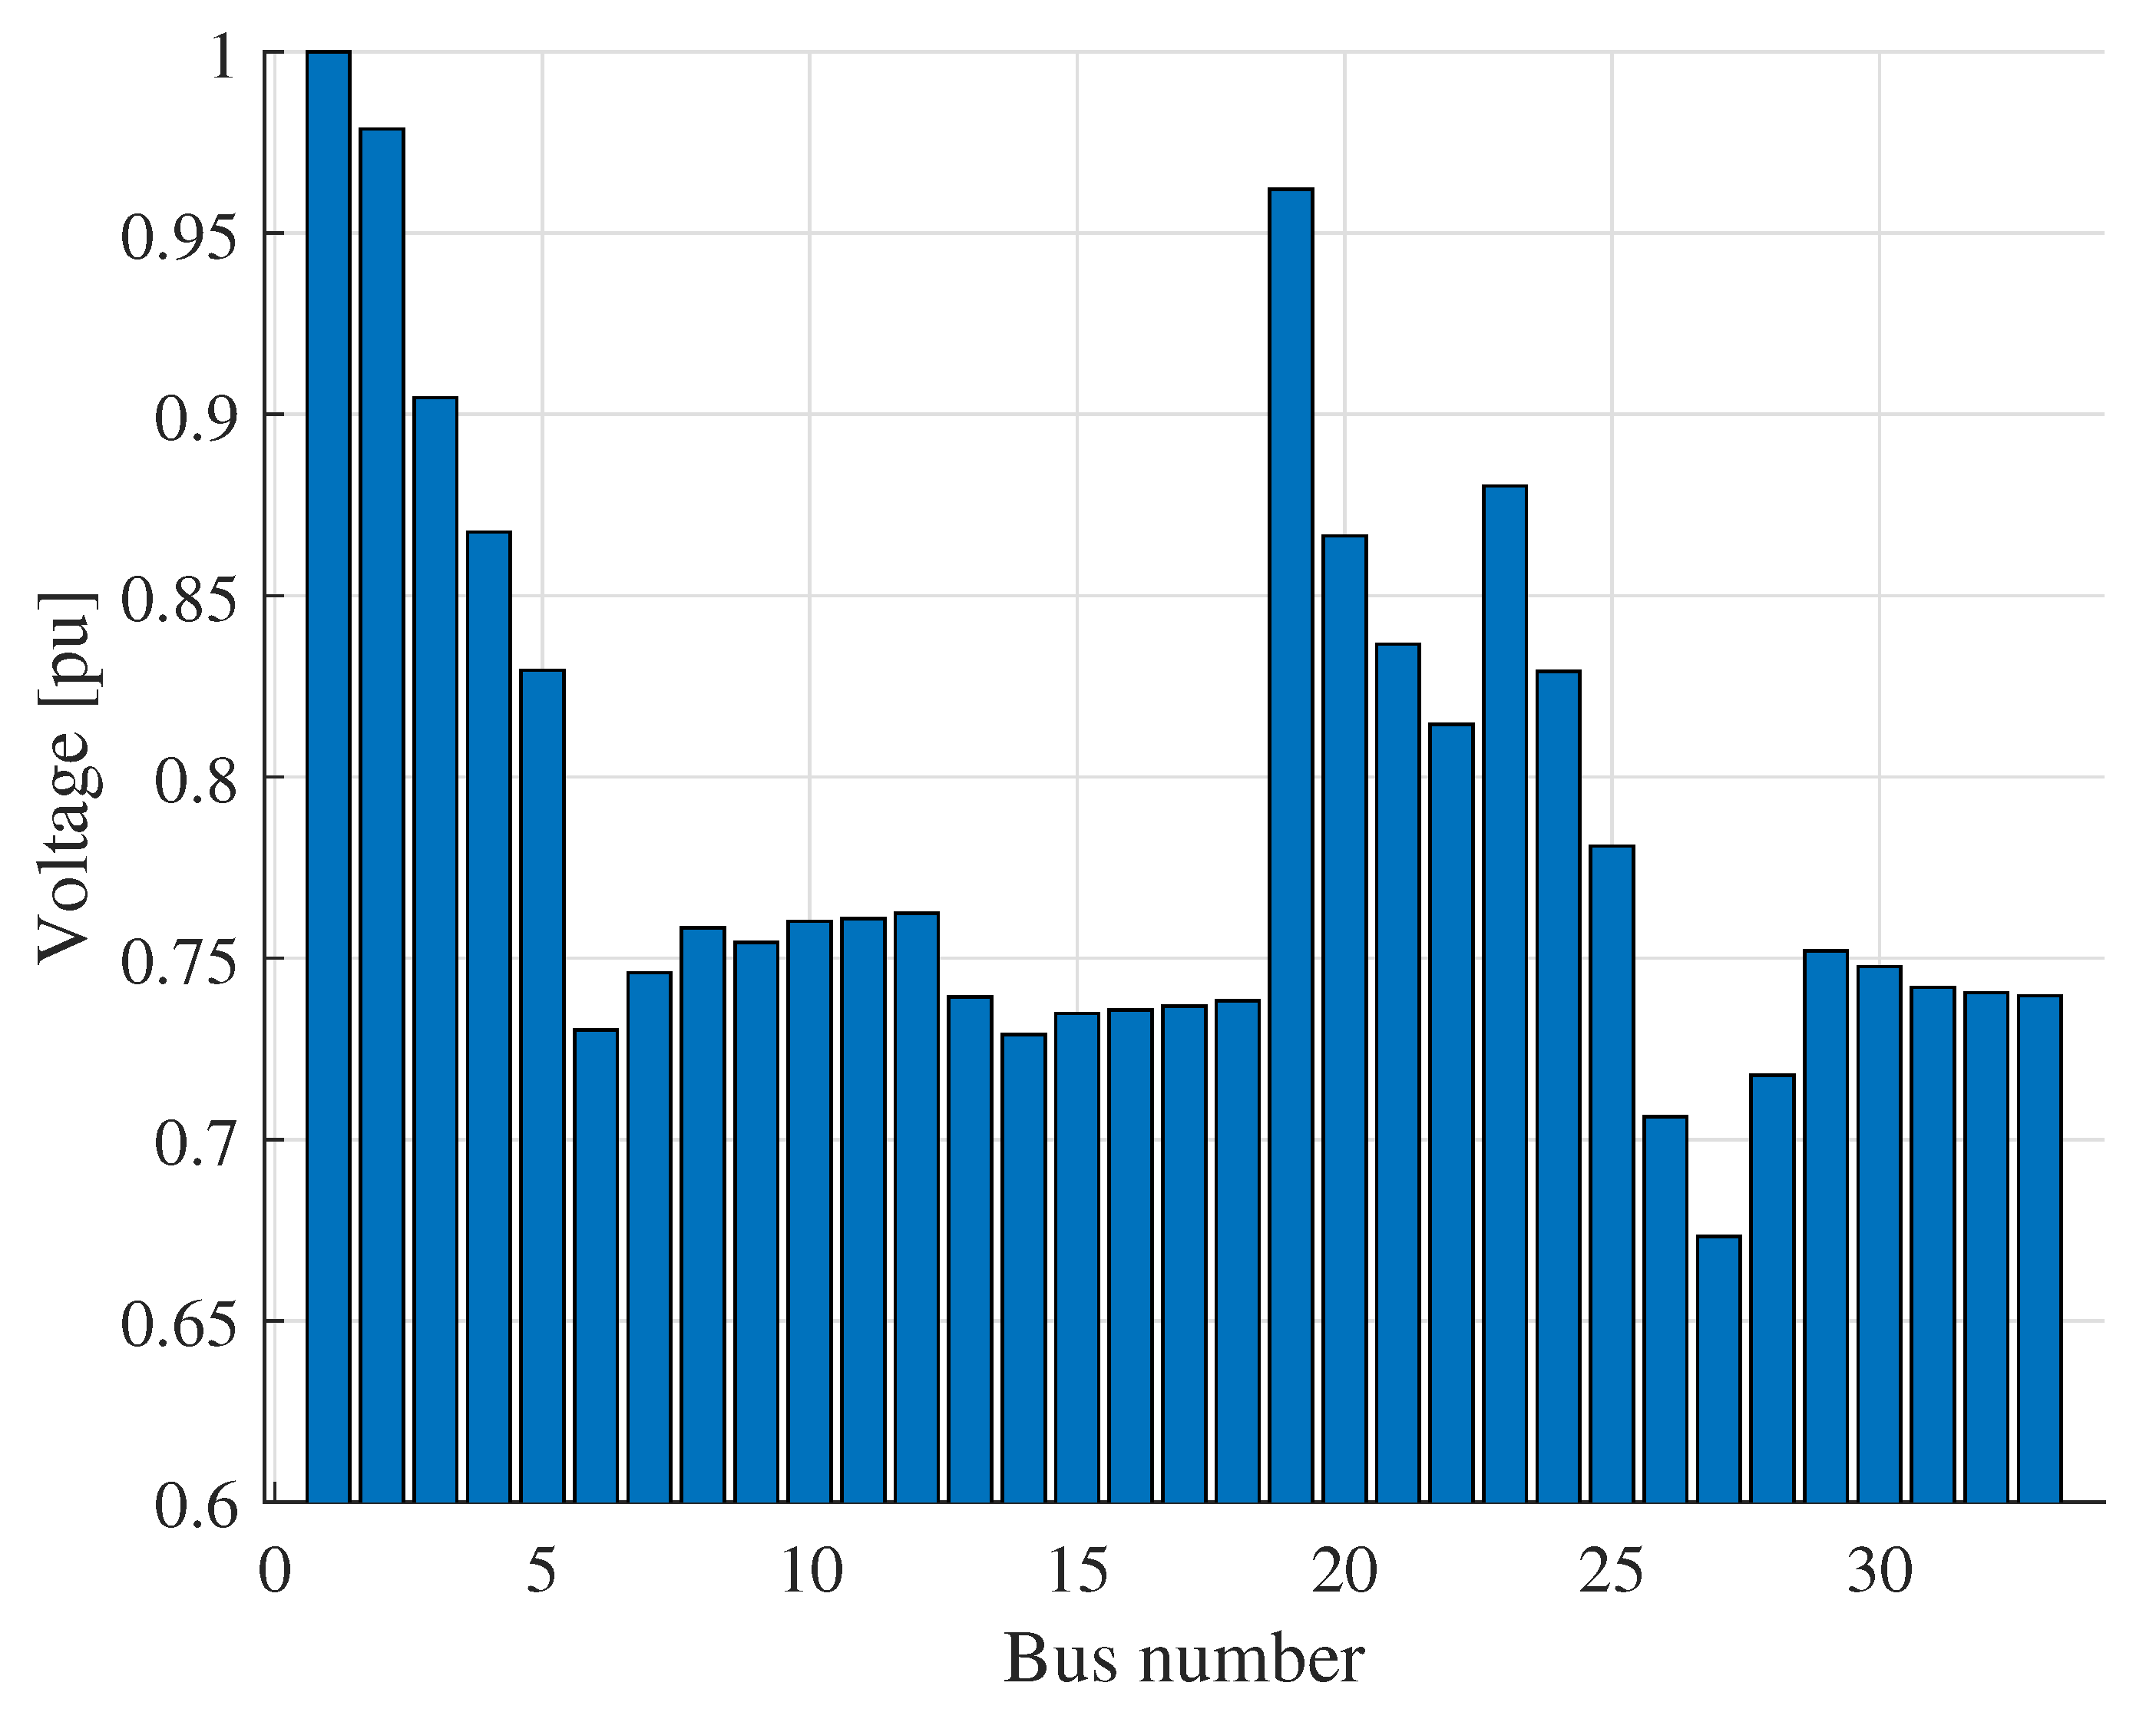
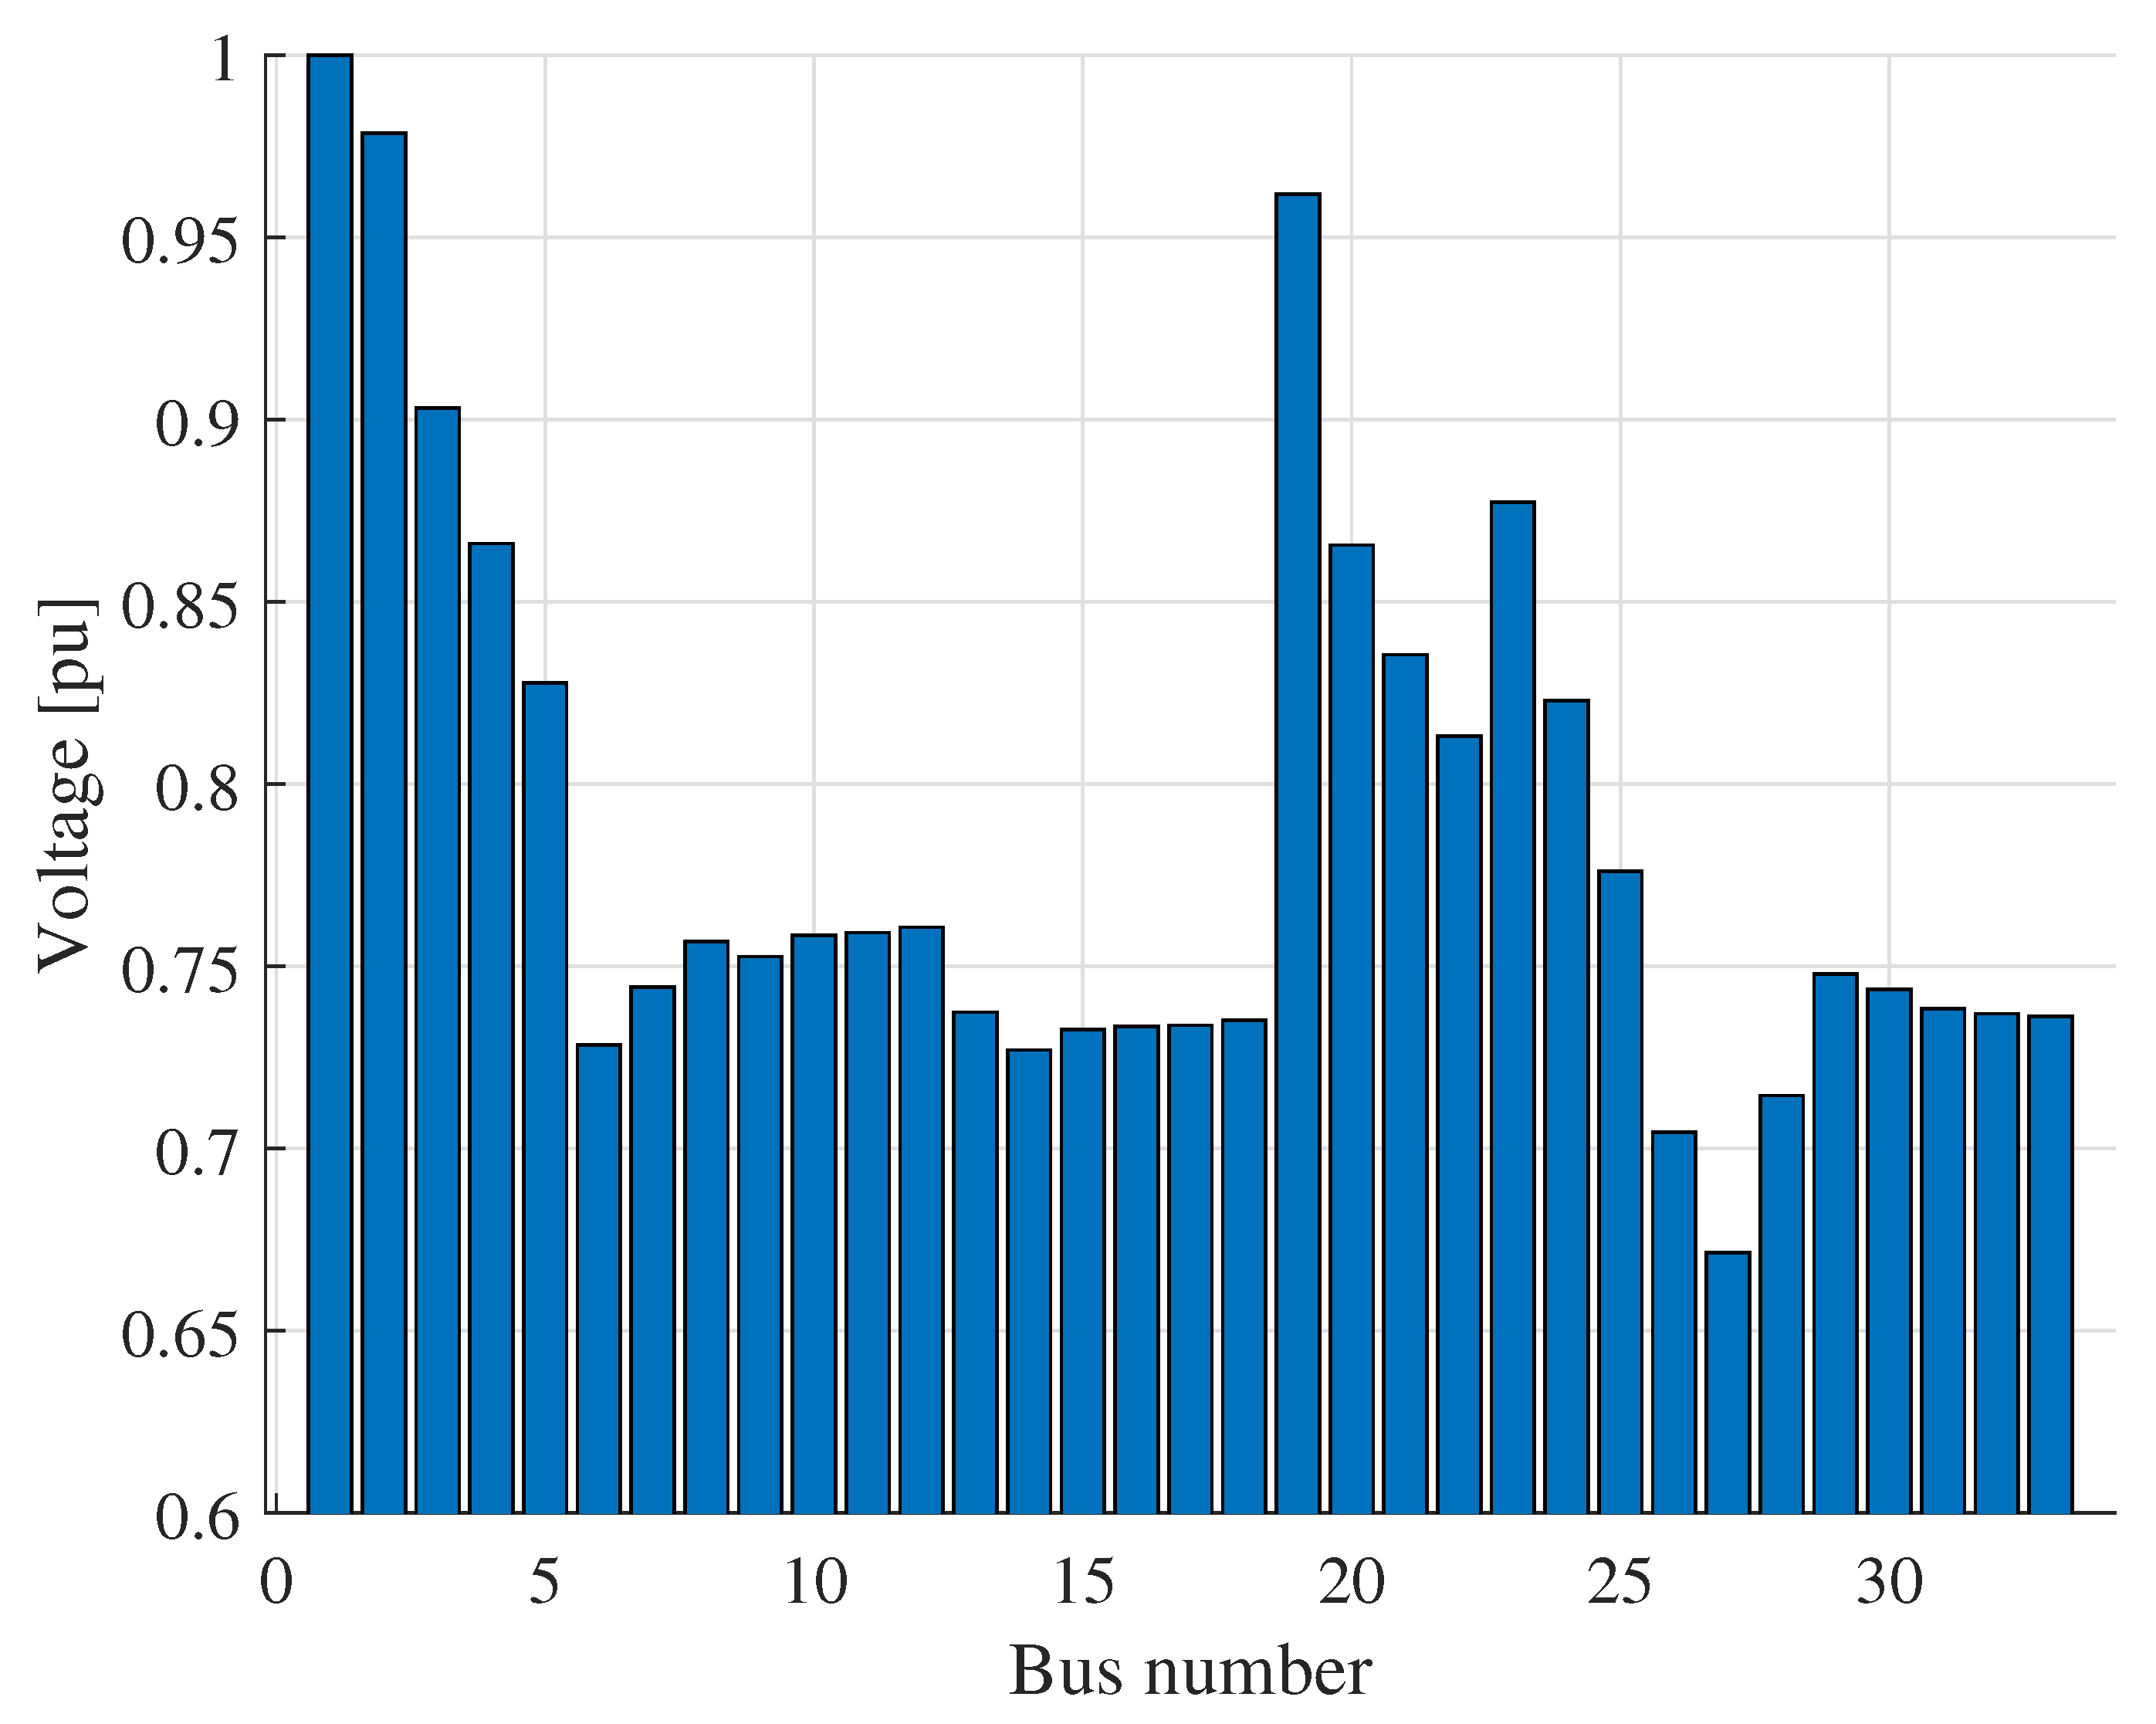
To better understand the impact that nonlinear loads have on the network, the voltage profiles of the test system are analyzed under two scenarios. The first is the voltage analysis with nonlinear loads present in the system (Figure 6), and the second is the analysis when DG is integrated into the system (Figure 7). Figure 8 shows the voltage levels of each bus in the system with the nonlinear loads in operation.
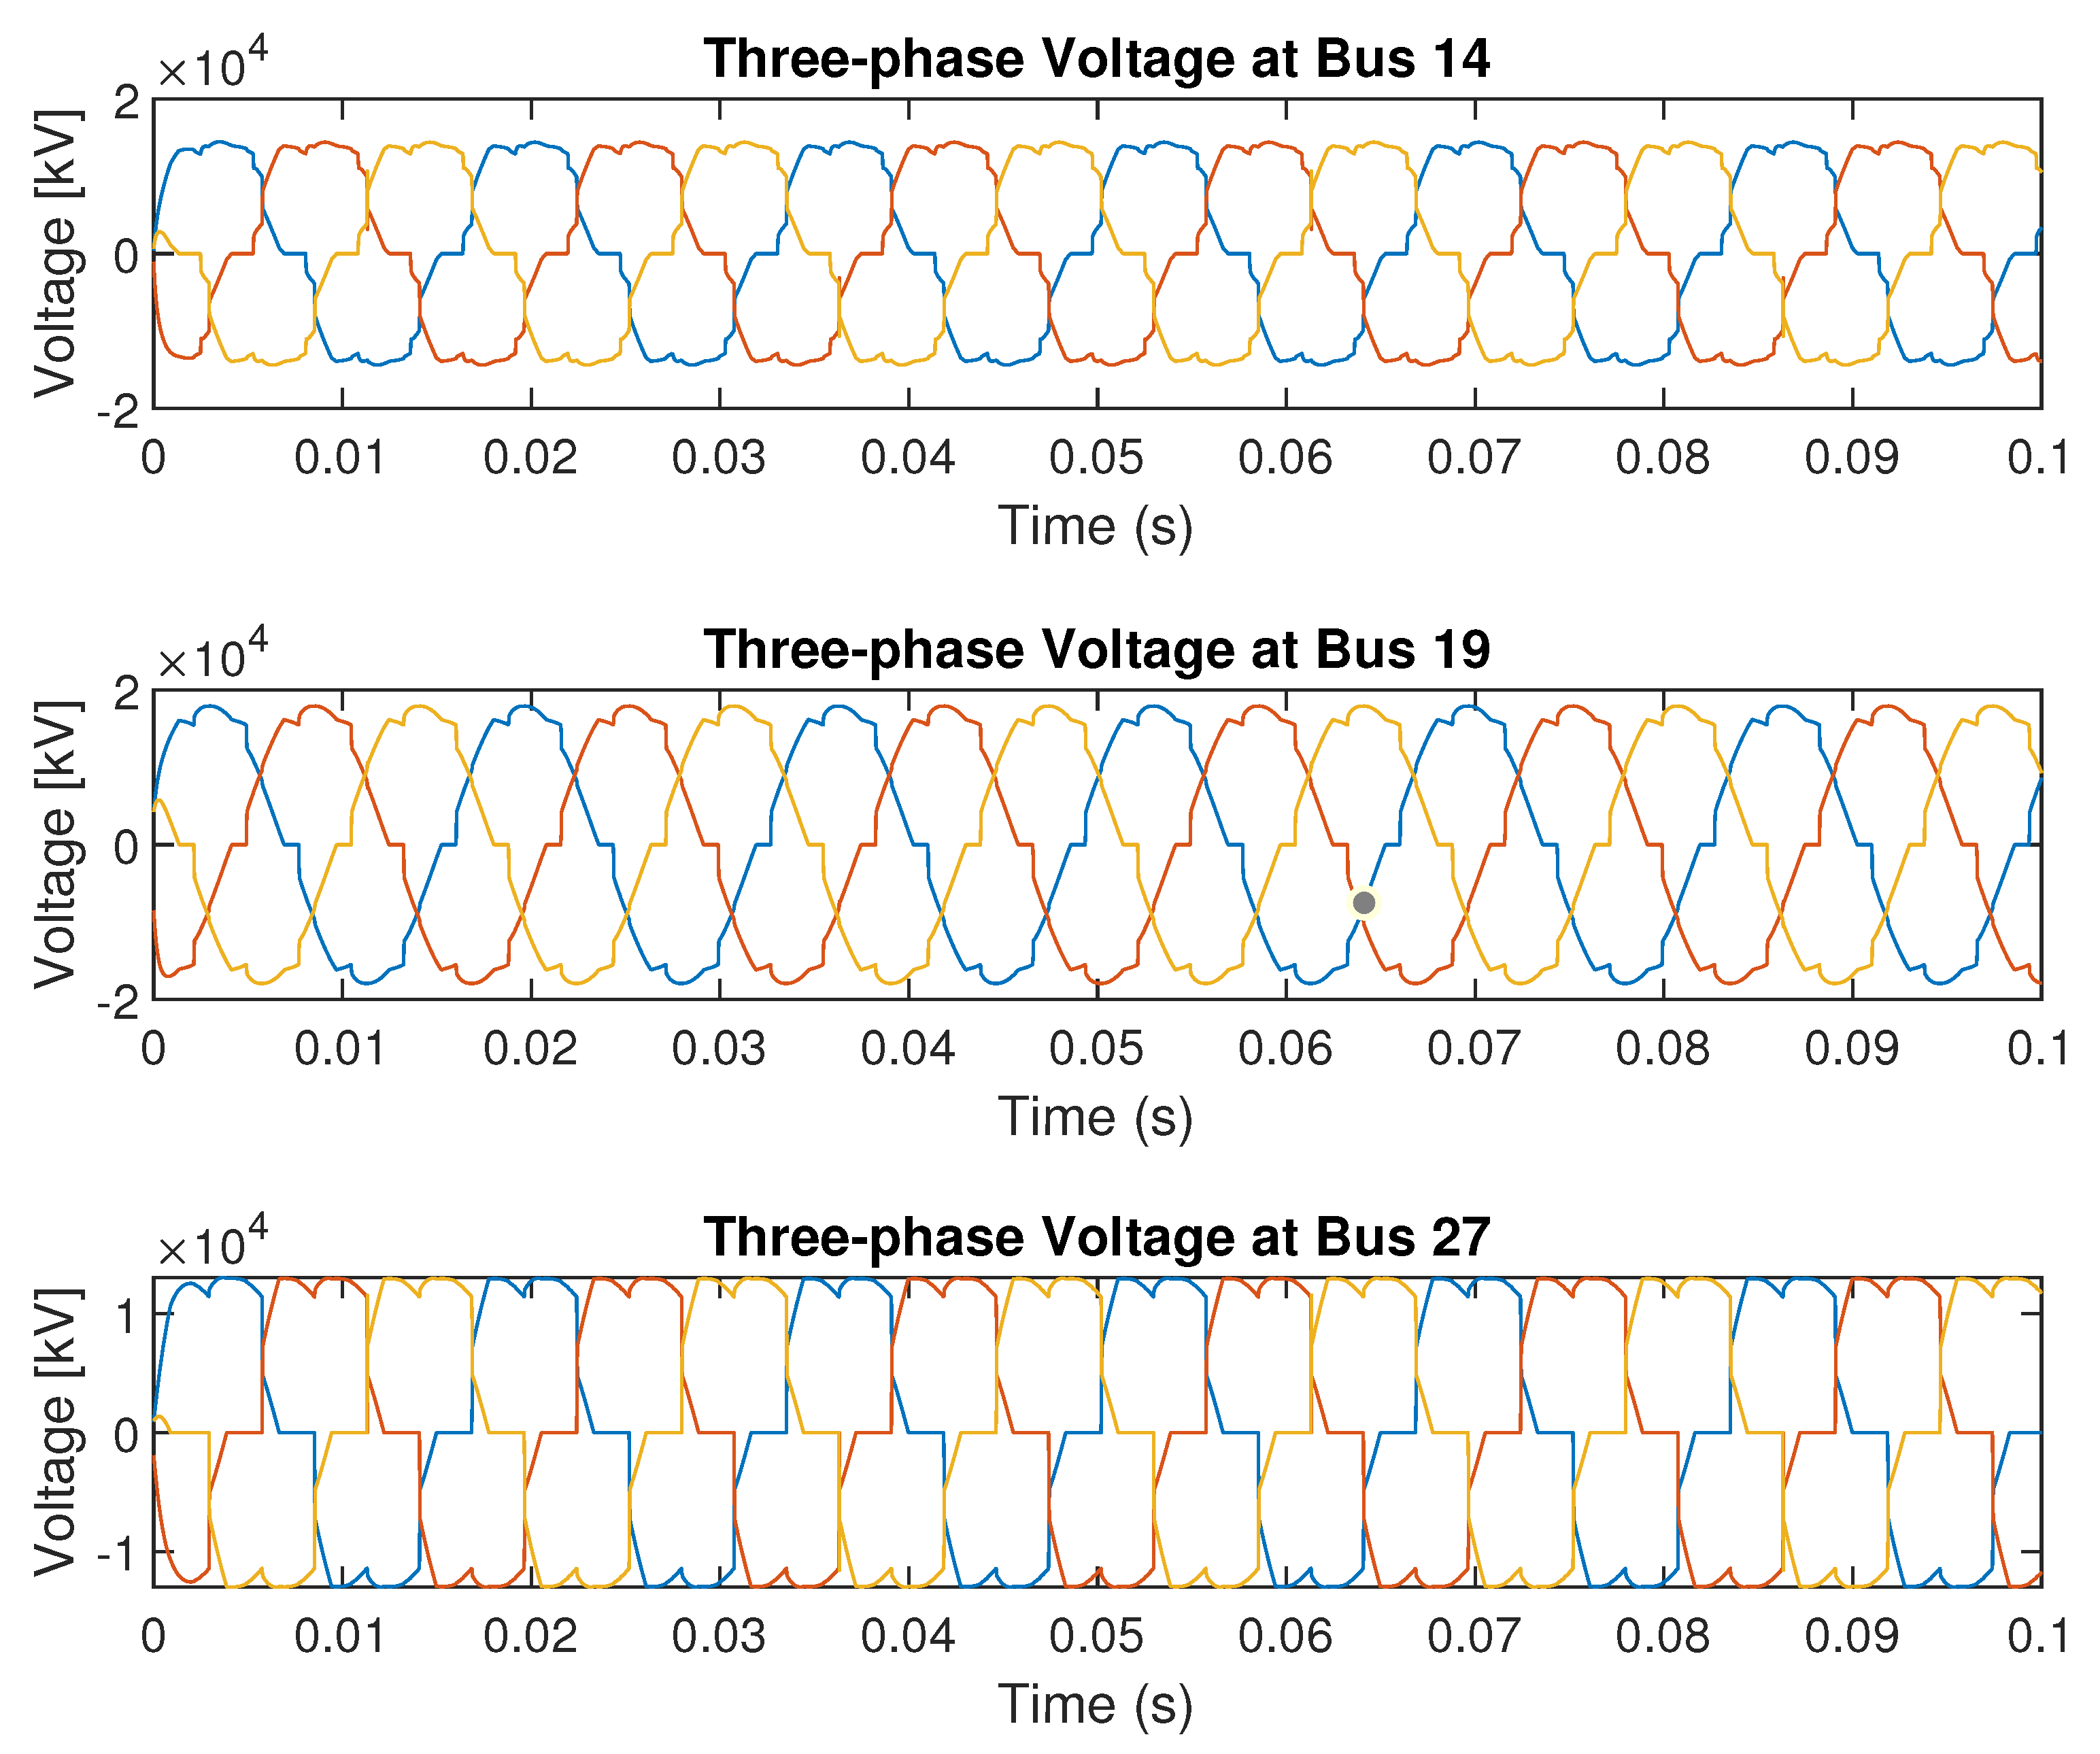
The voltage levels of each node in the system are presented in per unit (p.u.) values, using the nominal system voltage of 13.8 kV as the base value. Additionally, the waveform and THDv levels at each bus with nonlinear loads are evaluated. Figure 9 displays the three-phase voltage waveforms at buses 14, 19, and 27.
As shown in Figure 9, the presence of nonlinear loads significantly distorts the sinusoidal waveform. Furthermore, Figure 10 illustrates the voltage harmonics at bus 14, where the recorded THDv is 16.52%, a value that exceeds the permissible limit defined by regulatory standards.
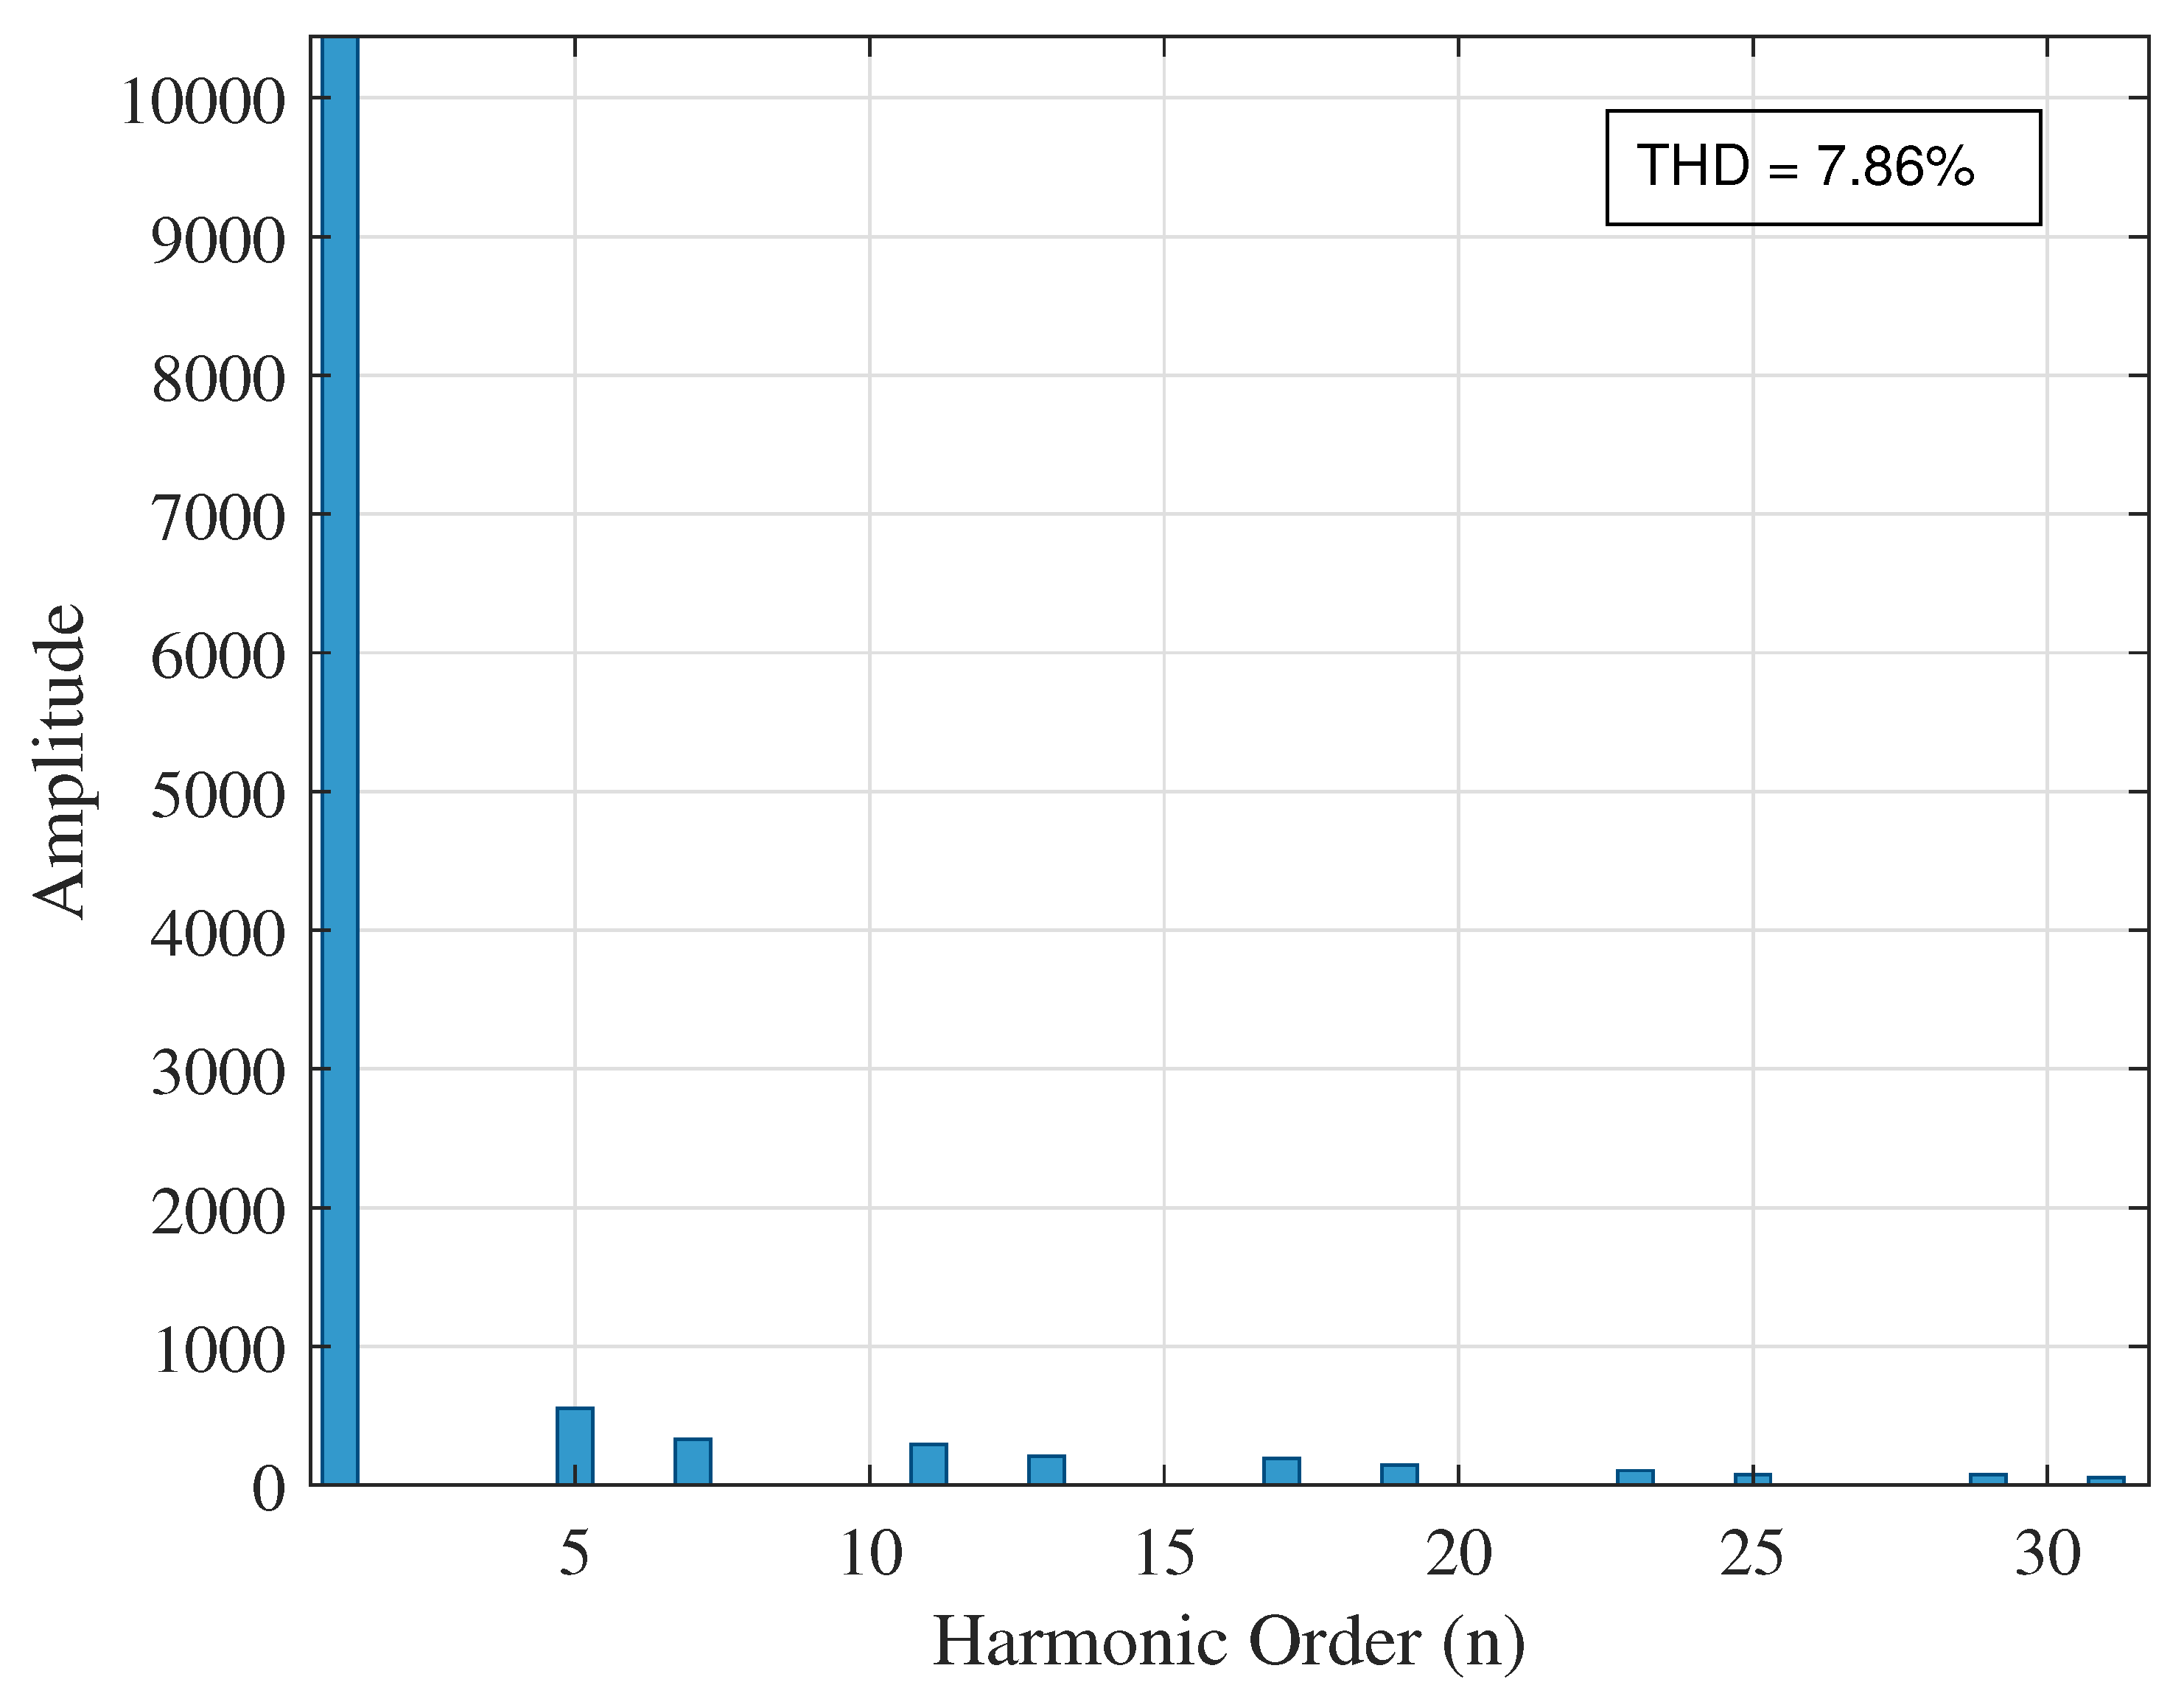
Figure 11 shows the THDv levels at bus 19, where the harmonic distortion reaches 7.86%.
Finally, to complete the analysis of this scenario, the THDv level at bus 27 is determined, as shown in Figure 12. This bus exhibits a recorded harmonic distortion of 23.29%.
Analyzing the THDv levels present at the buses with nonlinear loads, it is evident that these do not comply with the requirements established by the ARCERNNR 002/20 regulation. Therefore, the need to implement power quality improvement devices in this type of network becomes clear.
The second scenario mentioned previously corresponds to the analysis of voltage profiles when DG is integrated into the system (Figure 7). The voltage values for this condition are presented in Figure 13.
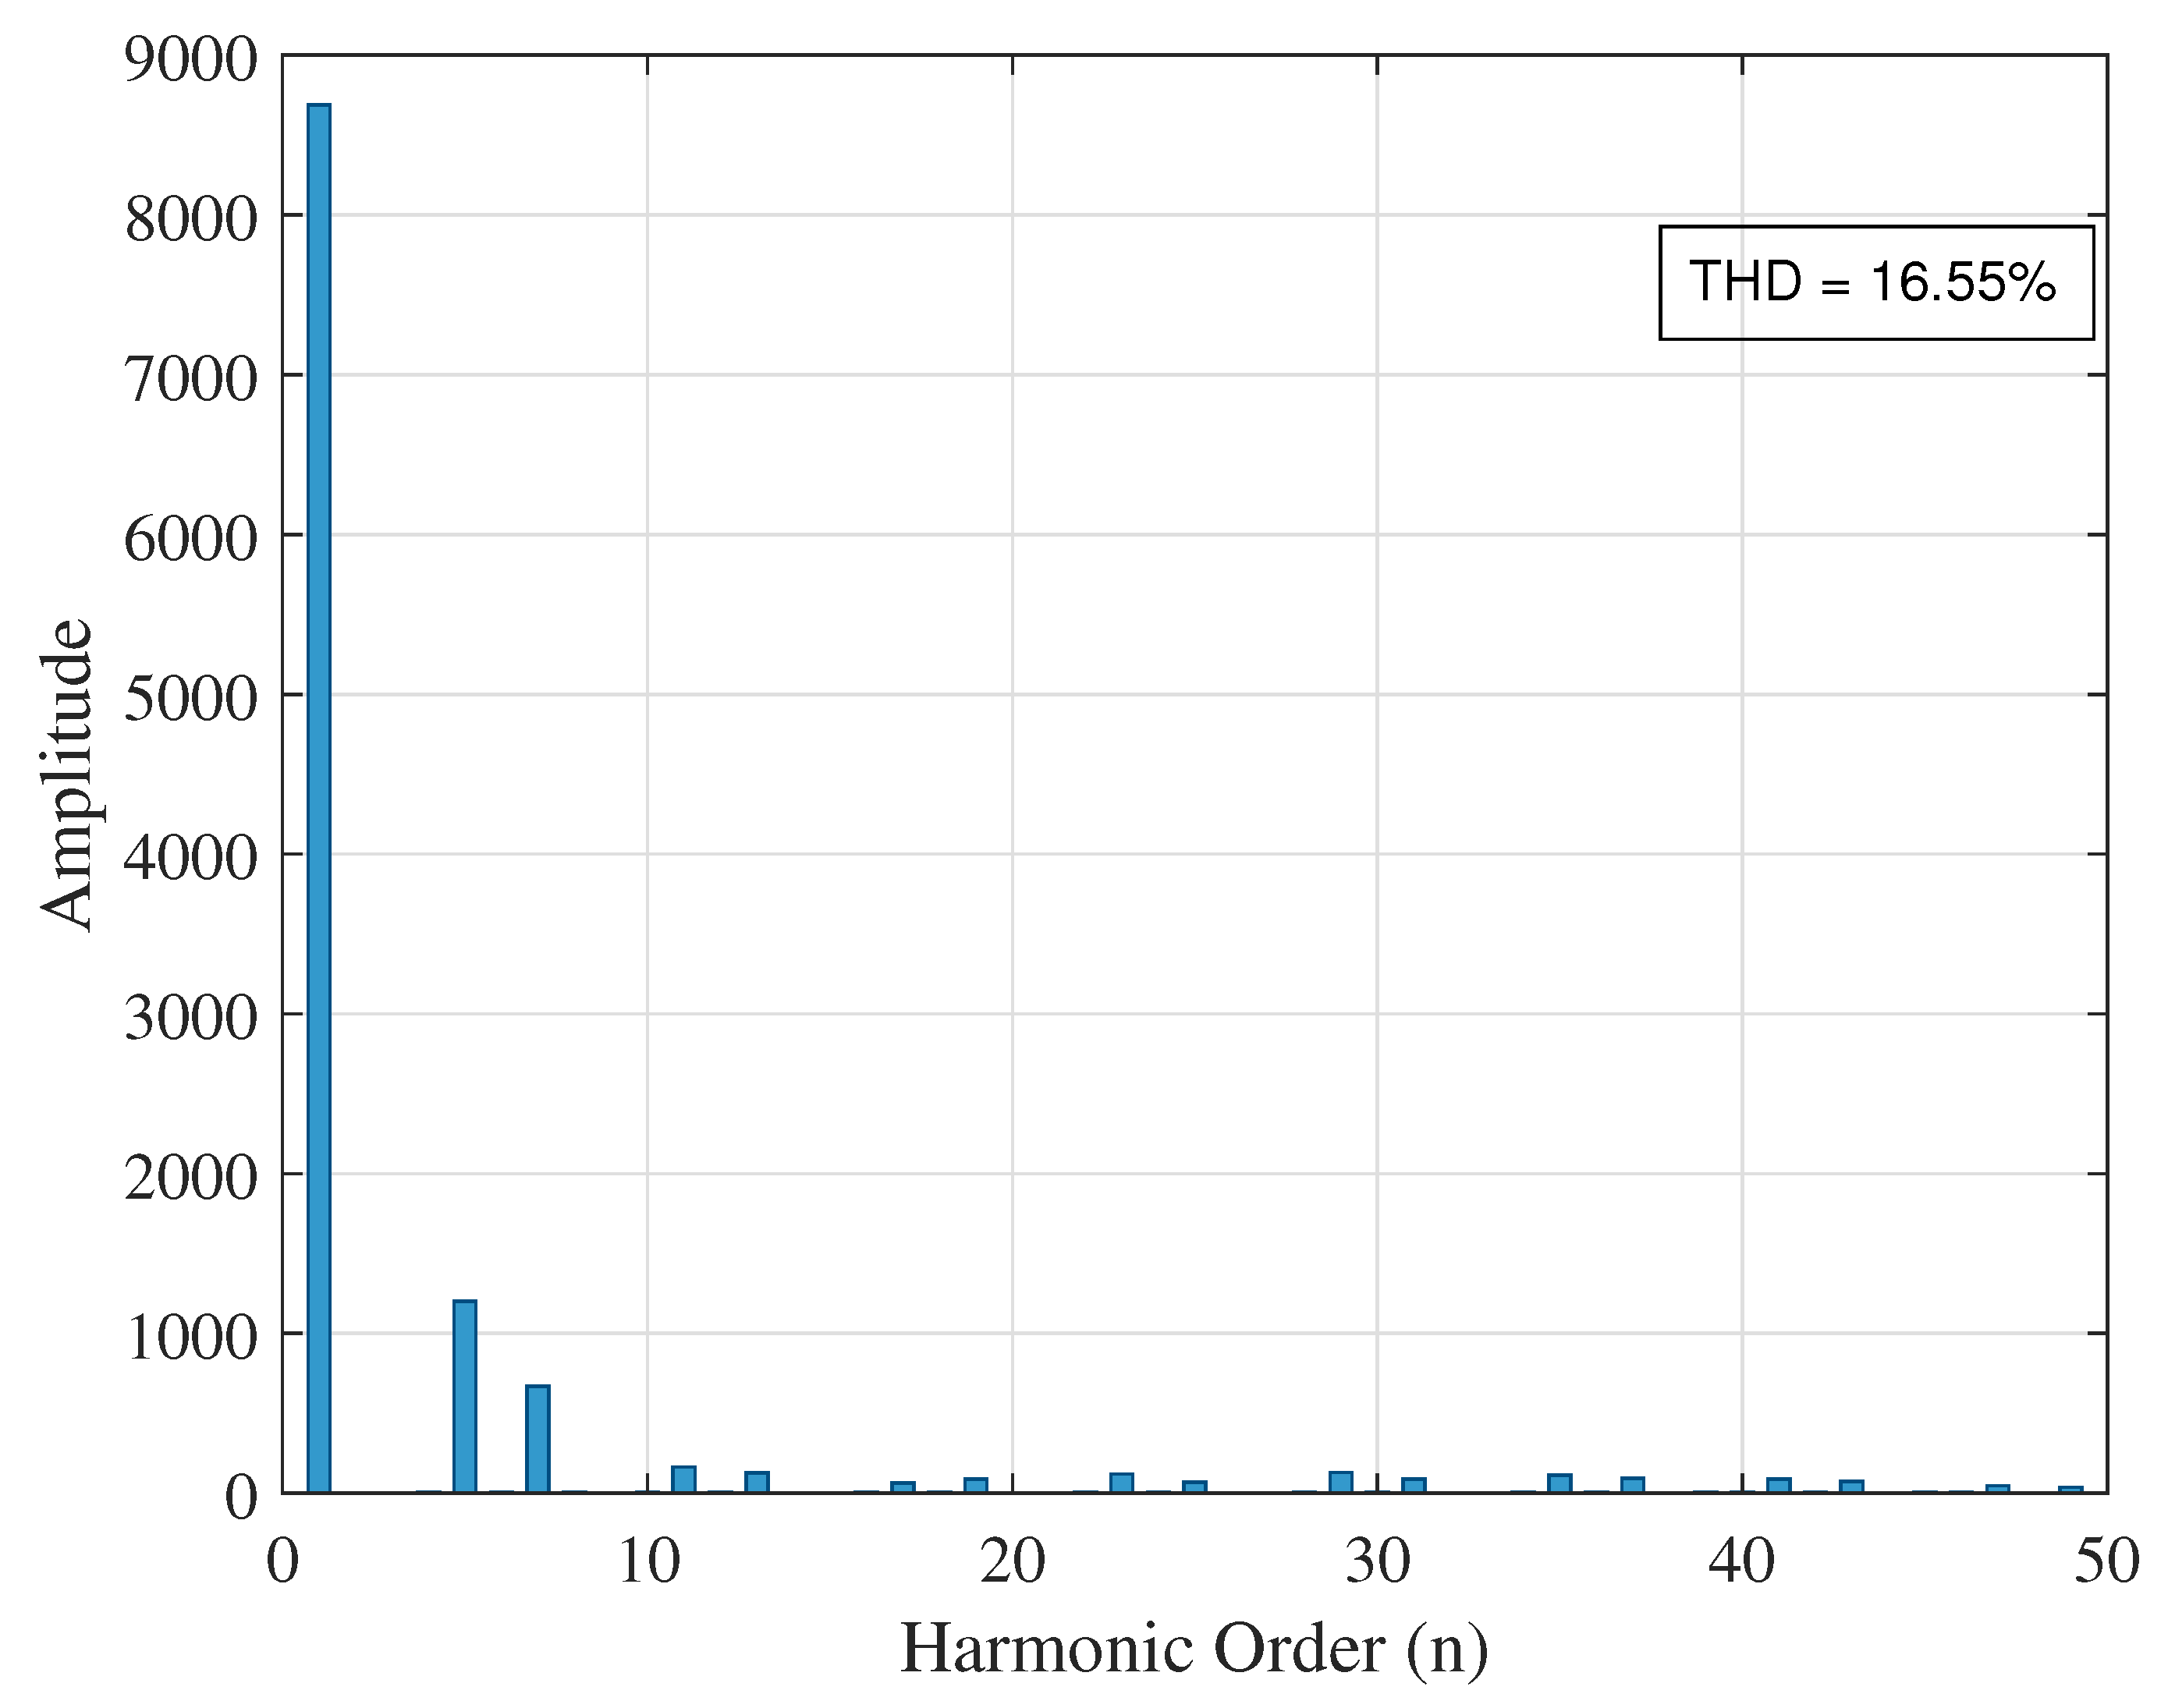
Based on Figure 13, it can be observed that the voltage levels of the system with DG integration do not exhibit significant variations. Slight changes are only noted in the THDv levels at the buses with nonlinear loads, as illustrated in Figure 14.
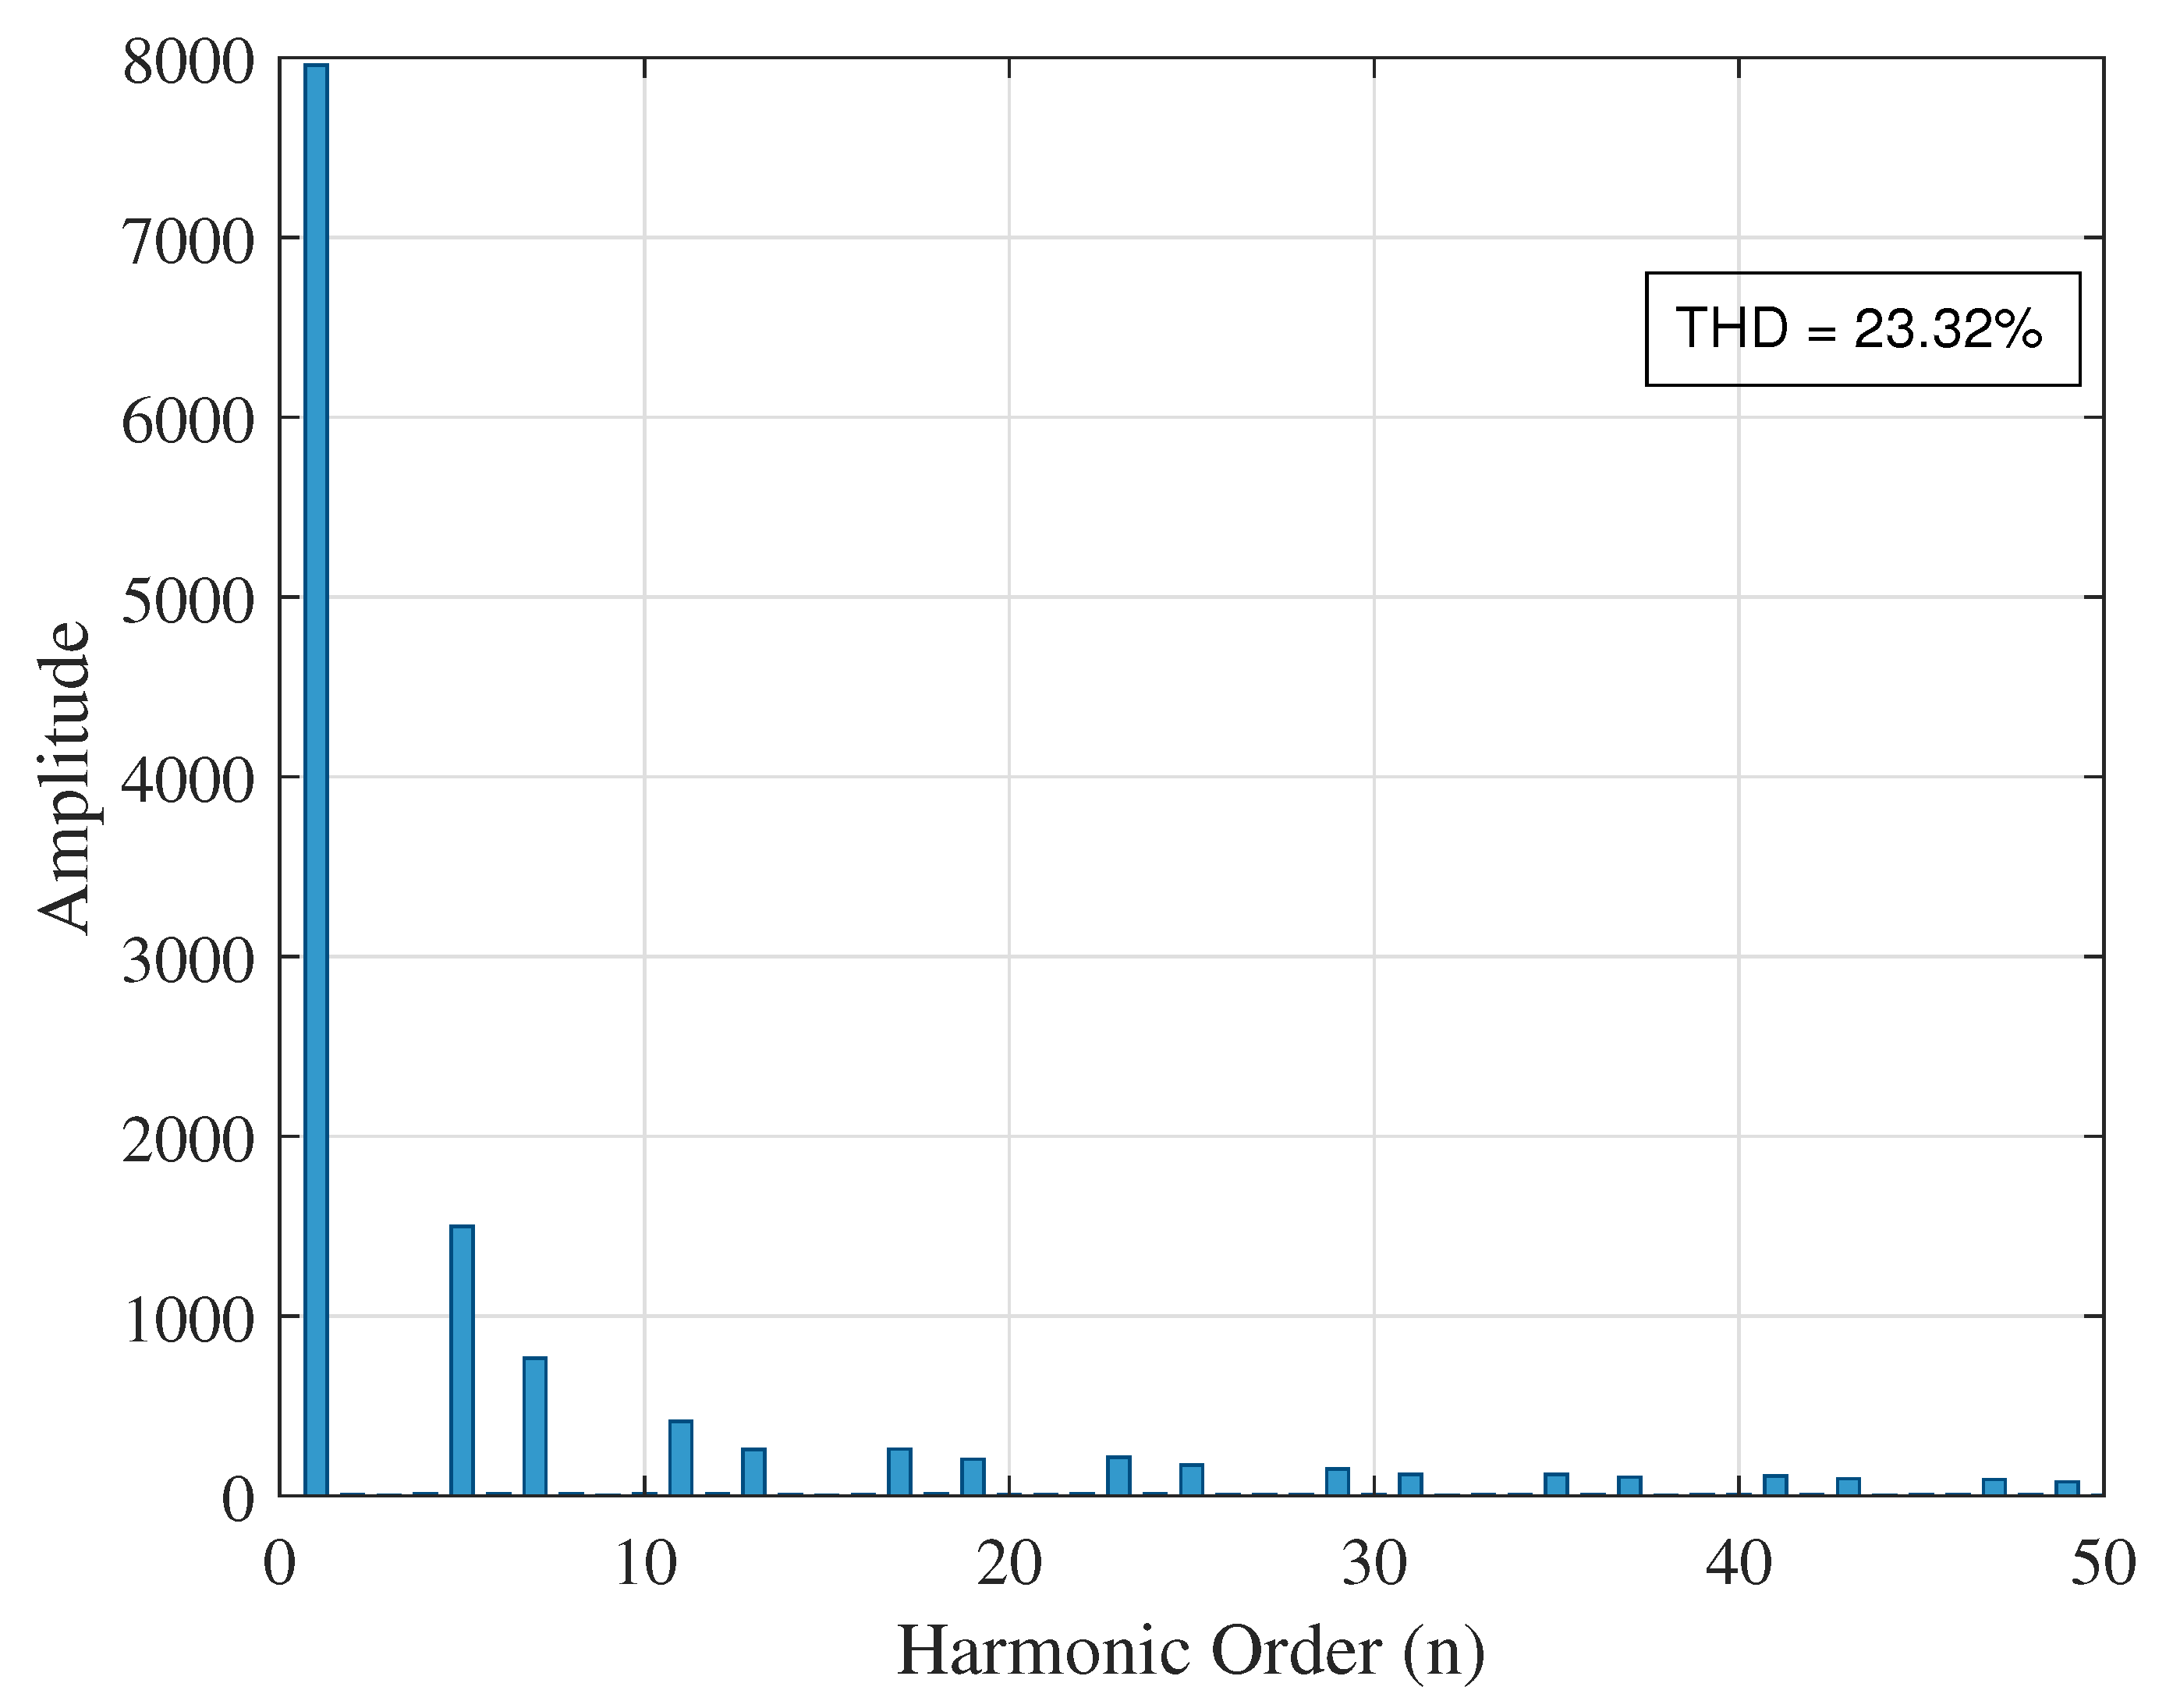
These changes are not significant, as their values are quite similar to those obtained in the previous scenario. To confirm this, Figure 15 and Figure 16 show the THDv levels at buses 19 and 27, respectively.
As verified in the previous figures, there is no significant difference between the two scenarios analyzed. However, it is possible that the inclusion of DG may influence the optimal placement of the power quality conditioner. This will be verified in the case studies presented in the next chapter. Additionally, the data obtained here will serve as a baseline for analyzing the improvement in THDv with the inclusion of the UPQC in each case study.

4. Case Studies

This study is based on the premise of optimally placing the UPQC in a distribution system. To this end, two case studies are proposed and detailed in this section.
Before presenting the case studies, it is important to clarify how the optimal placement of the device within the system is determined. For this purpose, the weighted cost objective function ( J ( x ) ) is employed. This function enables the identification of the optimal bus for installing the UPQC, where the best voltage profiles and THDv values are achieved.

4.1. Case 1

This case corresponds to the test system previously described, with nonlinear loads connected at buses 14, 19, and 27. For better understanding, the schematic of this system is presented in Figure 6.
Using exhaustive search, the UPQC is placed iteratively at each of the nonlinear load buses in order to evaluate the resulting changes in THDv and determine which location yields the lowest DPV.

4.2. Case 2

This analysis considers the test system with the inclusion of DG composed of a 3500W photovoltaic system. The schematic diagram of this configuration is the one shown earlier in Figure 7.
As in the previous scenario, exhaustive search is used to determine the optimal placement of the UPQC within this network topology. The aim is to assess whether the presence of such a microgrid affects the optimal location of the power quality improvement device compared to the previous case.

5. Results and Analysis

This section presents the results corresponding to the case studies defined in the previous chapter. These results demonstrate the impact of the UPQC on the test system, particularly in terms of mitigating voltage variations and reducing THD caused by nonlinear loads.

5.1. Voltage THD Summary

Table 6 compiles the voltage total harmonic distortion (THDv) values at the critical buses (14, 19, and 27) for each studied scenario and UPQC placement. This compact presentation allows direct numerical comparison of the effect of device location on harmonic mitigation, while minimizing the space required to present the results. Bold values indicate the lowest THDv achieved at each bus within each case.
Table 6 shows that in Case 1 the lowest THDv values are obtained at bus 14 when the UPQC is installed at bus 14, at bus 19 when it is installed at bus 19, and at bus 27 when it is installed at bus 14. In Case 2, the best results for buses 14, 19, and 27 are achieved with installations at buses 14, 27, and 19, respectively.

5.2. Case 1

5.2.1. UPQC Installed at Bus 14

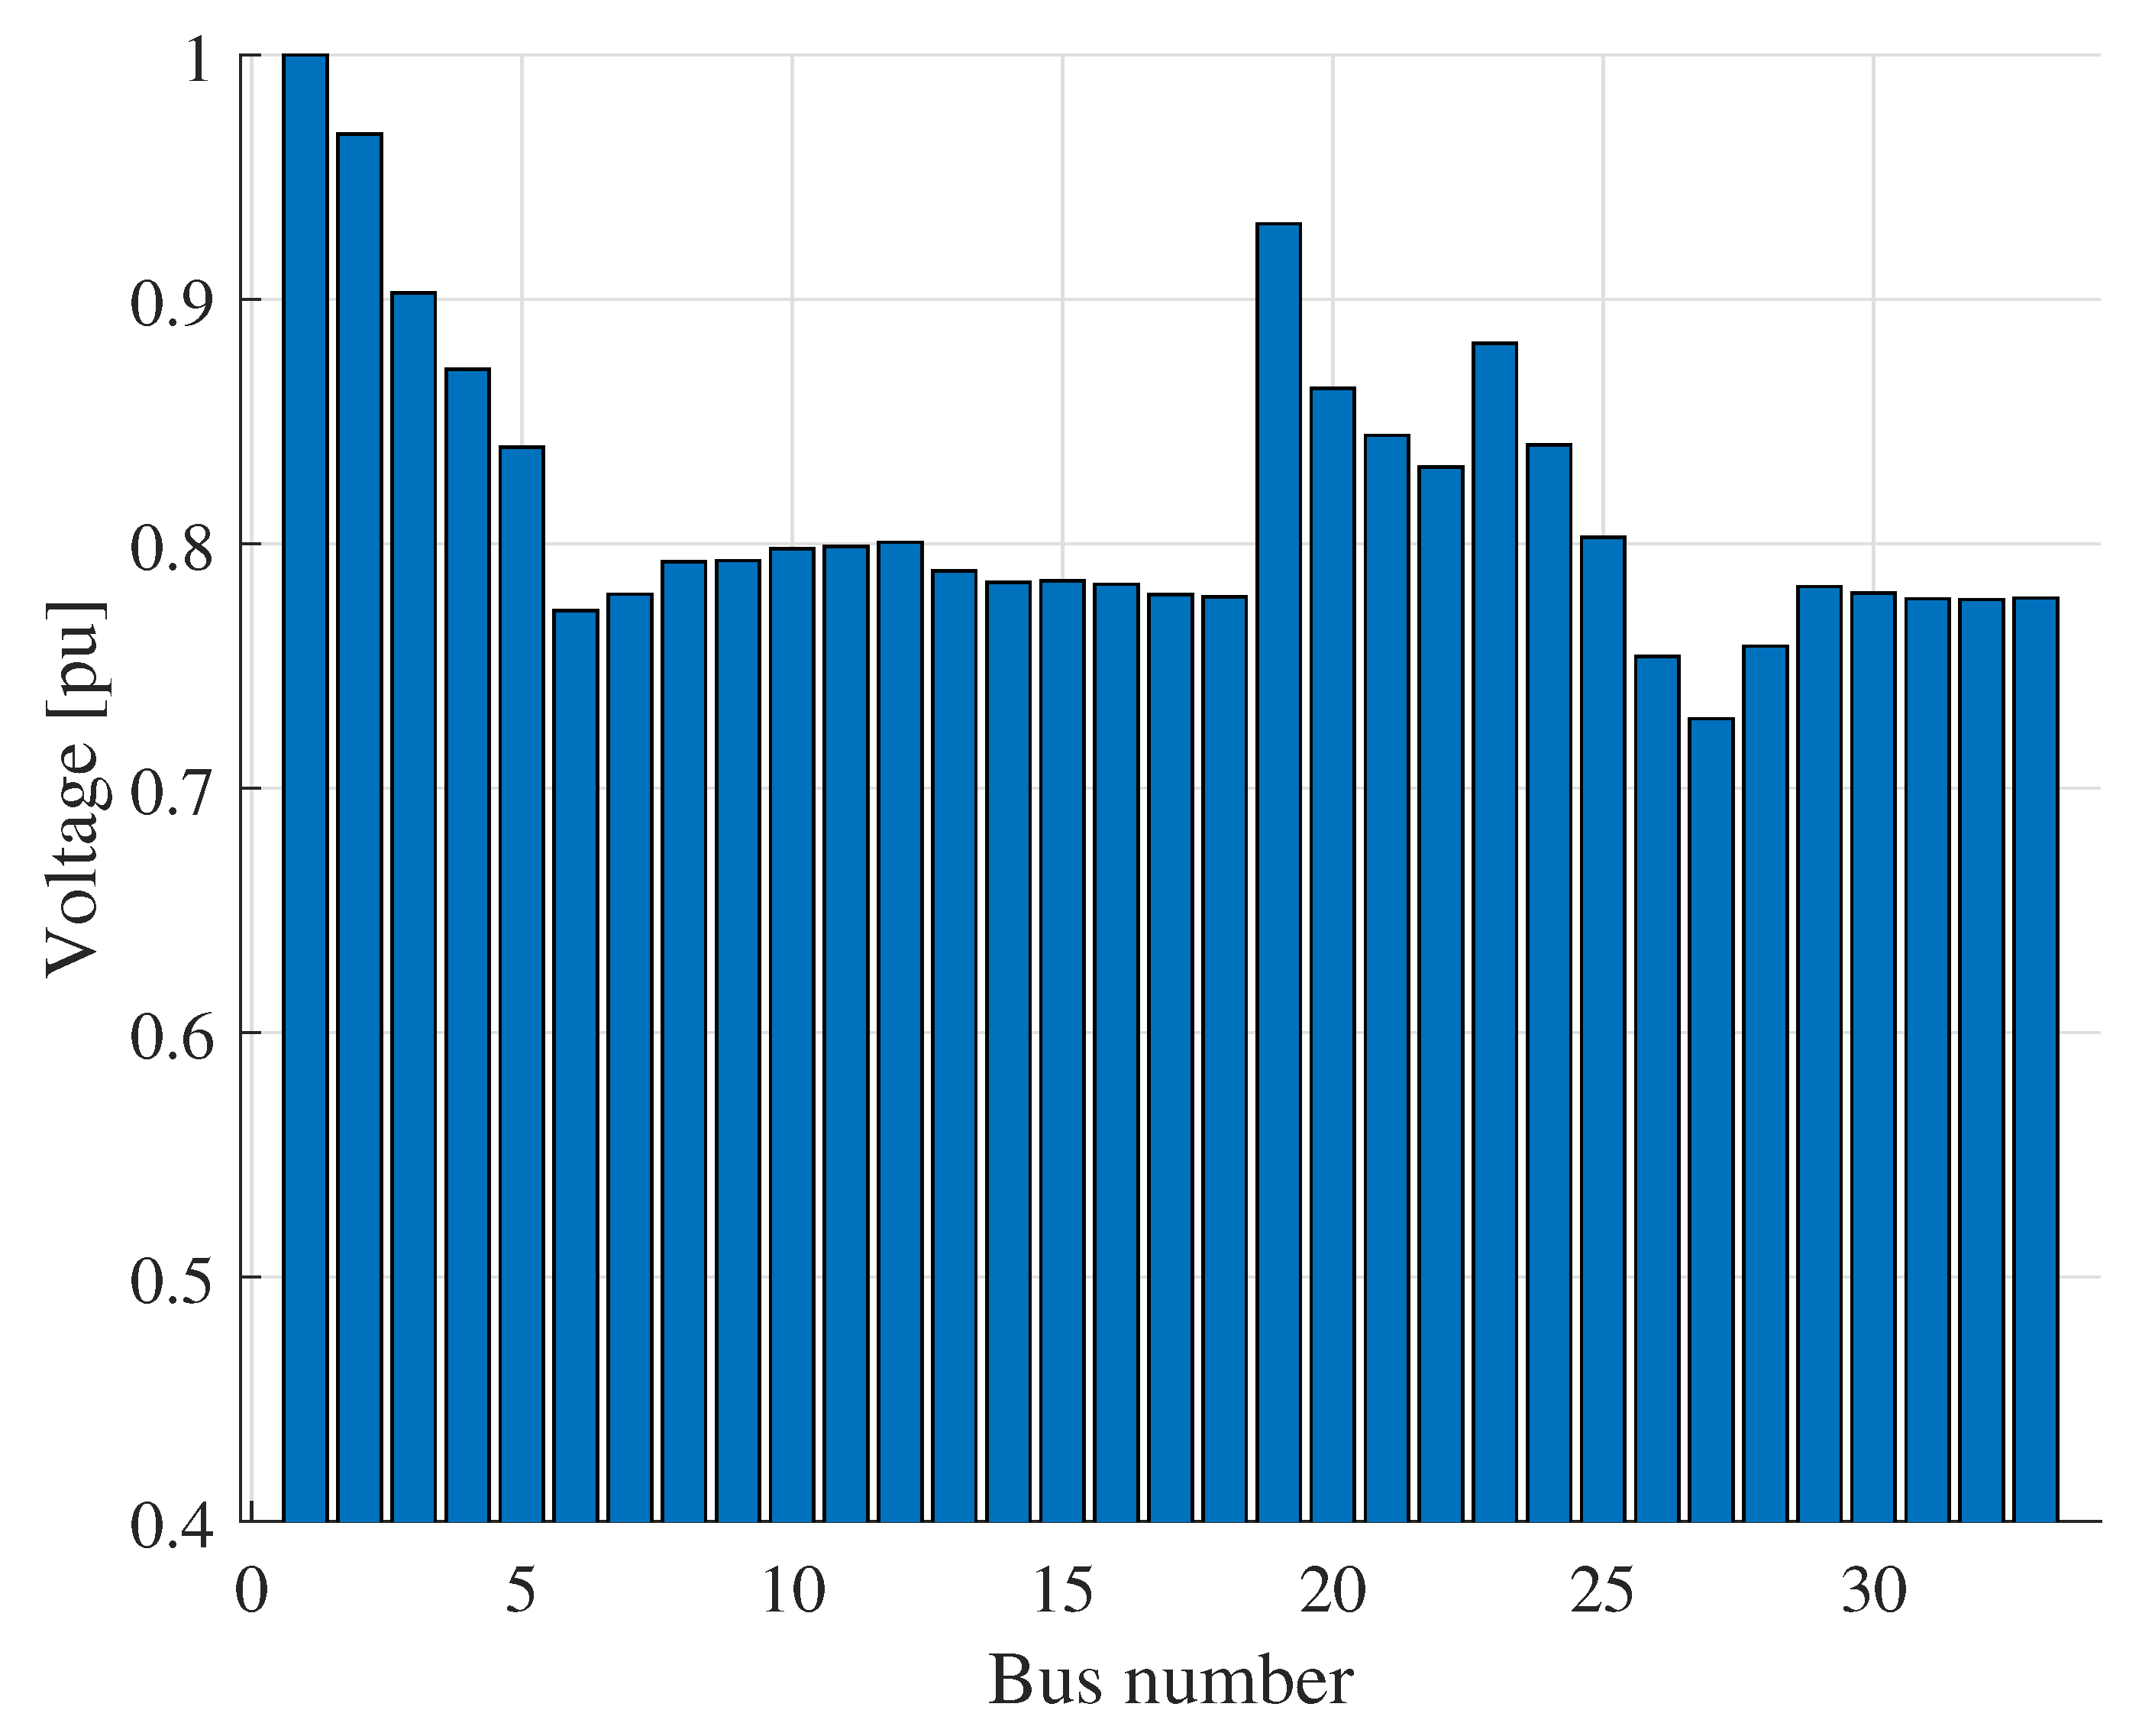
Figure 17 shows the initial voltage profile of the system for this first case study. It should be noted that these voltage values correspond to those previously presented in Figure 13.
Following the exhaustive search methodology, the device is placed at each of the nodes with nonlinear loads, starting with bus 14. The resulting voltage profiles are shown in Figure 18.
Additionally, Figure 19 presents the THD levels observed at bus 14 after the installation of the UPQC.
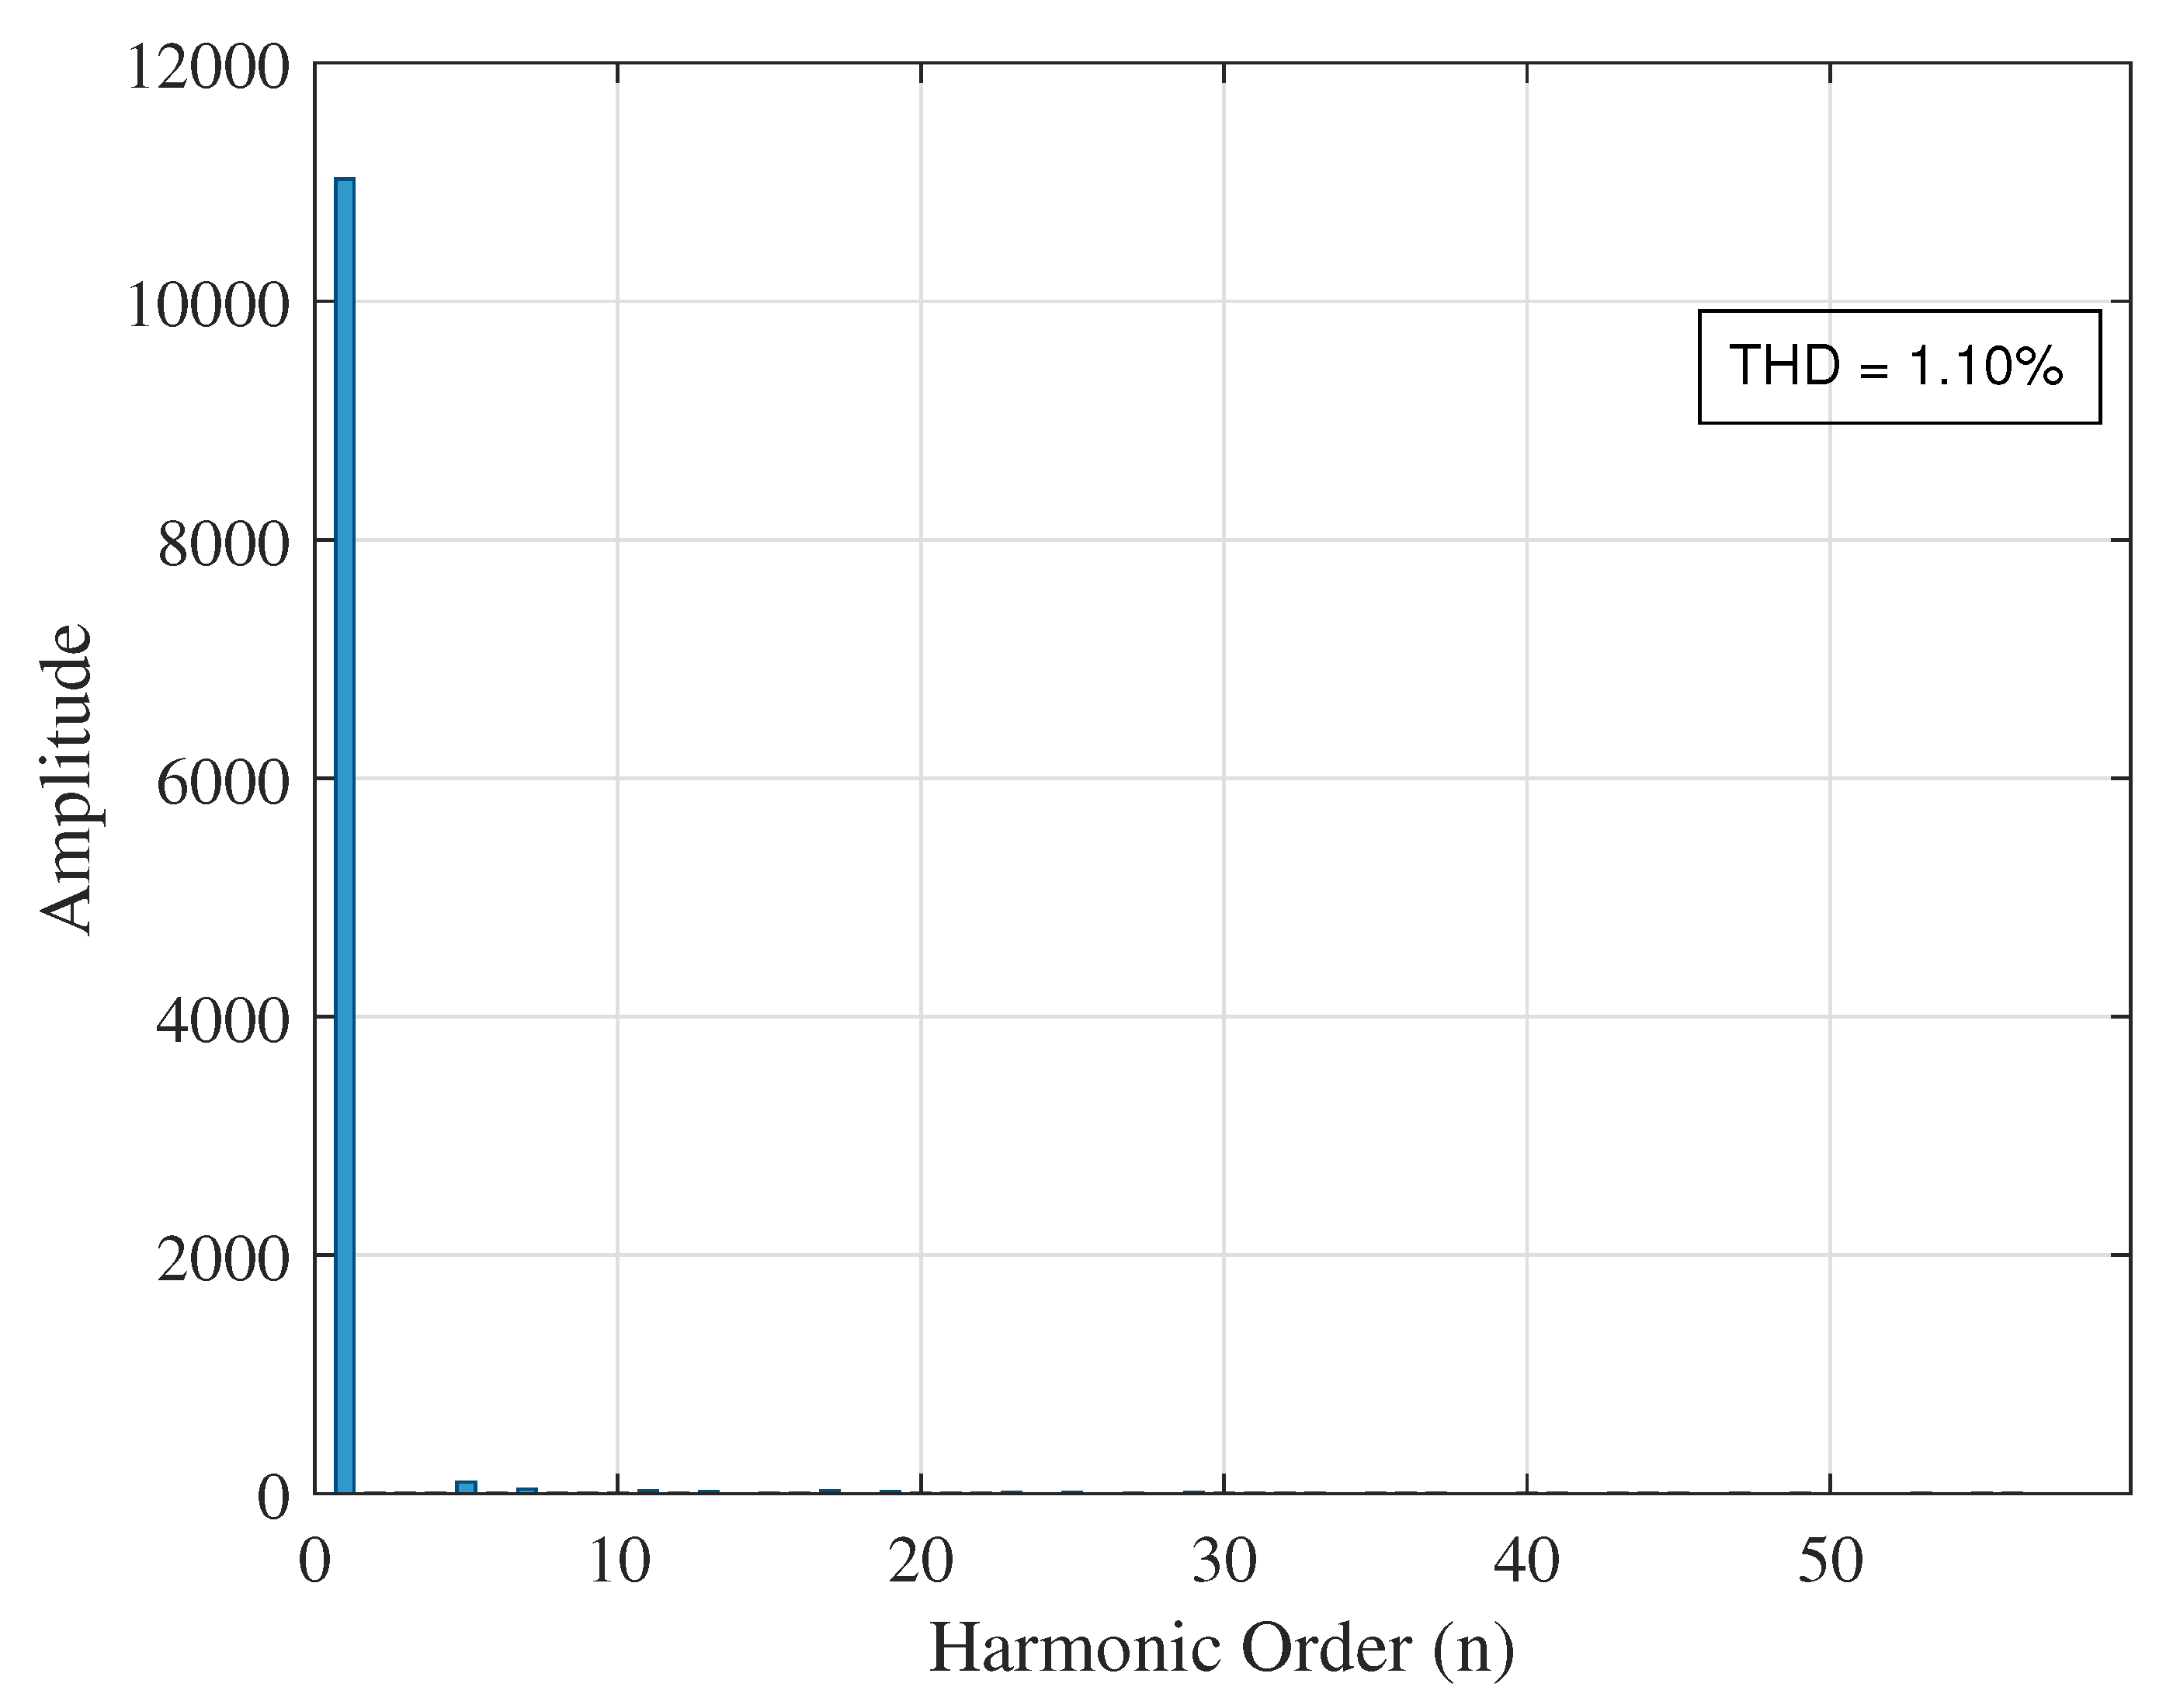
The THD recorded at bus 14 decreased from 16.52% (as presented in the base case results) to 1.10%, representing an improvement of approximately 93.34%. Similar improvements are observed at the other buses with nonlinear loads, such as bus 19, whose THD results are shown in Figure 20.
At this bus, the new THD value is 4.76%, which represents a 39.44% improvement over the original value. Similarly, Figure 21 shows the updated THD level at bus 27.
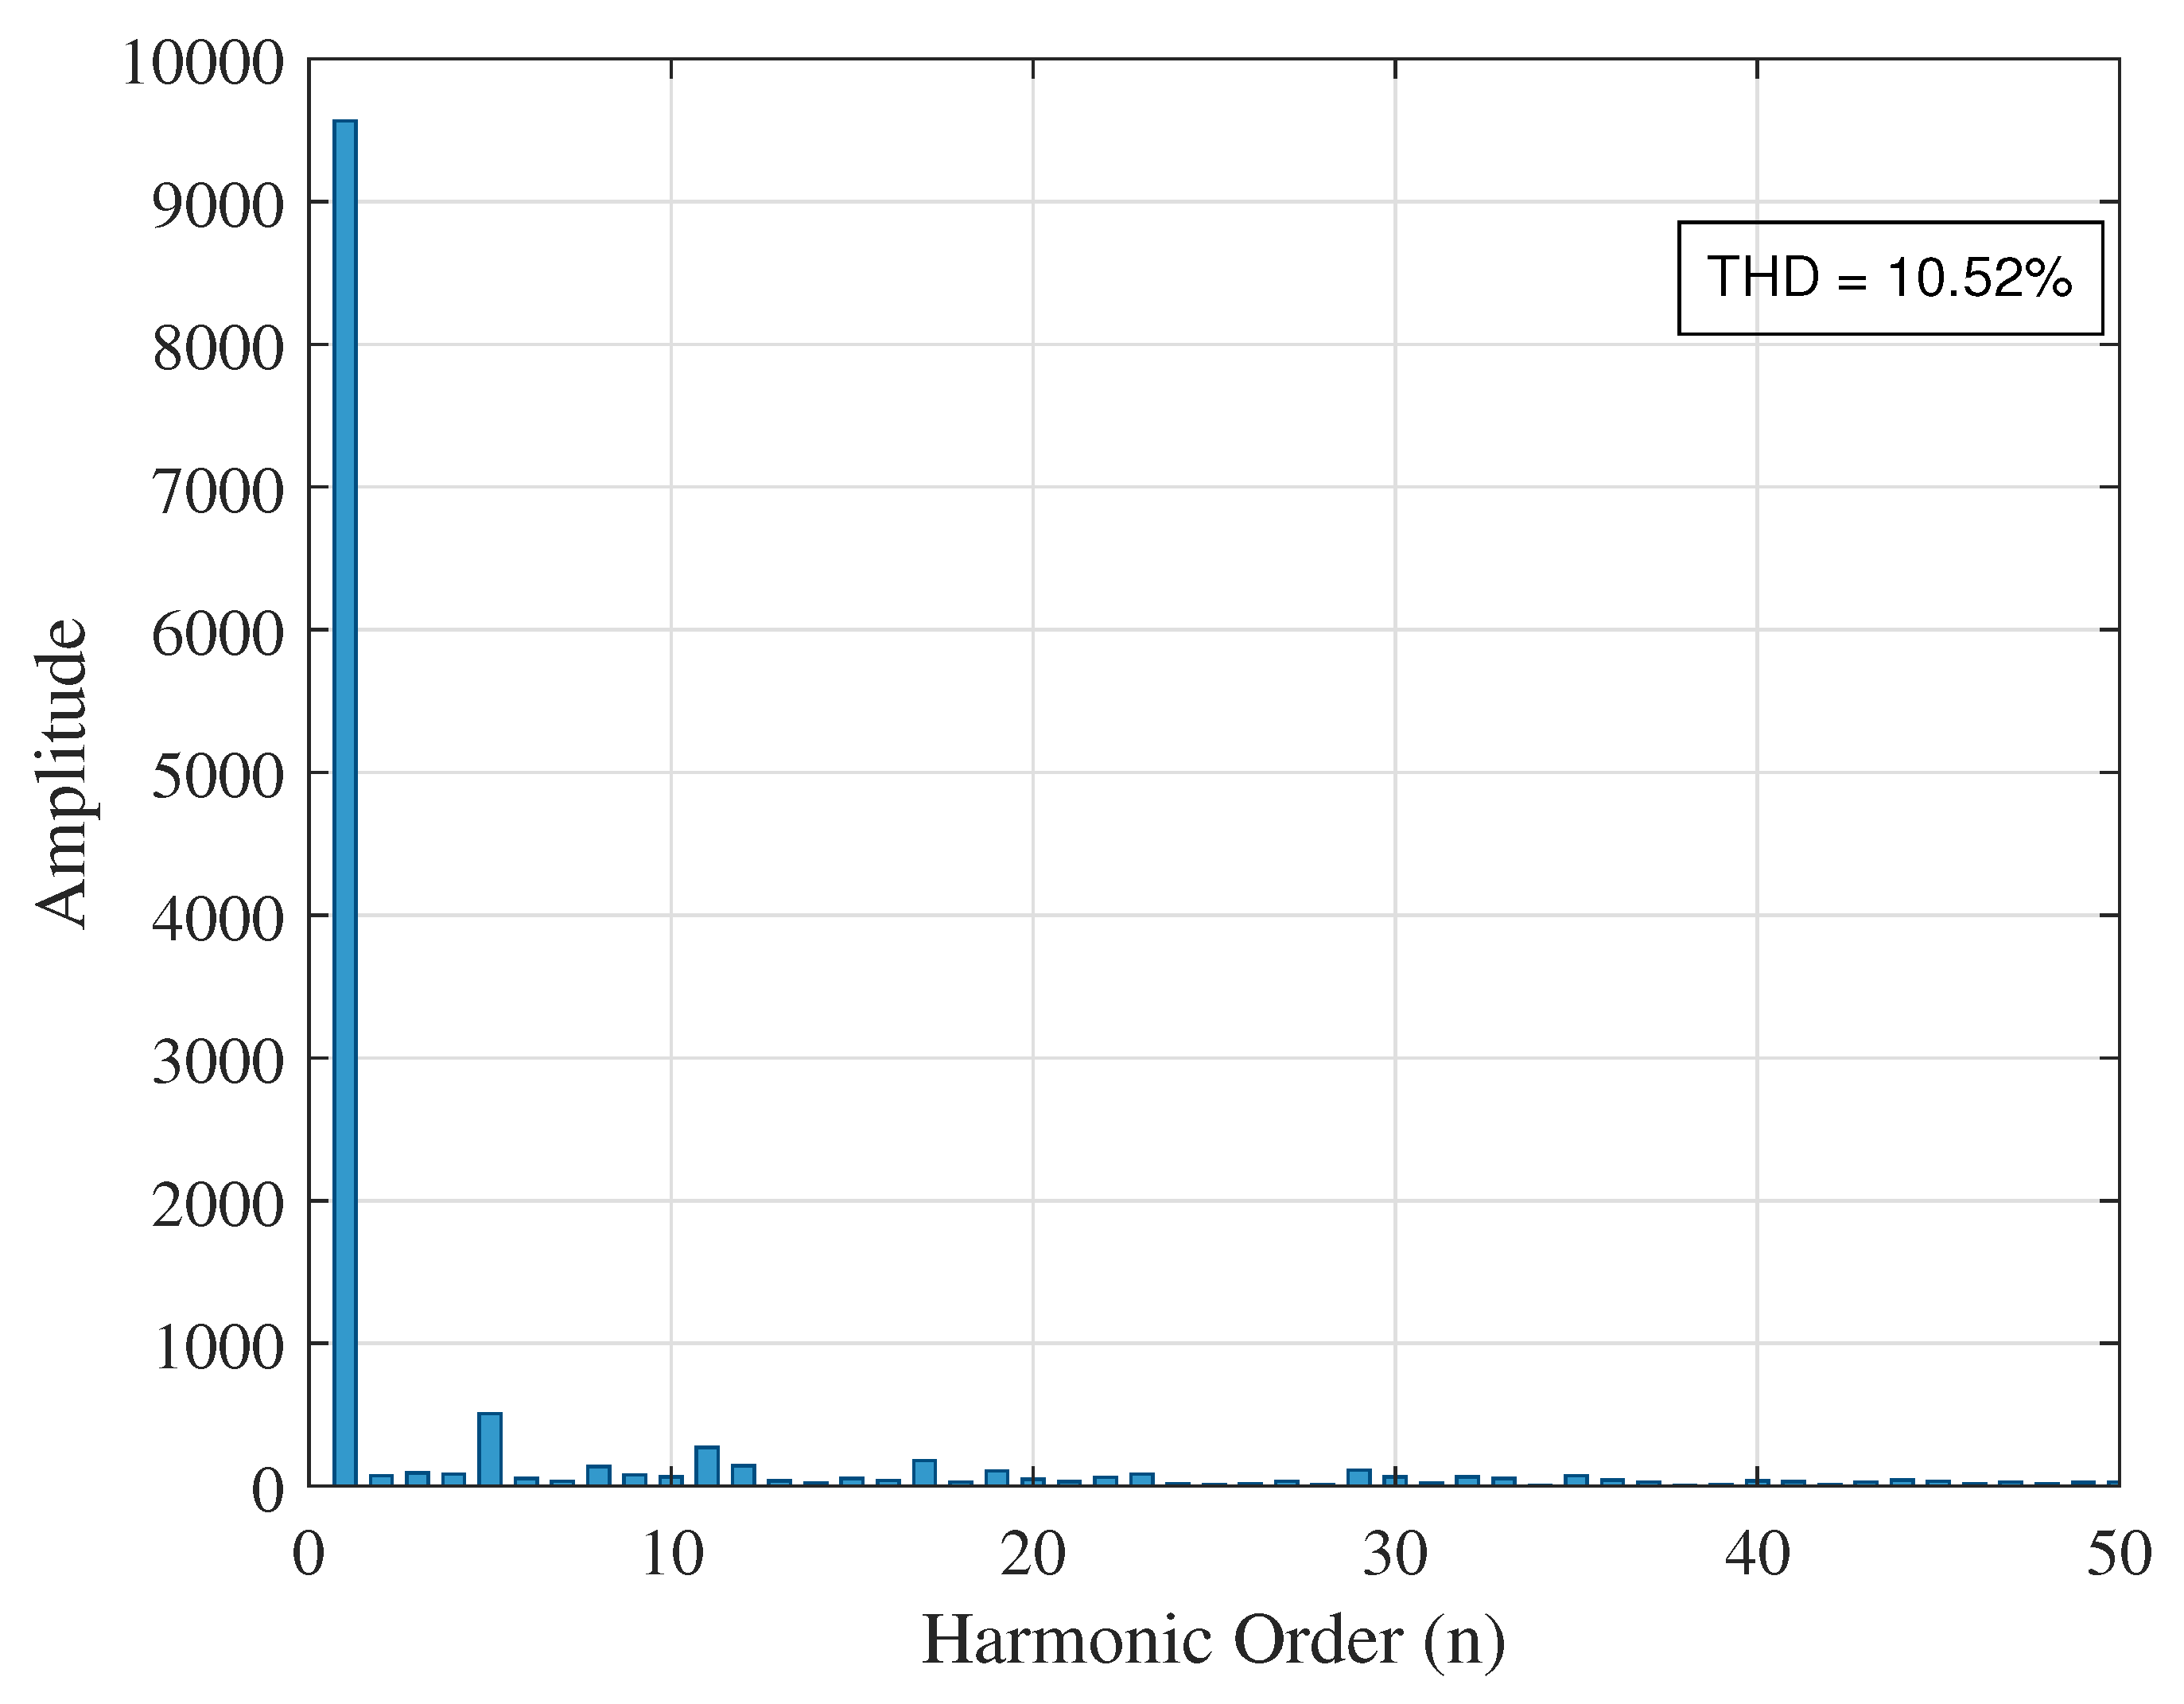
At bus 27, an improvement of 54.83% is observed, as the THD is reduced from 23.29% to 10.52%.

5.2.2. UPQC Installed at Bus 19

After confirming the improvements obtained with the UPQC installed at bus 14, the exhaustive search methodology proceeds by placing the device at bus 19. The resulting voltage profiles are shown in Figure 22.
As shown in Figure 22, the voltage levels experience slight variations. Similarly, changes in the THD levels at each bus can be observed. For instance, Figure 23 presents the updated THD at bus 14.
In this case, the THD at bus 14 shows no significant improvement. The THD recorded is 15.01%, compared to the 16.52% observed in the base case. This represents only a 9.14% reduction.
Figure 24 shows the THD at bus 19, where the UPQC is directly connected. A substantial improvement is expected at this node.
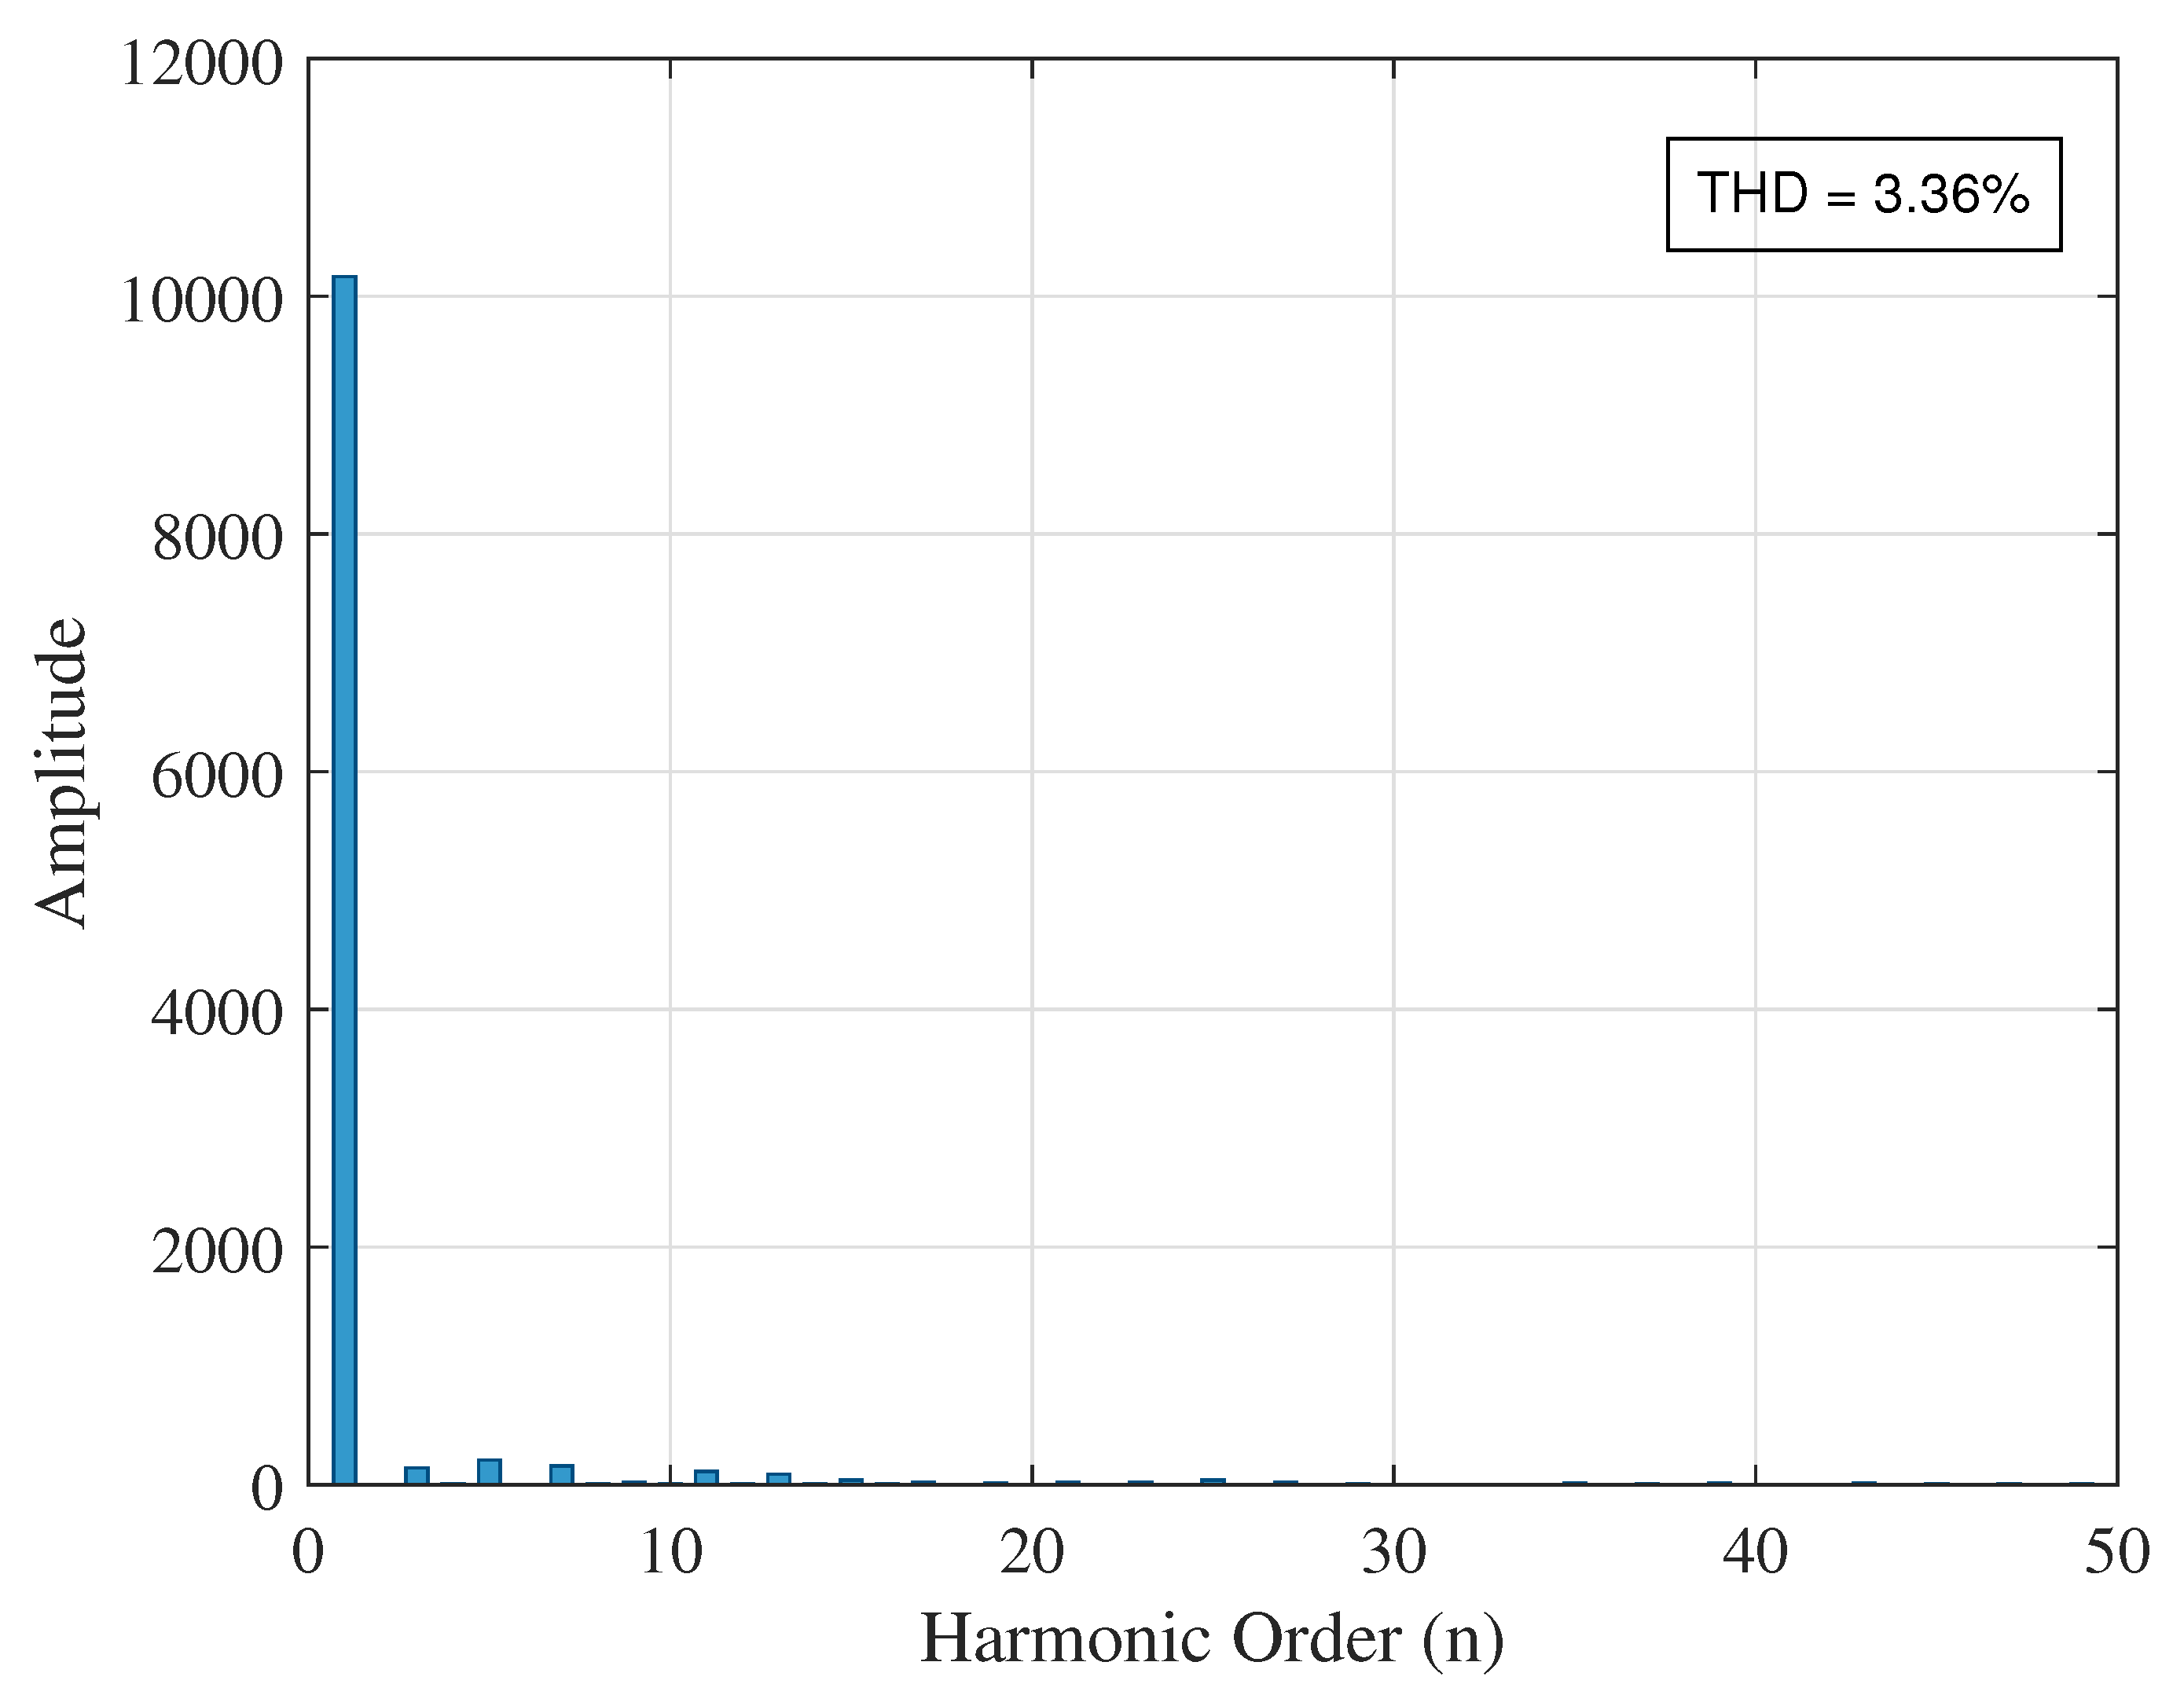
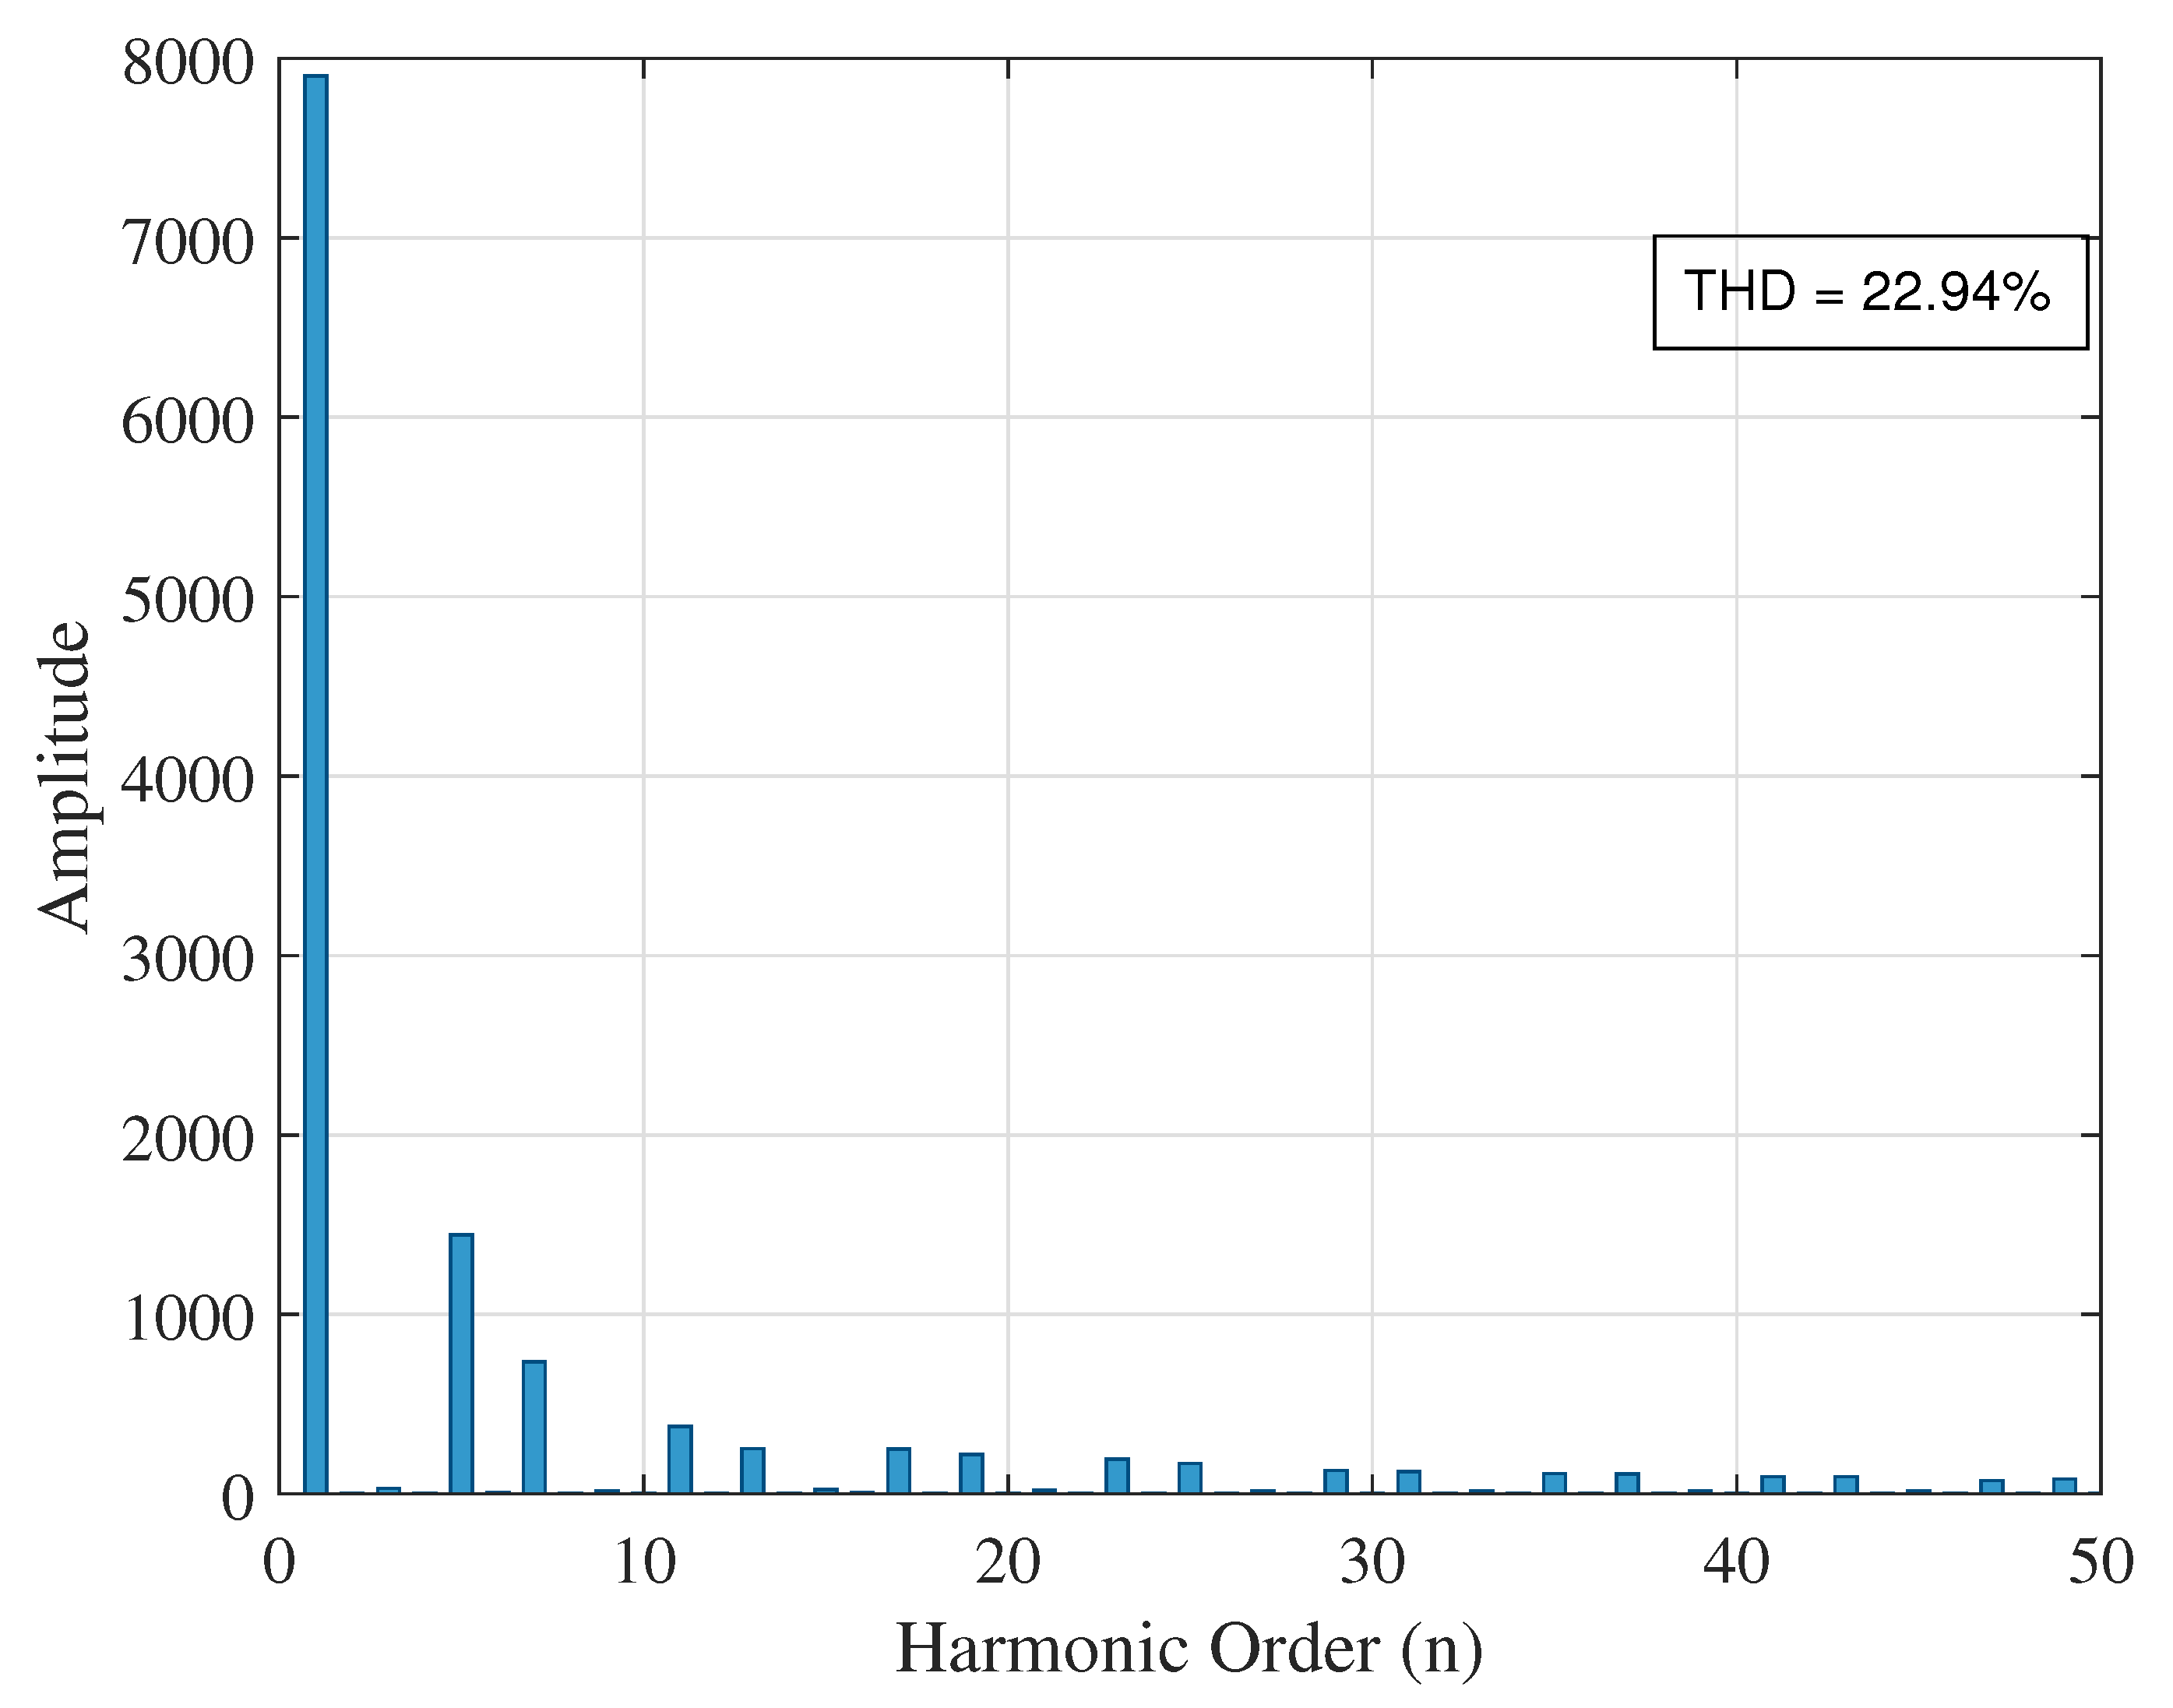
A THD value of 3.36% is obtained at this bus, representing a 57.2% reduction compared to the initial condition. Additionally, Figure 25 shows the THD at bus 27, where only a marginal change is observed—from 23.29% to 22.94%.
As can be seen, the improvement in THDv across the buses is not substantial when the UPQC is installed at bus 19, especially when compared to the scenario where the UPQC was connected at bus 14.

5.2.3. UPQC Installed at Bus 27

To complete the exhaustive search and identify the optimal location of the UPQC for this case study, the device is now placed at the final bus with a nonlinear load—bus 27. As in previous scenarios, the system’s voltage profiles are obtained once the device is installed at this bus. These results are presented in Figure 26.
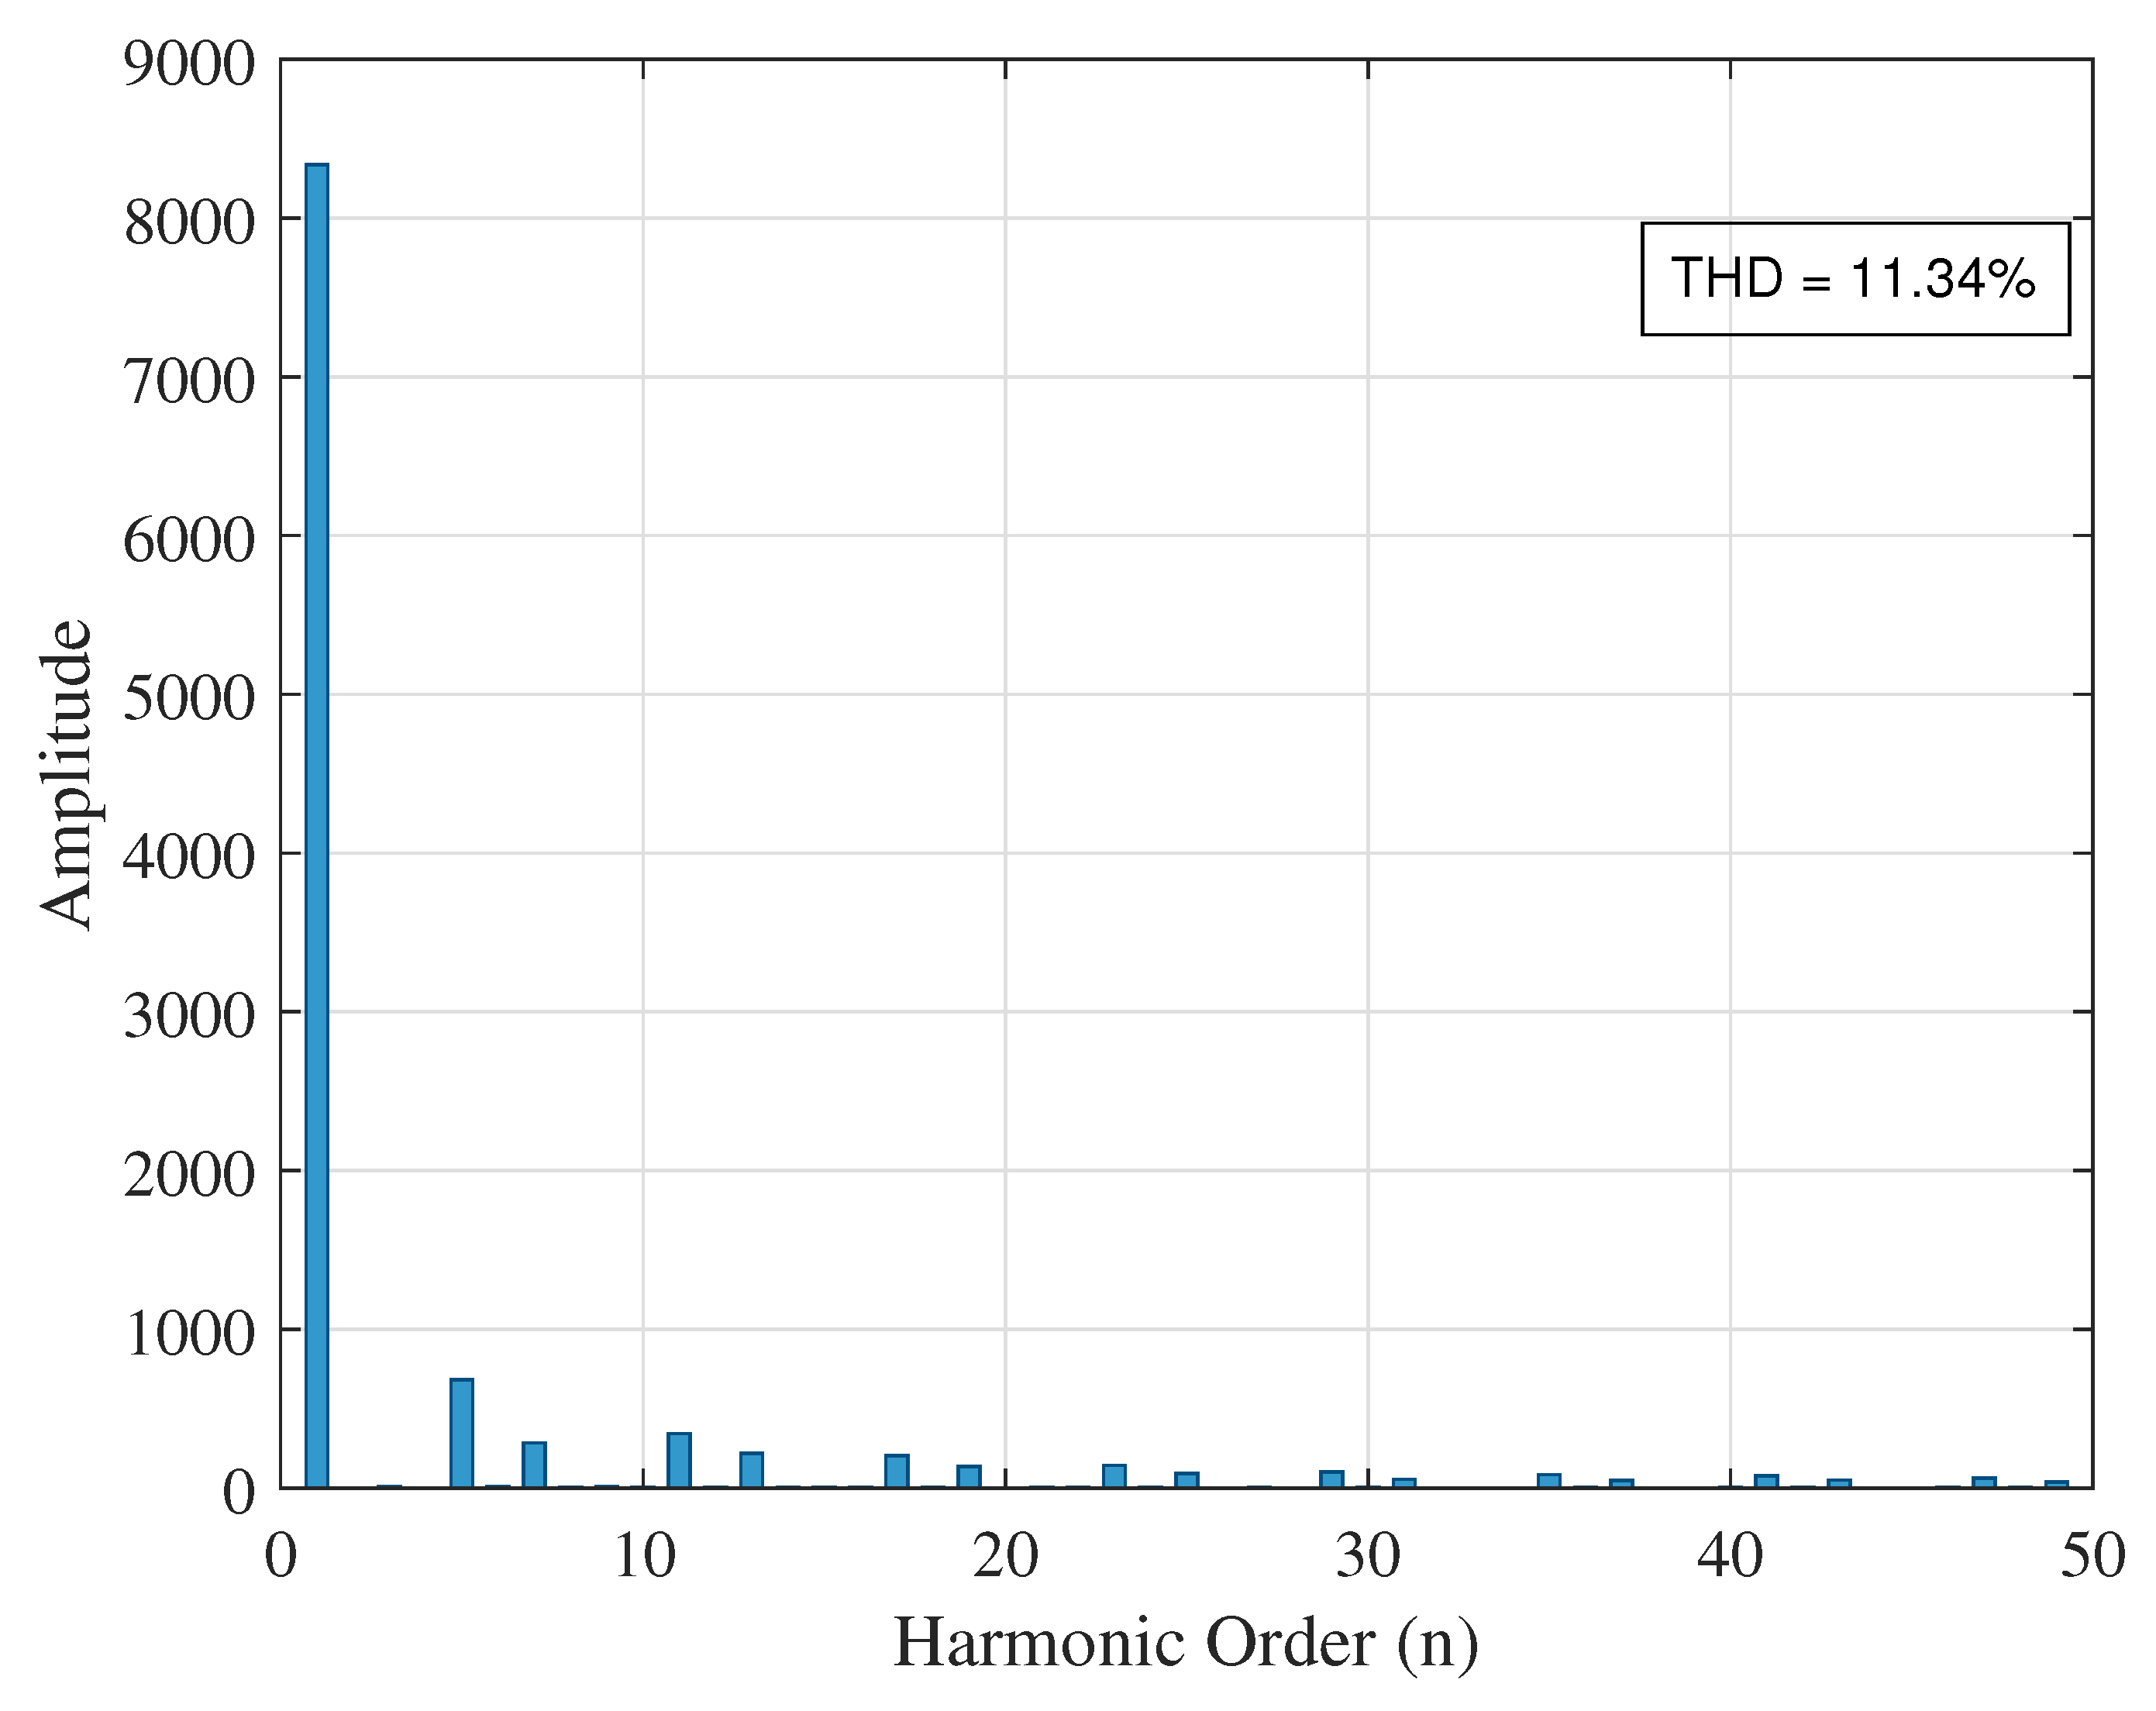
Once the UPQC is placed at bus 27, the analysis focuses on evaluating the THDv at buses 14, 19, and 27 to determine whether this configuration yields significant improvements compared to previous cases (i.e., UPQC installed at buses 14 and 19). Figure 27 shows the THDv level at bus 14 when the UPQC is connected at bus 27.
With the UPQC installed at bus 27, a THDv of 11.34% is recorded. Compared to the base value of 16.52%, this represents a 31.36% reduction. Additionally, Figure 28 presents the THDv at bus 19.
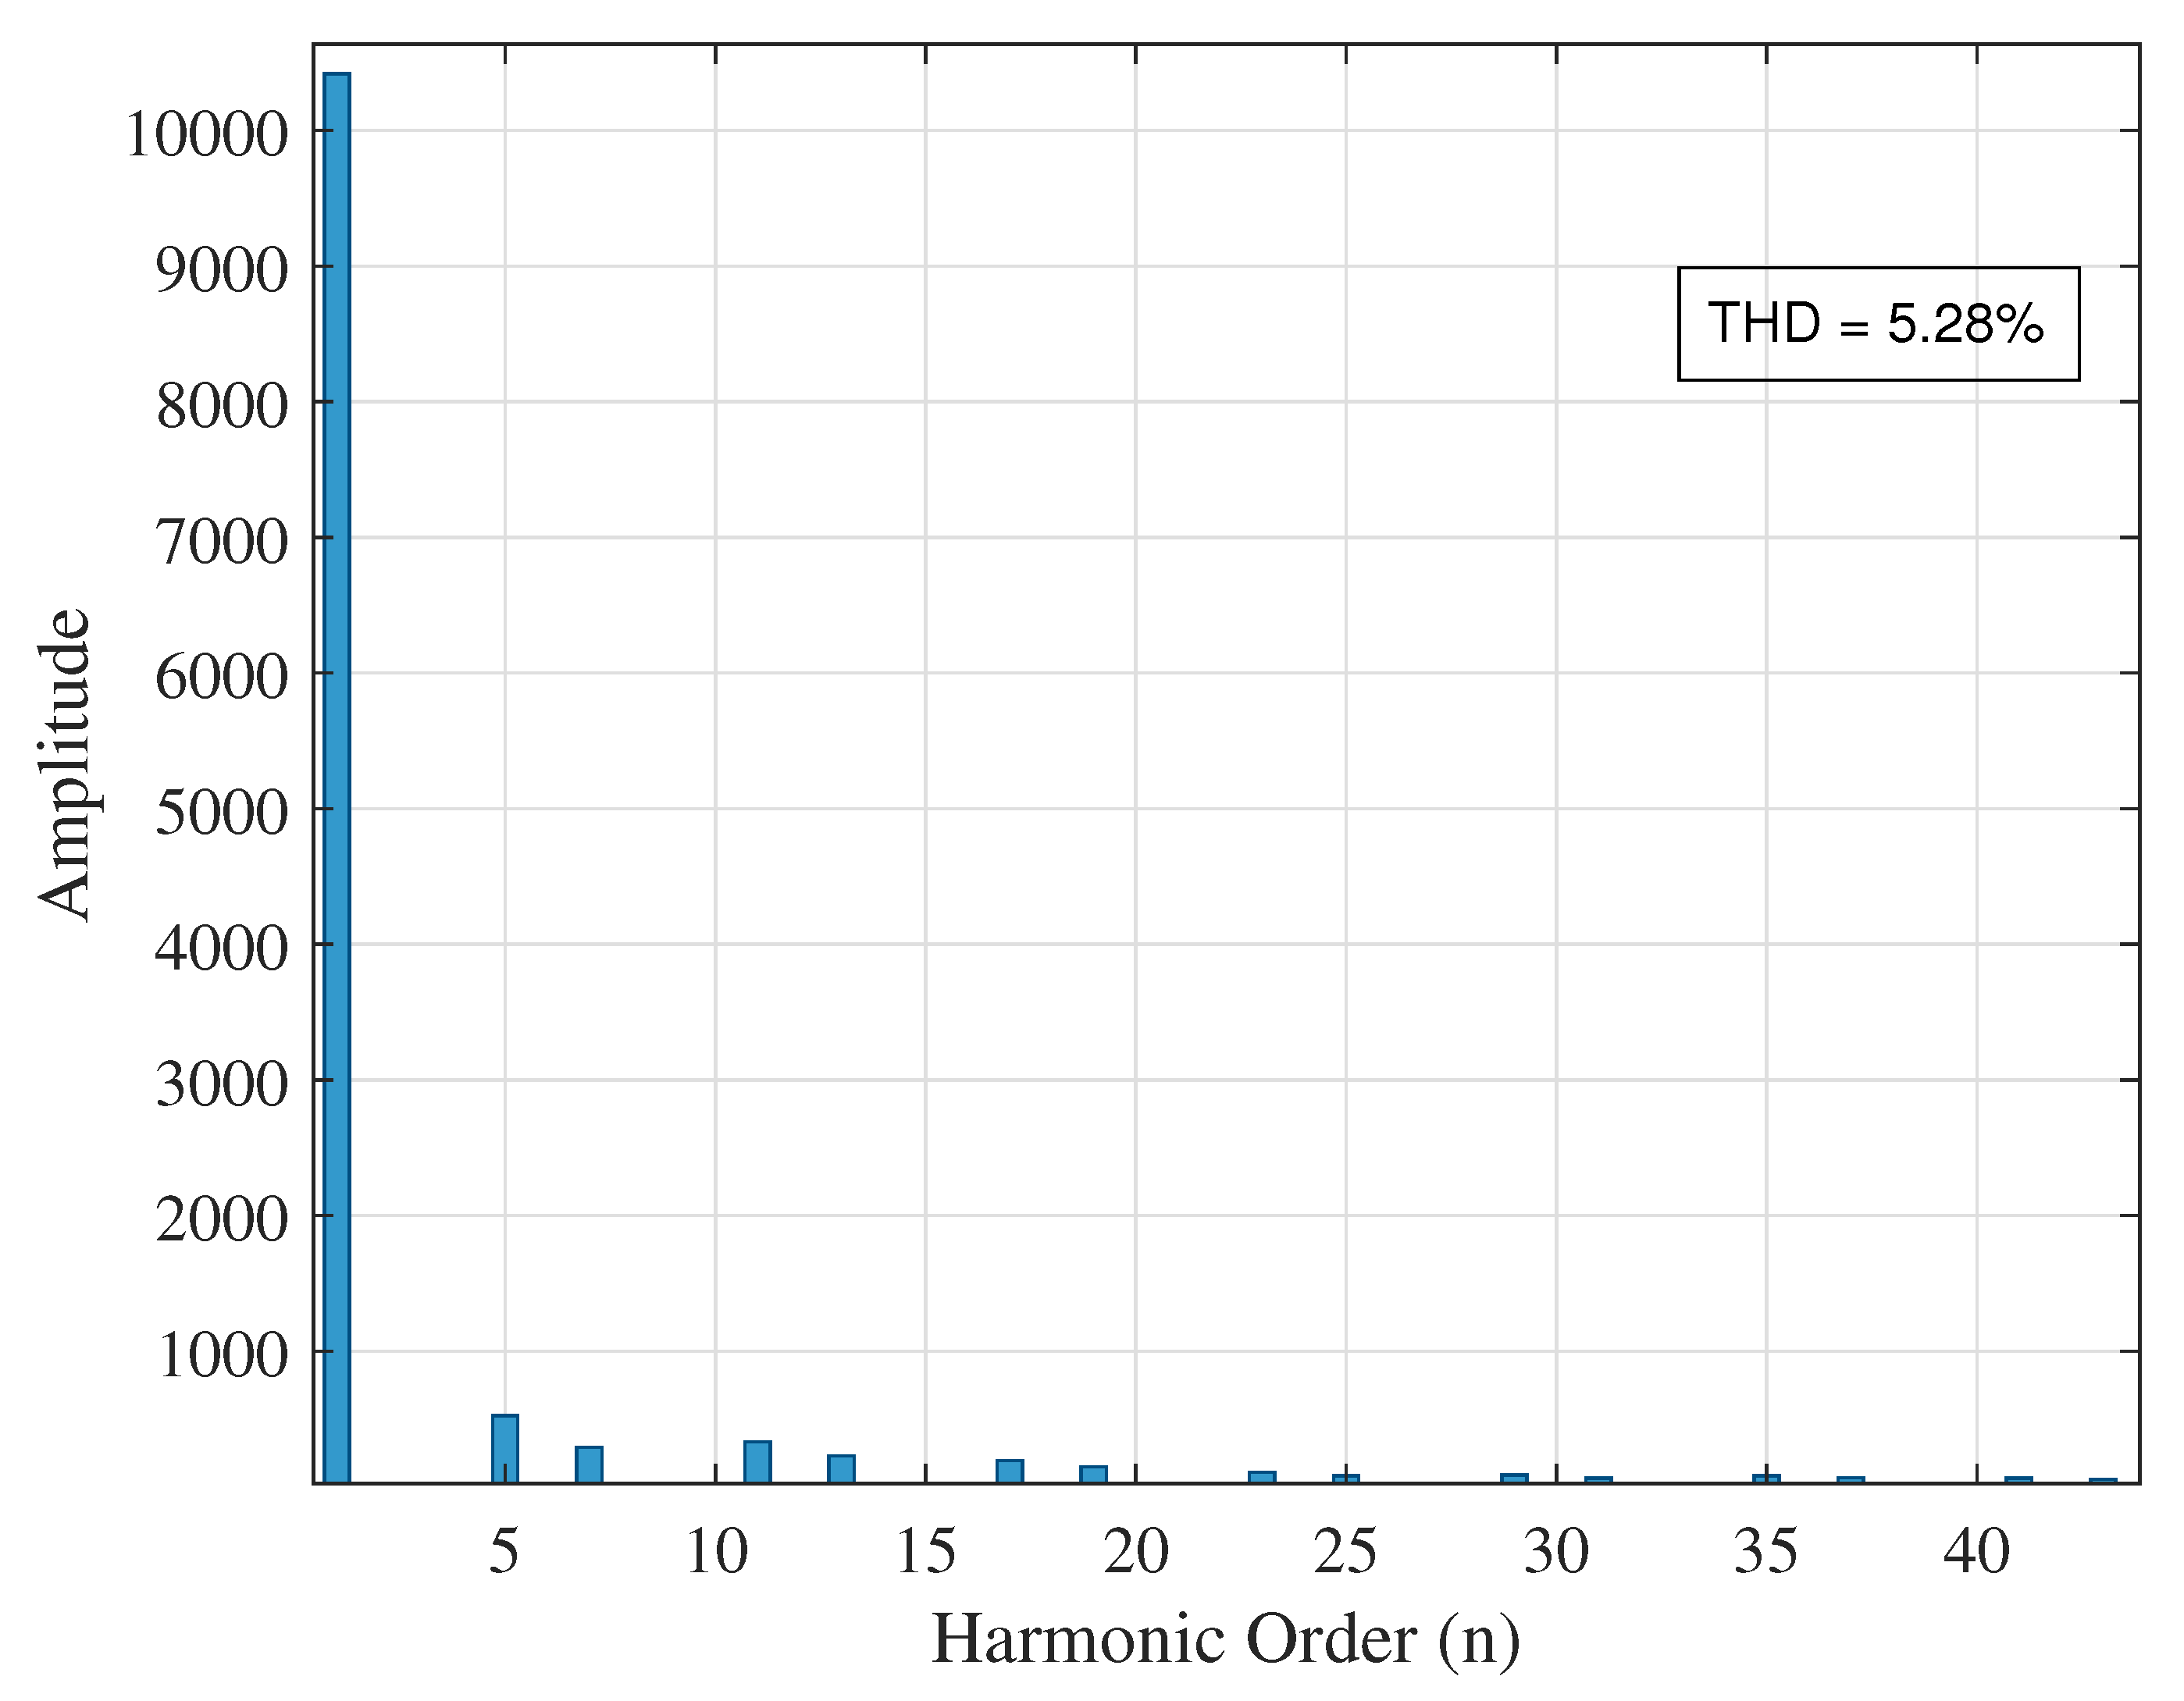
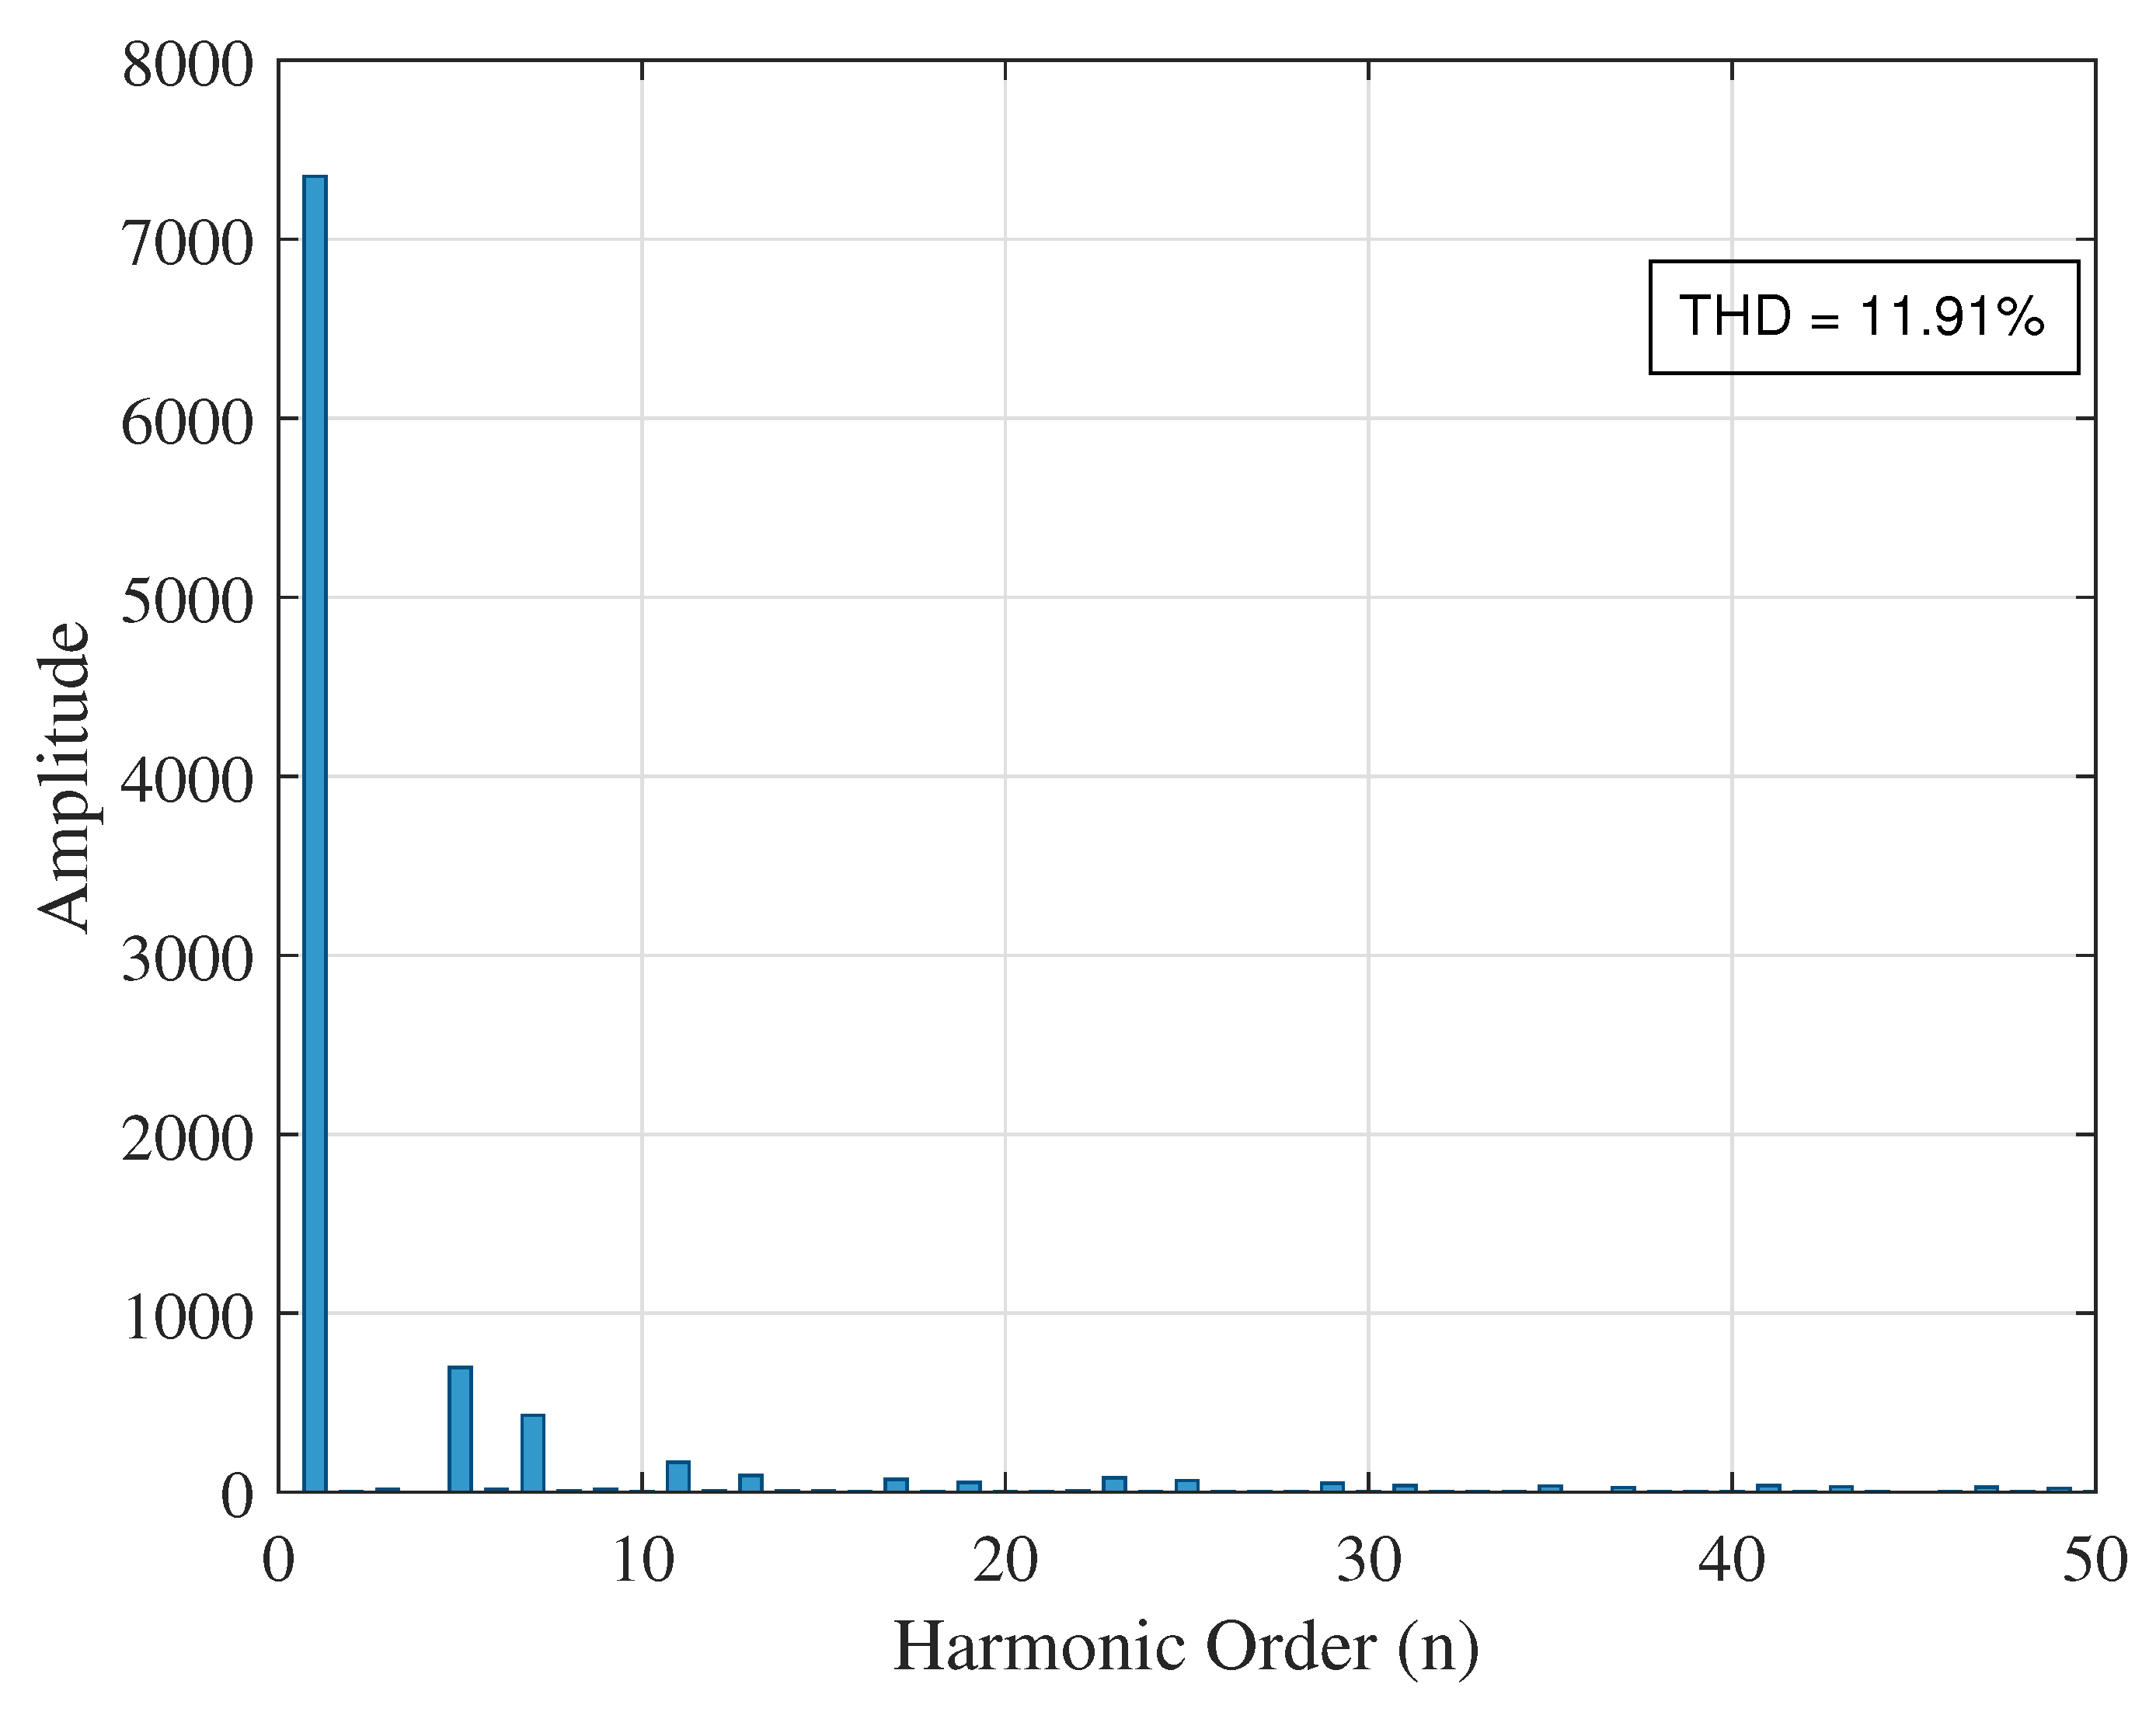
In this case, the THDv is reduced from 7.86% to 5.28%, corresponding to an improvement of 32.83%. At bus 27, where the UPQC is directly connected, a THDv of 11.91% is registered, as shown in Figure 29.
This new THDv value represents a 48.87% improvement compared to the base scenario. After completing the THDv analysis for all buses with nonlinear loads, the voltage profiles presented in Figure 18, Figure 22 and Figure 26 are reviewed to assess the impact of UPQC placement on voltage magnitude. The differences among these profiles are more clearly illustrated in Figure 30.
The voltage profile changes across the system do not explicitly indicate which location delivers the greatest benefit. Therefore, the optimization algorithm is applied to determine the optimal installation bus for the UPQC.

5.3. Optimal Location Analysis

To determine the optimal installation site for the UPQC among the three candidate buses, the first step is to calculate the average THDv for each candidate solution ( f 1 ) using Equation (16).
f 1 ( 14 ) = 16.38 3 = 5.46 %
f 1 ( 19 ) = 41.31 3 = 13.77 %
f 1 ( 27 ) = 28.53 3 = 9.51 %
Once the values for the first objective ( f 1 ) are obtained, the next step is to calculate the average voltage deviation ( f 2 ) for each case using Equation (17).
f 2 ( 14 ) = 6.2581 33 = 0.1896 p . u .
f 2 ( 19 ) = 6.2977 33 = 0.1908 p . u .
f 2 ( 27 ) = 6.9575 33 = 0.2108 p . u .
With both objective values ( f 1 and f 2 ) computed, normalization is applied using Equation (20), and the weighted cost function is then calculated for each candidate:
J ( 14 ) = 0.3 · 0 + 0.7 · 0 = 0
J ( 19 ) = 0.3 · 1 + 0.7 · 0.057 = 0.34
J ( 27 ) = 0.3 · 0.487 + 0.7 · 1 = 0.84
Finally, based on the obtained results, it is concluded that the optimal installation site for the UPQC is bus 14, as it yields the lowest value of the objective cost function.

5.4. Case 2

As previously mentioned, this case study aims to determine whether the inclusion of a PV-based DG unit alters the optimal location of the UPQC identified in the first case study.

5.5. Impact of DG Penetration on Harmonic Performance

To quantify how distributed generation (DG) penetration affects harmonic performance and UPQC siting, the PV output was swept between two operating points available in this study: 0% (no DG) and 100% of the nominal PV capacity (3.5 kW). For each operating point, the average voltage total harmonic distortion (THDv) over the monitored buses (14, 19, and 27) was computed for three representative UPQC locations (buses 14, 19, and 27), yielding the trends shown in Figure 31.
Results indicate that the optimal location identified in the base case remains robust when DG operates at its nominal point: UPQC@14 retains the lowest average THDv, while DG presence substantially reduces the average distortion for UPQC@19 and UPQC@27. These outcomes confirm that the siting strategy preserves its effectiveness across the tested DG operating range and motivate future work to interpolate intermediate penetration levels.
The PV-based distributed generation (DG) unit and the UPQC perform complementary roles at the point of common coupling (PCC). The shunt converter of the UPQC shapes the source current and regulates the DC-link voltage (with i q * 0 in steady state), while the series converter restores/conditions the load-side voltage [15,18]. Under these control objectives, the PV inverter continues to operate at its setpoint (e.g., MPPT or fixed active power) and sees a PCC voltage kept close to nominal. As a result, across the scenarios tested, we did not observe adverse interactions such as oscillatory power exchange or control coupling between the PV inverter and the UPQC.
Consistently with Figure 31, the presence of DG at nominal output reduces the average THDv for some non-optimal placements (e.g., UPQC at buses 19 and 27), narrowing the gap with respect to the optimal site. Nevertheless, UPQC installation at bus 14 remains the best trade-off for harmonic mitigation and voltage profile improvement within the tested range. From an operational standpoint, the shunt branch keeps the supply current near sinusoidal and in phase with the PCC voltage, while the series branch limits voltage distortion at the load terminals. This division of tasks confines the UPQC’s active-power support to balancing the injected series voltage (via DC-link control) without perturbing the PV inverter’s setpoint [13,15].
Finally, by mitigating overvoltage and distortion at the PCC, the UPQC can lower the risk of PV inverter protective trips (e.g., overvoltage or abnormal distortion) in feeders with variable irradiance. In feeders with higher DG penetration or multiple PV units, the same coordination principle applies, though additional devices or coordinated control could be required to achieve system-wide compliance, as discussed in the scalability notes of Section 3.4.

5.5.1. UPQC at Bus 14

As in the previous case, the THDv is analyzed for each possible installation site of the UPQC, starting with bus 14, as shown in Figure 32.
The THDv at bus 14 is analyzed with the UPQC installed at this location. In this case, the recorded THD is 1.08%, which is very similar to the result obtained in Case 1 (1.10%) without the DG connected. Compared to the base scenario with DG, where a THDv of 16.55% was observed, this result represents an improvement of approximately 93.47%.
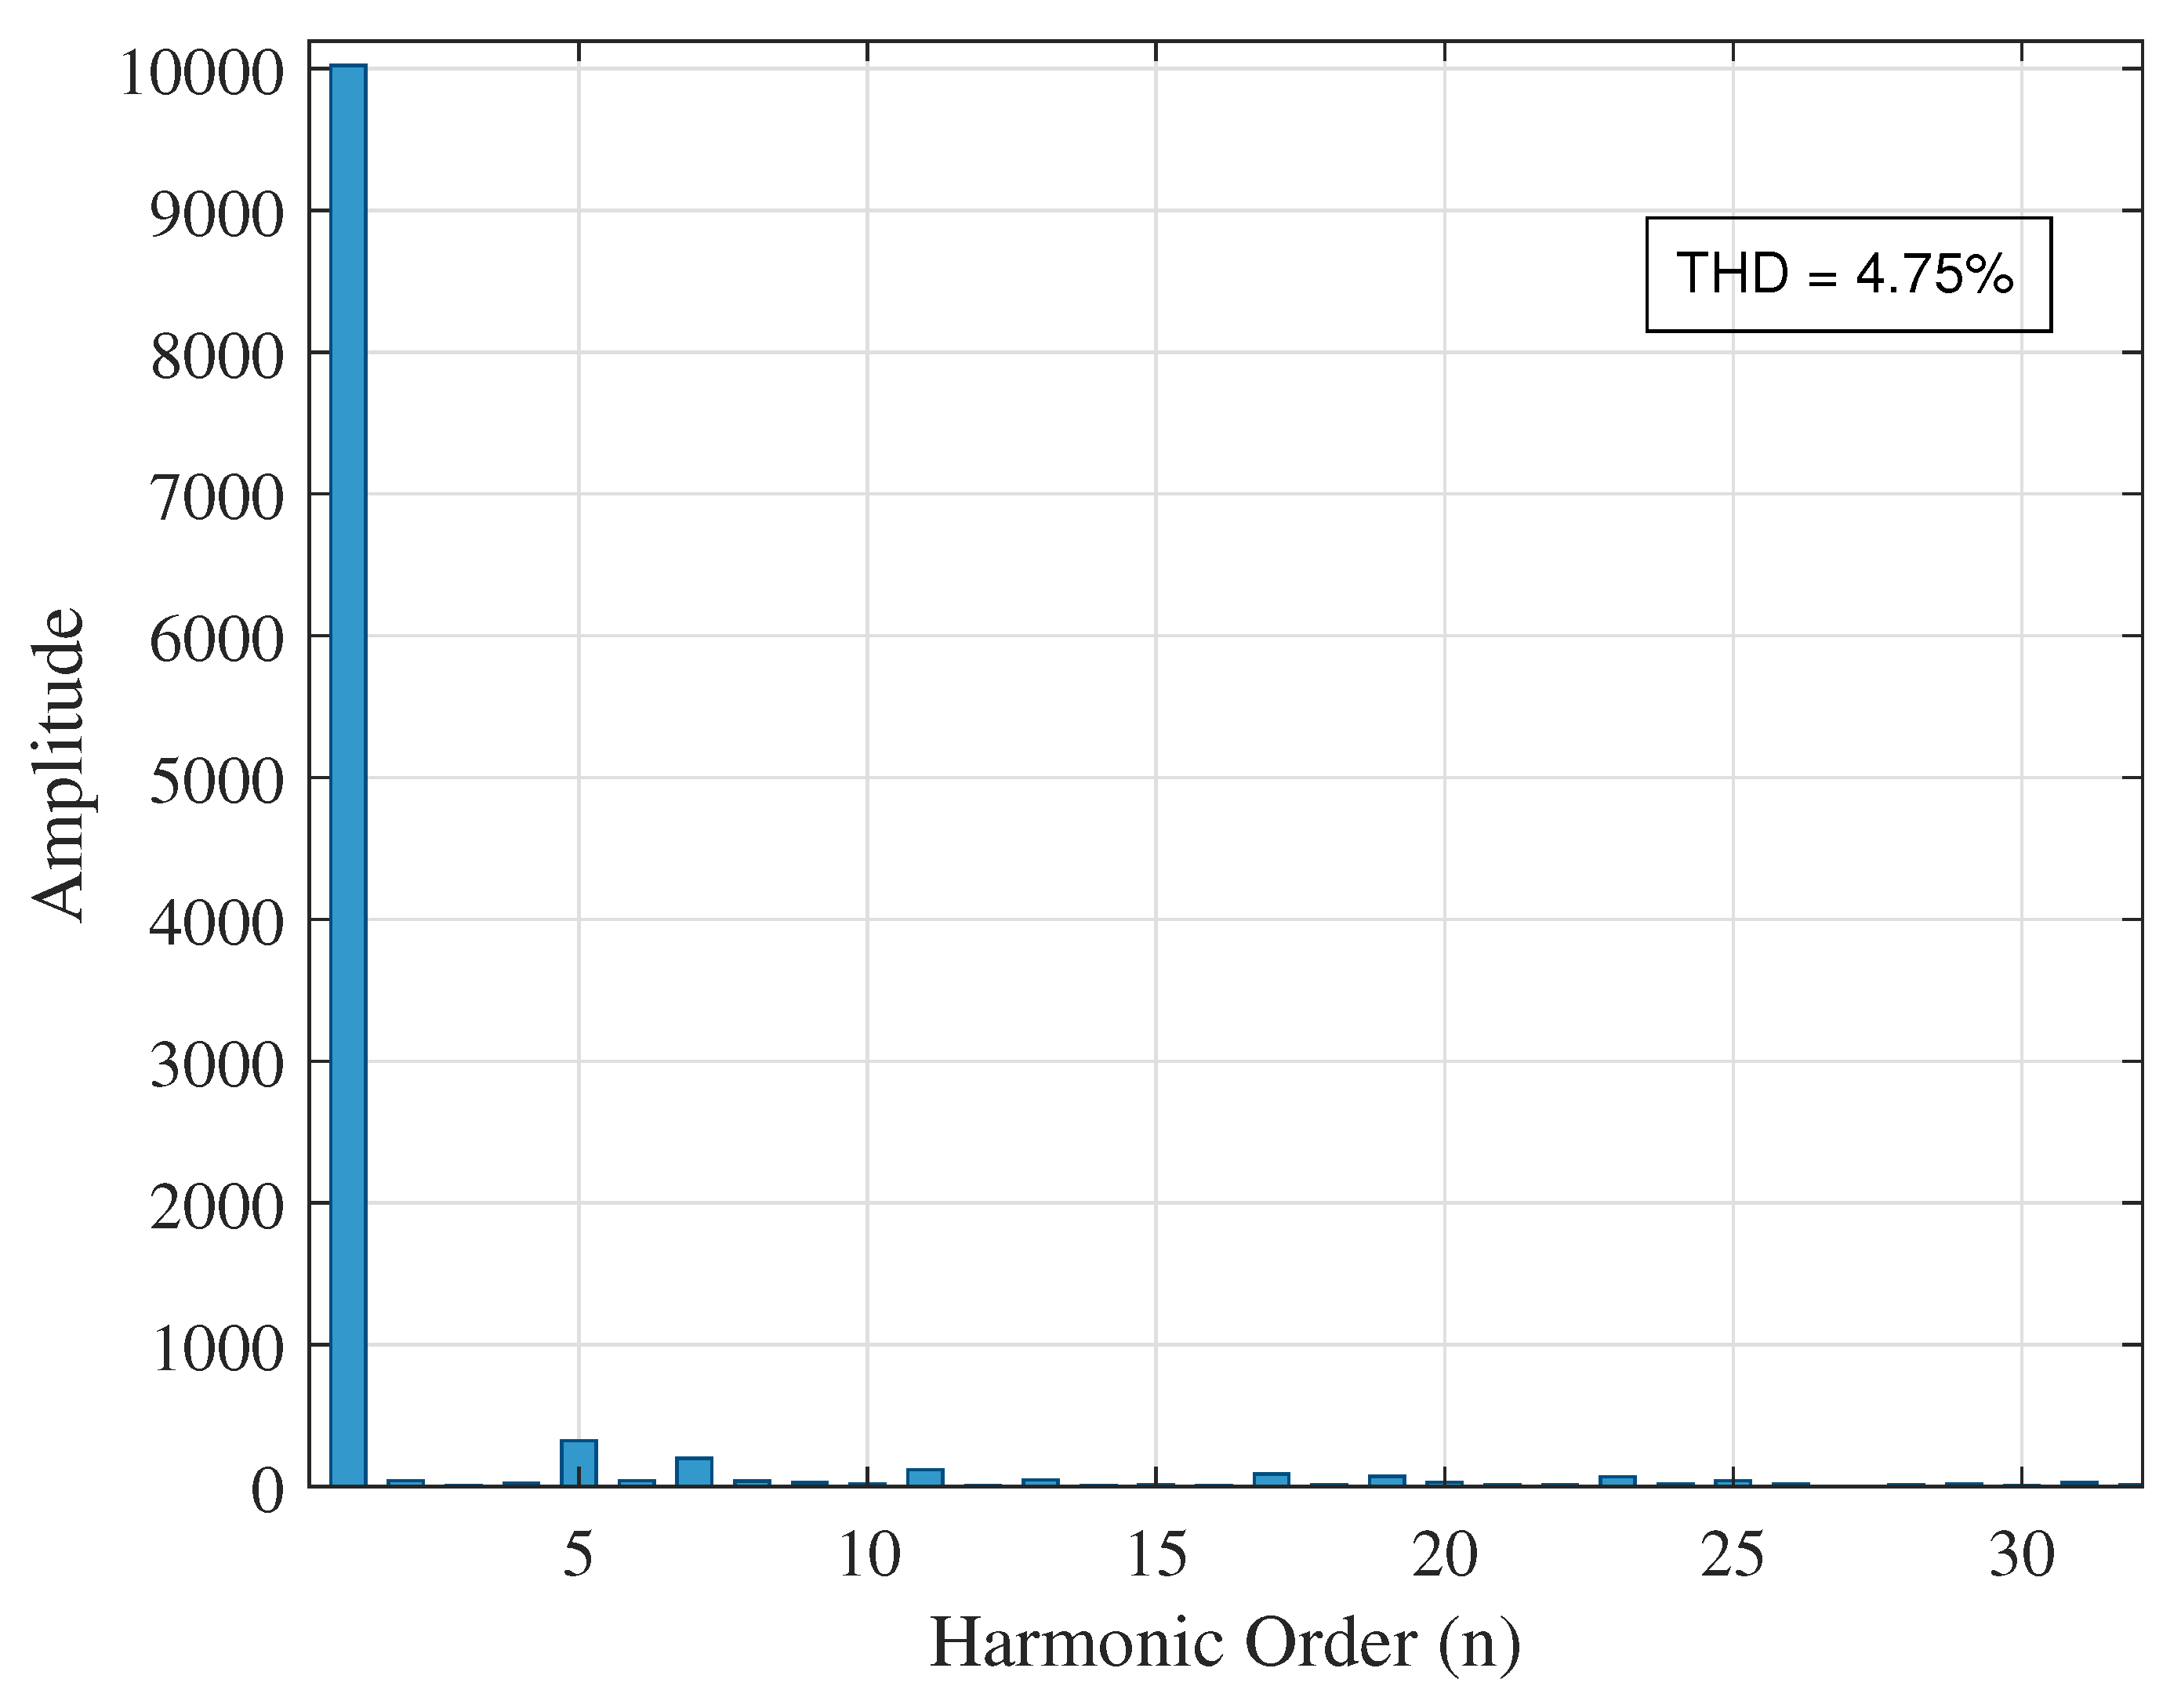
Meanwhile, the harmonic distortion at bus 19, shown in Figure 33, presents a THD of 4.75%.
Given that the base THDv at bus 19 was 7.87%, the reduction to 4.75% reflects an improvement of 39.64%. Figure 34 shows the harmonic distortion registered at bus 27.
At bus 27, the THDv is reduced from 23.32% to 11.39%, representing an improvement of 48.84%.
The voltage profile of the system with the UPQC installed at bus 14 in this scenario is presented in Figure 35.
Once the analysis with the UPQC placed at bus 14 is completed, the equipment is relocated to bus 19 and the corresponding THDv calculations are performed again.

5.5.2. UPQC at Bus 19

In this case, the new THD for bus 14 is obtained, as shown in Figure 36.
Compared to the base system with DG, the THD recorded at this bus improves by 42.36%. Additionally, bus 19 registers a new THDv of 2.90%, as illustrated in Figure 37.
This result represents a 63.16% improvement relative to the base system with DG. Meanwhile, Figure 38 shows the new THDv registered at bus 27.
The THDv at this bus decreases significantly, from 23.32% in the base system to 5.53% with the UPQC connected at bus 19, which corresponds to an improvement of 76.26%.
With this UPQC placement, the resulting voltage profiles are presented in Figure 39.

5.5.3. UPQC at Bus 27

After completing the analysis for bus 19, the UPQC is connected to bus 27, and the THDv is analyzed for each node with nonlinear loads, starting with bus 14, as shown in Figure 40.
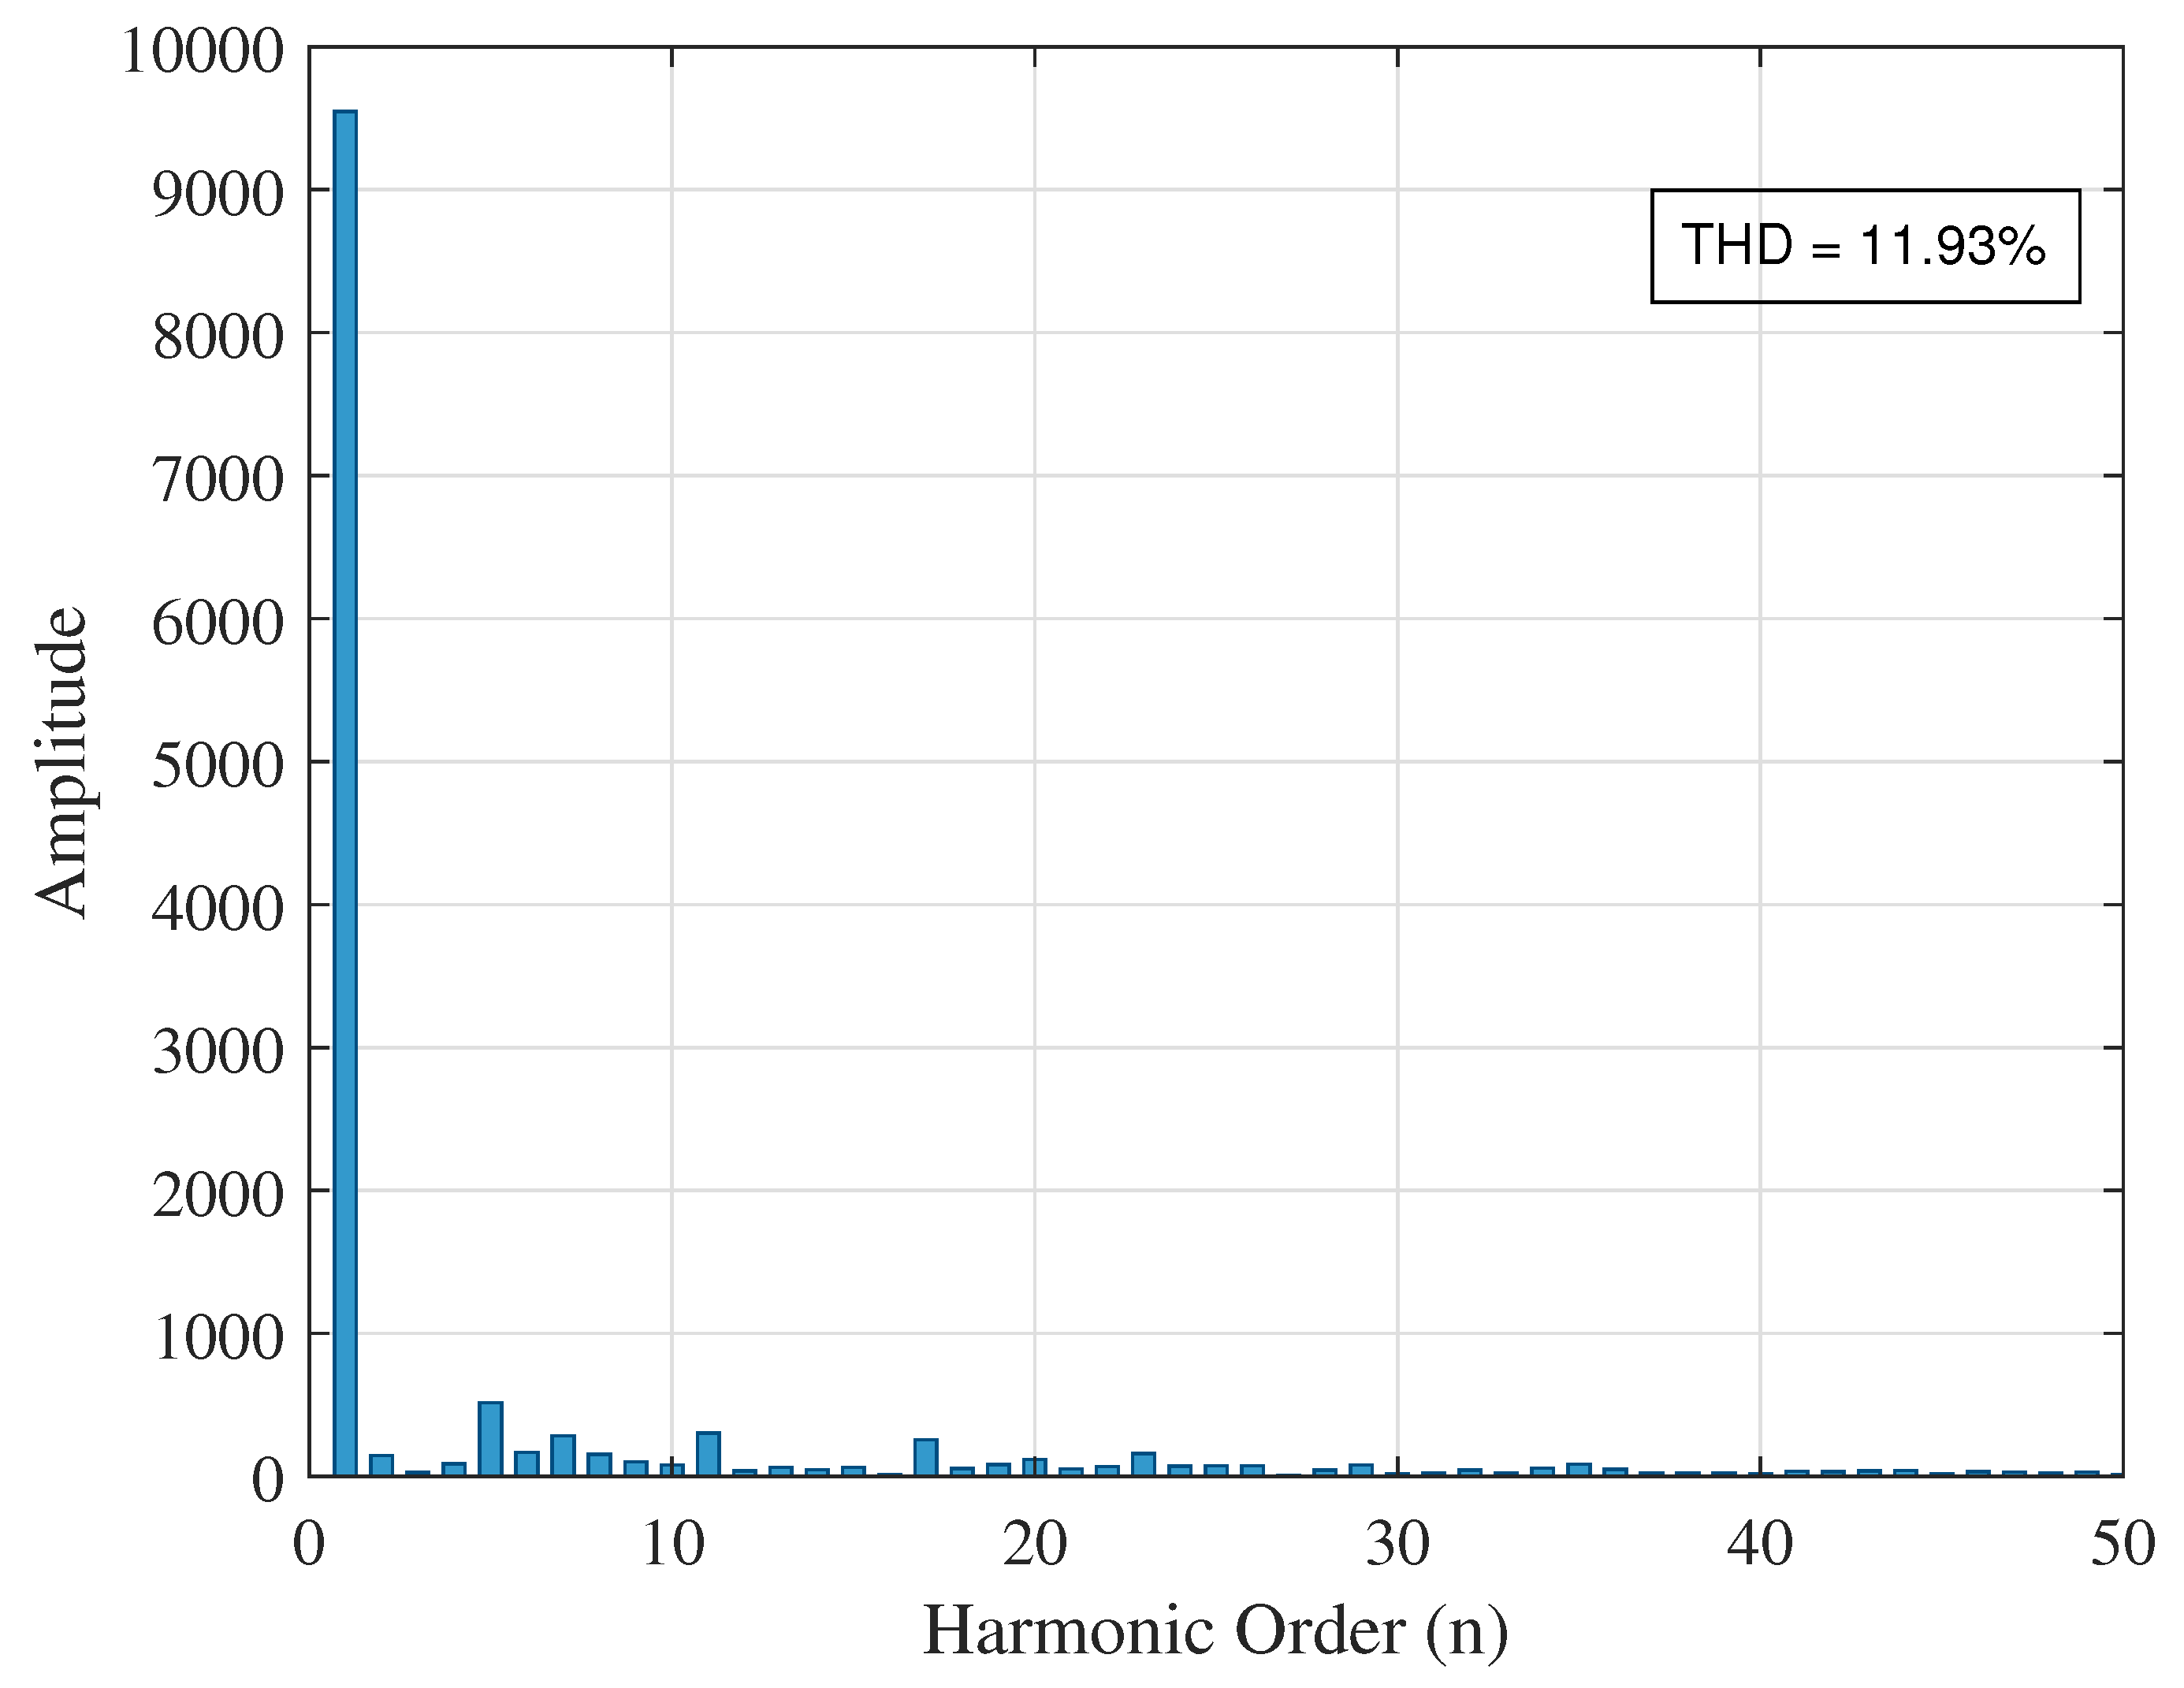
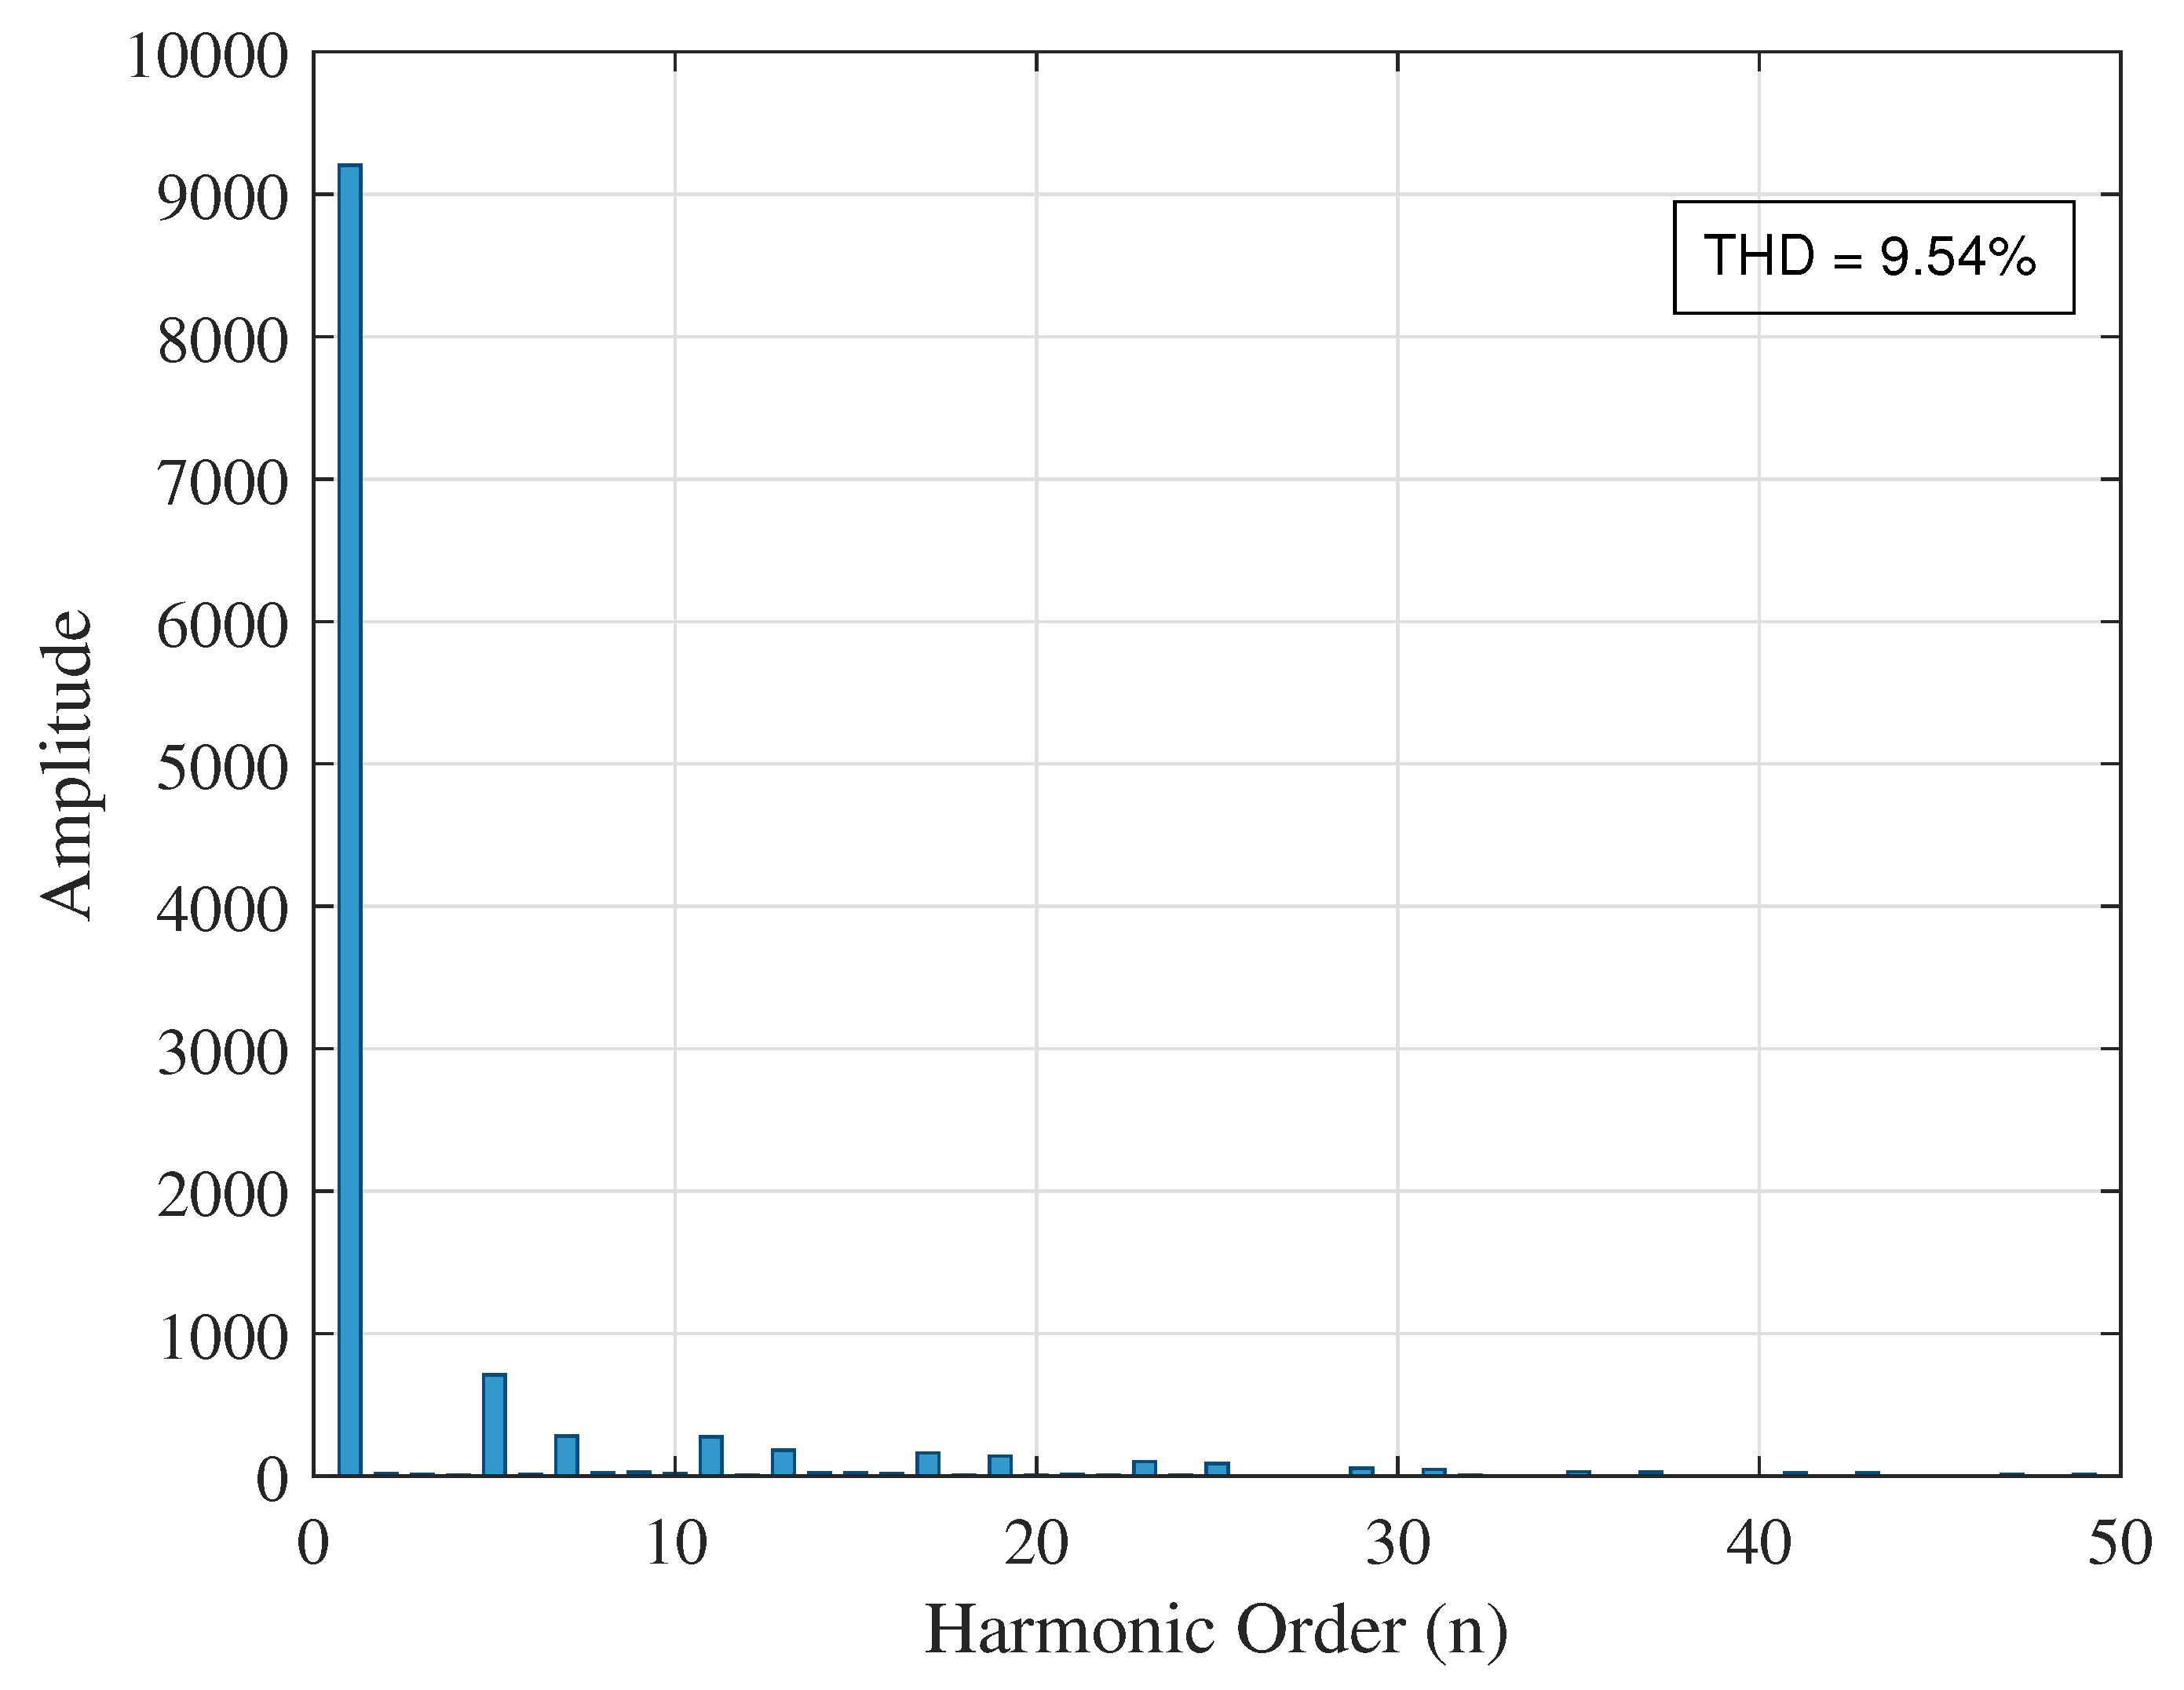
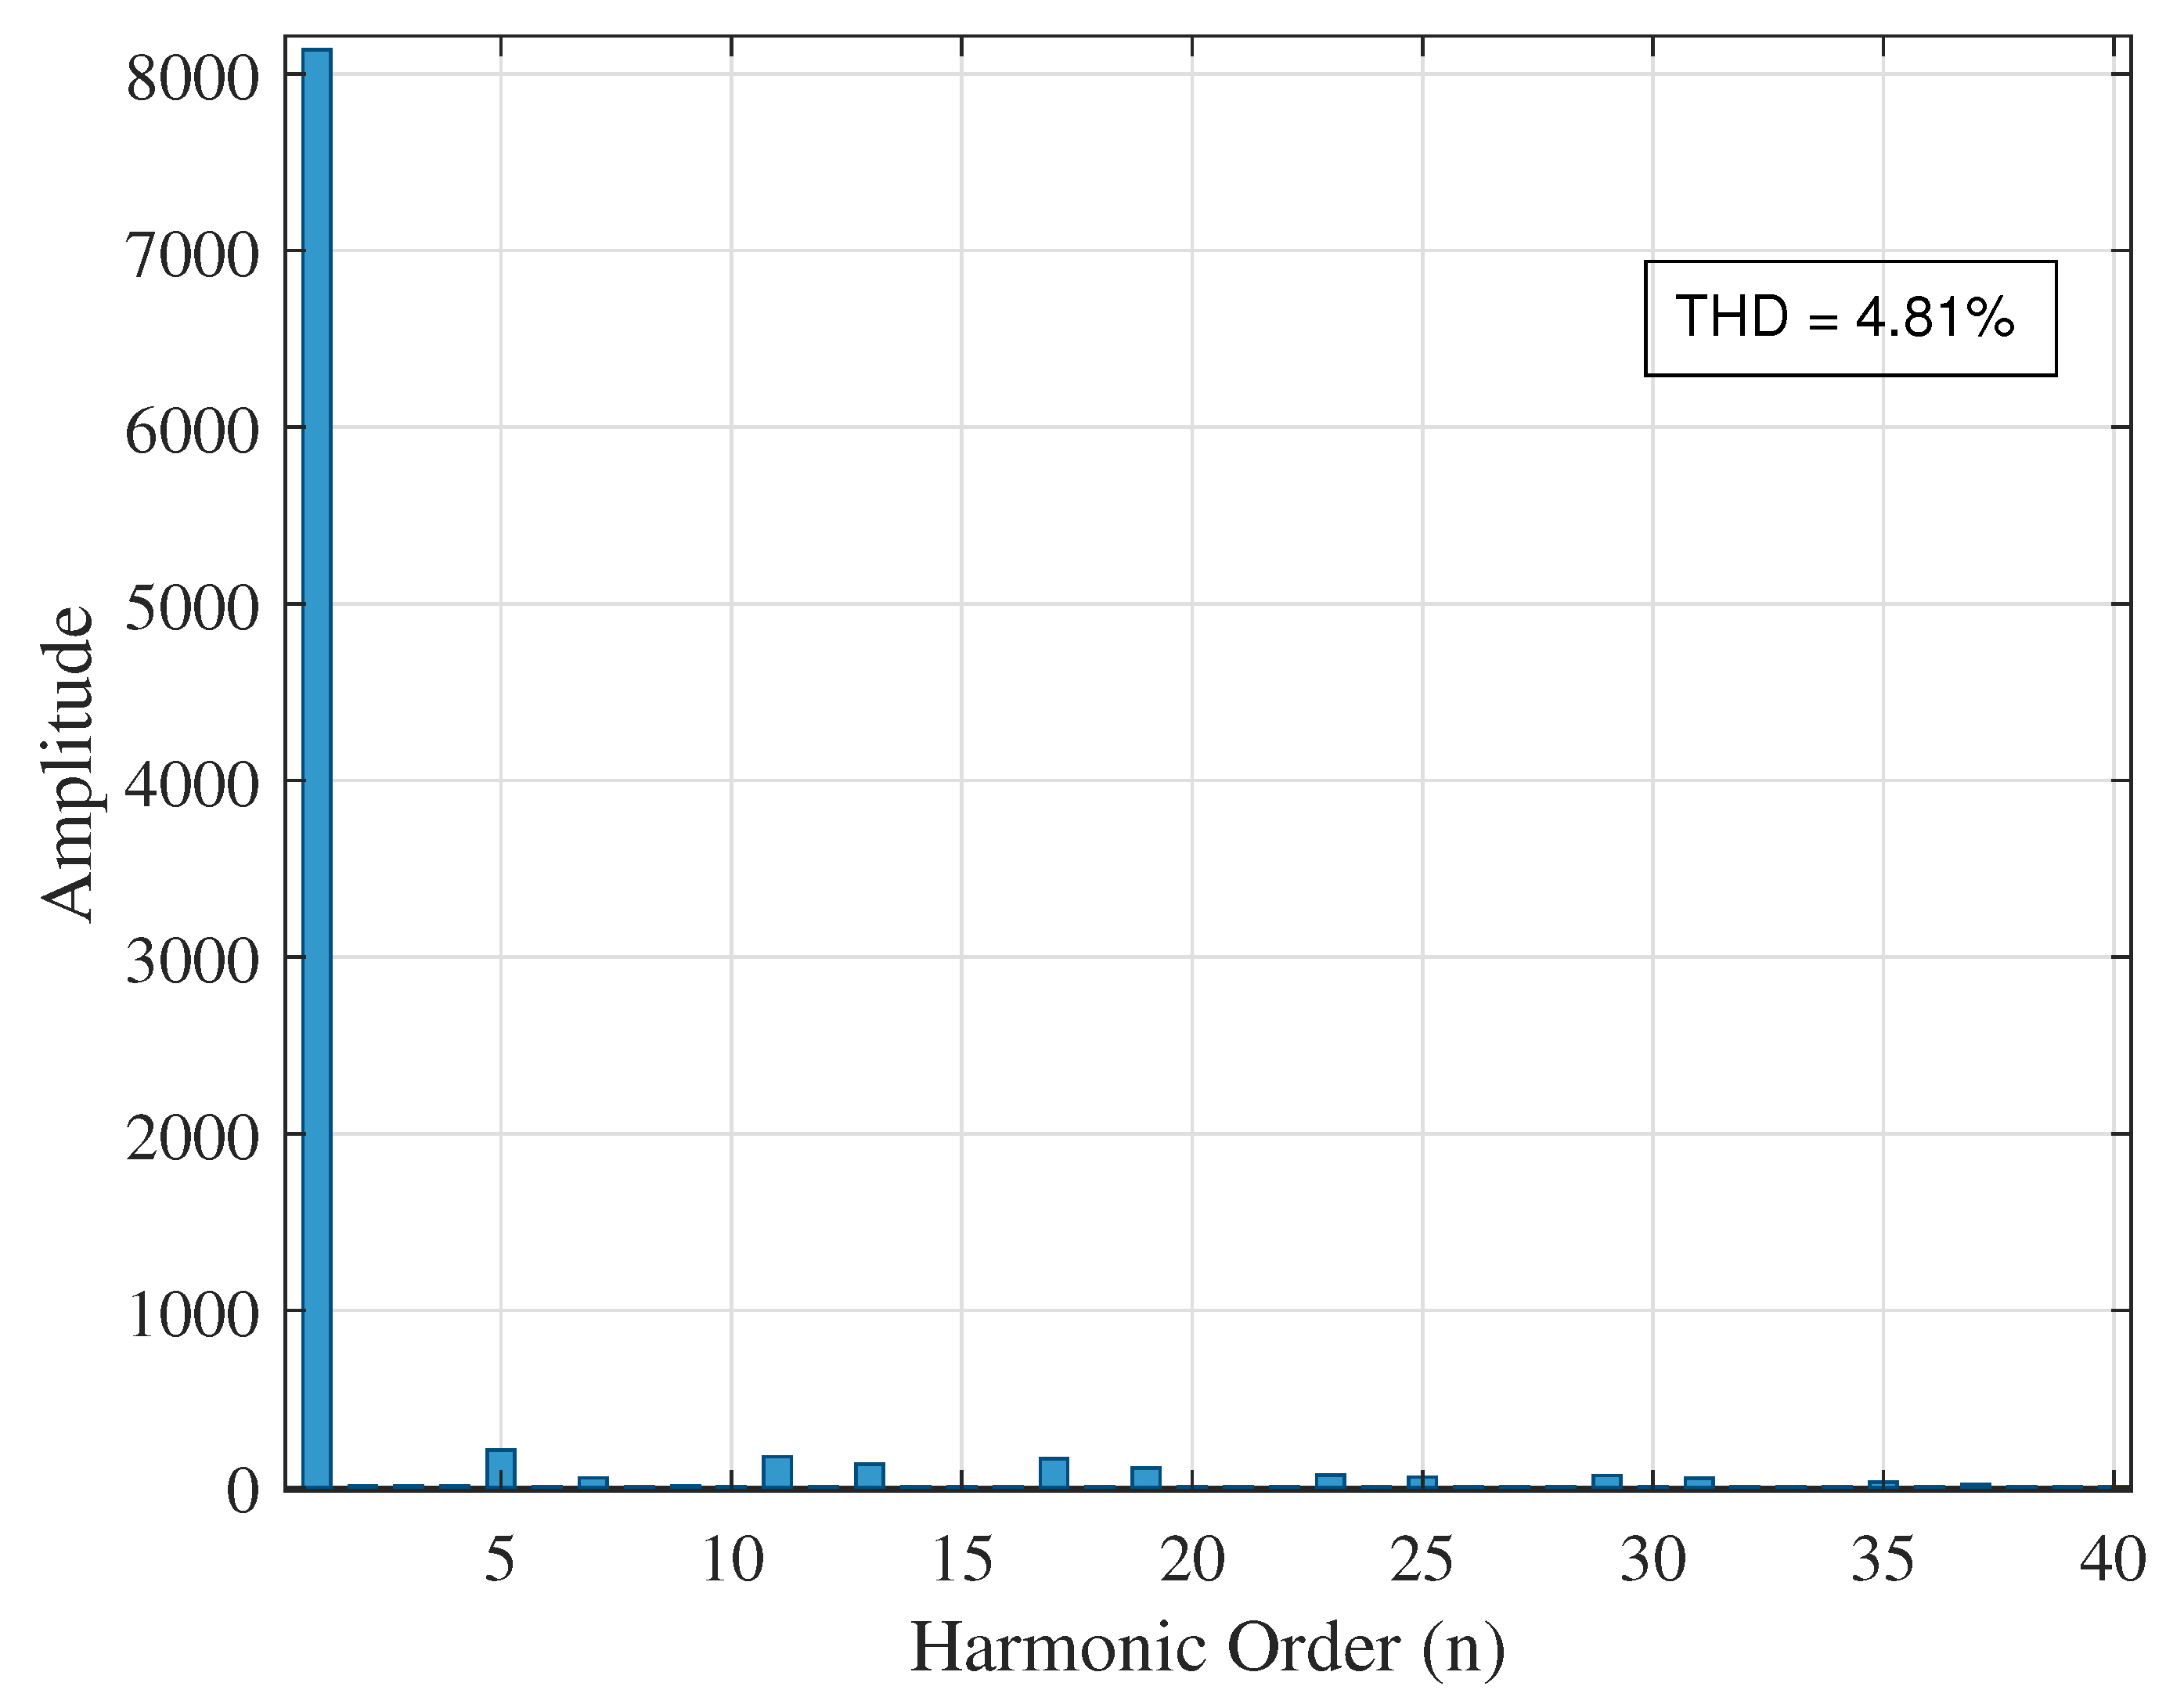
In this scenario, bus 14 presents a THDv of 4.81% compared to the previous case, in which the recorded value was 9.54%. A significant change can also be observed at bus 19, as shown in Figure 41.
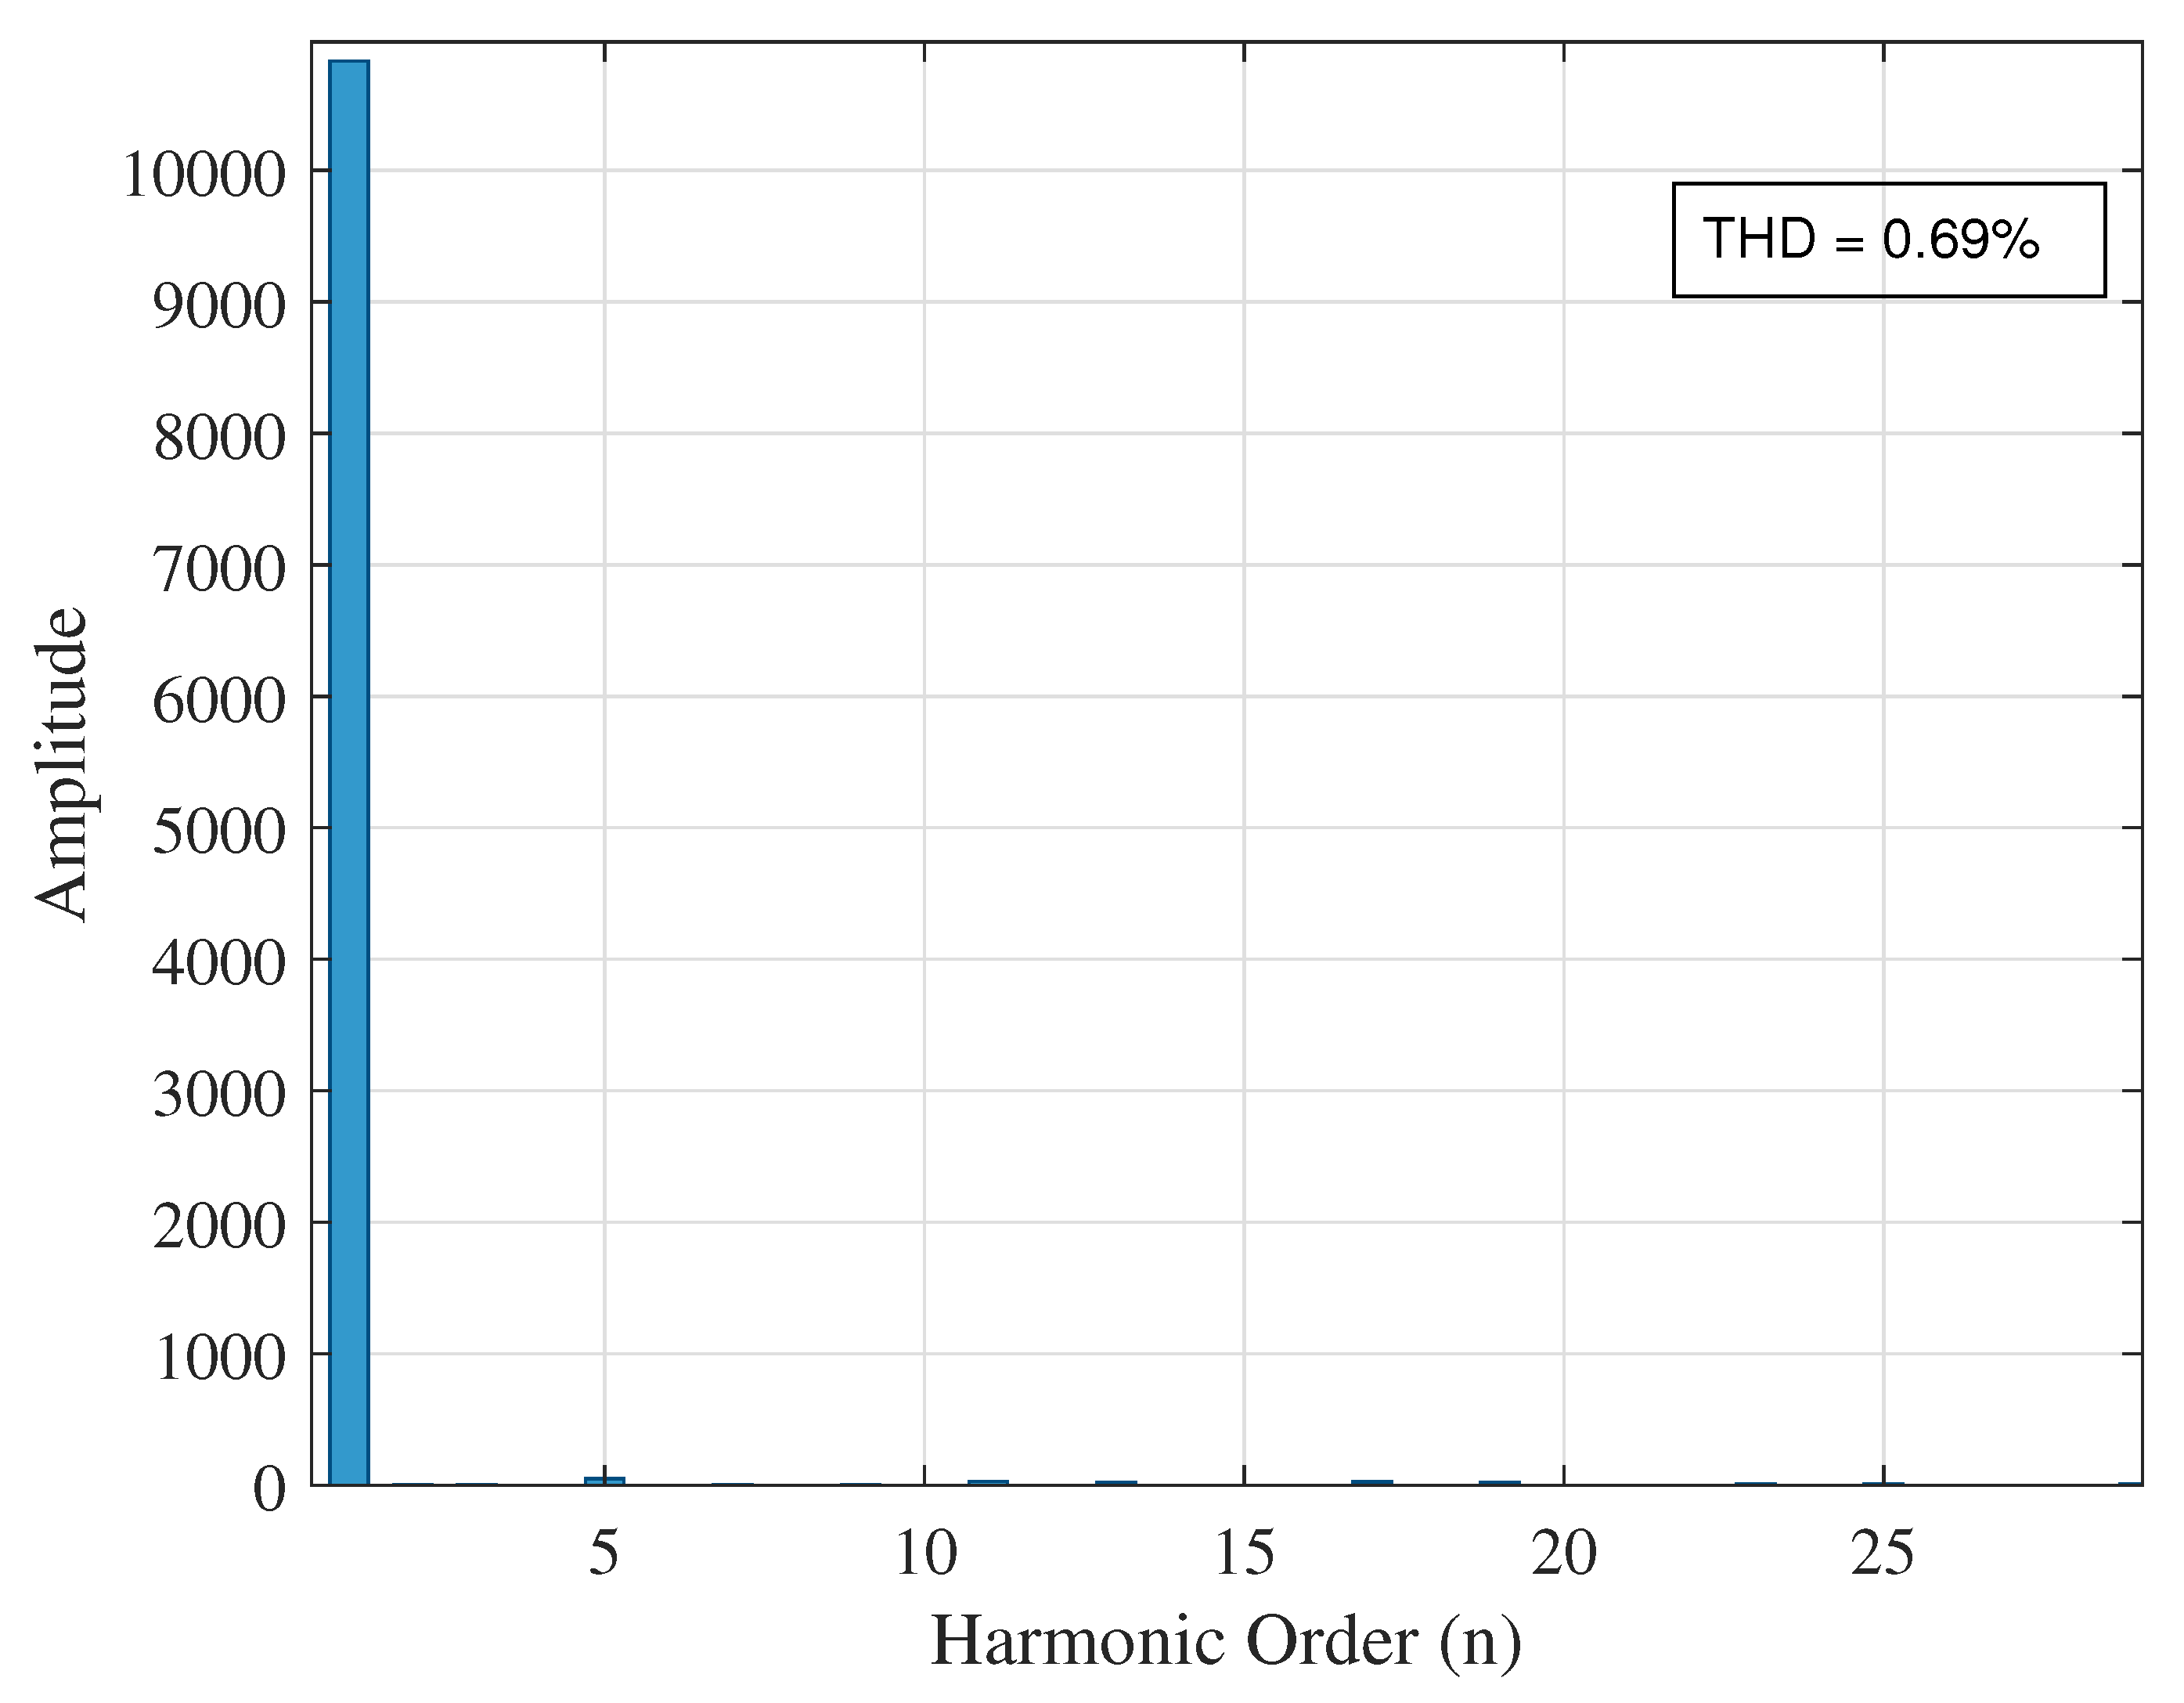
In this case, the improvement is quite evident, with the THDv reduced from 7.87% to 0.69%, which corresponds to a 91.24% enhancement in power quality. Figure 42 presents the harmonics at bus 27, where the recorded THDv is 10.57%.
This result represents a 54.12% improvement at this bus. With the UPQC installed at bus 27, the voltage profiles obtained are shown in Figure 43.
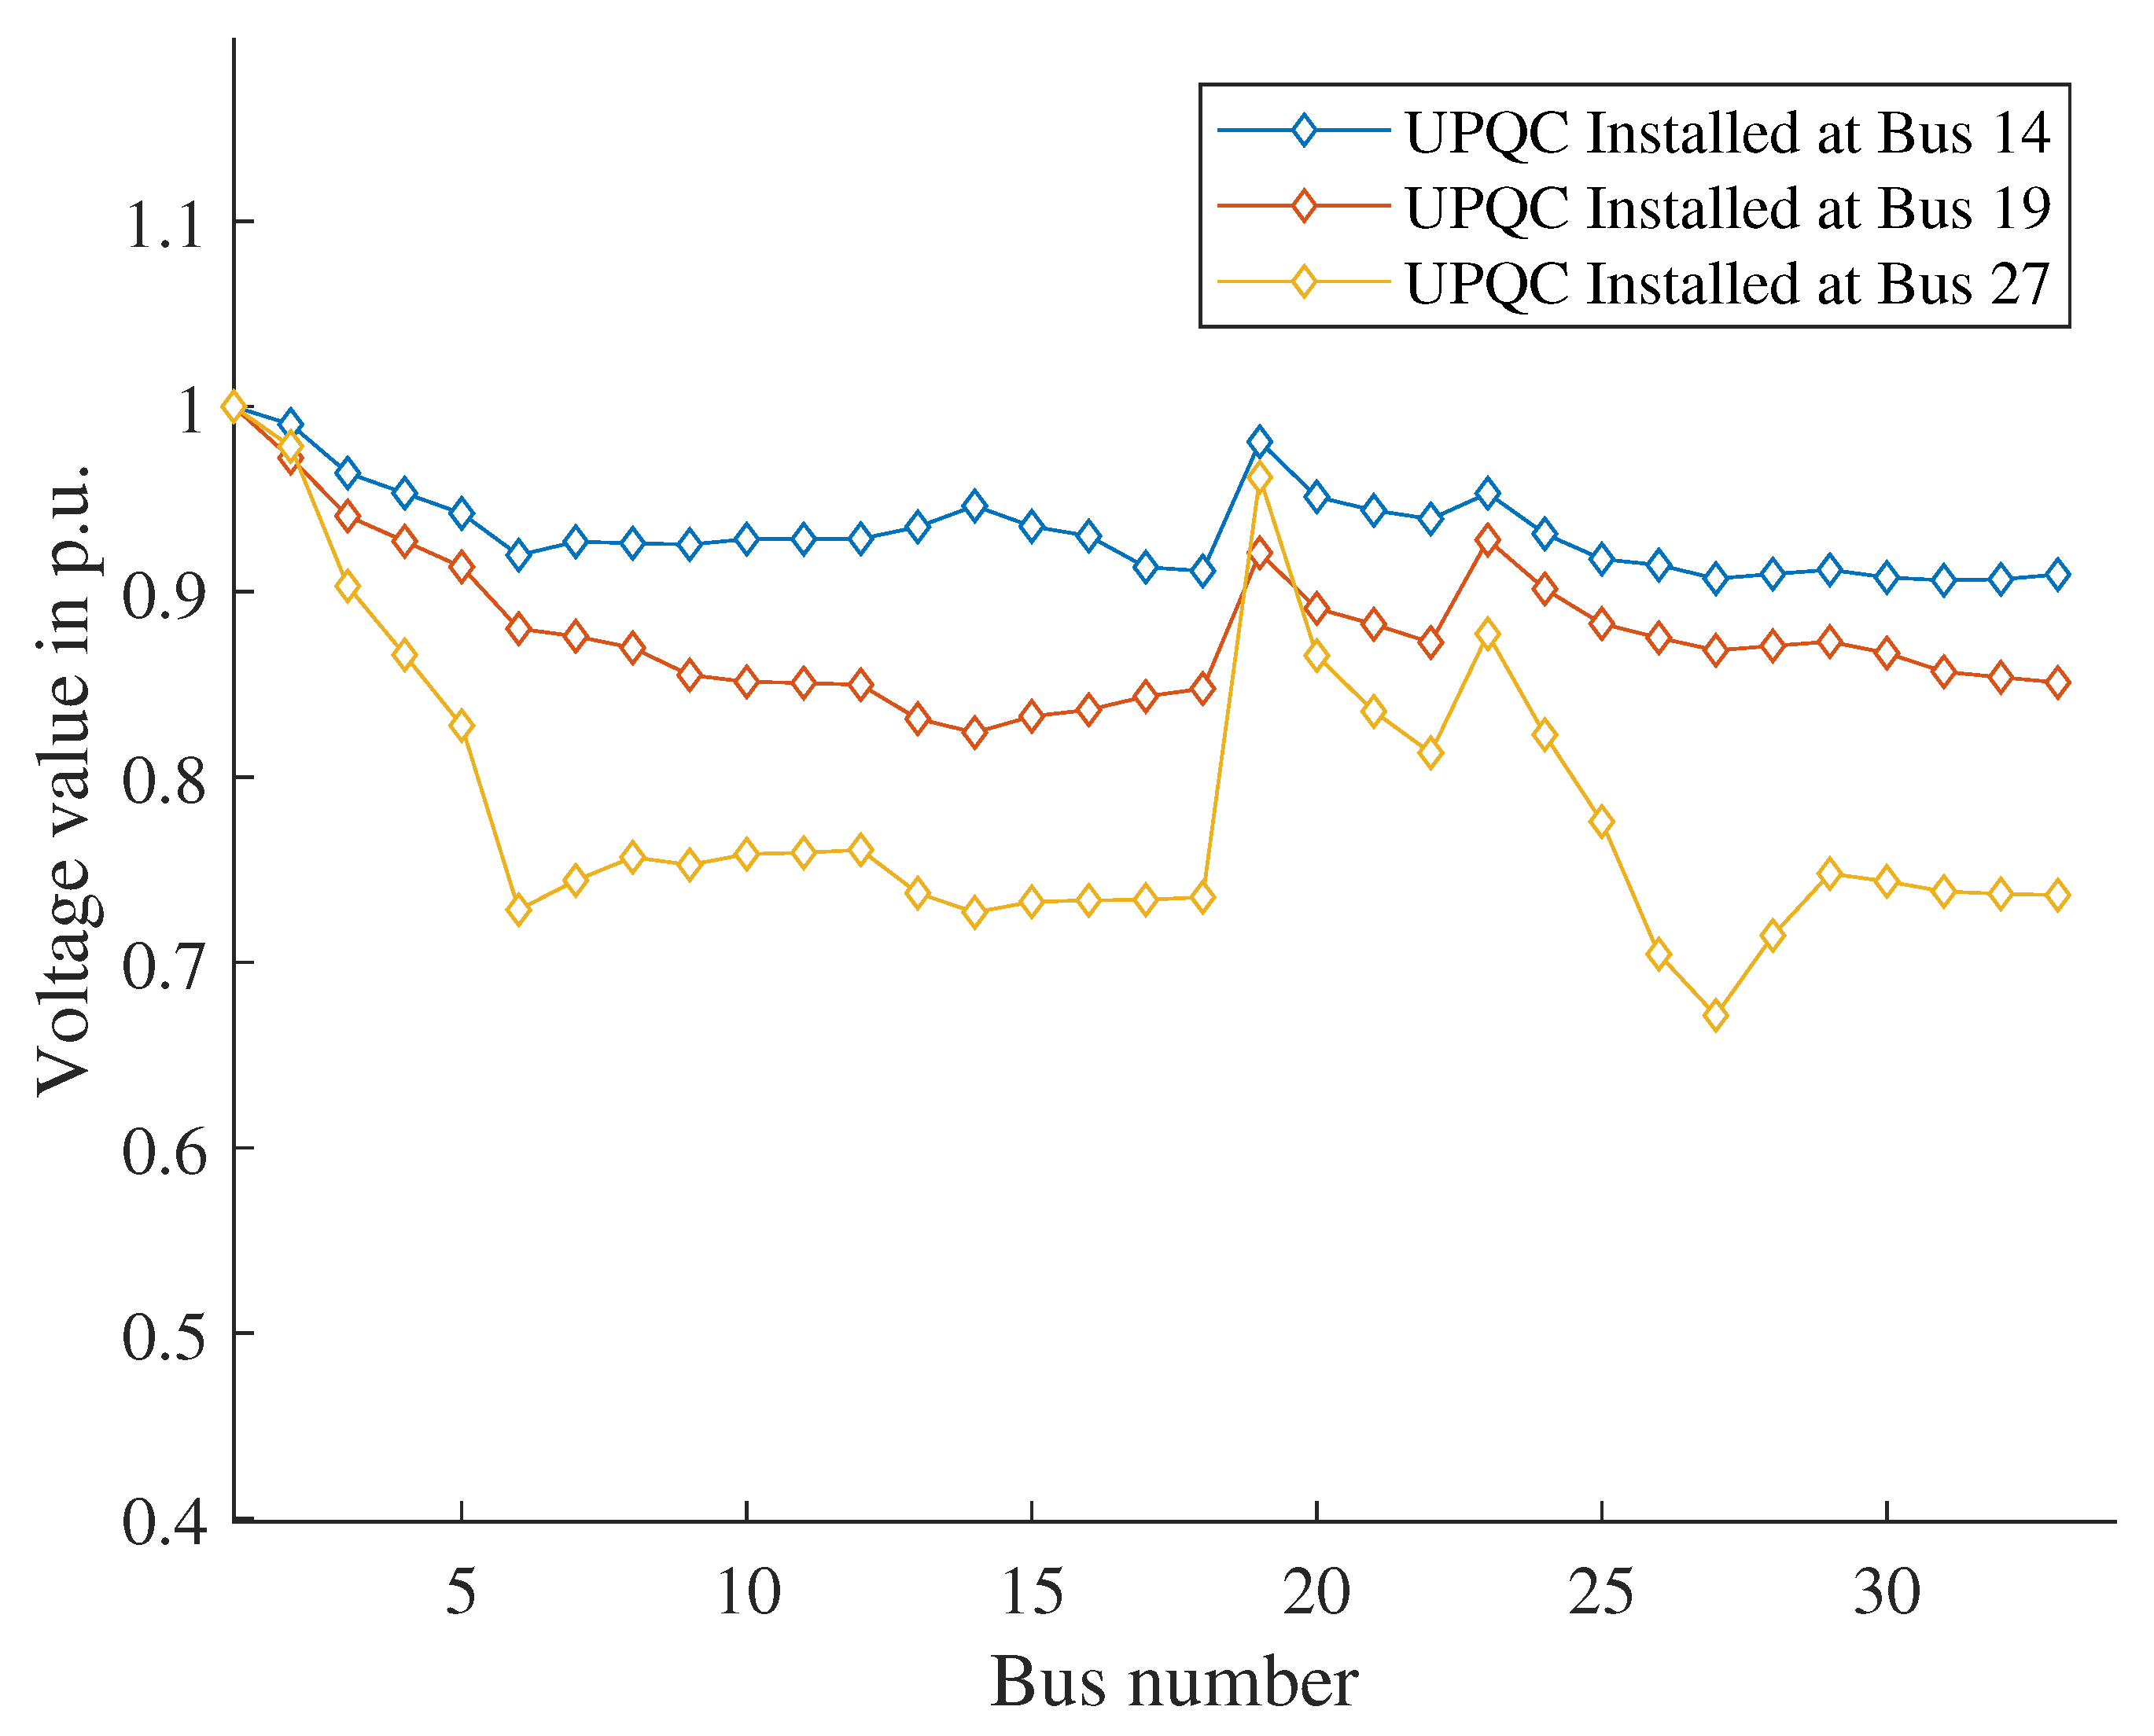
With the THDv analysis for this case study completed, the next step is to calculate the voltage deviation profile (VDP). To begin, a comparative graph is generated showing the voltage profiles for each of the three UPQC placement scenarios considered in this study, as illustrated in Figure 44.
These changes in voltage levels show a clear distinction compared to the previous case study. To ensure the optimal location of the power quality device, the corresponding calculations will now be performed using the previously established optimization strategy.

5.5.4. Optimal Location Analysis

As in the previous case study, the process begins by determining the values corresponding to the two objective functions.
f 1 ( 14 ) = 17.76 3 = 5.92 %
f 1 ( 19 ) = 17.97 3 = 5.99 %
f 1 ( 27 ) = 16.2 3 = 5.4 %
f 2 ( 14 ) = 2.2036 33 = 0.0668 p . u .
f 2 ( 19 ) = 4.0010 33 = 0.1212 p . u .
f 2 ( 27 ) = 7.0182 33 = 0.2127 p . u .
Once the average values of THDv ( f 1 ) and the voltage deviation profile ( f 2 ) are obtained, both functions ( f 1 ^ and f 2 ^ ) are normalized in order to compute the weighted cost function.
J ( 14 ) = 0.3 · 0.88 + 0.7 · 0.067 = 0.26
J ( 19 ) = 0.3 · 1 + 0.7 · 0.37 = 0.56
J ( 27 ) = 0.3 · 0 + 0.7 · 1 = 0.7
For this second case study, it is clearly evident that the optimal location for the UPQC is at bus 14, since this scenario yields the lowest value of the objective function among the three evaluated alternatives.
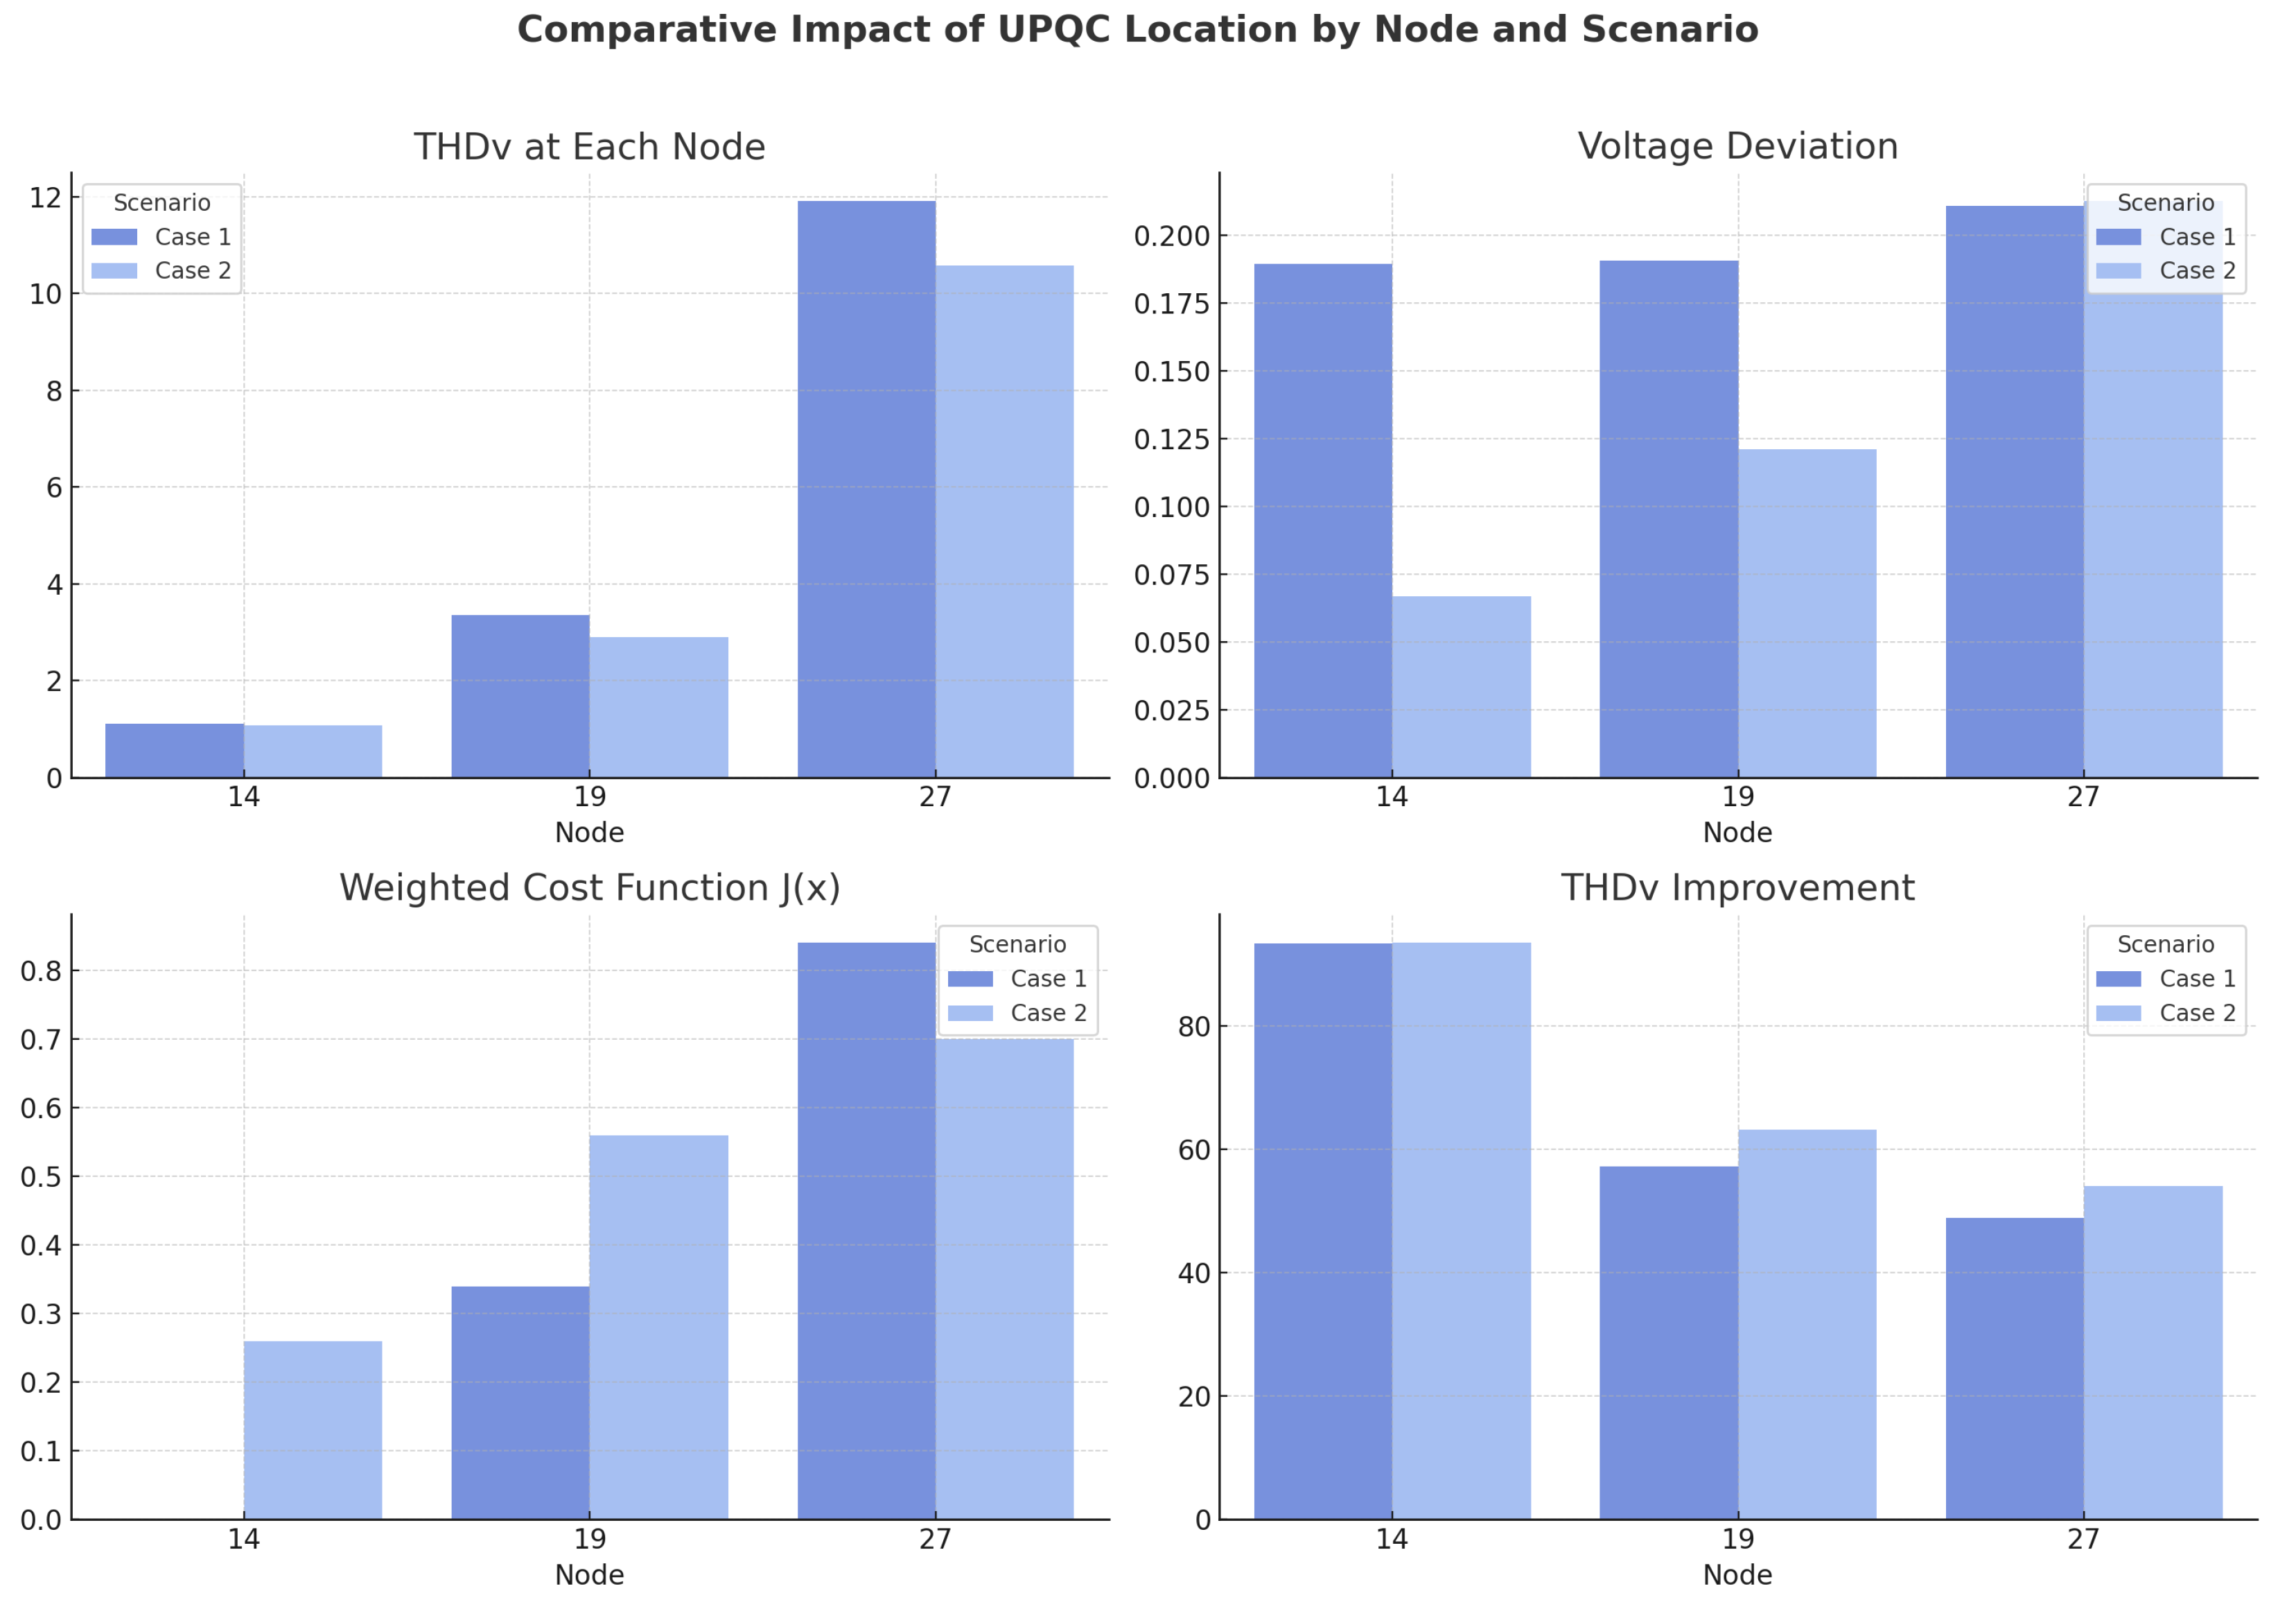
To provide a clearer and more concise visualization of the impact of the UPQC in both study cases, Table 7 presents a comparative summary of the most relevant indicators. The table includes the total harmonic distortion of voltage (THDv) at each node with nonlinear load (nodes 14, 19, and 27), the global voltage deviation, the weighted cost function value J ( x ) , and the percentage of THDv improvement with respect to the base scenario without UPQC. This summary facilitates the identification of the optimal installation node and quantifies the performance benefits achieved by each configuration.
To visually enhance the interpretation of the results, Figure 45 presents a graphical summary of key performance indicators for each scenario and UPQC location. This includes the total harmonic distortion in voltage (THDv), global voltage deviation, the weighted objective function value J ( x ) , and the percentage improvement in THDv with respect to the base case. The graph enables a clearer understanding of the impact of each configuration and supports the optimal placement analysis discussed previously.

5.6. Robustness Summary and Statistical Dispersion of THDv

Although the simulations are deterministic (i.e., repeated runs under identical operating points return identical values), it is still informative to quantify the dispersion across monitored buses for each scenario as a measure of spatial robustness. Table 8 reports the mean and standard deviation of voltage THD (%THDv) across buses 14, 19, and 27 in the base condition and with the UPQC placed at bus 14, for both scenarios considered (without DG and with PV-based DG at its nominal operating point). The reduction in the mean THDv relative to the corresponding base condition is also provided.
The results show substantial reductions in the mean THDv across the monitored buses when the UPQC is installed at bus 14 in both scenarios (approximately 66 % without DG and 64 % with DG), together with a decrease in dispersion (standard deviation). This indicates that, beyond improving the average harmonic distortion, the proposed placement also contributes to a more uniform power quality level across the affected area of the network. Because the simulations are deterministic, classical inferential tools (e.g., p-values) are not directly applicable; nonetheless, the spatial statistics reported here provide a concise and reproducible summary of robustness across buses under the tested operating conditions.

6. Discussion and Novelty of the Proposed Approach

The UPQC placement problem in this study is explicitly formulated as a constrained combinatorial optimization task, where the decision variable indicates the location of the device within the test network, subject to technical and operational limits. The optimization simultaneously considers multiple technical objectives: (i) minimization of voltage total harmonic distortion (THDv) at all monitored buses, (ii) improvement of voltage profiles across the network, and (iii) reduction of active power losses.
Unlike many existing approaches that address these objectives separately or focus solely on harmonic mitigation, the present work integrates all three performance indicators into a unified decision-making framework. The evaluation was conducted for all buses in the system, demonstrating that the most beneficial placements under nonlinear load conditions consistently yield superior results in all objectives. This comprehensive perspective ensures that the selected location not only reduces distortion but also contributes to overall network performance improvement.
The chosen exhaustive search method guarantees the identification of the exact global optimum within the reduced candidate set, which is computationally feasible in the studied system. This ensures the robustness of the conclusions without relying on stochastic or heuristic approximations. Furthermore, the methodology is scalable: for larger systems or multi-device installations, it can be adapted to incorporate metaheuristic optimization algorithms, cost constraints, and additional power quality indices.
The novelty of the proposed approach lies in:
  • The simultaneous optimization of THDv, voltage profile, and loss minimization for UPQC placement under nonlinear load conditions.
  • The application of the method to the complete network, with results confirming the dominance of nonlinear-load buses as optimal locations.
  • The adaptability of the framework to extended scenarios, including multiple UPQC devices, economic evaluation, and larger network sizes.
This integrated methodology provides a rigorous, transparent, and technically robust foundation for decision-making in practical UPQC deployment projects.

7. Conclusions

This study presented an exhaustive search strategy to determine the optimal placement of a UPQC in distribution networks affected by nonlinear loads and distributed generation. The IEEE 33-bus distribution system was employed as the test benchmark to evaluate two representative scenarios: the first involving the inclusion of nonlinear loads at nodes 14, 19, and 27, and the second incorporating a 3.5 kW photovoltaic-based DG at node 24, simulating typical residential or small commercial installations commonly found in urban distribution networks.
The results obtained in the first case study showed that the optimal location for the UPQC is at node 14, as confirmed by the proposed optimization model based on a weighted cost function. Placing the UPQC at this node resulted in substantial improvements in the voltage total harmonic distortion (THDv), with reductions of 93.34% at node 14, 39.44% at node 19, and 54.83% at node 27, compared to the base system without compensation.
In the second case study, which included the DG, it was also confirmed that node 14 remains the optimal location for the UPQC, yielding the lowest value of the objective function (0.26). In this scenario, the THDv was improved by 93.47% at node 14, 39.64% at node 19, and 48.84% at node 27. These results highlight the effectiveness of the proposed methodology in identifying the most suitable placement for the power quality conditioner, even when the network topology changes due to the integration of distributed generation.
Although the optimal location of the UPQC did not change between the two case studies, the inclusion of the DG did introduce variations in the voltage profile during the exhaustive search process. This outcome underlines the importance of considering the presence of distributed energy sources in future studies, particularly when analyzing the interaction between active compensation devices and renewable generation units.
Overall, this research validates the use of an exhaustive search algorithm combined with a multi-objective cost function as an effective strategy for the optimal placement of power quality improvement equipment in modern distribution systems. The proposed methodology not only enhances voltage profile stability but also achieves significant reductions in harmonic distortion, ensuring compliance with power quality standards under various operating conditions.

Author Contributions

J.S.E.G. and A.A.T. contributed equally to this work. All authors have read and agreed to the published version of the manuscript.

Funding

This research received no external funding.

Conflicts of Interest

The authors declare no conflicts of interest.

Abbreviations

ACAlternating Current
DCDirect Current
DGDistributed Generation
PVPhotovoltaic
UPQCUnified Power Quality Conditioner
APFActive Power Filter
DVRDynamic Voltage Restorer
SVCStatic Var Compensator
STATCOMStatic Synchronous Compensator
D-STATCOMDistribution Static Compensator
THDTotal Harmonic Distortion
THDvVoltage Total Harmonic Distortion
RMSRoot Mean Square
p.u.Per unit
IEEEInstitute of Electrical and Electronics Engineers
IECInternational Electrotechnical Commission
ANSIAmerican National Standards Institute
ARCERNNRAgencia de Regulación y Control de Energía y Recursos Naturales no Renovables

References

  1. Mangalapuri, S.; Sobhan, P.V. Analysis and Improvement of the Power Quality in Grid Integrated to Distributed Generation (Solar PV System) Using UPQC. In Proceedings of the 2023 International Conference on Advanced and Global Engineering Challenges, AGEC 2023, Kakinada, India, 23–24 June 2023; pp. 20–25. [Google Scholar] [CrossRef]
  2. Chindris, M.; Cziker, A.; Miron, A. UPQC—The best solution to improve power quality in low voltage weak distribution networks. In Proceedings of the 2017 International Conference on Modern Power Systems, MPS 2017, Cluj-Napoca, Romania, 6–9 June 2017; pp. 1–8. [Google Scholar] [CrossRef]
  3. Saliganti, K.; Papana, V.P.; Erukula, V. Performance Analysis of Solar PV-UPQC for Enhanced Power Quality. J. Eur. Syst. Autom. 2025, 58, 149–159. [Google Scholar] [CrossRef]
  4. Bhosale, S.S.; Bhosale, Y.N.; Chavan, U.M.; Malvekar, S.A. Power Quality Improvement by Using UPQC: A Review. In Proceedings of the 2018 International Conference on Control, Power, Communication and Computing Technologies, ICCPCCT 2018, Kannur, India, 23–24 March 2018; pp. 375–380. [Google Scholar] [CrossRef]
  5. Ghosh, A.; Ledwich, G. Unified Power Quality Conditioner. In Power Quality Enhancement Using Custom Power Devices; Springer Nature: New York, NY, USA, 2018; pp. 379–406. [Google Scholar] [CrossRef]
  6. Pathik, B.B.; Islam, S.; Akram, N.M.; Zaman, M.S.; Al-Nahian, M.A. Total Harmonic Distortion Reduction in a Power Grid: A UPQC Based Approach. In Proceedings of the International Conference on Robotics, Electrical and Signal Processing Techniques, Dhaka, Bangladesh, 7–8 January 2023; pp. 264–268. [Google Scholar] [CrossRef]
  7. Gu, J.; Xu, D.; Liu, H.; Gong, M. Unified power quality conditioner (UPQC): The principle, control and application. In Proceedings of the Power Conversion Conference-Osaka 2002, PCC-Osaka 2002, Osaka, Japan, 2–5 April 2006; Volume 1, pp. 80–85. [Google Scholar] [CrossRef]
  8. Dash, S.K.; Ray, P.K.; Ray, P. Implementation of adaptive control strategies for PV system integrated unified conditioner for optimal power quality regulation. Results Eng. 2025, 26, 105122. [Google Scholar] [CrossRef]
  9. Namdev, P.; Singh, R. Advances in Power Quality Enhancement: A Comprehensive Review of Custom Power Devices and Mitigation Strategies. In Proceedings of the 2023 3rd International Conference on Energy, Power and Electrical Engineering, EPEE 2023, Wuhan, China, 15–17 September 2023; pp. 761–765. [Google Scholar] [CrossRef]
  10. Karelia, N.; Sant, A.V.; Pandya, V. Comparison of UPQC topologies for power quality enhancement in grid integrated renewable energy sources. In Proceedings of the 2019 IEEE 16th India Council International Conference, INDICON 2019—Symposium Proceedings, Rajkot, India, 13–15 December 2019. [Google Scholar] [CrossRef]
  11. Chourasia, M.; Srivastava, S.P.; Panda, A. Control strategy for voltage sag/swell/harmonic/flicker compensation with conventional and fuzzy controller(UPQC). In Proceedings of the India International Conference on Power Electronics, IICPE, Nagercoil, India, 19–20 March 2015; pp. 1–6. [Google Scholar] [CrossRef]
  12. IEEE Std 1159; IEEE Recommended Practice for Monitoring Electric Power Quality. IEEE: Piscataway, NJ, USA, 2009; Volume 1995, pp. 1–94.
  13. Hernández-Mayoral, E.; Jiménez-Román, C.R.; Enriquez-Santiago, J.A.; López-López, A.; González-Domínguez, R.A.; Ramírez-Torres, J.A.; Rodríguez-Romero, J.D.; Jaramillo, O.A. Power Quality Analysis of a Microgrid-Based on Renewable Energy Sources: A Simulation-Based Approach. Computation 2024, 12, 226. [Google Scholar] [CrossRef]
  14. Agencia de Regulación y Control de Energía y Recursos Naturales No Renovables. Regulación Nro. ARCERNNR 002/20 (Codificada); Agencia de Regulación y Control de Energía y Recursos Naturales No Renovables: Guayaquil, Ecuador, 2023; Volume 20, pp. 1–35.
  15. Yadav, S.K.; Patel, A.; Mathur, H.D. Comparison of power losses for different control strategies of UPQC. In Proceedings of the PIICON 2020—9th IEEE Power India International Conference, Delhi, India, 28 February–1 March 2020; pp. 3–8. [Google Scholar] [CrossRef]
  16. Da Silva, S.A.; Modesto, R.A.; Sampaio, L.P.; Campanhol, L.B. Dynamic Improvement of a UPQC System Operating under Grid Voltage Sag/Swell Disturbances. IEEE Trans. Circuits Syst. II Express Briefs 2024, 71, 2844–2848. [Google Scholar] [CrossRef]
  17. Kaur, S.; Kaur, N. Analysis of Designed Power System with Power Quality Improvement by Using UPQC. In Proceedings of the International Conference on Self Sustainable Artificial Intelligence Systems, ICSSAS 2023—Proceedings, Erode, India, 8–20 October 2023; pp. 1719–1724. [Google Scholar] [CrossRef]
  18. Jaiswal, P.N.; Thakre, K.; Nigam, P. Comparison of DSTATCOM, DVR and UPQC for Mitigating Voltage Sag in Distribution System. In Proceedings of the 2022 IEEE 2nd International Symposium on Sustainable Energy, Signal Processing and Cyber Security, iSSSC 2022, Gunupur, India, 15–17 December 2022; pp. 7–12. [Google Scholar] [CrossRef]
  19. IEC 61000-2-4; Electromagnetic Compatibility (EMC)—Part 2-4: Environment—Compatibility Levels in Power Distribution Systems in Industrial Locations for Low-Frequency Conducted Disturbances. International Electrotechnical Commission: Geneva, Switzerland, 2023; Volume 2023.
  20. Águila Téllez, A.; López, G.; Isaac, I.; González, J.W. Optimal reactive power compensation in electrical distribution systems with distributed resources. Review. Heliyon 2018, 4, e00746. [Google Scholar] [CrossRef] [PubMed]
  21. Águila, A.; Ortiz, L.; Orizondo, R.; López, G. Optimal location and dimensioning of capacitors in microgrids using a multicriteria decision algorithm. Heliyon 2021, 7, e08061. [Google Scholar] [CrossRef] [PubMed]
  22. Zhang, X.P.; Yan, Z. Energy Quality: A Definition. IEEE Open Access J. Power Energy 2020, 7, 430–440. [Google Scholar] [CrossRef]
  23. Chawda, G.S.; Shaik, A.G.; Mahela, O.P.; Padmanaban, S.; Holm-Nielsen, J.B. Comprehensive Review of Distributed FACTS Control Algorithms for Power Quality Enhancement in Utility Grid with Renewable Energy Penetration. IEEE Access 2020, 8, 107614–107634. [Google Scholar] [CrossRef]
  24. IEEE Standard for Harmonic Control in Electric Power Systems; IEEE: Piscataway, NJ, USA, 2022.
  25. International Electrotechnical Commission (IEC). IEC 61000-2-12: Electromagnetic Compatibility (EMC)—Part 2-12: Environment—Compatibility Levels for Low-Frequency Conducted Disturbances and Signalling in Public Medium-Voltage Power Supply Systems; IEC: Geneva, Switzerland, 2003. [Google Scholar]
  26. International Electrotechnical Commission (IEC). IEC 60038:2009+AMD1:2021 CSV—Standard Voltages; IEC: Geneva, Switzerland, 2021. [Google Scholar]
  27. National Electrical Manufacturers Association (NEMA). ANSI C84.1-2020: American National Standard for Electric Power Systems and Equipment—Voltage Ratings (60 Hz); NEMA/ANSI: Rosslyn, VA, USA, 2020. [Google Scholar]
  28. Davidrajuh, R.; Rong, C. Solving Scheduling Problems with Randomized and Parallelized Brute-Force Approach. In Proceedings of the 12th International Conference on Computer Science and Information Technologies, CSIT 2019, Barcelona, Spain, 18–20 December 2019; pp. 1–4. [Google Scholar] [CrossRef]
Figure 1. Basic diagram of the UPQC.
Energies 18 04499 g001
Figure 2. Types of voltage disturbances.
Energies 18 04499 g002
Figure 3. Harmonic distortion waveform.
Energies 18 04499 g003
Figure 4. Distorted fundamental waveform.
Energies 18 04499 g004
Figure 5. 33-Bus Test Distribution System.
Energies 18 04499 g005
Figure 6. Test system with nonlinear loads.
Energies 18 04499 g006
Figure 7. Test system with nonlinear loads and DG.
Energies 18 04499 g007
Figure 8. Voltage level at each bus with nonlinear loads.
Energies 18 04499 g008
Figure 9. Three-phase voltage at buses 14, 19, and 27.
Energies 18 04499 g009
Figure 10. Voltage harmonics at bus 14 with nonlinear load.
Energies 18 04499 g010
Figure 11. Voltage harmonics at bus 19 with nonlinear load.
Energies 18 04499 g011
Figure 12. Voltage harmonics at bus 27 with nonlinear load.
Energies 18 04499 g012
Figure 13. Voltage levels at each bus with nonlinear loads and DG.
Energies 18 04499 g013
Figure 14. Voltage harmonics at bus 14 with nonlinear load and DG.
Energies 18 04499 g014
Figure 15. Voltage harmonics at bus 19 with nonlinear load and DG.
Energies 18 04499 g015
Figure 16. Voltage harmonics at bus 27 with nonlinear load and DG.
Energies 18 04499 g016
Figure 17. Initial voltage profile—Case 1.
Energies 18 04499 g017
Figure 18. Voltage profile with UPQC installed at Bus 14.
Energies 18 04499 g018
Figure 19. Voltage harmonics at Bus 14 with UPQC installed.
Energies 18 04499 g019
Figure 20. Voltage harmonics at bus 19 with UPQC installed at bus 14.
Energies 18 04499 g020
Figure 21. Voltage harmonics at bus 27 with UPQC installed at Bus 14.
Energies 18 04499 g021
Figure 22. Voltage profile with UPQC installed at Bus 19.
Energies 18 04499 g022
Figure 23. Voltage harmonics at Bus 14 with UPQC installed at Bus 19.
Energies 18 04499 g023
Figure 24. Voltage harmonics at bus 19 with UPQC installed.
Energies 18 04499 g024
Figure 25. Voltage harmonics at bus 27 with UPQC installed at bus 19.
Energies 18 04499 g025
Figure 26. Voltage profile with UPQC installed at Bus 27.
Energies 18 04499 g026
Figure 27. Voltage harmonics at Bus 14 with UPQC installed at Bus 27.
Energies 18 04499 g027
Figure 28. Voltage harmonics at bus 19 with UPQC installed at bus 27.
Energies 18 04499 g028
Figure 29. Voltage harmonics at bus 27 with UPQC installed.
Energies 18 04499 g029
Figure 30. Voltage levels with UPQC installed at each candidate bus in Case 1.
Energies 18 04499 g030
Figure 31. Average THDv as a function of DG penetration for three UPQC placements (buses 14, 19, and 27). Two penetration levels are considered with the data available: 0% (no DG) and 100% of nominal PV output (3.5 kW).
Energies 18 04499 g031
Figure 32. Harmonic distortion at bus 14 with UPQC.
Energies 18 04499 g032
Figure 33. Harmonic distortion at bus 19 with UPQC installed at bus 14.
Energies 18 04499 g033
Figure 34. Harmonic distortion at bus 27 with UPQC installed at bus 14.
Energies 18 04499 g034
Figure 35. Voltage profiles with UPQC installed at bus 14.
Energies 18 04499 g035
Figure 36. Harmonic distortion at bus 14 with UPQC installed at bus 19.
Energies 18 04499 g036
Figure 37. Harmonic distortion at bus 19 with UPQC.
Energies 18 04499 g037
Figure 38. Harmonic distortion at bus 27 with UPQC installed at bus 19.
Energies 18 04499 g038
Figure 39. Voltage profiles with UPQC installed at bus 19.
Energies 18 04499 g039
Figure 40. Harmonic distortion at bus 14 with UPQC installed at bus 27.
Energies 18 04499 g040
Figure 41. Harmonic distortion at bus 19 with UPQC installed at bus 27.
Energies 18 04499 g041
Figure 42. Harmonic distortion at bus 27 with UPQC.
Energies 18 04499 g042
Figure 43. Voltage profiles with UPQC installed at bus 27.
Energies 18 04499 g043
Figure 44. Voltage levels for UPQC placement in Case 2.
Energies 18 04499 g044
Figure 45. Graphical comparison of THDv, voltage deviation, weighted cost function J ( x ) , and THDv improvement for each UPQC location in both case studies.
Energies 18 04499 g045
Table 1. Comparison of power quality improvement devices.
VoltageCurrentCombined Function
DVR🗸--
SVC🗸--
STATCOM🗸--
DSTATCOM🗸🗸-
UPQC🗸🗸🗸
Table 2. Maximum allowable voltage harmonic distortion (THDv) percentages according to national regulation.
Voltage LevelIndividual HarmonicsTHDv
Medium Voltage3%5%
Low Voltage5%8%
Table 3. Comparative overview of approaches for power-quality enhancement and device placement (including UPQC).
Approach/FamilyDecision Scope (Typical)Objectives (Typical)Constraints (Typical)ProsCons/Risks
Exhaustive (brute-force) search
(this work)
Select UPQC bus/location over a reduced candidate setTHDv reduction, voltage deviation minimization (weighted multi-objective)Operating limits; network feasibilityGlobal optimum guaranteed on small search spaces; simple, transparent; reproduciblePoor scalability with large spaces; impractical if many candidate buses or multi-device placement
Metaheuristics (PSO, GA/NSGA-II, ACO, DE, SA) [23]Placement/sizing of compensation or control set-points; multi-device layoutsMulti-objective trade-offs (losses, THD, voltage profile, cost, reliability)Device limits, voltage/current/thermal bounds; investment budgetsHandle large, nonconvex spaces; flexible with mixed/discrete variablesNo global-optimality guarantees; parameter tuning needed; runs-to-run variability
Multicriteria/heuristic decision methods [20,21]Placement and sizing (e.g., capacitors) in distribution networksCombined technical indices (losses, voltage, THD) and economic criteriaBudgetary and operational constraintsIntegrate technical–economic viewpoints; transparent weightingSolution quality depends on criteria/weights and elicitation; may need ex-post feasibility checks
UPQC topology and control-focused works [2,4,5,7,10,11,15,17,18]Converter topology; controller design/tuning; comparative device performanceMitigation of sags/swells /THD, power factor, unbalance; dynamic responseController and device ratings; stability marginsDemonstrate mitigation efficacy and implementation aspectsTypically do not address siting as an optimization problem; limited system-level placement guidance
Table 5. Ranking of candidates vs. weight on THDv, ω 1 ( ω 2 = 1 ω 1 ).
Scenario ω 1 RangeRanking (Best → Worst)
Case 1 (no DG) [ 0 , 1 ] 14 ≺ { 19 , 27 } (bus 14 always optimal)
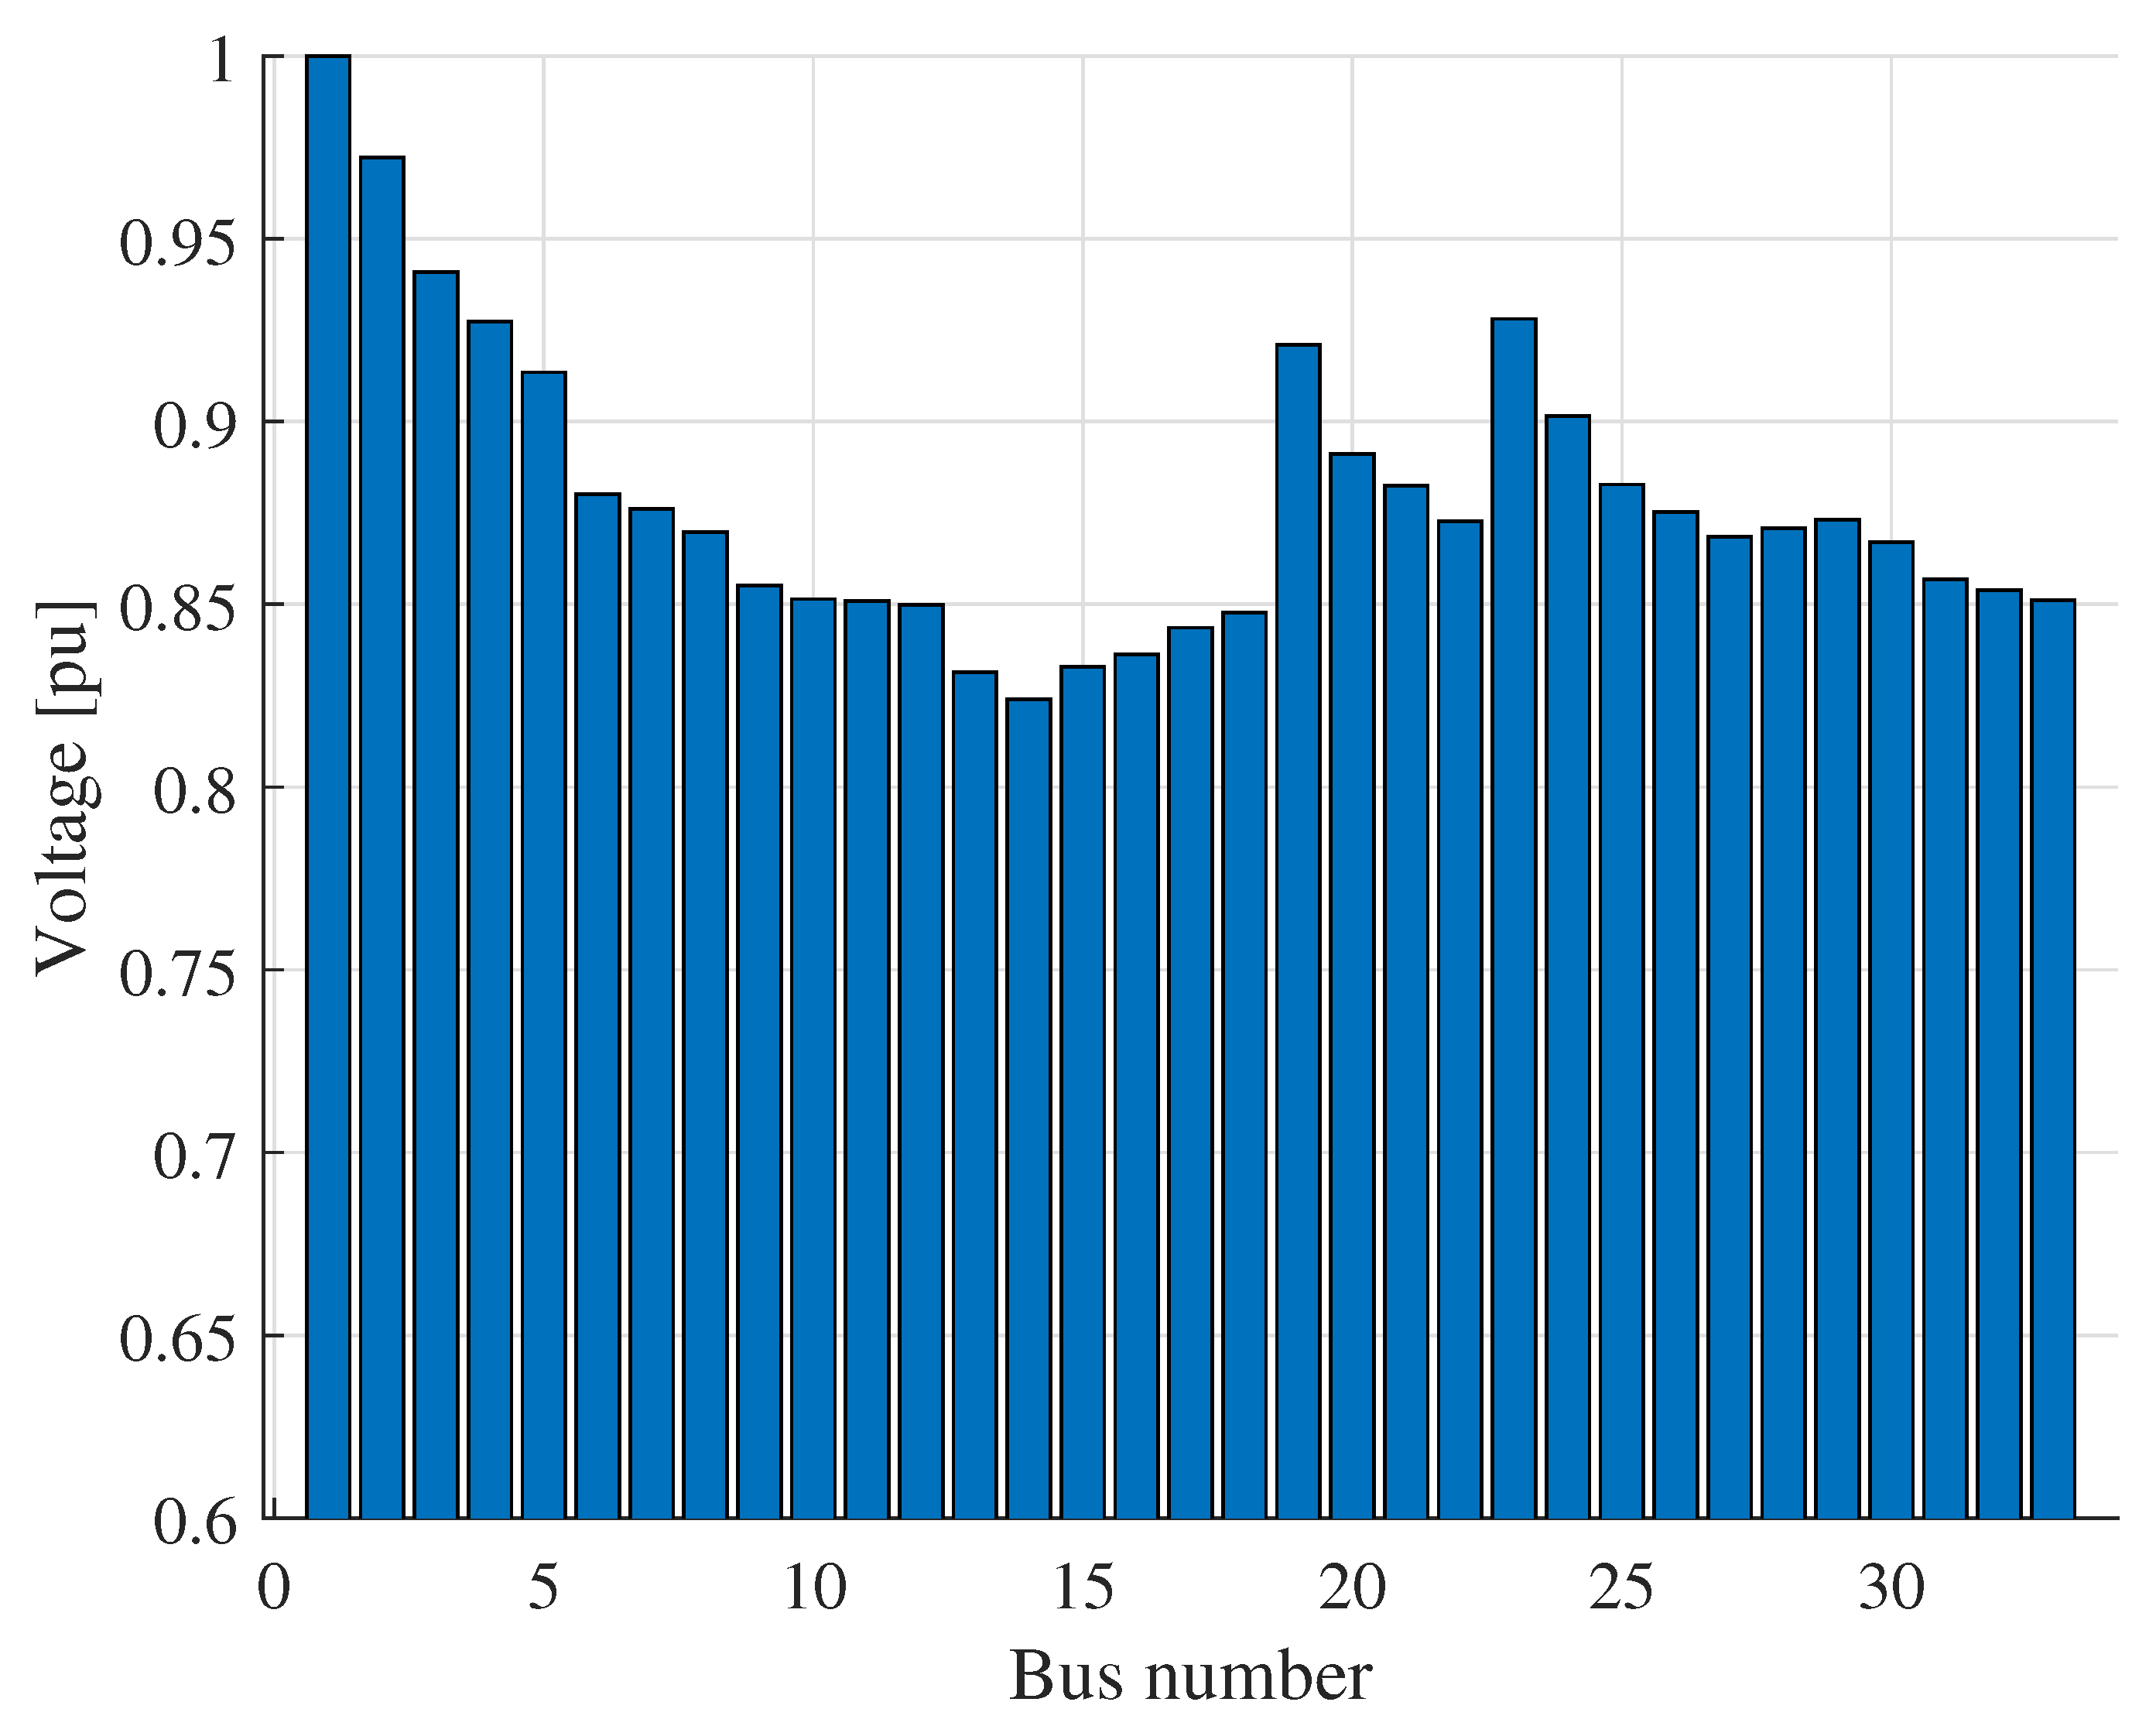
Case 2 (with DG) [ 0 , 0.515 ) 14 ≺ 19 ≺ 27
Case 2 (with DG) [ 0.515 , 1 ] 27 ≺ 19 ≺ 14
Table 6. THDv (%) at buses 14, 19, and 27 for each scenario and UPQC placement. Bold values mark the best performance per bus within each case.
CaseUPQC LocationBus 14Bus 19Bus 27
Case 1 (No DG)None (base)16.527.8623.29
At bus 141.104.7610.52
At bus 1915.013.3622.94
At bus 2711.345.2811.91
Case 2 (With DG)None (base)16.557.8723.32
At bus 141.084.7511.39
At bus 199.542.905.53
At bus 274.810.6910.57
Table 7. Comparative summary of THDv, voltage deviation, cost function and improvement for optimal UPQC locations.
ScenarioNodeTHDv (%)Voltage Deviation (p.u.) J ( x ) THDv Improvement (%)
Case 1 (No DG)141.100.18960.0093.34
193.360.19080.3457.23
2711.910.21080.8448.87
Case 2 (With DG)141.080.06680.2693.47
192.900.12120.5663.16
2710.570.21270.7054.12
Table 8. Statistical summary of THDv (%) across monitored buses (14, 19, 27): mean and standard deviation for base vs. UPQC@14 in both scenarios.
ScenarioConditionMean THDv (%)Std. Dev. (%)Reduction vs. Base (%)
Case 1 (no DG)Base (buses 14/19/27: 16.52, 7.86, 23.29)15.897.73
Case 1 (no DG)UPQC@14 (1.10, 4.76, 10.52)5.464.7565.64
Case 2 (with DG)Base (16.55, 7.87, 23.32)15.917.74
Case 2 (with DG)UPQC@14 (1.08, 4.75, 11.39)5.745.2363.92
Values in parentheses are the per-bus THDv (%) used to compute the statistics. Mean and standard deviation are computed across buses (spatial dispersion) for each condition. Reductions are calculated as the relative decrease of the mean with respect to the corresponding base case.
Disclaimer/Publisher’s Note: The statements, opinions and data contained in all publications are solely those of the individual author(s) and contributor(s) and not of MDPI and/or the editor(s). MDPI and/or the editor(s) disclaim responsibility for any injury to people or property resulting from any ideas, methods, instructions or products referred to in the content.