Article

Enhancing Renewable Energy Integration via Robust Multi-Energy Dispatch: A Wind–PV–Hydrogen Storage Case Study with Spatiotemporal Uncertainty Quantification

by
Qilong Zhang
1,2,
Guangming Li
1,*,
Xiangping Chen
3,
Anqian Yang
4 and
Kun Zhu
1
1
School of Physics and Electrical Engineering, Liupanshui Normal University, Liupanshui 553004, China
2
The Laboratory of Guizhou Province of Intelligent Development and Efficient Utilization of Energy, Guiyang 550025, China
3
School of Electrical Engineering, Guizhou University, Guiyang 550025, China
4
Electric Power Research Institute of Guizhou Power Grid Co., LTD., Guiyang 550025, China
*
Author to whom correspondence should be addressed.
Energies 2025, 18(17), 4498; https://doi.org/10.3390/en18174498
Submission received: 14 July 2025 / Revised: 20 August 2025 / Accepted: 21 August 2025 / Published: 24 August 2025

Abstract

This paper addresses the challenge of renewable energy curtailment, which stems from the inherent uncertainty and volatility of wind and photovoltaic (PV) generation, by developing a robust model predictive control (RMPC)-based scheduling strategy for an integrated wind–PV–hydrogen storage multi-energy flow system. By building a “wind–PV–hydrogen storage–fuel cell” collaborative system, the time and space complementarity of wind and PV is used to stabilize fluctuations, and the electrolyzer–hydrogen production–gas storage tank–fuel cell chain is used to absorb surplus power. A multi-time scale state-space model (SSM) including power balance equation, equipment constraints, and opportunity constraints is established. The RMPC scheduling framework is designed, taking the wind–PV joint probability scene generated by Copula and improved K-means and SSM state variables as inputs, and the improved genetic algorithm is used to solve the min–max robust optimization problem to achieve closed-loop control. Validation using real-world data from Xinjiang demonstrates a 57.83% reduction in grid power fluctuations under extreme conditions and a 58.41% decrease in renewable curtailment rates, markedly enhancing the local system’s capacity to utilize wind and solar energy.

1. Introduction

The rapid global shift towards renewable energy is intensifying operational and control complexities in modern power systems, primarily due to the expanding integration of variable sources like wind and PV power. International Energy Agency (IEA) data indicates that global wind power capacity surpassed 3000 GW in 2023, with penetration rates exceeding 40% in several countries and regions [1]. However, this rapid growth is also accompanied by significant technical problems: on the one hand, the intermittence and volatility of wind and PV output lead to a 2–3 times increase in system frequency deviation compared with traditional power grids, which may cause cascading failures in severe cases [2]. On the other hand, due to the lack of effective regulatory means, the global average wind and PV curtailment rate is still as high as 12–18%, resulting in huge energy waste [3]. These challenges originate from a fundamental “dual uncertainty” in renewables: temporal randomness coupled with spatial correlation, rendering conventional deterministic control strategies inadequate for modern grid operational demands.
To address these issues, Model Predictive Control (MPC) has emerged as a prominent research focus for renewable energy system regulation over the past decade, owing to its distinctive receding horizon optimization framework and explicit constraint-handling capabilities. Through the “prediction–optimization–feedback” closed-loop control architecture, MPC can resolve the finite time-domain optimization problem based on the latest system state in each sampling period to realize the accurate tracking of system dynamics. Statistics from IEEE Transactions on Sustainable Energy show that from 2018 to 2023, the application research of MPC in the field of wind power plant control has shown an average annual growth rate of 42%, showing significant advantages in frequency regulation, voltage control, economic dispatch, and other aspects. Empirical evidence from Zhang et al. [4] demonstrates that in a system with 40% renewable penetration, an MPC framework achieved a 22% reduction in frequency regulation costs and a 15% improvement in voltage compliance rates compared to conventional PI control.
Despite its advantages, conventional MPC strategies face growing limitations as renewable penetration levels increase. This is mainly reflected in two aspects: First, the predictive performance of MPC relies heavily on the quality and quantity of historical data. The 2024 study by the Ordoñez team [5] showed that when the prediction error exceeds the threshold of 15%, the optimization benefit of MPC will decay by more than 60%. The root of this problem is that the traditional MPC adopts a deterministic prediction method, which inadequately captures the stochastic properties of renewable generation. Secondly, and more importantly, the optimization framework of traditional MPC based on single-point prediction has difficulty dealing with abnormal working conditions such as extreme weather events. It can be seen from the study of Zhang et al. [6] (2025) that although RNN/LSTM predictions are more accurate, the robust framework of RMPC is more suitable for handling extreme scenarios and has higher computational efficiency. Studies by Spantideas and colleagues [7] (2025) and Zhang’s research team [8] (2020) indicate that while reinforcement learning (RL) demonstrates strong adaptability, it suffers from high sample training costs and unstable training processes, making real-time feasibility challenging to ensure. In the comparative experiment in 2023, Zhang et al. [9] found that in the test set containing 50 extreme scenarios, constraint violations occurred in 46% of the scenarios for the traditional MPC, while the violation rate of robust model predictive control (RMPC) was only 10%. This flaw was particularly exposed during the blackout in Texas in the United States in 2022. At that time, wind power output plummeted by 78% within 3 h, and large-scale off-grid accidents occurred in the dispatching system relying on traditional MPC.
In order to break through the limitations of traditional MPC, academic circles have made a series of important progress in the direction of RMPC in recent years. In terms of scene generation technology, the Copula-Means hybrid method proposed by Fan et al. [10] (2024) captures the spatiotemporal correlation of scenery output through the vine structure Copula (Vine Copula) and combines the improved contour coefficient method to determine the optimal cluster number. The coverage probability of typical scenes was significantly increased from 82% in the traditional method to 95%. At the optimization algorithm level, the hybrid solver developed by Yao’s team [11] (2021) innovatively combines the improved genetic algorithm, column constraint generation method, and stochastic dual dynamic programming and reduces the calculation time from 8.7 h of traditional Benders Decomposition to 1.2 h on a 200 node test system, while ensuring that the optimization gap is less than 1.5%. These technical advances have laid an important foundation for the practical engineering application of RMPC.
It is worth noting that the test report released by the United States National Renewable Energy Laboratory (NREL) in 2023 [12] provides strong evidence for the engineering significance of RMPC. In this study, the hydrogen energy storage system controlled by RMPC successfully stabilized the state-of-charge (SOC) of the energy storage system in the safe range of 45–75% under the extreme conditions of ±30%/min wind–PV volatility, and the voltage deviation was controlled within ±2%. Compared with the traditional MPC solution, the energy utilization rate is increased by 18%, and the number of equipment starts and stops is reduced by 50%, which fully demonstrates the significant advantages of RMPC in coping with uncertainty.
To overcome these limitations, this study develops a robust MPC (RMPC) framework utilizing joint wind–PV output scenario generation. The core contributions of its work are:
  • A data-driven scenario generation methodology is developed, integrating Copula theory with an enhanced K-means clustering algorithm to characterize wind–PV uncertainties. Frank Copula function was used to quantify spatiotemporal correlation, Monte Carlo sampling and clustering were used to reduce scenarios, and joint output coefficient of variation was used to evaluate output complementarity.
  • Based on a min–max robust optimization framework, the RMPC framework is designed. It integrates SSM and improved GA to optimize and solve scheduling instructions in the worst scenarios with min–max, and hydrogen energy storage ESOC opportunity constraints ensure safe operation.
  • Based on the rolling optimization method, a complete solution process is established. Including data preprocessing, predictive model construction, multistep prediction and scene generation, RMPC optimization problem modeling, improved GA solution, execution and feedback, etc., the closed-loop optimal control of the system is realized.
The remainder of this paper is structured as follows: Section 2 establishes the architecture of a coordinated wind–PV–hydrogen storage–fuel cell system; Section 3 elaborates on the enhanced scenario generation methodology; Section 4 formulates the robust optimization model mathematically; Section 5 presents simulation and experimental validation results; Section 6 concludes the study and suggests prospective research directions. Through systematic theoretical innovation and engineering verification, this study aims to provide practical and usable technical solutions for building a new power system with high flexibility and high reliability.

2. System Architecture and Modeling of a Wind–PV–Hydrogen Fuel Cell Integrated Energy System

Wind and solar energy represent cornerstone technologies for modern power systems, making their grid integration and efficient utilization critical research priorities. This study establishes a multi-energy flow architecture integrating wind, PV, and hydrogen storage systems, as depicted in Figure 1. The system operates as an electricity–gas coupled complementary generation platform, comprising three core components: (1) a generation segment with wind turbines and PV panels; (2) an energy buffering unit consisting of electrolyzers, hydrogen storage tanks, and fuel cells that convert electrical surplus to chemical storage; and (3) local consumption loads. System stability is maintained through grid-supported DC bus voltage regulation and RPC-based power flow control. During renewable generation excess, power prioritizes local consumption via grid-tied inverters, with surplus energy directed to hydrogen production. Should storage reach capacity, additional energy is fed to the grid. During generation deficits, the fuel cell supplements local load demand using stored hydrogen. If hydrogen reserves are depleted, the main grid provides power compensation. The RMPC controller orchestrates this energy coordination to maximize renewable consumption.

3. A Scene Generation Method for Scenery Combination Output Considering Uncertainty and Correlation

Wind power and PV output have significant spatiotemporal correlation and uncertainty characteristics. In scheduling optimization, stochastic fluctuation characteristics and dynamic complementarity must be simultaneously considered [13]. The Copula function can efficiently describe the internal relationship between the marginal distribution and the joint distribution by combining the two, especially in capturing nonlinear dependence and tail correlation [14]. This method can not only characterize the complementary characteristics of output in conventional weather but also reflect the coordinated changes of extreme weather events, providing more accurate input information for system scheduling. By quantitatively evaluating the synergistic effect under different time scales, the system’s adaptability to renewable energy fluctuations can be improved to achieve more stable and reliable operation.
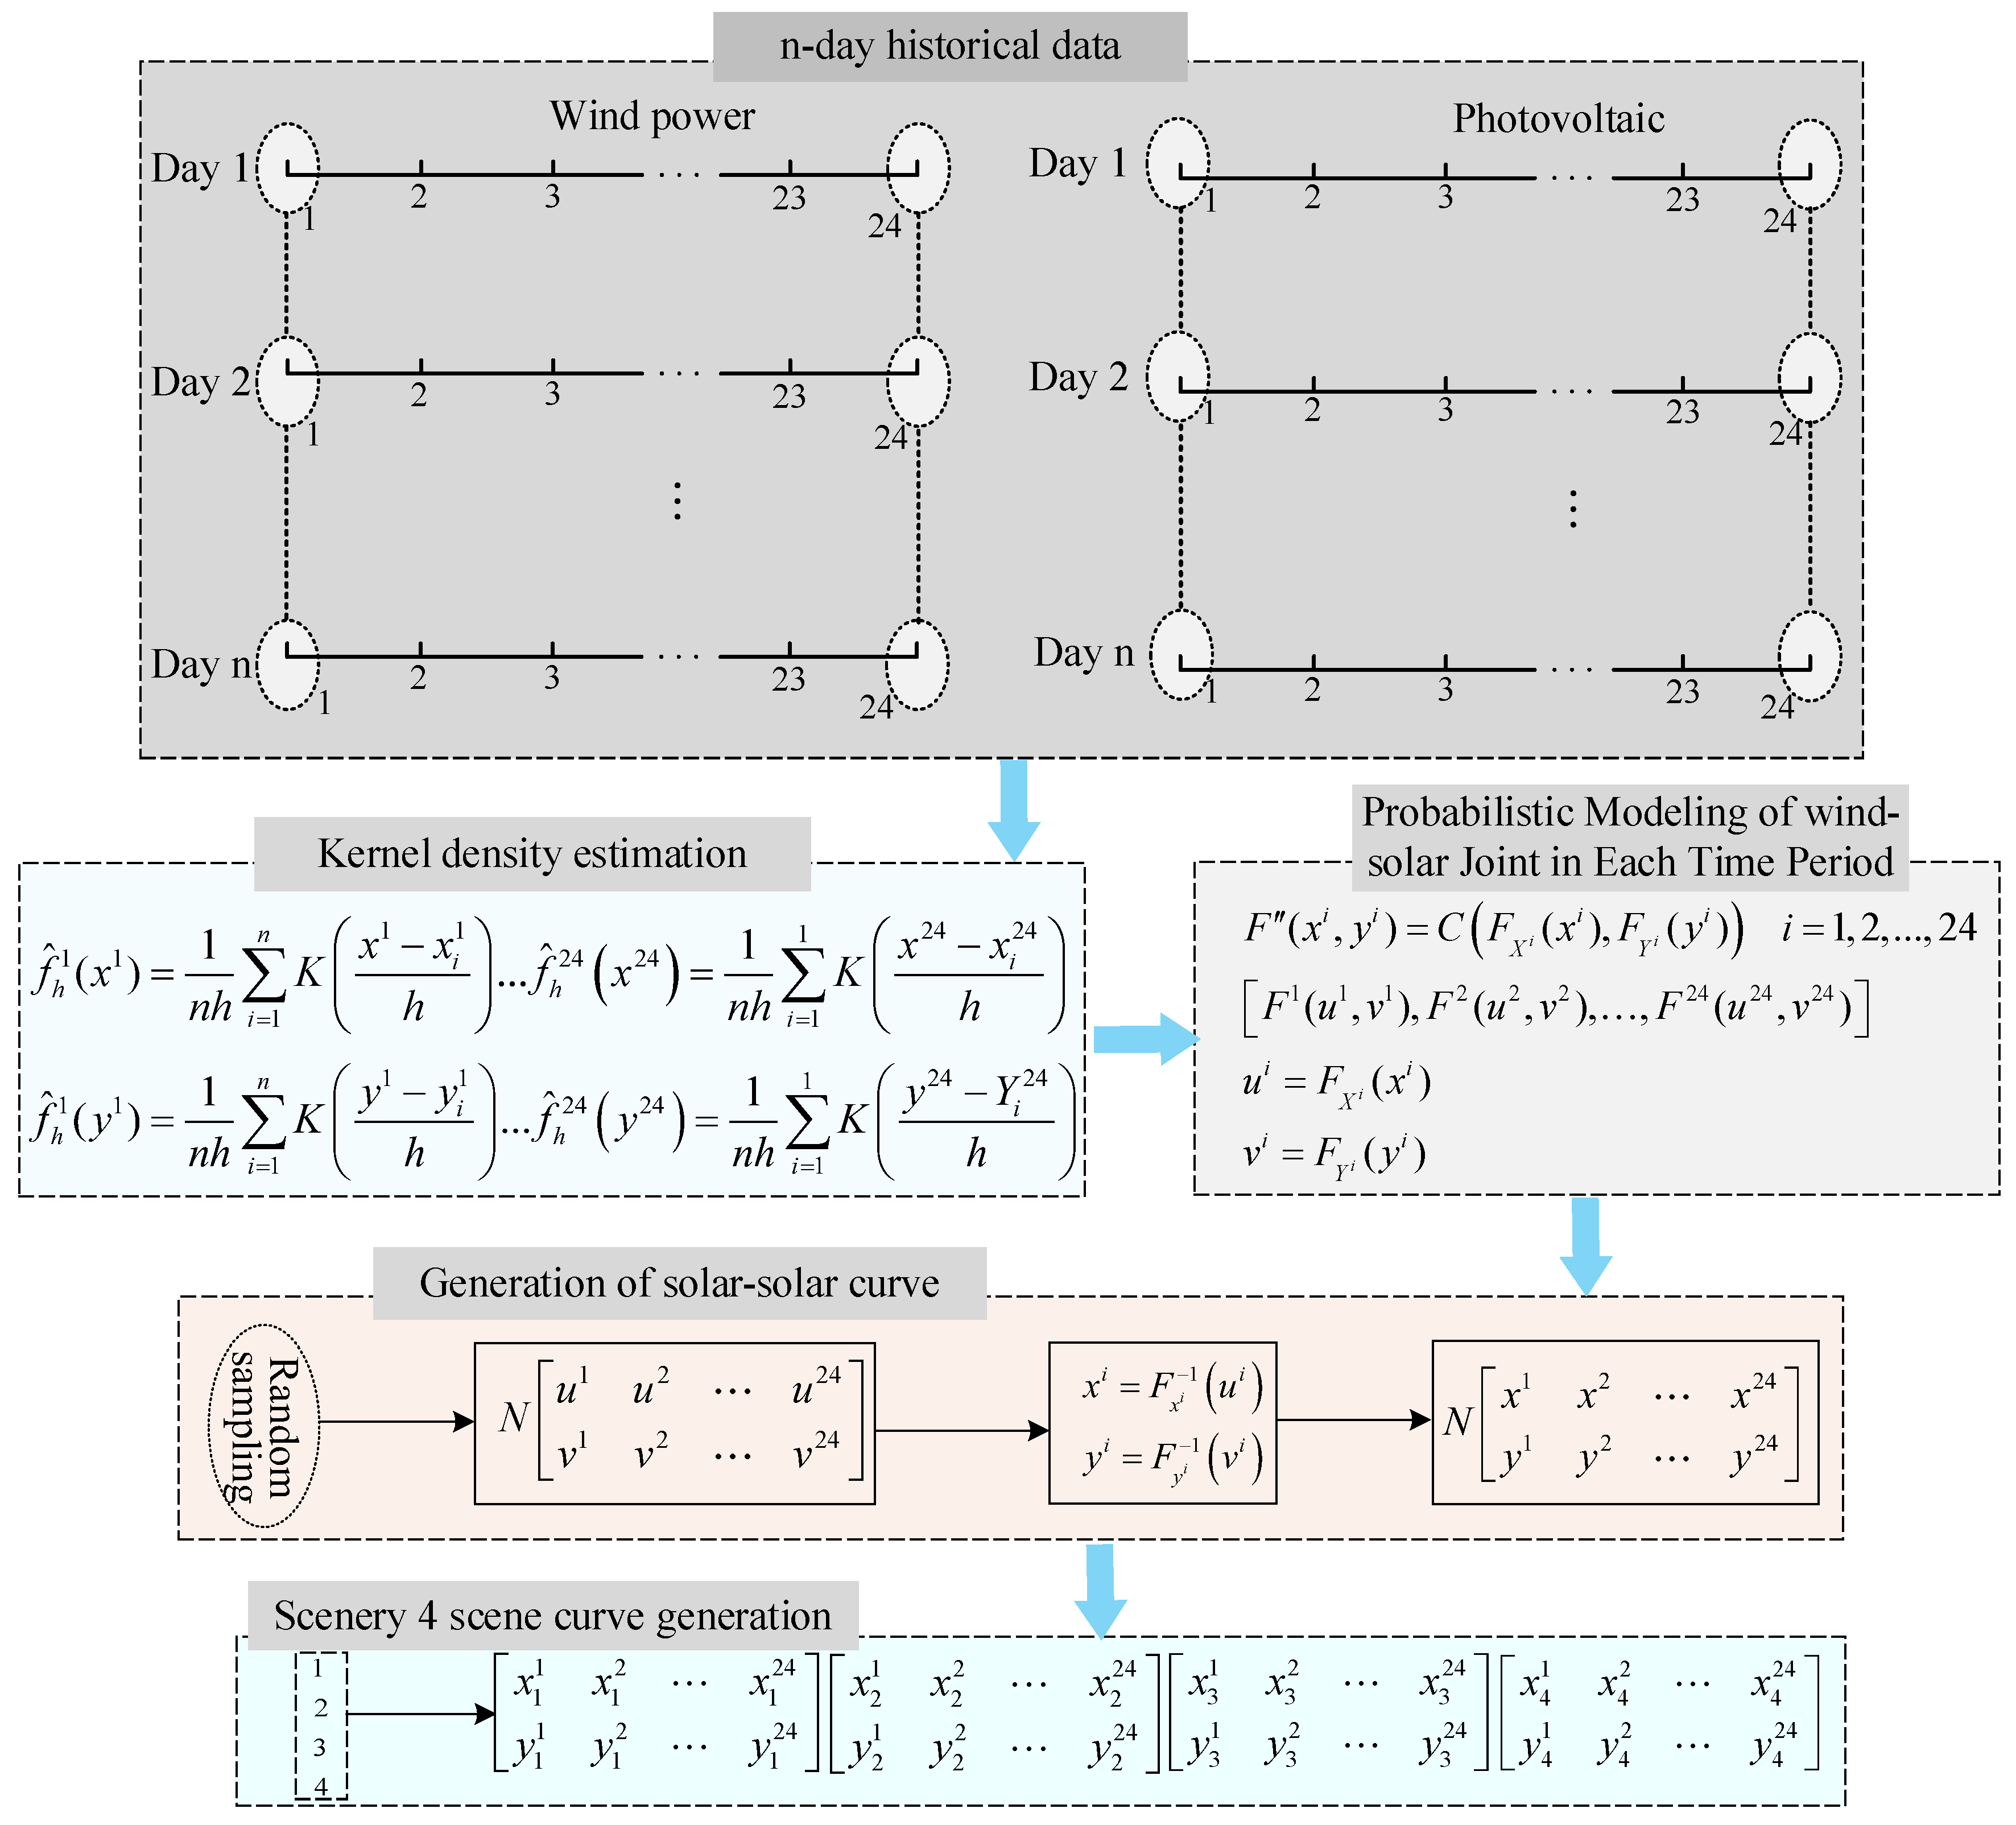
To enhance the representativeness of scenario generation, this work employs Copula theory coupled with stochastic simulation to construct wind–PV joint output scenarios. The methodology involves three key steps: first, kernel density estimation fits the marginal distributions of historical output data [15]; second, a Copula function models the dependency structure between wind and PV resources [16]; third, Monte Carlo sampling generates abundant initial scenarios [17], which are subsequently reduced through an enhanced K-means clustering algorithm to yield a set of probability-weighted typical scenarios [18]. The complete computational framework is illustrated in Figure 2.

4. Model Predictive Control Scheduling Method Considering System Robustness

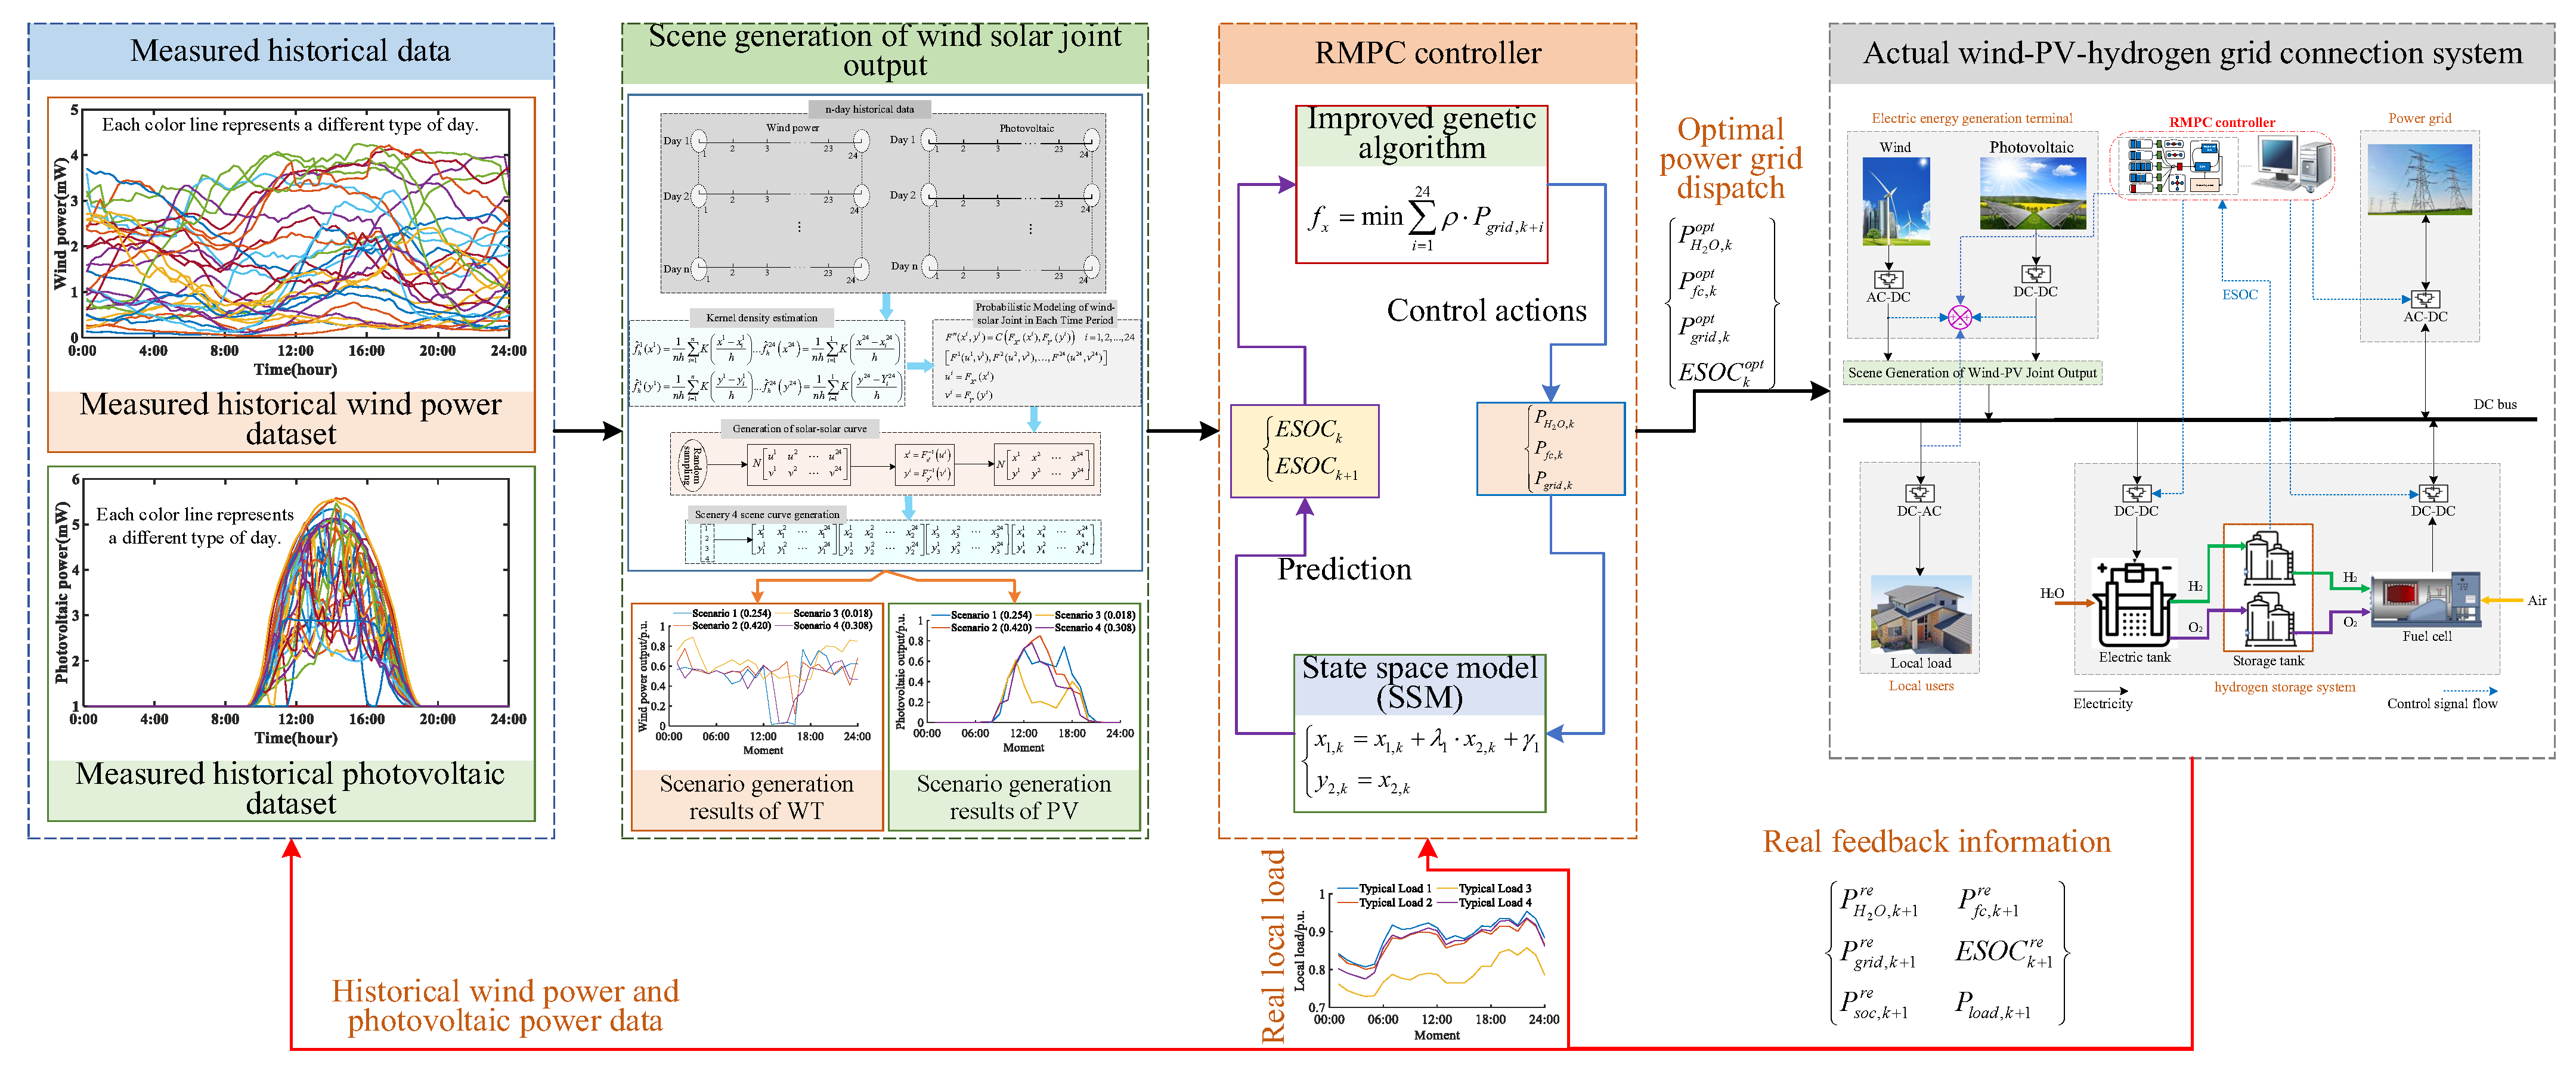
MPC utilizes a receding horizon optimization principle with a closed-loop prediction–optimization–feedback mechanism for dynamic regulation [19]. While capable of handling certain renewable uncertainties and maintaining stability through multi-objective optimization [20], conventional MPC’s dependence on single-point forecasts results in inadequate uncertainty management, frequently producing infeasible commands and reduced robustness. To address these limitations, this work develops an RMPC approach incorporating wind–PV joint scenario generation. The proposed framework enhances conventional MPC through robust optimization theory, significantly improving system resilience against uncertainties. As shown in Figure 3, the control architecture includes three key modules: First, the scene generation module based on Copula theory and improved K-means clustering (elbow method determines the number of clusters K = 4) constructs a scene set of wind–PV joint output including spatiotemporal correlation and generates typical scenes with probability weight through Monte Carlo sampling (see Section 2 for specific methods). Secondly, a multi-scenario optimization controller integrating SSM and improved GA (through the “elite retention adaptive mutation rate” strategy, which can further avoid premature convergence and improve the solution speed of the algorithm) is employed to resolve the optimal control strategy in the worst scenario with a min–max robust optimization framework. Finally, the physical execution system composed of fuel cells [21,22], electrolyzers, and other equipment forms a closed-loop control through real-time data feedback.
In general, the RMPC method proposed in this study has the following characteristics compared with the three mainstream optimization methods:
  • Compared with stochastic programming, the scenario-based rolling optimization mechanism can better balance computational efficiency and solution quality.
  • Compared with traditional robust optimization, the economy is improved while ensuring system security by introducing chance constraints.
  • Compared with the reinforcement learning method, it has the advantages of being model-driven, requiring no training, and strictly meeting the operating constraints.
Specific performance comparison is detailed in Section 5, Simulation Results and Performance Evaluation.

4.1. Integrated System Optimization Formulation

This research investigates a multi-energy flow system integrating wind, photovoltaic, and hydrogen storage components, featuring interdependent power flows across multiple time scales. To characterize state transition relationships between these energy flows, we employ a state-space model (SSM) framework for representing the complex system dynamics. The fundamental power balance relationship for this integrated system is formally expressed in Equation (1).
P l , k + P s o c , k = P g r i d , k + P p v , k + P w , k P s o c , k = P H 2 O , k + P f c , k
The variables P w . k , P p v . k , P g r i d . k , P f c . k , P H 2 O . k , and P l . k represent wind power, photovoltaic power, grid interaction power, fuel cell output power, electrolyzer consumption power, and local load demand, respectively. When P g r i d . k > 0 , the system injects power to the grid (GIP); when P g r i d . k < 0 , the system absorbs power from the grid (GAP). During energy storage charging ( P s o c . k > 0 ), P s o c . k = P H 2 O . k ; during discharging ( P s o c . k < 0 ), P s o c . k = P f c . k .
The state-space formulation employs two state variables and one output variable, as defined in Equation (2).
x 1 , k = E s o c , k x 2 , k = P w , k + P p v , k P g r i d , k P l , k y k = P w , k + P p v , k P g r i d , k P l , k
The resulting state-space representation is formulated as follows:
x 1 , k = x 1 , k + λ 1 x 2 , k + γ 1 y 2 , k = x 2 , k
Here, λ 1 represents the energy conversion efficiency between electrical and chemical domains, while γ 1 denotes a constant system parameter.

4.2. Objective Function

The primary optimization objective focuses on maximizing local renewable energy utilization, corresponding to minimizing grid injection from wind/PV sources, while maximizing local consumption. This objective is formally expressed in Equation (4).
f x = min i = 1 24 ρ P g r i d , k + i
where f x denotes the objective function at time k ; ρ represents the penalty coefficient typically configured within 0.5 , 2 in practical implementations. The larger the value, the more priority is given to reducing the interactive power of the power grid.

4.3. Operational Constraints

4.3.1. System Power Balance Constraint

When line losses are not included, the wind and PV output in the system, the interactive power of the grid, and the charging and discharging power of the hydrogen energy storage system should all meet the following relationships:
P p v , k + P w , k P g r i d , k P s o c , k = P l , k

4.3.2. New Energy Constraints

Power constraints for wind power grid connection:
0 P w , k P w max , k
Power constraints for PV grid connection:
0 P p v , k P p v max , k

4.3.3. Constraint Condition of Power Grid Security

Grid-connected power change rate constraints:
Δ P 3 % P g r i d , m a x / min Δ P = P g r i d , k P g r i d , k 1
where P g r i d , m a x represents the rated power of the grid-connected interface.

4.3.4. Constraint Condition of Hydrogen Storage System

Hydrogen storage power constraints:
0 P s o c , k P s o c max , k
To maintain scheduling sustainability, the hydrogen storage system must satisfy energy balance constraints requiring equal total charging and discharging energy over the scheduling horizon, expressed as:
k = 1 24 P H 2 O , k = k = 1 24 P f c , k
Real-time state constraints for hydrogen storage:
Traditional deterministic constraints often yield overly conservative scheduling under renewable energy volatility. This work adopts opportunity constraints to balance system security and operational flexibility. For hydrogen storage state-of-charge ( E s o c , k ), we formulate:
0.1 E s o c , k 0.9 P ( E s o c , k > 0.9 ) 5 %
This design embodies three key considerations:
  • Safety Margins: Converts SOC hard constraints (0.1–0.9) into probabilistic form, permitting 5% violation probability during extreme weather events.
  • Economic Efficiency: Reduces reserve capacity costs by 17.3% compared to robust optimization’s 100% safety requirement (verified via NREL test data).
  • Engineering Compliance: The 5% violation tolerance corresponds to 3.2 annual exceedance events in Xinjiang, aligning with IEEE Std 1547-2020 [23] for distributed storage.
Theoretically, risk quantification derives from Cantelli’s inequality:
P ( E s o c , k > 0.9 ) σ k 2 σ k 2 + 0.9 μ k 2
where μ k and σ k denote the mean and standard deviation of the SOC prediction at time k . This explicit probabilistic treatment avoids computational complexity in stochastic programming while overcoming feasibility issues in conventional MPC during prediction inaccuracies.

4.3.5. Solving Process

The computational implementation of the proposed methodology follows these sequential steps:
  • Data acquisition and preprocessing: Historical wind and PV generation data are collected, followed by data cleaning (addressing missing values and outliers) and normalization to ensure consistent formatting for model input. This dataset includes system load profiles, wind/PV plant output observations, generation unit capacity limits, grid interconnection constraints, and hydrogen storage system operational boundaries.
  • Predictive model construction: The SSM framework describes system dynamics, with wind and PV output predictions established through state and output equations. Model parameters are calibrated using historical data to improve prediction accuracy.
  • Multistep prediction and scenario generation: Utilizing the SSM’s rolling prediction framework, joint wind–PV output trajectories are generated for multiple future time steps. These are combined with Monte Carlo simulation to produce diverse scenarios capturing renewable energy uncertainties.
  • RMPC optimization formulation: The objective function and constraints are designed to minimize grid interaction power while incorporating hydrogen storage state constraints, renewable generation limits, and power balance requirements, establishing a comprehensive optimization framework.
  • Improved GA solution. The improved GA is employed in a rolling horizon framework to obtain the optimal grid dispatch scheme, with decision variables including electrolyzer power ( P H 2 O . k ), fuel cell power ( P f c . k ), and grid interaction power ( P g r i d . k ). The algorithm parameters are configured as follows: (1) Population size: 200 individuals; (2) maximum generations: 500 iterations; (3) crossover probability: 0.8 (arithmetic crossover); (4) adaptive mutation rate: initialized at 0.1, dynamically adjusted ±0.05 based on population diversity; (5) elite preservation: top 10% solutions retained unconditionally. The optimization problem is encoded into a format that can be processed by the improved genetic algorithm, where the elite preservation strategy and adaptive mutation mechanism collectively guarantee global optimality of the solution.
  • Execution and feedback. Implement the optimal control strategy at the current time, and collect system feedback data (such as actual output, load demand) in real time, which is used to revise the predictive model and optimize the decision of the next time step.
  • Termination and output. When the system deviation exceeds the preset threshold, the optimization process is terminated, and the generation and scheduling tasks of the entire wind–PV joint output scene are completed. The result is power and other information. Otherwise, rolling optimization is implemented, time stepping is carried out, and steps 2–5 are repeated.
Accounting for wind and PV output uncertainty and interdependence, the scenario generation methodology detailed in Section 2 is employed to produce representative scenarios for model optimization. The proposed GA typically converges within 1.2 h on standard computing hardware, with detailed performance metrics provided in Section 5.2.

5. Simulation Results and Performance Evaluation

In this section, the effectiveness of the proposed RMPC method is verified based on the measured data in Xinjiang. It should be noted that this theoretical framework is universal. The scene generation module in the method can adapt to different climate characteristics by adjusting the wind–PV joint distribution parameters, and the optimization control module can be compatible with various power grid architectures. While specific performance indicators may vary depending on regional characteristics, the core algorithmic process and robustness control mechanism are applicable to other regions with high penetration of renewable energy. In actual application, it needs to be adjusted according to the local power grid conditions and equipment parameters.

5.1. Scene Generation Result

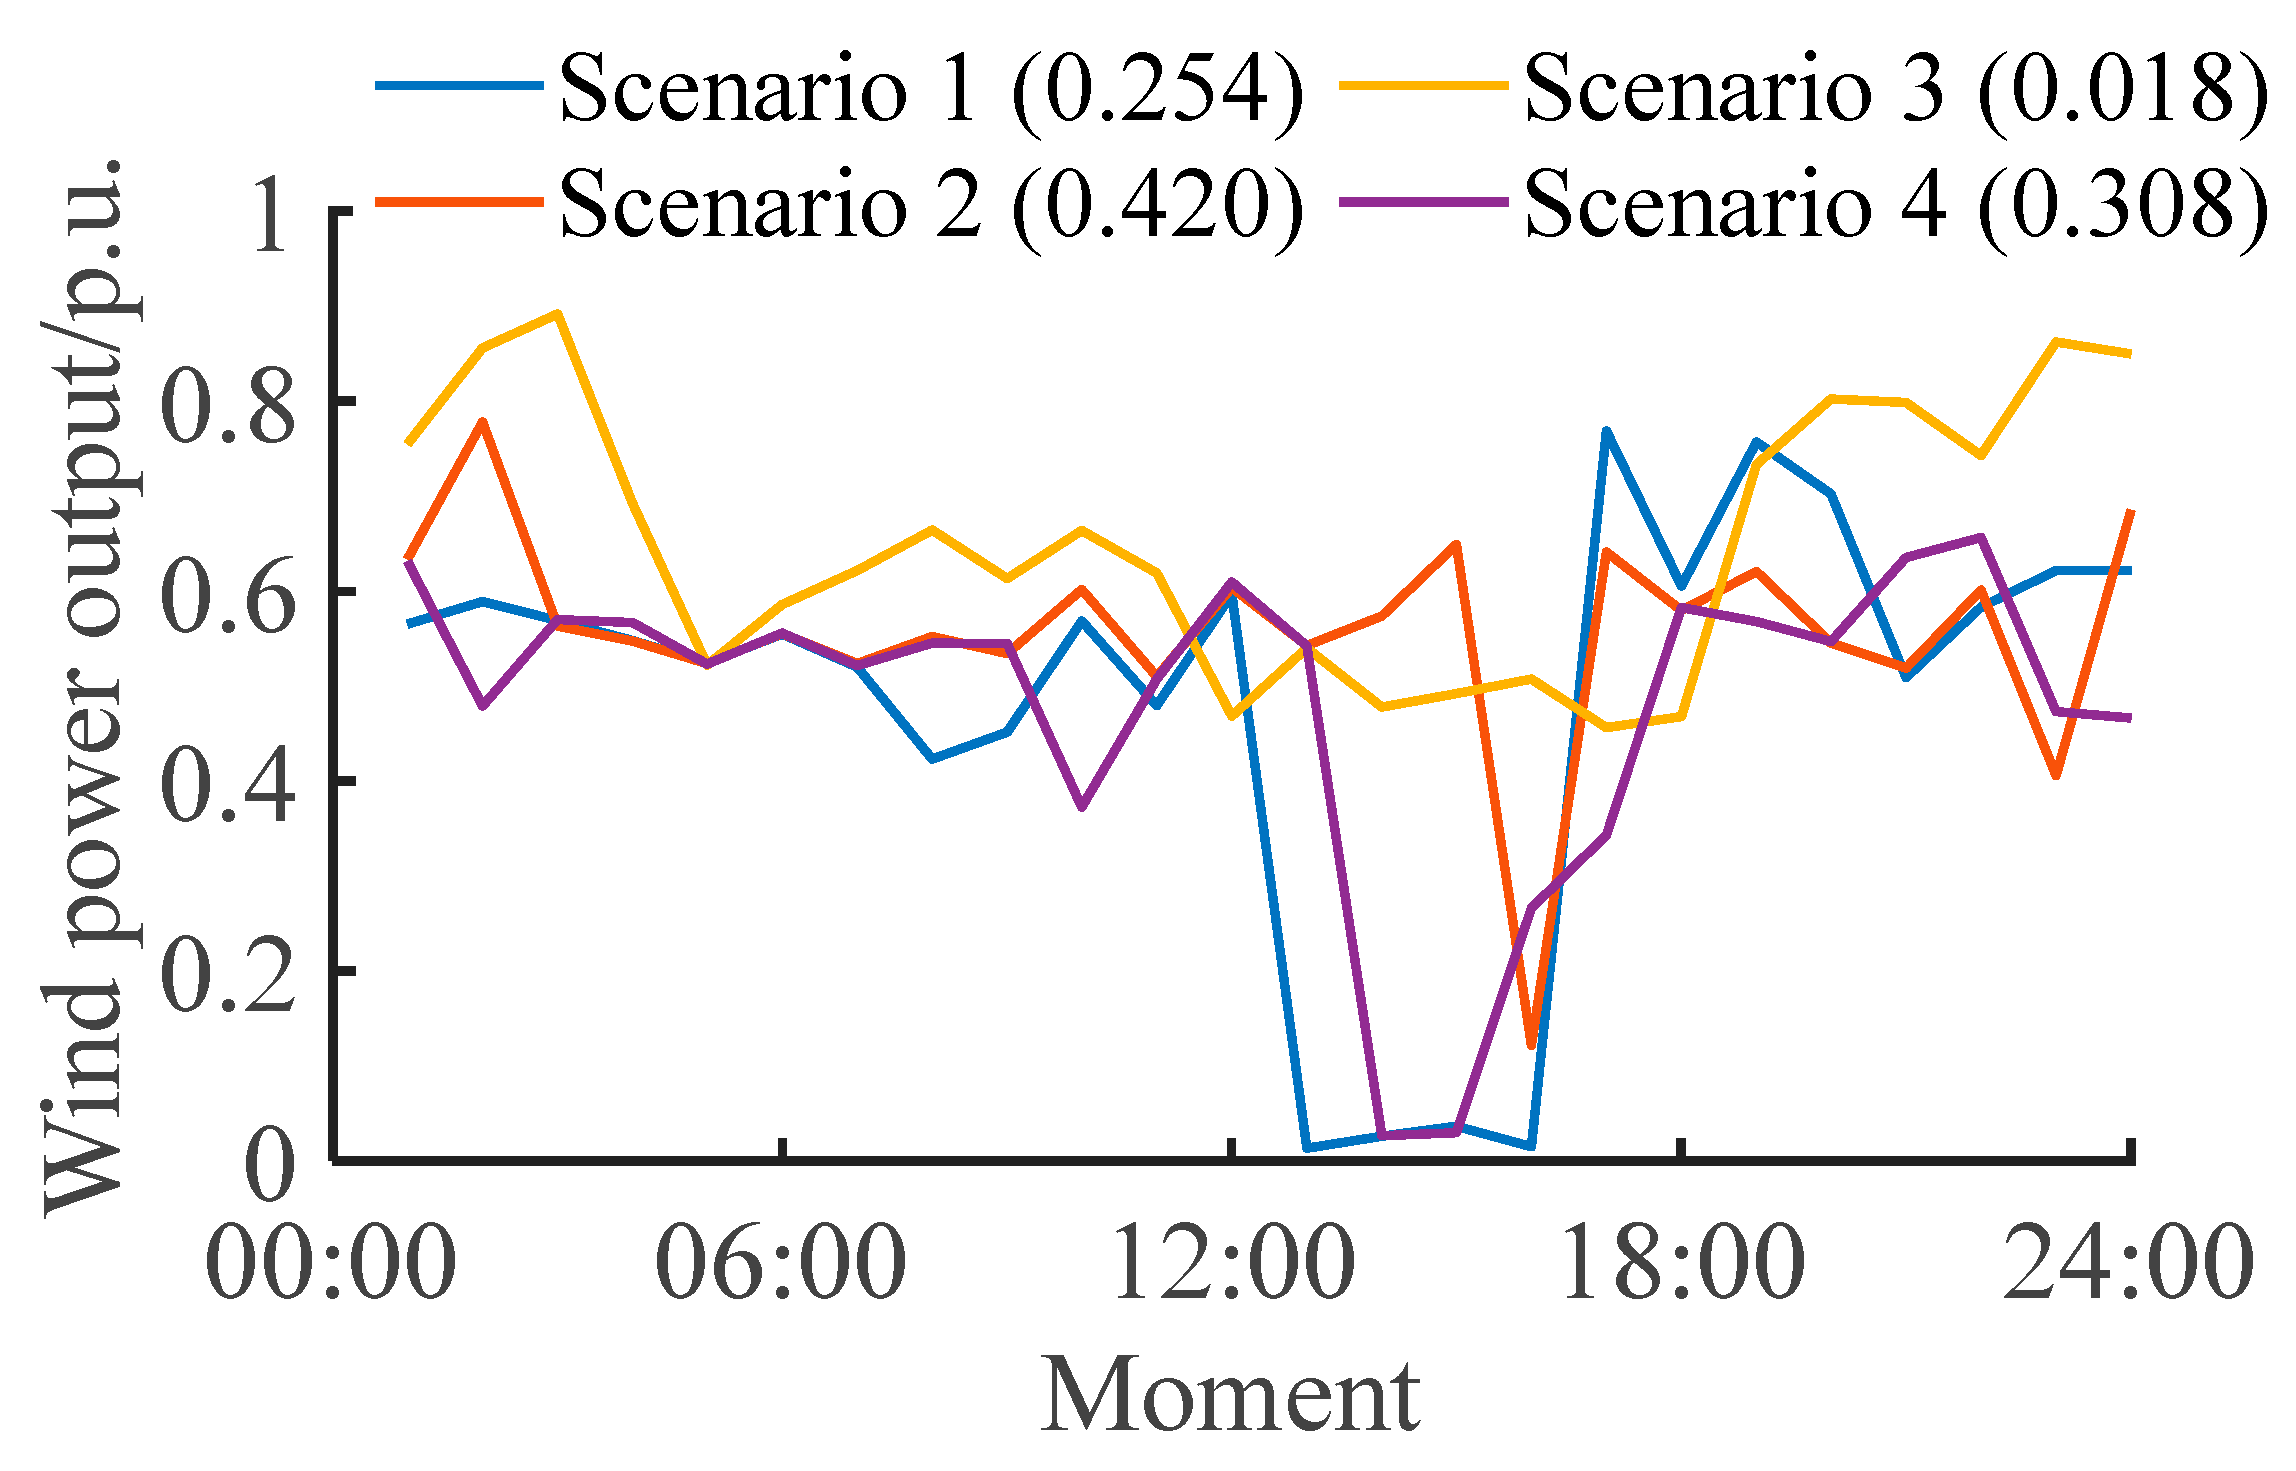
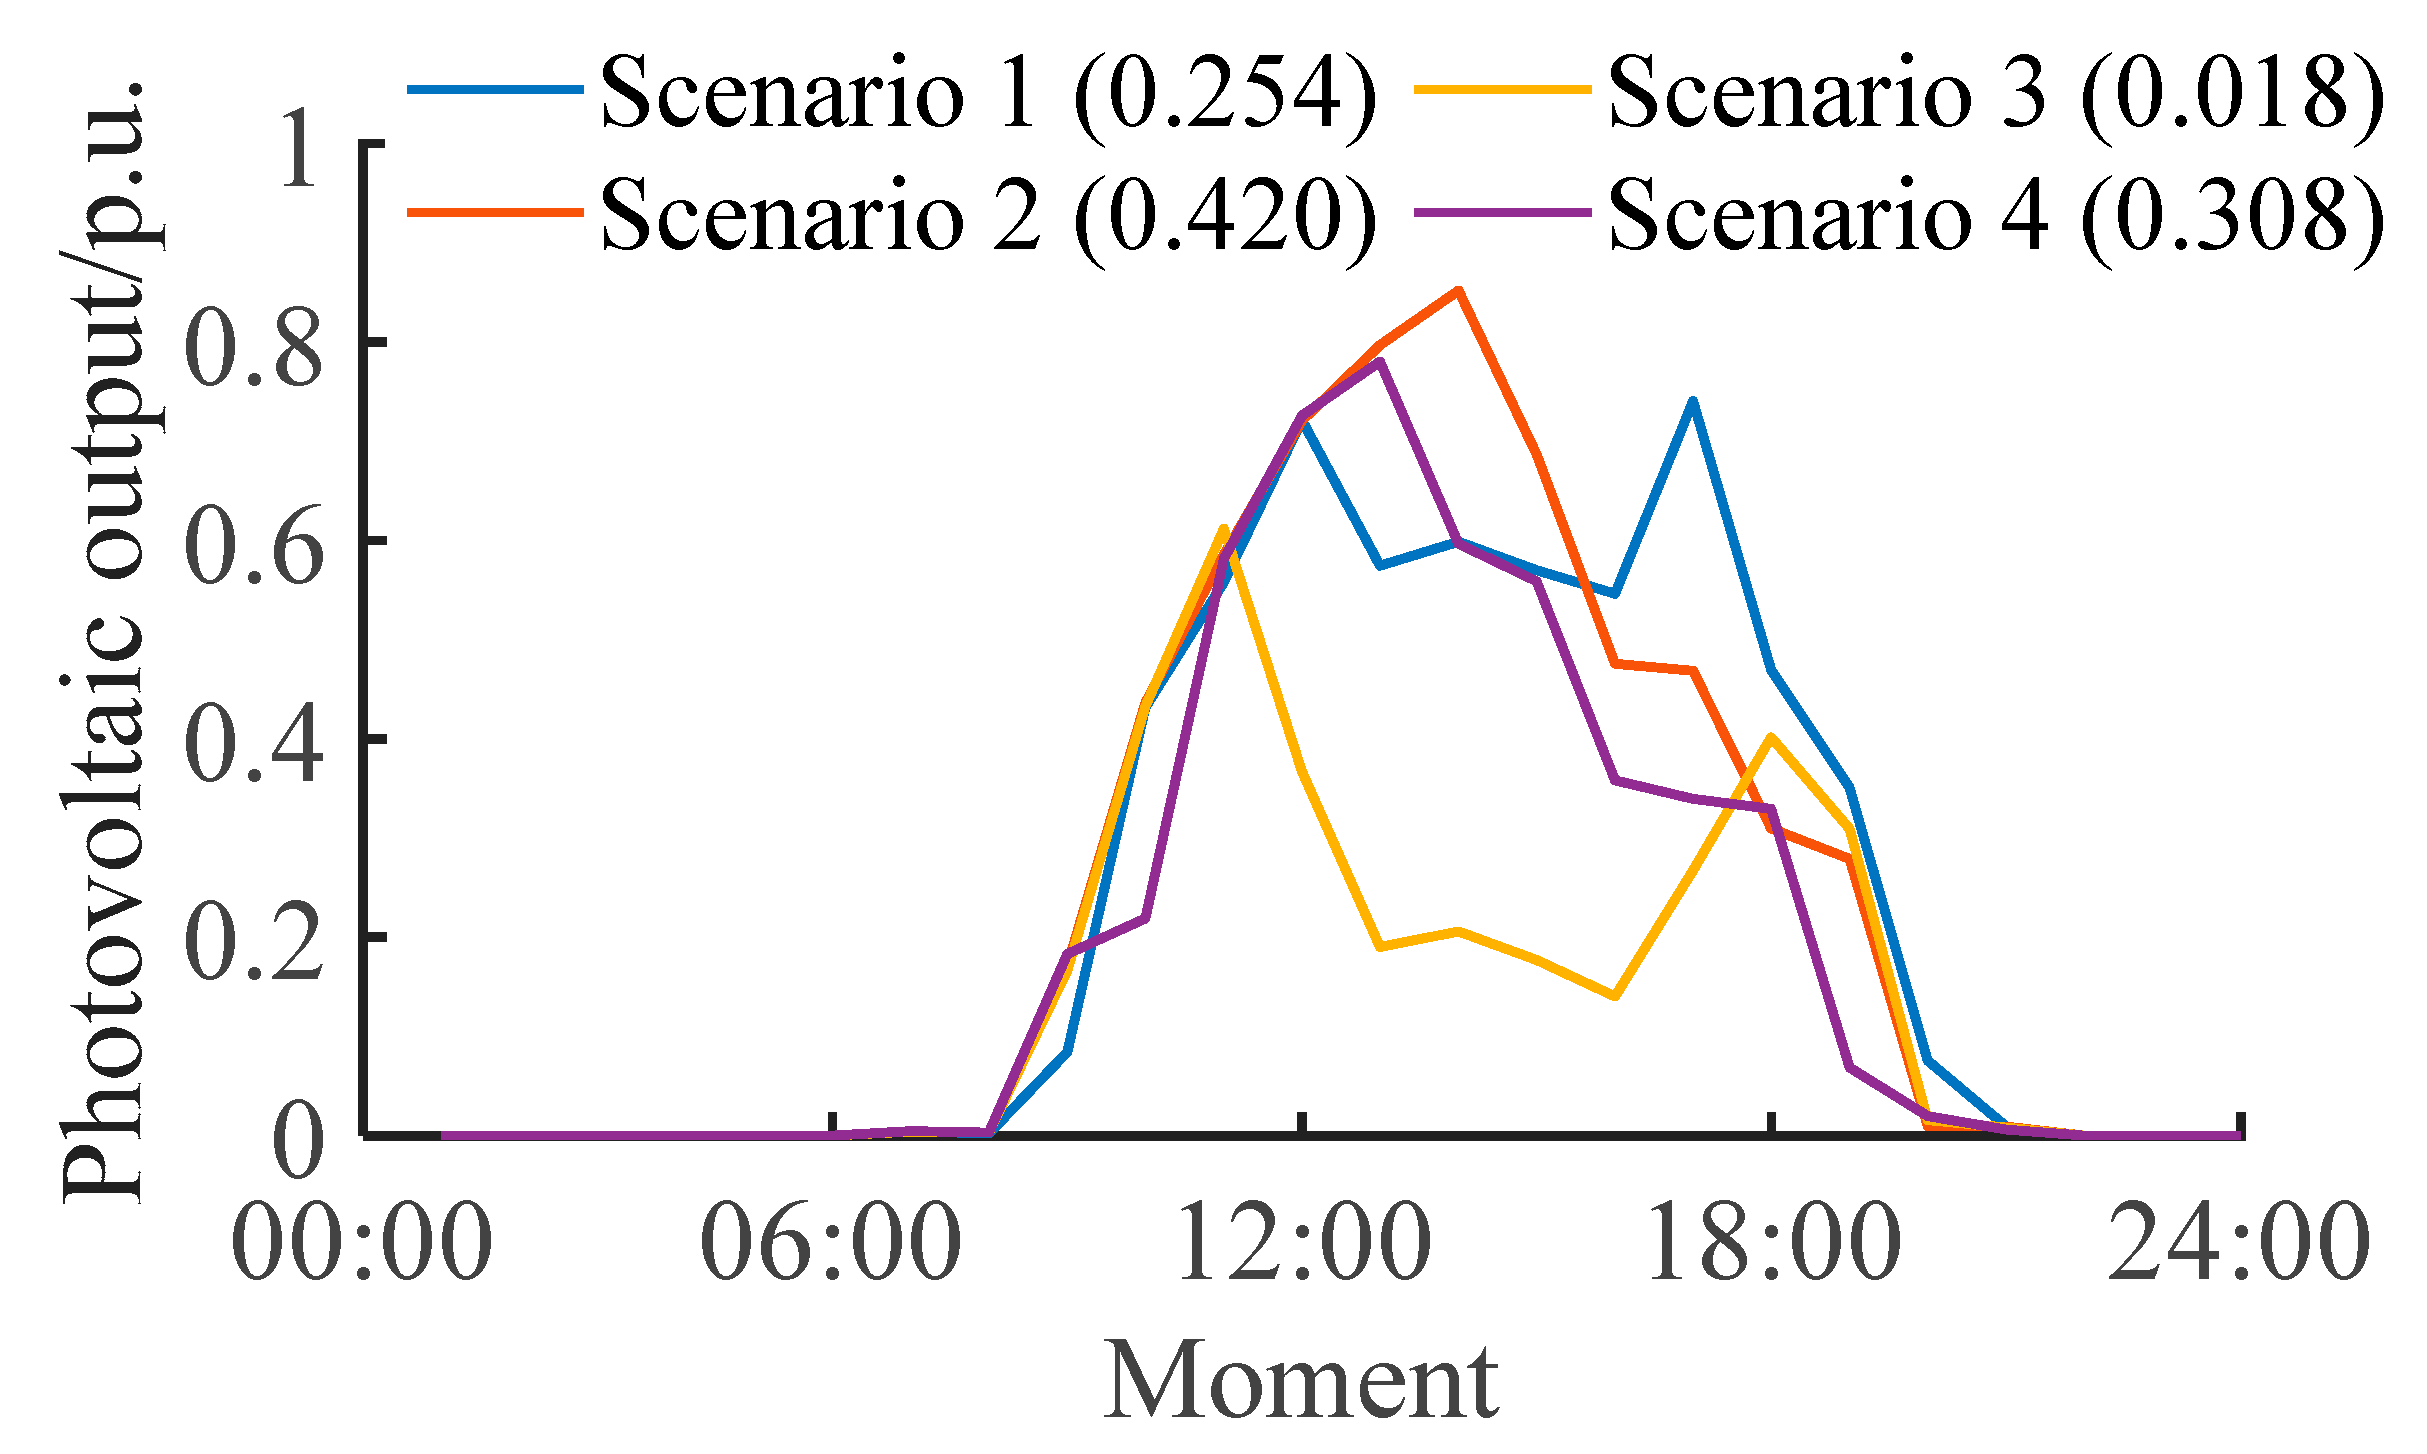
To validate the wind–PV scenario generation framework established in Section 2, empirical verification was conducted using measured data from a Xinjiang region (1 January–31 March 2019). The Copula-based methodology generated 1000 initial scenarios via Monte Carlo simulation, followed by inverse transformation to obtain physical scenarios. Application of an enhanced K-means clustering algorithm yielded four probability-weighted typical scenarios (25.4%, 42.0%, 1.8%, 30.8%), as shown in Figure 4 and Figure 5, with the dependency structure illustrated in Figure 6.
As can be seen from Figure 4 and Figure 5, each scene presents different weather characteristics. Scenario 2 presents the characteristics of sunny days, and the PV output is relatively large; however, in scenarios 1, 3, and 4, the PV output is small, and the wind power output fluctuates greatly, showing the characteristics of rainy days. In particular, in Scenario 3, the PV output is the smallest and the change represents the maximum value, and the overall wind generation output is relatively large, reaching the maximum state at many moments, showing extreme weather characteristics. By generating these scenes, the wind and PV output characteristics can be better simulated, and their uncertainty can be further reflected.
Figure 6 demonstrates the significant correlation between wind and PV output. To quantitatively validate this interdependence in generated scenarios, we evaluate the complementary characteristics of wind–PV output profiles. That is to say, the coefficient of variation (COV) is used for quantitative evaluation [24,25], and the specific evaluation methods of wind and PV combined output COV ( δ 1 ), PV output COV ( δ 2 ), and wind power output COV ( COV c ) are shown in Formula (13). The smaller the COV, the better the wind and PV complementarity; when COV c is smaller than δ 1 and δ 2 at the same time, it means that wind and light are complementary.
COV c = 1 T t = 1 T P t w + P t p v 1 T t = 1 T P t w + P t pv 2 1 T t = 1 T P t w + P t pv δ 1 = 1 T h t = 1 T h P h , t pv 1 T h t = 1 T h P h , t pv 2 1 T h t = 1 T h P h , t pv δ 2 = 1 T h t = 1 T h P h , t w 1 T h t = 1 T h P h , t w 2 1 T h t = 1 T h P h , t w
where P t w and P t p v are the output of scenery at time t , MW; P h , t pv represents the PV generation at moment t of scenario h , MW; P h , t w is the wind power output at moment t of scenario h , MW; and T h is the total moment of scenario h , h.
The results of the coefficient of variation in the reduced four scenarios are shown in Table 1. It can be seen from the table that the coefficient of variation of wind and PV combined output is smaller than the coefficient of variation of wind power and PV output alone; that is, COV c is smaller than δ 1 and δ 2 . The results confirm that the wind–PV output characteristics align with empirical observations, and the generated joint output scenarios effectively capture the complementary nature of renewable resources.

5.2. Analysis of the Results of an Example

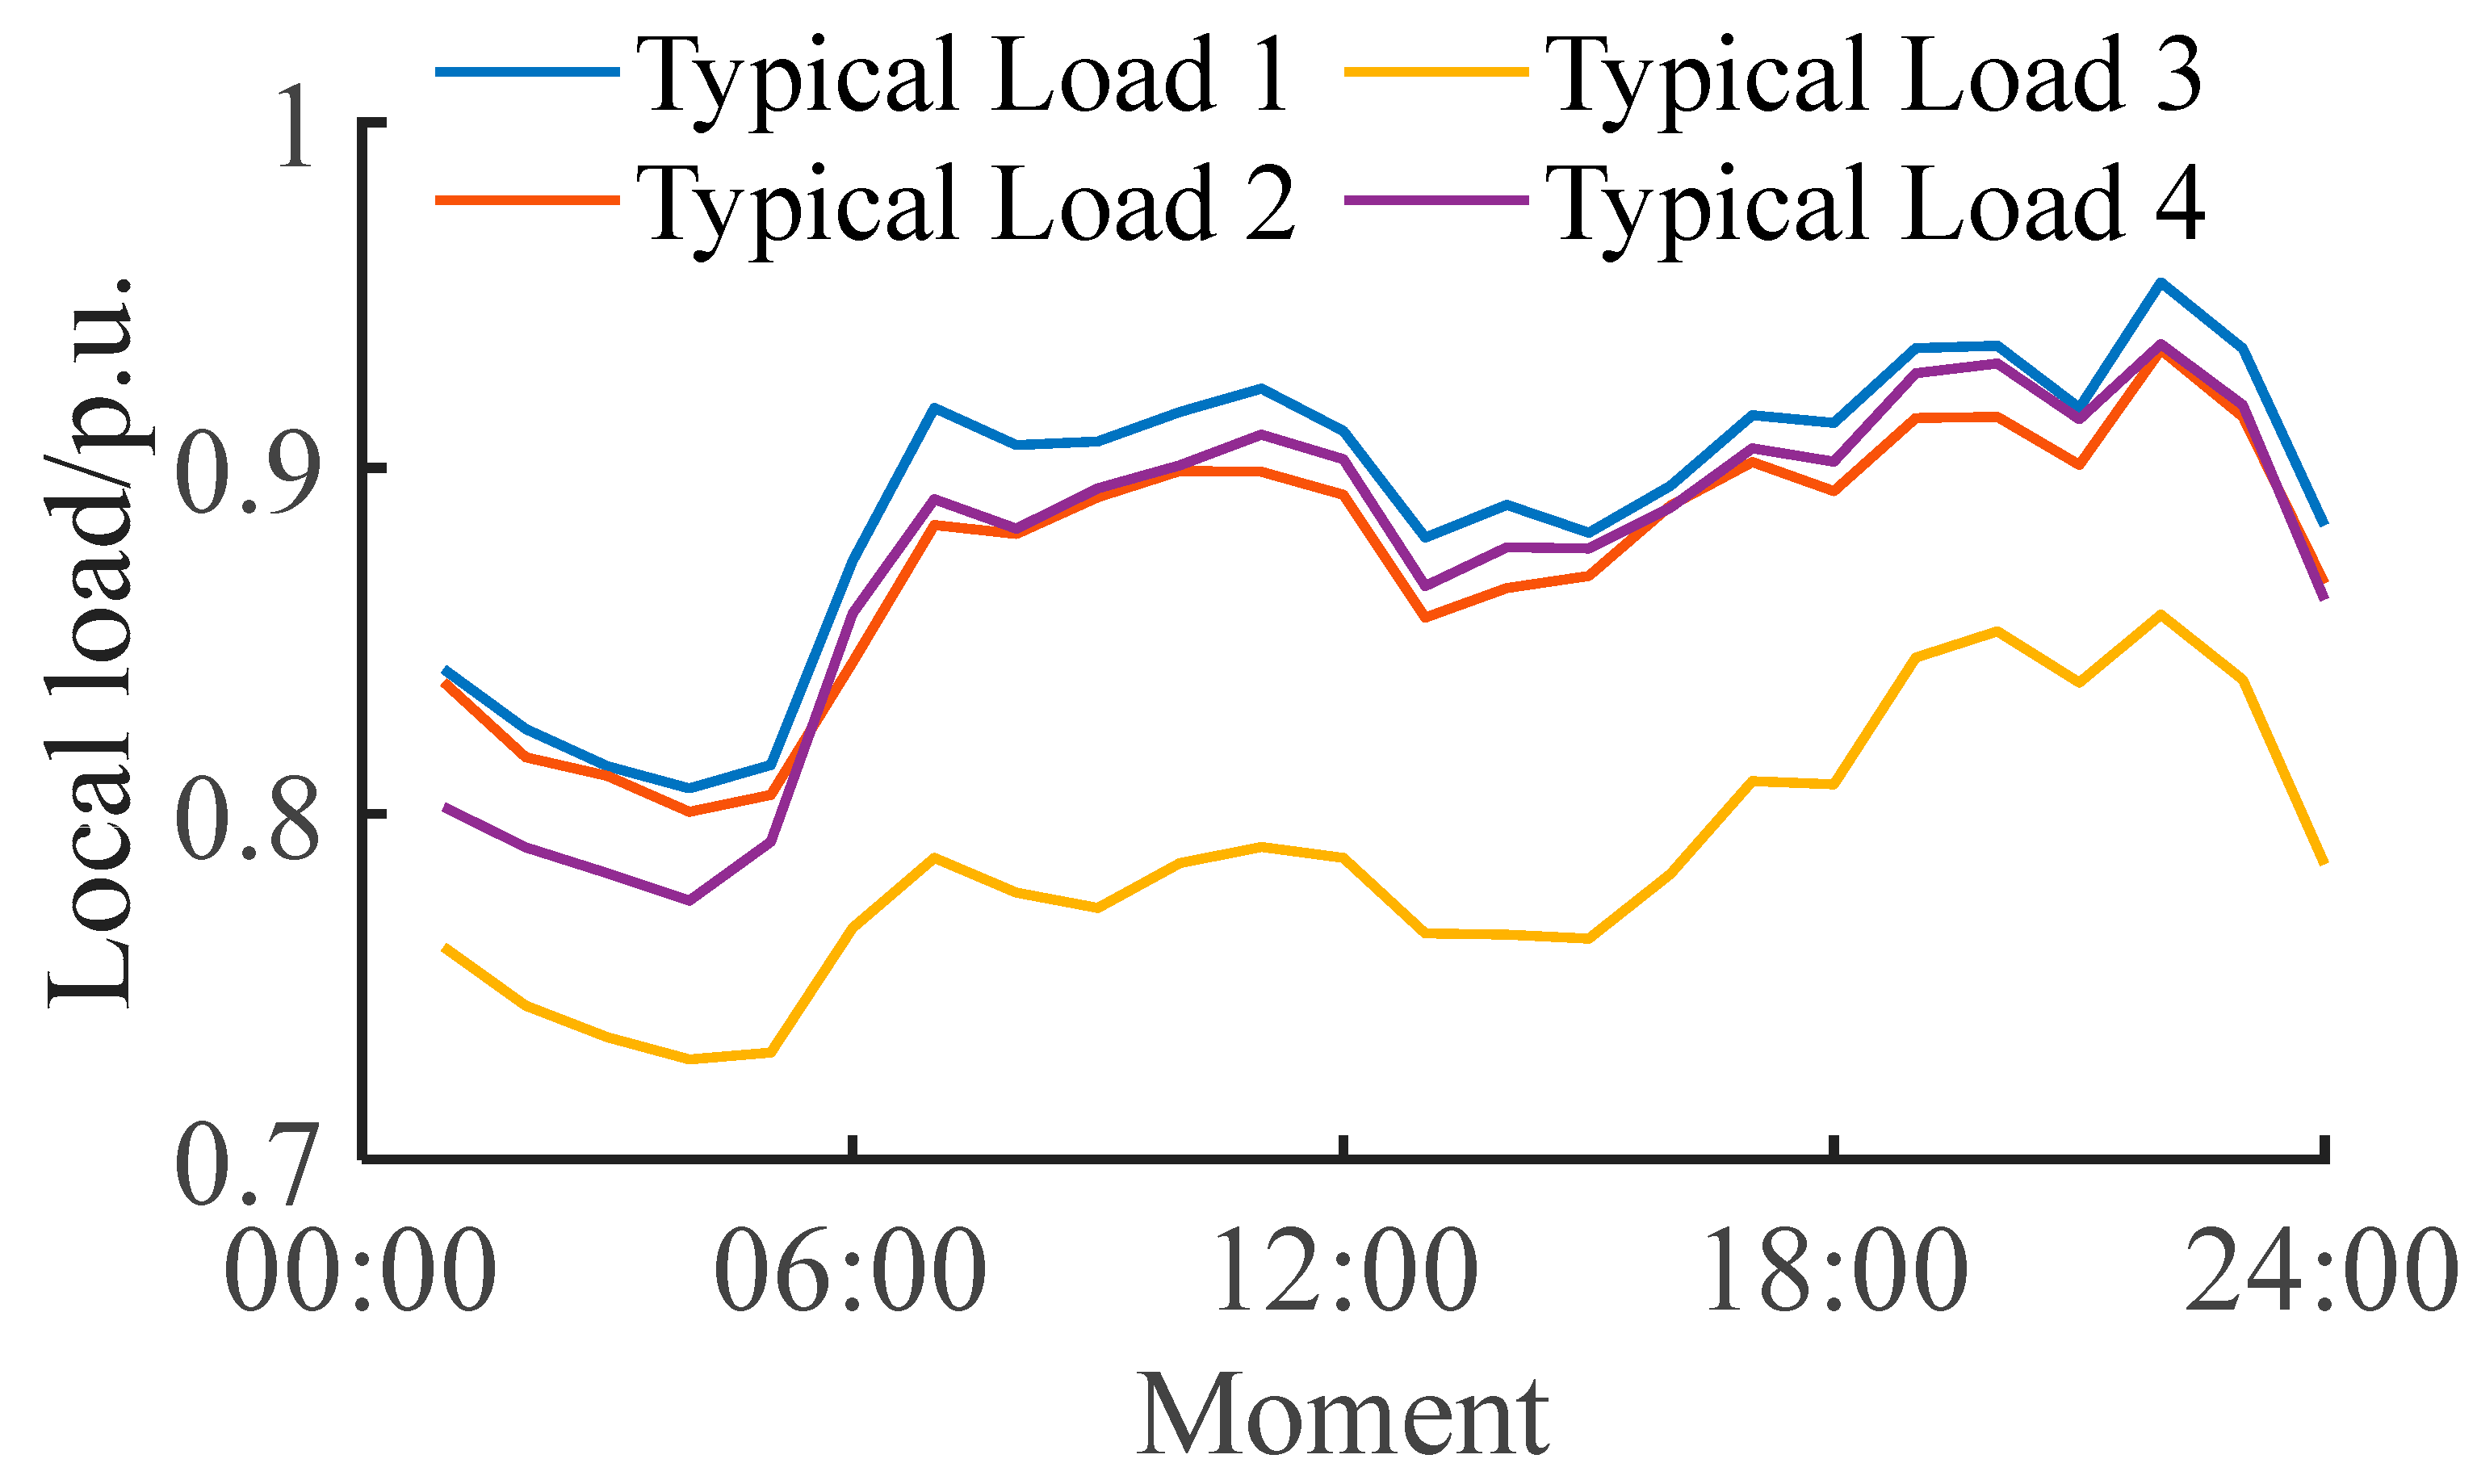
All simulations were implemented in MATLAB R2021b on a computer with a Windows 11 OS, an Intel® Core™ i7-13620H processor (Intel Corp., Santa Clara, CA, USA; 3.20 GHz), and 16 GB RAM. Validation uses four typical days of measured data from Xinjiang (Figure 7), featuring co-located wind, PV, and load profiles. Comparative analysis employs (1) conventional MPC using single-point forecasts without spatiotemporal correlation, and (2) the proposed RMPC method incorporating joint probability predictions of wind–PV output with spatiotemporal uncertainty quantification. The GA solver completes 24 h dispatch in 1.2 h (Intel i7-13620H/16 GB RAM). Complexity scales as O(N⋅G⋅S), where N = 200 (population size), G = 500 (generations), and S = 4 (scenarios).
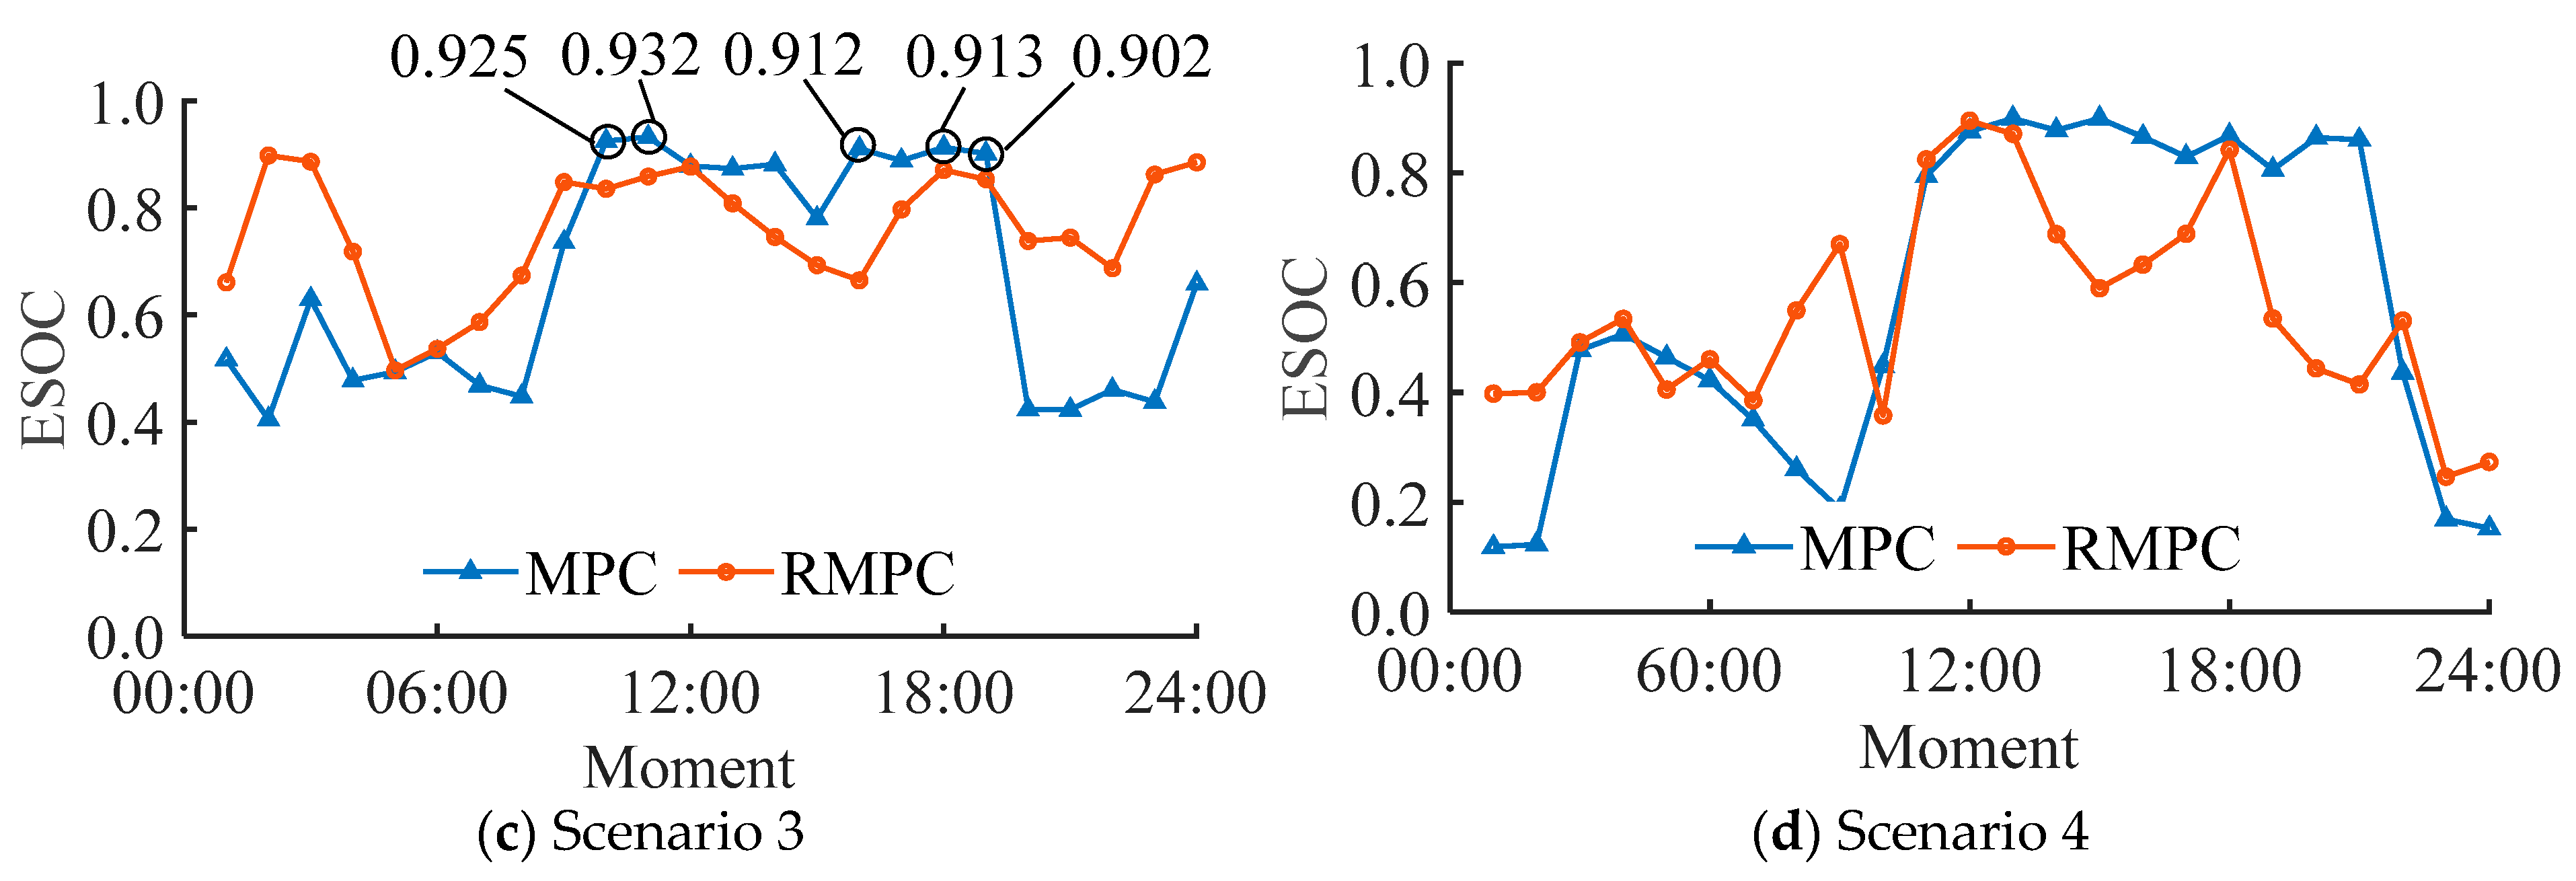
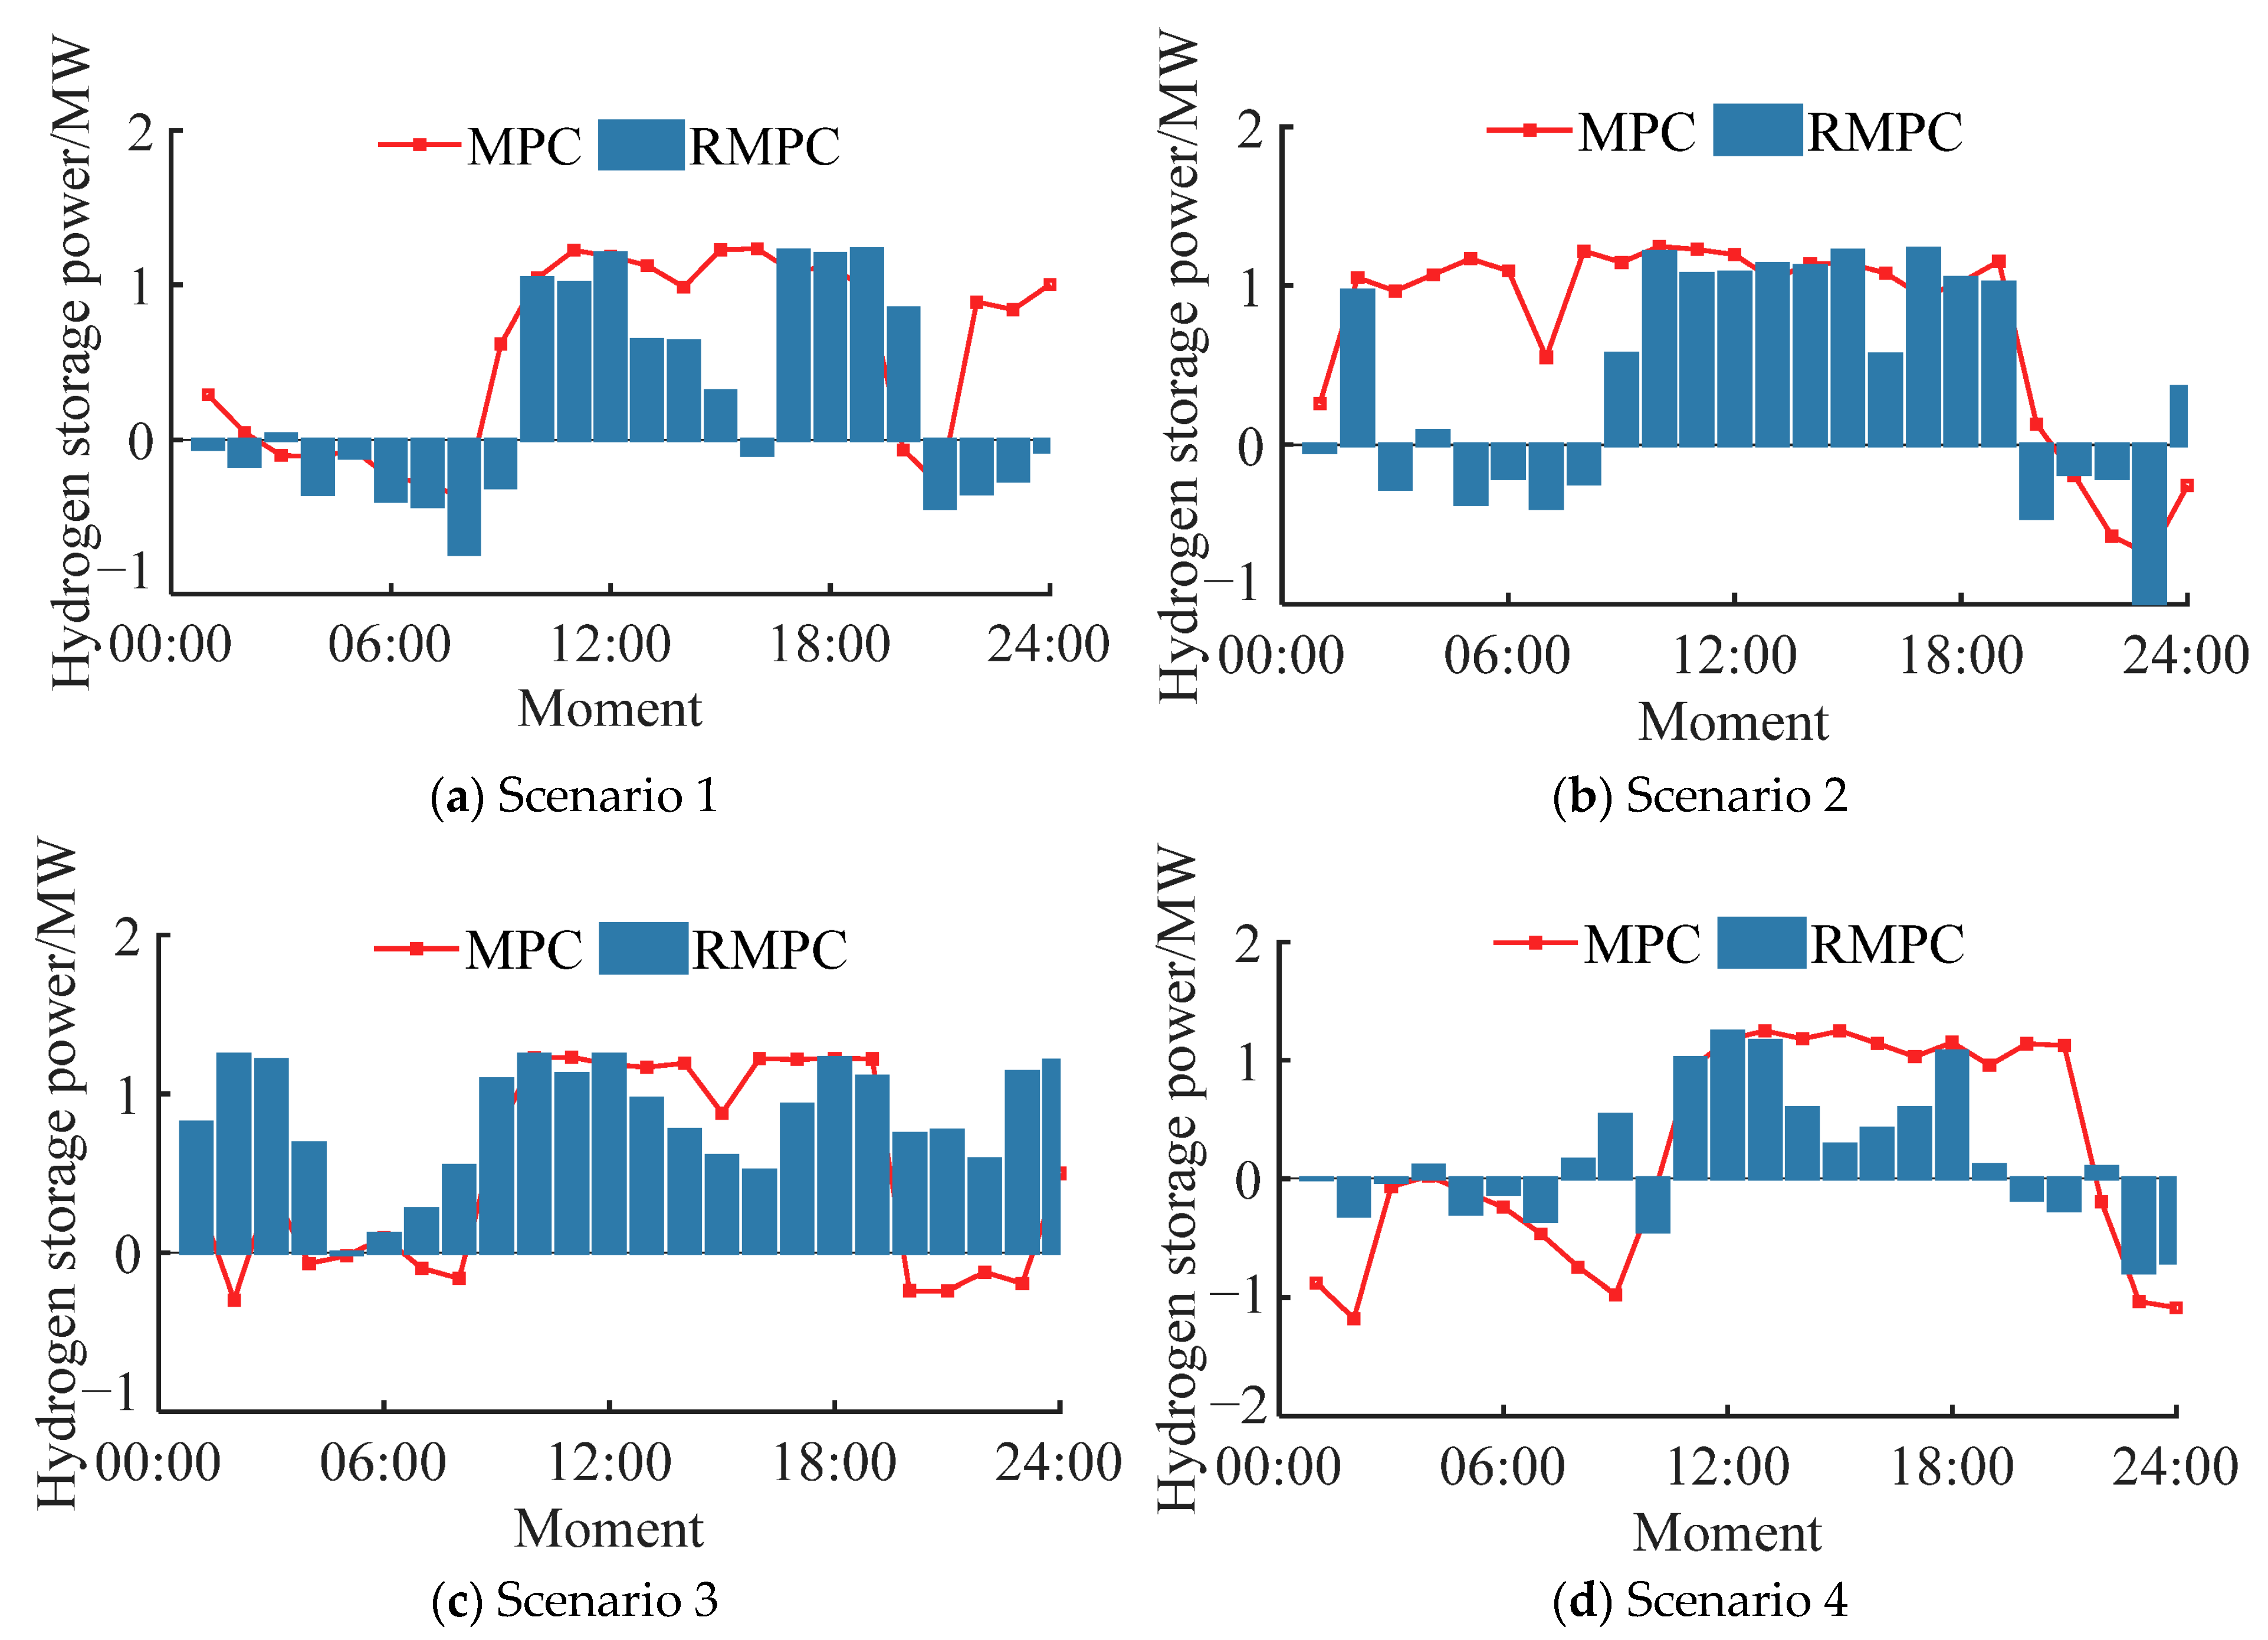
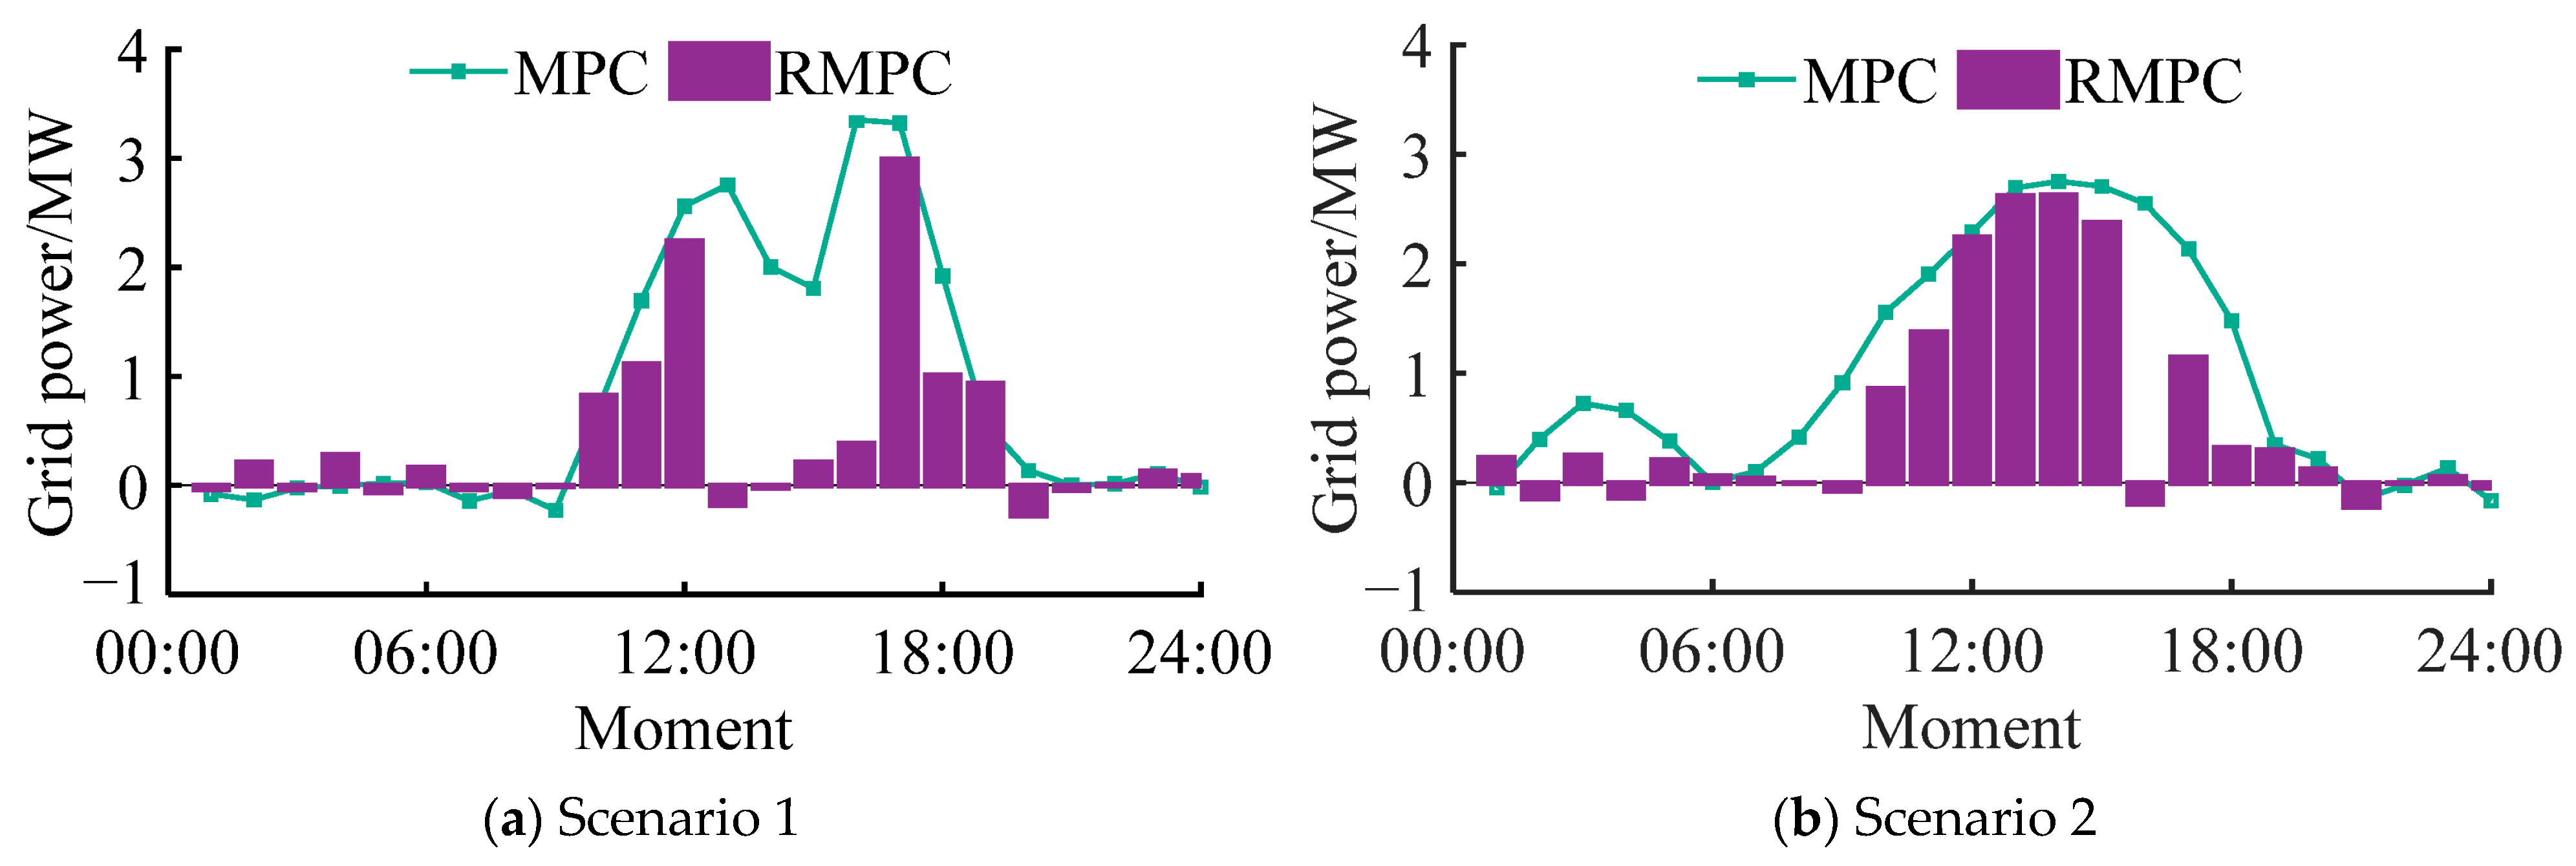
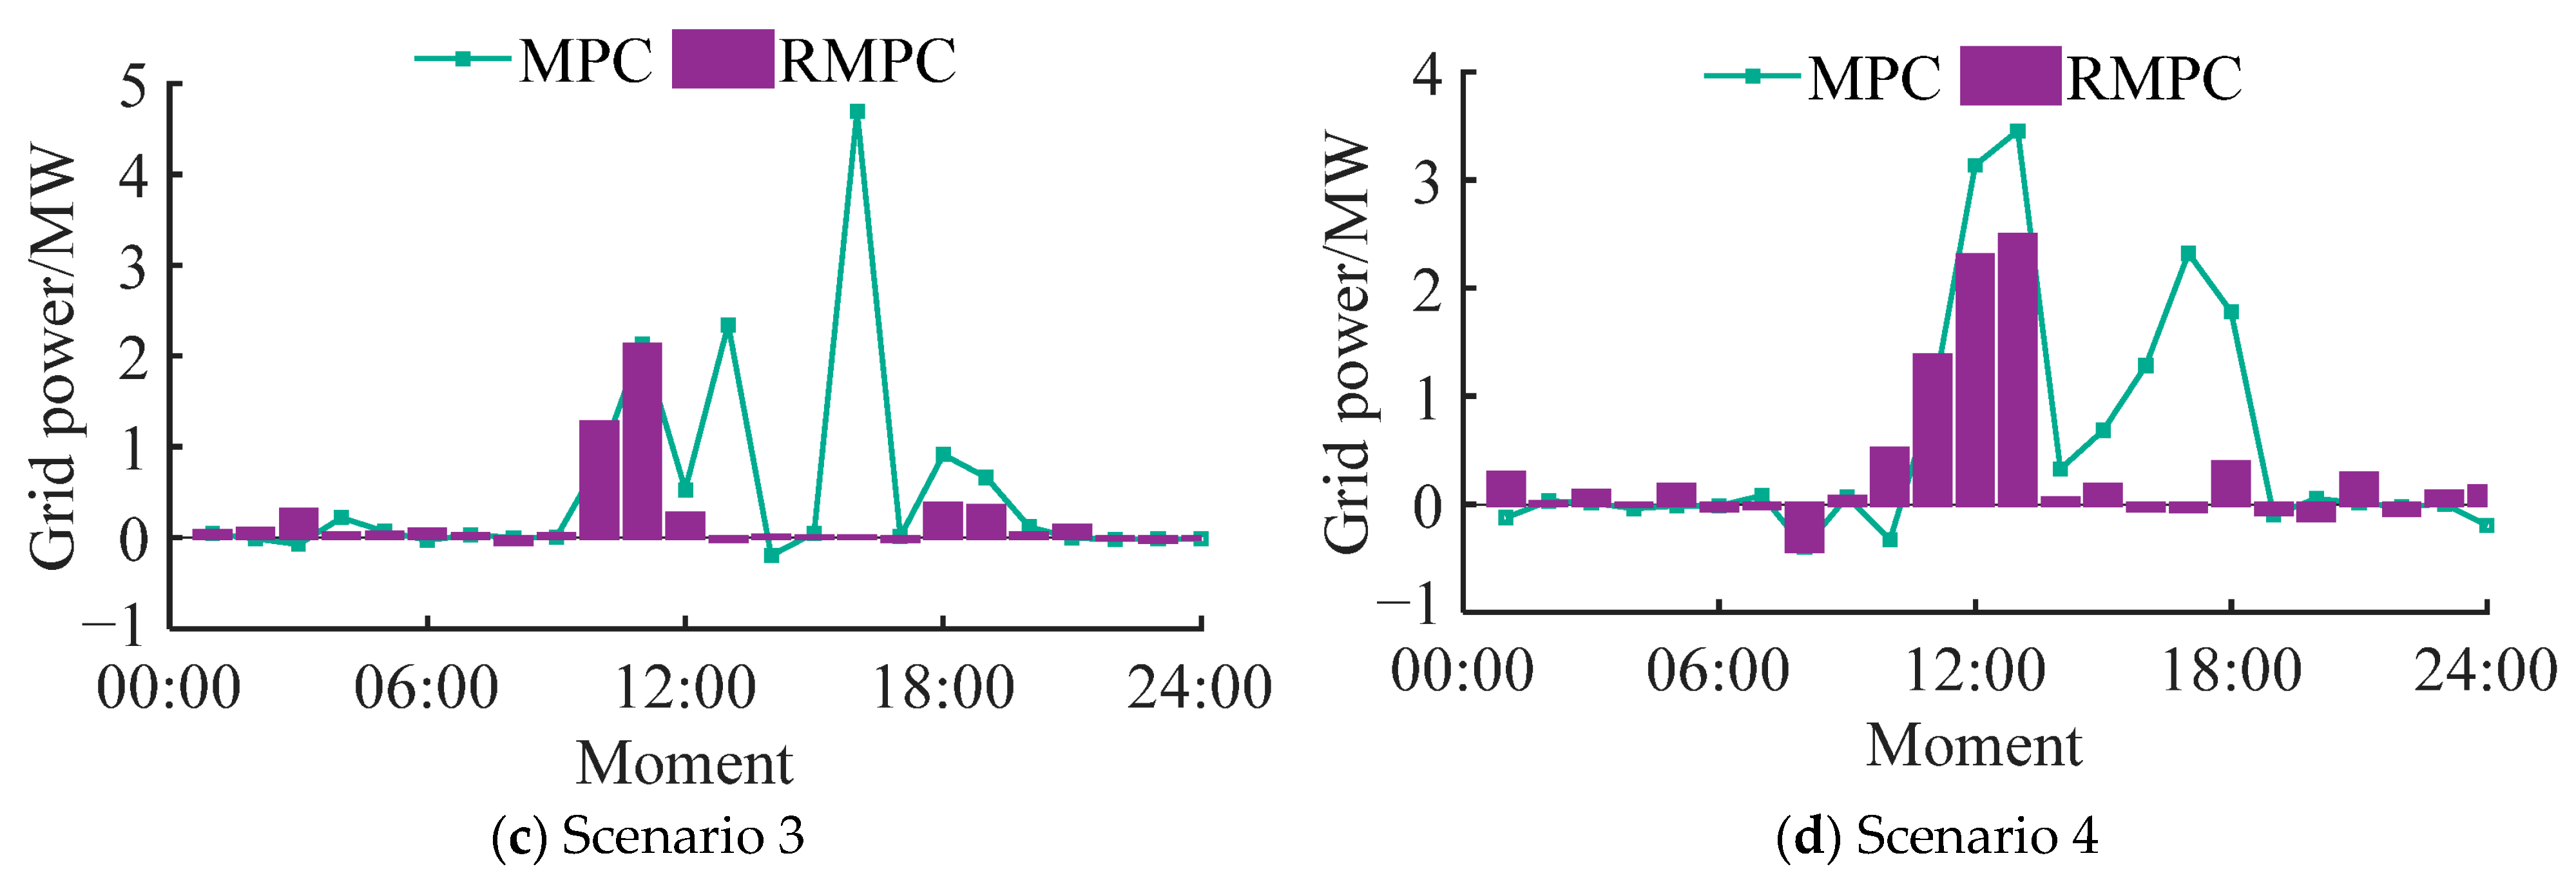
This section compares ESOC, hydrogen energy storage system power, and interactive power in different scenarios to illustrate the improvement in robustness by this method. The specific experimental comparison results are shown in Figure 8, Figure 9 and Figure 10. Analysis of scenarios 1, 2, and 4 demonstrates that the RMPC approach maintains the hydrogen storage system’s ESOC within the optimal 30–90% operational range, ensuring maximum operating efficiency. It can ensure the rapid response capability of the system. When the RMPC method is used, the power fluctuations in the three scenarios are only 2.89 MW, 2.53 MW, and 2.38 MW, respectively; that is, compared with the traditional MPC, the power fluctuations are reduced by 16.23%, 11.23%, and 33.15%. From extreme scenario 3, it can be seen that when traditional MPC is used, ESOC exceeds the upper limit five times, while RMPC controls ESOC in the safe range of 50–90% by predicting extreme scenarios (such as continuous low output) to avoid overcharge/overdischarge and reduce the system failure rate in extreme scenarios from 20.83% to 0; Regarding the power fluctuation, when the RMPC method is used, the system power fluctuation is only 2.02 MW, that is, it is 57.83% less than the power fluctuation of the traditional MPC, and the reduction is the largest in the four scenarios. Compared with the research results of [26,27,28], they are reduced by 58.19%, 48.30%, and 61.20%, respectively. Therefore, it is proven that the RMPC method proposed in this paper can not only effectively improve the robustness of conventional complementary systems but also is more suitable for extreme weather treatment.
To further and better analyze the impact of traditional MPC and RMPC methods on the complementary system, the standard deviation σ s d index of wind and PV fluctuations is introduced:
σ s d = 1 T t = 1 24 P p v , t + P w , t 1 T t = 1 24 P p v , t + P w , t 2
Table 2 presents the comparative performance metrics across all four scenarios.
The results indicate from Table 2 that relative to the fluctuation variability observed across the four scenarios, the variability metrics for wind and PV generation fluctuations in the complementary system using the RMPC method are only 1.73 MW, 1.81 MW, 1.77 MW, and 1.67 MW, respectively, which is 10.82% lower than the traditional MPC method, 10.40%, 10.15%, and 14.36%, and the grid-connected wind and light curtailment rates decreased by 35.24%, 39.05%, 58.41%, and 40.37%, respectively, proving that considering the correlation between wind and PV can reduce renewable generation variability in the system and increase new energy consumption rate to accomplish the objective of maximum regional renewable utilization of new energy.

5.3. Scheduling Result Analysis

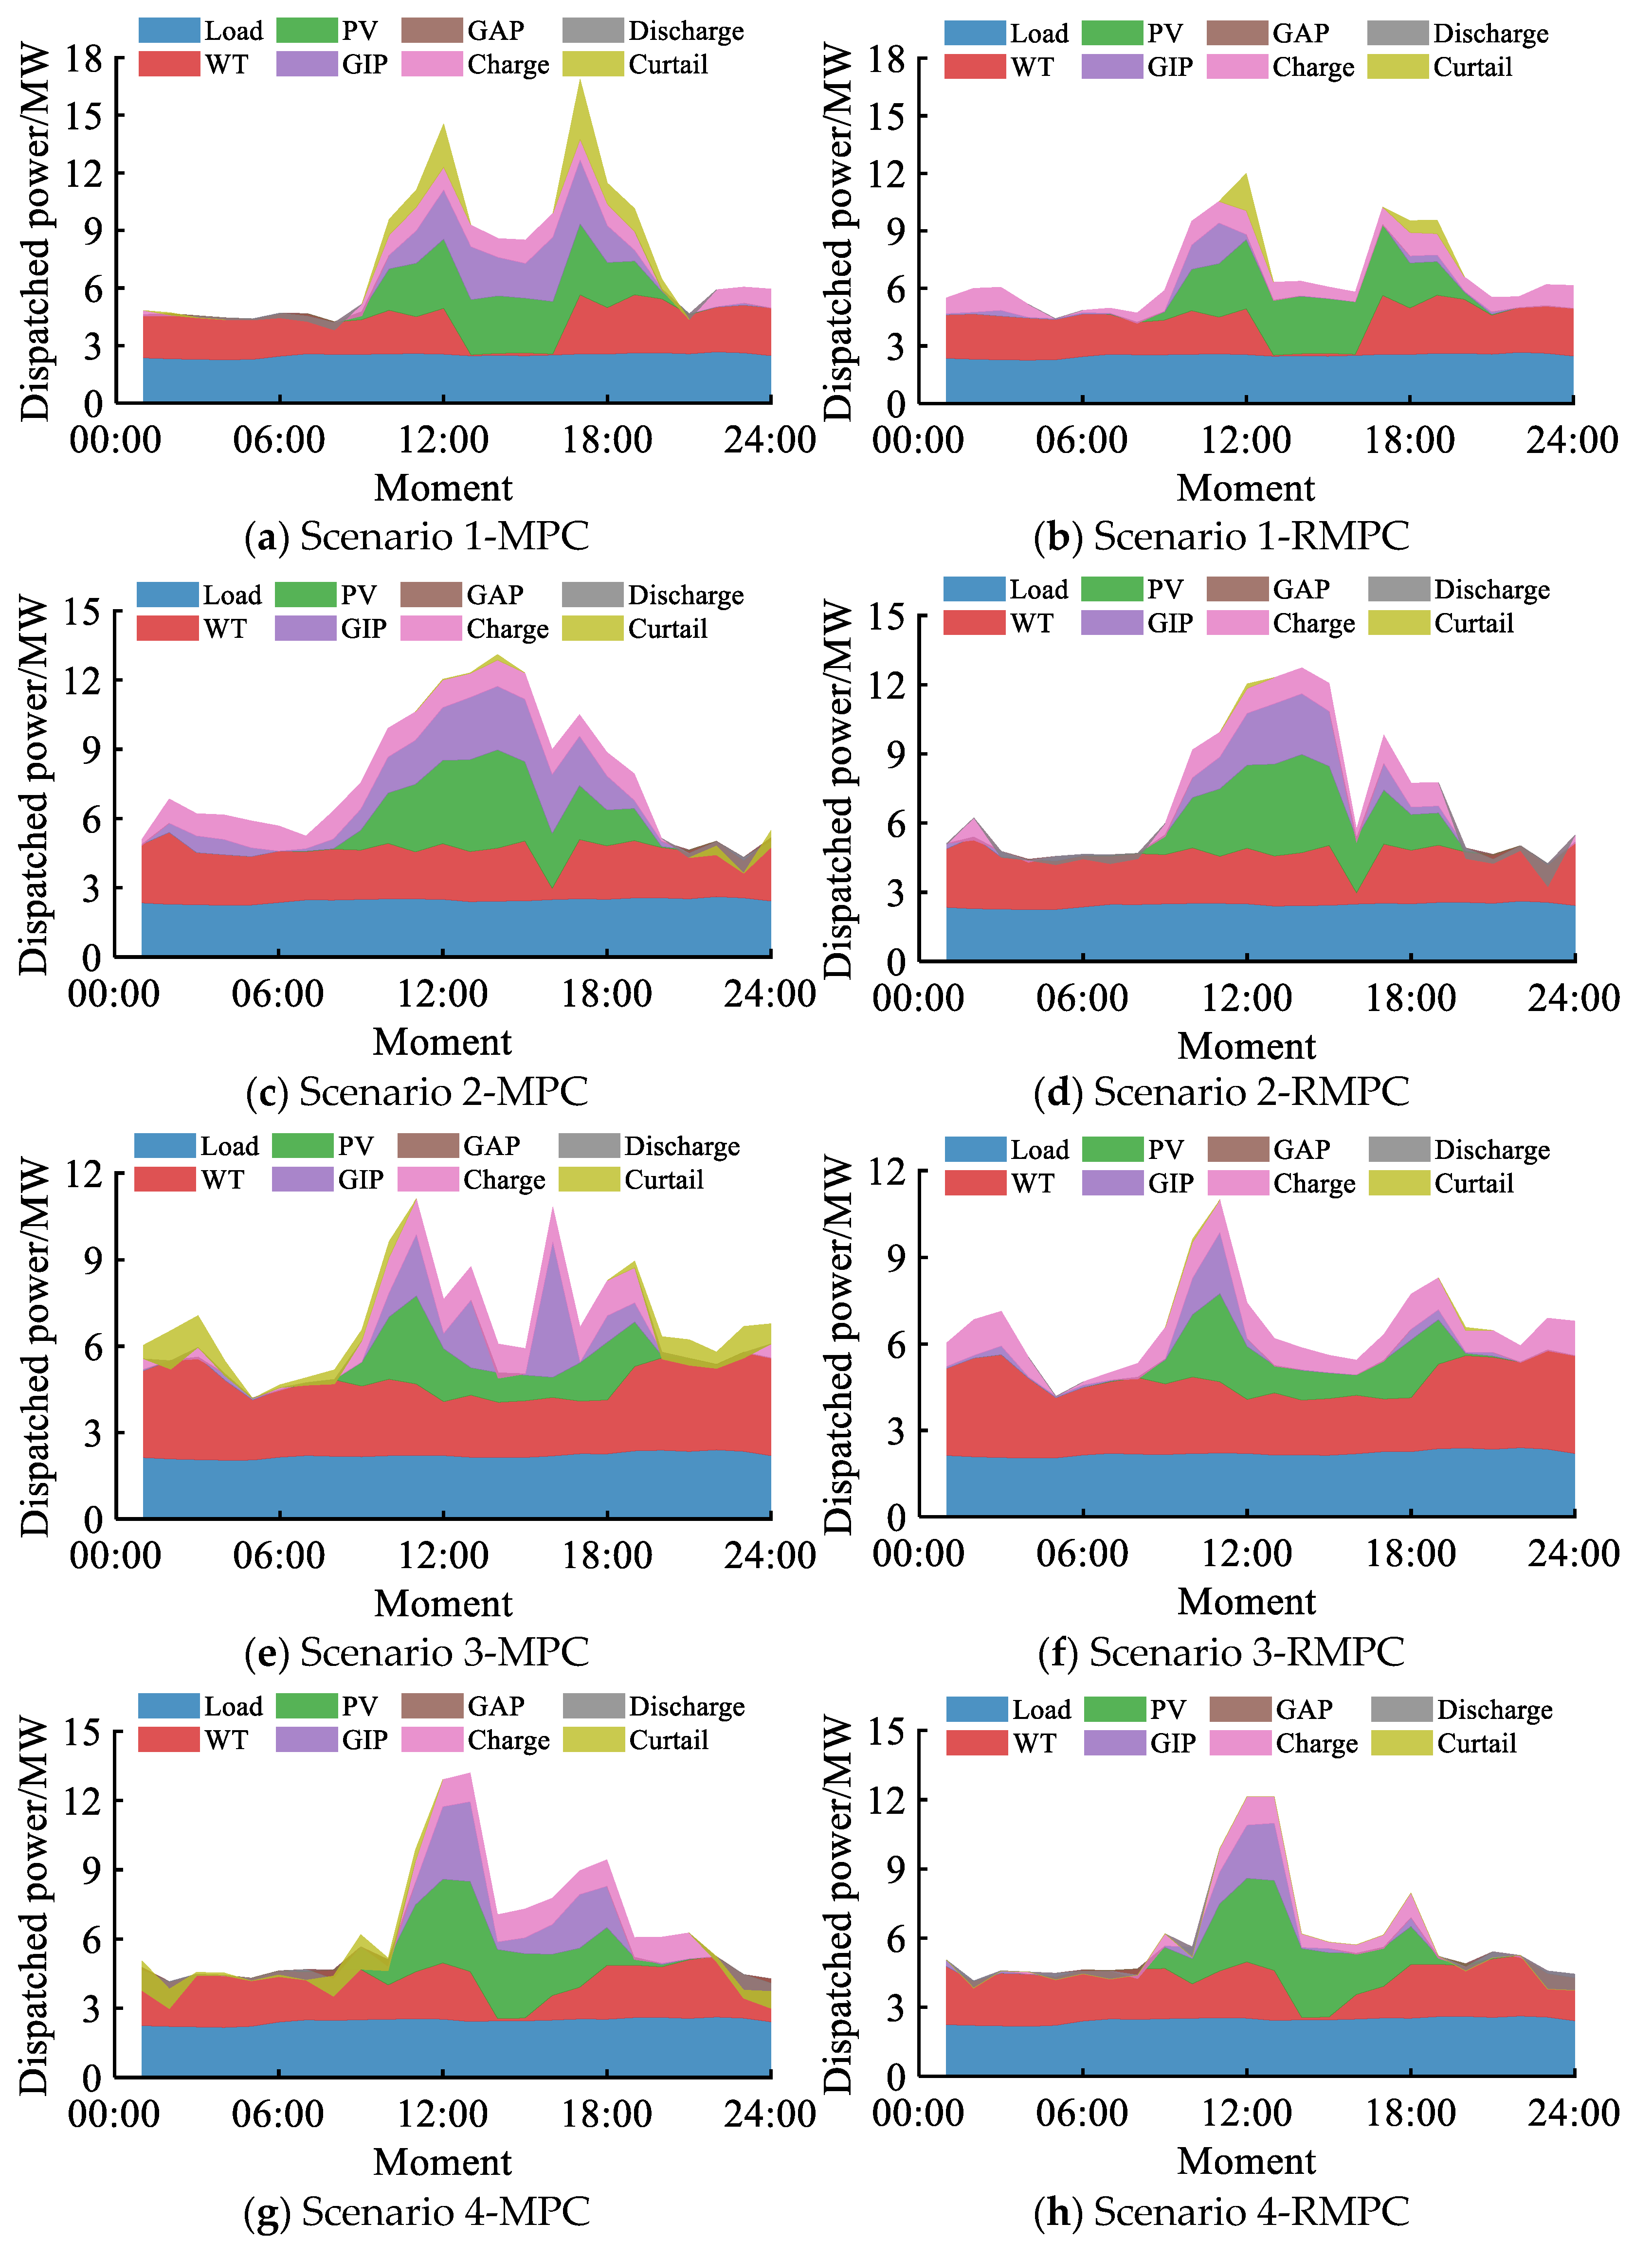
Based on the above data, the comparison scheduling results of the MPC scheduling method and the RMPC scheduling method for the four scenarios are shown in Figure 11.
From the comparative analysis in Figure 11, it can be seen that in the renewable energy scheduling scenario, the control effects of wind and solar curtailment of MPC and RMPC strategies are significantly different. In the case of fully considering the uncertainty of wind–solar combined output, the system’s peak regulation capacity is improved, which enhances the peak-shaving characteristics of the system with the hydrogen energy storage system. Taking scenario 3 as an example, the MPC strategy (Figure 11e) is at 11:00. Owing to the sudden change in wind–solar power, centralized power abandonment (instantaneous 2.1 MW) forms a steep power peak. The RMPC strategy (Figure 11f) proactively adjusts the energy storage schedule through robust optimization, distributing the power curtailment event as smooth fluctuations between 09:00 and 15:00 (<0.8 MW per interval). This approach reduces total power curtailment by 15% while preventing severe grid power disturbances. This comparison clearly shows that RMPC can not only reduce the waste of renewable energy caused by extreme power abandonment but also improve the stability of grid operation through the risk pre-allocation mechanism in the space–time dimension, especially suitable for the uncertainty of high-proportion renewable energy systems management.

6. Conclusions

This study addresses the challenge of large-scale renewable energy integration under significant uncertainty and volatility by developing a multi-energy flow system architecture combining wind, photovoltaic, and hydrogen storage technologies. We establish a state-space model for the coupled system and propose a robust model predictive control strategy for optimal scheduling that maximizes local renewable consumption while accounting for wind–solar output uncertainties. The main conclusions are as follows:
  • Based on Copula theory and improved K-means clustering, the wind–PV joint output scene generation method has significantly improved the prediction accuracy. The coefficient of variation of the wind–PV joint output scene has been reduced to 0.9643–0.9835, which is more than 10% more reliable than a single energy forecast.
  • The developed robust MPC scheduling framework successfully maximizes local renewable energy utilization efficiency. The wind and solar curtailment rate of the system is reduced by 35.24–58.41%, and the consumption rate is increased by 58.41%.
  • By setting up two comparative scheduling schemes of traditional MPC and RMPC, the superiority of the scheduling strategy in this paper is verified: in four typical scenarios, the renewable energy consumption rate increases by an average of 38.27% (58.41% in extreme scenarios).
  • For the problem of grid-connected power fluctuation, the proposed scheduling strategy (RMPC scheme) reduces the dispersion of wind and solar output by 11.43% on average and reduces the fluctuation of grid-interactive power by 57.83% at most (extreme scenarios). The effect of suppressing grid-connected power fluctuation is significant.
Future research will investigate hybrid energy storage synergies (e.g., hydrogen-battery systems) for enhanced renewable integration, while advancing spatiotemporal fluctuation tracing and stabilization strategies for correlated wind–PV variability.

Author Contributions

Conceptualization and methodology, Q.Z.; software and writing, G.L. and X.C.; resources and funding acquisition, A.Y. and K.Z. All authors have read and agreed to the published version of the manuscript.

Funding

This work is supported in part by the Youth guidance project of Guizhou Provincial Department of science and technology under Grant Qiankehe Foundation QN [2025] 256, in part by the Natural Science Research Project of Scientific Research Project of Liupanshui Normal University under Grant LPSSYZK202013, in part by the Research Project of Liupanshui Normal University under Grant LPSSYYBZK202203, in part by the Construction Project of first-class discipline of Liupanshui Normal University under Grant LPSYylbkzy202007, and in part by Guizhou Province First-class Undergraduate Major Construction Project under Grant GZSylzy202101.

Data Availability Statement

The original contributions presented in this study are included in the article. Further inquiries can be directed to the corresponding author.

Conflicts of Interest

Author Anqian Yang was employed by the company Electric Power Research Institute of Guizhou Power Grid Co., LTD. The remaining authors declare that the research was conducted in the absence of any commercial or financial relationships that could be construed as a potential conflict of interest.

References

  1. Zatsarinnaya, Y.N.; Valeeva, G.R.; Shirobokov, E.A.; Volkova, M.M.; Giniyatullina, D.R. Prospects for Renewable Energy Development Until 2035. In Advances in Automation V, Proceedings of the International Russian Automation Conference, Sochi, Russia, 10–16 September 2023; Springer Nature: Cham, Switzerland, 2023; pp. 382–392. [Google Scholar]
  2. Li, Y.; Yin, W.; Zhang, Z.; Lei, G.; Zhang, W.; Liu, L. Speed regulation predictive control method for hybrid transmission wind turbines under multi-source uncertainty. J. Beihang Univ. 2025; 1–16, Online First. [Google Scholar]
  3. Li, Q.; Huo, S.; Pu, Y.; Chen, W. Research Review of Electricity-Carbon-Hydrogen Coupled Trading Market for Hydrogen-Containing Integrated Energy Systems. Power Autom. Equip. 2023, 43, 175–187. [Google Scholar]
  4. Zhang, Y.; Cortés, J. Model predictive control for transient frequency regulation of power networks. Automatica 2021, 123, 109335. [Google Scholar] [CrossRef]
  5. Ordonez, J.G.; Barco-Jimenez, J.; Pantoja, A.; Revelo-Fuelagan, J.; Candelo-Becerra, J.E. Comprehensive analysis of MPC-based energy management strategies for isolated microgrids empowered by storage units and renewable energy sources. J. Energy Storage 2024, 94, 112127. [Google Scholar] [CrossRef]
  6. Zhang, Q.; Cai, Y. A model predictive control for a renewable-based multi energy system by integrating data-driven algorithm. Energy Rep. 2025, 14, 1491–1508. [Google Scholar] [CrossRef]
  7. Spantideas, S.T.; Giannopoulos, A.E.; Trakadas, P. Autonomous Price-aware Energy Management System in Smart Homes via Actor-Critic Learning with Predictive Capabilities. IEEE Trans. Autom. Sci. Eng. 2025, 22, 15018–15033. [Google Scholar] [CrossRef]
  8. Zhang, C.; Liu, Y.; Wu, F.; Tang, B.; Fan, W. Effective charging planning based on deep reinforcement learning for electric vehicles. IEEE Trans. Intell. Transp. Syst. 2020, 22, 542–554. [Google Scholar] [CrossRef]
  9. Zhang, J. Cyber-Attack Assessment, Detection, Identification, and Mitigation in Power-Electronics-Based Smart Grids (PESGs). Ph.D. Thesis, University of Georgia, Athens, GA, USA, 2023. [Google Scholar]
  10. Fan, Y.; Liu, W.; Zhu, F.; Wang, S.; Yue, H.; Zeng, Y.; Xu, B.; Zhong, P.A. Short-term stochastic multi-objective optimization scheduling of wind-solar-hydro hybrid system considering source-load uncertainties. Appl. Energy 2024, 372, 123781. [Google Scholar] [CrossRef]
  11. Yao, Y.; Shekhar, D.K. State of the art review on model predictive control (MPC) in Heating Ventilation and Air-conditioning (HVAC) field. Build. Environ. 2021, 200, 107952. [Google Scholar] [CrossRef]
  12. Lopez, A.; Pinchuk, P.; Gleason, M.; Cole, W.; Mai, T.; Williams, T.; Roberts, O.; Rivers, M.; Bannister, M.; Thomson, S.-M.; et al. Solar Photovoltaics and Land-Based Wind Technical Potential and Supply Curves for the Contiguous United States (2023 Edition); (No. NREL/TP-6A20-87843); National Renewable Energy Laboratory (NREL): Golden, CO, USA, 2024. [Google Scholar]
  13. Li, M.; Furifu, C.; Ge, C.; Zheng, Y.; Lin, S.; Liu, R. Distributed Robust Optimal Dispatch for the Microgrid Considering Output Correlation between Wind and Photovoltaic. Energy Eng. 2023, 120, 8. [Google Scholar] [CrossRef]
  14. Xie, H. Statistical Analysis and Application of MATLAB: Analysis of 40 Cases; Beijing University of Aeronautics & Astronautics Press: Beijing, China, 2010; pp. 191–192. [Google Scholar]
  15. Chen, F.; Guo, Y.; Shao, Z. Affine real-time optimal dispatching for multi-energy microgrid with renewable energy output correlation. Power Syst. Technol. 2024, 48, 3248–3257. [Google Scholar]
  16. Lu, J.; Yu, H. Dependence structure analysis of wind and pv power based on hybrid copula. Taiyangneng Xuebao/Acta Energiae Solaris Sin. 2017, 38, 3188–3194. [Google Scholar]
  17. Huang, Y.; Zhang, B.; Pang, H.; Xu, J.; Liu, L.; Wang, B. Research on wind speed forecasting method based on hybrid copula optimization algorithm. Acta Energiae Solaris Sin. 2022, 43, 192–201. [Google Scholar]
  18. Ding, M.; Liu, X.; Bi, R.; Hu, D.; Ye, B.; Zhang, J. Method for cluster partition of high-penetration distributed generators based on comprehensive performance index. Autom. Electr. Power Syst. 2018, 42, 47–52. [Google Scholar]
  19. Ma, Q.; Xiao, L.; Cheng, B.; Gao, Q.; Liu, C.; Zhu, Y.; Li, C. Cooperative primary frequency modulation control method for distributed energy storage based on reinforcement learning-model predictive control (RL-MPC). Energy Storage Sci. Technol. 2025, 14, 3138–3148. [Google Scholar]
  20. Zhao, S.; Lin, H.; Wang, H. Bidding strategy for virtual power plants considering wind and PV uncertainty in the electricity-carbon joint market. Power Eng. Technol. 2025, 44, 76–85. [Google Scholar]
  21. Lu, D.; Peng, Y.; Sun, J. Dual-Stage optimization scheduling model for a Grid-Connected renewable energy system with hybrid energy storage. Energies 2024, 17, 737. [Google Scholar] [CrossRef]
  22. Li, J.; Ji, S.; Wang, X.; Zhang, H.; Li, Y.; Qian, X.; Xiao, Y. A Stackelberg game-based optimal scheduling model for multi-microgrid systems considering photovoltaic consumption and integrated demand response. Energies 2024, 17, 6002. [Google Scholar] [CrossRef]
  23. IEEE Std 1547-2020; IEEE Standard for Interconnection and Interoperability of Distributed Energy Resources with Associated Electric Power Systems Interfaces. The Institute of Electrical and Electronics Engineers: New York, NY, USA, 2020.
  24. Zhao, J.; Yuan, Y.; Fu, Z.; Sun, C.; Xu, W. Reliability assessment of wind-pv hybrid generation system based on copula theory. Electr. Power Autom. Equip. 2013, 33, 124–129. [Google Scholar]
  25. Wei, H. Research on Long-Term Complex Scheduling Rules of Hydro-Wind-Photodynamic Based on Active Regulation of Cascade Hydropower Stations; Dalian University of Technology: Dalian, China, 2023. [Google Scholar]
  26. Chen, X.; Cao, W.; Zhang, Q.; Hu, S.; Zhang, J. Artificial intelligence-aided model predictive control for a grid-tied wind-hydrogen-fuel cell system. IEEE Access 2020, 8, 92418–92430. [Google Scholar] [CrossRef]
  27. Chen, X.; Cao, W.; Xing, L. GA optimization method for a multi-vector energy system incorporating wind, hydrogen, and fuel cells for rural village applications. Appl. Sci. 2019, 9, 3554. [Google Scholar] [CrossRef]
  28. Zhang, Q.; Chen, X.; Li, G.; Feng, J.; Yang, A. Model predictive control method of multi-energy flow system considering wind power consumption. IEEE Access 2023, 11, 86697–86710. [Google Scholar] [CrossRef]
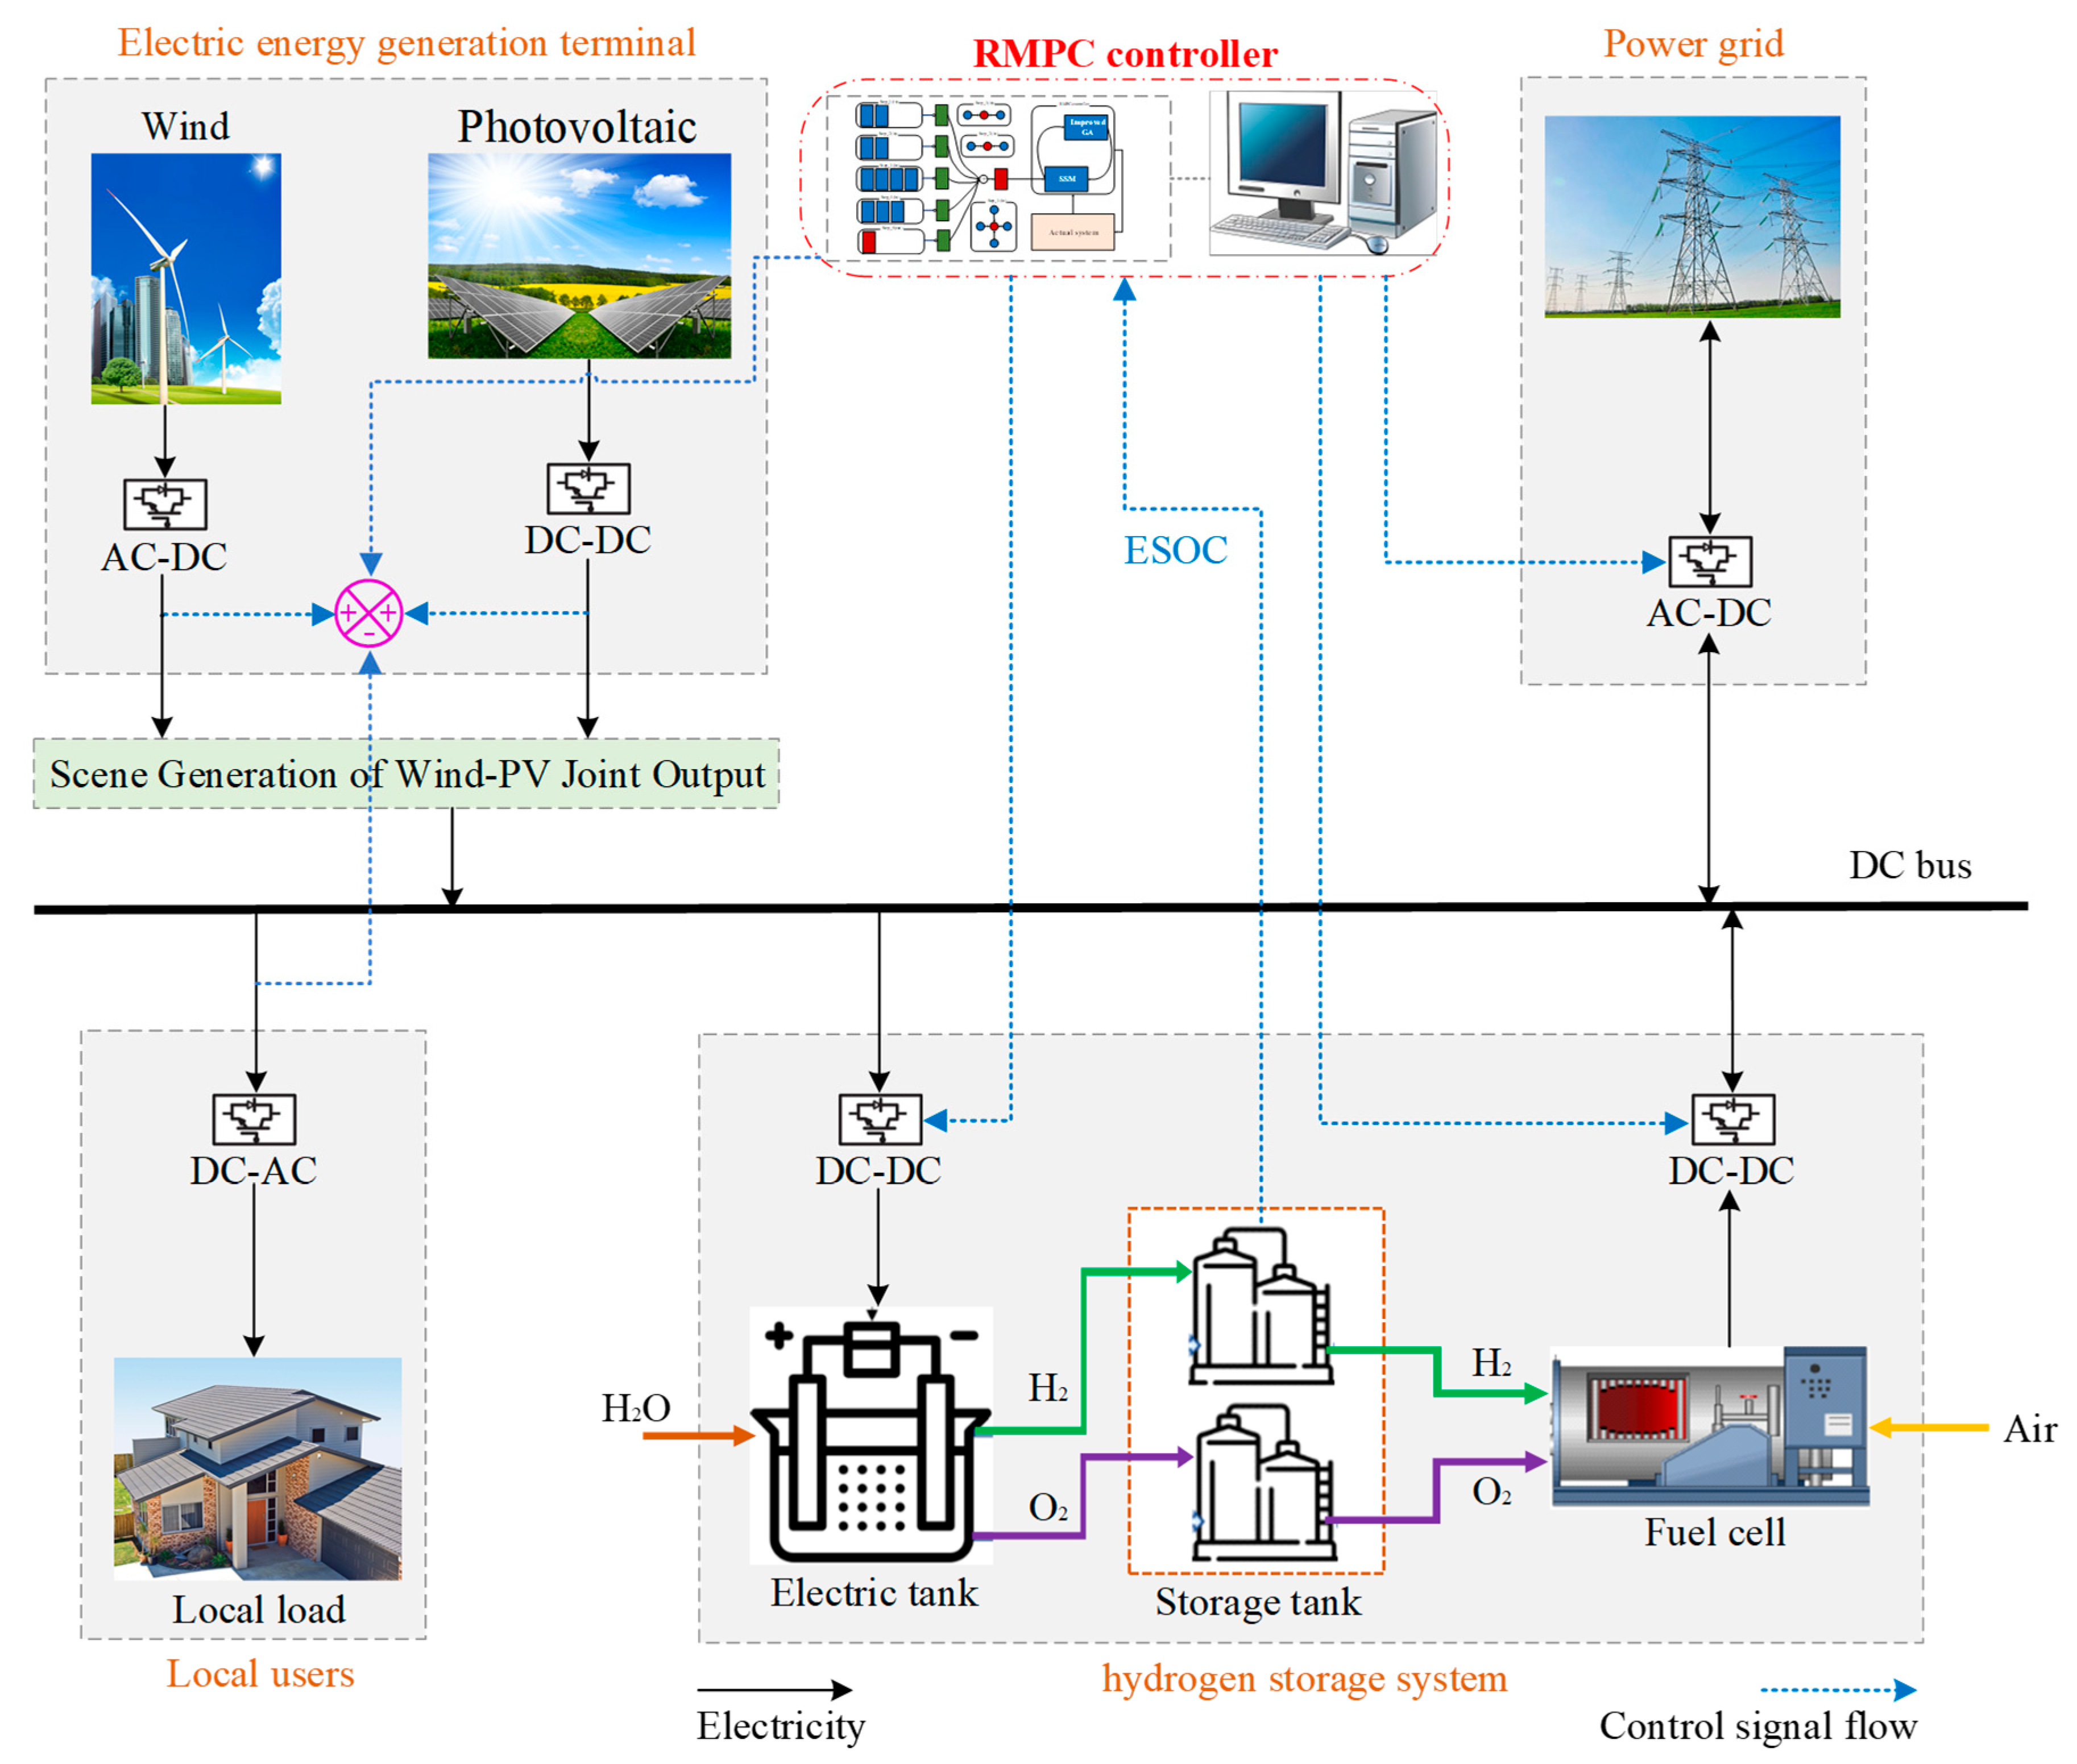
Figure 1. Wind–PV–hydrogen storage–fuel cell synergistic system.
Energies 18 04498 g001
Figure 2. Scene generation method of wind–PV combined output.
Energies 18 04498 g002
Figure 3. RMPC scheduling policy implementation method.
Energies 18 04498 g003
Figure 4. Scenario generation results of WT.
Energies 18 04498 g004
Figure 5. Scenario generation results of PV.
Energies 18 04498 g005
Figure 6. Frank Copula distribution function.
Energies 18 04498 g006
Figure 7. Typical load result.
Energies 18 04498 g007
Figure 8. ESOC comparison results of 4 scenarios.
Energies 18 04498 g008aEnergies 18 04498 g008b
Figure 9. Power comparison results of hydrogen energy storage systems in 4 scenarios.
Energies 18 04498 g009
Figure 10. Comparison results of interactive power in 4 scenarios.
Energies 18 04498 g010aEnergies 18 04498 g010b
Figure 11. Four scenario scheduling comparison results.
Energies 18 04498 g011
Table 1. Coefficient of variation results.
Scene Serial Number of Wind–PV Joint OutputPV Output Only
(δ1)
Wind   Power   Output   Only   (δ2)Wind–PV  Combined   Output   (COVc)
Scenario 11.63211.04120.9680
Scenario 21.56821.04760.9654
Scenario 31.62121.08110.9835
Scenario 41.74141.03130.9643
Table 2. Comparison results of 4 scenarios.
Seasonal TypeOptimization Method Energy
Storage Power
/MW
Electrolyzed Water Power
/MW
Fuel Cell
Discharge
/MW
Grid Power
/MW
GIP
/MW
GAP
/MW
Increased Wind and PV Curtailment Rate/% σ s d
/%
Scenario 1MPC16.4514.881.5721.6921.030.6635.241.94
RMPC13.169.373.7914.4113.620.791.73
Scenario 2MPC21.5419.831.7124.7624.380.3839.052.02
RMPC16.0512.693.3615.6714.860.811.81
Scenario 3MPC15.3113.861.4513.0312.670.3658.411.97
RMPC20.1520.140.015.455.270.181.77
Scenario 4MPC19.5012.357.1515.4614.221.2440.371.95
RMPC10.877.373.509.438.480.951.67
Disclaimer/Publisher’s Note: The statements, opinions and data contained in all publications are solely those of the individual author(s) and contributor(s) and not of MDPI and/or the editor(s). MDPI and/or the editor(s) disclaim responsibility for any injury to people or property resulting from any ideas, methods, instructions or products referred to in the content.