Article

Spatial Multi-Criteria Land Suitability Analysis for Community-Scale Biomass Power Plant Site Selection

by
Athipthep Boonman
1,2,
Suneerat Fukuda
1,2,* and
Agapol Junpen
1,2
1
The Joint Graduate School of Energy and Environment, King Mongkut’s University of Technology Thonburi, Bangkok 10140, Thailand
2
Center of Excellence on Energy Technology and Environment (CEE), Ministry of Higher Education, Science, Research and Innovation (MHESI), Bangkok 10140, Thailand
*
Author to whom correspondence should be addressed.
Energies 2025, 18(17), 4469; https://doi.org/10.3390/en18174469
Submission received: 22 June 2025 / Revised: 12 August 2025 / Accepted: 19 August 2025 / Published: 22 August 2025

Abstract

Community-scale biomass power plants (CSBPPs) offer a decentralized approach for electricity generation by utilizing locally available biomass while delivering socioeconomic benefits. Site selection plays a critical role in the success of CSBPPs and requires the consideration of diverse spatial and non-spatial factors. This study presents a spatial decision-support tool for identifying suitable CSBPP sites in Thailand’s Eastern Economic Corridor (EEC), which comprises the Chachoengsao, Chonburi, and Rayong provinces. A geoprocessing workflow integrating Geographic Information Systems (GISs), Multi-Criteria Decision-Making (MCDM), and the Analytic Hierarchy Process (AHP) was developed using ModelBuilder tools in ArcGIS Pro (version 3.0.2). Thirteen sub-criteria related to geographical, infrastructural, and socioeconomic–cultural dimensions, along with exclusion zones, were evaluated by 15 experts from diverse stakeholder groups. Biomass availability from five major economic crops was combined with other spatial data layers, incorporating expert-assigned weights and suitability scores. The findings indicated a remaining biomass energy potential was 34,156 TJ, with sugarcane residues contributing over 80%. Approximately 20% of the EEC area (about 0.262 million hectares) was classified as highly suitable for CSBPP development, revealing several viable site options. The proposed model offers a flexible and replicable framework for regional biomass planning and can be adapted to other locations by adjusting the criteria and integrating optimization techniques.

1. Introduction

Local communities in both developed and developing countries are undergoing a transformation. They are shifting from being passive energy consumers to active prosumers engaged in energy production. Community energy plays a critical role in integrating distributed energy resources (DERs) while fostering local participation and ownership. This active involvement not only strengthens communities but also supports the development of sustainable, decentralized energy systems. By deploying DERs, community energy initiatives help bridge gaps in access to electricity, heating, and transportation, particularly at the grassroots level. These efforts empower communities to take charge of their energy futures, enhancing energy resilience, driving local economic growth, and advancing environmental sustainability [1].
The Thai government has recognized the importance of community energy and initiated a pilot project aimed at generating a total of 150 MW of electricity from small-scale biomass and biogas power plants—with capacities of less than 6 MW and 3 MW, respectively [2,3]. This initiative incorporates strategies to support local economic development, including the creation of prototype community models grounded in local enterprise ecosystems. Under this program, private developers are permitted to build, own, and operate power plants, provided that at least 10% of ownership is held by a community enterprise or community enterprise network, and a minimum of 80% of the fuel supply is sourced locally. These requirements promote active community participation in energy generation, fostering local self-reliance and supporting a more sustainable and inclusive energy transition. To ensure long-term viability, 20-year Power Purchase Agreements (PPAs) will be established between the community-based power plants and the Provincial Electricity Authority (PEA) [4].
Strategic site selection is critical to the successful development of Community-Scale Biomass Power Plants (CSBPPs). Among the various factors, the availability of biomass feedstock is one of the most important determinants of a project’s feasibility and long-term sustainability. Effective supply chain management is essential to maintain a balanced relationship between supply and demand, addressing challenges posed by the dispersed and seasonal nature of biomass resources. Optimizing the supply chain not only enhances operational efficiency but also contributes to income stability for the local communities supplying the feedstock. Establishing long-term agreements (e.g., 3–5 years) between power plants and local farming communities or cooperatives ensures certainty in both supply volume and pricing. Such arrangements allow communities to plan their production and income with greater confidence, while enabling power plants to secure a reliable and continuous biomass fuel supply [2,3]. Nevertheless, other key factors—such as environmental and social considerations—must also be integrated into the site selection process to ensure a comprehensive and responsible approach [5].
Multi-Criteria Decision-Making (MCDM) is extensively applied in energy policy development and sustainable energy management, particularly in renewable energy planning and resource allocation, when multiple criteria (or objectives) need to be considered together [6]. There are several MCDM approaches that can used for analysis and decision-making. For example, the Analytic Hierarchy Process (AHP) is commonly employed to address complex energy planning issues involving multiple, and often conflicting, criteria and multiple objectives in energy applications to evaluate power plants and prioritize development, such as the studies by Budak et al. (2019) [7] and Çolak (2024) [8]. Other MCDM approaches include weighted sums [9], priority settings [10], etc. Effatpanah et al. (2022) [11] reviewed the MCDM approaches and conducted a comparative analysis of five MCDM techniques (SAW, TOPSIS, ELECTRE, VIKOR, and COPRAS) for clean energy technology solutions, including solar, wind, nuclear, and biomass. It was concluded that each MCDM approach has its own benefits, drawbacks, and suitability for a particular application. This study selected the MCDM-AHP method since it is one of the most established MCDM methods for siting biomass power plants and more importantly, it can be readily integrated into the GIS spatial analysis platform.
Geographic Information Systems (GISs) have been widely employed in numerous studies to identify optimal sites for biomass power plants. For example, Natarajan et al. (2016) utilized GISs to map surplus biomass resources by accounting for existing biomass consumption, enabling the strategic siting of biomass-based and cogeneration power plants in various Indian states [12]. Bharti et al. (2021) [13] utilized GISs to estimate the bioenergy potential of agriculture residues. This research highlighted that GISs applications offer significant benefits for farmers, ranging from efficient biomass management to the production of renewable energy. GISs have also become a standard tool in the planning of other renewable energy systems. The integration of GISs with Multi-Criteria Decision-Making (MCDM) and Analytic Hierarchy Process (AHP) methodologies further enhance energy planning by enabling comprehensive spatial analysis, improving visualization and communication, and offering advanced decision-making support [14]. This integrated approach has been successfully applied in various contexts: Ali et al. (2019) used GISs and AHP to evaluate physiographic, environmental, and economic criteria for siting a hybrid wind–solar power plant in Songkhla, Thailand [15]. Similarly, Waewsak et al. (2020) identified potential sites for para rubberwood power plants based on a secure supply of para rubberwood feedstock to individual 9.5 MW biomass facilities for at least 20 years in the southernmost provinces of Thailand [16]. Sekeroglu et al. (2024) identified sites for biomass-solar hybrid renewable energy facilities based on spatial modeling and fuzzy logic Geographic Information Systems [17].
Although GIS-based MCDM combined with AHP techniques have been widely applied to develop land suitability models, several limitations and challenges remain. Traditional AHP relies on decision-makers to assign weights or relative importance to each criterion based on subjective judgment, which can introduce biases or inconsistencies into the decision-making process. Additionally, the assumption of fixed weights limits AHP’s ability to account for uncertainty or variability in expert opinions. Another notable limitation is its lack of scalability, making it impractical for problems involving a large number of criteria or alternatives.
This study contributes to advancing GIS-based MCDM methodologies by introducing an automated, scalable geospatial decision-support framework for community-scale biomass power plant (CSBPP) site selection. The study presents a novel integration of spatial-based MCDM and AHP in a pairwise comparison matrix within a GIS environment using the ModelBuilder tool in ArcGIS Pro [18]. This enables structured and reproducible decision analysis while improving model transparency and efficiency. The participatory weighting approach, which incorporates diverse expert inputs from stakeholders involved in bioenergy planning within Thailand’s Eastern Economic Corridor (EEC) to prioritize key criteria and assign weights for community-scale biomass power plants (CSBPPs), enhances the robustness, credibility, and contextual relevance of the weights assigned to the evaluation criteria. By embedding the decision model into an automated ModelBuilder framework, the proposed method significantly enhances the processing speed and scalability, making it suitable for high-resolution spatial analysis (100-m grid) and large-scale applications. The proposed framework was applied in Thailand’s Eastern Economic Corridor (EEC), a newly developed industrial zone, as a case study.

2. Materials and Methods

2.1. Study Area

This study used Thailand’s Eastern Economic Corridor (EEC) region as the study area. The EEC region is a newly developed industrial zone that promotes innovation-driven and value-based industries. It covers three provinces along Thailand’s eastern seaboard: Chachoengsao, Chonburi, and Rayong [19]. As shown in Figure 1a (image adapted from the ArcGIS Pro output [18]), the study area spans approximately 1.334 Mha and is located between 12°20′ and 14°10′ N latitude and 100°50′ and 102°00′ E longitude. Figure 1b presents the major land-use type in the EEC region based on data from Land Development Department (LDD) in 2019/2020 [20].

2.2. Modeling Tool and Platform Enhancement

2.2.1. Geospatial Dataset, Visual Programming, and Automated Geospatial-Based MCDM–AHP Modeling

Geographic Information Systems (GIS) and a visual programming approach were used to develop an automated geospatial-based Multi-Criteria Decision-Making (MCDM) model integrating the Analytic Hierarchy Process (AHP). ArcGIS ModelBuilder was applied to design batch-processing workflows, which were compiled into Python (version 3.9) scripts for flexible implementation and reproducibility.
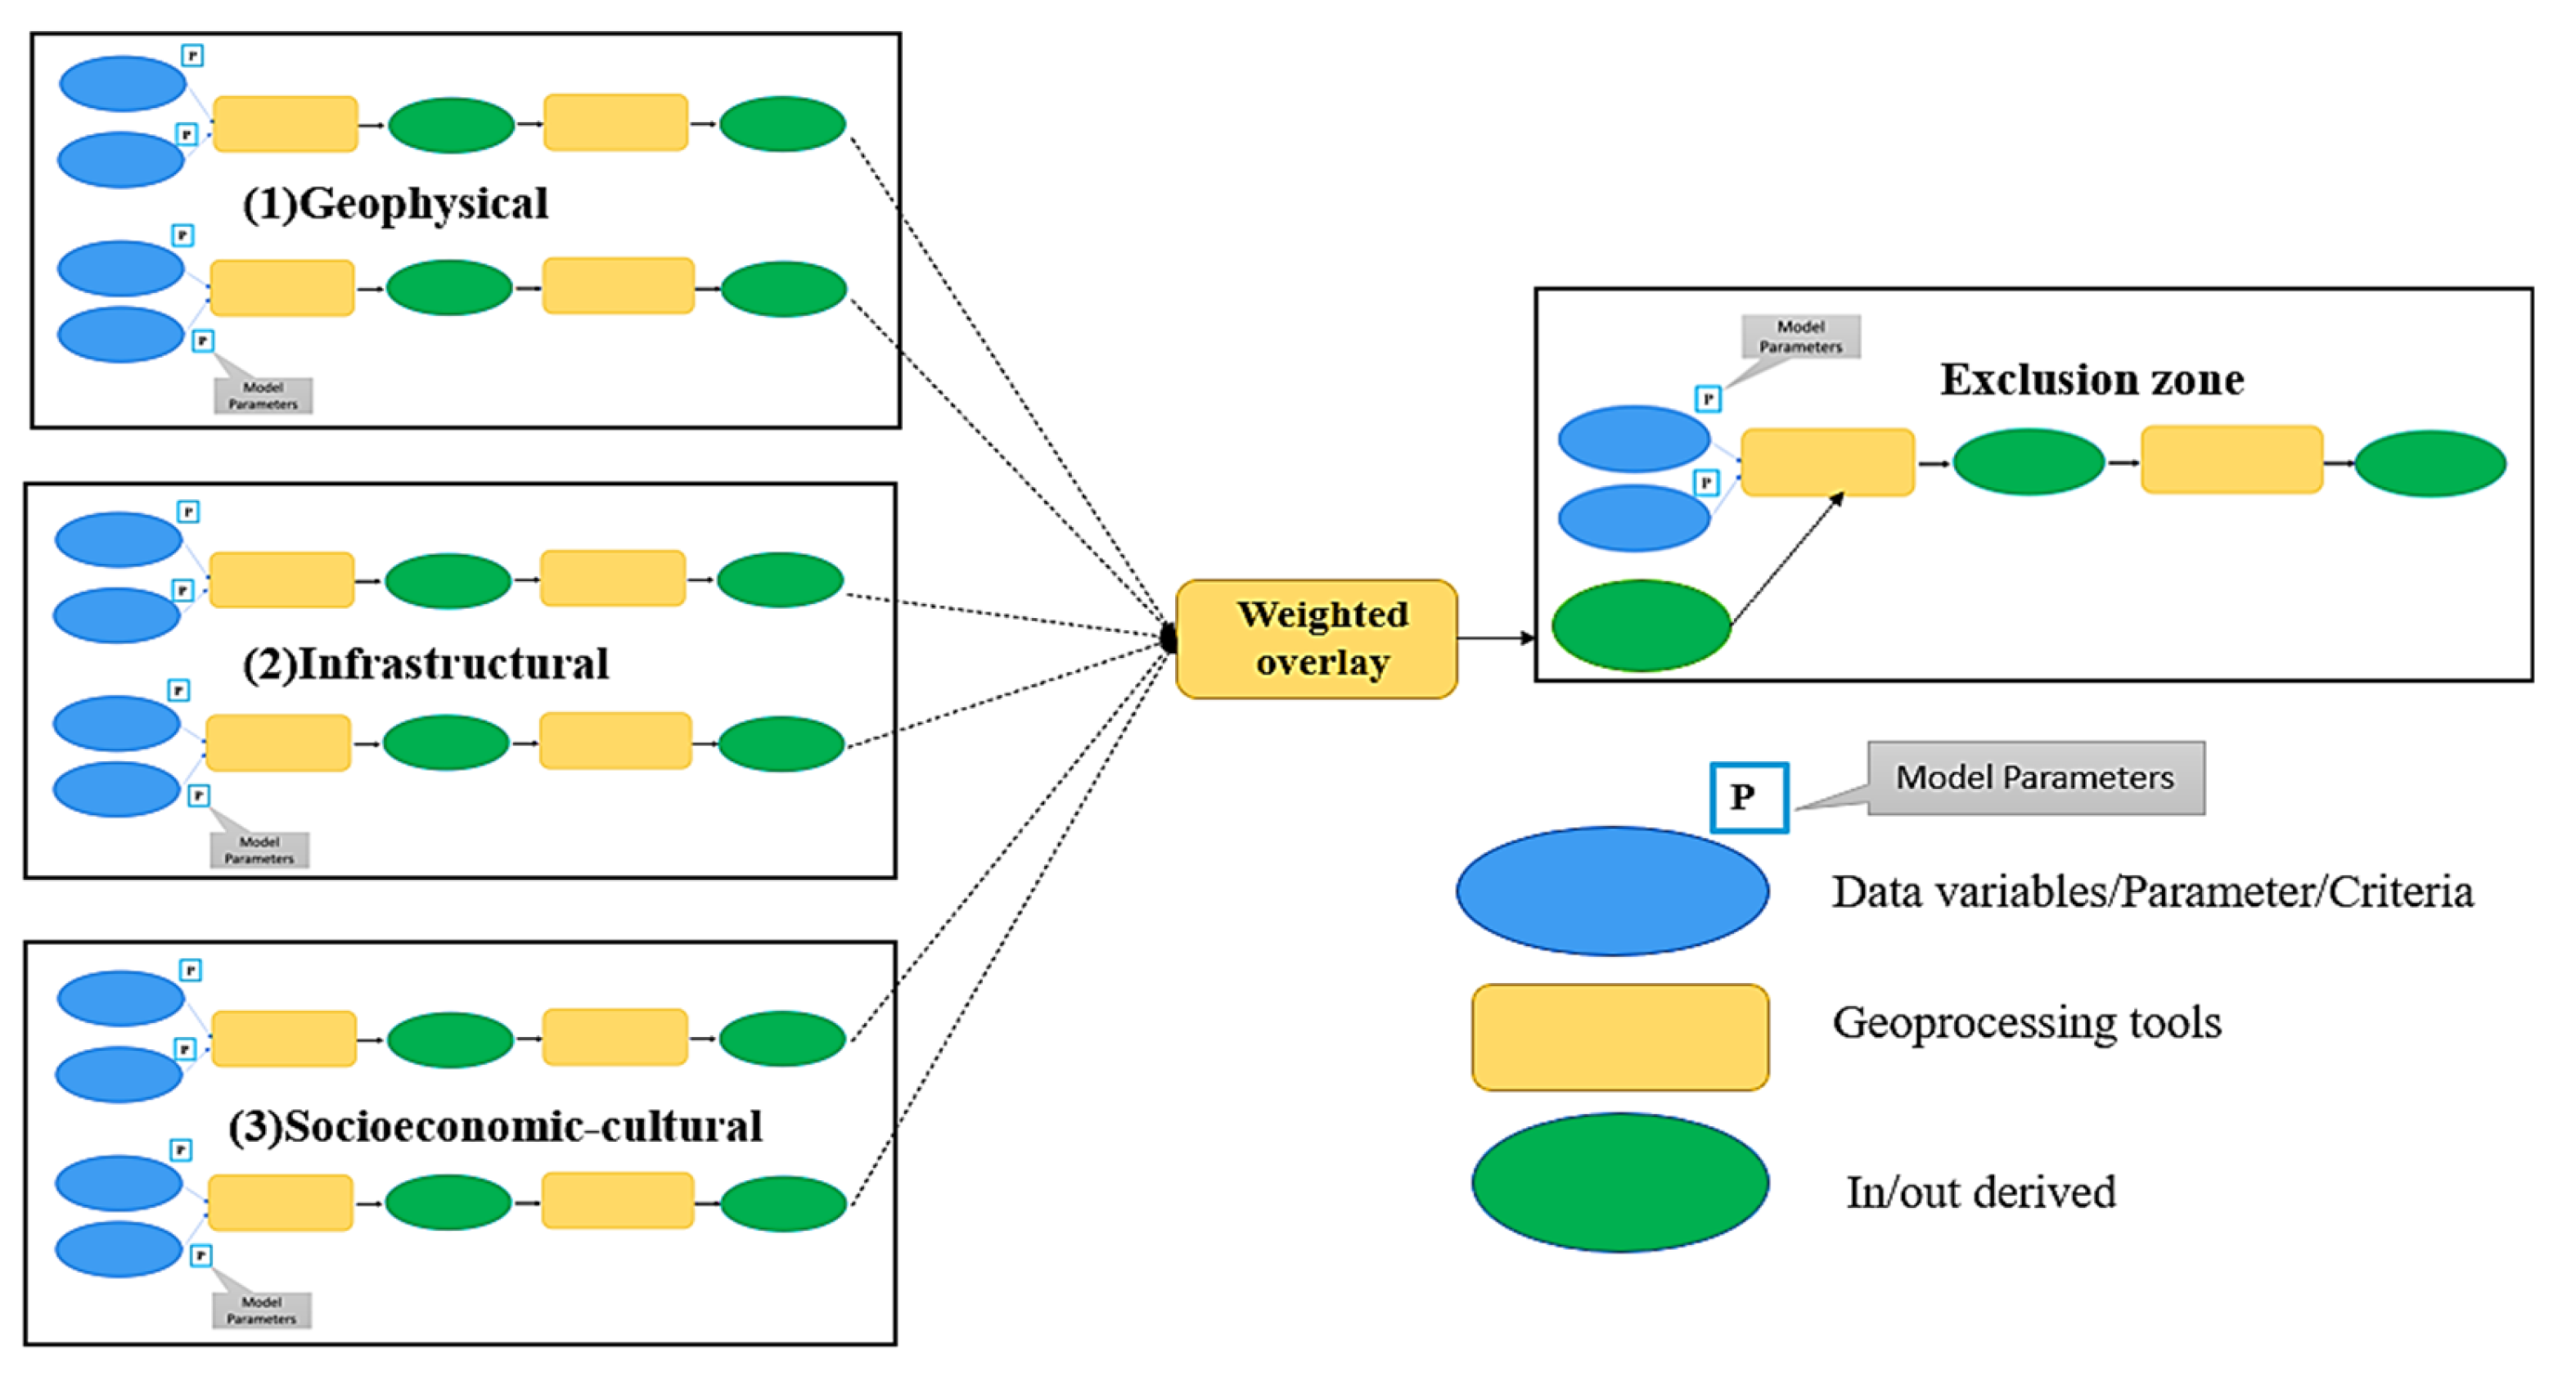
The framework, adapted from Boonman et al. (2025) [21] and illustrated in Figure 2, comprises: (1) spatial dataset development, (2) criteria selection and weighting, and (3) automated MCDM–AHP modeling via ModelBuilder and custom ArcGIS Pro toolboxes [22]. Spatial data—points, lines, polygons, and statistical records—were selected according to the defined criteria.
All criteria and sub-criteria were converted from vector to 100 m raster grids to enable uniform spatial analysis. While this standardization supports consistent computation, it may introduce minor data loss or aggregation bias. The model assessed land suitability, prioritized criteria, and estimated crop residue potential using 2019–2020 land-use data for Thailand’s Eastern Economic Corridor (EEC) from the Land Development Department (LDD, 2020) [20], combined with crop-specific residue-to-product ratio (RPR) values. The RPR, defined as the weight of residues remaining after harvest or agro-processing relative to the main crop product (e.g., husk and straw from rice), was used to quantify biomass availability [23].

2.2.2. Criteria Determination and Priority Weights

The study explored the critical factors for selecting suitable area for community-scale biomass power plants. An extensive literature review (2010–2025) covering bioenergy supply chains, sustainability assessment frameworks, and the AHP methodology revealed that relevant criteria generally fall into five broad dimensions: geographical features, technical and infrastructure support, sustainability principles, socioeconomic and social equity, and environmental concerns [14]. Then, a refined list of potential criteria and sub-criteria was selected based on commonly used factors in bioenergy supply chain planning and biomass power plant siting, as well as specific considerations relevant to this study such as criteria for sustainable community-scale biomass power plants and the Eastern Special Development Zone Act B.E. 2561 (2018) in Thailand. Ultimately, thirteen sub-criteria were identified across three main dimensions, geographical, infrastructural, and socioeconomic–cultural, to form a robust framework for site selection. In addition, exclusion zones were identified by six sub-criteria to exclude areas designated as protected or otherwise unsuitable for development.
An AHP-based questionnaire was developed based on these identified criteria and sub-criteria. A diverse panel of fifteen experts from identified stakeholders was selected to rank the relative importance through pairwise comparisons and assign weights scores accordingly. These stakeholders represent various sectors of the bioenergy supply chain, including policy makers, biomass power plant developers, academic researchers, community representatives, and government officials. This multidisciplinary panel ensured a comprehensive and balanced perspective. The questionnaire was sent via email to individual expert and the completed questionnaire was also returned by email. The information obtained from the fifteen experts was analyzed using the AHP matrix to achieve the final weight score. The fundamental scale proposed by Saaty (1980) [24] that was tested for logical consistency using the consistency index (CI) and consistency ratio (CR) [25] was applied.
The study followed ethical research practices to protect the participants’ rights and ensure responsible data collection:
(1)
Confidentiality and anonymity were guaranteed and communicated to all participants.
(2)
There was minimal risk to the participants, as involvement was limited to completing an online questionnaire.
(3)
Clear communication of the study’s purpose and scope was included in the questionnaire.

2.3. Evaluation Criteria, Data Types, and Data Sources

The thirteen evaluation criteria, along with their corresponding data types and sources, are summarized in Table 1.
  • Geographical criteria
The geographical suitability of a CSBPP site was assessed based on five prioritized sub-criteria. Biomass feedstock potential was identified as the most critical factor since a reliable and sustainable fuel supply is essential for continuous power generation. The availability of water resources ranked next in importance, given its necessity for various operational processes within biomass power plants. The remaining three sub-criteria focused on strategic land-use alignment: proximity to agricultural promotion zones and industrial development zones, both of which align with existing land-use policies and may offer logistical and economic synergies [22,26,27]. Lastly, land slope suitability was evaluated to ensure ease of construction and reduce potential development costs [28]. Together, these geographical criteria significantly influence the long-term feasibility, operational efficiency, and environmental compatibility of proposed CSBPP sites.
  • Infrastructural criteria
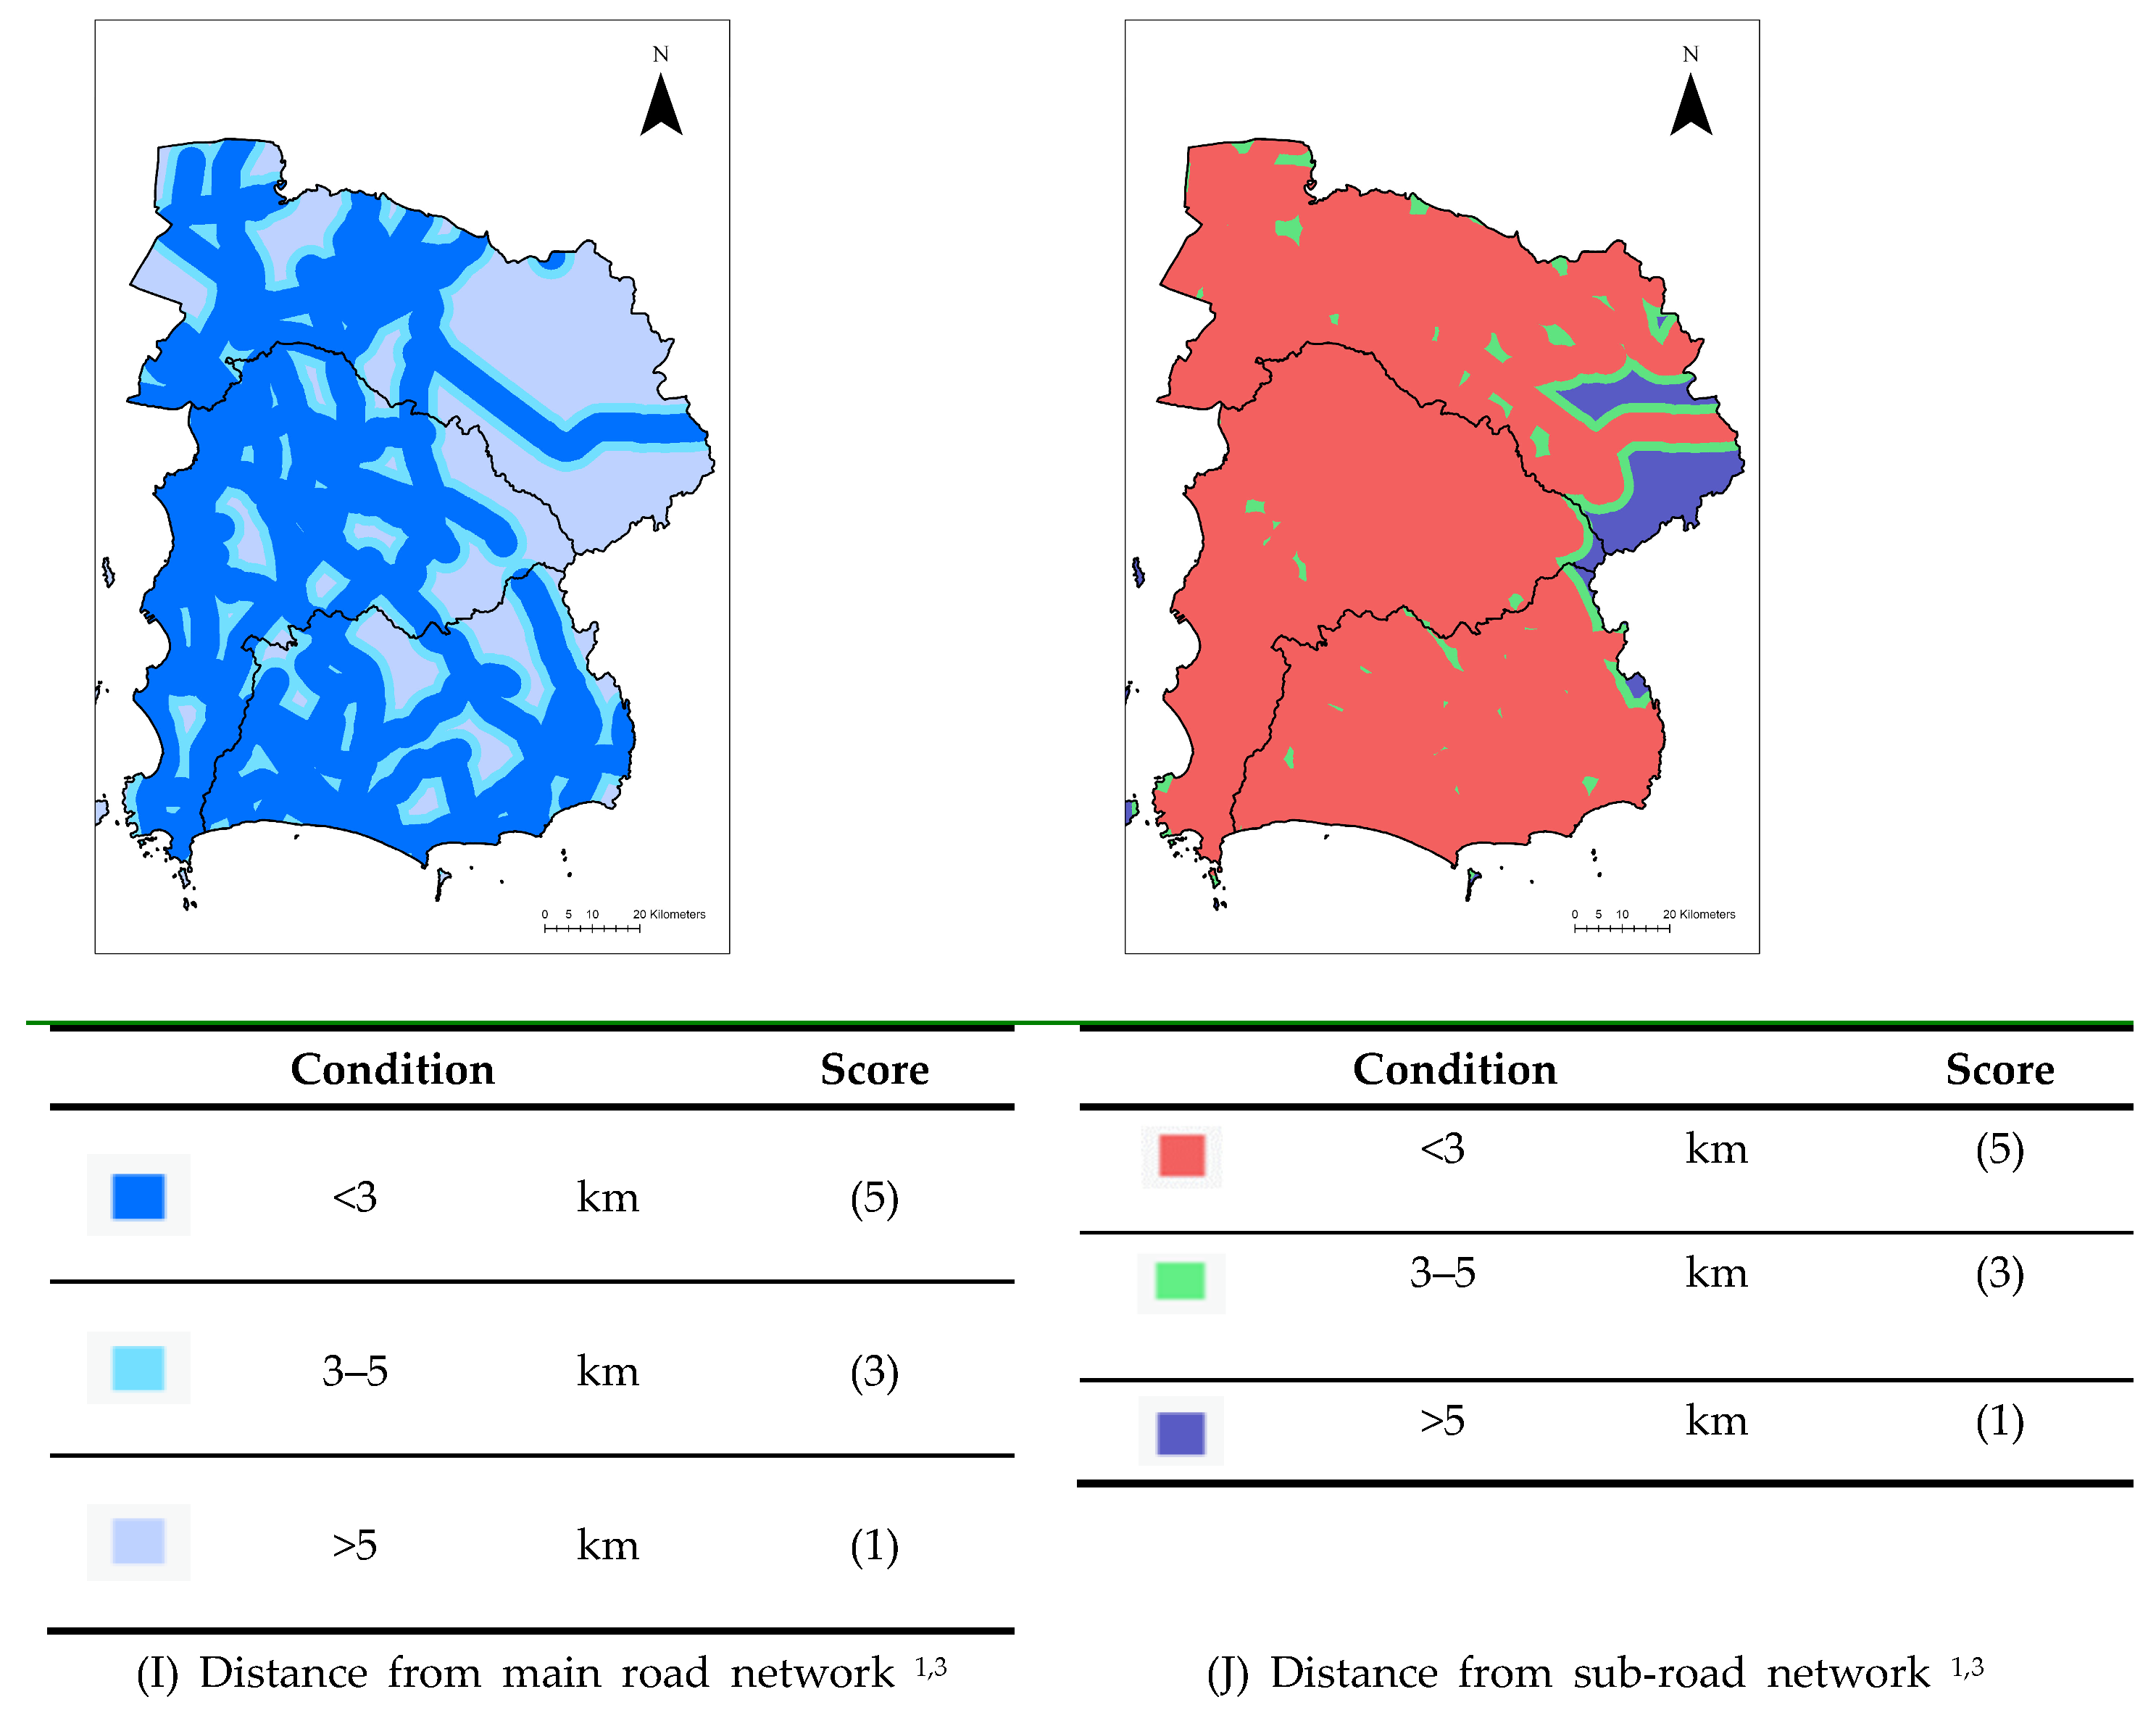
Infrastructure suitability for new CSBPPs was evaluated based on four prioritized sub-criteria, with the aim of optimizing project viability and minimizing the associated costs. First and foremost, proximity to existing or planned electrical infrastructure, particularly 22 kV transmission/distribution lines and power substations [29], is critical to reduce grid connection expenses, including the cost of equipment and transmission line construction. Secondly, the capacity and spatial distribution of existing and projected Very Small Power Plants (VSPPs) utilizing biomass within the EEC call for careful consideration to ascertain the remaining feedstock potential and prevent competition for biomass resources. Thirdly, the accessibility of primary and secondary road networks is a significant factor influencing the transportation costs associated with supplying biomass feedstock to the CSBPPs [26]. Collectively, these infrastructural criteria influence both the economic feasibility and operational efficiency of potential CSBPP sites.
  • Socioeconomic–cultural criteria
Socioeconomic impacts are frequently identified in the literature as key evaluation criteria in the development of renewable energy systems, including biomass, wind, and solar power projects [11]. In line with this, the present study incorporated three sub-criteria grounded in socioeconomic and cultural factors. The assessment of potential land for rural community development within the EEC region was guided by the future land-use planning framework established by the DPT [26] and the EECO [30]. In addition, the spatial proximity of the proposed power plant locations to critical community facilities such as schools and hospitals was carefully considered due to potential environmental and social concerns. Another key sub-criterion was local community participation and public acceptance, which are essential for the long-term success and social sustainability of community-based energy projects [10]. This aspect was operationalized by analyzing the distance from nearby communities, serving as a proxy indicator for the potential to establish collaborative partnerships, such as local biomass feedstock supply arrangements and community co-ownership of the CSBPP project.
  • Exclusion zone criteria
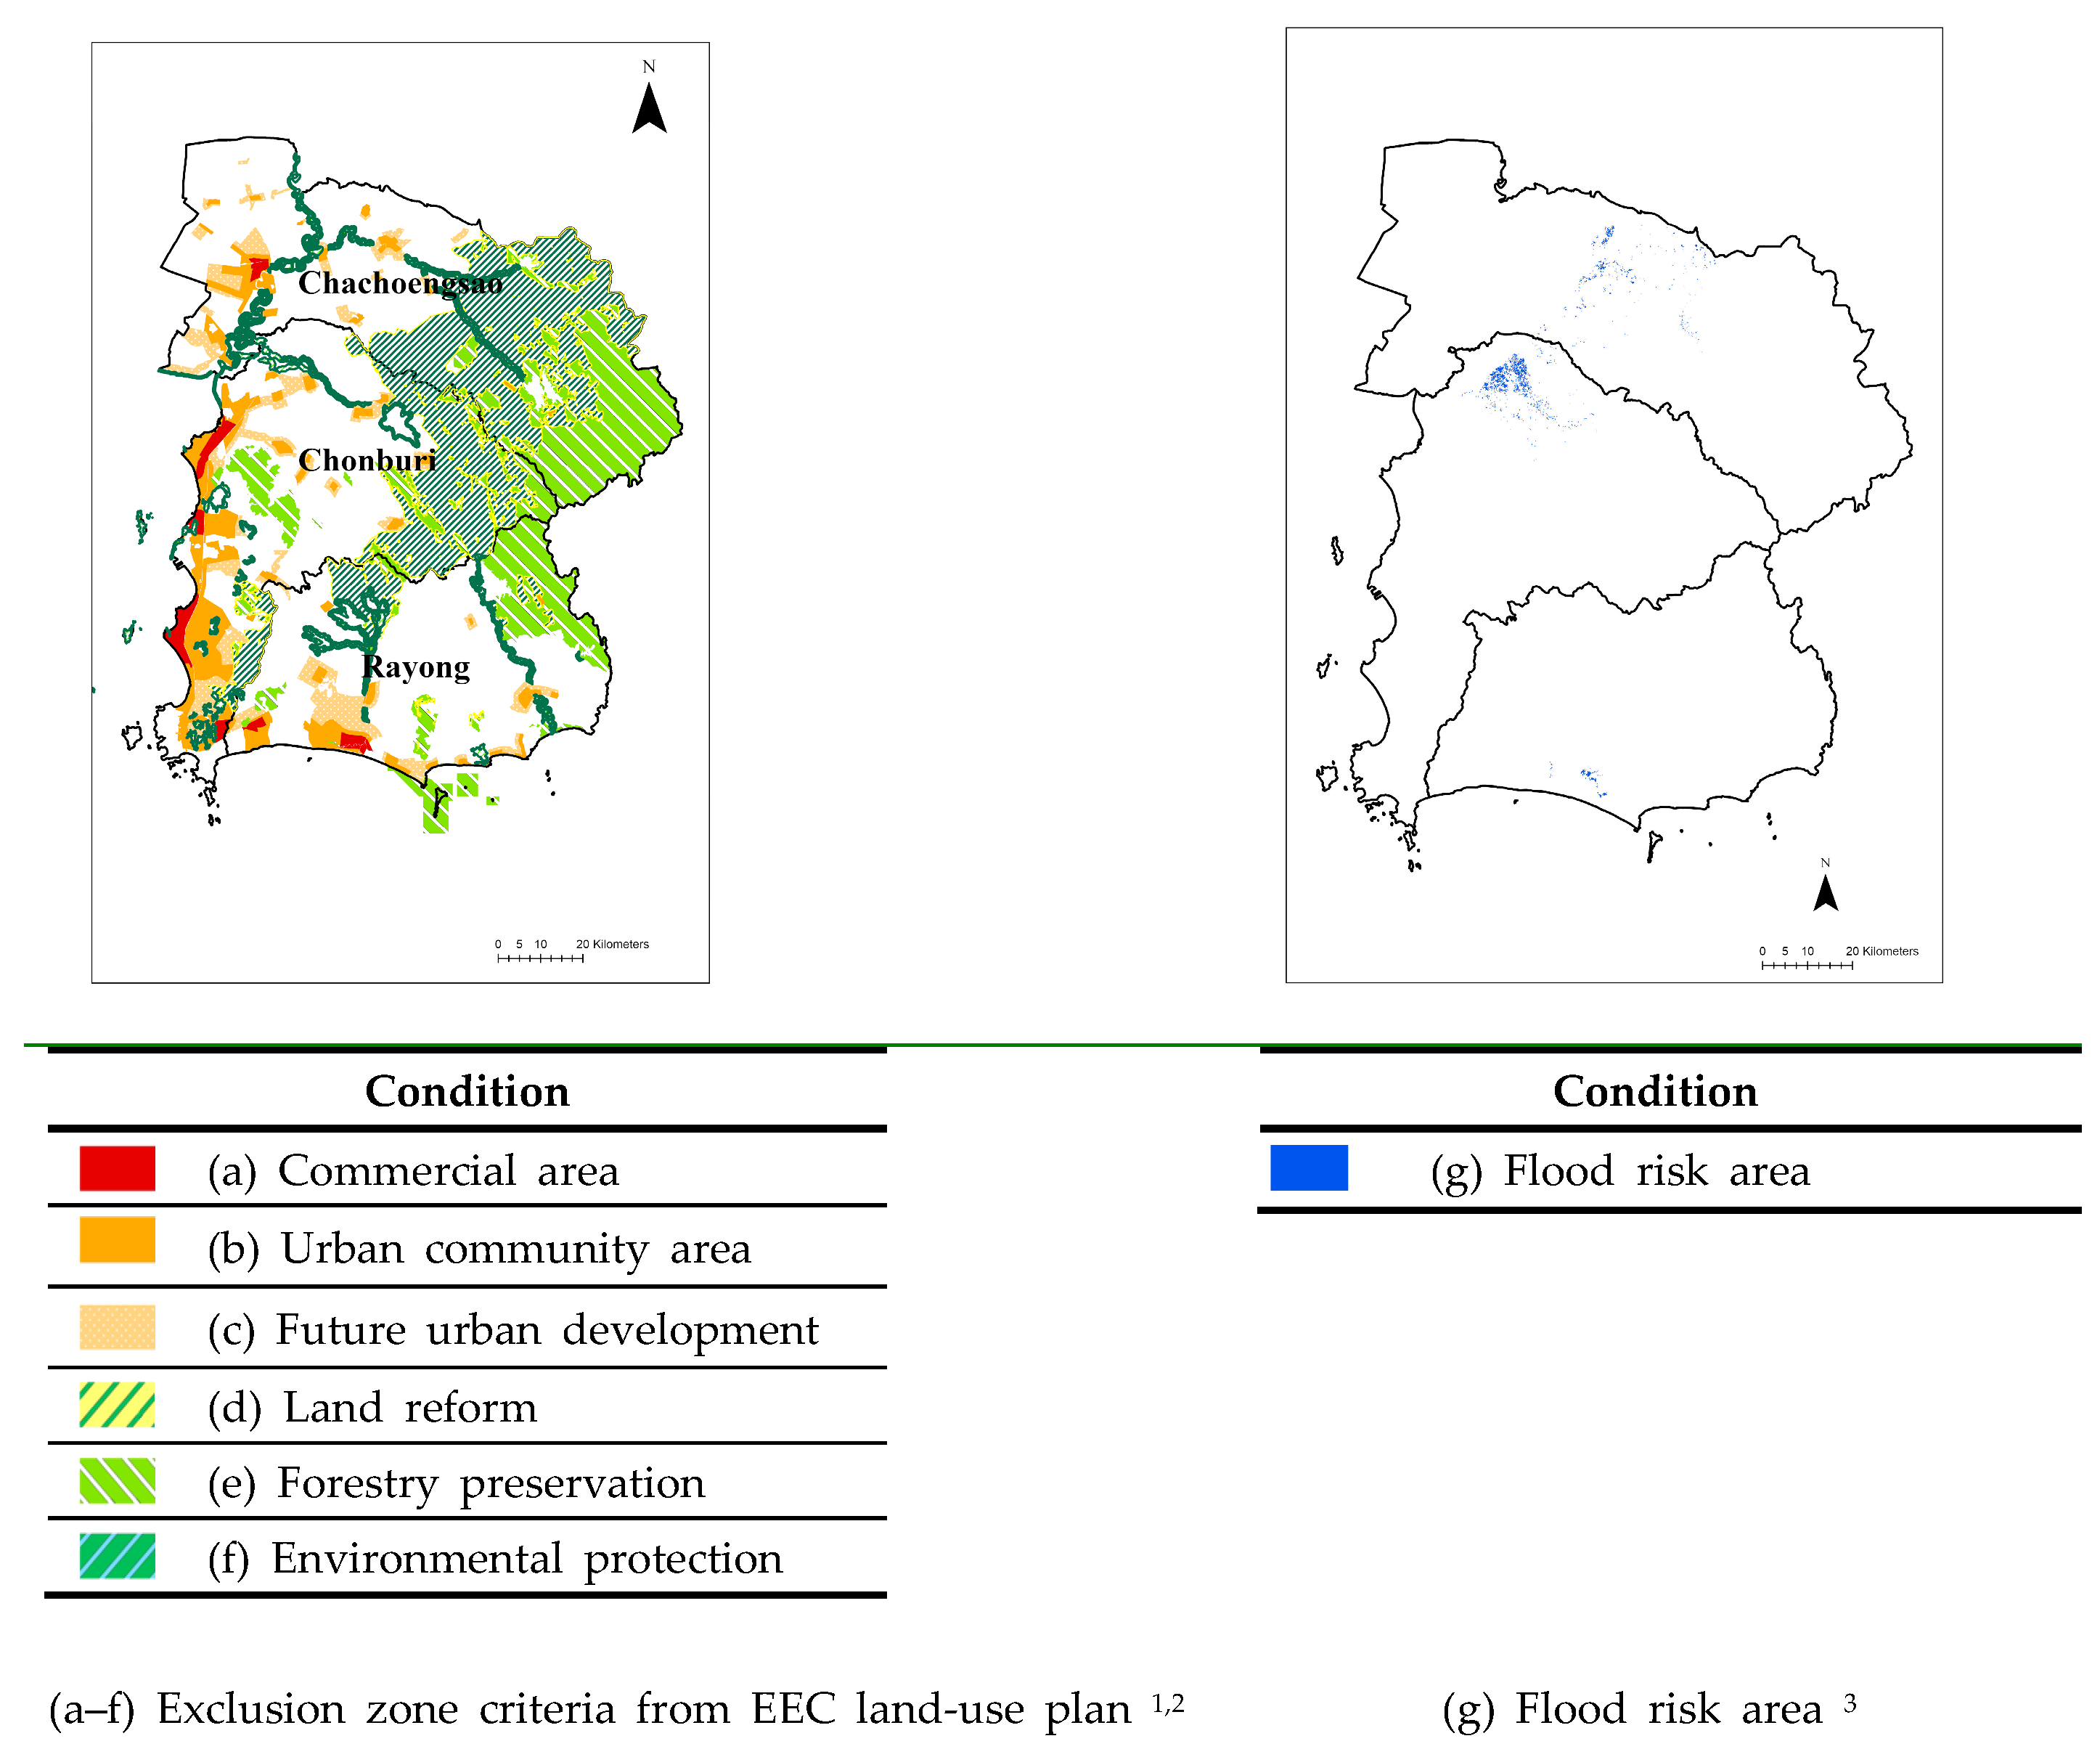
Exclusion zones refer to areas deemed unsuitable for the development of community-scale biomass power plants (CSBPPs) due to land-use restrictions or potential environmental and social impacts. These include commercial and urban community areas, areas designated for future urban development, land reform zones, forest preservation areas, environmentally protected areas, and flood risk areas. For this study, densely populated urban areas—particularly along the eastern coastal areas, forest areas, and high-flood-risk areas—were excluded [31].
Table 1. Criteria used, and data types and sources.
Main CriteriaSub-CriteriaData FormatSourcesYear
1. GeographicalBiomass feedstock potentialPolygon2 LDD/4 OAE2019/2020
Waterbody3 DPT/1 EECO2019
Agricultural promotion zone3 DPT/1 EECO20-year land-use plan (2018–2037)
Industrial development zone3 DPT/1 EECO
Slope data5 DEM2019
2. InfrastructuralTransmission/distribution of power linesLine1 DPT/6 PEA2020
Power substationPoint3 DPT/1 EECO2019/2020
Existing biomass VSPPs3 DPT/1 EECO2019/2020
Main road networkLine1 DPT/1 EECO2019
Sub-road network1 DPT/1 EECO2019
3. Socioeconomic–culturalPotential land for rural community developmentPolygon1 DPT/1 EECO20-year land-use plan (2018–2037)
Important locations (hospitals and schools)Point2 LDD2019
Local community participation and public acceptance3 DPT/1 EECO2019/2020
4. Exclusion zoneCommercial and urban community areaPolygon3 DPT/2 EECO20-year land-use plan (2018–2037)
Future urban development3 DPT/1 EECO
Environmental protection3 DPT/1 EECO
Land reform3 DPT/1 EECO
Forest preservation3 DPT/1 EECO
Flood risk area7 GISTDA2020
1 EECO: The Eastern Economic Corridor Office of Thailand [30]; 2 LDD: Land Development Department [20]; 3 DPT: Department of Public Works and Town & Country Planning (20-year land-use plan) [26]; 4 OAE: Office of Agricultural Economics [27]; 5 DEM: Digital Elevation Model from NASA’s Earth Science Data Systems (ESDS) [28]; 6 PEA: Provincial Electricity Authority [29]; 7 GISTDA: Geo-Informatics and Space Technology Development Agency (public organization) [31].

2.4. Biomass Resource Potential Assessment

The assessment of available crop residues for energy production focused on residues from five major economic crops for the EEC region: rice, cassava, sugarcane, para rubber, and oil palm. The potential of annual crop residues was assessed using several key parameters such as plantation area, crop productivity (measured in tons per hectare, ton/ha), the residue-to-product ratio (RPR) coefficient, and the fraction of residues that remain unused. Data on plantation area were derived from a GIS-based land-use database with a 100-m resolution for the 2019/2020 period, which was provided by the Land Development Department (LDD) [20]. Crop productivity data were obtained from official reports and previous academic studies, e.g., Cheewaphongphan et al. (2018) [32] and DEDEc (2020) [33]. The analysis considered crop residues from harvesting areas and agro-processing facilities located within a 20 km radius from the crop harvesting sites. Based on a comprehensive review of established practices in biomass supply chain logistics and technoeconomic analyses for similar bioenergy projects, a 20 km radius is widely considered an economically viable distance for collecting agricultural residues to minimize transportation costs and ensure a consistent and sustainable feedstock supply for a local processing facility [34]. The theoretical potential use and the remaining potential of annual crop residues (dry matter) as energy feedstock was calculated using Equations (1) and (2), respectively [32,35].
Theoretical   potential   ( tonnes )   = ( C A i × C P i × R P R i , j )
Remaining   potential   ( tonnes ) = Theoretical   potential   ( tonnes )   ×   100 % M C i , j × Unused fraction   ( % )
where
  • CAi is the plantation area of crop i in hectares (ha);
  • CPi is the productivity of crop i , measured in tonnes per hectare (tonnes/ha);
  • RPRi,j is the residue to product ratio of crop type i and crop residue type j (i or j = 1, 2, …, n );
  • MCi,j (%) is the moisture content for crop residue type i , j ;
  • Unused fraction (%) is the percentage of biomass not currently diverted to other energy or agricultural uses.

2.5. Setup of the Geospatial Dataset Structure and Modeling Tool Preparation

The land suitability model was developed using data from thirteen sub-criteria, each of which was transformed into a gridded (raster) format, allowing each pixel to be spatially linked to a specific geographic location. The geospatial database was then reclassified into a format compatible with raster grid cells using ModelBuilder coding tools available within the Spatial Analyst extension of ArcGIS Pro software [36].
Figure 3 presents the conceptual framework of the model. The key components of the ModelBuilder tools include geoprocessing tools, variables, connectors, and exclusion zone, all designed to automate and document the spatial analysis and data management procedures. Within the ModelBuilder environment, users can create, visualize, and refine geoprocessing models through diagrammatic workflows. These diagrams illustrate the sequential linkages between processes and geoprocessing tools, where the output of one operation serves as the input for the next.

2.6. Criterion Weight Assessment Using the AHP Technique

In the AHP-based decision-making process, the consistency ratio (CR) plays a critical role in evaluating the reliability of expert judgments during site selection. The value of the consistency ratio (CR) is derived from the relationship between the Consistency Index (CI) and the Random Index (RI), as defined in Equations (3) and (4). According to AHP methodology, acceptable levels of consistency are indicated by CR values less than 0.10 (or 10%). When the CR exceeds this threshold, it suggests a significant degree of inconsistency in the pairwise comparisons, which may compromise the validity of the results [24,25]. In such cases, the judgments must be reviewed and adjusted to ensure consistency before proceeding with the analysis.
C R = C I / R I
C I = λ m a x n n 1
Here, λ m a x is the maximum eigenvalue, and n is the matrix size (n × n). The average value of CI for random matrices using the predefined values by Saaty (1980) [24] is the Random Index (RI). The predefined RI value for this study was 1.56, and the values for matrix sizes of the thirteen elements are shown in Table 2.

2.7. Determining the Relative Score Range of the Land Suitability Map

Land suitability analysis was conducted using the ArcGIS Pro platform through ModelBuilder tools, applying either the Weighted Overlay or Raster Calculator to generate a composite suitability map. The procedure followed the following key steps:
(a)
An evaluation scale was applied to the raster input cell values, allowing for arithmetic operations across layers with differing initial scales. The default values of each raster cell were adjusted based on their relative suitability or importance for the criteria being analyzed.
(b)
Weights were assigned to each raster input that reflect the relative importance of each sub-criterion. The total combined weight of all raster layers was constrained to equal 100%. Specifically, the thirteen sub-criteria used in the model were each assigned a weight ranging from 10 to 100, in accordance with their influence on suitability. Land suitability was categorized using scores of 0, 1, 3, and 5, which indicated that the land was unsuitable, marginally suitable, moderately suitable, and highly suitable, respectively. These classifications were derived from statistically significant clusters following the FAO guidelines (1976) [37]. This approach allowed for a quantitative determination of relative suitability score ranges beyond the qualitative limitations of the FAO 1976 framework. The individual land suitability characteristics—such as slope, distance from power lines, main sub-road network feedstock potential, and grid proximity—were standardized using fuzzy membership functions to establish a continuous suitability scale. The relative importance of these criteria was objectively weighted using the Analytic Hierarchy Process (AHP), refined through expert input, and validated using initial sensitivity analysis. A weighted linear combination within a GIS environment then generated a continuous land suitability index from which final suitability classes (e.g., highly, moderately, and marginally suitable, and not suitable) were derived using Natural Breaks (Jenks) as one of optimization methods, providing a robust, data-driven, and spatially differentiated assessment for the EEC study area [36].
(c)
The Weighted Overlay tool was then employed to compute the final suitability map. Each cell value in the raster input was multiplied by its corresponding weight (as shown in Table 2). The results were then aggregated across all layers, producing a weighted rank-sum output, which was calculated using
S = i = 1 n w i x i
where S is the total suitability score, w i is the weight of the selected site suitability factor (i), and x i is the assigned criterion score of the suitability class (i).

3. Results and Discussion

3.1. Crop Residue Potential in the EEC Region

The analysis revealed that the five economic crops grown in the EEC region during 2019–2020 (sugarcane, oil palm, rice (primary and secondary crops), cassava, and para rubber) produced substantial amounts of residues each year. As shown in Table 3, the total crop residues generated from these five crops were estimated to be 7209 kt/year (dry matter) in 2019/2020. Sugarcane produced the highest amount of residues, accounting for nearly one-third of the total, with an estimated 5335 kt/year, including both cane tops, leaves, and bagasse. Cassava ranked second in crop production at 1580 kt/year. However, its low residue-to-product ratio, resulting from the trunk and rhizome, led to a modest generation of only 276 kt/year of crop residues. Rice cultivation in the EEC region occurs in two cycles, generating residues (rice husk and rice straw) totaling 1202 kt/year. Oil palm contributed 298 kt of residues from palm trunks, fronds, leaves, fiber, and shells, while para rubber produced a smaller quantity of residues at 67 kt/year, consisting of tree roots, twigs, leaves, and rubber wood chips.
The quantity of residue generated indicates a significant potential for using this biomass as fuel in CSBPPs within the EEC region. However, some residues are already being utilized for various energy and non-energy purposes, making it essential to estimate the actual biomass potential for CSBPPs. Table 3 also summarizes the remaining potential of crop residues for energy production, which only reflects the unused fraction. Crop residues that are available at agro-processing plants such as sugarcane bagasse or rice husks are fully utilized, while crop residues remaining at the plantation areas such as sugarcane tops and leaves and rice straw are less preferred due to the cost of collection and transportation. The total remaining residue potential from the five economic crops was 2403 kt/year, representing about one-third of the theoretical generation potential. Among these, sugarcane tops and leaves contribute the largest share, with an estimated 1767 kt/year available. Other significant contributors included rice straw from both the first and second crops (276 kt/year), and oil palm residues including trunks and fronds (203 kt/year). In total, the available residues were estimated to generate 34,156 TJ. The spatial distribution of these remaining crop residues (tons/ha) is illustrated in Figure 4 and serves as a critical input for the land suitability model for CSBPPs.

3.2. Estimation of Criteria Weights with GIS-Based MCDM and AHP Framework

The use of responses from 15 experts in the AHP was justified by the method’s emphasis on the quality and consistency of judgment rather than the sample size. The reliability of the pairwise comparisons was ensured by maintaining the consistency ratio (CR) below the accepted threshold of 0.10. Moreover, the expert panel’s diverse composition, including policymakers, developers, academics, and government officials, helped capture a wide range of perspectives across the bioenergy supply chain. Given this diversity, expanding the sample size would likely give limited additional insights.
Table 4 presents the weights for the 13 sub-criteria, along with the standard deviations (S.D.), which were expressed as percentages to indicate the level of variation. The top three sub-criteria—biomass resources/feedstock potential (18.49%, ±8.8%), waterbody (18.19%, ±7.8%), and local community participation and public acceptance (17.59%, ±8.9%)—showed slightly higher variability, reflecting their critical importance in decision-making, yet remained within ±9%, indicating strong agreement. The remaining sub-criteria had standard deviations ranging from ±0.8% to ±4.4%, reflecting high consistency. Overall, the narrow distribution of standard deviations across all the sub-criteria confirmed that a sample of 15 well-selected experts was sufficient to produce statistically robust and policy-relevant AHP results with acceptable uncertainty margins.

3.3. Land Suitability Map

The database of thirteen sub-criteria was converted into thematic raster maps using advanced spatial analysis techniques in ArcGIS Pro software. Each sub-criterion was classified into one of four suitability levels (highly suitable, moderately suitable, marginally suitable, and unsuitable), along with designated exclusion zones. The resulting classified raster maps are illustrated in Figure 5, Figure 6, Figure 7 and Figure 8. Certain ranges of sub-criteria data were arbitrarily classified for each score based on characteristics of the EEC region, which was supported by
(1)
Literature data on optimal biomass collection radians for similar-scale bioenergy projects, balancing feedstock accessibility with transportation costs [27,33,34].
(2)
A preliminary spatial analysis of the study area’s agricultural residue distribution, identifying natural breaks algorithm based on geospatial analysis tools and clustering patterns in residue availability [22,23,26,27,33].
(3)
Practical considerations related to the local infrastructure and logistical feasibility for collection and transport for EEC regions [20,26].
Figure 5. Geographical criteria (1 OAE: Office of Agricultural Economics [27]; 2 LDD: Land Development Department [20]; 3 EECO: The Eastern Economic Corridor Office of Thailand [30]; 4 DPT: Department of Public Works and Town & Country Planning (20-year land-use plan) [26]; 5 DEM: Digital Elevation Model from NASA’s Earth Science Data Systems (ESDS) Program [28].
Energies 18 04469 g005
Figure 6. Infrastructural criteria; 1 DPT: Department of Public Works and Town & Country Planning (20-year land-use plan) [26]; 2 PEA: Provincial Electricity Authority [29]; 3 EECO: The Eastern Economic Corridor Office of Thailand [30].
Energies 18 04469 g006aEnergies 18 04469 g006b
Figure 7. Socioeconomic–cultural criteria; 1 EECO: The Eastern Economic Corridor Office of Thailand [30]; 2 DPT: Department of Public Works and Town & Country Planning (20-year land-use plan) [26]; 3 LDD: Land Development Department [20].
Energies 18 04469 g007
Figure 8. Exclusion zone criteria; 1 EECO: The Eastern Economic Corridor Office of Thailand [30]; 2 DPT: Department of Public Works and Town & Country Planning (20-year land-use plan) [26]; 3 GISTDA: Geo-Informatics and Space Technology Development Agency (public organization) [31].
Energies 18 04469 g008
An automated workflow within ArcGIS Pro software was used to perform land suitability analysis via a weighted rank-sum overlay, which was implemented using ModelBuilder tools. This process integrated the spatial classification of the thirteen sub-criteria along with the exclusion zone constraints. The resulting land suitability map (Figure 9), generated at a 1 km × 1 km resolution, facilitated the identification of suitable areas at the district (Amphoe) level. This map visually categorizes land into four suitability classes: highly suitable (dark green), moderately suitable (light green), marginally suitable (yellow), and unsuitable (red), with exclusion zones shown as uncolored areas. The analysis revealed that, out of the 1.334 Mha of Eastern Economic Corridor (EEC) area, 19.63% (0.262 Mha) was classified as highly suitable, 3.21% (0.043 Mha) as moderately suitable, and 44.01% (0.587 Mha) as marginally suitable; 14.91% (0.199 Mha) was deemed unsuitable, while exclusion zones accounted for 18.24% (0.243 Mha). As illustrated in Figure 9, highly suitable areas were distributed in several grided boundary zones (at the district level), which include
  • Chachoengsao province, including the grided boundary zone of (a) Bang Nam Priao, (b) Mueang, (c) Phanom Sarakham, and (d) Ban Pho;
  • Chonburi province, including the grided boundary zone of (e) Si Racha;
  • Rayong province, including the grided boundary zone of (f) Mueang Rayong and (g) Klaeng.
Figure 9. Land suitability map for the EEC region. Chachoengsao province: (a) Bang Nam Priao, (b) Mueang, (c) Phanom Sarakham, and (d) Ban Pho; Chonburi province: (e) Si Racha; Rayong province: (f) Mueang Rayong and (g) Klaeng.
Energies 18 04469 g009
The study found that within the highly suitable areas for CSBPPs in the EEC, the key crop residues are prioritized as rice straw, followed by sugarcane tops and leaves, and para rubber roots. To ensure the validity of the model, the resulting land suitability map was externally validated with the independent datasets and constraints, such as the distance of the new power plant in a highly suitable area from existing biomass VSPPs, and determining the correlation between crop residue availability and production potential.
The typical capacity of CSBPPs is 6–10 MWe, which is a balance between energy efficiency and the efficiency of biomass collection (hence the biomass cost). Biomass supply by the local community is preferred. Direct combustion—steam turbine technology is proposed for CSBPPs due to its proven technological record worldwide (as compared to gasification or other advanced technologies) and fuel flexibility.
Using the proposed model framework, the prototypical GIS-MCDM-AHP-integrated automated ModelBuilder model can be adapted to assess CSBPP site suitability in other regions of Thailand and around the world. The flexibility and adaptability of the developed model stem from its modular design and the use of widely applicable geospatial techniques. The model was built upon parameters that can be readily adjusted to reflect varying regional characteristics, such as crop yields, residue-to-product ratios, transportation costs, and available infrastructure. The model source code can be modified to interface with different GIS databases or other data formats. However, the criteria and sub-criteria may require adjustments to reflect the specific local conditions and community contexts.

4. Conclusions

The ModelBuilder tool within ArcGIS Pro was effectively employed to integrate Geographic Information Systems (GIS), Multi-Criteria Decision-Making (MCDM), and the Analytic Hierarchy Process (AHP) into a unified geoprocessing framework for evaluating site suitability for future community-scale biomass power plants. A conceptual model was developed and applied in a case study of Thailand’s Eastern Economic Corridor (EEC) region, where thirteen sub-criteria covering geographical, infrastructural, and socioeconomic–cultural dimensions along with exclusion zones were identified, prioritized, and weighted by fifteen experts representing diverse stakeholder groups. The automated ModelBuilder workflow successfully generated a land suitability map, revealing that approximately 20% of the total EEC area was highly suitable for CSBPP development. The proposed GIS-MCDM-AHP framework, supported by a flexible and adaptable codebase, can be applied to other regions in Thailand and around the world. The model can be modified to interface with different GIS datasets or other data formats. However, the criteria and sub-criteria may require adjustments to reflect the local conditions and community contexts. This study not only presents a robust geospatial decision-support model, but also contributes to policy-relevant, sustainable energy planning.
Since the biomass supply data used in the current study was limited to a static database, future methodological improvements could integrate dynamic feedstock availability analysis, which could consider seasonal crop production cycles, projections of land-use changes aligned with the EEC’s 20-year development plan, and qualitative assessments of climate change impacts on crop yields. Such analyses will require the development of a predictive model to forecast feedstock availability and quality fluctuations based on historical and real-time satellite data on crop yields and weather patterns. More comprehensive sensitivity analysis of the input data should also be carried out.

Author Contributions

Conceptualization, A.B., S.F. and A.J.; data curation, A.B.; methodology, A.B. and S.F.; validation, S.F. and A.J.; investigation, A.B.; software, A.B.; supervision, S.F. and A.J.; writing—original draft preparation, A.B. and S.F.; writing—review and editing, S.F. and A.J. All authors have read and agreed to the published version of the manuscript.

Funding

This research was funded by the Petchra Pra Jom Klao PhD Research Scholarship and JGSEE PhD student research grant from King Mongkut’s University of Technology Thonburi (KMUTT) for Athipthep Boonman.

Data Availability Statement

The original contributions presented in the study are included in the article. Further inquiries can be directed to the corresponding author.

Acknowledgments

The authors thank Jompob Waewsak and Kanchit Ngamsanroaj for their comments and guidance on the methodology and analysis.

Conflicts of Interest

The authors declare no conflicts of interest.

References

  1. Musolino, M.; Maggio, G.; D’Aleo, E.; Nicita, A. Three case studies to explore relevant features of emerging renewable energy communities in Italy. Renew. Energy 2023, 210, 540–555. [Google Scholar] [CrossRef]
  2. DEDEa (Department of Alternative Energy Development and Efficiency). The Alternative Energy Development Plan (AEDP 2018–2037). 2018. Available online: https://policy.asiapacificenergy.org/sites/default/files/Alternative%20Energy%20Development%20Plan%202018-2037%20%28AEDP%202018%29%28TH%29.pdf (accessed on 14 February 2023).
  3. EPPO (Energy Policy and Planning office). Thailand’s Power Development Plan (PDP) 2018–2037 (Revision 1). 2020. Available online: https://www.eppo.go.th/images/Infromation_service/public_relations/PDP2018/PDP2018Rev1.pdf (accessed on 20 February 2020).
  4. ERC (Energy Regulatory Commission and Office of the Energy Regulatory Commission). Community Power Plant (Pilot Project 150 MW). 2021. Available online: https://www.erc.or.th/th/power-purchasing3/2711 (accessed on 16 February 2023).
  5. Petrillo, A.; Salomon, V.A.P.; Tramarico, C.L. State-of-the-Art Review on the Analytic Hierarchy Process with Benefits, Opportunities, Costs, and Risks. J. Risk Financ. Manag. 2023, 16, 372. [Google Scholar] [CrossRef]
  6. Elkadeem, M.R.; Younes, A.; Sharshir, S.W.; Campana, P.E.; Wang, S. Sustainable siting and design optimization of hybrid renewable energy system: A geospatial multi-criteria analysis. Appl. Energy 2021, 295, 117071. [Google Scholar] [CrossRef]
  7. Budak, G.; Chen, X.; Celik, S.; Ozturk, B. A systematic approach for assessment of renewable energy using analytic hierarchy process. Energy Sustain. Soc. 2019, 9, 37. [Google Scholar] [CrossRef]
  8. Çolak, Z. A hybrid MCDM method for enhancing site selection for wind power plants in Turkey. Energy Sustain. Dev. 2024, 82, 101536. [Google Scholar] [CrossRef]
  9. Ghosh, S.; Chakraborty, T.; Saha, S.; Majumder, M.; Pal, M. Development of the location suitability index for wave energy production by ANN and MCDM techniques. Renew. Sustain. Energy Rev. 2016, 59, 1017–1028. [Google Scholar] [CrossRef]
  10. Agliata, R.; Busato, F.; Presciutti, A. MCDM-Based Analysis of Site Suitability for Renewable Energy Community Projects in the Gargano District. Sustainability 2025, 17, 6376. [Google Scholar] [CrossRef]
  11. Effatpanah, S.K.; Ahmadi, M.H.; Aungkulanon, P.; Maleki, A.; Sadeghzadeh, M.; Sharifpur, M. Comparative Analysis of Five Widely-Used Multi-Criteria Decision-Making Methods to Evaluate Clean Energy Technologies: A Case Study. Sustainability 2022, 14, 1403. [Google Scholar] [CrossRef]
  12. Natarajan, K.; Latva-Käyrä, P.; Zyadin, A.; Pelkonen, P. New methodological approach for biomass resource assessment in India using GIS application and land use/land cover (LULC) maps. Renew. Sustain. Energy Rev. 2016, 63, 256–268. [Google Scholar] [CrossRef]
  13. Bharti, A.; Paritosh, K.; Mandla, V.R.; Chawade, A.; Vivekanand, V. GIS Application for the Estimation of Bioenergy Potential from Agriculture Residues: An Overview. Energies 2021, 14, 898. [Google Scholar] [CrossRef]
  14. Sahoo, S.K.; Pamucar, D.; Goswami, S.S. A Review of Multi-Criteria Decision-Making Applications to Solve Energy Management Problems from 2010-2025: Current State and Future Research. Spectr. Decis. Mak. Appl. 2025, 2, 219–241. [Google Scholar] [CrossRef]
  15. Ali, S.; Taweekun, J.; Techato, K.; Waewsak, J.; Gyawali, S. GIS based site suitability assessment for wind and solar farms in Songkhla, Thailand. Renew. Energy 2019, 132, 1360–1372. [Google Scholar] [CrossRef]
  16. Waewsak, J.; Ali, S.; Gagnon, Y. Site suitability assessment of para rubberwood-based power plant in the southernmost provinces of Thailand based on a multi-criteria decision-making analysis. Biomass Bioenergy 2020, 137, 105545. [Google Scholar] [CrossRef]
  17. Sekeroglu, A. Site selection for biomass-solar hybrid renewable energy facilities: Spatial modelling based on fuzzy logic-geographic information systems. Renew. Energy 2024, 237, 121775. [Google Scholar] [CrossRef]
  18. ESRI (Environmental Systems Research Institute). ArcGIS Pro Software, license 3.0.2; ESRI: Redlands, CA, USA, 2020.
  19. BOI (Thailand Board of Investment), Thailand’s Eastern Economic Corridor (EEC). The Special Economic Zone (SEZ) for the Future of ASEAN. 2016. Available online: https://www.boi.go.th/en/Policy_EEC (accessed on 2 February 2020).
  20. LDD (Land Development Department). Land Use (GIS Databased) in the Year 2019/2020; Ministry of Agriculture and Cooperatives: Bangkok, Thailand, 2020. Available online: https://dinonline.ldd.go.th/Login.aspx?service=3 (accessed on 20 February 2020).
  21. Boonman, A.; Fukuda, S.; Tiwari, S.; Kraxner, F. Two-Phase Approach for Designing Sustainable Biomass Supply Chains for Community-Scale Biomass Power Plants in Thailand. Energies 2025, 18, 520. [Google Scholar] [CrossRef]
  22. ESRI (Environmental Systems Research Institute). Geoprocessing (Model Builder); ESRI: Redlands, CA, USA, 2020. [Google Scholar]
  23. DEDEb (Department of Alternative Energy Development and Efficiency). Biomass Potential Database System in Thailand. 2014. Available online: https://gis.dede.go.th/module/map/index.aspx (accessed on 25 February 2020).
  24. Saaty, T.L. Textbook of the Analytic Hierarchy Process, Planning, Priority Setting, Resources Allocation; McGraw-Hill: New York, NY, USA, 1980; pp. 271–278. [Google Scholar]
  25. Saaty, T.L. Decision-making with the AHP: Why is the principal eigenvector necessary. Eur. J. Oper. Res. 2003, 145, 85–91. [Google Scholar] [CrossRef]
  26. DPT (Department of Public Works and Town & Country Planning). GIS Data in Land Use Plan (2037) Data for The Eastern Economic Corridor (EEC) 20-Year; The Eastern Economic Corridor Office of Thailand (EECO): Bangkok, Thailand, 2020. [Google Scholar]
  27. OAE (Office of Agricultural Economics). Agricultural Statistics of Thailand Fiscal Year 2019/2020; Ministry of Agriculture and Cooperatives: Bangkok, Thailand, 2019. Available online: https://oae.go.th/home/article/393 (accessed on 20 February 2023).
  28. DEM. Digital Elevation Model from NASA’s Earth Science Data Systems (ESDS) Program. Available online: https://www.earthdata.nasa.gov/esds (accessed on 18 February 2023).
  29. PEA (Provincial Electricity Authority). Transmission Lines and Distribution Power Lines (115 kV/22kV) in Digital File for The Eastern Economic Corridor (EEC); Ministry of Interior: Bangkok, Thailand, 2022.
  30. EECO (Eastern Economic Corridor Office of Thailand). Agriculture and Cooperatives. Overall Land Use Plan. 2020. Available online: https://eeco.or.th/th/overall-land-use-plan (accessed on 15 May 2021).
  31. GISTDA (Geo-Informatics and Space Technology Development Agency (Public Organization). Flood Risk Area. 2020. Available online: https://disaster.gistda.or.th/flood (accessed on 15 May 2021).
  32. Cheewaphongphan, P.; Junpen, A.; Kamnoet, O.; Garivait, S. Study on the Potential of Rice Straws as a Supplementary Fuel in Very Small Power Plants in Thailand. Energies 2018, 11, 270. [Google Scholar] [CrossRef]
  33. DEDEc (Department of Alternative Energy Development and Efficiency); ESCAP (The United Nations Economic and Social Commission for Asia and the Pacific). Pilot Training on Power and Heat Generation from Biomass Under the Project “Building Capacity of ASEAN Countries in Biomass Energy Development through Local Capacity Development”. In Handbook for Pilot Training; Department of Alternative Energy Development and Efficiency: Bangkok, Thailand, 2020; pp. 2–16. [Google Scholar]
  34. Sugathapala, A.G.T. Feasibility of Small Scale Biomass Power Plants in Sri Lanka. Prepared for Biomass Energy 2022 Project United Nations Development Programme (UNDP). 2020. Available online: https://www.undp.org/sites/g/files/zskgke326/files/migration/lk/Feasibility-of-BM-Power-Plants.pdf (accessed on 15 February 2023).
  35. Hytönen, J.; Kaakkurivaara, N.; Kaakkurivaara, T.; Nurmi, J. Biomass Equations for Rubber Tree (Hevea Brasiliensis) Components in Southern Thailand. J. Trop. For. Sci. 2018, 30, 588–596. [Google Scholar] [CrossRef]
  36. ESRI (Environmental Systems Research Institute). Reclassify Method in ArcGIS Pro Software; ESRI: Redlands, CA, USA, 2020. [Google Scholar]
  37. FAO (Food and Agriculture Organization of the United Nations). A Framework for Land Evaluation. Soils Bulletin No. 32; FAO: Rome, Italy, 1976. [Google Scholar]
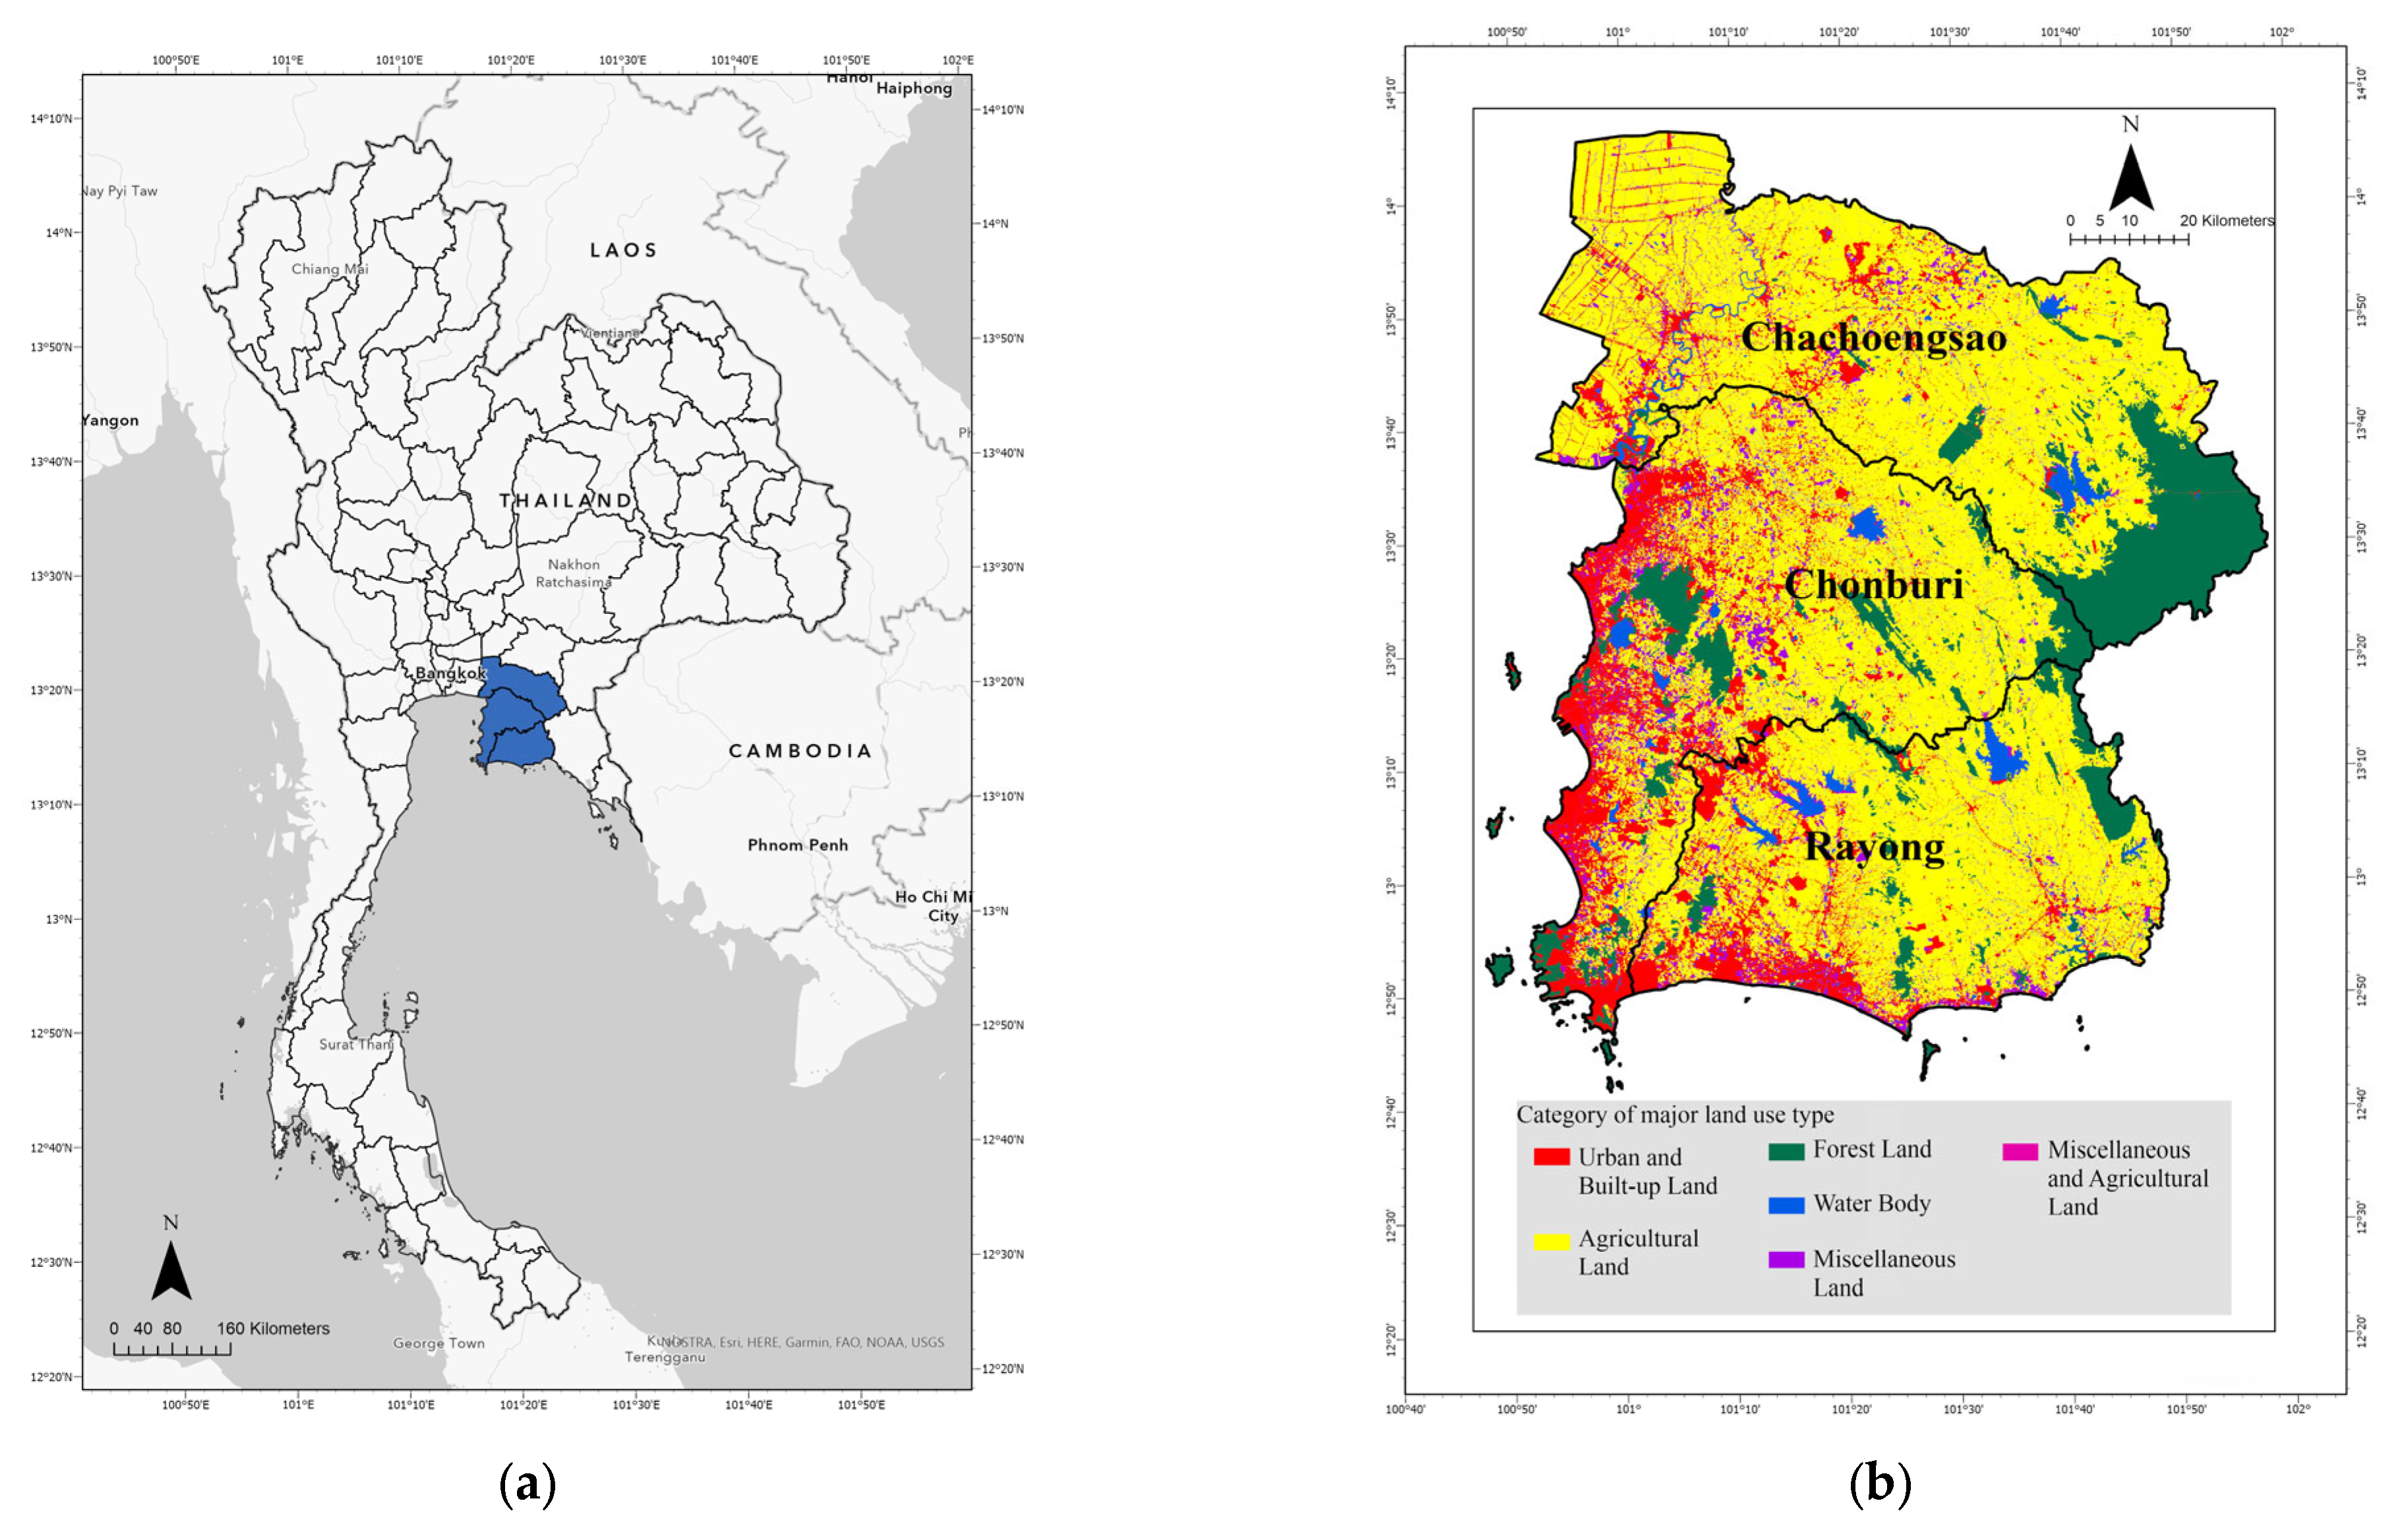
Figure 1. Thailand’s Eastern Economic Corridor (EEC). (a) Geographical area information. (b) Major land-use type based on data from 2019/2020.
Energies 18 04469 g001
Figure 2. Land suitability optimization model for CSBPPs.
Energies 18 04469 g002
Figure 3. Conceptual framework of model using GIS ModelBuilder tools within ArcGIS Pro software (version 3.0.2).
Energies 18 04469 g003
Figure 4. Remaining potential of crop residues from five economic crops in EEC region.
Energies 18 04469 g004
Table 2. Predefined random index values for matrix sizes of elements 1–13.
η 12345678910111213
RI0.000.000.580.901.121.241.321.411.451.491.521.541.56
Source: adapted from Saaty (2003) [25] and Ali et al. (2019) [15].
Table 3. Theoretical biomass potential, remaining potential, and energy potential in 2019/2020 in EEC region.
CropTotal Crop Production (kt) 1Residues
Type 1
Residue-to-Product Ratio (RPR) 2Moisture Content (%) 2Crop Residues
Generated
(kt, Dry Matter) 2
Unused Fraction (%) 2Crop Residues Remaining
(kt, Dry Matter) 2
Lower Heating Value or LHV (MJ/kg) 3Available
Energy
Potential
(TJ) 3
Sugarcane17,090Tops and leaves0.1929.20298659.2176715.4827,360
Bagasse0.27950.732349007.370
Palm432Palm trunk1.00048.4022389.92007.541511
Palm empty fruit bunch0.20058.6031007.240
Palm fronds and leaves0.19978.001915.931.765
Palm fiber0.13138.50350011.400
Palm shell0.05612.00210016.900
First-crop rice412Rice straw1.25610.0046627.712912.331591
Rice husk0.26210.00970013.520
Second-crop rice468Rice straw1.25610.0052927.714712.331808
Rice husk0.26210.001100013.520
Cassava1580Cassava trunk0.33359.40214469815.591532
Cassava rhizome0.09659.406255.8355.49190
Para rubber103Rubber tree root0.56940.003568.8246.57159
Rubber tree twig0.17755.008006.570
Rubber tree leaves0.08355.004006.570
Rubberwood chips/wings0.44055.0020006.570
Gross crop residue potential 7209 2403 34,156
1 Total crop production in the EEC area data sources: annual crop production or annual primary production (ton) and yield (ton/ha) from OAE, 2019/2020 [27]; spatial land-use information from LDD, 2020 [20]). 2 Total potential crop residues (remaining) available for energy production (in 2019/2020) [20,27] calculated based on the following parameters: crop production, residue-to-product ratio (RPR) (-), the unused fraction of residues (%), and moisture content (%) from DEDEb, 2014 [23]; Cheewaphongphan et al., 2018 [32]; and DEDEc, 2020 [33]. 3 Available energy potential = Amount of biomass residue available (dry weight) × LHV × conversion factor; Conversion factor MJ × 11,700,000 kWh × (efficiency 20%)/(42,120,000 MJ × 24 h/day × 330 day/year) [33,36].
Table 4. Priority rank (preference) scores and importance weights of criteria obtained using AHP method.
Main CriteriaSub-CriteriaWeight
Priorities
Criteria Weight (%)Priority Rank (Preference)Standard
Deviation
(S.D) (σ)
GeographicalBiomass resources/feedstock potential0.184918.491±8.8%
Waterbody0.181918.192±7.8%
Agricultural promotion zone0.05125.126±2.9%
Industrial development0.05095.097±2.7%
Slope0.02252.2512±1.1%
InfrastructuralDistribution of power lines0.104110.414±4.4%
Power substation0.04324.328±2.0%
Existing biomass for VSPPs0.03663.669±1.8%
Main road network0.02992.9911±1.4%
Sub-road network0.01611.6113±0.8%
Socioeconomic–culturalPotential land for rural community development0.03193.1910±1.4%
Important places (hospitals and schools)0.07087.085±3.7%
Local community participation and public acceptance0.175917.593±8.9%
Total1100(1–13)-
Disclaimer/Publisher’s Note: The statements, opinions and data contained in all publications are solely those of the individual author(s) and contributor(s) and not of MDPI and/or the editor(s). MDPI and/or the editor(s) disclaim responsibility for any injury to people or property resulting from any ideas, methods, instructions or products referred to in the content.