Article

Influence of Inlet Temperature Differentials on Aerothermal Characteristics and Mass Flow Distribution in Multi-Inlet and Multi-Outlet Corotating-Disc Cavities

Department of Energy and Power Engineering, Tsinghua University, Beijing 100084, China
*
Author to whom correspondence should be addressed.
Energies 2025, 18(17), 4472; https://doi.org/10.3390/en18174472
Submission received: 16 July 2025 / Revised: 14 August 2025 / Accepted: 19 August 2025 / Published: 22 August 2025
(This article belongs to the Section J1: Heat and Mass Transfer)

Abstract

To facilitate the development of next-generation gas turbine cooling systems, the present study systematically investigates the influence of inlet temperature differentials on the aerothermal characteristics and mass flow distribution within multi-inlet, multi-outlet corotating-disc cavities, for which inlet temperature differentials of 10 K, 30 K, and 50 K were applied. Steady-state Reynolds-averaged Navier–Stokes (RANS) simulations using the Shear Stress Transport (SST) k-ω model were performed across a range of flow conditions corresponding to Rossby numbers from 0.01 to 0.10, by varying the rotational and axial Reynolds numbers. This study finds that the inlet temperature differentials are a secondary driver of the aerothermal characteristics in the corotating cavity. Meanwhile, Rossby number dictates the main flow structure of radially stratified vortices and governs the thermal mixing between hot and cold streams. A higher Rossby number enhances mixing, causing the radial outlet temperature to rise significantly, while the axial outlet remains cool. A larger inlet temperature differential can induce secondary vortices at high Rossby numbers. Furthermore, the differential is revealed to increase cavity pressure, slightly reducing the radial outlet’s mass flow by up to 2.5% and its discharge coefficient by nearly 5% at high Rossby numbers. These insights allow engine designers to develop more precise and optimized cooling strategies.

1. Introduction

A critical aspect of advancing modern gas turbine design lies in the, which is essential for cooling and ensuring the durability of high-temperature turbine components. The secondary air system (SAS) comprises a complex network of seals, orifices, and rotating cavities, which dictates the distribution of cooling air. At the heart of this network are corotating-disc cavities with multiple inlets and outlets, which are pivotal in directing airflow to precise locations. Traditionally, the design of these systems has relied on simplified assumptions, often treating the inflow as having a uniform temperature. However, in reality, the air entering these cavities can originate from different stages of the compressor, leading to temperature variations at different inlets. The introduction of non-uniform inlet temperatures can potentially alter the internal flow structure and pressure distribution, which in turn influence the mass flow distribution among the various outlets. A thorough understanding of these thermally driven flow characteristics is a critical necessity for the next generation of more efficient and reliable gas turbines. By investigating the influence of inlet temperature differentials, engine designers can move beyond conservative design margins and develop more precise and optimized cooling strategies, ultimately enhancing overall engine performance and component longevity.
The modern understanding of fluid dynamics within corotating-disc cavities has been progressively developed through decades of theoretical, experimental, and numerical research. The groundwork for this field was laid by early theoretical models, such as that proposed by Hide [1], which conceptualized the cavity as being composed of discrete source, sink, and core regions delineated by Ekman boundary layers.
Expanding on these principles, Owen et al. [2] successfully applied momentum-integral methods to derive analytical solutions for the linear and nonlinear Ekman layer equations. This approach enabled them to characterize the flow structure under radial outflow conditions, with predictions that showed strong correspondence to experimental data. These analytical frameworks were later substantiated by pioneering numerical studies. For instance, the work of Chew et al. [3] offered crucial validation for these established models in simple radial outflow cavities. Their 2D axisymmetric Navier–Stokes simulations demonstrated excellent agreement with the experimental flow visualizations conducted by Owen and Pincombe [4]. In a subsequent refinement, Chew and Rogers [5] enhanced Owen’s momentum-integral methods by incorporating energy integral equations, a significant development that made it possible to predict temperature distributions and account for localized variations in fluid density.
Building on these foundations, recent research has focused on studying the flow within single-inlet and outlet corotating-disc cavities to refine their use in SAS design. Shen et al. [6] investigated the strong coupling between pressure and temperature in high-speed cavities using validated RANS simulations and developed analytical coupled prediction model to compute radial swirl ratio profiles within cavities with radial inflow and radial outflow configurations. Addressing a specific condition arising from the use of de-swirl nozzles, Xu et al. [7] conducted a numerical investigation of the flow structure under a negative effective inlet swirl ratio, establishing a theoretical model to predict pressure drop and identifying a critical swirl ratio threshold that separates distinct flow patterns. Focusing on another key design parameter, Zhang et al. [8] quantified the windage torque within a compressor disc cavity, which is a crucial factor in windage-induced temperature rise. They employed a novel static testing technique and numerical methods to establish how the torque coefficient varies with the rotational Reynolds number and mass flow rate, providing essential data for the thermal design of high-pressure compressor cavities.
While these studies provided cavity flow insights, real-world applications often involve non-uniform heating and cooling, necessitating a deeper investigation into complex thermal boundary conditions within corotating cavities. A key focus of this research has been focused on effects on cavity flow due to temperature gradients within corotating cavities. Farthing et al. [9] demonstrated through experimental flow visualization that when a shrouded cavity is heated, revealing a buoyancy-driven structure characterized by a “radial arm” of cool air that penetrates the cavity. Conversely, the thermal conditions can be inverted, where the inflow is hotter than the corotating discs. Pernak et al. [10] discovered that similar buoyancy still drives a vortical flow structure fundamentally similar to the conventional heated-shroud case with the hot and cold plume directions reversed. Zhao et al. [11] studied the combined effects of radial and axial heating on corotating cavities with RANS simulations, finding that the resulting axial temperature gradient alters the internal flow and temperature fields, especially at lower Rossby numbers where the flow is most sensitive to the thermal boundaries. Wang et al. [12] used large eddy simulations to study the effects of radial wall temperature gradients within closed rotating cavities, inducing a highly turbulent but isothermal core. Meanwhile, Fazeli et al. [13] showed that the flow’s sensitivity to thermal effects is not uniform, being rotation-dominated at high radii but highly sensitive to thermal effects at low radii, particularly for low Rossby numbers. While these works explored effects of cavity temperature gradient on internal flow, these are cavities with the upper cavity enclosed, which can give rise to buoyancy-induced flows and are not subjected to superimposed flows.
The selection of an appropriate turbulence model is crucial for accurately simulating the complex flow within rotating cavities. Early investigations by Morse [14] using a low-Reynolds-number k-ϵ model successfully predicted source–sink flow structures but struggled to resolve turbulent Ekman layers during radial outflow. Conversely, recent studies have demonstrated the utility of specific k-ϵ variants; for instance, Guo et al. [15] selected Re-Normalization Group (RNG) k-ε model for their analysis of a twin-web turbine disc cavity after it showed strong agreement with experimental validation data. Subsequent comparative studies, such as the work by Kumar et al. [16] evaluated the Spalart–Allmaras (SA), k-ϵ, and Reynolds Stress (RSM) models. Their findings favoured the RSM, noting that the other models produced excessive turbulent diffusion in the cavity’s core region. More recently, Xu et al. [7] demonstrated the superior predictive accuracy of the SST k-ω model over both RSM and k-ϵ formulations. This was attributed to the model’s hybrid nature, which combines the near-wall precision of the k-ω approach with the robustness of the k-ϵ model in free-stream regions, allowing for better resolution of steep gradients and swirling vortices. Lee et al. [17] also found the SST k-ω model to be the most effective for predicting SAS internal rotating flows, noting that while wall-modelled large eddy simulation (WMLES) offers better prediction of instantaneous jet spreading, its time-averaged results are not significantly different from RANS-based models. The reliability of the SST k-ω model is further supported by Onori et al. [18], whose large eddy simulation (LES) results showed strong agreement with both SST k-ω predictions and experimental data.
The analysis of existing research reveals a gap in the understanding of flow within complex corotating-disc cavities. While these foundational studies provide insight into source–sink flows, their reliance on single-inlet, single-outlet configurations cannot capture the complex jet interactions and flow stratification that occur in the multi-inlet, multi-outlet cavities found in modern engines. Furthermore, studies that have explored thermal gradients often do so in enclosed cavities, where buoyancy is the primary driver. This overlooks the superimposed through-flow conditions that are more representative of actual secondary air systems, a knowledge gap this study aims to fill. By examining how inlet temperature differentials can affect a corotating-disc cavity with multi-inlet and multi-outlet configurations, designers can move beyond conservative estimates and develop more precise, optimized cooling strategies, ultimately enhancing engine performance and component lifespan.
This study aims to systematically investigate the influence of inlet temperature differentials on the aerothermal characteristics and mass flow distribution within a multi-inlet and multi-outlet corotating-disc cavity. Through detailed numerical simulations, the research will explore a rotational Reynolds number R e ϕ range from 5 × 10 6 to 2 × 10 7 and an axial Reynolds number R e z range from 2 × 10 5 to 5 × 10 5 , corresponding to a Rossby number R o range of 0.01 to 0.10. Critically, this work introduces inlet temperature differentials Δ T I N of 10 K, 30 K, and 50 K to quantify the impact of non-uniform thermal boundary conditions. These modest differentials are representative of the small thermal variations expected between different compressor bleed air streams that have traversed slightly different paths, as opposed to the large temperature differences between the secondary air and the main hot gas path. The primary goal is to characterize how these temperature differentials alter the cavity flow structures and to reveal the underlying physical mechanisms responsible for changes in the mass flow distribution and the resultant outlet temperatures. This will provide new insights for the thermal management and optimization of secondary air systems for engine designers.

2. Numerical Methodology

2.1. CFD Model and Boundary Conditions

The numerical simulation within this study is conducted through solving the governing Navier–Stokes equations within a discretized fluid domain. These equations are the mathematical formulations of the conservation laws for mass, momentum, and energy. The general form of the continuity, momentum, and energy equations are presented below, respectively:
ρ / t + · ρ V = 0 ,
ρ V / d t + · ρ V V = p + μ · τ ,
ρ E T / d t + · ρ V E T = ρ / t + · ( V · τ ) + Q ,
where ρ denotes the density of air, V denotes velocity, p   denotes pressure, k denotes thermal conductivity, and μ denotes dynamic viscosity. The τ denotes the viscous stress tensor and E T is the total energy, which are defined below:
τ = V + V T + 3 / 2   δ · V ,
E T = E + V 2 / 2
The governing equations are solved for compressible flow, with air density treated as a variable dependent on temperature and pressure via ideal gas assumption. By solving the full momentum equation in Equation (2), the influence of density variations within the flow due to centrifugal buoyancy is inherently captured through the inertial · ρ V V and pressure gradient p terms, without the need for an explicit buoyancy source term. It is important to clarify the nature of the buoyancy effects in this study. The term ‘buoyancy’ here refers to forces arising from density gradients within the strong centrifugal field of the rotating cavity, not from gravity. Gravitational effects are considered negligible in comparison to the powerful rotational forces and are therefore not included in the model.
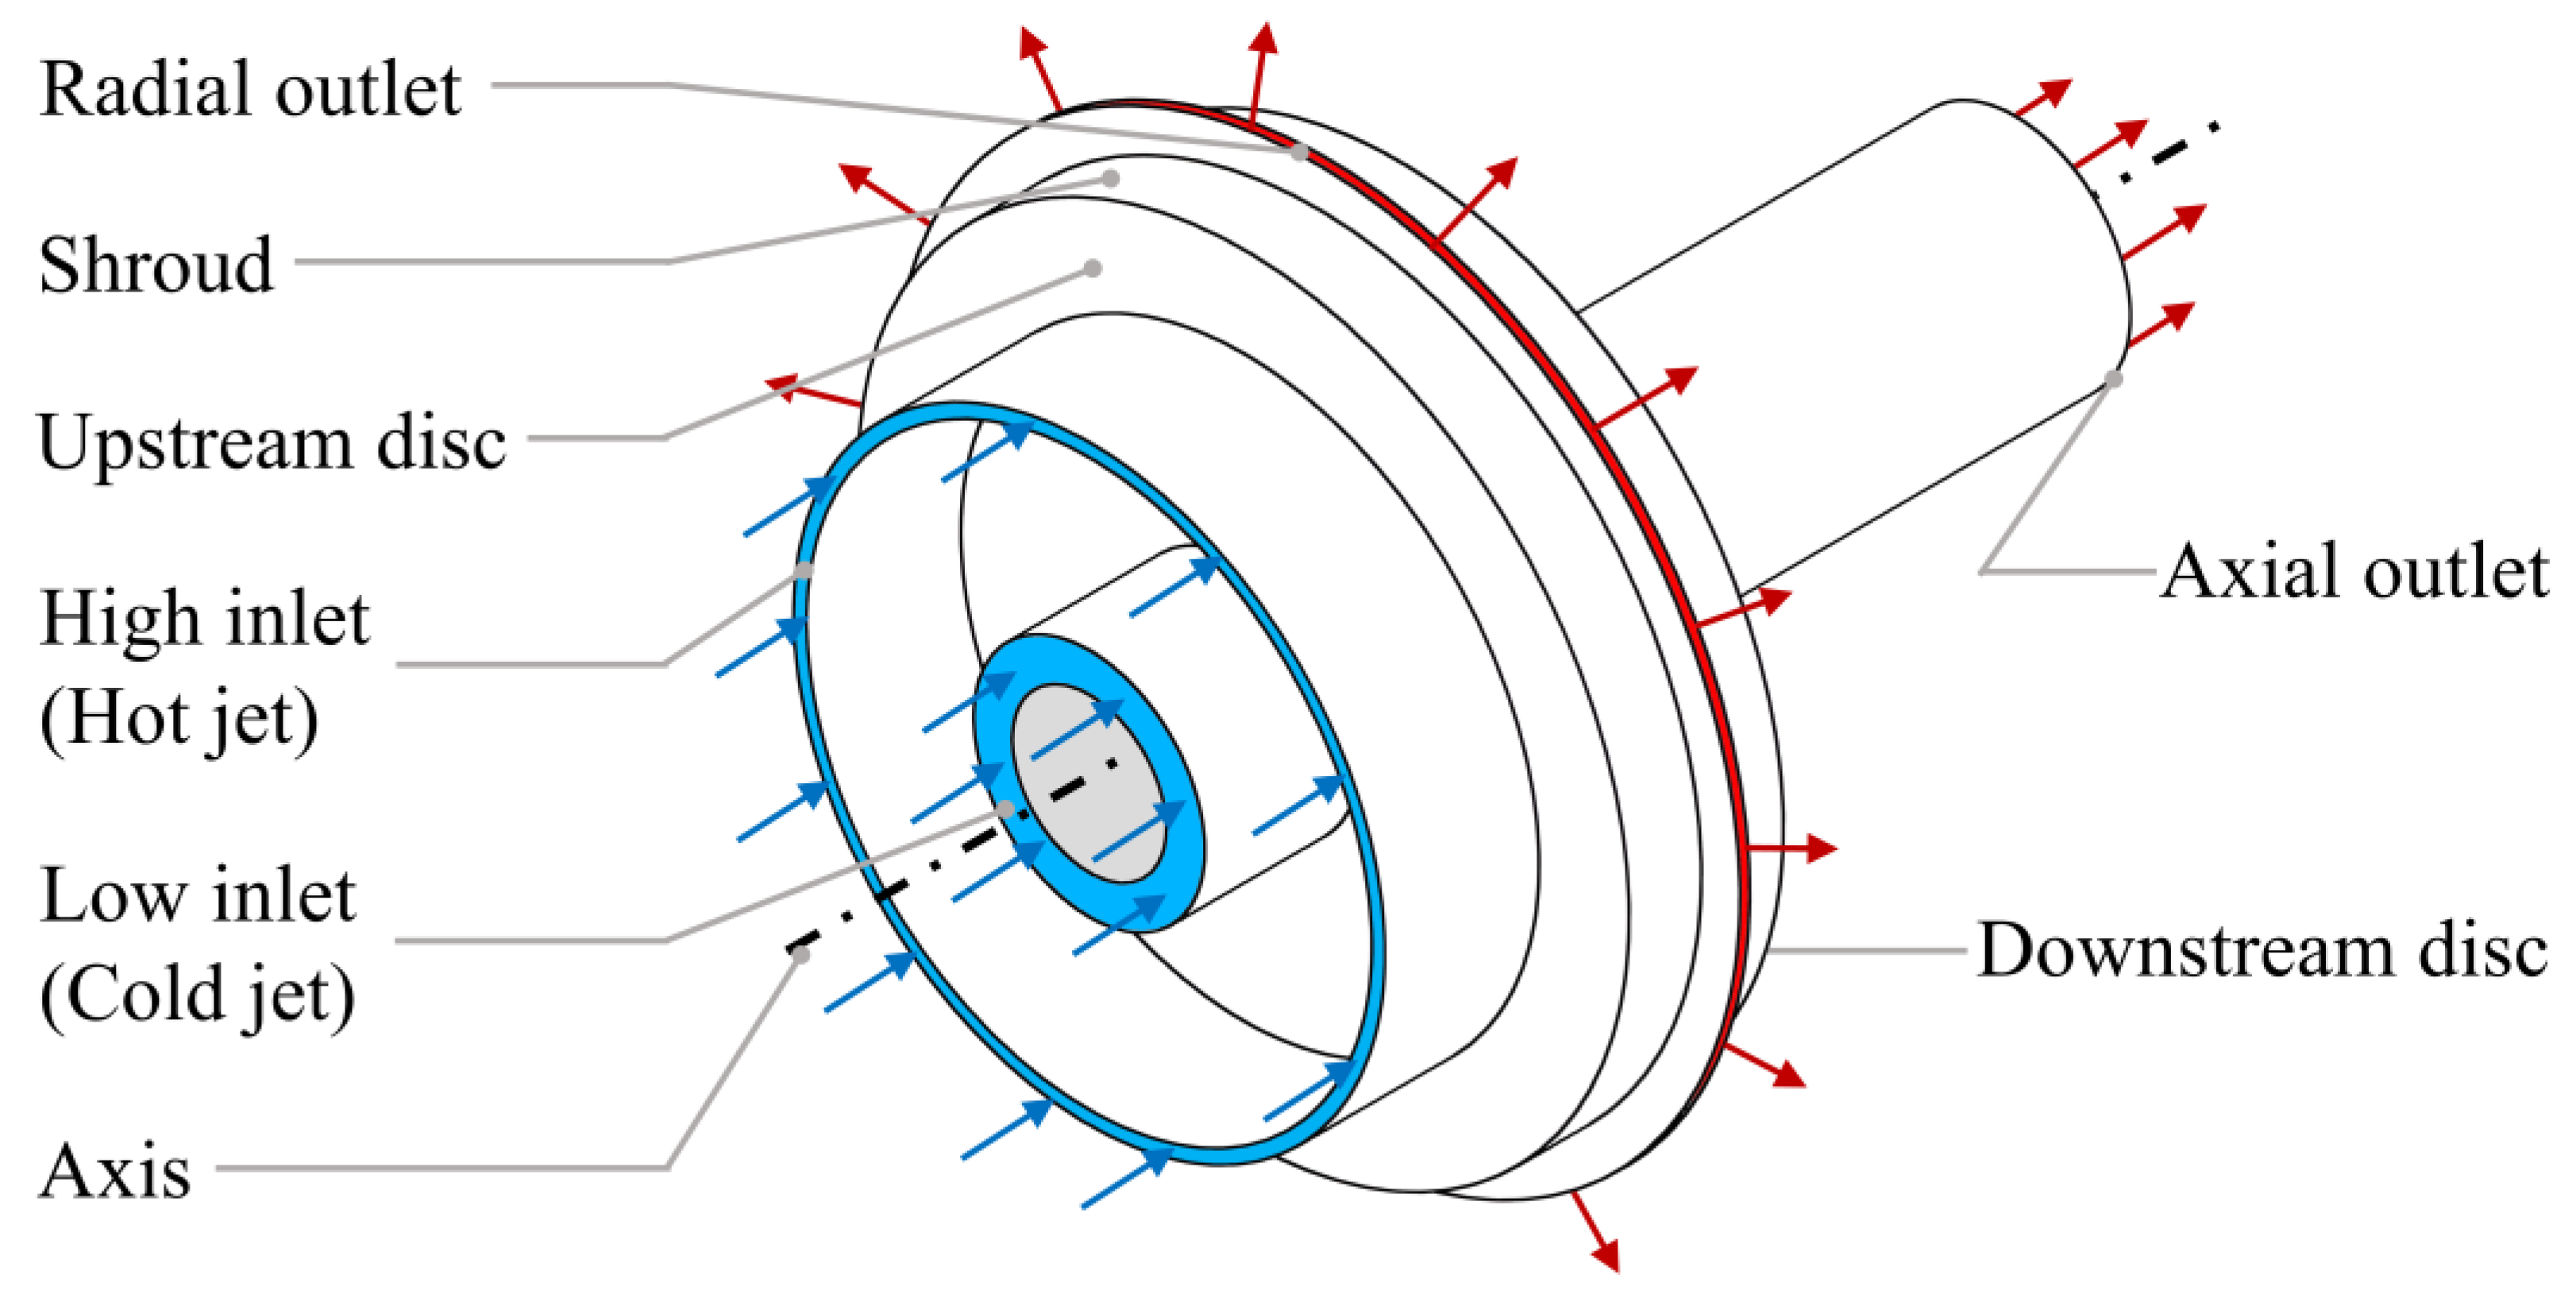
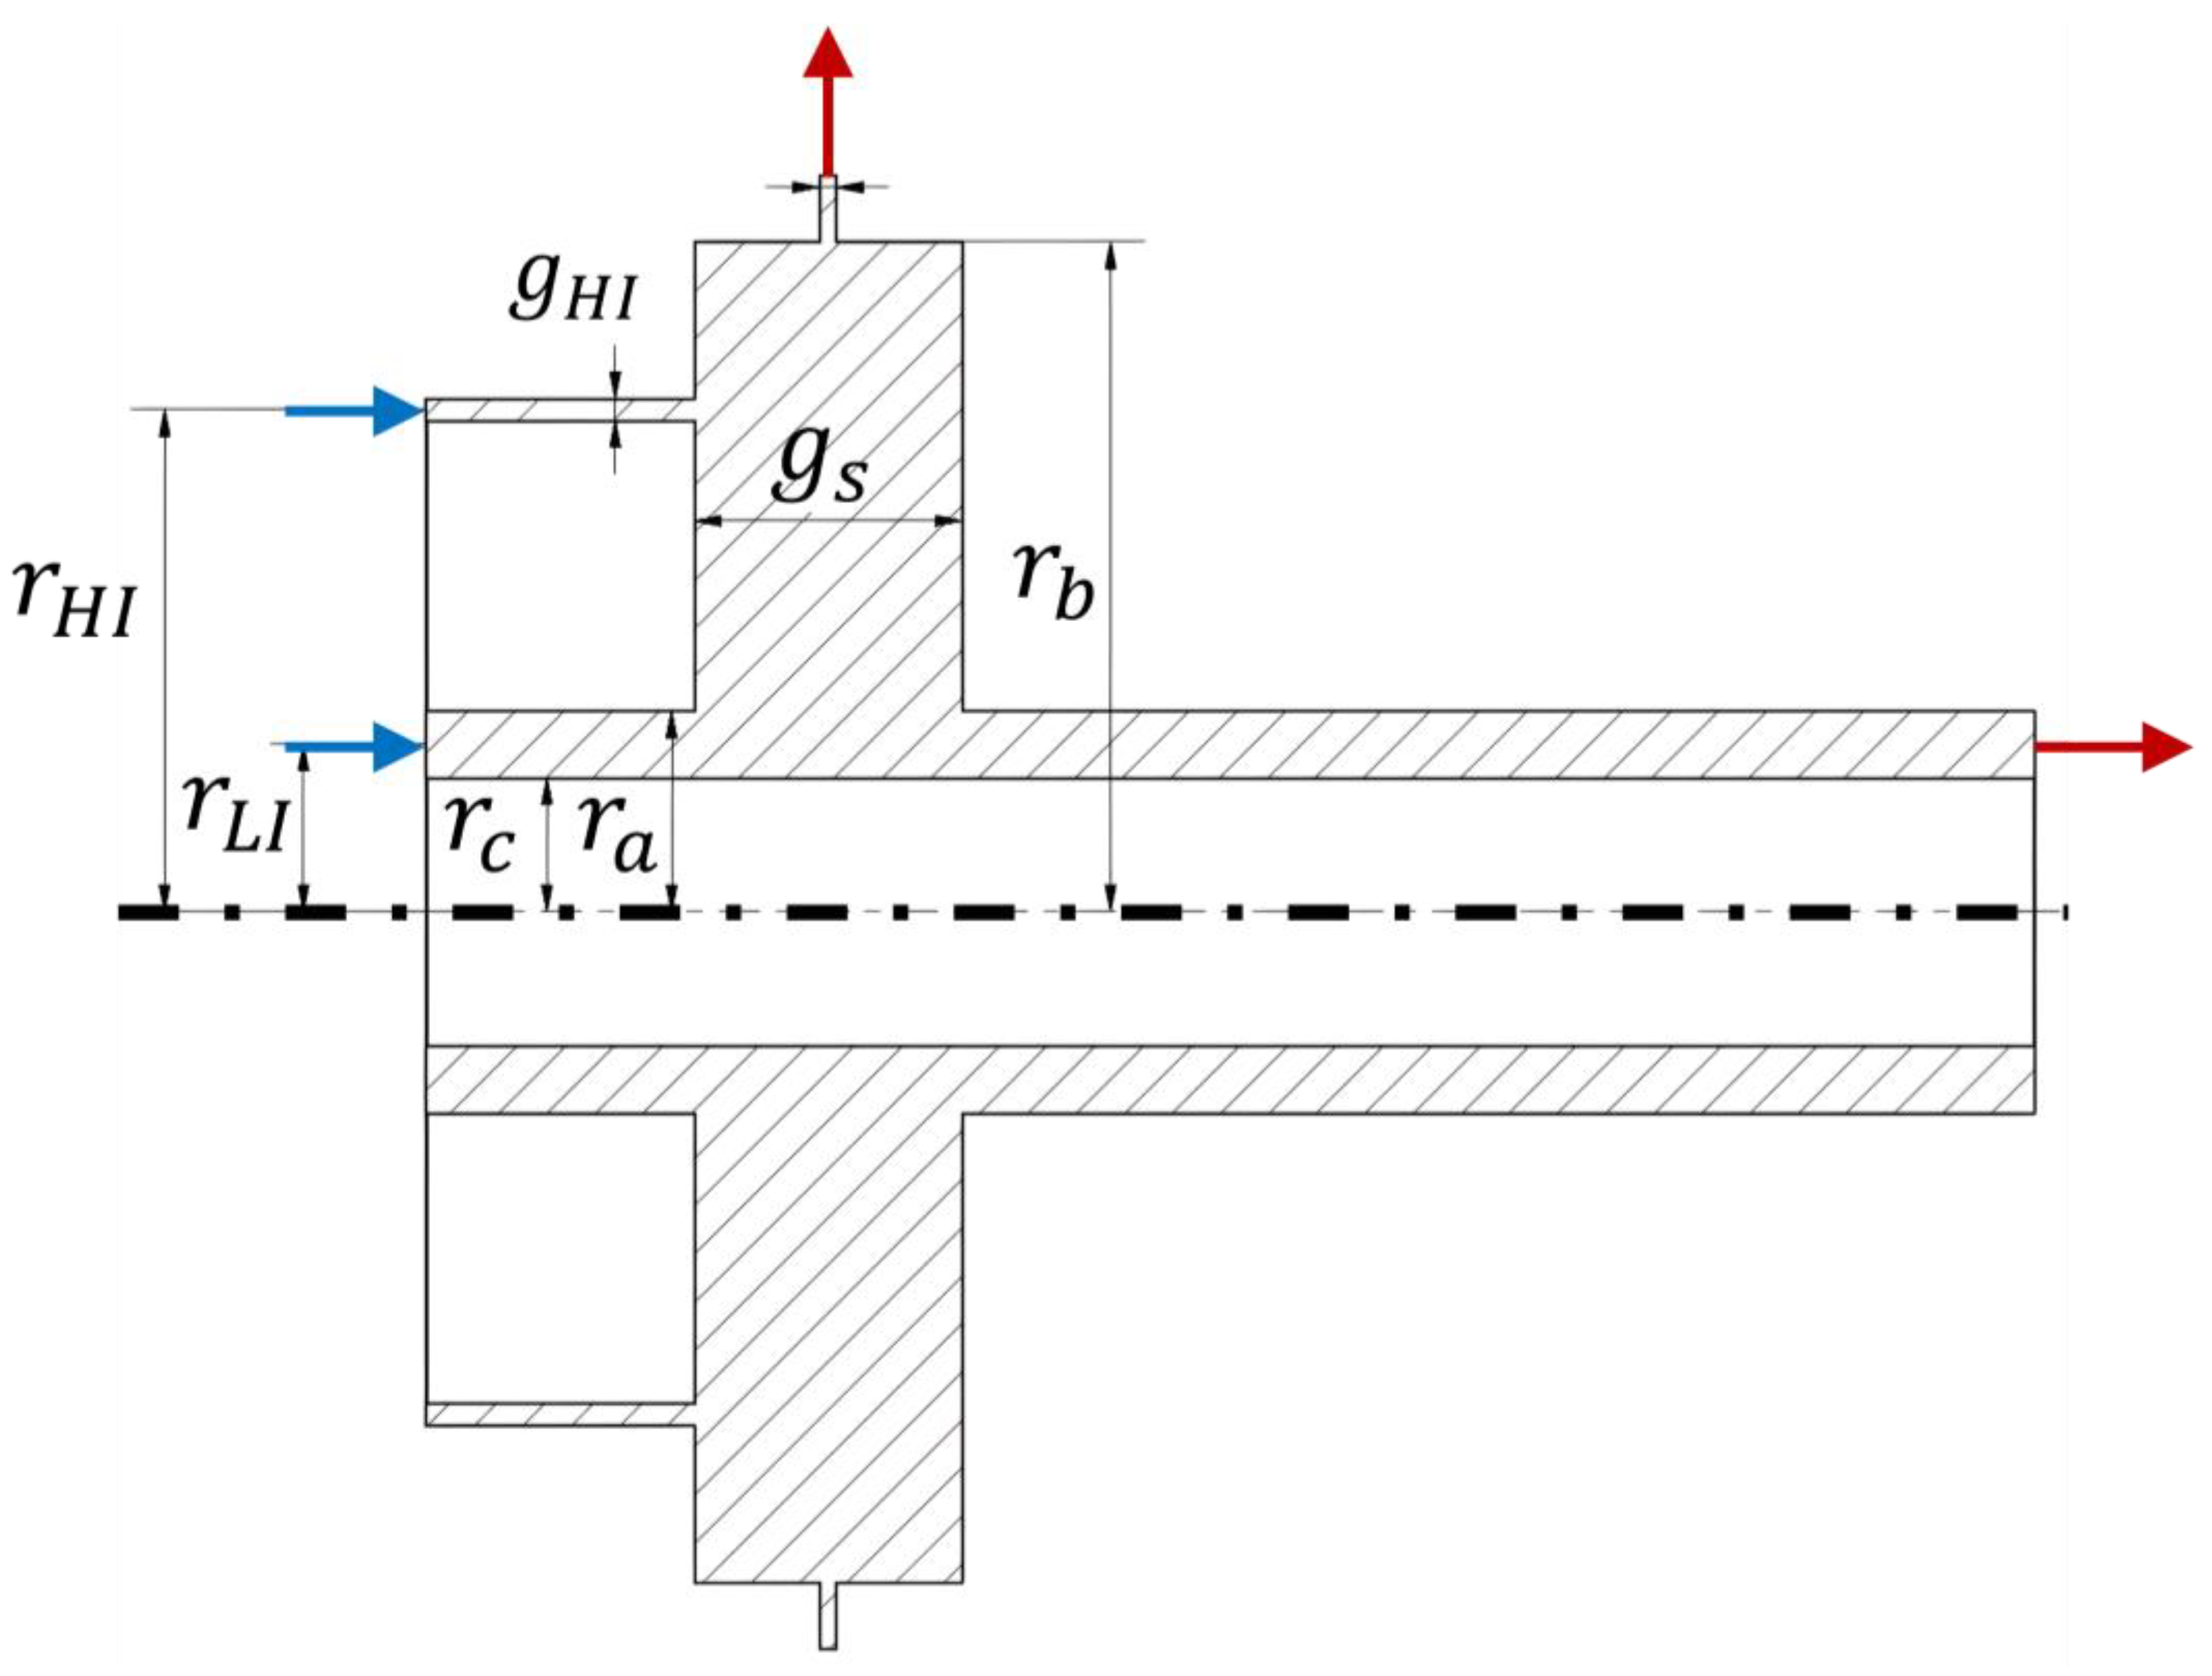
The computational domain used for this investigation is illustrated in Figure 1. The corotating-disc cavity receives cooling air from two distinct sources: a low inlet (LI) located at the base of the cavity and a high inlet (HI) positioned at a mid-radial location on the upstream rotor. Flow exits the domain through two paths: a straight annular passage forming the axial outlet (AO) and a narrow circumferential gap at the upper shroud, which serves as the radial outlet (RO). Both inlets are modelled as mass flow inlets with identical flow rates, while both outlets are modelled as pressure outlet set to uniform static pressures of 0 Pa. The operating pressure for the computational domain was set to 101,325 Pa. The magnitude of this rate is determined by the target axial Reynolds number R e z for the low inlet, defined as follows:
R e z = ρ V z , i n r L I / μ ,
A fully developed swirl, matching the local tangential speed of the corotating discs, is prescribed for both inflows. All solid surfaces are defined as rotating walls, with a speed corresponding to the target rotational Reynolds number R e ϕ , given as follows:
R e ϕ = ρ Ω r b 2 / μ ,
To characterize the relative effects of the two forces within the cavity, the dimensionless Rossby number R o is introduced as a critical parameter. It is defined as the ratio of the axial Reynolds number to the rotational Reynolds number, as follows:
R o = R e z / R e ϕ ,
This study covers a flow condition range of 0.01 < R o < 0.10 , 2 × 10 5 < R e z < 5 × 10 5 , and 5 × 10 6 < R e ϕ < 2 × 10 7 , which translate to mass inflow rates of 0.094   k g / s < m ˙ < 0.234   k g / s for each inlet and rotational speeds of 76.02   r a d / s < Ω < 304.06   r a d / s . Temperature-wise, to investigate the influence of thermal effects, a temperature differential Δ T is introduced between the two inlets. The low-inlet flow is maintained at a baseline temperature of T L I = 300 K, while the high-inlet temperature is set to T L I = 310 K, 330 K, and 350 K to achieve temperature differentials of Δ T I N = 10 K, 30 K, and 50 K, respectively. All solid walls remain defined as adiabatic. As shown in Figure 1, the circumferentially periodic configuration permits a 30° sector domain simplification, with the side walls assigned with periodic boundary conditions.
The geometry of the cavity, detailed in Figure 2, is based on a simplified representation of typical lower SAS cavities. The key radial dimensions of the model include the overall outer radius r b , the outer and inner radii of the axial channel ( r a and r c ), and the median radii of the low and high inlets ( r L I and r H I , respectively). Several geometric parameters are determined by specific constraints. The annular gap width of the high inlet g H I , is sized to ensure its cross-sectional area is identical to that of the low inlet. The separation between the two corotating discs is defined by a constant gap width, g s . At the exit, the radial outlet’s gap width, g R O , is a function of a prescribed outlet area ratio S = A R O / A A O , representing the area of the radial outlet A R O relative to the area of the axial outlet A A O . A comprehensive summary of all geometrical parameters is provided in Table 1.

2.2. Grid and Mesh Independence Study

A tetrahedral mesh was generated for the computational domain using ANSYS Fluent Meshing from ANSYS Fluent 2022 R1, with a representative view of this discretization shown in Figure 3. To accurately resolve the steep velocity gradients anticipated in the narrow radial outlet gap, local mesh refinement was implemented in this specific region. To properly capture viscous effects near solid surfaces, a boundary layer mesh composed of thin prismatic elements was applied to all wall-adjacent regions. The height of the first element off the wall was carefully controlled, set to 0.001 times the radial thickness of the axial channel. This strategy ensured that the dimensionless wall distance y + remained below a value of 5 throughout the entire cavity, satisfying the requirements of the wall function approach. This near-wall mesh consists of 10 thin prism layers, which expand from the wall with a growth ratio of 1.2 to provide a smooth and high-quality transition to the core tetrahedral elements of the bulk mesh.
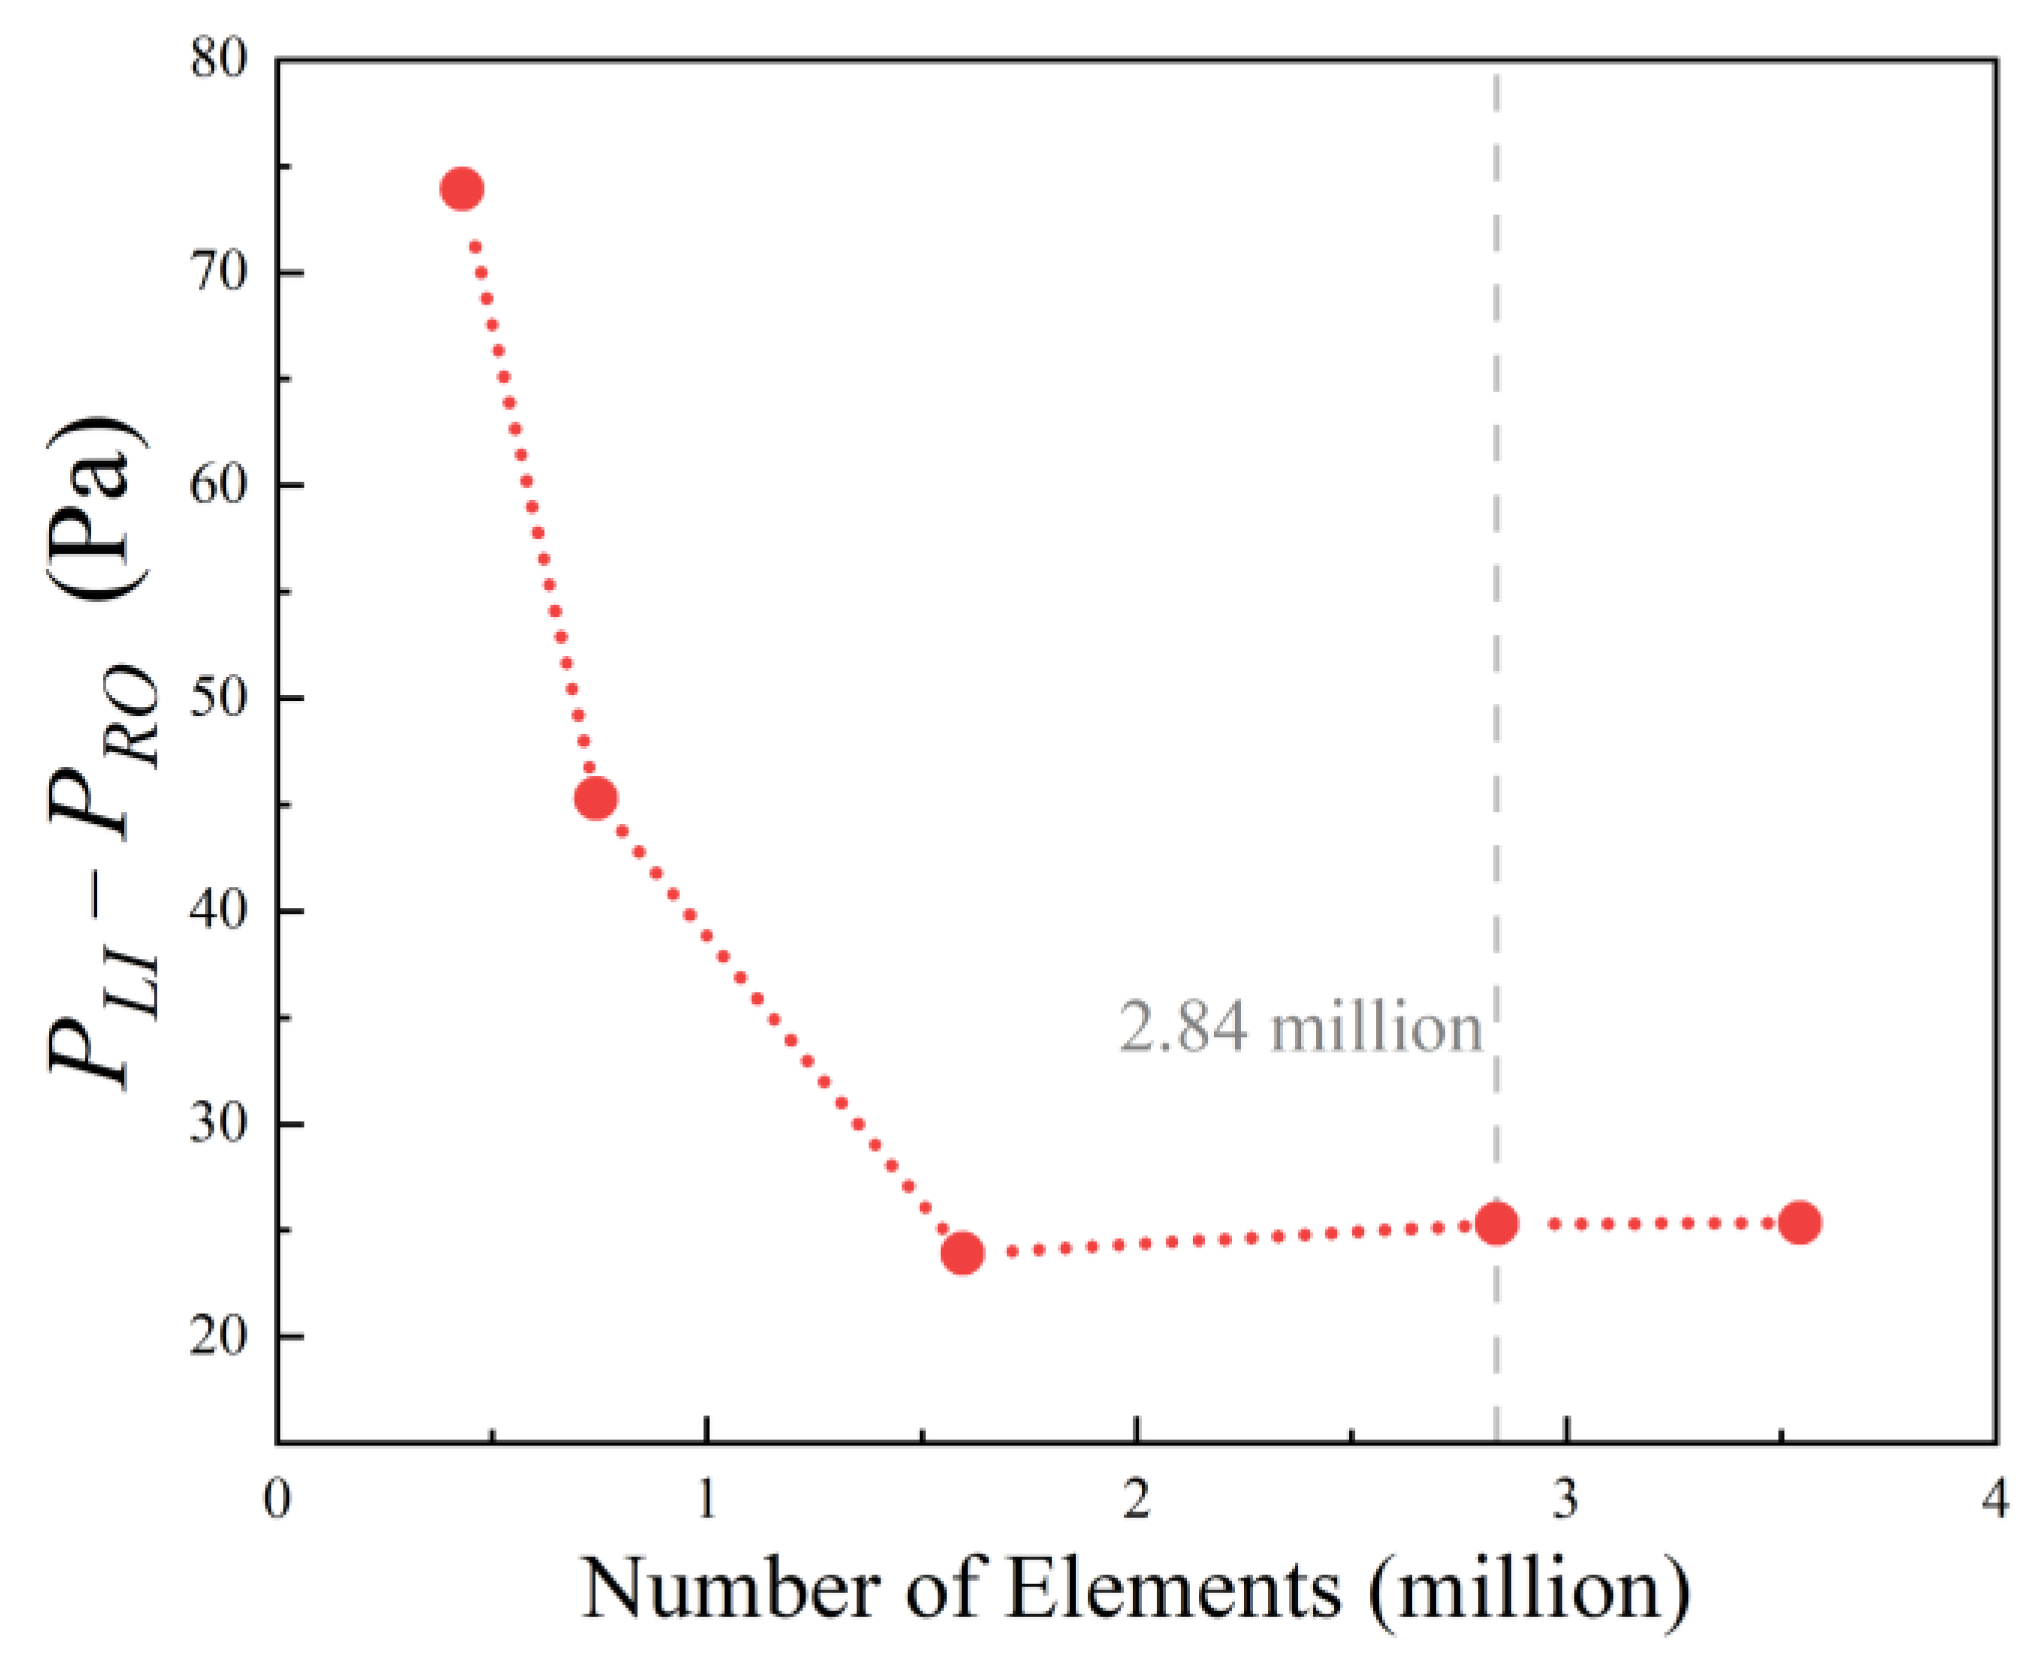
A grid independence study was conducted to determine the optimal mesh resolution. This was achieved by generating and testing a series of computational grids with element counts ranging from 400,000 to 4,000,000. The evaluation was performed under fixed boundary conditions of an axial Reynolds number R e z of 2 × 10 5 and a rotational Reynolds number R e ϕ of 5 × 10 6 . As depicted in Figure 4, the pressure difference between the lower axial inlet and radial outlet was monitored as the mesh density increased. The curve plateaus at higher element counts, which indicates that the solution is approaching convergence and is less sensitive to further mesh refinement. When compared to the results from the finest grid, the deviation in this pressure difference drops below 1% for any mesh with more than 2.84 million elements. Consequently, a mesh configuration that meets this criterion was selected for all subsequent simulations, providing a suitable balance between numerical accuracy and the efficient use of computational resources.

2.3. Numerical Method and Validation

The numerical simulations for this study were performed using the commercial CFD software Ansys Fluent 2022 R1. This code was used to solve the steady-state RANS equations that govern the flow within the corotating-disc cavity. A pressure-based solver was utilized, and the coupled algorithm was selected for pressure–velocity coupling to ensure robust and efficient convergence. The operating pressure for the computational domain was set to 101,325 Pa. For the spatial discretization of the governing equations, the pressure term was resolved using a second-order scheme, while gradients were computed using the Least Squares Cell-Based method. A second-order upwind scheme was applied to momentum and energy quantities to maintain high accuracy throughout the solution domain.
The working fluid throughout the domain is treated as ideal compressible air. Consistent with the adiabatic wall assumption used in this study, several fluid properties are held constant: the specific heat of air c p is set to 1006.43 J/(kg·K), thermal conductivity k is 0.0242 W/(m·K), and dynamic viscosity μ is 1.7894 × 10⁻⁵ kg/(m·s).
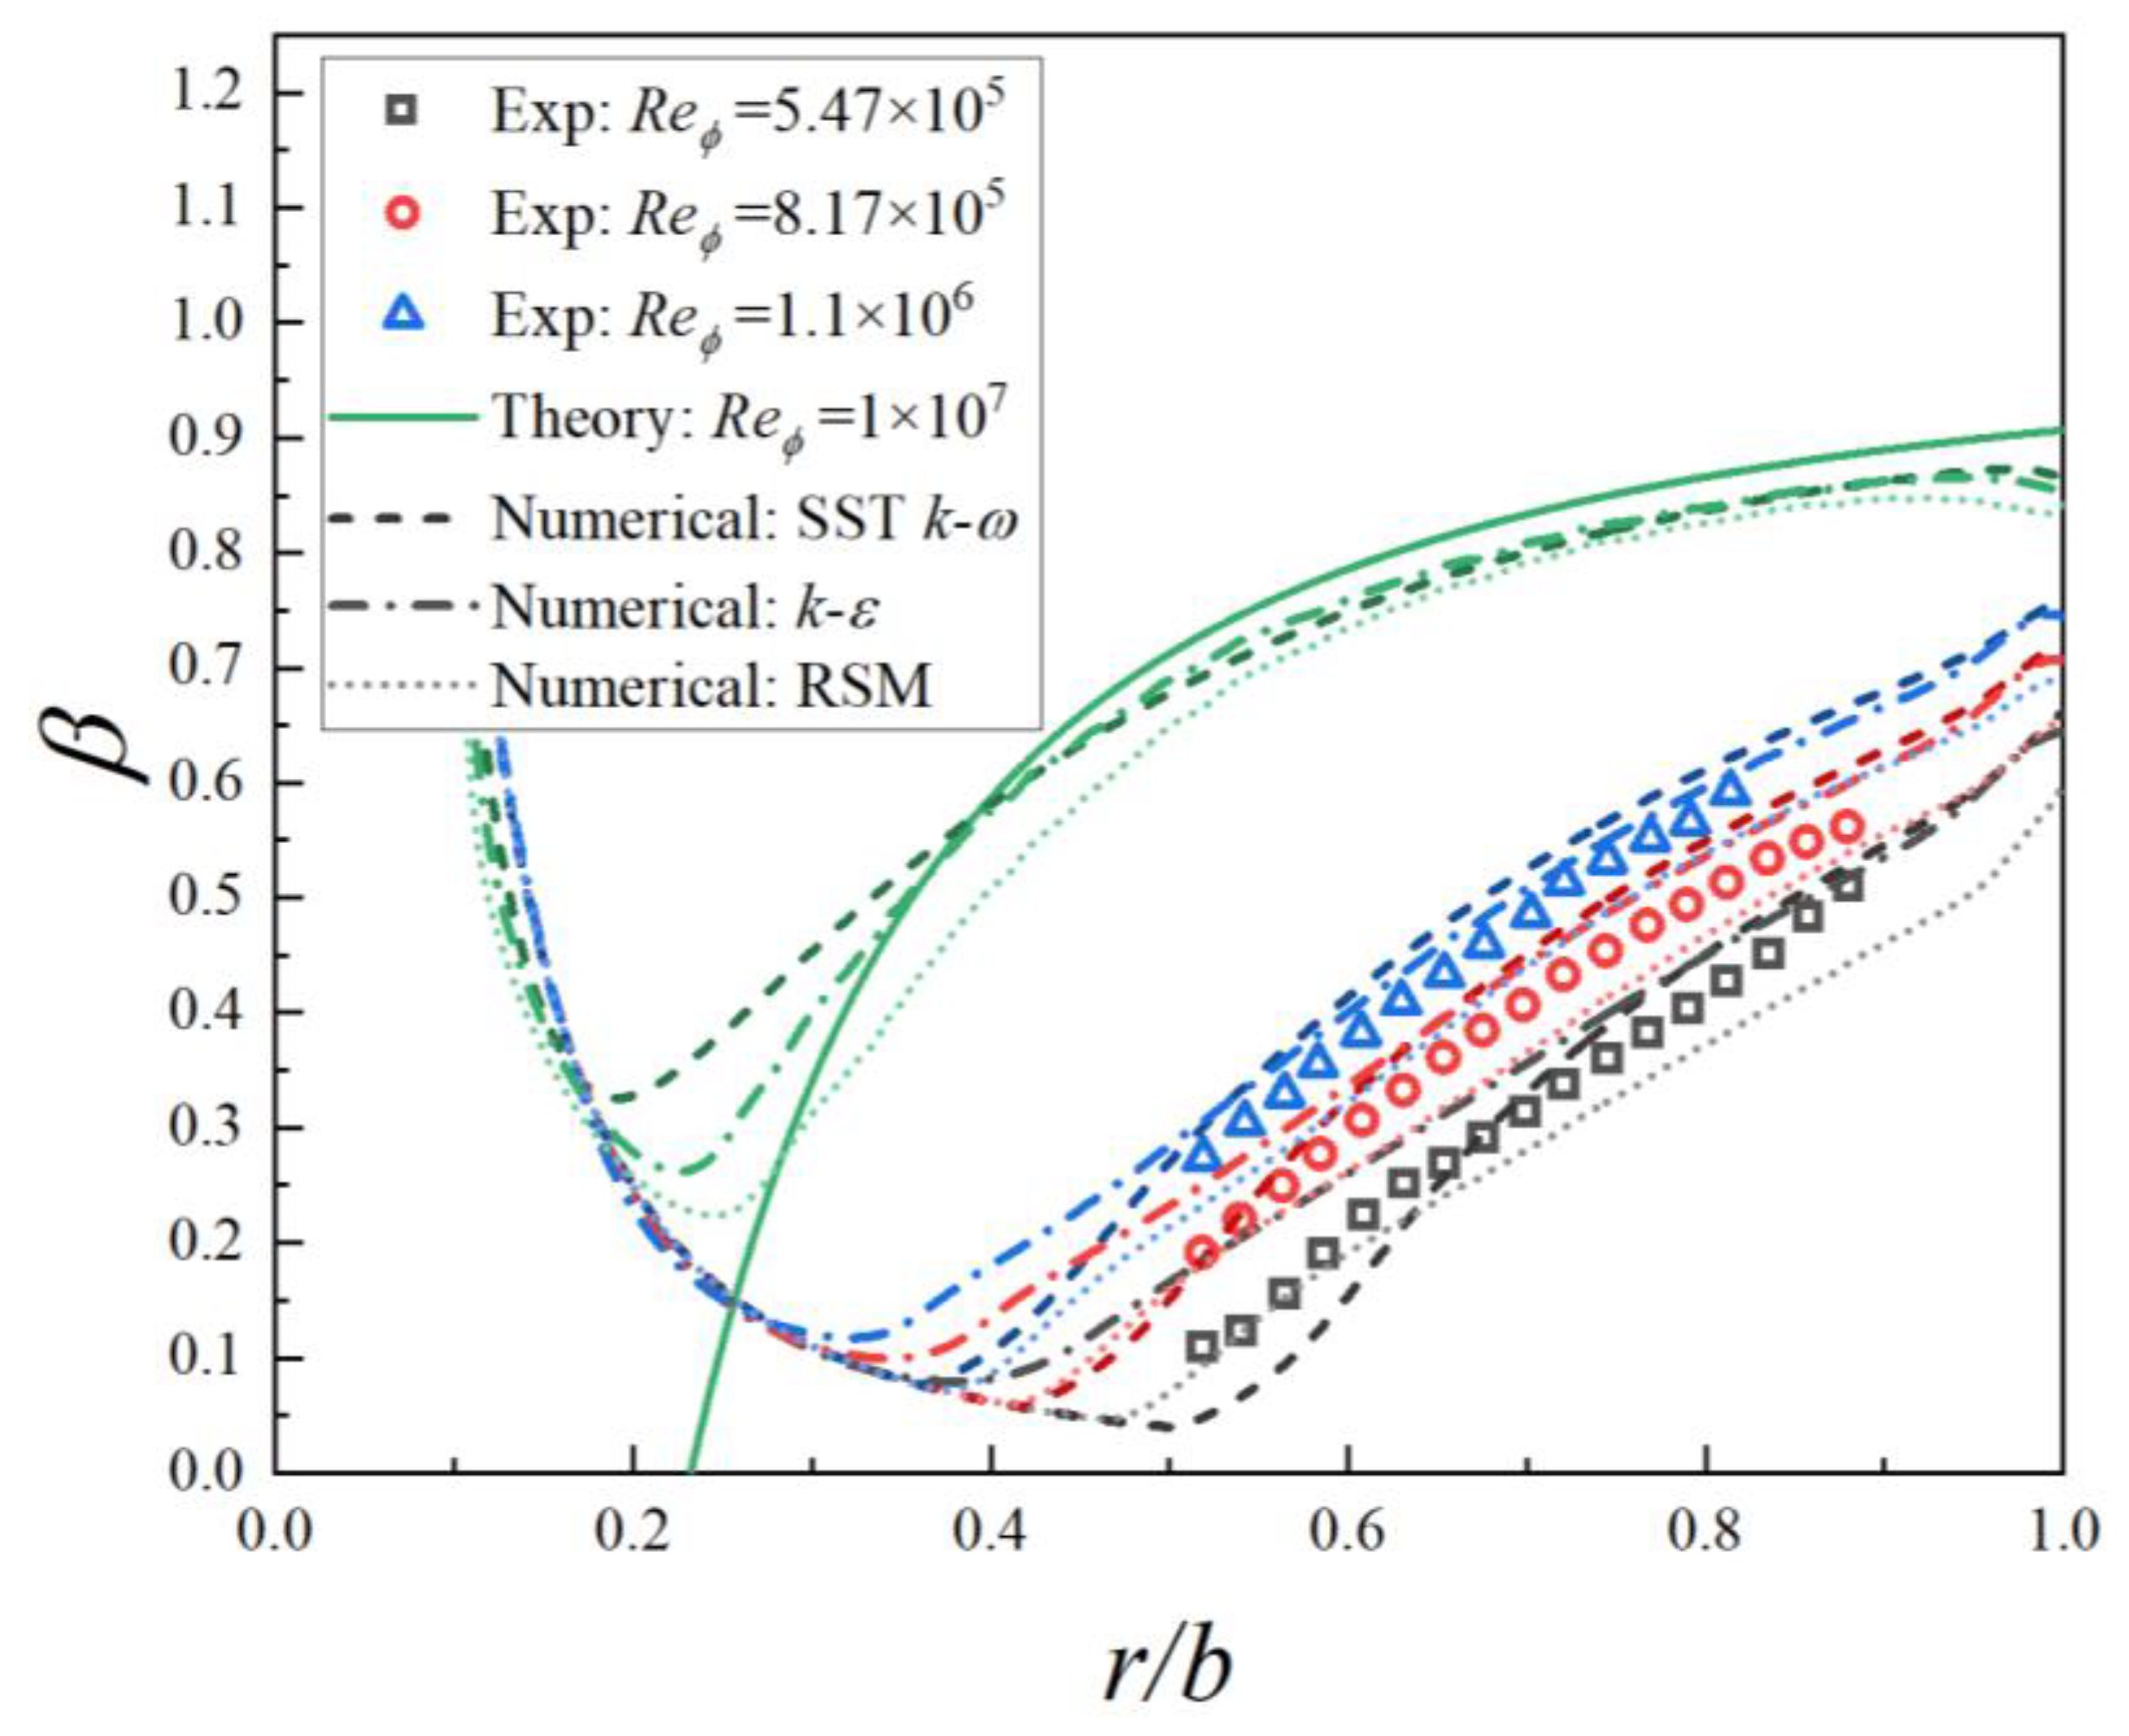
The review of prior numerical studies in the introduction section reveals no clear consensus on the optimal turbulence model for accurately predicting flows in corotating-disc cavities. Therefore, this investigation includes a comparative analysis of three promising models identified in the literature: the Reynolds Stress Model (RSM), the Realizable k-ϵ model, and the SST k-ω model. To validate the numerical predictions, results were compared against both experimental data and an established theoretical solution. For rotational Reynolds numbers R e ϕ ranging from 10 5 to 10 6 , the model was validated against experimental data from Owen et al. [2]. This involved comparing the predicted radial distribution of the swirl ratio β , which is the non-dimensional fluid tangential velocity V ϕ / Ω r , against the measurements taken in the cavity core region. For the higher rotational Reynolds number of R e ϕ   = 10 7 , validation was performed against a theoretical solution for the swirl distribution derived from the linear Ekman layer equations [19]. The theoretical solution equation is expressed as
β c o r e = 1 2.22 C w 5 / 8 R e ϕ 0.5   r / r b 13 / 8   ,
Here, C w is the dimensionless mass flow rate m ˙ i n / μ b .
A C w of 2500 was used for all validation cases to match the experimental conditions. The results shown in Figure 5 indicate that while all three turbulence models generally capture the experimental and theoretical trends, their individual performance varies significantly. The RSM, shown as a light dotted line, consistently underpredicts the swirl ratio across all tested R e ϕ conditions. In contrast, the k-ϵ model, denoted as dash–dot line, aligns well with validation data at higher R e ϕ conditions but overpredicts the swirl in the lower-radial regions. The SST k-ω model, however, delivers predictions with consistently high accuracy across the full range of R e ϕ . This observation is quantitatively supported by the average errors e r r ¯ presented in Table 2, which confirm that the SST k-ω model’s predictions remain within a 10% error margin. Based on this comprehensive validation, the numerical approach incorporating the SST k-ω turbulence model was chosen for all subsequent investigations.

3. Results and Discussion

3.1. Effect of Inlet Temperature Differential on Flow Characteristics

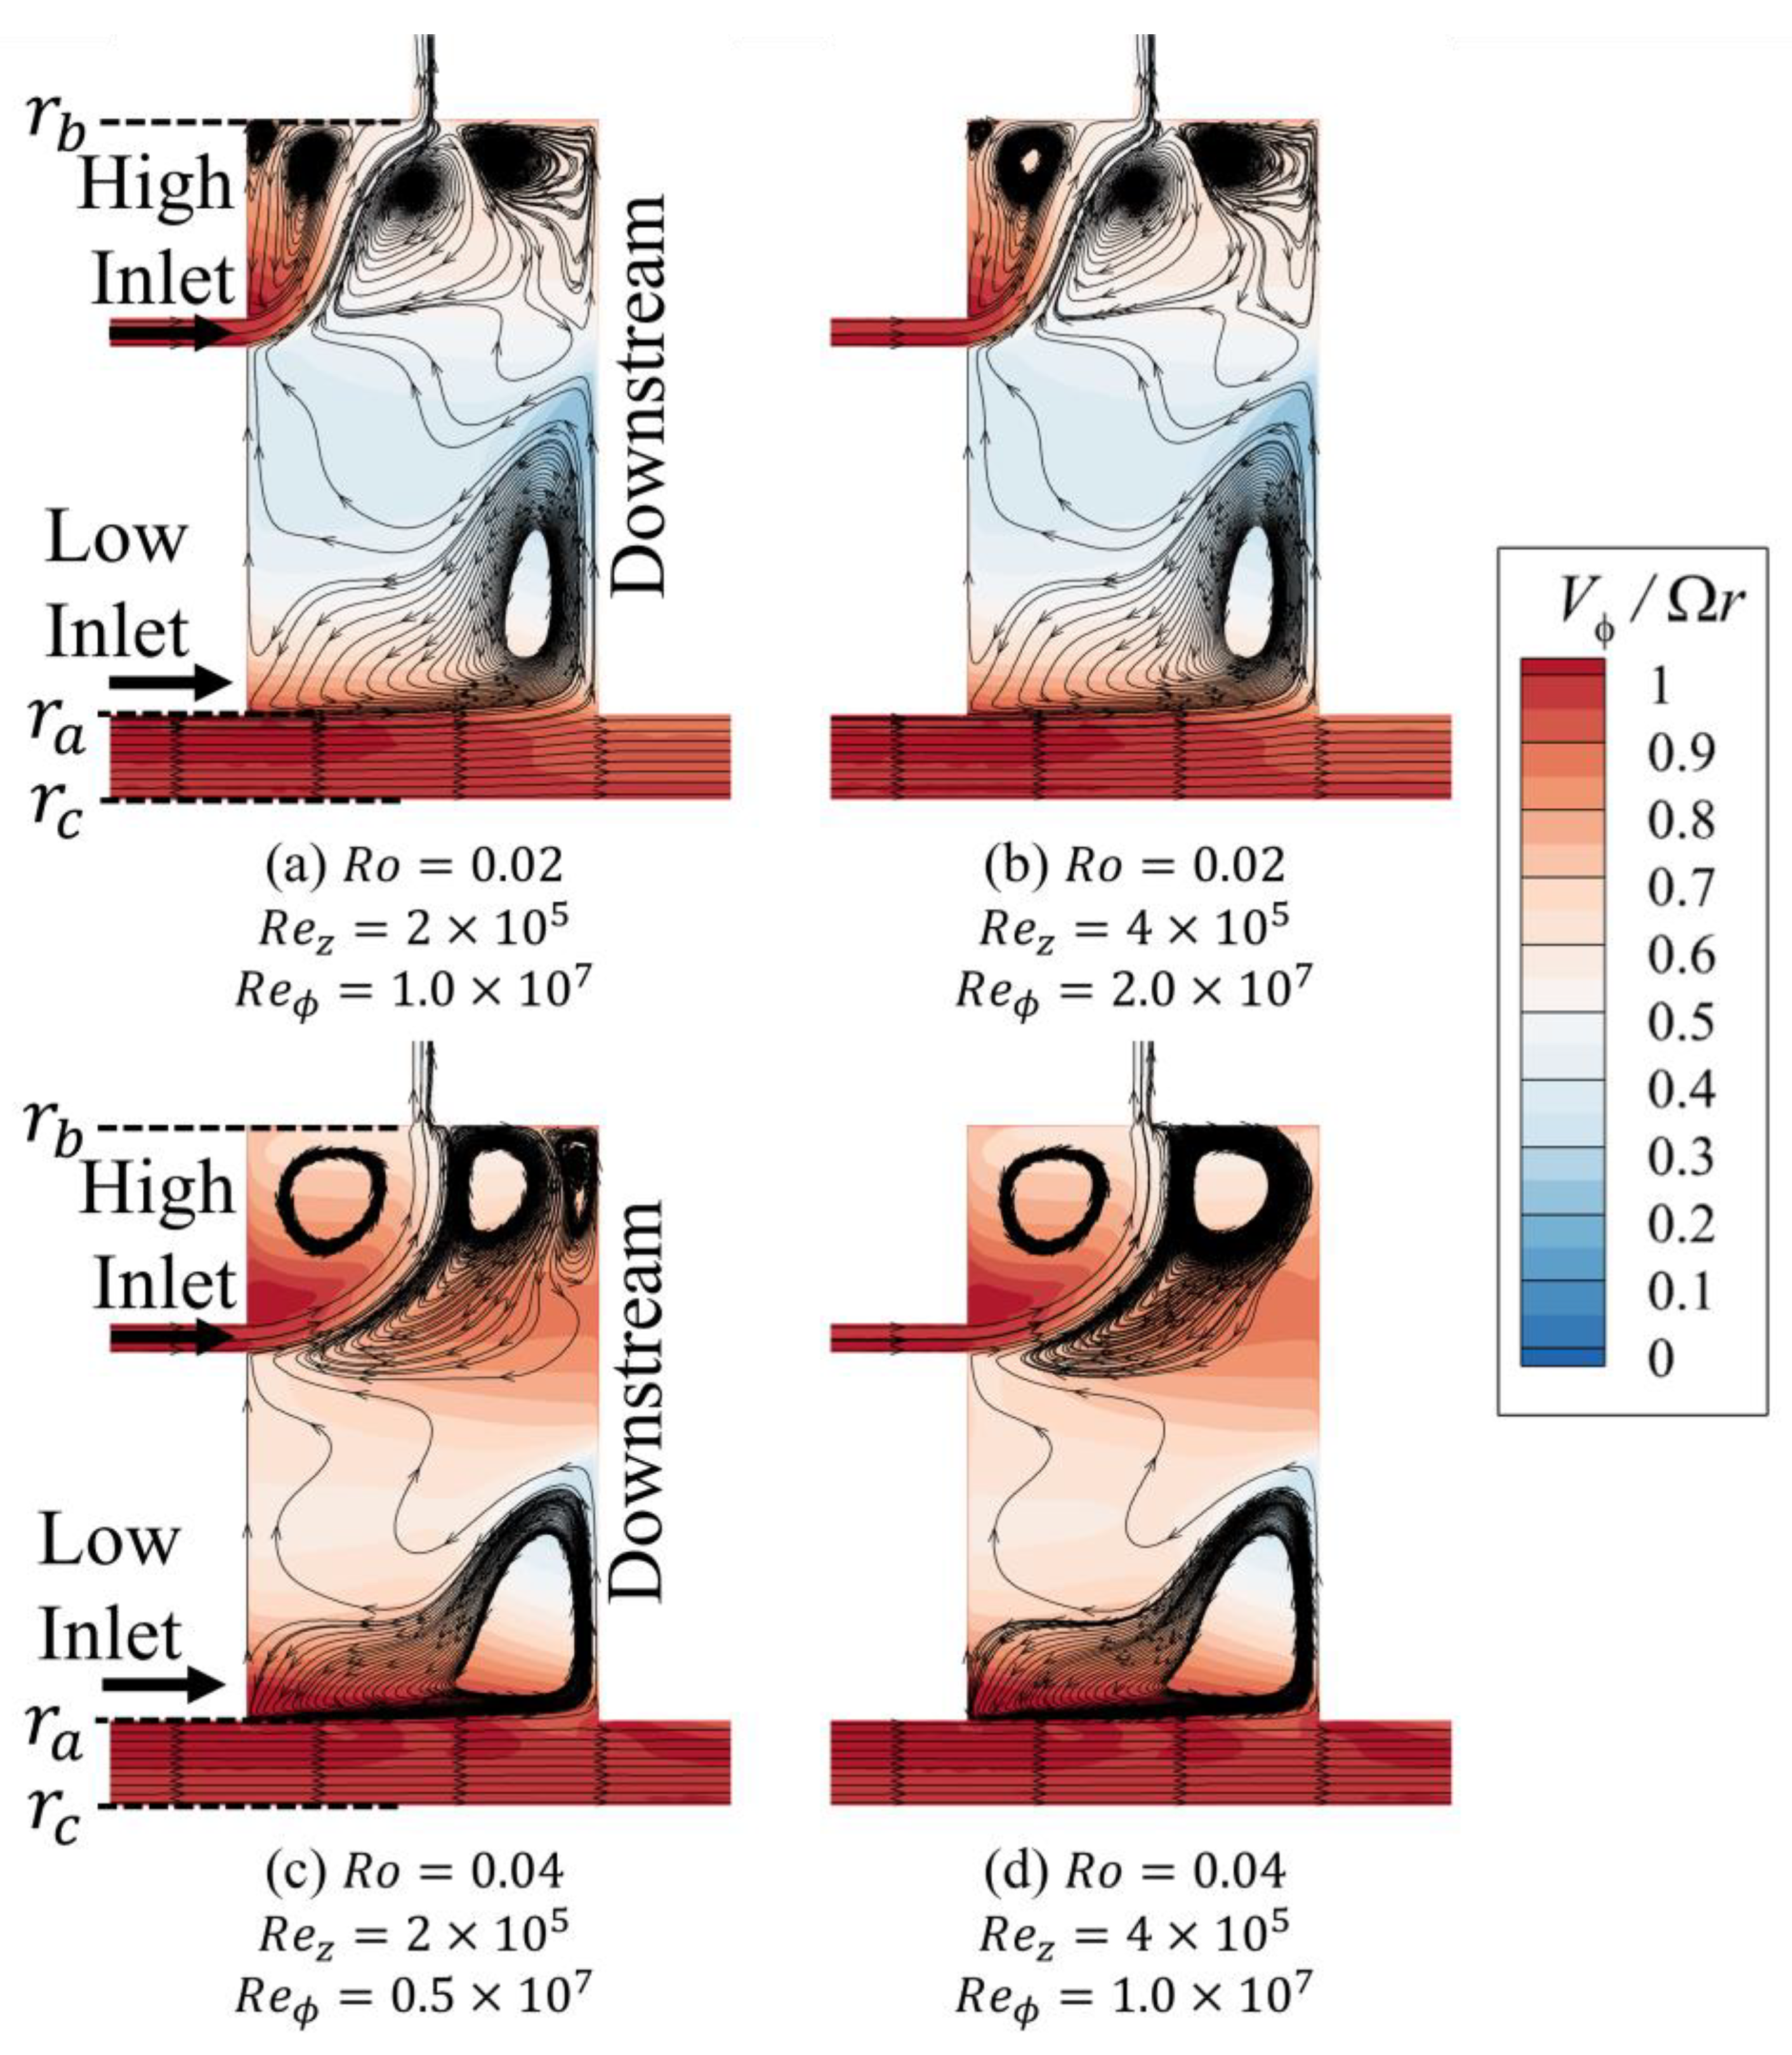
The flow characteristics within rotating cavities are typically governed by the balance between the inertial and rotational forces. Figure 6 presents two pairs of streamline diagrams overlaid on corresponding swirl ratio β contours for the radial–axial midplane of the cavity, in which the low- and high-inlet jets are subjected to a temperature differential of Δ T I N = 50 K. The figure showcases two pairs of cases where the Rossby number is held constant at R o = 0.02 and R o = 0.04 , respectively, while the constituent axial and rotational Reynolds numbers ( R e z and R e ϕ ) are varied.
Despite these significant variations in the individual Reynolds numbers, the resulting streamline patterns and swirl ratio β contours within each pair are observed to be nearly identical. This striking resemblance confirms that Rossby number flow similarity remains valid even for the complex multi-inlet, multi-outlet configuration investigated in this study and under the influence of inlet temperature differentials. Therefore, the subsequent analysis of the aerothermal characteristics and mass flow distribution in this paper will be framed against an increasing Rossby number to provide a clear and systematic interpretation of the governing flow physics.
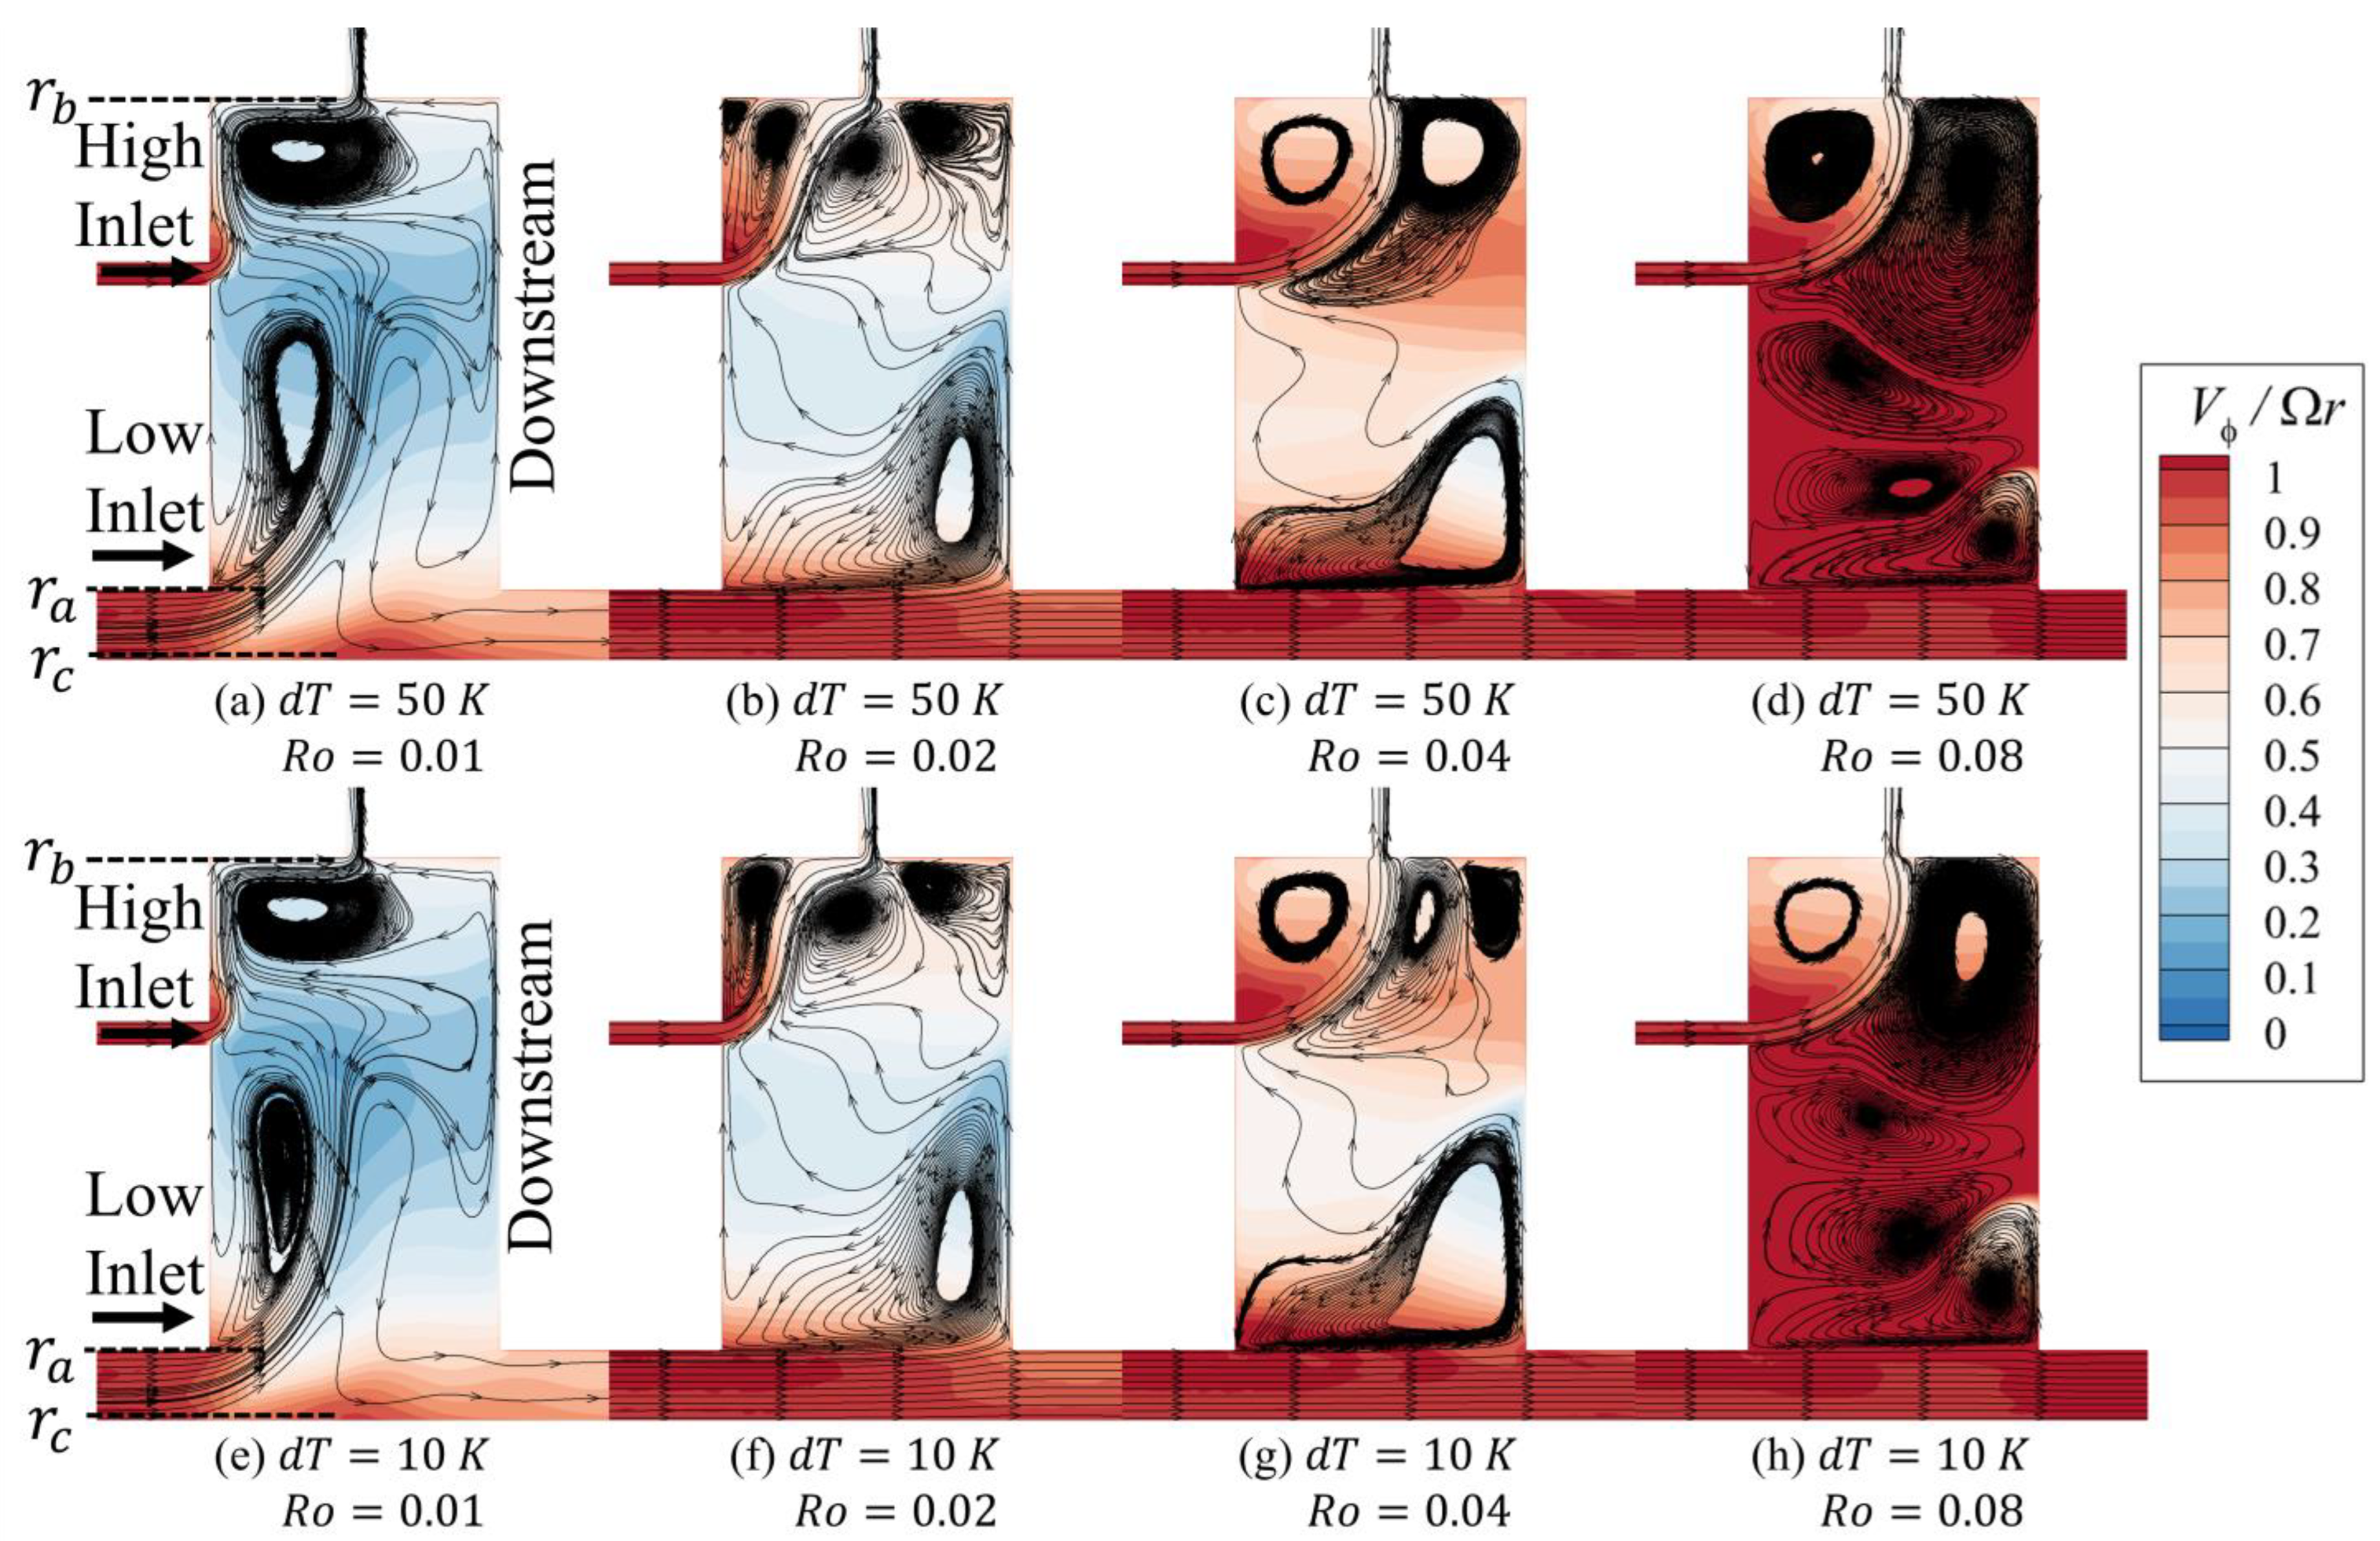
Figure 7 presents the streamline patterns at the cavity’s radial–axial midplane for Rossby numbers ranging from 0.01 to 0.08, under inlet temperature differentials Δ T I N of 10 K and 50 K. The diagrams reveal a complex flow field dominated by two radially stratified vortical zones that change significantly as the Rossby number increases. Notably, for any given Rossby number, the flow structure is nearly identical for both the 10 K and 50 K temperature differential cases, indicating the secondary role of thermal effects on the overall flow topology.
At the lowest Rossby number of R o   =   0.01 , the flow within the cavity is heavily dominated by rotational forces, as depicted in Figure 7a,e. Upon entering the cavity, the low-inlet jet is swept radially outward along the upstream disc. The high-inlet jet is also deflected outward, feeding into a large, axially stretched clockwise vortex that occupies the upper portion of the cavity. While the overall flow structures are very similar, a minor difference can be observed in the low-inlet jet trajectory between the Δ T I N = 50 K and 10 K cases, where it appears to penetrate slightly further axially into the cavity under the higher temperature differential.
When the Rossby number increases to R o = 0.02, as illustrated in Figure 7b,f, the flow pattern undergoes a significant transformation. The jet from the low inlet now establishes a direct axial path toward the outlet. However, a portion of this flow strikes the downstream disc, which gives rise to a clockwise vortex in the lower-radial area of the cavity. While the overall flow structures remain broadly similar, a subtle difference can be observed in the high-radial region between the high-inlet jet and the upstream disc. In the Δ T I N = 50 K case of Figure 7b, small, secondary vortices appear in the cavity’s upstream upper corner. However, at the lower Δ T I N = 10 K in Figure 7f, this area is characterized by a single, larger vortex.
Further increasing the Rossby number to 0.04, as illustrated in Figure 7c,g, results in more changes to the flow structure in the upper recirculation zone. As R o rises, the high-inlet jet penetrates further axially before being deflected radially upward in a smooth path. This compresses the downstream vortices against the disc and allows the upstream vortex to expand, filling the upper corner. Differences between the 50 K and 10 K cases become more apparent; the upper downstream vortex is a single entity at 50 K but is split in the 10 K case. Furthermore, the large vortex in the lower recirculation zone is radially shorter when Δ T I N is 10 K.
As the Rossby number is further increased to 0.08, as seen in Figure 7d,h, the recirculation zone in the lower-radial area develops into a more complex structure composed of several vortices stacked radially. The primary vortex, which originates from the low-inlet jet impacting the downstream disc, shrinks in its radial dimension. In the upper recirculation zone, the path of the high-inlet jet remains consistent. However, the increased inflow momentum associated with the higher Rossby number leads to a more forceful impact of the deflected jet on the shroud. This causes the clockwise vortex in this upper region to expand and extend downwards, past the radial location of the high inlet. The flow from this enlarged upper vortex then spills into the lower recirculation area, contributing to the formation of the stacked vortex structure and significantly disturbing the local flow field. The higher temperature of the high-inlet (HI) jet at a 50 K differential leads to lower fluid density. At high Rossby numbers, where inertial forces are dominant, this lower-density, high-velocity jet has different momentum and buoyancy characteristics compared to the cooler, denser 10 K jet. This difference in density and momentum upon interacting with the existing cavity flow and the shroud is what can trigger the formation of secondary vortices and enhance the overflow. A key distinction between the temperature differential cases is that the overflow from the downstream high-radial-region vortex is more pronounced at the higher differential of 50 K, which in turn compresses the vortices in the low-radial recirculation zone.
The appearance of these secondary vortices at higher temperature differentials aligns with findings from studies on heated cavities, such as those by Zhao et al. [11] and Fazeli et al. [13], which noted that flow becomes more sensitive to thermal effects and gradients, particularly at lower Rossby numbers in their configurations. Our study shows that even with a strong superimposed through-flow, thermal differentials can induce such secondary flow features, especially when inertial forces are significant.
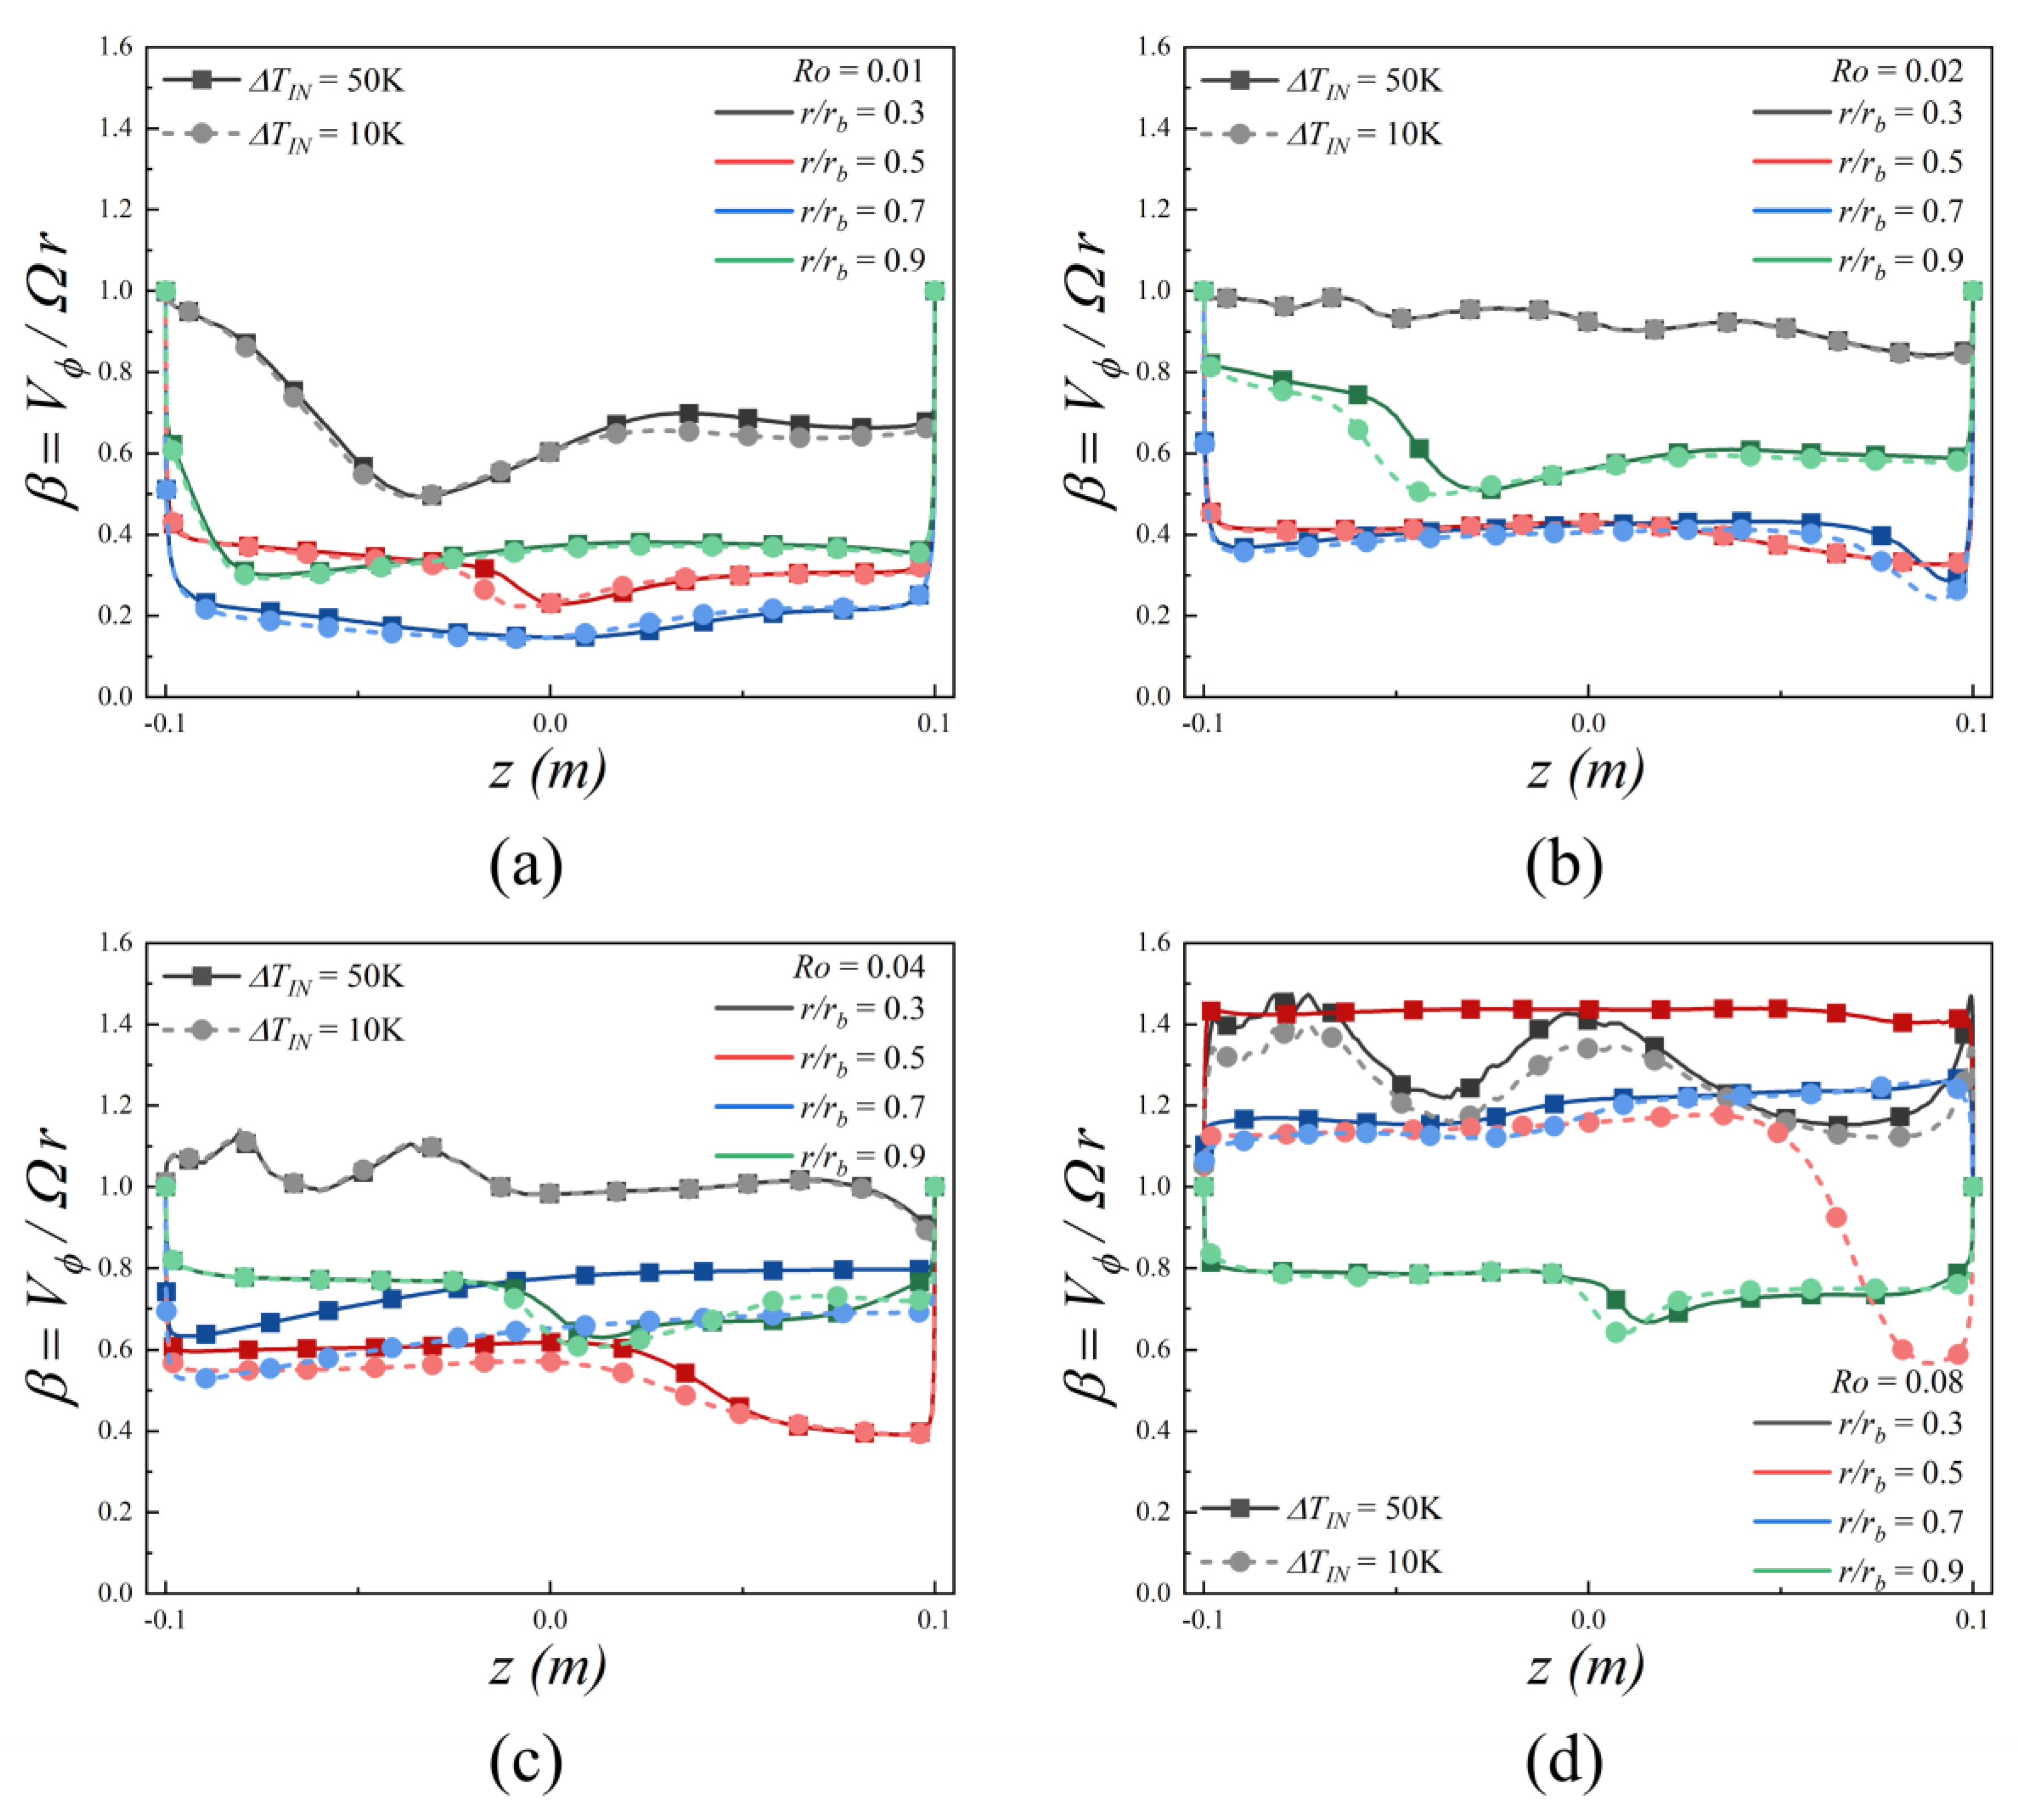
To analyze the cavity swirl ratio β in greater detail, the axial distributions are examined at various radial locations ( r / r b = 0.3 , 0.5 , 0.7 , 0.9 ). As shown in Figure 8, these distributions are mapped from the upstream rotor surface ( z = 0.1 m) to the downstream rotor surface ( z = 0.1 m). Subfigures (a) through (d) illustrate the axial distributions of the swirl ratio for Rossby numbers of 0.01, 0.02, 0.04, and 0.08, respectively. In each graph, the darker lines with square symbols represent the 50 K inlet temperature differential, while the lighter lines with circular symbols correspond to the 10 K differential.
Based on the data presented in Figure 8, several overarching characteristics of the axial swirl ratio distributions can be identified. A consistent trend is β approaching unity near both the upstream and downstream rotor surfaces, which aligns with the expected behaviour of the near-wall fluid achieving corotation with the discs. In the region between these surfaces, the profiles are marked by steep gradients close to the walls and a comparatively flat profile within the central core. This pattern is typical of rotating cavity flows, signifying the presence of thin Ekman boundary layers where disc-induced viscous effects are significant, and a central, largely inviscid core. Furthermore, an increase in R o leads to a noticeable elevation in the magnitude of the β across all monitored radial locations.
Under the most rotationally dominant condition of R o = 0.01 , the profile in Figure 8a reveals a zone of high swirl near the upstream disc, which is most pronounced in the low-radial region at r / r b = 0.3 . This corresponds to the upward deflection of the low-inlet jet that was previously observed in the streamline patterns of Figure 7a,e. The limited axial penetration of this inflow jet is captured in the swirl profile at r / r b = 0.3 , which shows a distinct minimum value at approximately z = 0.05   m. While the overall profiles for the 50 K and 10 K cases are very similar, the most discernible, albeit minor, difference between the two inlet temperature differentials also occurs in this low-radial region. When the R o increases to 0.02, the swirl ratio at a relative radius of r / r b = 0.3 initially oscillates around β = 1.0 near the upstream disc before settling to approximately β = 0.9 closer to the downstream disc, as shown in Figure 8b. The primary distinctions in the swirl ratio profiles between the two temperature differentials are observed in the higher-radial locations of r / r b =   0.7 and r / r b = 0.9. At these locations, the larger 50 K temperature differential results in elevated axial swirl ratios at specific points. Meanwhile, the axial swirl ratios at lower-radial locations of r / r b = 0.3 and r / r b = 0.5. In contrast, at the lower-radial locations of r / r b = 0.3 and r / r b = 0.5, the axial swirl ratio profiles exhibit negligible differences between the two temperature cases, resulting in nearly overlapping plots.
As the Rossby number increases to 0.04 shown in Figure 8c, fluctuations in the low-radial region of r / r b = 0.3 are further amplified. The primary differences between the inlet temperature differentials are confined to the mid-radial locations of r / r b = 0.5 and 0.7, where a higher Δ T I N results in an increased swirl ratio across nearly the entire axial length. This location corresponds to the position of the vortex in the lower recirculation zone, as shown previously in the streamline patterns of Figure 7c,g. Upon further increasing the Rossby number to 0.08, as illustrated in Figure 8d, the differences in the swirl ratio profiles for the two inlet temperature differentials become evident at all monitored radial locations within the cavity. A larger temperature differential Δ T I N = 50   K generally results in an elevated and more stable swirl ratio compared to the lower differential Δ T I N = 10   K .
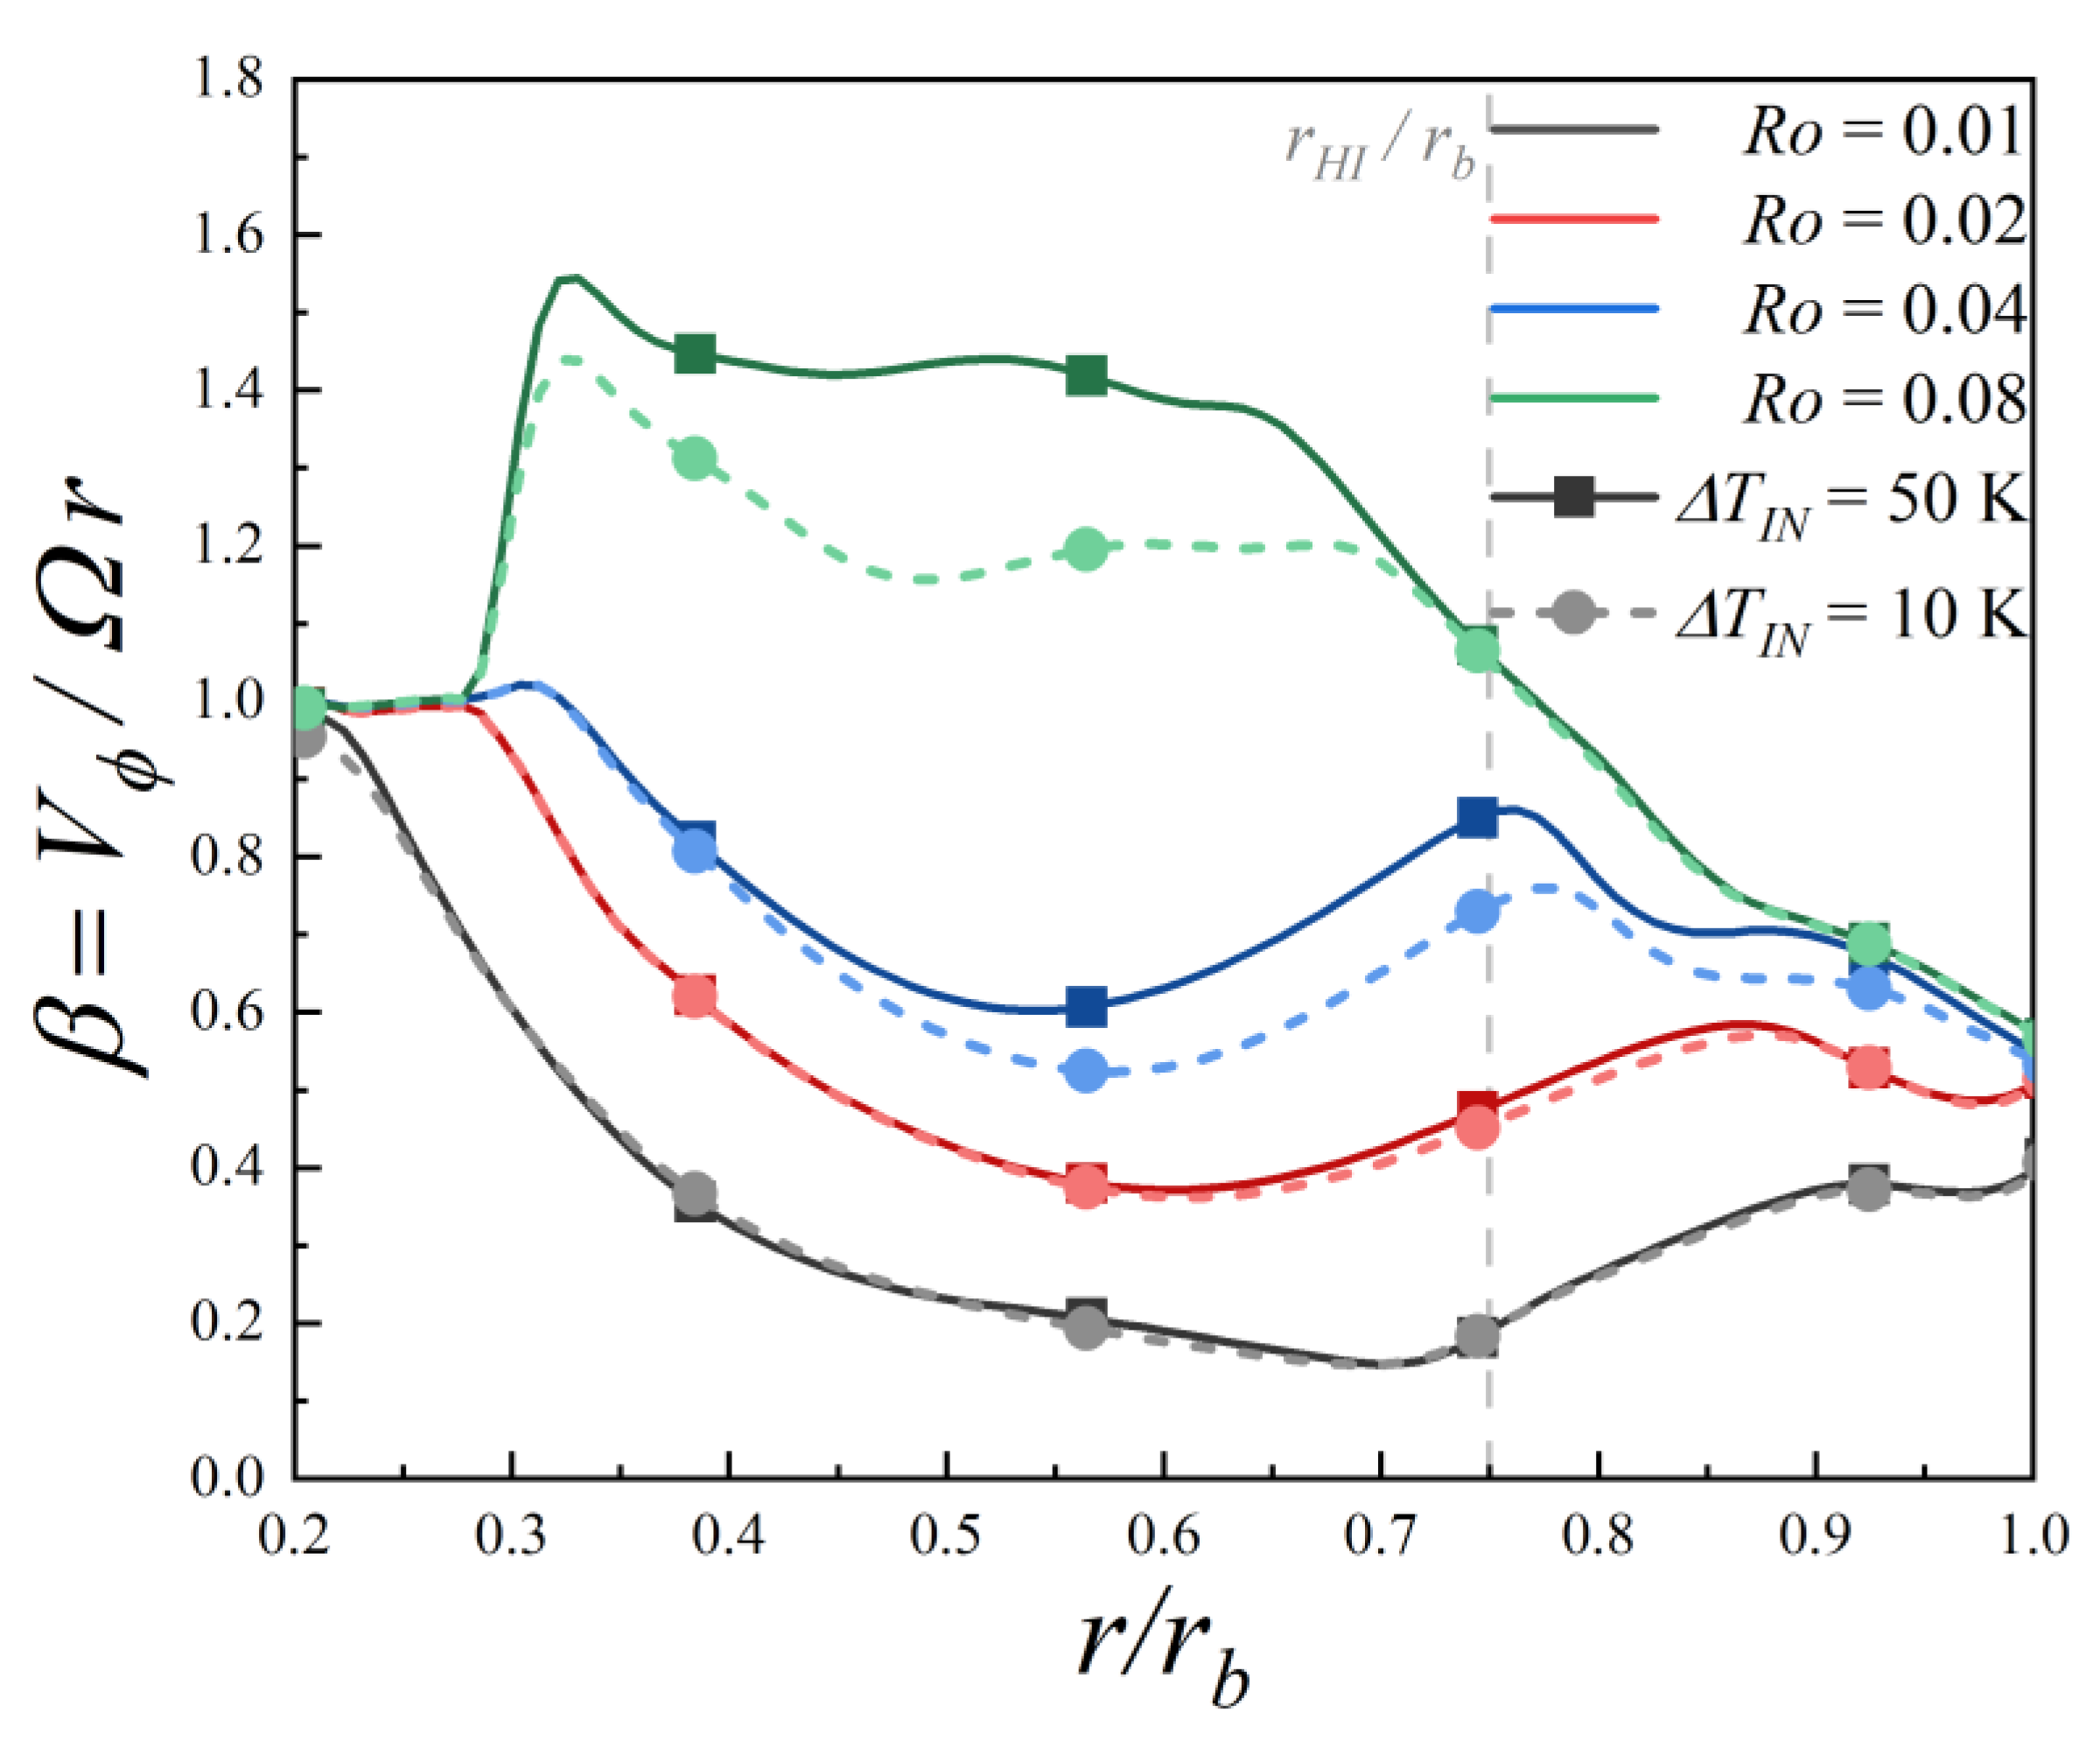
To supplement the analysis of axial profiles, the circumferentially averaged swirl ratio at the cavity’s midplane ( z = 0   m) is presented in Figure 9, illustrating the radial distributions of swirl ratio under various Rossby numbers. In the figure, a vertical dotted line indicates the radial location of the high inlet r H I / r b , serving as a reference point for flow interactions in the outer part of the cavity. Similar to Figure 8, the results for the 50 K inlet temperature differential are shown using darker lines with square markers, whereas the 10 K differential is represented by lighter lines with circular markers.
A clear trend is that the swirl ratio generally increases across the radius as the Rossby number increases. At the lowest Rossby number of R o = 0.01 , the profile is the lowest, and the impact of the inlet temperature differential is negligible. However, as R o increases, a higher temperature differential of Δ T I N = 50   K consistently results in a higher swirl ratio, an effect that becomes more significant at higher R o values. For instance, the maximum percentage difference between the swirl ratios for the two temperature differentials is 24.06% at R o = 0.08 , compared to 20.59% at R o = 0.04 and only 4.79% at R o = 0.02 . Moreover, for Rossby numbers of 0.02 and 0.04, a pronounced peak in the swirl ratio develops at a high-radial position ( r / r b 0.75 0.9 ). In contrast, the R o = 0.08 case exhibits a broad surge in swirl ratio across the cavity’s mid-section, where it remains above unity, unlike the dip seen at lower Rossby numbers.
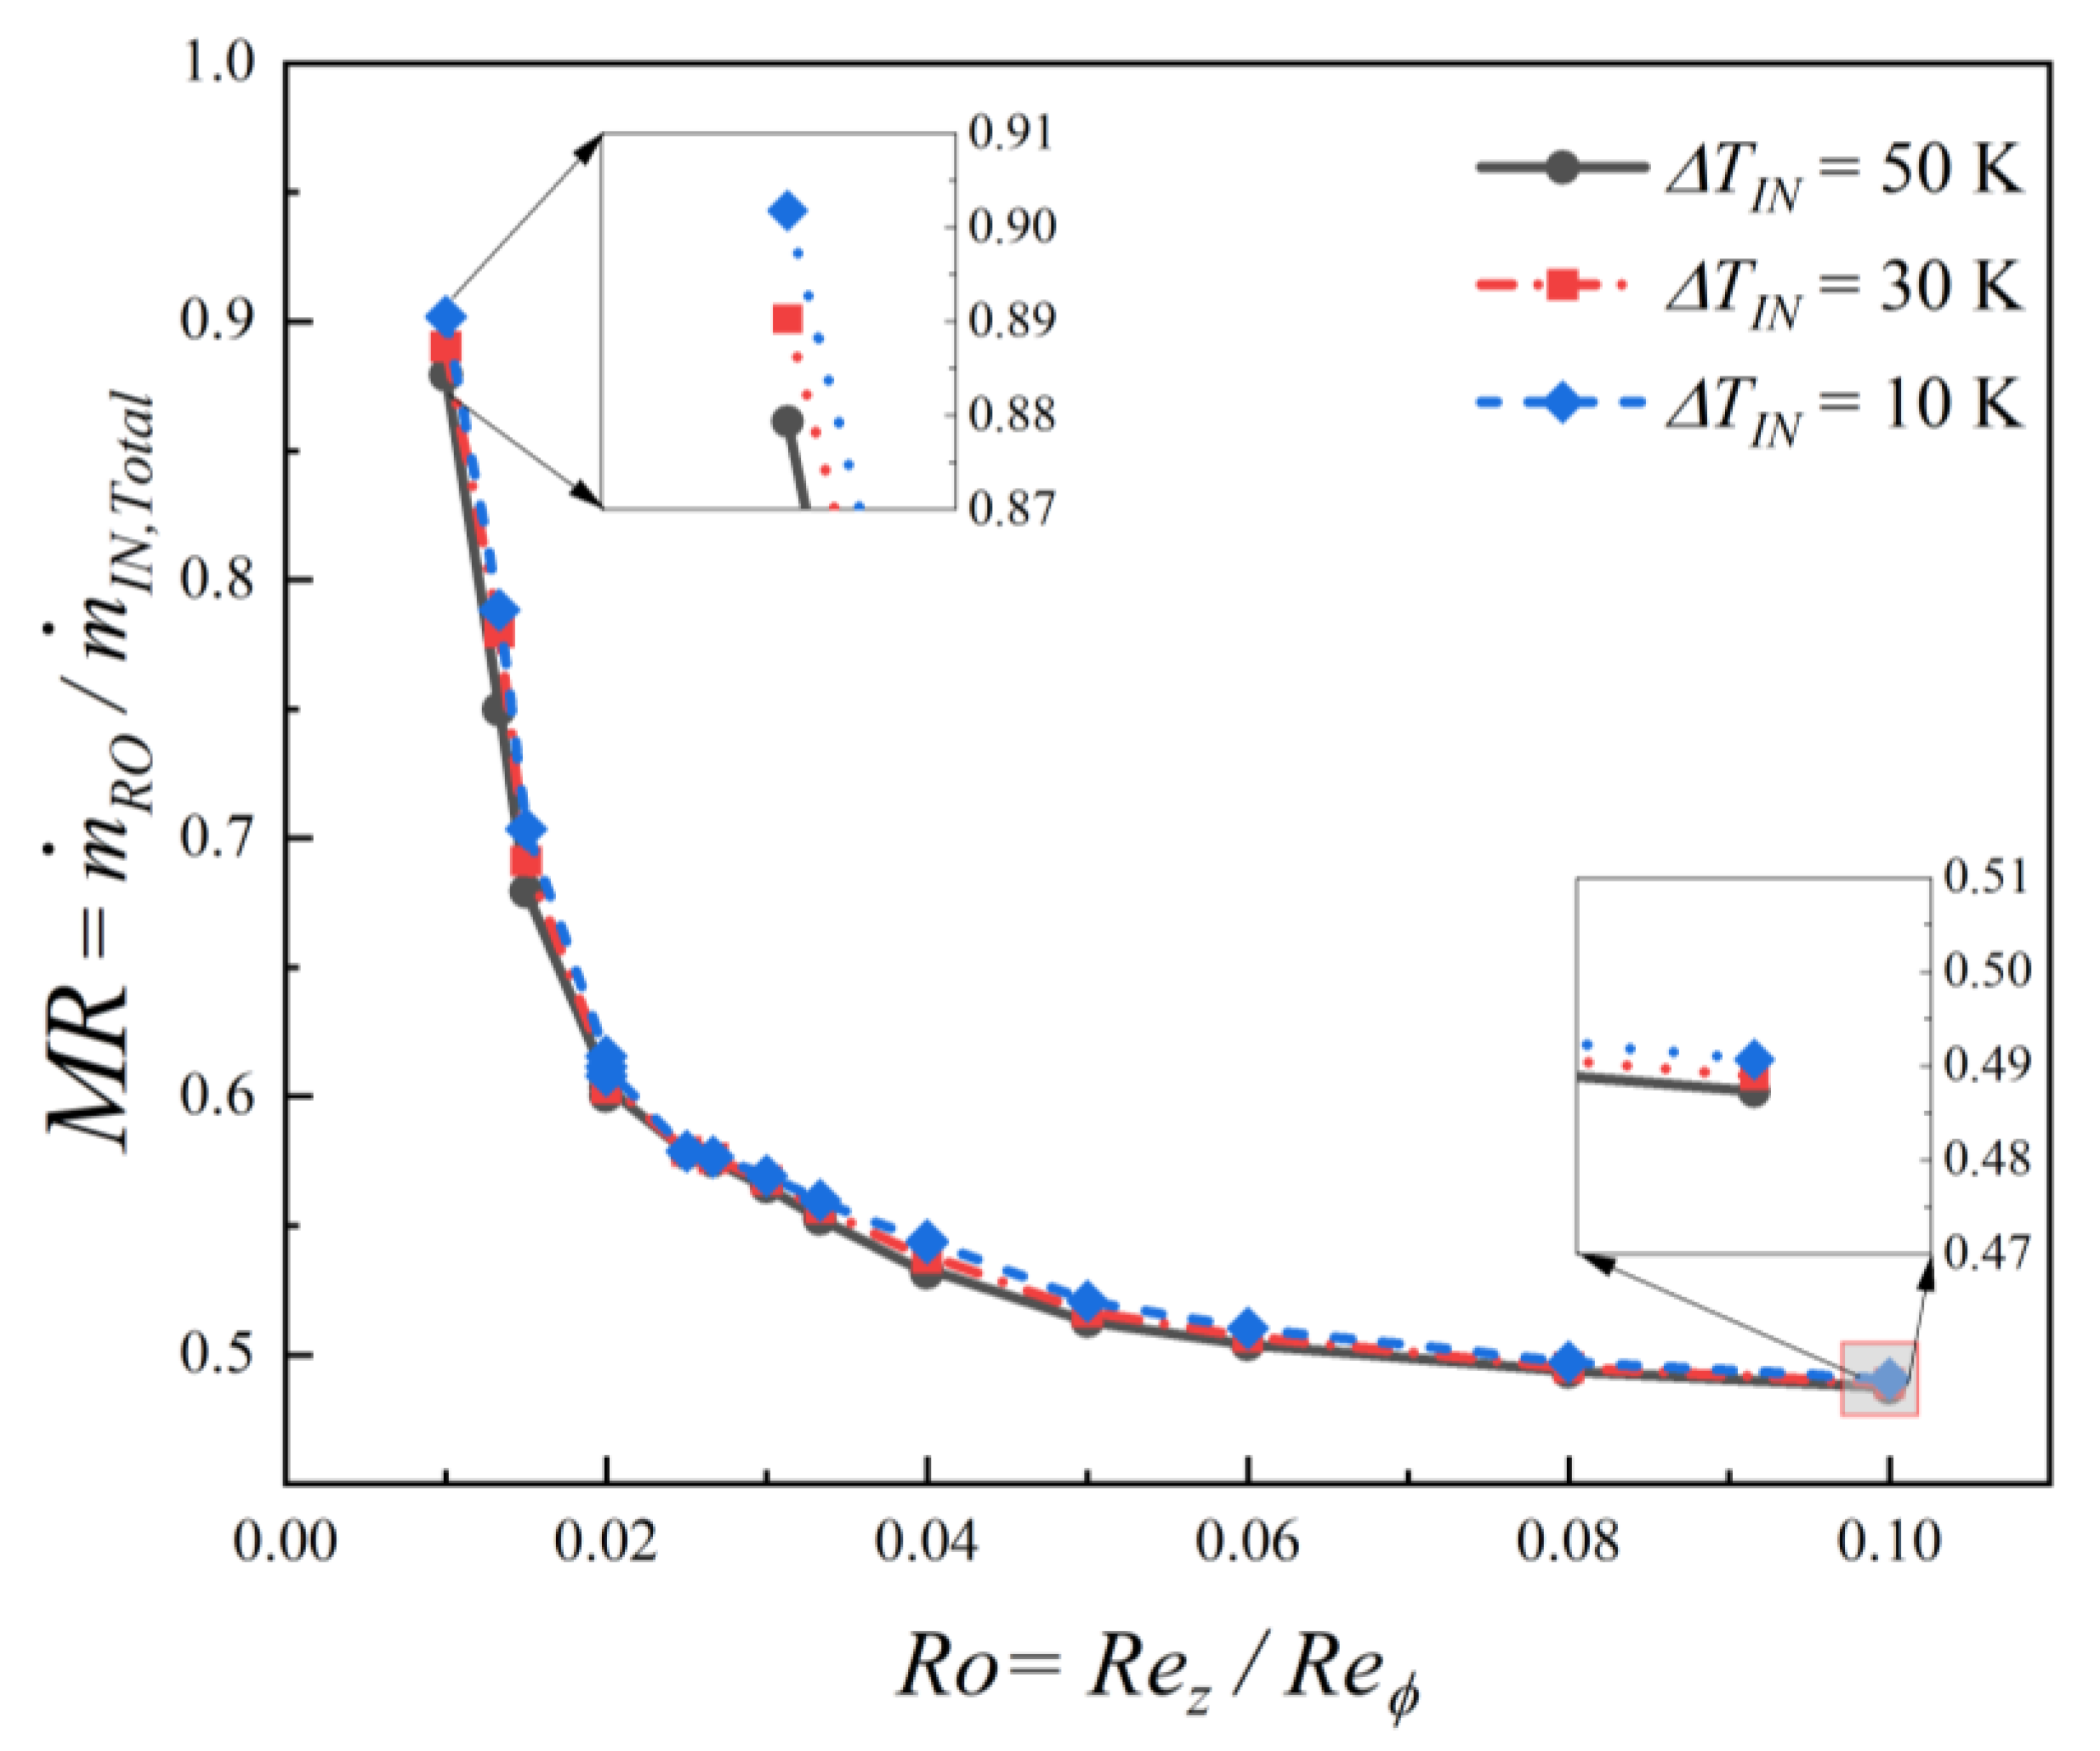
Figure 10 illustrates the relationship between the mass flow distribution that leaves the cavity via radial outlet as denoted by the mass flow ratio   M R , the Rossby number R o , and the inlet temperature differential Δ T I N . A dominant trend is observed where the M R decreases sharply as the Rossby number increases, falling from approximately 0.9 at R o = 0.01 to approximately 0.5 at R o = 0.10 . This signifies a fundamental shift in the flow distribution, where rotationally dominated conditions of low R o favour the radial outlet, while inertia-dominated conditions of high R o result in a more balanced split between the radial and axial outlets. which plateaus to approximately 0.5. In comparison, the inlet temperature differential plays a secondary role. A higher Δ T I N consistently results in a slightly lower M R through the radial outlet across the entire range of Rossby numbers tested. However, as highlighted by the magnified insets, this thermal effect is minor; the difference in M R between the different temperature cases is only 2.5% at R o = 0.01 and diminishes to 0.7% at R o = 0.10 .
In this section, it is revealed that Rossby number is the primary driver of flow characteristics within the multi-inlet, multi-outlet corotating-disc cavity and that the inlet temperature differential plays a secondary role. The overall flow topology, defined by radially stratified vortical zones, is largely dictated by the Rossby number. However, increasing the inlet temperature differential induces subtle changes, such as the formation of secondary vortices and more pronounced vortex overflow at higher Rossby numbers. This thermal influence is also evident in the swirl ratio, where a higher temperature differential consistently results in an elevated and more stable swirl, an effect that becomes more significant as the Rossby number increases. Consequently, these changes to the internal flow field affect the mass flow distribution. A higher inlet temperature differential consistently leads to a slight reduction in the mass flow ratio through the radial outlet across the entire range of Rossby numbers tested. However, this thermal effect on the mass flow split is minor.

3.2. Effect of Inlet Temperature Differential on Outlet Performance

Having established how inlet temperature differentials modify the governing vortex structures of the cavity in the preceding section, the focus now shifts to the consequences for the multi-outlet flow characteristics. The distribution of mass flow between the axial and radial outlets is intrinsically linked to the pressure field developed within the cavity, which is in turn influenced by the aerothermal interactions. Therefore, this analysis commences with a detailed investigation of the cavity pressure distribution, focusing on how it is altered by the varying inlet temperature differentials. Building upon this, the investigation then introduces discharge coefficients to quantitatively evaluate the performance of each outlet. The findings are systematically framed against the Rossby number to unify the results across the different operating conditions and clearly delineate the influence of the thermal inlet conditions.

3.2.1. Cavity Pressure Distributions

To analyze the pressure field, the static pressure P is normalized into a pressure coefficient C P , with the low-inlet static pressure P L I serving as the reference: C P = ( P P L I ) / ( 0.5 ρ Ω 2 r b 2 ) . Figure 11 shows the resulting C P contours on the cavity’s radial–axial midplane for Rossby numbers from 0.01 to 0.08 and inlet temperature differentials Δ T I N of 10 K and 50 K.
It is observed in all cases that the cavity pressure generally exhibits a radial pressure gradient. The pressure consistently increases from the inner radius toward the outer shroud, causing the highest pressure coefficients to be located at the cavity’s outer radius. The magnitude of this pressure rise is also strongly dependent on the Rossby number; as R o increases, the overall level of C P within the cavity rises significantly. In addition, the increase in R o is accompanied by the formation of a localized high-pressure region on the downstream disc for R o 0.02 . This zone is caused by the impingement of the low-inlet jet, marking a stagnation point at the base of the lower recirculation zone. The intensity of this high-pressure stagnation zone increases as the Rossby number rises. However, the pressure at this low-radial location is lower than the maximum pressure observed near the outer shroud.
Notably, a comparison between the high 50 K and low 10 K inlet temperature differential cases for the given low Rossby number reveals that the thermal conditions have a negligible effect on the global static pressure distribution, with the contour plots appearing nearly identical. However, at higher Rossby numbers of R o 0.04 , the localized high-pressure region becomes apparent near the high-inlet jet, which is likely due to flow stagnation effects of the high-inlet jet. In the outer radial zone, the C P is consistently greater under the higher Δ T I N conditions of 50 K.
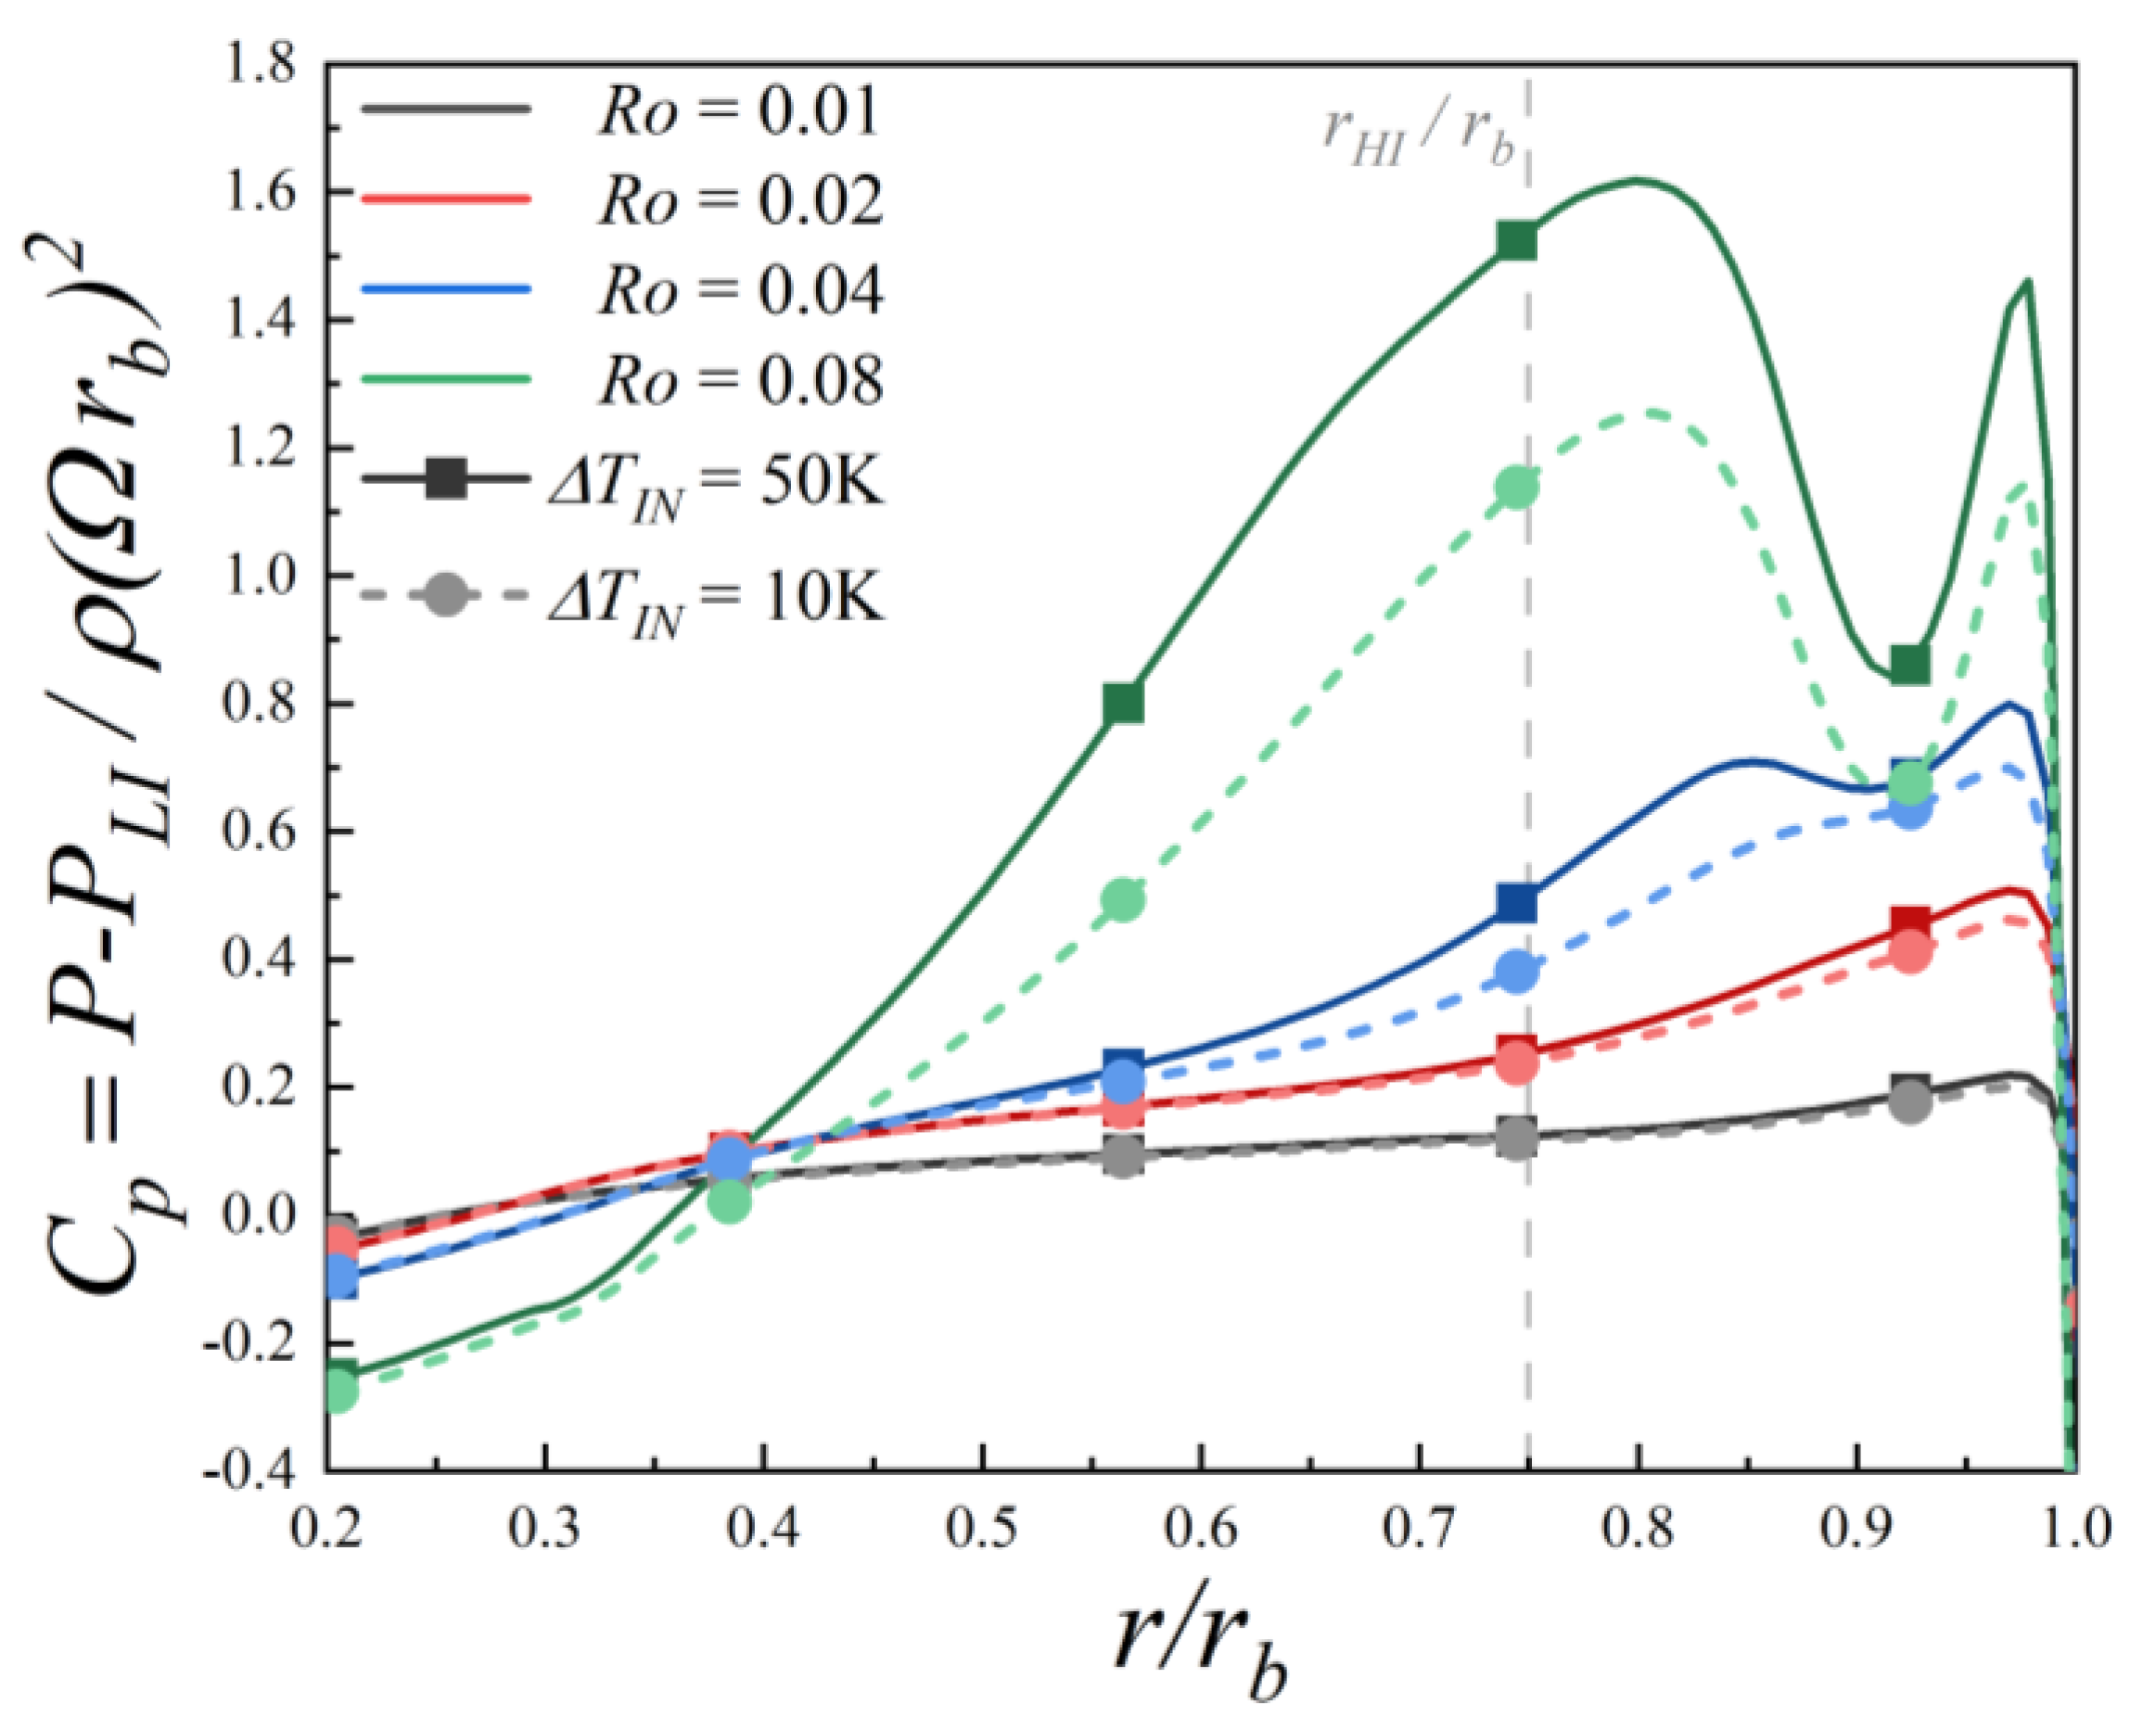
To provide a quantitative perspective on the pressure variations observed in Figure 11, the circumferentially averaged pressure coefficient C P , is plotted at the cavity’s axial midplane ( z = 0   m) in Figure 12. This figure illustrates the radial pressure distribution for Rossby numbers ranging from 0.01 to 0.08, comparing the effects of 10 K and 50 K inlet temperature differentials. The radial location of the high inlet ( r H I / r b ) is marked with a vertical dotted line, offering a reference for interactions within the cavity’s outer region.
A dominant trend across all cases is the general increase in C P with radius. The magnitude of this pressure rise is strongly dependent on the Rossby number; as Ro increases, the overall pressure level within the cavity is significantly elevated. The influence of the inlet temperature differential Δ T I N , is more nuanced. At the lowest Rossby number ( R o = 0.01 ), the thermal effect is negligible, with the profiles for 10 K and 50 K being nearly identical. However, as the Rossby number increases, the impact of a higher Δ T I N becomes progressively more pronounced. For R o 0.02 , the 50 K case consistently exhibits higher pressure coefficient than the 10 K case, a difference that is amplified in the outer half of the cavity. This is particularly evident for the R o = 0.08 case, where the higher temperature differential leads to a substantially larger pressure peak. Specifically, at the radial location of the high inlet ( r H I / r b ) , the percentage difference in C P between the two temperature differential cases increases from 5.74% at R o = 0.02 and 25.22% at R o = 0.04 , to a maximum of 28.26% at R o = 0.08 . This highlights how thermal effects can augment the localized pressure rise caused by the high-inlet jet’s stagnation.
This phenomenon can be explained by the change in density due to temperature. The hotter fluid of the high-inlet jet in the higher Δ T I N case is less dense. Under a constant mass flow rate at the inlets, the less dense hotter air enters the cavity at a higher velocity, giving the high-inlet jet greater kinetic energy and dynamic. When this jet impinges upon the slower-moving fluid in the cavity and stagnates, more of its kinetic energy is converted into static pressure, resulting in the more significant localized pressure peak observed.
The observed radial pressure gradient, which increases with the Rossby number, is consistent with the fundamental principles of rotating flows established by Owen et al. [2] and numerically validated by Chew et al. [3]. However, our findings expand on this by demonstrating how the stagnation effects from multiple inlet jets, particularly the high-inlet jet, superimpose a localized pressure peak on top of this centrifugal field, a feature not present in simpler source–sink models.

3.2.2. Discharge Coefficient of the Different Outlets

To quantitatively assess how the pressure fields analyzed in the preceding section govern the performance of the cavity’s two exits, the discharge characteristics of the axial and radial outlets will now be evaluated for different Δ T I N . For this purpose, a discharge coefficient C d is established as a key performance metric for each outlet path, as expressed in Equation (10). This dimensionless coefficient quantifies the efficiency of an outlet by expressing the ratio of the actual mass flow rate m ˙ a c t u a l predicted by the simulation to the theoretical mass flow rate m ˙ t h e o r e t i c a l that would occur under ideal, frictionless conditions. The subsequent analysis will focus on how the discharge coefficients for the axial and radial outlets respond to changes in the governing flow regime, dictated by the Rossby number, and particularly, how they are influenced by the different inlet temperature differential Δ T I N .
C d = m ˙ a c t u a l / m ˙ t h e o r e t i c a l   ,
To establish a baseline for evaluating outlet efficiency, the theoretical mass flow rate for each exit is determined by assuming an ideal, frictionless flow. In this idealized scenario, the potential energy, represented by the pressure drop across the outlet, is assumed to be entirely converted into the kinetic energy of the exiting fluid. This allows for the application of Bernoulli’s principle, where the theoretical mass flow rate can be calculated directly from the pressure differential as shown:
m ˙ t h e o r e t i c a l , R O = A R O 2 ρ Δ P R O ,
The driving potential for the mass flow through the radial outlet is the pressure difference Δ P R O , defined as the variance between the pressure at the shroud P b and the radial outlet back pressure P R O . The analysis in the preceding section on cavity pressure distributions revealed that P b is not merely a function of radius but is determined by the superposition of two key phenomena: the global pressure increase due to centrifugal forces and the localized stagnation pressure resulting from the impingement of the high-inlet jet. To account for these interactions, the shroud pressure P b is modelled by combining the mass-weighted average total pressure at the high-inlet boundary P T , H I , which represents the stagnation component, with the centrifugally induced pressure gain calculated relative to the low-inlet conditions. P b is presented as
P b = P T , H I + P L I + 1 2 ρ Ω 2 ( r b 2 r L I 2 ) ,
A comparable methodology based on ideal-flow principles is applied to determine the theoretical mass flow through the axial outlet. However, defining the appropriate pressure differential Δ P A O that drives the axial flow requires careful consideration of the internal flow dynamics influenced by the inlet conditions. As established from the pressure contour analysis in Figure 11, the direct impingement of the low-inlet jet onto the downstream disc results in a distinct zone of elevated stagnation pressure. This localized high pressure is considered the primary driving potential for the fluid exiting through the axial path. To model this, the mass-weighted average total pressure at the low-inlet boundary P T , L I is selected as the upstream reference pressure, assuming negligible losses before impingement. Consequently, the theoretical driving pressure differential Δ P A O is formulated as the difference between the inlet total pressure P T , L I and the static back pressure at the axial outlet P A O . This relationship provides the basis for calculating the theoretical axial mass flow rate m ˙ t h e o r e t i c a l , A O as shown:
m ˙ t h e o r e t i c a l , A O = A A O 2 ρ ( P T , L I P A O ) ,
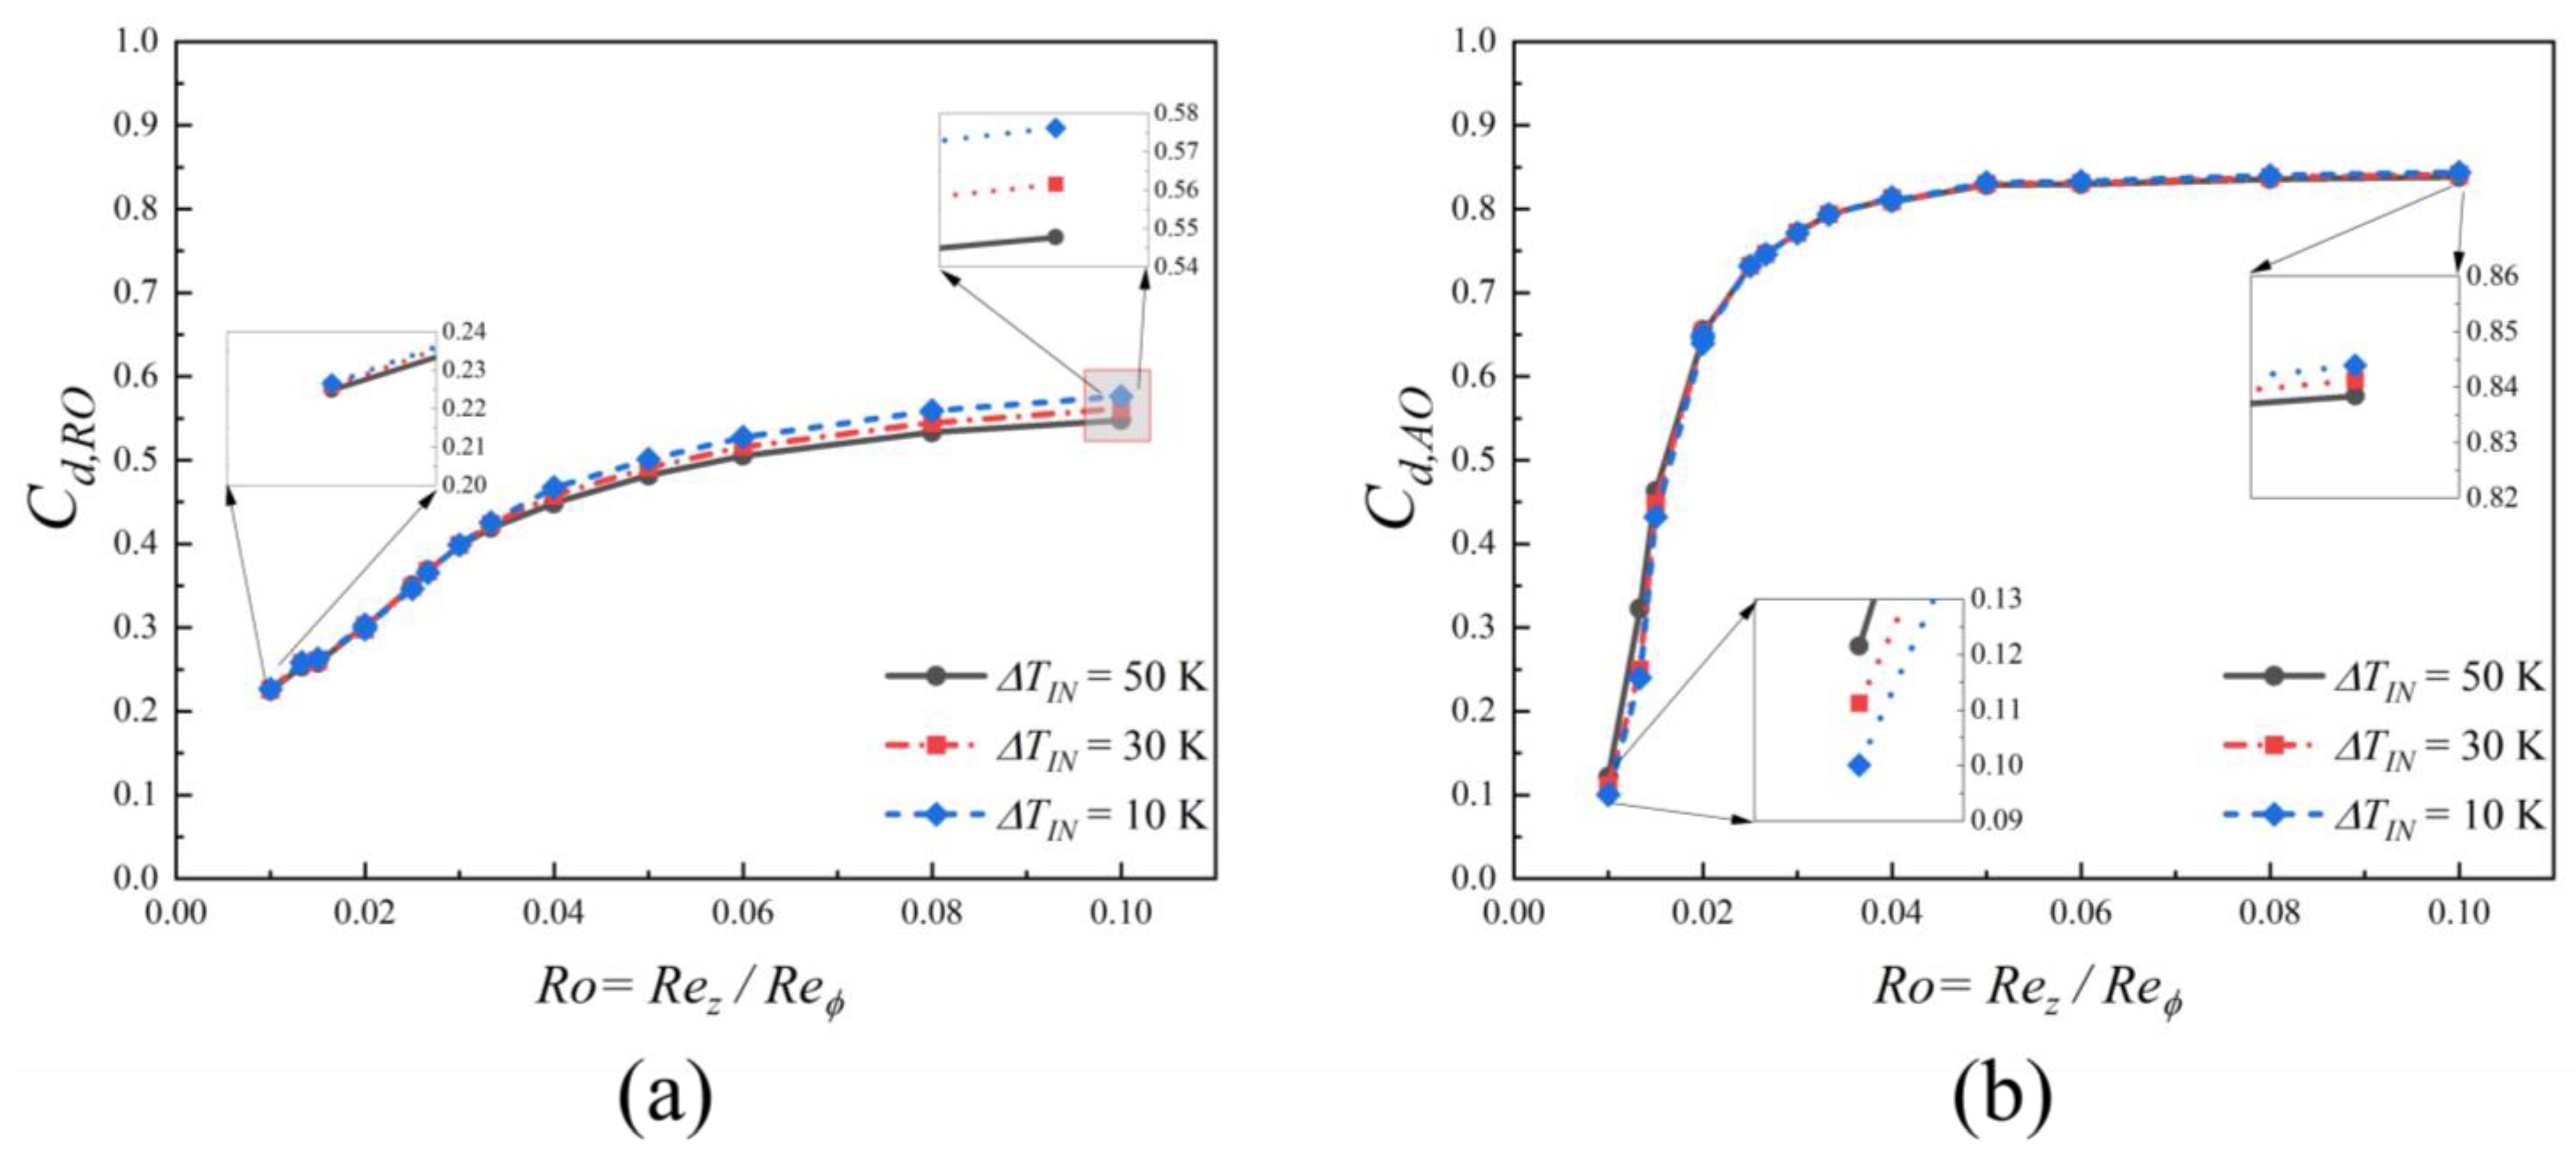
Figure 13 illustrates the discharge performance for both the radial outlet C d , R O and the axial outlet C d , A O as a function of the Rossby number for various inlet temperature differentials. As shown in Figure 13a,b, both coefficients follow an upward trend with an increasing Rossby number. In general, the effects of the inlet temperature differentials on the discharge coefficients are minor, as the data lines for the different Δ T I N conditions largely overlap.
According to Figure 13a, the introduction of an inlet temperature differential Δ T I N does not alter the fundamental relationship between the C d , R O and the R o . As shown in the figure, C d , R O maintains its positive correlation with R o across all thermal conditions, including the subtle change in gradient around Ro = 0.04. The primary effect of the temperature differential is a minor reduction in the radial outlet discharge coefficient. At the highest tested Rossby number of R o   =   0.1 , the C d , R O decreased by nearly 5% as the inlet temperature differential increased from 10 K to 50 K.
Conversely, C d , A O demonstrates a different behaviour that is highly dependent on a distinct flow transition, as illustrated in Figure 13b. Rather than the gradual increase seen for the radial outlet, C d , A O rises sharply around R o   =   0.02 . This sudden improvement corresponds to the point where the inflow’s inertia becomes strong enough to overcome the dominant rotational forces. As seen in the transition from Figure 7a to Figure 7b, this allows a direct through-flow path to form between the low inlet and the axial outlet. After this direct path is established, the efficiency of the axial outlet largely saturates. Consequently, the growth rate of C d , A O slows considerably, eventually plateauing at a value of about 0.85 for Rossby numbers above 0.04. Similar to the radial outlet, the inlet temperature differential has a minimal impact on the axial outlet discharge coefficient across the range of conditions tested. However, the magnified insets reveal that at a low Rossby number of R o   =   0.01 , increasing the inlet temperature differential from 10 K to 50 K causes the C d , A O to increase by 21%, whereas at the highest Rossby number of R o   =   0.1 , the same change causes the C d , A O to decrease by 0.6%.
In summary, the inlet temperature differential has a tangible but secondary effect on the outlet characteristics compared to the dominant influence of the Rossby number, similar to the previous section. A higher temperature differential amplifies the pressure within the cavity, particularly in the outer radial regions and at higher Rossby numbers. This elevated pressure slightly reduces the discharge coefficient of the radial outlet, especially at higher Rossby numbers, while its effect on the axial outlet’s discharge coefficient is minimal and varies with the flow regime.

3.3. Cavity Thermal Field and Outlet Thermal Characteristics

To analyze the thermal field within the cavity, the temperature is normalized into a dimensionless form T′, defined as T = ( T T L I ) / ( T H I T L I ) . This allows for a clear comparison of the thermal distribution across different operating conditions. Figure 14 presents the contours of this dimensionless temperature on the radial–axial midplane for Rossby numbers ranging from 0.01 to 0.08, all under a constant inlet temperature differential of Δ T I N = 50 K. A consistent feature across all cases is the clear thermal stratification, with the cooler fluid from the low inlet generally occupying the lower and inner regions of the cavity, while the hotter fluid from the high inlet dominates the upper and outer regions.
As R o increases, a significant change in the thermal distribution is observed. At the lowest Rossby number of R o = 0.01 , the hot fluid from the high inlet is largely contained in the upper-radial region near the upstream disc, with minimal mixing into the lower cavity, as shown in Figure 14a. As Ro increases to 0.02 and 0.04, the increased inertial influence causes the hot jet to penetrate deeper into the cavity, pushing the thermal interface further down and leading to more significant mixing between the hot and cold streams. Additionally, the primary vortex denoted by dark blue, which originates from the cold low-inlet jet impacting the downstream disc, shrinks in its radial dimension, when comparing between Figure 14b and Figure 14c. At the highest Rossby number of R o = 0.08 , Figure 14d shows that the hot fluid extends across almost the entire upper half of the cavity and begins to migrate towards the lower region, indicating substantial thermal mixing driven by the strong inflow momentum of the high-inlet jet.
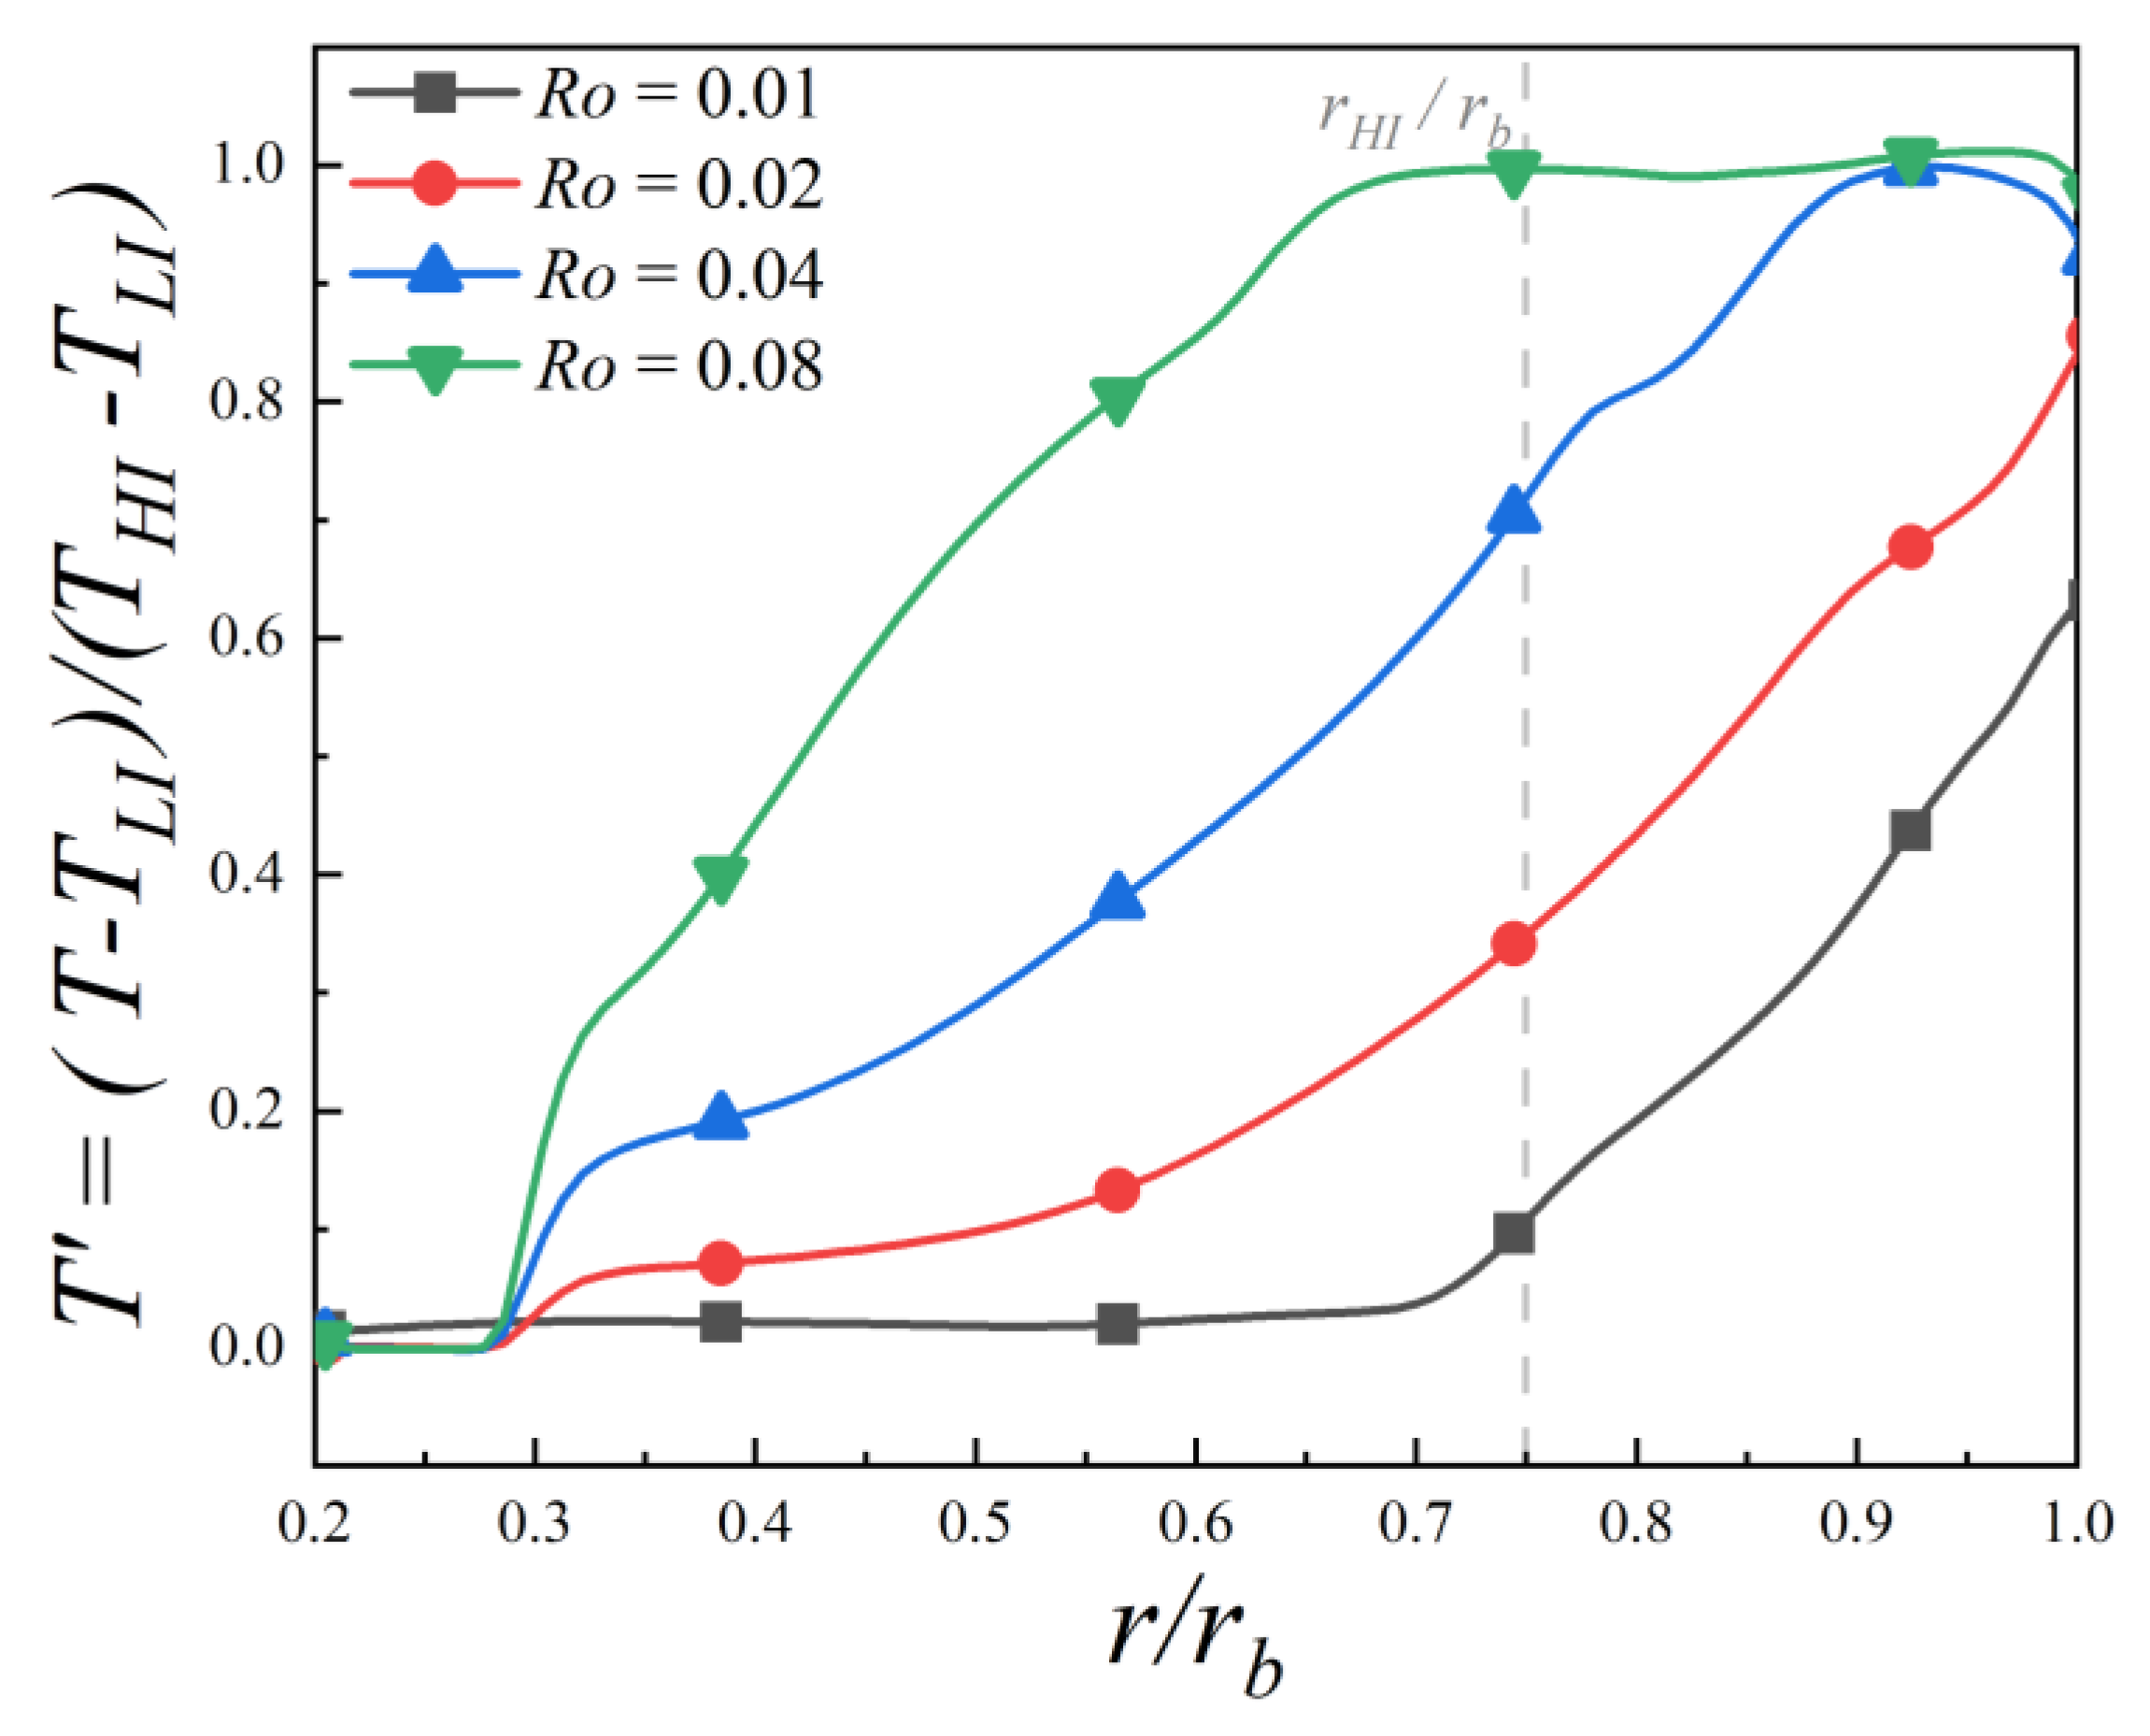
To further quantify the thermal distribution shown in the preceding contour plots, Figure 15 presents the circumferentially averaged radial profiles of the dimensionless temperature T at the cavity’s axial midplane. In general, the data illustrates that as the Rossby number increases, the dimensionless temperature rises across the entire radial span of the cavity, indicating that the hot fluid from the high inlet penetrates more effectively into the lower-radial region.
The radial temperature profiles at the cavity midplane reveal that thermal mixing is strongly dictated by the Rossby number. In the rotation-dominated regime at R o   =   0.01 , the hot fluid from the high inlet is confined to the outer radii ( r / r b   >   0.75 ), leaving the majority of the cavity core unheated ( T     0 ). As inertial forces become more significant at R o   =   0.02 , the hot jet penetrates further inward, initiating a temperature rise from a much smaller radius of r / r b     0.3 . This trend intensifies at R o   =   0.04 , which exhibits a steeper temperature gradient and higher overall temperatures across the profile. Finally, at the inertia-dominated condition of R o   =   0.08 , the hot fluid fully saturates the upper regions of the cavity, with T plateauing near unity for r / r b   >   0.7 . This indicates a substantial overflow of hot air into the lower cavity.
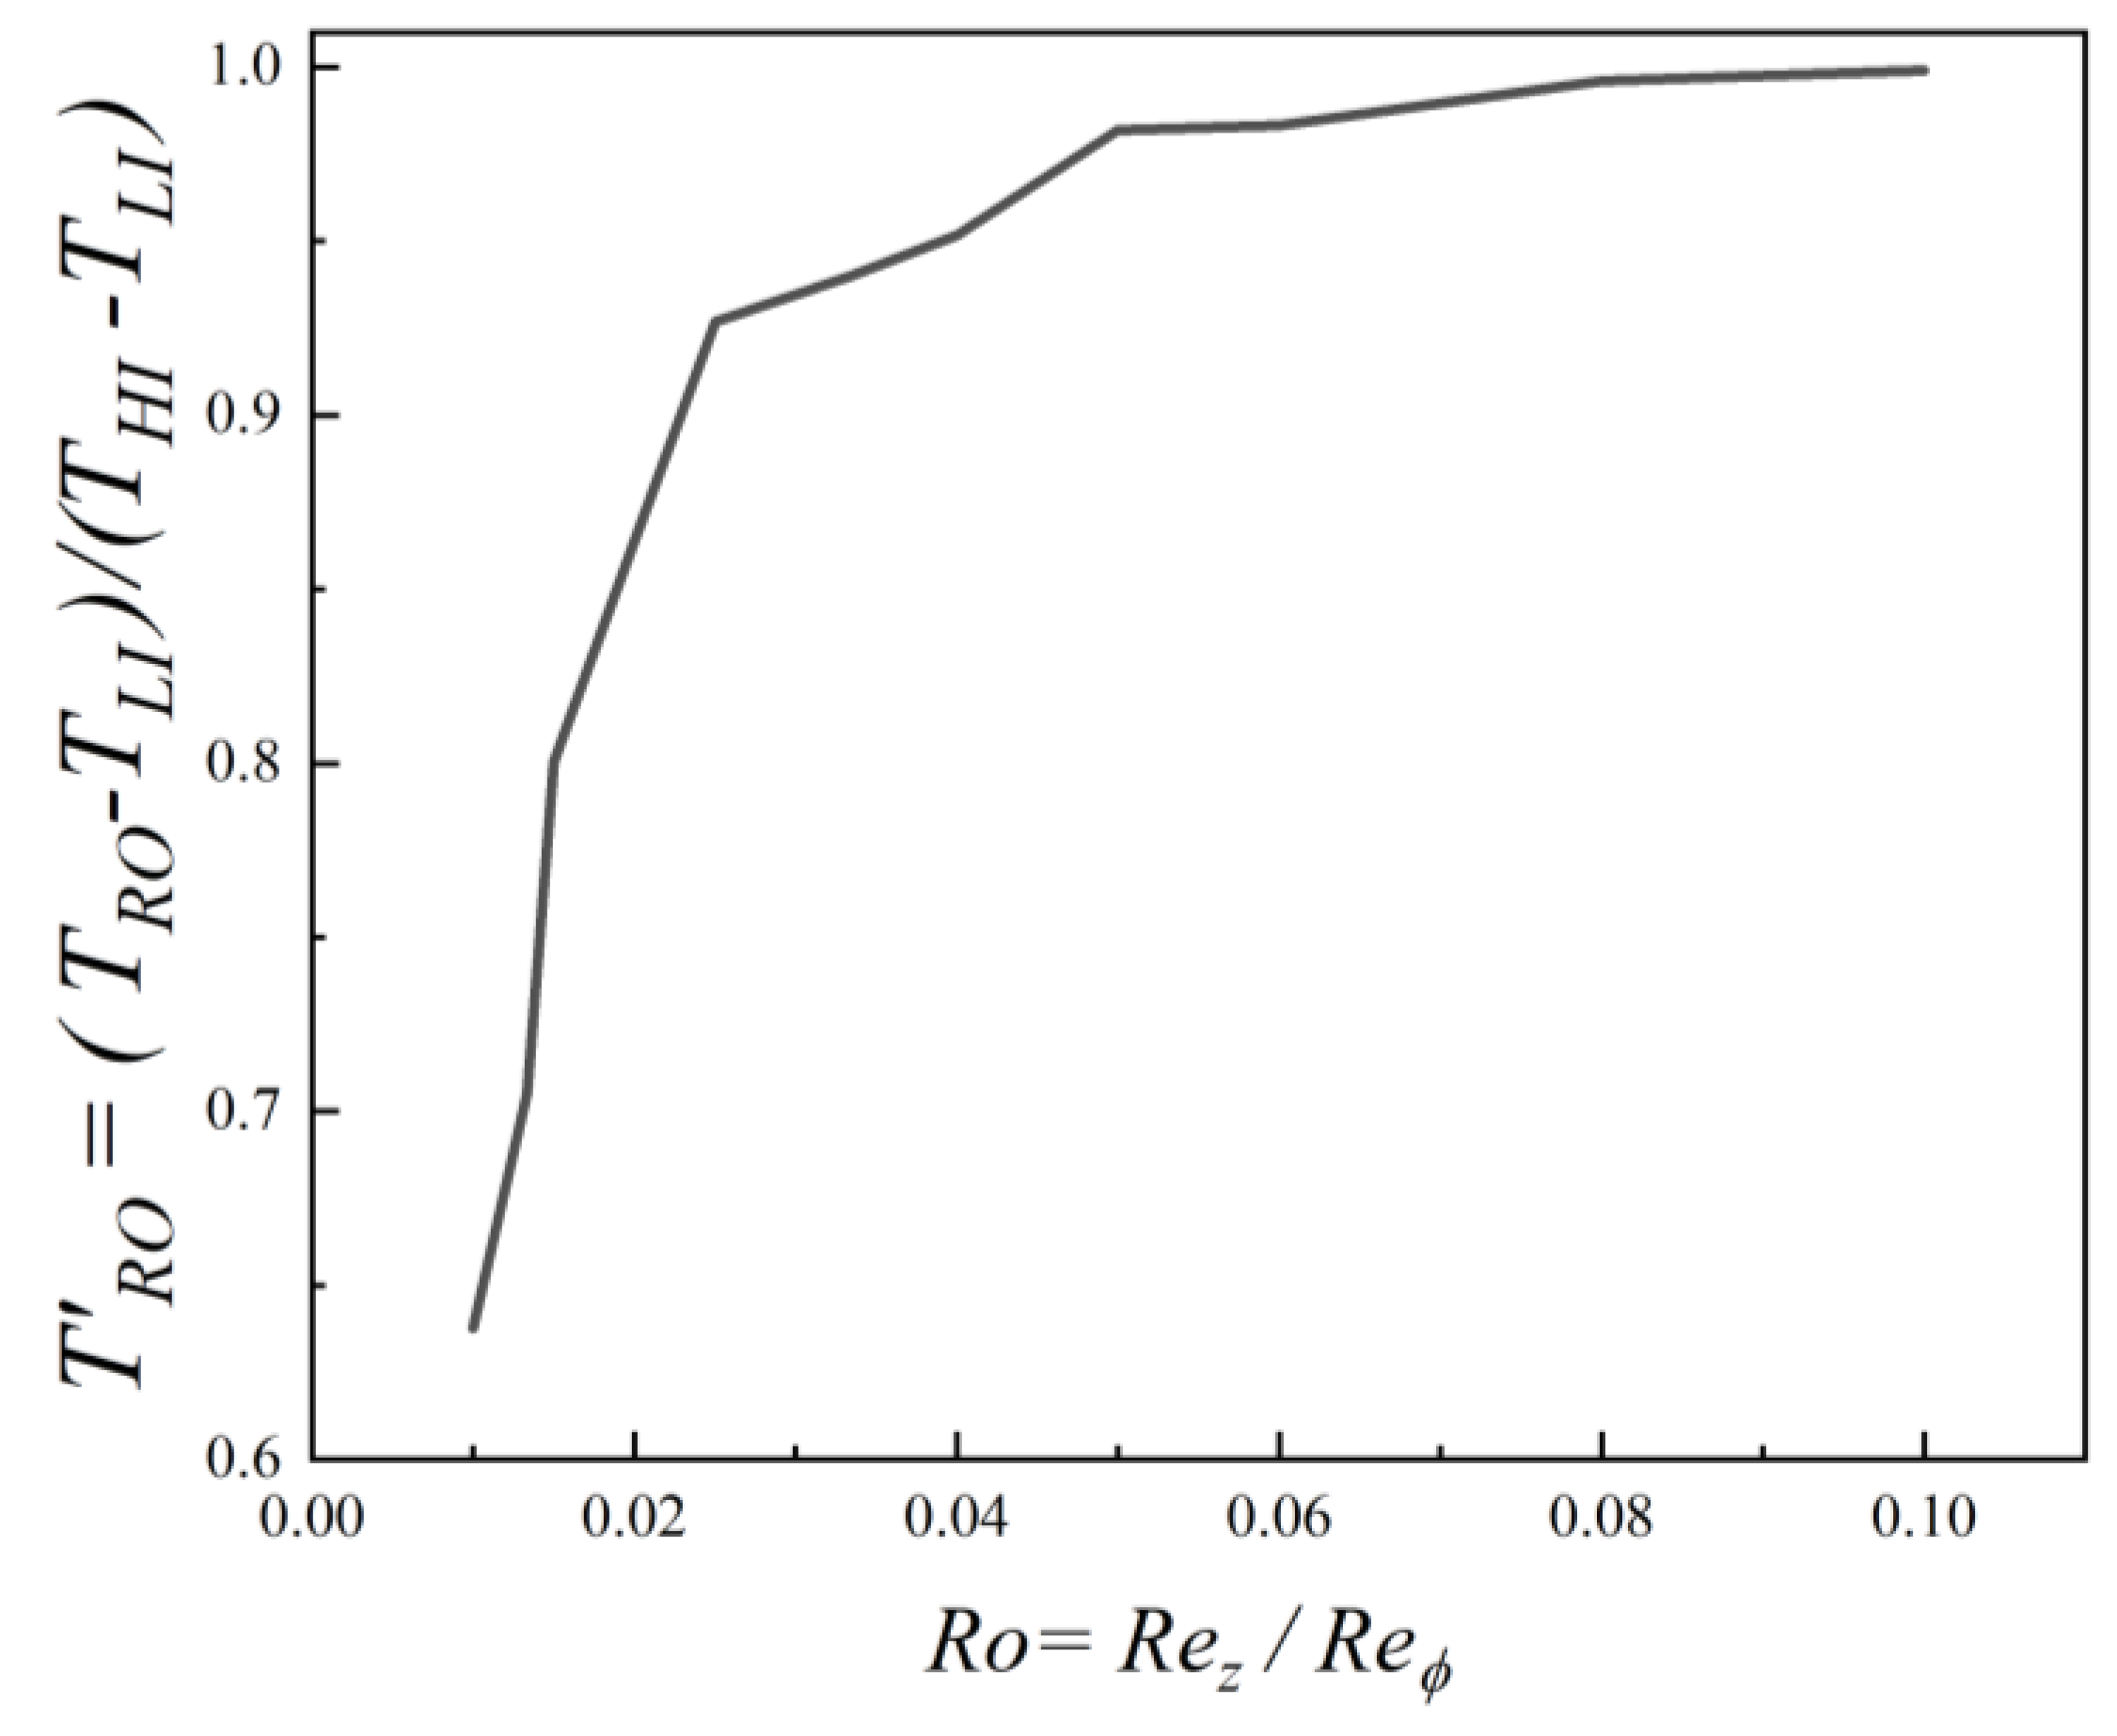
To quantify the impact of these internal thermal field changes on the outlet flow, Figure 16 plots the dimensionless temperature of the radial outlet T R O , as a function of the Rossby number. The corresponding dimensionless temperature for the axial outlet T A O is not shown, as it remains at approximately zero across the entire range of Rossby numbers investigated. This indicates that the outflow through the axial path is composed almost entirely of the unheated fluid from the low inlet.
The behaviour of the radial outlet temperature T R O is directly linked to the thermal mixing patterns observed in Figure 14 and Figure 15. The temperature at the radial outlet undergoes a sharp increase as the Rossby number rises from 0.01 to approximately 0.05, after which it begins to plateau. At low Rossby numbers of R o = 0.01 , the rotation-dominated flow confines the hot fluid from the high inlet to the upper-radial region, which results in incomplete mixing. The fluid exiting the radial outlet is therefore a combination of hot and cooler cavity fluid, leading to a dimensionless temperature significantly below 1. As the Rossby number increases to the range of R o = 0.02 0.04 , the greater inertial influence causes the hot jet from the high-inlet to penetrate deeper into the cavity and enhance thermal mixing. This progressively raises the temperature of the fluid in the upper cavity, causing the sharp rise in T R O seen in Figure 16. At high Rossby numbers of R o 0.05 , the hot fluid from the high-inlet jet extends across almost the entire upper half of the cavity, saturating the outer regions with high-temperature fluid where T 1 . Consequently, the fluid exiting the radial outlet consists almost entirely of unmixed, hot fluid from the high inlet, causing the T R O to plateau at a value approaching unity.
In summary, the thermal characteristics of the cavity are highly dependent on the Rossby number, which governs the extent of thermal mixing between the hot and cold inlet streams. At low Rossby numbers, the flow is rotationally dominated, leading to clear thermal stratification where the cooler fluid occupies the lower and inner regions, and the hotter fluid is contained in the upper and outer areas. As the Rossby number increases, enhanced inertial forces drive deeper penetration of the hot jet, leading to significant thermal mixing and a more uniform temperature distribution in the cavity’s upper half. Consequently, the temperature of the fluid exiting the radial outlet rises sharply with the Rossby number, eventually plateauing as it becomes saturated with unmixed hot fluid from the high inlet. In contrast, the axial outlet temperature remains consistently cool, indicating it is fed almost entirely by the unheated low-inlet stream across all tested conditions.
4. Conclusions

This study presents an experimentally validated numerical investigation into the effects of inlet temperature differentials on the aerothermal performance and mass flow distribution in a multi-inlet, multi-outlet corotating-disc cavity. The analysis covers a range of operating conditions, with Rossby numbers from 0.01 to 0.10, by varying the rotational Reynolds number R e ϕ from 0.5 × 10 7 to 2.0 × 10 7 and the axial Reynolds number R e z from 2 × 10 5 to 5 × 10 5 . To assess thermal effects, inlet temperature differentials Δ T I N of 10 K, 30 K, and 50 K were applied. The conclusions are summarized as follows:
  • The Rossby number is the primary factor determining the cavity’s flow structure, which is characterized by radially stratified vortical zones. The inlet temperature differential has a secondary influence; a higher differential can lead to the formation of secondary vortices and increase vortex overflow at high Rossby numbers. Consequently, a higher temperature differential of 50 K causes a small but consistent reduction in the mass flow ratio through the radial outlet, with the highest percentage difference being 2.5% at the smallest Rossby number of 0.01.
  • A higher inlet temperature differential increases the pressure within the cavity, an effect that is most significant in the outer radial regions and at higher Rossby numbers. This elevated pressure leads to a slight reduction in the discharge coefficient of the radial outlet, which decreased by nearly 5% at the highest tested Rossby number of Ro = 0.1 as the differential increased from 10 K to 50 K. Conversely, the effect on the axial outlet’s discharge coefficient is minimal and varies depending on the flow regime.
  • The Rossby number governs the thermal mixing between the hot and cold inlet streams. At low Rossby numbers, the flow is thermally stratified due to rotational dominance. As the Rossby number increases, inertial forces enhance mixing, causing the temperature at the radial outlet to rise sharply and then plateau as it becomes saturated with hot fluid from the high inlet. The axial outlet’s temperature remains consistently cool across all conditions, indicating it is supplied almost entirely by the unheated low-inlet inflow jet.
While density was treated as variable, other properties like dynamic viscosity and thermal conductivity were held constant. Building on these limitations, future investigations should incorporate temperature-dependent viscosity and conductivity to investigate the combined effects of varying properties on the flow field. To further expand on the current study, future works can explore larger temperature differentials to determine if thermal effects become a primary driver of the cavity’s flow characteristics.
Overall, this investigation offers valuable insights into how thermal effects interact with dominant rotational and inertial forces to influence flow distribution and thermal efficiency in rotating cavities of secondary air systems. For the design engineer and researcher, the quantification of how a 50 K temperature differential can alter the mass flow by up to 2.5% and the radial outlet discharge coefficient by nearly 5% provides specific margins that can be used to refine cooling models.

Author Contributions

Conceptualization, C.J.C.C., X.L., and J.R.; methodology, C.J.C.C.; formal analysis, C.J.C.C.; investigation, C.J.C.C.; writing—original draft preparation, C.J.C.C.; writing—review and editing, C.J.C.C., X.L., and J.R.; visualization, C.J.C.C.; supervision, X.L. and J.R.; project administration, X.L. and J.R.; funding acquisition, X.L. and J.R. All authors have read and agreed to the published version of the manuscript.

Funding

The authors would like to acknowledge the support from the National Science and Technology Major Project (Y2022-III-0003-0012) for providing the invaluable resources for this study.

Data Availability Statement

The data presented in this study are not readily available because the data are part of an ongoing study. Requests to access the dataset should be directed to the corresponding author.

Conflicts of Interest

No potential conflicts of interest were reported by the authors.

Abbreviations

The following abbreviations are used in this manuscript:
AOAxial Outlet
CFDComputational Fluid Dynamics
HIHigh Inlet
HPHigh Pressure
LESLarge Eddy Simulation
LILow Inlet
RANSReynolds-Averaged Navier–Stokes
RSMReynolds Stress Model
RORadial Outlet
SASpalart–Allmaras
SASSecondary Air Systems
SSTShear Stress Transport

References

  1. Hide, R. On Source-Sink Flows in a Rotating Fluid. J. Fluid Mech. 1968, 32, 737–764. [Google Scholar] [CrossRef]
  2. Owen, J.M.; Pincombe, J.R.; Rogers, R.H. Source–Sink Flow Inside a Rotating Cylindrical Cavity. J. Fluid Mech. 1985, 155, 233–265. [Google Scholar] [CrossRef]
  3. Chew, J.W.; Owen, J.M.; Pincombe, J.R. Numerical Predictions for Laminar Source-Sink Flow in a Rotating Cylindrical Cavity. J. Fluid Mech. 1984, 143, 451–466. [Google Scholar] [CrossRef]
  4. Owen, J.M.; Pincombe, J.R. Velocity Measurements Inside a Rotating Cylindrical Cavity with a Radial Outflow of Fluid. J. Fluid Mech. 1980, 99, 111–127. [Google Scholar] [CrossRef]
  5. Chew, J.W.; Rogers, R.H. An Integral Method for the Calculation of Turbulent Forced Convection in a Rotating Cavity with Radial Outflow. Int. J. Heat Fluid Flow 1988, 9, 37–48. [Google Scholar] [CrossRef]
  6. Shen, W.; Wang, S.; Hou, X. Coupling Mechanism of Pressure and Temperature in a Co-Rotating Cavity with Radial Flow. Therm. Sci. Eng. Prog. 2023, 43, 101940. [Google Scholar] [CrossRef]
  7. Xu, Y.; Ding, S.; Liu, P.; Zhao, Y.; Qiu, T. Numerical Investigation of Flow Structure and Pressure Drop Prediction for Radial Inflow Between Co-Rotating Discs with Negative Effective Inlet Swirl Ratio. In Proceedings of the GT2024, London, UK, 24–28 June 2024; Volume 8: Heat Transfer: Internal Air Systems; Heat Transfer: Internal Cooling; Industrial and Cogeneration. [Google Scholar]
  8. Zhang, Z.; Wang, S.; Luo, X.; Wu, Z. Windage Torque and Flow Characteristics of a Co-Rotating Conical Cavity Under Radial Inflow. J. Turbomach. 2025, 147, 111008. [Google Scholar] [CrossRef]
  9. Farthing, P.R.; Long, C.A.; Owen, J.M.; Pincombe, J.R. Rotating Cavity with Axial Throughflow of Cooling Air: Flow Structure. J. Turbomach. 1992, 114, 237–246. [Google Scholar] [CrossRef]
  10. Pernak, M.J.; Nicholas, T.E.W.; Carnevale, M.; Lock, G.D.; Tang, H.; Scobie, J.A. Flow and Heat Transfer in Rotating Compressor Cavities with Inverted Shroud-Throughflow Temperature Differences. In Proceedings of the GT2024, London, UK, 24–28 June 2024; Volume 8: Heat Transfer: Internal Air Systems; Heat Transfer: Internal Cooling; Industrial and Cogeneration. [Google Scholar]
  11. Zhao, Y.; Ding, S.; Qiu, T.; Xu, Y.; Liu, P. Numerical Investigation for a Rotating Cavity With Axial Throughflow with Both Axial Heating and Radial Heating. In Proceedings of the GT2024, London, UK, 24–28 June 2024; Volume 8: Heat Transfer: Internal Air Systems; Heat Transfer: Internal Cooling; Industrial and Cogeneration. [Google Scholar]
  12. Wang, R.; Chew, J.W.; Gao, F.; Marxen, O. Large-Eddy Simulation of Axial, Radial and Mixed Centrifugal Convection in a Closed Rotating Cavity. Int. J. Heat Mass Transf. 2024, 227, 125559. [Google Scholar] [CrossRef]
  13. Fazeli, S.M.; Kanjirakkad, V.; Long, C. Experimental and Computational Investigation of Flow Structure of Buoyancy Induced Flow in Heated Rotating Cavities. J. Glob. Power Propuls. Soc. 2021, 5, 148–163. [Google Scholar] [CrossRef]
  14. Morse, A.P. Numerical Prediction of Turbulent Flow in Rotating Cavities. J. Turbomach. 1988, 110, 202–211. [Google Scholar] [CrossRef]
  15. Guo, Y.T.; Wang, S.F.; Shen, W.J. Effect of Coolant Inlet Mode on Heat Transfer Characteristics of a Twin-Web Turbine Disc Cavity. J. Appl. Fluid Mech. 2025, 18, 933–946. [Google Scholar] [CrossRef]
  16. Vinod Kumar, B.G.; Chew, J.W.; Hills, N.J. Rotating Flow and Heat Transfer in Cylindrical Cavities with Radial Inflow. In Proceedings of the GT2012, Copenhagen, Denmark, 11–15 June 2012; Volume 4: Heat Transfer, Parts A and B, pp. 2047–2060. [Google Scholar]
  17. Lee, J.; Kim, S.; Kim, D.; Cho, G.; Cho, J. Controlling the Flow Distribution Characteristics in the Secondary Air System of a Gas Turbine. Int. J. Heat Fluid Flow 2022, 95, 108973. [Google Scholar] [CrossRef]
  18. Onori, M.; Amirante, D.; Hills, N.J.; Chew, J.W. LES Validation for a Rotating Cylindrical Cavity with Radial Inflow. In Proceedings of the GT2016, Seoul, Republic of Korea, 13–17 June 2016; Volume 2D: Turbomachinery. [Google Scholar]
  19. Childs, P.R.N. Rotating Flow; Elsevier Science: Amsterdam, The Netherlands, 2010; ISBN 978-0-12-382099-0. [Google Scholar]
Figure 1. Three-dimensional schematic of the simplified corotating-disc cavity model.
Energies 18 04472 g001
Figure 2. Two-dimensional schematic of the cavity with geometrical parameters, where r b is the cavity outer radius, r a and r c are the inner and outer radii of the central axial channel respectively, r H I and r L I are the median radii for the high inlet and low inlet respectively. g H I is the radial gap width of the high inlet. g s is the axial gap width between the corotating-discs.
Energies 18 04472 g002
Figure 3. Generated mesh structure for corotating-disc cavity model domain.
Energies 18 04472 g003
Figure 4. Mesh independence study showing the effect of the number of mesh elements on the calculated pressure difference between the lower axial inlet and the radial outlet ( P L I P R O ).
Energies 18 04472 g004
Figure 5. Numerical verification study.
Energies 18 04472 g005
Figure 6. Streamline-overlaid swirl ratio contour of R o = 0.02 and 0.04 conditions pairs from different R e z and R e ϕ under the inlet temperature differential of Δ T I N = 50   K . (a) R o = 0.02 , R e z = 2 × 10 5 , R e ϕ = 1.0 × 10 7 ; (b) R o = 0.02 , R e z = 4 × 10 5 , R e ϕ = 2.0 × 10 7 ; (c) R o = 0.04 , R e z = 2 × 10 5 , R e ϕ = 0.5 × 10 7 ; (d) R o = 0.04 , R e z = 4 × 10 5 , R e ϕ = 1.0 × 10 7 .
Energies 18 04472 g006
Figure 7. Streamline-overlaid swirl ratio contours of different R o conditions taken at radial–axial midplane of the cavity under inlet temperature differentials of Δ T I N = 50 K and 10 K. (a)   Δ T I N =   50   K ,   R o = 0.01 ; (b) Δ T I N =   50   K ,   R o = 0.02 ; (c) Δ T I N =   50   K ,   R o = 0.04 ; (d) Δ T I N =   50   K ,   R o = 0.08 ; (e) Δ T I N =   10   K ,   R o = 0.01 ; (f) Δ T I N =   10   K ,   R o = 0.02 ; (g) Δ T I N =   10   K ,   R o = 0.04 ; (h) Δ T I N =   10   K ,   R o = 0.08 .
Energies 18 04472 g007
Figure 8. Axial distribution of swirl ratio at different radial locations for different R o conditions under inlet temperature differentials of Δ T I N = 50 K and 10 K. (a)   R o = 0.01 ; (b)   R o = 0.02 ; (c)   R o = 0.04 ; (d)   R o = 0.08 .
Energies 18 04472 g008
Figure 9. Circumferentially averaged radial distribution of swirl ratio at cavity midplane for different R o conditions under inlet temperature differentials of Δ T I N = 50 K and 10 K.
Energies 18 04472 g009
Figure 10. Variations of M R with R o under different Δ T I N conditions.
Energies 18 04472 g010
Figure 11. Pressure coefficient contours of different R o conditions taken at radial–axial midplane of the cavity under inlet temperature differentials of Δ T I N = 50 K and 10 K. (a)   Δ T I N =   50   K ,   R o = 0.01 ; (b)   Δ T I N =   50   K ,   R o = 0.02 ; (c)   Δ T I N =   50   K ,   R o = 0.04 ; (d) Δ T I N =   50   K ,   R o = 0.08 ; (e) Δ T I N =   10   K ,   R o = 0.01 ; (f) Δ T I N =   10   K ,   R o = 0.02 ; (g) Δ T I N =   10   K ,   R o = 0.04 ; (h) Δ T I N =   10   K ,   R o = 0.08 .
Energies 18 04472 g011
Figure 12. Circumferentially averaged radial distribution of pressure coefficient for different R o conditions under inlet temperature differentials of Δ T I N = 50 K and 10 K.
Energies 18 04472 g012
Figure 13. (a) Variation of C d , R O with R o for different Δ T I N conditions; (b) Variation of C d , A O with R o for different Δ T I N conditions.
Energies 18 04472 g013
Figure 14. Dimensionless cavity temperature contours of different R o conditions taken at radial–axial midplane of the cavity under inlet temperature differential of Δ T I N = 50 K. (a)   R o = 0.01 ; (b)   R o = 0.02 ; (c)   R o = 0.04 ; (d)   R o = 0.08 .
Energies 18 04472 g014
Figure 15. Circumferentially averaged radial distribution of dimensionless temperature for different R o conditions under inlet temperature differential of Δ T I N = 50 K.
Energies 18 04472 g015
Figure 16. Variations of T R O with R o under inlet temperature differential of Δ T I N = 50 K.
Energies 18 04472 g016
Table 1. Cavity geometrical parameters.
ParametersValues
g s / r b 0.4
r L I / r b 0.25
r c / r b 0.1
r H I / r b 0.75
A R O / A A O 1
Table 2. Numerical methods errors.
Case R e ϕ e r r ¯ k ϵ e r r ¯ S S T k ω e r r ¯ R S M
Exp1 5.47 × 10 5 20.34%9.21%10.14%
Exp2 8.17 × 10 5 11.17%7.99%8.85%
Exp3 1.1 × 10 6 6.02%8.74%11.00%
Theory 1 × 10 7 2.90%4.19%5.91%
Disclaimer/Publisher’s Note: The statements, opinions and data contained in all publications are solely those of the individual author(s) and contributor(s) and not of MDPI and/or the editor(s). MDPI and/or the editor(s) disclaim responsibility for any injury to people or property resulting from any ideas, methods, instructions or products referred to in the content.