Article

Multiscale Evaluation of an Electrically Heated Thermal Battery for High-Temperature Industrial Energy Storage †

Electrified Thermal Solutions, Inc., Medford, MA 02155, USA
*
Author to whom correspondence should be addressed.
This paper integrates content from two earlier conference papers, which was chaired by the editor of this special issue, and includes revisions made during subsequent review rounds.: Asar, M.E.; McKinley, D.; Truong, B.; Kabel, J. Characterizing Thermal, Electric, and Structural Responses of Electrically Charged Firebricks for Industrial Thermal Battery Applications. In Proceedings of the American Society of Thermal and Fluids Engineers (ASTFE) 10th Thermal and Fluids Engineering Conference, Washington, DC, USA, 9–12 March 2025. Asar, M.E.; Stack, D.C.; Truong, B. Conjugate Heat Transfer Analysis of Discharging Joule Hive Thermal Battery. In Proceedings of the ASTFE 9th Thermal and Fluids Engineering Conference, Corvallis, OR, USA, 21–24 April 2024.
Energies 2025, 18(17), 4461; https://doi.org/10.3390/en18174461
Submission received: 31 May 2025 / Revised: 21 June 2025 / Accepted: 14 August 2025 / Published: 22 August 2025
(This article belongs to the Special Issue Highly Efficient Thermal Energy Storage (TES) Technologies)

Abstract

Industrial processes such as cement, steel, and glass manufacturing rely heavily on fossil fuels for high-temperature heat, presenting a significant challenge for decarbonization. To enable continuous thermal output from intermittent renewable electricity, Electrified Thermal Solutions, Inc. is developing the Joule Hive™ Thermal Battery (JHTB), an electrically heated energy storage system capable of delivering process heat up to 1800 °C. The system employs electrically conductive firebricks (E-Bricks) as both heating elements and thermal storage media, arranged with insulating bricks (I-Bricks) to facilitate gas flow and heat exchange. The work combines experimental and numerical studies to evaluate the thermal, electrical, and structural performance of the JHTB. A small-scale charging experiment was conducted on a single E-Brick circuit in a 1500 °C furnace, showing good agreement with coupled thermal-electric finite element models that account for Joule heating, temperature-dependent properties, radiation, and natural convection. Structural modeling assessed stress induced by thermal gradients. In addition, a high-fidelity conjugate heat transfer model of the full JHTB core was developed to assess system-scale discharge performance, solving conservation equations with SST k-ω turbulence and radiation models. Simulations for two air channel geometries demonstrated the battery’s ability to deliver 5 MW of heat for at least five hours with air temperatures higher than 1000 °C, validating its potential for industrial decarbonization.

1. Introduction

The 2022 “Net-Zero Heat” report [1] highlights that heating and cooling accounted for 50% of global energy consumption in 2019. Of this, around 70% came from burning fossil fuels, contributing to 45% of all energy-related annual CO2 emissions. Industrial manufacturing is a large consumer of heat, significantly impacting global carbon emissions. Decarbonizing heat is key to reaching a decarbonized industry [2] and industrial electrification is a crucial way to tackle this problem [3]. In fact, the U.S. Department of Energy has identified industrial electrification as a major pillar for decarbonization [4]. To transition from fossil fuels to renewable energy for processes that require continuous industrial heating (e.g., cement, steel, glass manufacturing), a high-temperature thermal energy storage system (TES) is necessary to convert intermittent renewable energy into a steady heat supply. The authors of the same report [1] predict that achieving net-zero heat by 2040 requires the deployment of two to eight terawatts of TES. TES has been utilized in various applications, including heat recovery from combustion flue gas [5,6] and in concentrated solar power (CSP) to store solar energy for nighttime use [7,8]; however, it has not been adapted to allow for renewable electrical energy to be stored as heat for high temperature processes until recently in so-called electrically heated TES (E-TES) systems. Sepulveda et al. [9] evaluated long-duration energy storage systems and provided cost target and duration requirements to have decarbonized power systems. There exists today no cost-effective E-TES capable of delivering zero-carbon heat across a wide range of temperatures, from low temperatures (~100 °C) to more than 1400 °C required by the hardest-to-abate industries (such as cement and steel). For instance, the latest E-TES systems utilize metallic heaters that are constrained by the oxidation kinetics of the materials and have practical storage temperature limits near 700–800 °C (with peak temperature at 1250 °C [10]). Consequently, current E-TES technologies are insufficient for high-temperature industries such as cement, steel, or glass production, which require delivered temperatures near 1500–1600 °C [11]. While green hydrogen can deliver zero-carbon heat at 1400 °C, its production and storage remain costly, at approximately USD5/kg [12].
Electrified Thermal Solutions Inc. is developing the innovative Joule Hive™ Thermal Battery (JHTB), which merges thousands-year-old technology (bricks) with semiconductor doping. Nearly a decade of research at MIT demonstrated that oxide bricks can be modified to become electrically conductive [13]. In fact, regular ceramic or refractory bricks are known to be electrically resistive rather than conductive [14]. Electrified Thermal’s electrically conductive bricks (E-Bricks) are patented [15] for storage media, heat source, and heat exchanger to provide process heat. This high-temperature heat is applicable across various sectors, including food and beverages, chemicals, and the hard-to-abate cement and steel industries. The JHTB functions as a thermal energy storage system that can retain heat at temperatures up to 1800 °C, addressing the diverse thermal requirements of industrial processes. Its thermal output ranges from 1 to 200 MWth and can sustain heat for several hours, making it a cost-effective solution for high-temperature energy storage and on-demand heat. Additionally, the system can charge and discharge simultaneously, providing a continuous heat supply needed by many industrial applications. A report [16] discusses the challenges of reaching zero emissions in heavy industry, which shows the uniqueness and importance of JHTB technology within this sector due to its capabilities.
Stack et al. [17] conducted a numerical investigation of a firebrick resistance-heated thermal energy storage system, which later became the basis of JHTB. Their research involved a one-dimensional (1-D) model of a rectangular prism body made of E-Bricks with air channels. Their brick stack was averaged into a characteristic “cell” to reduce the problem to 1-D dimensional. They focused on discharge scenarios, utilizing the Gnielinski correlation to estimate convective heat transfer coefficients. In addition, Zetterholm et al. [18] numerically analyzed a hot blast stove, which is commonly used to provide hot blast to steel making process, using finite difference approximations to ultimately improve the energy efficiency of the hot blast stove operation.
There are several studies of Joule heating modeling for ceramics applications. Using finite element analysis, Serrazina et al. [19] modeled the particle contact influence on Joule heating and temperature distribution during field-assisted sintering, in which ceramics densify in a few seconds at low temperatures. They studied how cubic particle orientation changes the heat generation and temperature distribution using a lead-free piezoelectric, potassium sodium niobate. Similarly, Holland et al. [20] and Grasso et al. [21] conducted a study of field-assisted sintering process and focused on localized Joule heating, and Liu et al. [22] focused on Joule-heating ceramic reactors for catalytic carbon monoxide oxidation.
There is a need to numerically and experimentally test the capability of charging electrically conductive bricks, which are the basis of the JHTB since they act as the heating element and storage medium as well as analyzing the system-level performance. Therefore, the first part of this study is focused on numerically and experimentally analyzing a small-scale (0.3 m-long) charging brick stack in a radiative cooling environment. The geometry used in the models and experiments can be considered a simplified unit cell of large-scale JHTB, to be used in delivering electrified heat to industrial processes. The results of this study would be beneficial to identify the thermal–electric–structural behavior of the JHTB. Therefore, two sequentially coupled numerical models were developed using ANSYS-Mechanical 2023R1 [23]: (1) a thermal–electric model that couples electric flow with a thermal problem where Joule heating and temperature-dependent properties (e.g., electrical resistivity) are the primary factors coupling two physics; (2) a structural model that inputs the resultant temperature data and estimates mechanical stresses due to thermal expansion. Additionally, a steady-state charge–discharge experiment was conducted on a charged brick stack placed in a 1500 °C furnace to check the validity of the thermal–electric model with the same brick stack design, inputs, and boundary conditions.
The second part of this paper focuses on system-level performance and expands the previous knowledge by numerically modeling the JHTB by conducting a high-fidelity conjugate heat transfer model using Ansys Fluent [24] with an upgraded 2-D geometry consisting of E-Bricks and electrically insulating bricks that surround them and act as a part of the storage. Therefore, for the first time, a thermal battery of electrically conductive and insulator bricks is modeled, where the model couples solid–fluid heat transfer and considers turbulent flow in the air channels and surface-to-surface radiation within the brick stack. This work analyses discharging JHTB with two air channel designs and compares them with fixed total mass flow rate conditions.
Overall, this paper contributes to the literature by providing first-of-a-kind experimental and numerical data of Joule-heated electrically conductive bricks. It provides unique data for charging and discharging thermal battery technology in small (laboratory) and large (industrial) scales. It uses the only new type of heating element invented in the last few decades for high-temperature applications. This paper is an extension of the previous work reported in two conference proceedings [25,26].

2. Small-Scale Analysis of Charging Brick Stack

2.1. Numerical Methodology

Two numerical models have been developed for the characterization of electrically charged firebricks: (1) a steady-state thermal–electric model, and (2) a static structural model. The following discussion describes the models in detail.

2.1.1. Thermal–Electric Model

The first model is the steady-state charging (thermal–electric) model, where the primary cooling mechanism comes from a colder radiative heat sink with a prescribed temperature. Thermal and electric responses are two-way coupled, and Joule heating is solved while material properties (thermal conductivity, emissivity, electrical resistance, specific heat capacity) are functions of temperature.
Geometry and Computational Domain of the Thermal-Electric Model
The computational domain uses a brick stack in a way that is relevant to JHTB where electrically conductive (E-) bricks are enclosed inside electrically-insulating (I-) bricks. In addition to functioning as a thermal battery, the JHTB is a heat exchanger that allows active airflow during discharge operation. (In other words, active air flow and the resultant forced convection is the mechanism to discharge heat from the JHTB and provide hot flow to downstream—more discussion on this is provided in the second part of this paper.) Introducing I-Bricks to the thermal battery design increases the thermal storage capacity in a cost-effective way and protects E-Brick from airflow. Overall, the computational geometry is a small scale, simplified representation of JHTB’s core technology during steady-state charge–discharge conditions where the discharge condition is met by radiative cooling instead of convection.
The numerical model uses simplified versions of the brick stacks inside a temperature-controlled furnace, and its domain is of three bodies: E-Brick, I-Brick, and “simplified” furnace floor, see Figure 1. The E-Brick body is surrounded by a merged body of four hollow I-Bricks and capped with a non-hollow I-Brick. The side walls of the radiative heat sink are accounted for as radiation boundary conditions; therefore, they do not physically appear in the numerical model.
The model studies a brick stack placed inside a heated furnace on its two side walls. The furnace floor does not have heaters and consists of high alumina plates resting on several layers of insulation. The furnace floor was simplified by using an effective thermal conductivity for a selected wall thickness.
Governing Equations of the Thermal-Electric Model
The steady-state thermal–electric model has two main governing equations: energy and electric charge conservation, as shown in Equations (1) and (2). The energy equation has the conduction term and a non-zero source term, which corresponds to volumetric heat generation due to Joule heating. The electric charge conservation equation can be written in terms of electric field and electrical resistance matrix where the electric field is the electric potential gradient, see Equations (2) and (3). The power dissipated by Ohmic loss is calculated by the relation given in Equation (4) and is applied to the energy conservation equation by Equation (5). The two governing equations are highly coupled by Q g e n and temperature-dependent electric resistivity terms; therefore, two-way coupled solution is critical for accuracy.
· k · T = Q g e n
· J = · E / [ ρ ] = 0
E = φ
P = J ·   E = E 2 / ρ
P = Q g e n
In addition to the governing equations mentioned above, the model uses radiation relations because of the high-temperature application (>1500 °C). Radiation dominates the heat transfer between the E-Brick and I-Bricks (inner enclosure) and the I-Brick to heat sink (outer enclosure). Surface-to-surface radiation and radiation to ambient/heat sink were effective surfaces making up the inner and outer enclosures, respectively. It is assumed that all surfaces are opaque, gray, and diffuse, and radiation between the surfaces is unaffected by separating media. In fact, this model does not include the air domain that would fill the internal and external radiation enclosures because natural convection is dominated by the radiation heat transfer. This model uses the radiosity solution method between N surfaces in conjunction with the conduction problem, and its equations are given in Equations (6) and (7). More information can be found in [27]. Note that the E-Brick’s and I-Brick’s emissivity measurements were conducted by a third party in an air-filled enclosure at 400–1450 °C that covers a spectral range of 1100–1650 nm. The emissivity data measured at different temperatures suggests that the emissivities are not strong functions of temperature.
j = 1 N [ δ i j ( 1 ε i ) F i j ] q j o = ε i σ T i 4
q i = q i o j = 1 N F i j q j o
Boundary and Interface Conditions of the Thermal-Electric Model
The brick stack and the furnace floor were divided into four and symmetry conditions and are applied at the side planes shown in Figure 1b. Prescribed electric current and zero voltage were applied at the bottom and top surfaces of the E-Brick, respectively. The E-Brick’s side walls are open to the inner radiation enclosure, and surface-to-surface radiation is activated. Similarly, the I-Brick’s inner walls and a portion of the furnace floor are in the inner radiation enclosure with surface-to-surface radiation boundary conditions. The I-Brick’s outer walls and most of the furnace floor are open to the temperature-controlled furnace walls at heat sink temperature (Ths). Therefore, radiation to ambient with prescribed temperature is active on these walls. This work focuses on a radiative cooling scenario of an electrically charged brick stack inside a temperature-controlled furnace on its side surfaces, where the bottom of the furnace does not have heaters. Therefore, the top edges of the “simplified” bottom furnace wall are prescribed the same temperature as the radiative heat sink temperature (Ths), and natural convection is applied at the bottom. Natural convection input parameters were selected to be 40 °C ambient temperature and 5 W/m2K convection coefficient. No thermal or electrical contact resistance has been applied at the interface between the two solids for simplicity.

2.1.2. Structural Model

This work’s second model is a static structural analysis of a thermally expanding E-Brick body to attain mechanical stresses. The structural model inputs thermal loads from the thermal–electric model to model isotropic thermal expansion, making the models one-way coupled. The initial condition of the structural model is the undeformed E-Brick body at 22 °C. The structural model outputs the deformed body with the applied thermal load at steady-state conditions.
Geometry and Computational Domain of the Structural Model
The computational domain of the structural model is the quarter E-Brick geometry with appropriate symmetry conditions on the side planes.
Governing Equations of the Structural Model
The main governing equation of the structural model is the strain–stress equation given in Equation (8), where non-linearities are ignored. Elastic strain vector, ε e l , is a function of the total strain vector, ε , and thermal strain vector, ε t h , as shown in Equation (9). Equation (10) shows the stress–strain equation when the stress vector, σ , and elastic strain vector, ε e l , are written in terms of their components where [ D ] stands for elastic stiffness matrix. ε t h can be written in terms of the difference between local and reference temperatures and thermal expansion coefficients—see Equation (11). Finally, Equation (8) can be transitioned into the form, Equation (12), used by the ANSYS Mechanical solver, where [ D ] 1 term is given in Equation (13). More information can be found in [27]. Note that gravity was activated in -y direction; therefore, gravitational body forces were accounted for in σ term.
σ = [ D ] ε e l
ε e l = ε ε t h
[ σ x   σ y σ z σ x y σ y z σ x z ] T = [ D ] [ ε x   ε y ε z ε x y ε y z ε x z ] T ε t h
ε t h = ( T T r e f )     [ α x s e   α y s e   α z s e   0   0   0   ] T
ε = ε t h + [ D ] 1 σ
[ D ] 1 1 / E x v x y / E x v x z / E x v y x / E y 1 / E y v y z / E y v z x / E z 0 0 0 v z y / E z 0 0 0 1 / E z 0 0 0 0 0 0 0 0 0 0 1 / G x y 0 0 0 0 1 / G y z 0 0 0 0 1 / G x z
Boundary Conditions of the Structural Model
The E-Brick’s bottom surface was given a prescribed displacement such that it does not move up or down in the y-direction but is free to move in the xz plane. The other surfaces (top and side) of the E-Brick are free to expand because of the gap between I- and E-Bricks.

2.1.3. Meshing

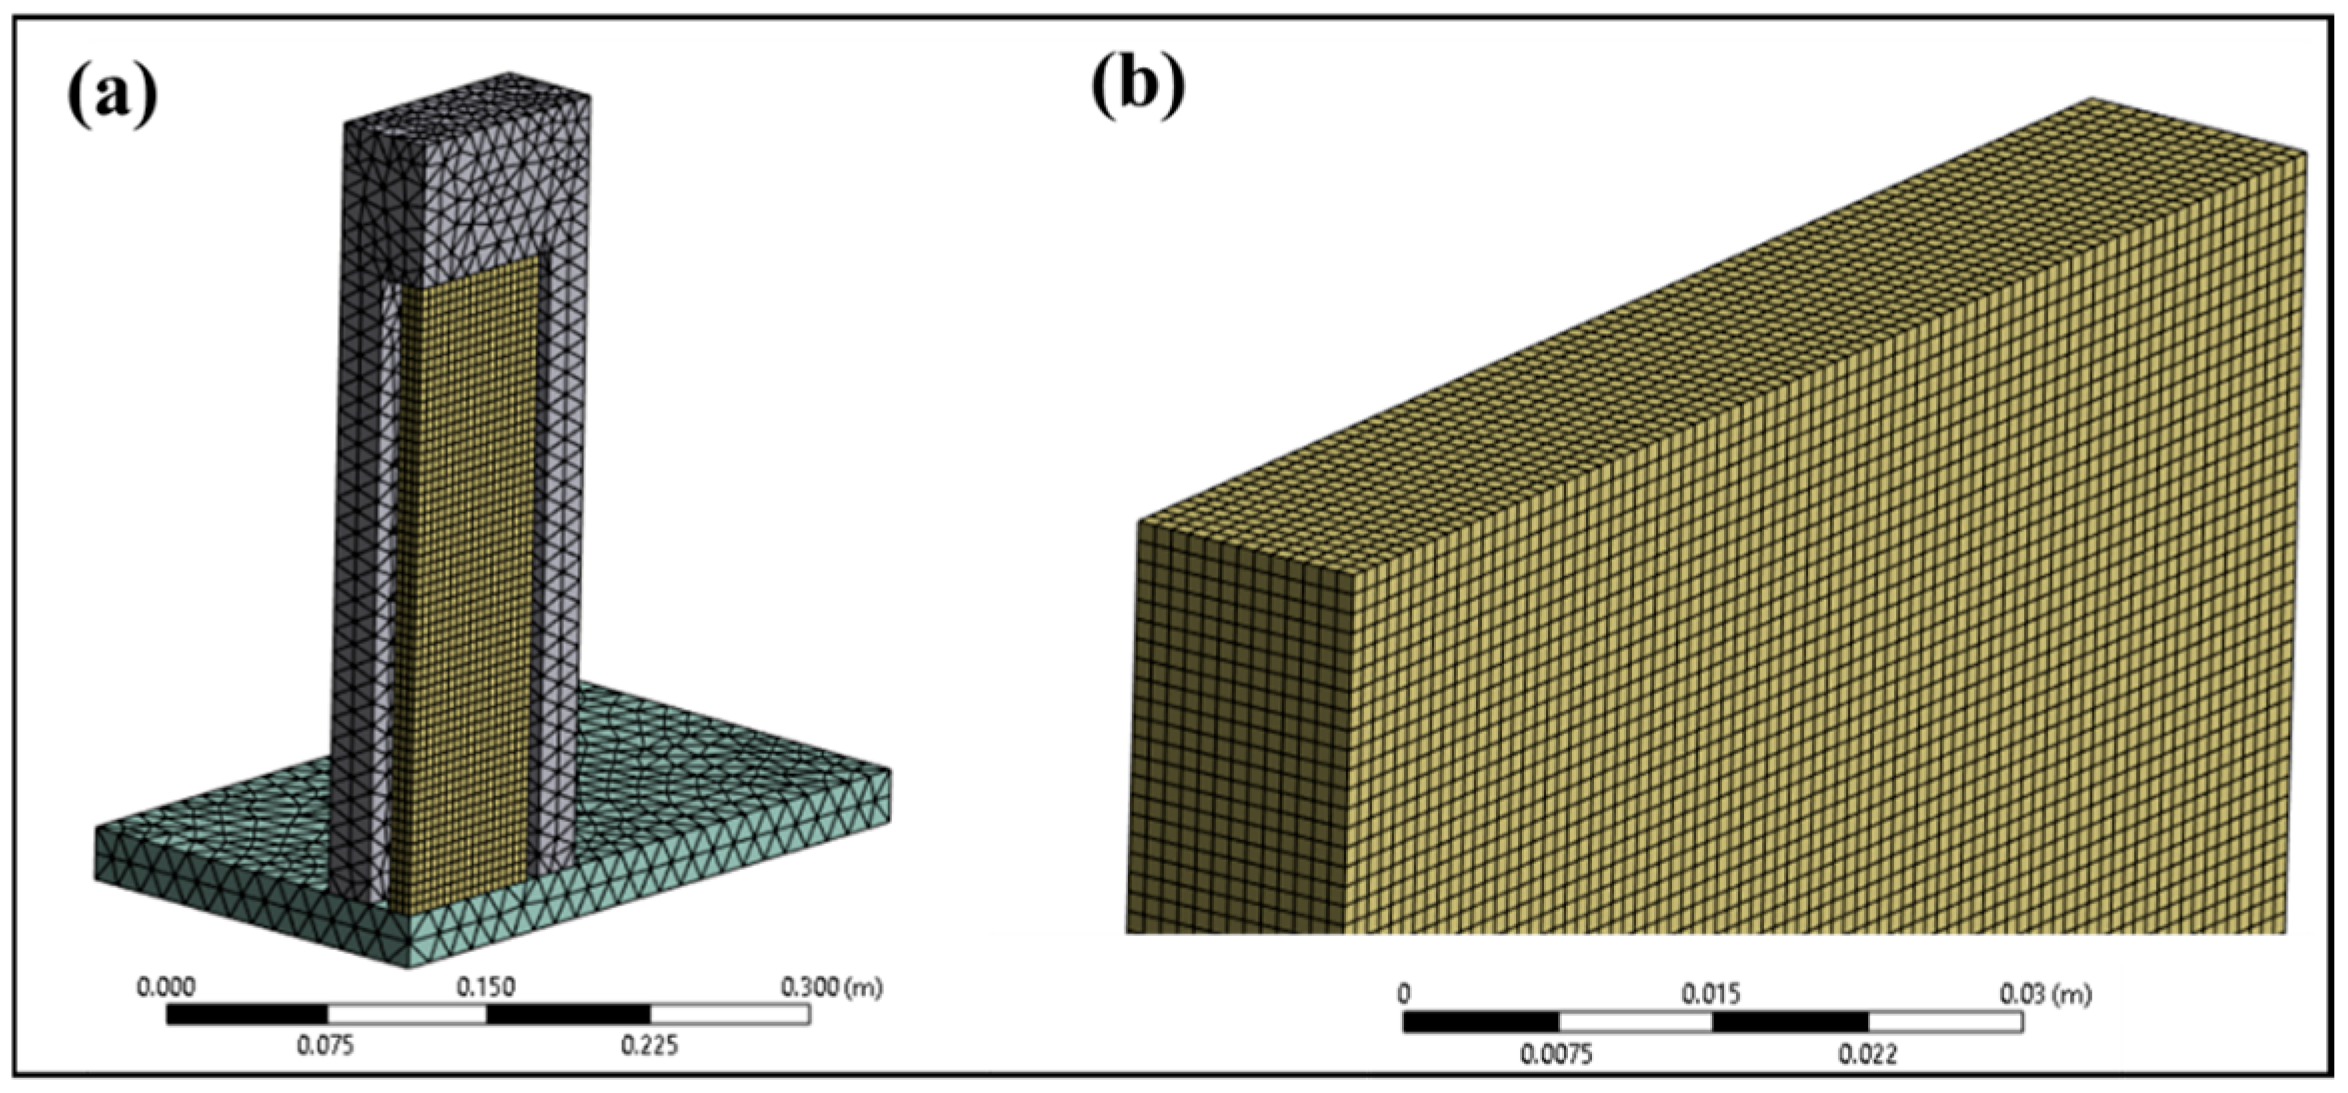
Tetrahedral meshes were generated for the I-Brick and furnace floor, whereas hexahedral elements were used in the E-Brick body, see Figure 2. Based on the mesh-sensitivity analysis conducted, the thermal–electric model uses 5 mm, 11 mm, and 15 mesh sizes for E-Brick, I-Brick, and furnace floor bodies, whereas the static–structural model uses 1 mm mesh size on the E-Brick. A portion of this mesh dependency analysis is given in Table 1, which illustrates how mesh size changes the important results of the model.

2.2. Experimental Methodology

An experiment was conducted to check the validity of the thermal–electric numerical model. The following sections discuss the experimental setup, measurement, and test conditions.

2.2.1. Experimental Setup

The experiment was conducted at the Electrified Thermal Solutions, Inc. (ETS) research and development laboratory in the 900 × 900 × 1200 mm chamber of a high-temperature refractory furnace (Figure 3a) that was used to fabricate the E-Brick element and provide thermal boundary conditions for testing. The furnace is electrically heated with a peak input power of 75 kVA using molybdenum di-silicide heating elements controlled by a PID control loop with a control input from an alumina-sheathed B-type thermocouple (TC). This TC was located at the height of 600 mm above the furnace floor and embedded in the rear wall, as shown in Figure 3a. Hollow Al2O3 refractory bricks (“I-Bricks”) placed on the furnace floor (Figure 3b,c,e) enclosed the electrically doped Cr2O3/Al2O3 E-Brick element (Figure 3d; 28 × 165 × 314 mm).
AC power was applied to the E-Brick circuit through platinum electrodes, as shown in Figure 3d. These platinum electrodes pass through the furnace wall and connect to copper wire leads that connect a power supply via a step-up transformer. E-Brick power was supplied by a 60 kVA, 0–300 V, and 60 Hz AC power supply operating as a current-limited voltage source (Pacific Power Supply 1600ADF-2G, Pacific Power Source, Inc., Irvine, CA, USA) feeding a step-up transformer with a ratio of 6.66. Applied power to the E-Brick circuit was calculated based on incremental progression to the commercially desired E-Brick wattage loading, accounting for estimated losses in the step-up transformer and electrode assembly.

2.2.2. Experimental Measurement

Local temperature and voltage were measured, and thermocouple and voltage probe locations are illustrated in Figure 3d. Temperature was measured by B-type thermocouples placed in alumina sheaths along the exact midpoint locations as the voltage measurements. Sheaths were held in holes in the I-Bricks (as shown in Figure 3e) and offset by 2 mm from the E-Brick surfaces to provide electrical isolation. A Datexel DAT 8018 thermocouple (Datexel LLC, Jupiter, FL, USA) DAQ read thermocouple signals for a combined uncertainty of ±4.86 °C. E-Brick voltage was measured between the grounded neutral of the secondary winding of the step-up transformer and Ø0.33 mm platinum wires attached to the side of the E-Bricks. These voltage measurement wires were attached at the midpoint of the longer E-Brick edge (“side center” or SC). Voltage measurements were made using Verivolt IsoBlock (Verivolt LLC, Miami, FL, USA) differential voltage measurement isolation modules, which provided galvanic isolation and a low voltage output signal that was measured by a National Instruments cRio-9056 with NI-9220 (Austin, TX, USA) voltage input cards. For the voltage range described in this experiment, an uncertainty of ±1.07 V is estimated. Circuit current was measured using a Phoenix Contact 100 A (Harrisburg, PA, USA) current transformer on the secondary line leg of the step-up transformer with an uncertainty of ±1.0 A. Experimental temperature data was sampled at 20 Hz, and experimental voltage data was sampled at 20 kHz and used to calculate the RMS voltage value. All data were down-sampled to 10-s averages.

2.2.3. Experimental Procedure

The furnace chamber temperature was increased to 1500 °C and held constant at this value; constant power was applied to the E-Bricks and a quasi-steady state point was identified for comparison with the steady-state thermal model. This point was selected on the basis of (1) stable furnace and E-Brick temperature, and (2) minimal voltage changes with time.

2.3. Discussion of the Small-Scale Analysis of Charging Brick Stack

Numerical results were discussed in two parts per individual model, which are sequentially coupled in the order of (1) thermal–electric and (2) static–structural models.

2.3.1. Numerical Results

Thermal–Electric Model Results
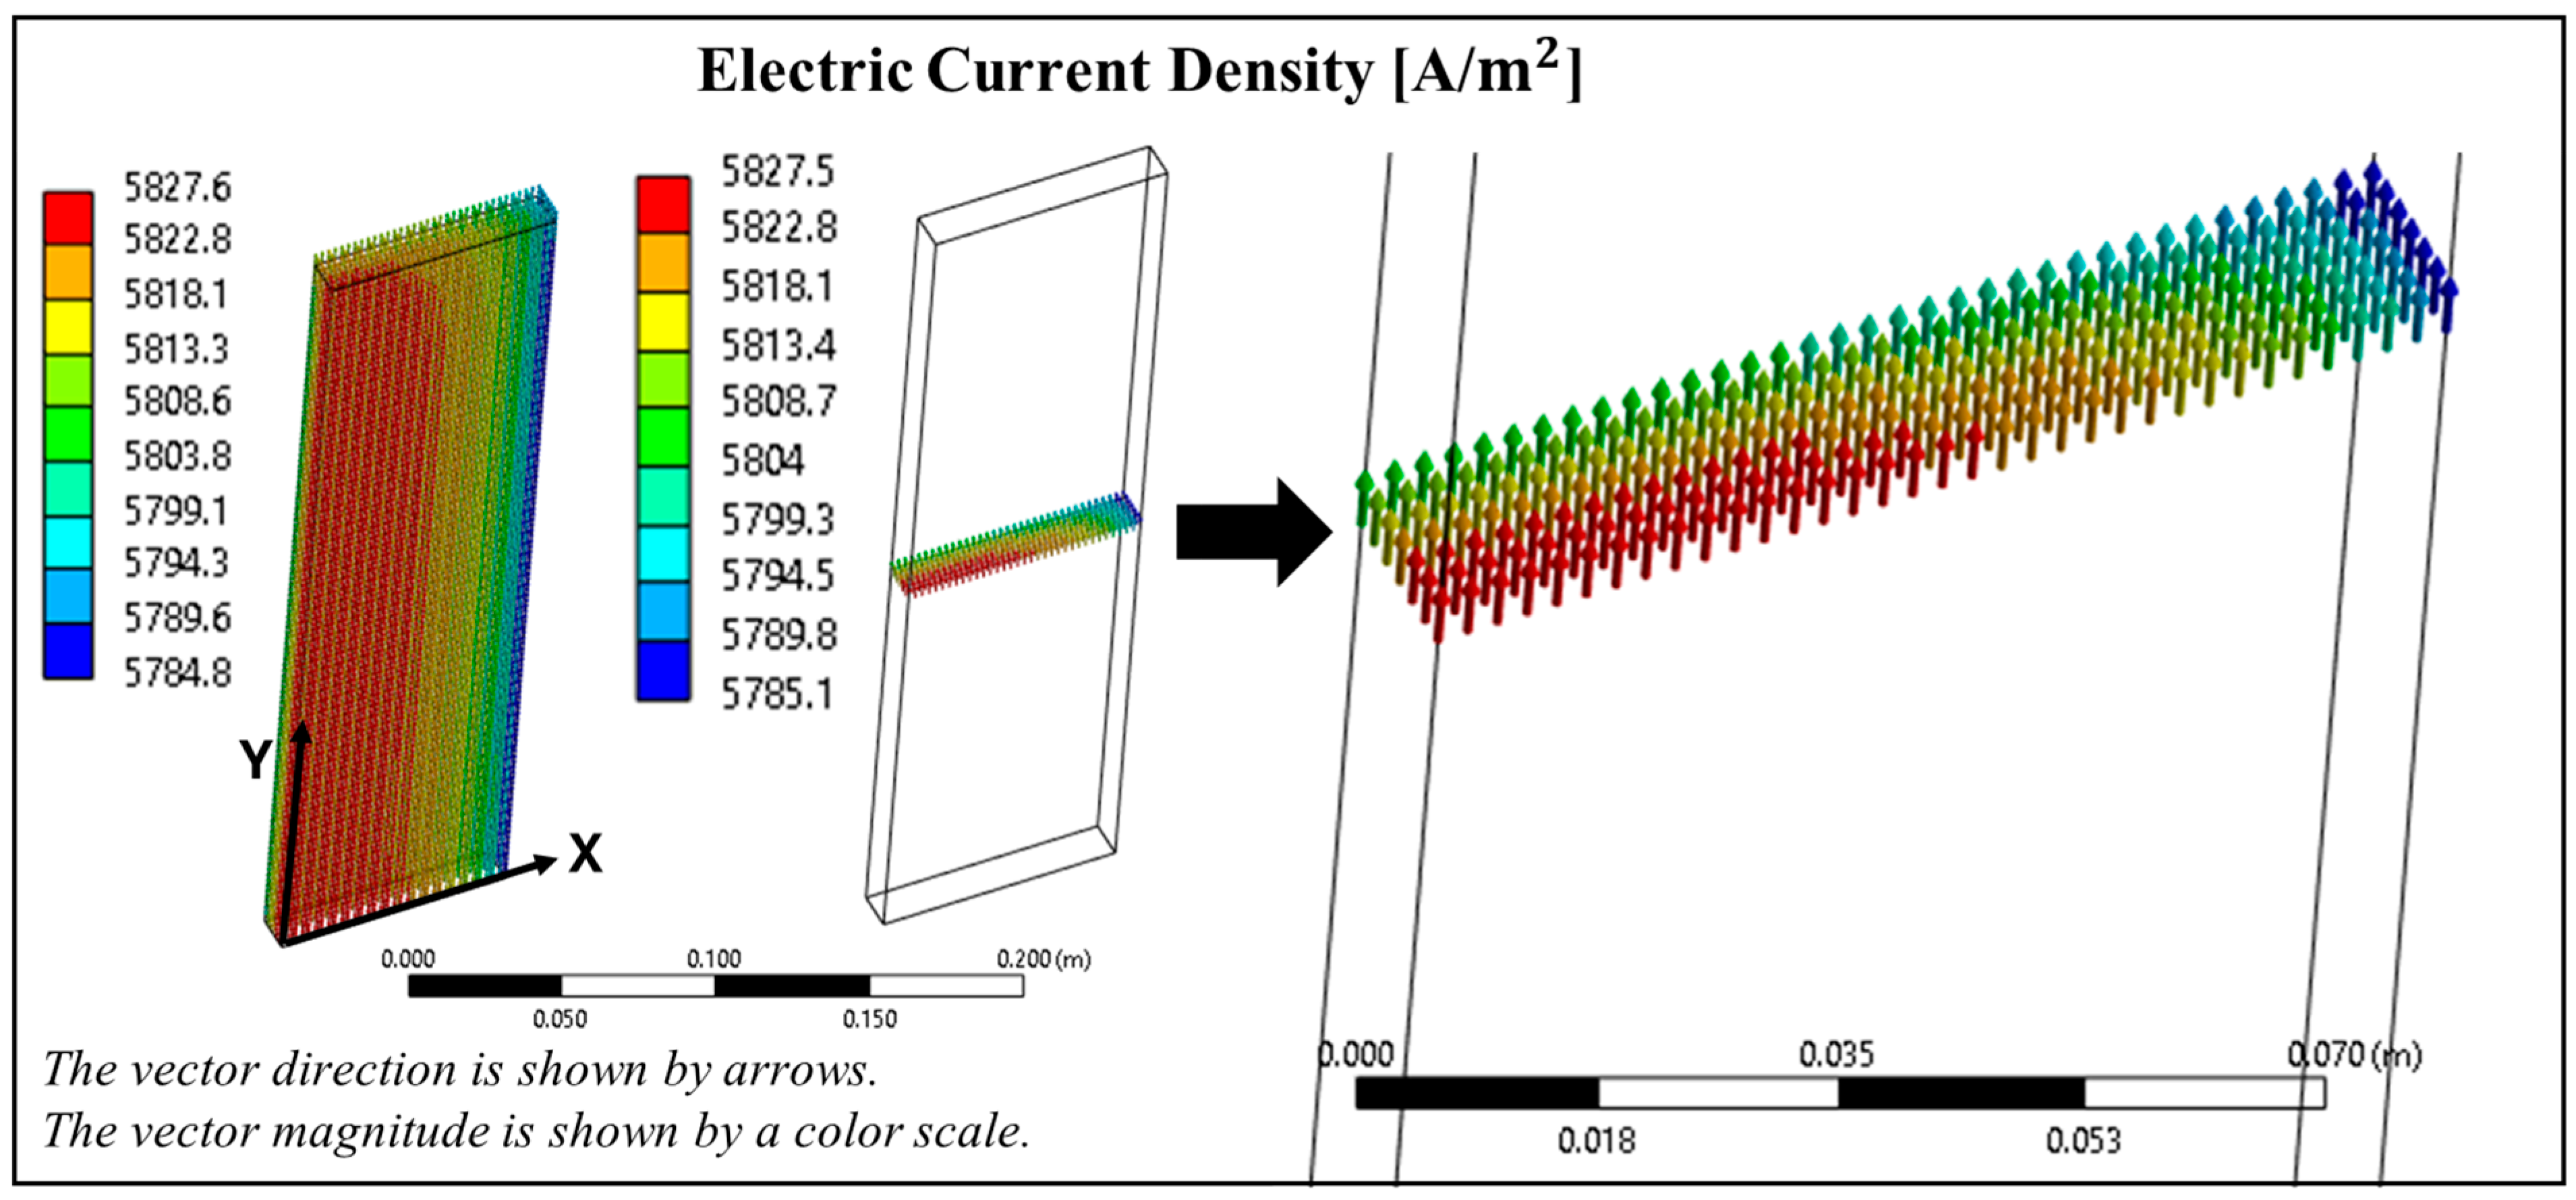
Figure 4 and Figure 5 show important three-dimensional data of the thermal-electric model where the computational domain corresponds to the quarter stack due to symmetry on two sides. The electric current density displays amps per meter square and is shown in Figure 4. As expected, the electrical current favors passing through the core of the E-Brick rather than through the skin of the brick stack because the hotter core has lower resistivity, consistent with the typical temperature dependence of resistivity of ceramic semiconductors (as seen in Figure 5c). The distribution is better visible in the zoomed-in version, where electric current density is shown at a selected cross-section.
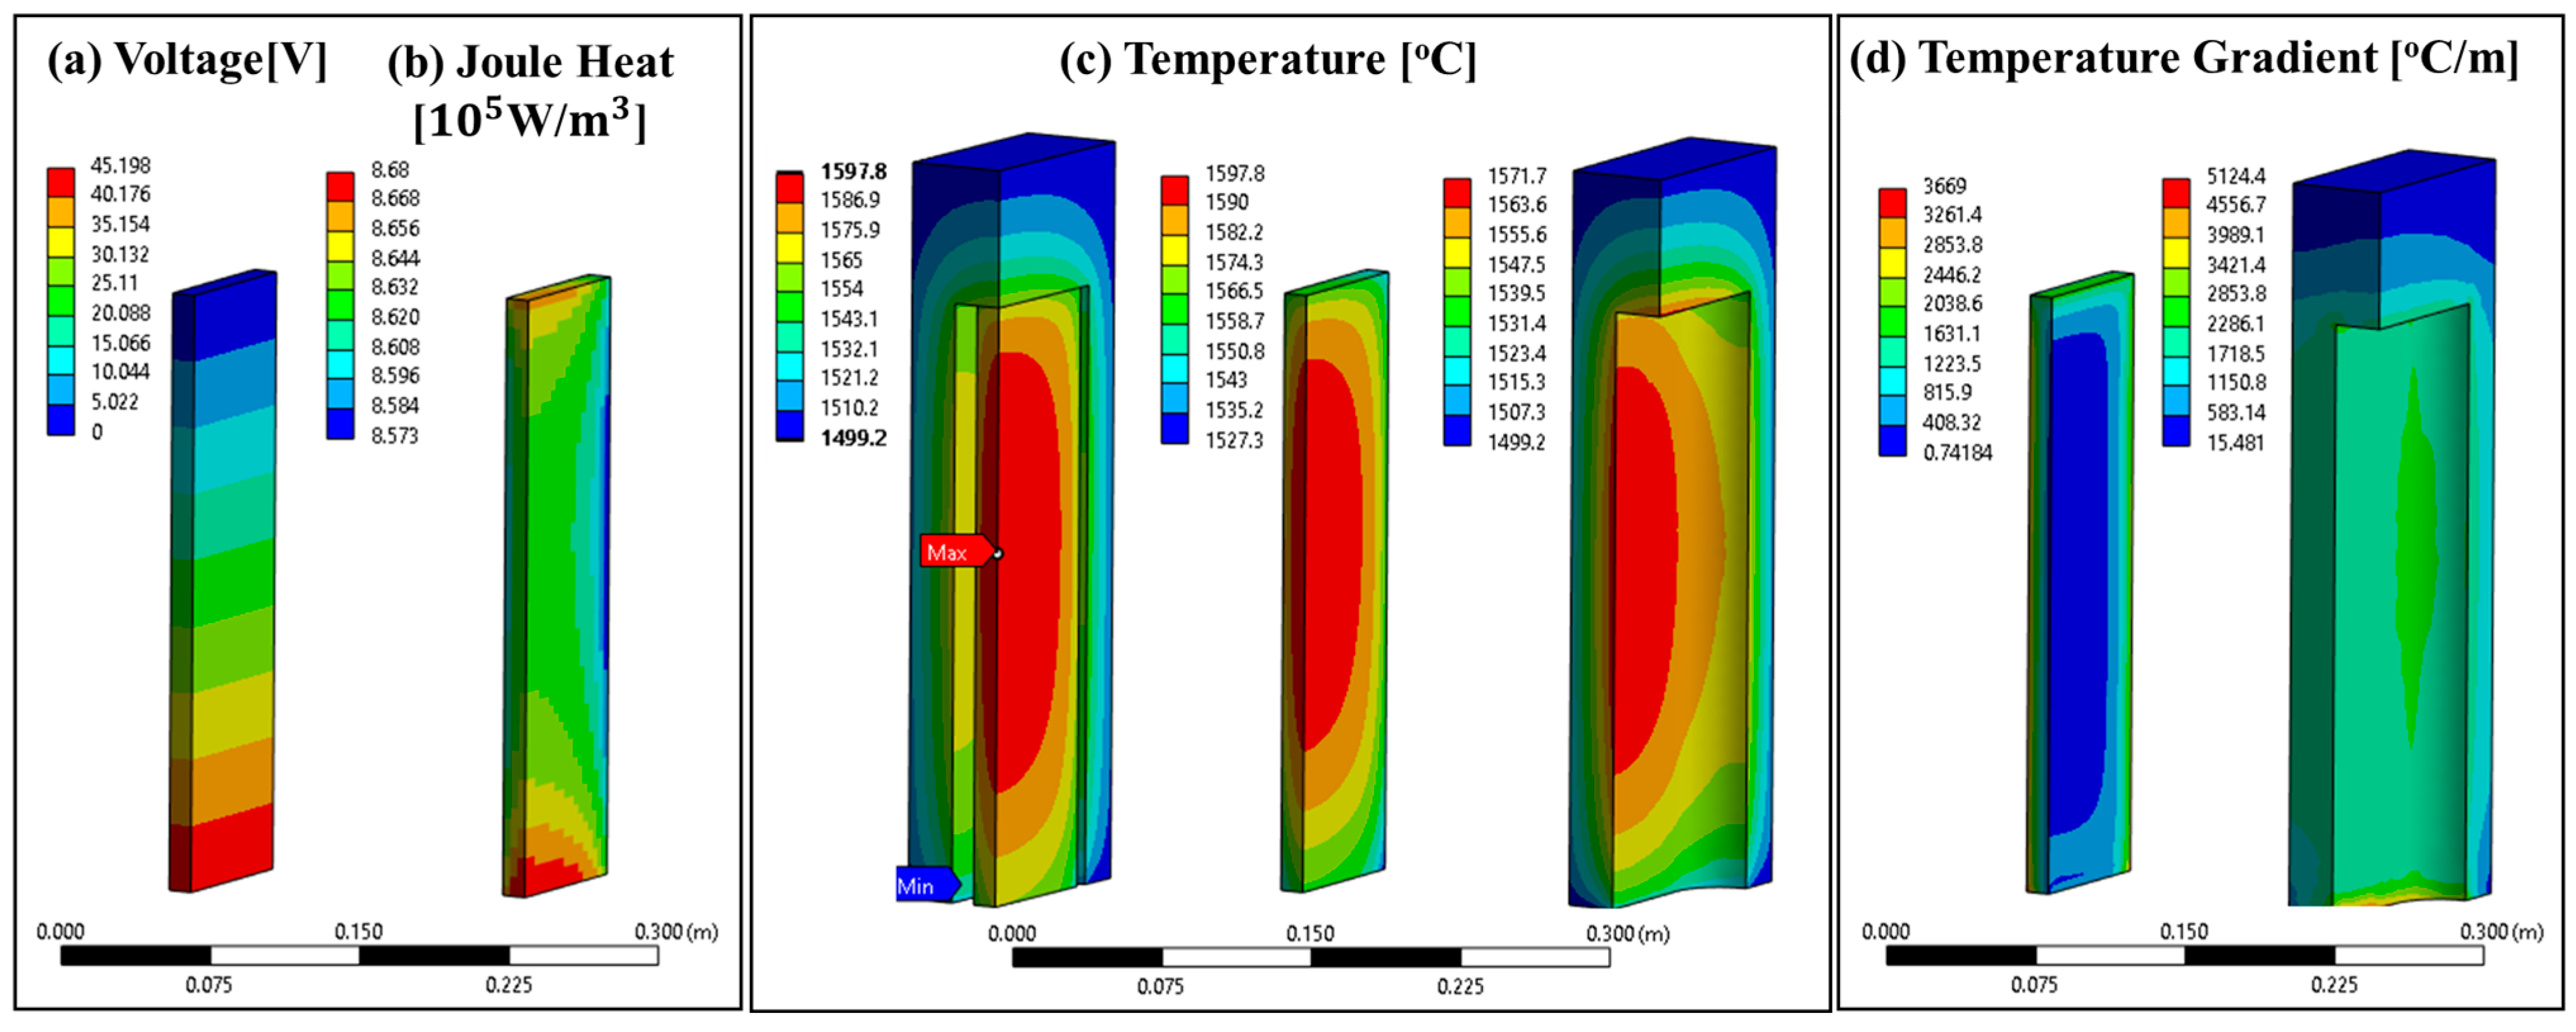
Figure 5a shows a voltage map. As expected, voltage linearly increases from the ground voltage applied at the top of the E-Brick towards its bottom surface, in which electrical current was prescribed. The total voltage drop across the E-Brick circuit is estimated to be 45.198 V at the steady-state conditions. Figure 5b shows the volumetric heat generation or Joule heat term, which is proportional to electrical resistivity and local current density’s second power. The E-Brick material’s electrical resistivity decreases with increasing temperature. This explains the high Joule heat values at the top and bottom of the E-Brick because these regions have lower temperatures (see Figure 5c) compared to the middle of the E-Brick. In addition, Figure 5c displays E-Brick and I-Brick temperature contours. Both bodies were cooled by radiation and directly and indirectly lost heat to a 1500 °C radiative environment and to a 25 °C ambient by natural convection from the bottom of the furnace, while E-Brick generates heat due to the applied current. Therefore, at steady-state conditions, the hottest spot is in the core of the E-Brick body (see Figure 5c) and is about 98 °C higher than the radiative heat sink temperature. Due to the dominant surface-to-surface radiation between E- and I-Bricks, the I-Brick temperature variation is highly dependent on the temperature variation of the E-Brick. The coldest spot in the Brick stack is on the I-Brick, which is the most distant to E-Brick and in contact with the furnace floor.
The temperature gradient is estimated, and the total magnitude of the temperature gradient is shown in Figure 5d. Temperature gradient is an important parameter to track, as it leads to thermal stress that may cause fractures in ceramic materials if its magnitude is high. The peak temperature gradient is seen on the I-Brick’s bottom surface in contact with the floor mainly due to the heat transfer with the much colder ambient. Overall, the temperature gradient increases in the E-Brick in the direction of the core to the skin because of the accumulation of volumetric heat generation. Due to steady conditions and surface area of the inner and outer walls of the I-Brick, the I-Brick’s inner surface experiences higher heat fluxes than the outer surface, so the temperature gradient follows.
Static Structural Model Results
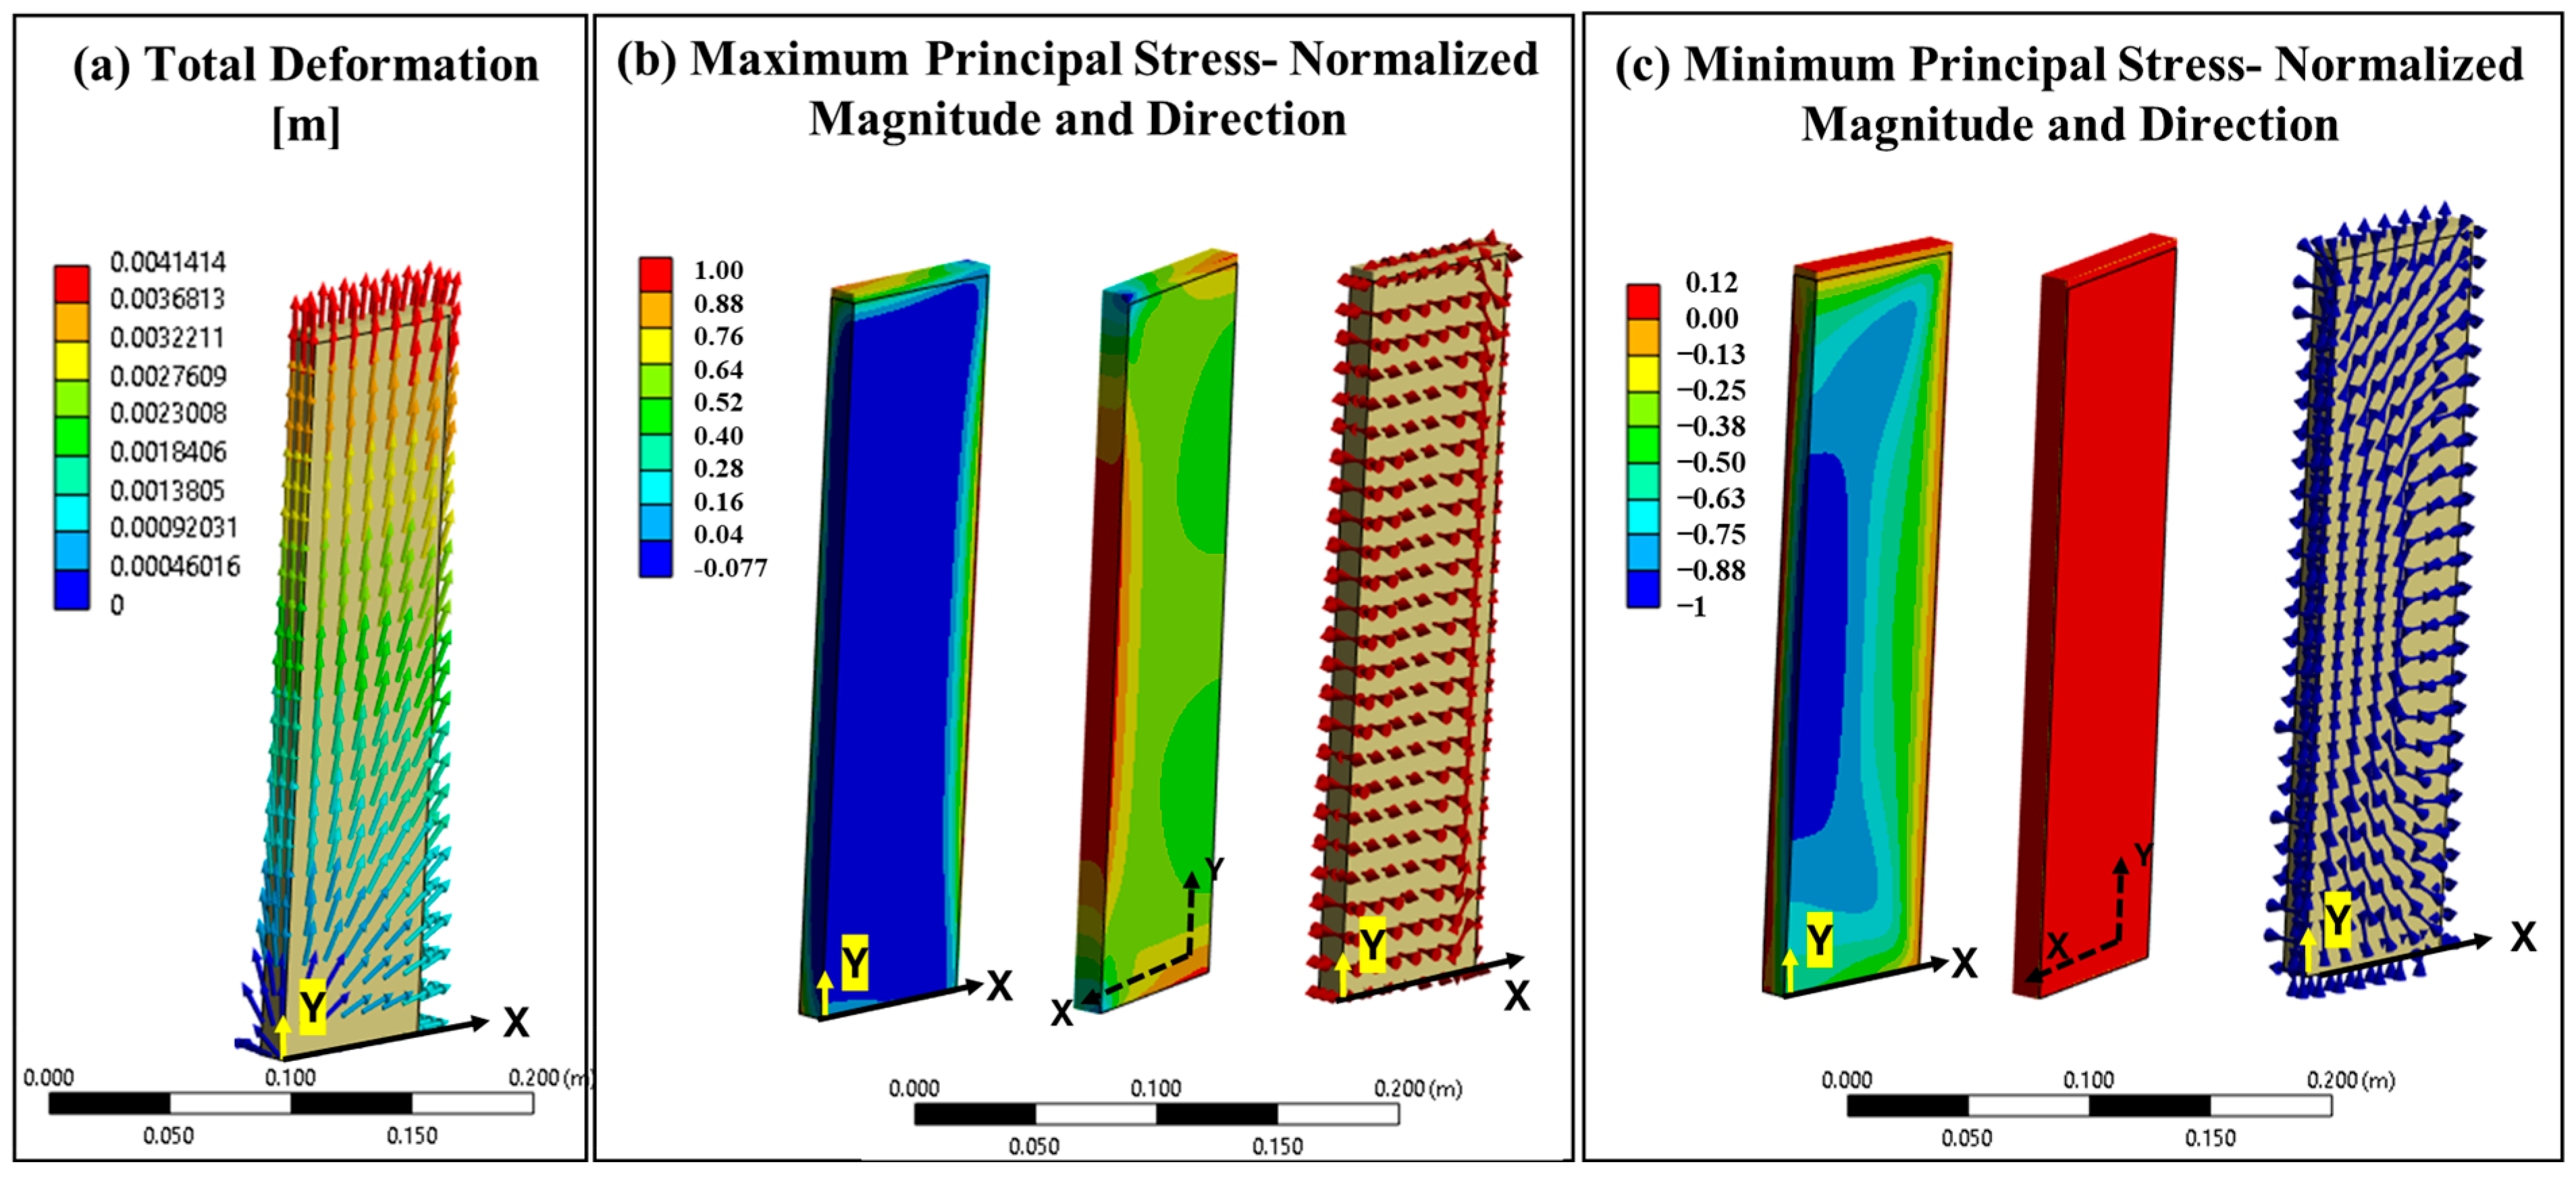
The E-Brick thermal load shown in Figure 5b was input into the static–structural model. Based on this thermal load, deformation in all directions is estimated. Total deformation magnitude and direction are given in Figure 6a. Deformation is zero at the origin point due to the combination of symmetry planes on each side and the prescribed zero displacement (in y-direction) boundary condition on the bottom to create a virtual floor. In addition, Figure 6a,b shows maximum and minimum principal stresses along with its normalized magnitudes and directions. Positive magnitudes represent tensile, while negative magnitudes represent compressive stresses. Based on these plots, it is evident that the majority of the E-Brick is in compression on the inside, whereas its skin mainly experiences tensile stresses. The core has a higher temperature and thus needs to expand more; therefore, the core is in compression, and minimum principal stresses magnitudes are higher in the core compared to the E-Brick surface. The vector directions typically depend on the thermal distribution and geometry of the heated body. It is reasonable in this case that the principal tensile stress is in the y-direction along the long axis of the rectangular element. Similarly, it follows that the principal stress swings in direction as the stress state transitions from tensile to compression toward the center. Accurate data on the principal stress distribution informs and guides system design for material optimization, element geometry, and operation limits.

2.3.2. Experimental Results and Validation of Numerical Model

Experimental Results
The experimental data are tabulated in Table 2, which includes local temperatures and voltage drop across two voltage measurement locations. The measurement locations are shown in Figure 3d, and exact locations are also included in Table 2 about the origin shown in Figure 1c. Note that the voltage probes were in contact with the E-Brick; however, the thermocouples beads were about 2 mm off the E-Brick surface. No correction factor was applied owing to the difficulty in estimating the temperature drop between the thermocouple and brick surface; at the temperatures studied, given the dominant radiation heat transfer and low mass of the thermocouples, it was assumed that the measured temperature can represent the brick’s surface temperature. This was necessary to obtain an accurate measurement with thermocouples and to electrically isolate the thermocouples from the E-Brick circuit, considering that the E-Brick is an electrically conductive material that forms a circuit. Four temperature measurements were made, three of them were located near the front face (F1, F2 and F4) and one of them near the side center (SC2) of the E-Brick. All measured temperatures were higher than the radiative heat sink temperature controlled at Ths = 1500 °C due to Joule heating of the E-Brick. Among the four temperature readings, the highest temperature was TSC2 = 1583 ± 4.86 °C. This was expected since the side center TC location, compared to the front TC location, was closer to the heating element’s core. The front TC measurements range from 1545.6 to 1559.5 °C. In addition, the voltage drop between SC1 and SC4 locations is calculated to be 33.03 V.
Numerical Model Validation with Experimental Data
The thermal–electric model’s three-dimensional numerical results were processed to obtain temperature and voltage data at specific locations, see Figure 3. Both experimental and numerical work corresponds to a heat sink temperature of Ths = 1500 °C for the same total electrical current passing through the entire E-Brick circuit. Numerical data compares favorably with the experimental data, with error magnitude and percentage shown in Table 2. Percent error in temperature data comparison was calculated by ( T n u m T e x p . ) × 100 / ( T e x p . T h s ) . The error magnitude is within the uncertainty of the measurements for TF1, TF4, and ΔVSC1-SC4, whereas it is slightly higher than the inaccuracy limits for TF2 and TSC2. The ± 4.86 °C uncertainty of the thermocouples corresponds to ± 8.74% acceptable error. The highest error belongs to TF2 measurement location with 5.3 °C (9.5%). The slightly higher error of TF2 and TSC2 could be due to multiple factors, such as inaccuracies in material properties that go into the model (e.g., temperature-dependent properties: electrical resistivity, thermal conductivity), the accuracy of the boundary conditions in the model (e.g., heat loss estimation from furnace floor), the accuracy of controlled furnace temperature in experiments, the accuracy of thermocouple positioning within the furnace and within its alumina sheath, and the possible spatial variation of furnace wall temperature that was not measured and not captured in the model. Accounting for these uncertainty factors mentioned above, it is considered that the model successfully predicted the temperature and voltage drop behavior of an electrically charged brick stack in a radiative cooling condition.

3. System-Level Discharging Brick Stack

This section focuses on the thermal performance of Joule HiveTM Thermal Battery (JHTB), an electrically heated thermal storage system that can store and provide high-process heat up to 1800 °C. The JHTB consists of 48 rows of electrically conductive bricks (E-Brick) stacked in a snaking path and surrounded by insulating bricks (I-Brick). E-Bricks are the heating elements, and all bricks store heat and act as heat exchangers. The channels between I-Brick columns allow fluid flow, take in cold gas, and provide hot gas output. Figure 7 shows a schematic of JHTB, the incoming cold flow, and the outgoing hot flow. The JHTB system is approximately shipping container size and consists of N columns of the snaking path of bricks. As a result, there are N-1 air channels across the entire JHTB unit.

3.1. Methodology

3.1.1. Geometry and Computational Domain

With appropriate symmetrical boundary conditions, the core of JHTB is reduced to a two-dimensional array of 48 brick stacks and half of one air channel. As shown in Figure 8, E-Bricks are surrounded by I-Bricks and the current model includes 48 brick assemblies, but since I-Bricks are connected, only one large I-Brick body is accounted for. Due to geometrical symmetry, only half of the bricks are included in the computational model. E- and I-Bricks do not touch each other and the gap between them is filled with air, which is called internal air in this study. In addition, there is forced airflow in the air channels between two neighboring I-Brick bodies. Due to symmetry, only half the air channel is included in the model. Air is assumed to be the ideal gas and has a variable density in the calculation. I-Bricks are made of mainly of Aluminum oxide whereas E-Bricks are of a mixture of Aluminum oxide and chromium oxide with special doping materials. The densities, thermal conductivities, and emissivities are known and were used as an input.

3.1.2. Governing Equations

Mass, momentum, and energy conservation equations (Equations (14)–(17)) are solved in addition to the surface-to-surface radiation and turbulent flow relations. Since the discharging scenario is modeled, there is no heat generation in the E-Bricks, and the source term of the energy equation is zero. The simulations are conducted on Ansys Fluent 2022R2. Due to the turbulent flow, Reynolds-averaged Navier-Stokes (RANS) equations are used, which input time-averaged values (see Equation (17)) of both vectoral and scalar parameters. The shear–stress transport (SST) k- ω model estimates the turbulent flow parameters that have a viscosity formulation to account for the transport effects of the principal turbulent shear stress [28].
ρ t + x i ρ u i = 0
t ρ u i + x i ρ u i u j = p x i + x i µ u i x j + u j x i 2 3 δ i j u i x j + x i ( ρ u i u j ¯ )
t ρ ( e + v 2 2 ) + · ρ v ( h + v 2 2 ) = · ( k + k t ) T j h i J J + τ e f f ̿ . v
u i = u i ¯ + u i ( v e l o c i t y   c o m p o n e n t s ) ;   φ = φ ¯ + φ   ( s c a l a r )
Turbulent flow relations: The following equations (Equations (18) and (19)) are the SST k- ω turbulent flow transport equations to obtain turbulent kinetic energy (k) and specific dissipation rate ( ω ) [28]:
t ρ k + x i ρ k u i = x j Γ k k x j + G k Y k
t ρ ω + x i ρ ω u i = x j Γ ω ω x j + G ω Y ω
Effective diffusivities are given in Equations (20) and (21), where turbulent viscosity is calculated by Equation (22) [28]:
Γ k = µ + µ t σ k
Γ ω = µ + µ t σ ω
µ t = ρ k ω 1 m a x 1 α * S   F 2 a 1 ω
where α * is the dampening coefficient of turbulent viscosity, calculated by Equation (23) and F 2 is shown in Equation (24) [28].
α * = α * β i 3 + ρ k µ ω R k 1 + ρ k µ ω R k
F 2 = t a n h m a x 2 k 0.09 ω k , 500 µ ρ y 2 ω 2
Model constants are given in Equation (25). The rest of the equations and relations of SST k- ω can be found in [28].
σ k , 1 = 1.176 ,   σ ω , 1 = 2.0 ,   σ k , 2 = 1.0 ,   σ ω , 2 = 1.168 ,   a 1 = 0.31 ,   β i , 1 = 0.075   β i , 1 = 0.0828 ,   α * = 1 ,   α = 0.52 , α 0 = 1 9 ,   β * = 0.09 ,   β i = 0.072 ,   R β = 8
Radiation: Due to high temperature application, the model must include radiation that dominates the heat transfer between the E-Bricks and I-Bricks. Surface-to-surface radiation was effective at the surfaces of E-Bricks and internal surfaces of I-Brick-facing E-Bricks. It is assumed that all surfaces are opaque, gray, and diffuse, and that the radiation between the surfaces is unaffected by the separating medium. Hence, the air domain separating the bricks (internal air) does not play a role in radiation but only by natural convection within the enclosure. The E-Brick’s and I-Brick’s emissivity measurements were conducted by a third party in an air-filled enclosure at 400–1450 °C that covers a spectral range of 1100–1650 nm. The emissivity data measured at different temperatures suggest that the emissivities are not a strong function of temperature.
Surface-to-surface radiation relations are as follows. The energy flux leaving a surface k ( q o u t , k ) can be written as shown in Equation (26) where q i n , k represents energy flux incident on surface k from the surroundings and ρ k is reflectivity of surface k. q i n , k could be written in terms of view factors ( F i j ) and q o u t of all surfaces in the enclosure, as seen in Equation (27), where F i j is a geometrical relation of two surfaces. Equation (27) can also be written as Equation (28) using radiosities and emissive power of surface k. To account for every surface k, Equation (28) can be transformed to a matrix form as given in Equation (29), which includes the matrix forms of radiosity and emissivity matrix where K is an N × N matrix [28].
q o u t , k = ε k σ T 4 + ρ k q i n , k
q o u t , k = ε k σ T 4 + ρ k j = i N F k j q o u t , j
J k = E k + ρ k j = i N F k j J j
K J = E

3.1.3. Initial, Boundary, and Interface Conditions

Initial Condition: At time = 0, the temperature is 1700 °C everywhere in the domain.
Boundary Conditions: Flow inlet and outlet boundaries were selected as inlet with prescribed mass flow rate and zero pressure outlet, respectively. Inlet turbulence conditions were specified based on turbulence intensity (5%) and turbulent viscosity ratio (10). Fluent’s default values were used since they were assumed to be reasonable. Domain boundaries on the left and right (visualized with green dashed line in Figure 2) are selected as symmetric boundaries due to geometrical symmetry since they represent the mid-line of bricks and air channel, respectively. Top and bottom boundaries, excluding inlet and outlet regions, are insulated walls.
Interface Conditions: There are several fluid–solid interface boundaries within the domain. At these locations, temperature and heat fluxes are matched. All solid walls are selected as stationary walls with no-slip conditions.

3.1.4. Operating Conditions and Parameters of the Numerical Analysis

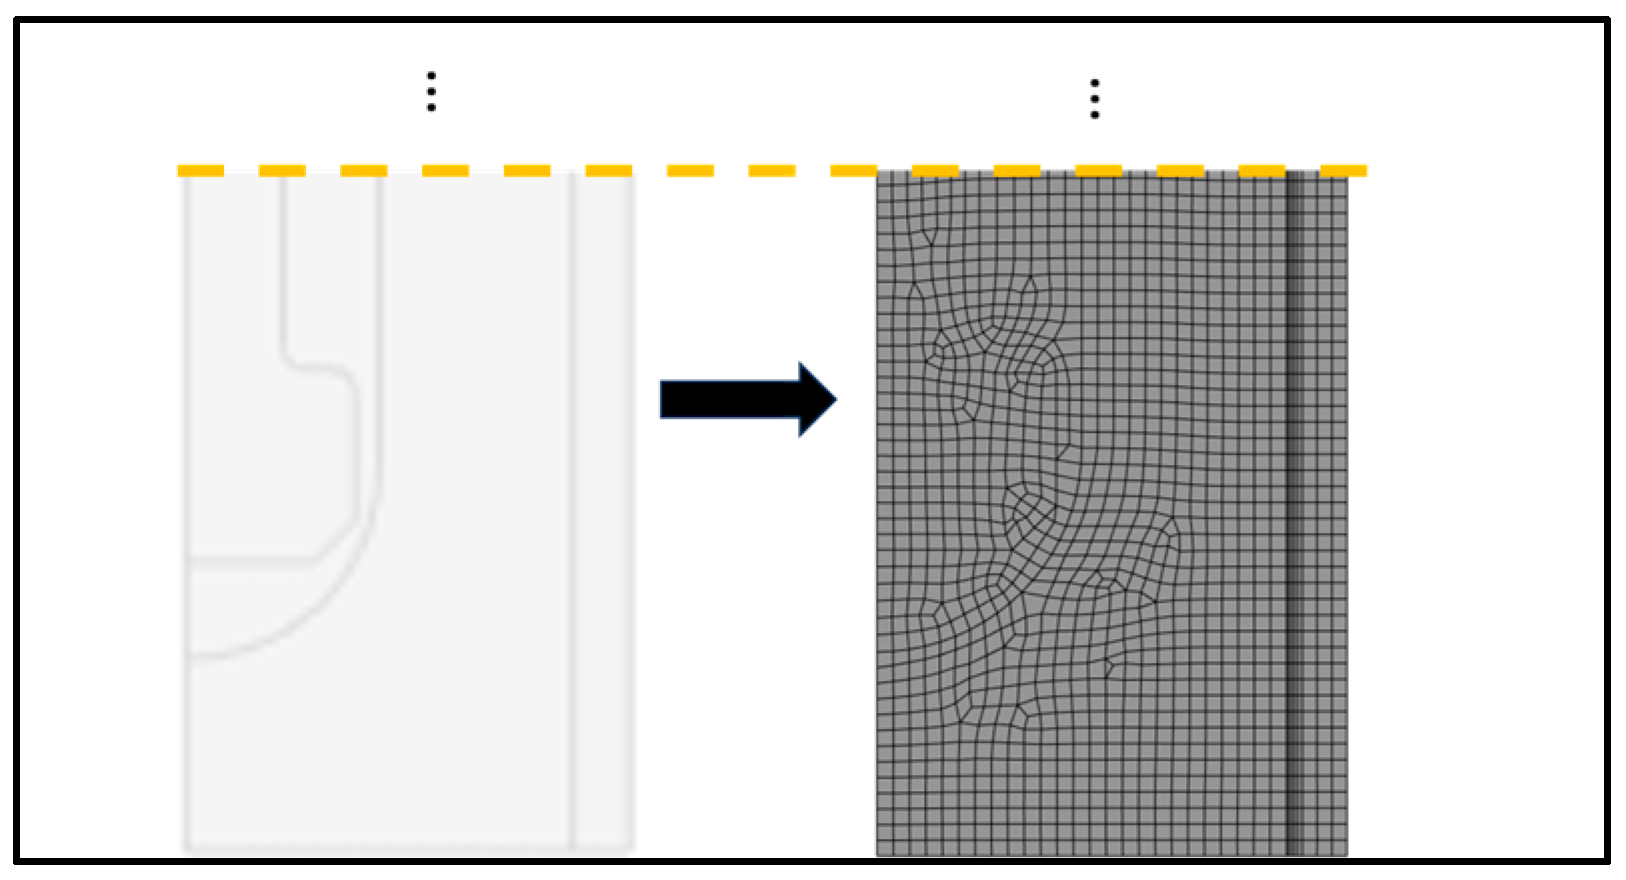
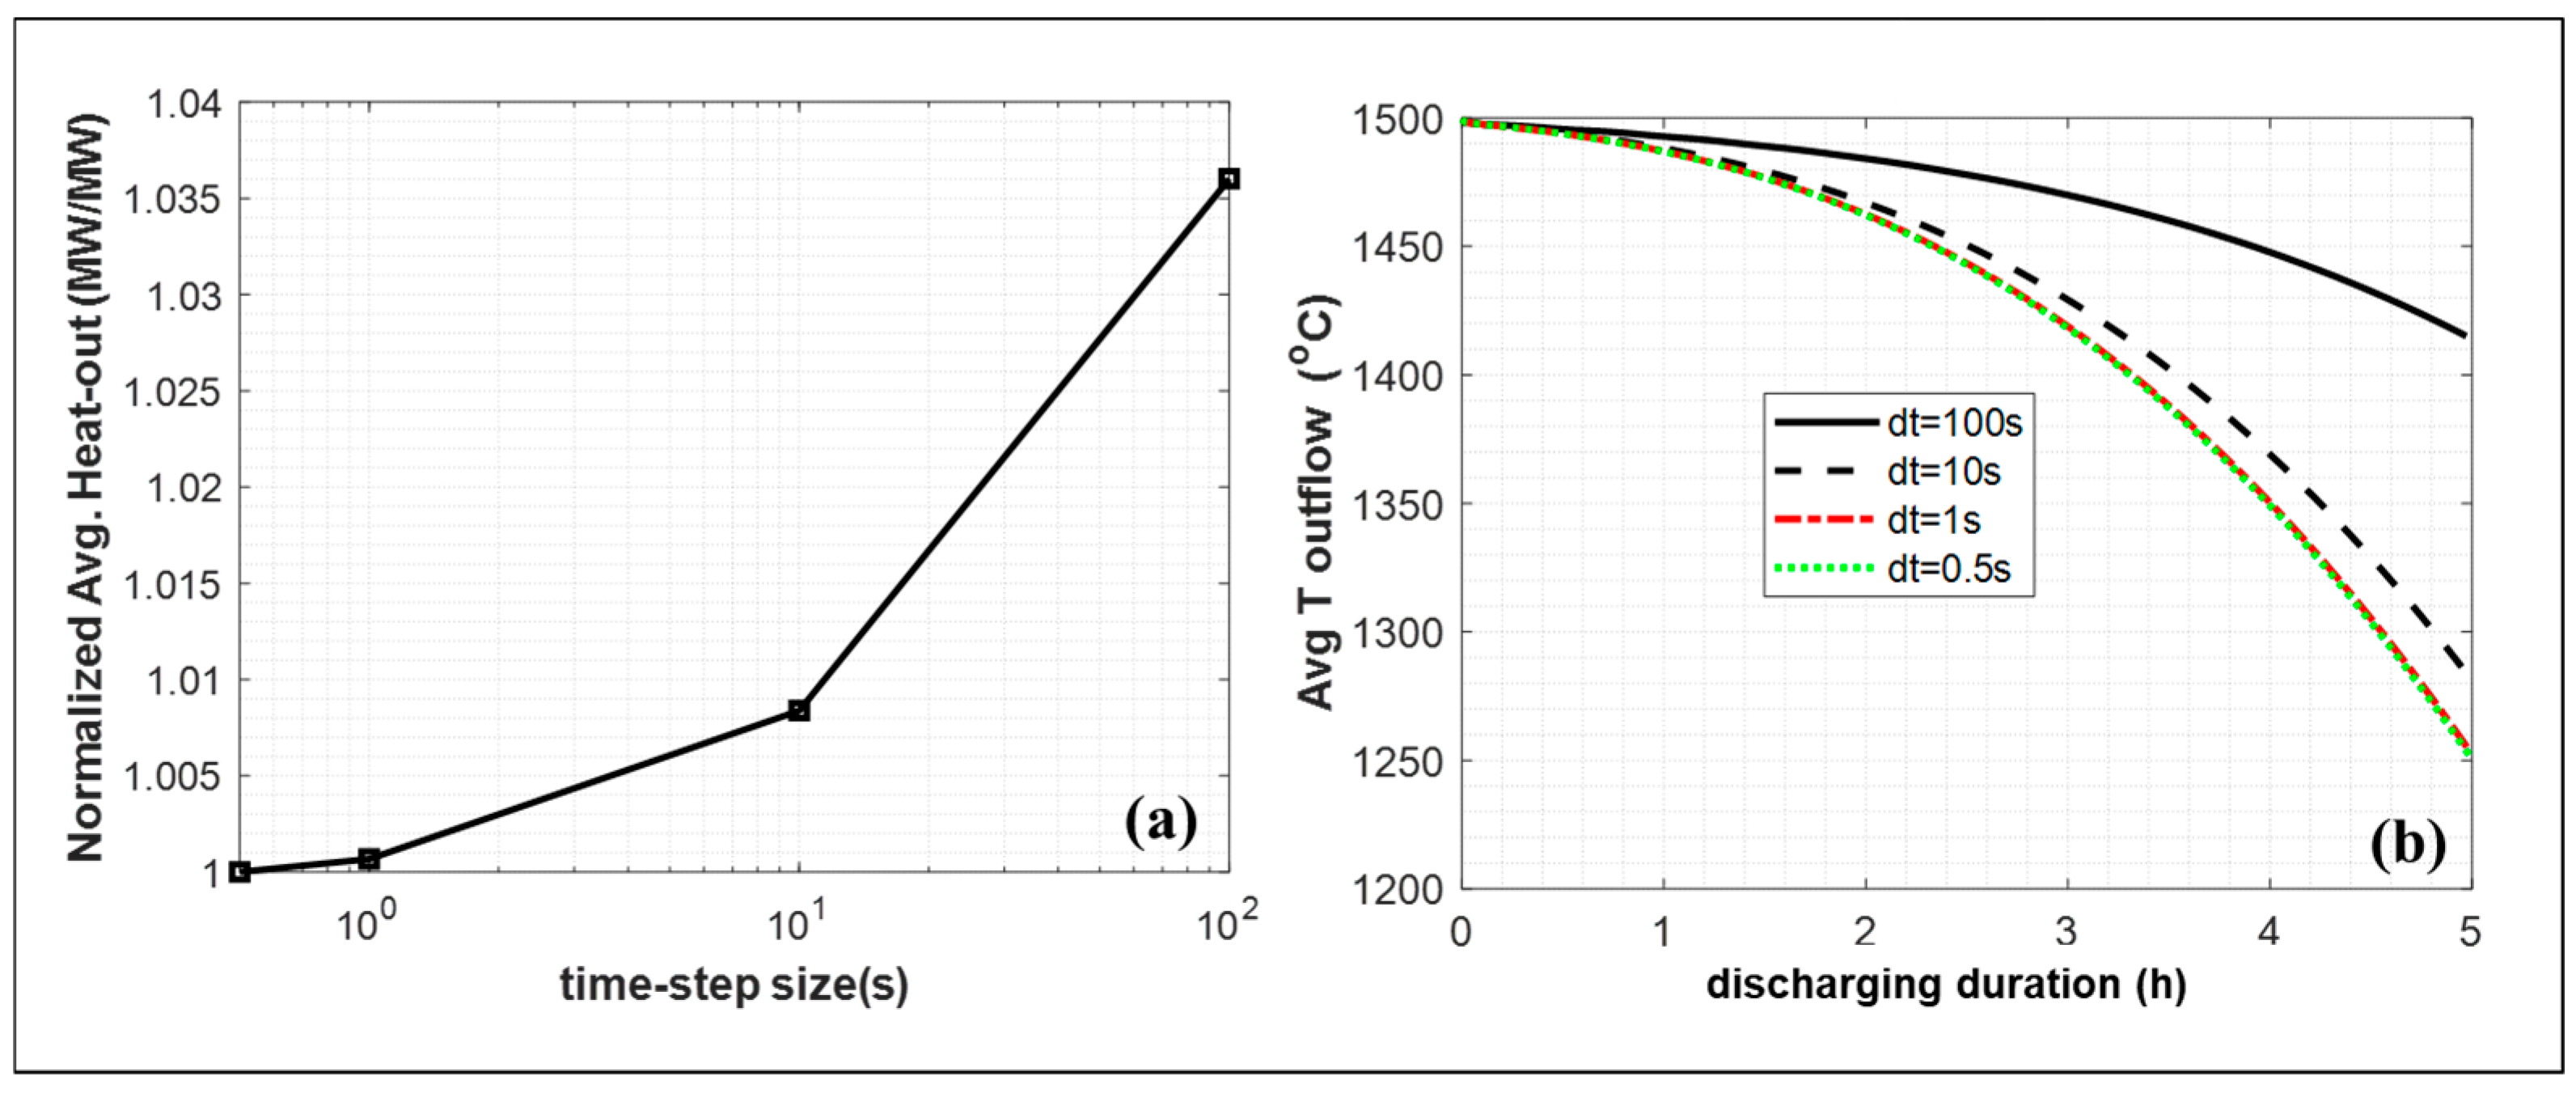
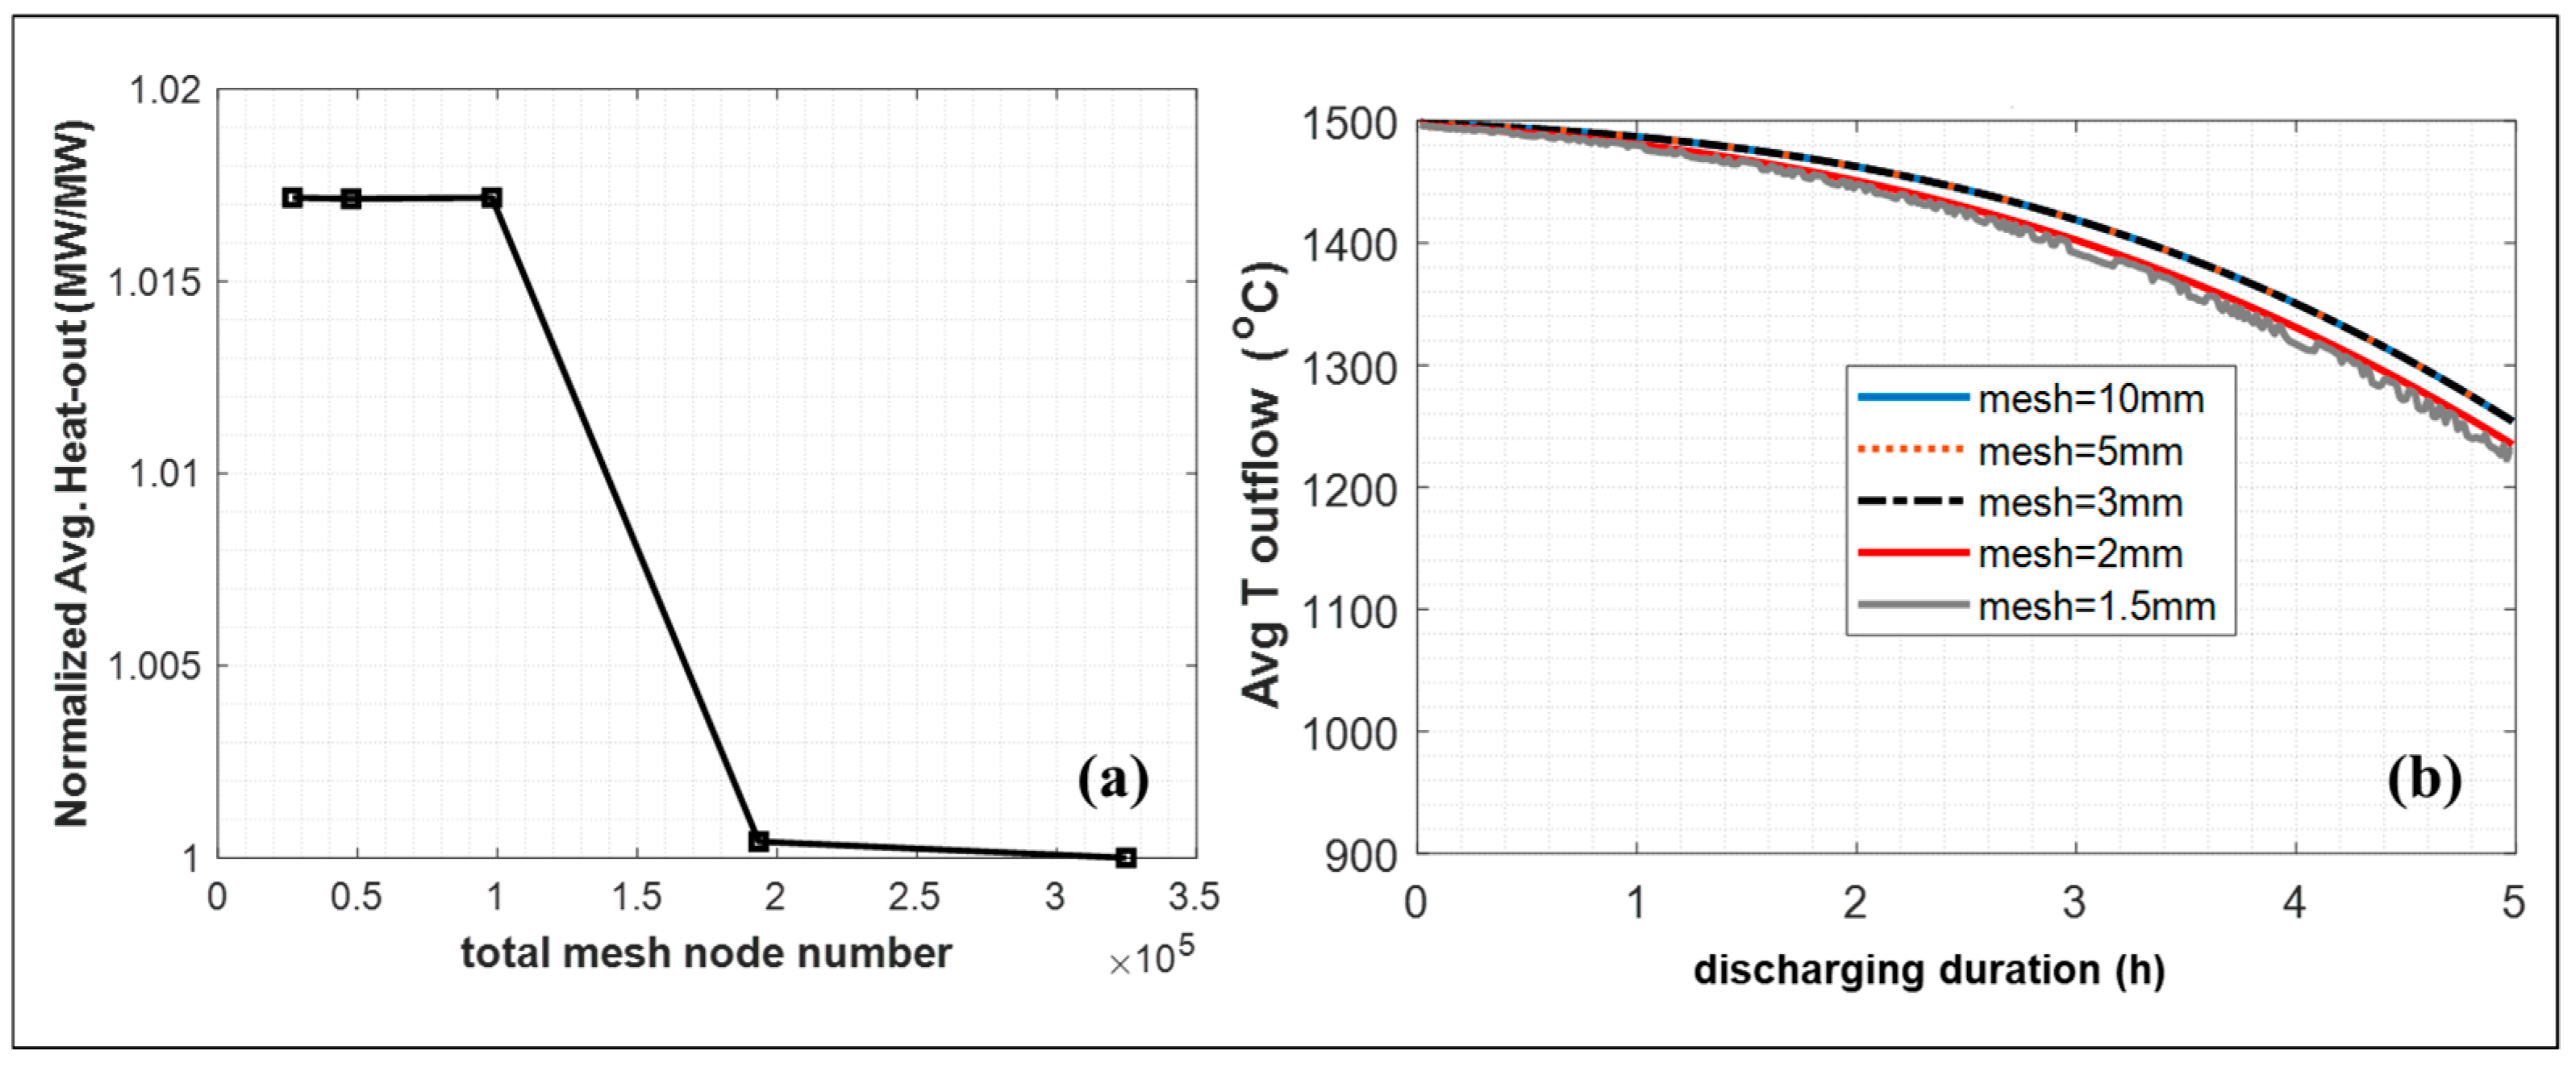
The two-dimensional domain is meshed with rectangular and triangular elements, including five inflation or boundary layer meshes on the air domain near the channel walls. A zoomed-in version of the meshing layout on the first half of row 1 can be seen in Figure 9. The finalized results are shown with 2 mm mesh and a time-step-size of 1 s, which was determined with mesh-size and time-step-size dependency studies where the summary of the most important results (outlet temperature and heat output) are given in Figure 10 and Figure 11. Note that the smallest mesh size studied in this work (1.5 mm) with the ideal time-step size (dt = 1 s) creates fluctuations with time signaling when mesh size is too small.
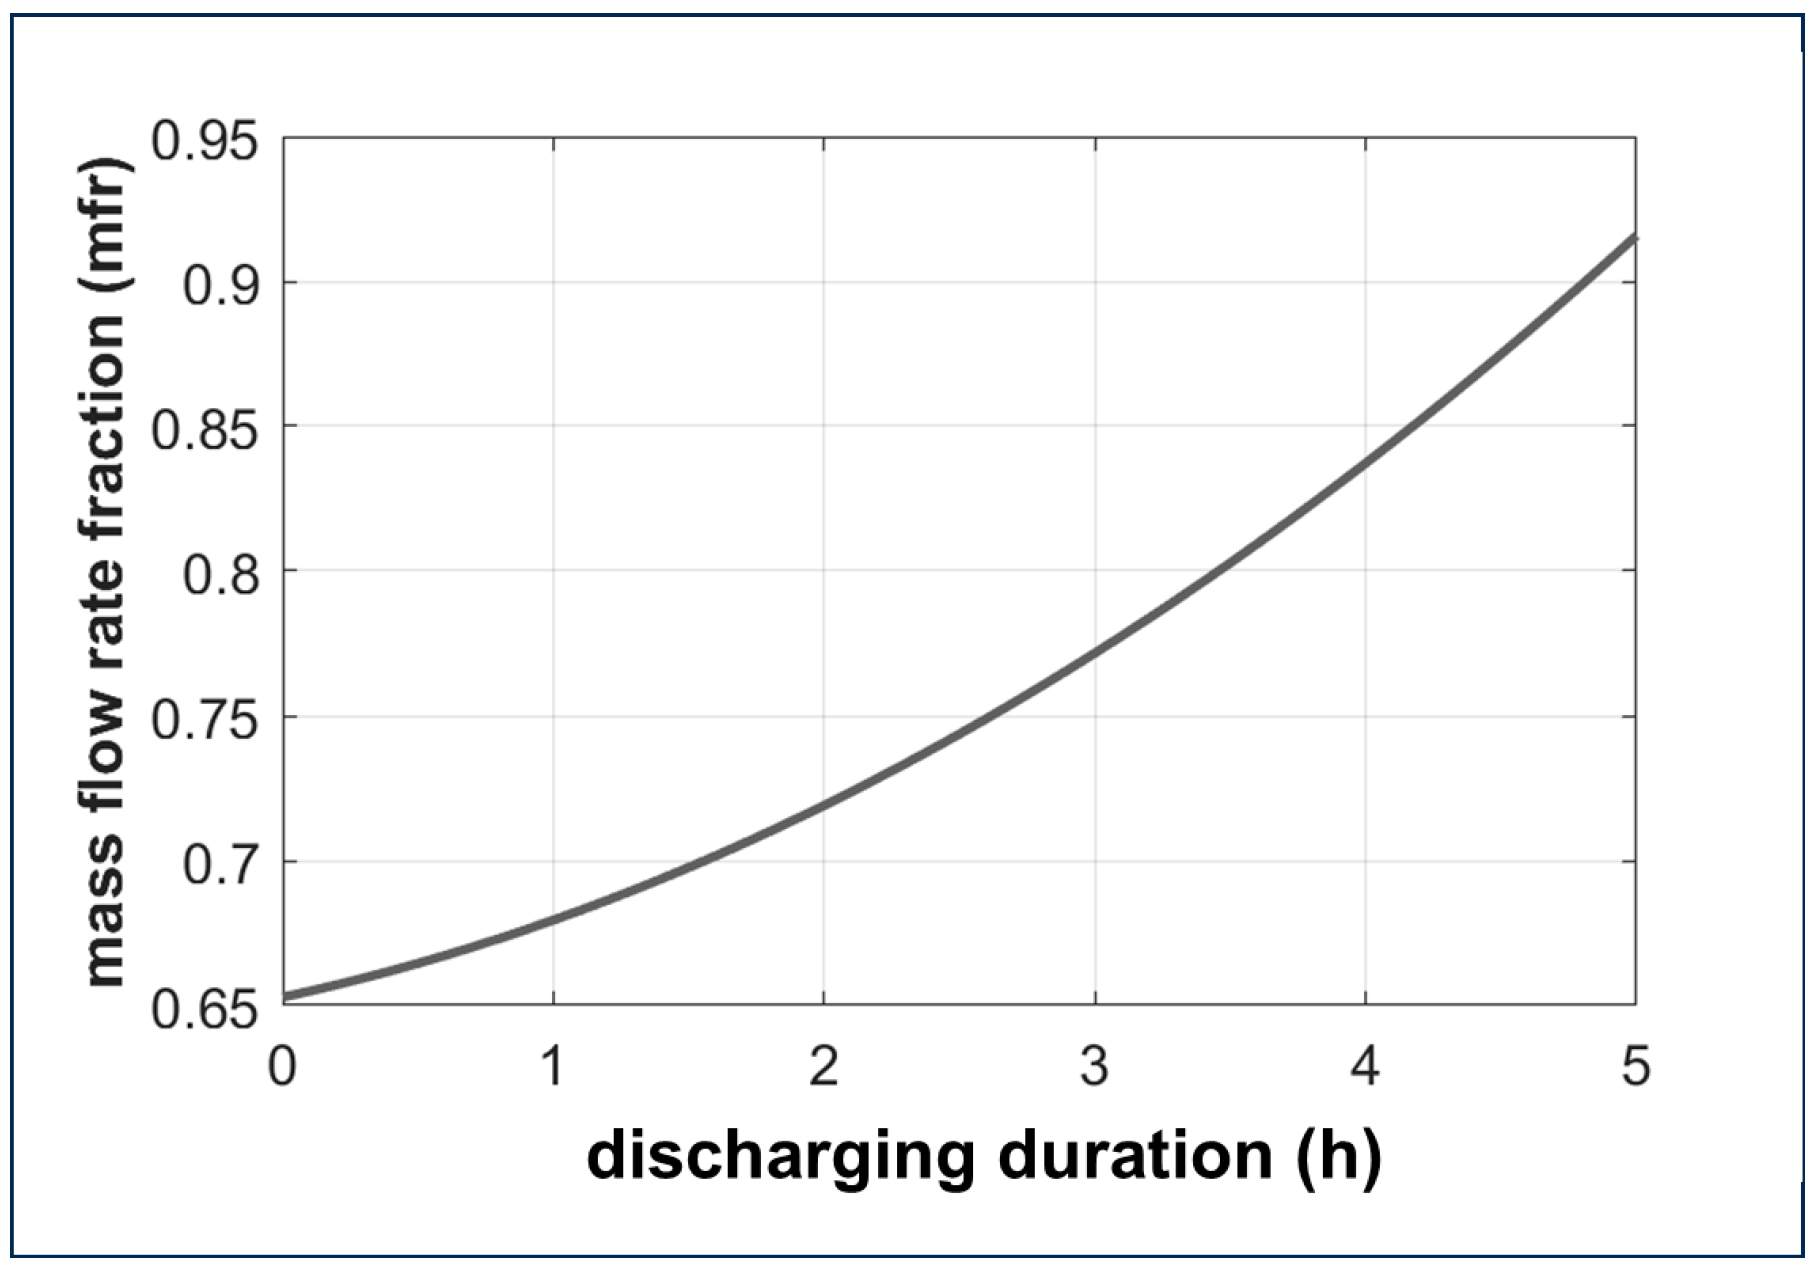
To maintain a constant level of power output during the discharging of JHTB, the airflow intake of JHTB needs to be varied with time. As air at 25 °C enters the JHTB, the JHTB’s temperature will decrease with time while the total energy of the system is depleted. If constant mass flow were being used, this would result in decreasing power output from the JHTB. Industrial applications require constant power output and, to achieve that, the mass flow rate should be varied or increased with time. In a real operation, the mass flow rate ratio would be controlled based on an algorithm that takes real-time measurements and estimates the overall power output. However, including this control-loop to the model is out of the scope of this study and instead a pre-determined potential mass flow rate ratio curve is used to balance out JHTB’s cooling down with time, and is shown in Figure 12. The data of Figure 12 stem from a previously conducted control analysis owned by Electrified Thermal Solutions, which focuses on discharging of simplified JHTB with constant desired power. Note that the purpose of this study is not to obtain a constant desired power level. Instead, the purpose is to assess whether a certain level of power and range of output temperatures are achievable. This assumes the thermal battery has a flow bypass system that allows only the desired mass flow rate to enter the thermal battery. In Figure 12, the mass flow rate ratio = 1 corresponds to the scenario where all available airflow passing through the JHTB, in this case, is 5 kg/s. Other operating conditions are given in Table 3.

3.2. Discussion of the System-Level Discharging Brick Stack

Transient temperature data are obtained at various locations along the JHTB system and stored at different times. Figure 13 shows the temperature of bricks and air at multiple locations for the channel width of 1.5 cm. The system is designed to operate for up to 5 h of discharge; therefore, the results are shown until t = 5 h. Several rakes are set up to visualize temperatures in different rows. Visualization of the rake locations can also be seen in Figure 13. For example, “rake-ee” corresponds to air temperature at the center of the air channel. At t = 0 s, the temperature everywhere is set at 1700 °C. At t = 100 s, brick temperatures are still very close to 1700 °C, but air temperature has risen significantly. At the t = 1 h plot, it is clearly visible that the upstream of JHTB bricks is becoming colder down to the 1200–1300 °C range. The further away from the air channel, the higher the brick temperature. Furthermore, the coldest brick temperatures are seen in the first row due to the coldest air temperatures and high convective heat transfer because of the flow entrance effects. As time passes, air and brick temperatures converge, and the difference becomes about 200 °C at the end of five hours of discharge. It is important to note that air temperature stays above 1000 °C at the exit for five hours.
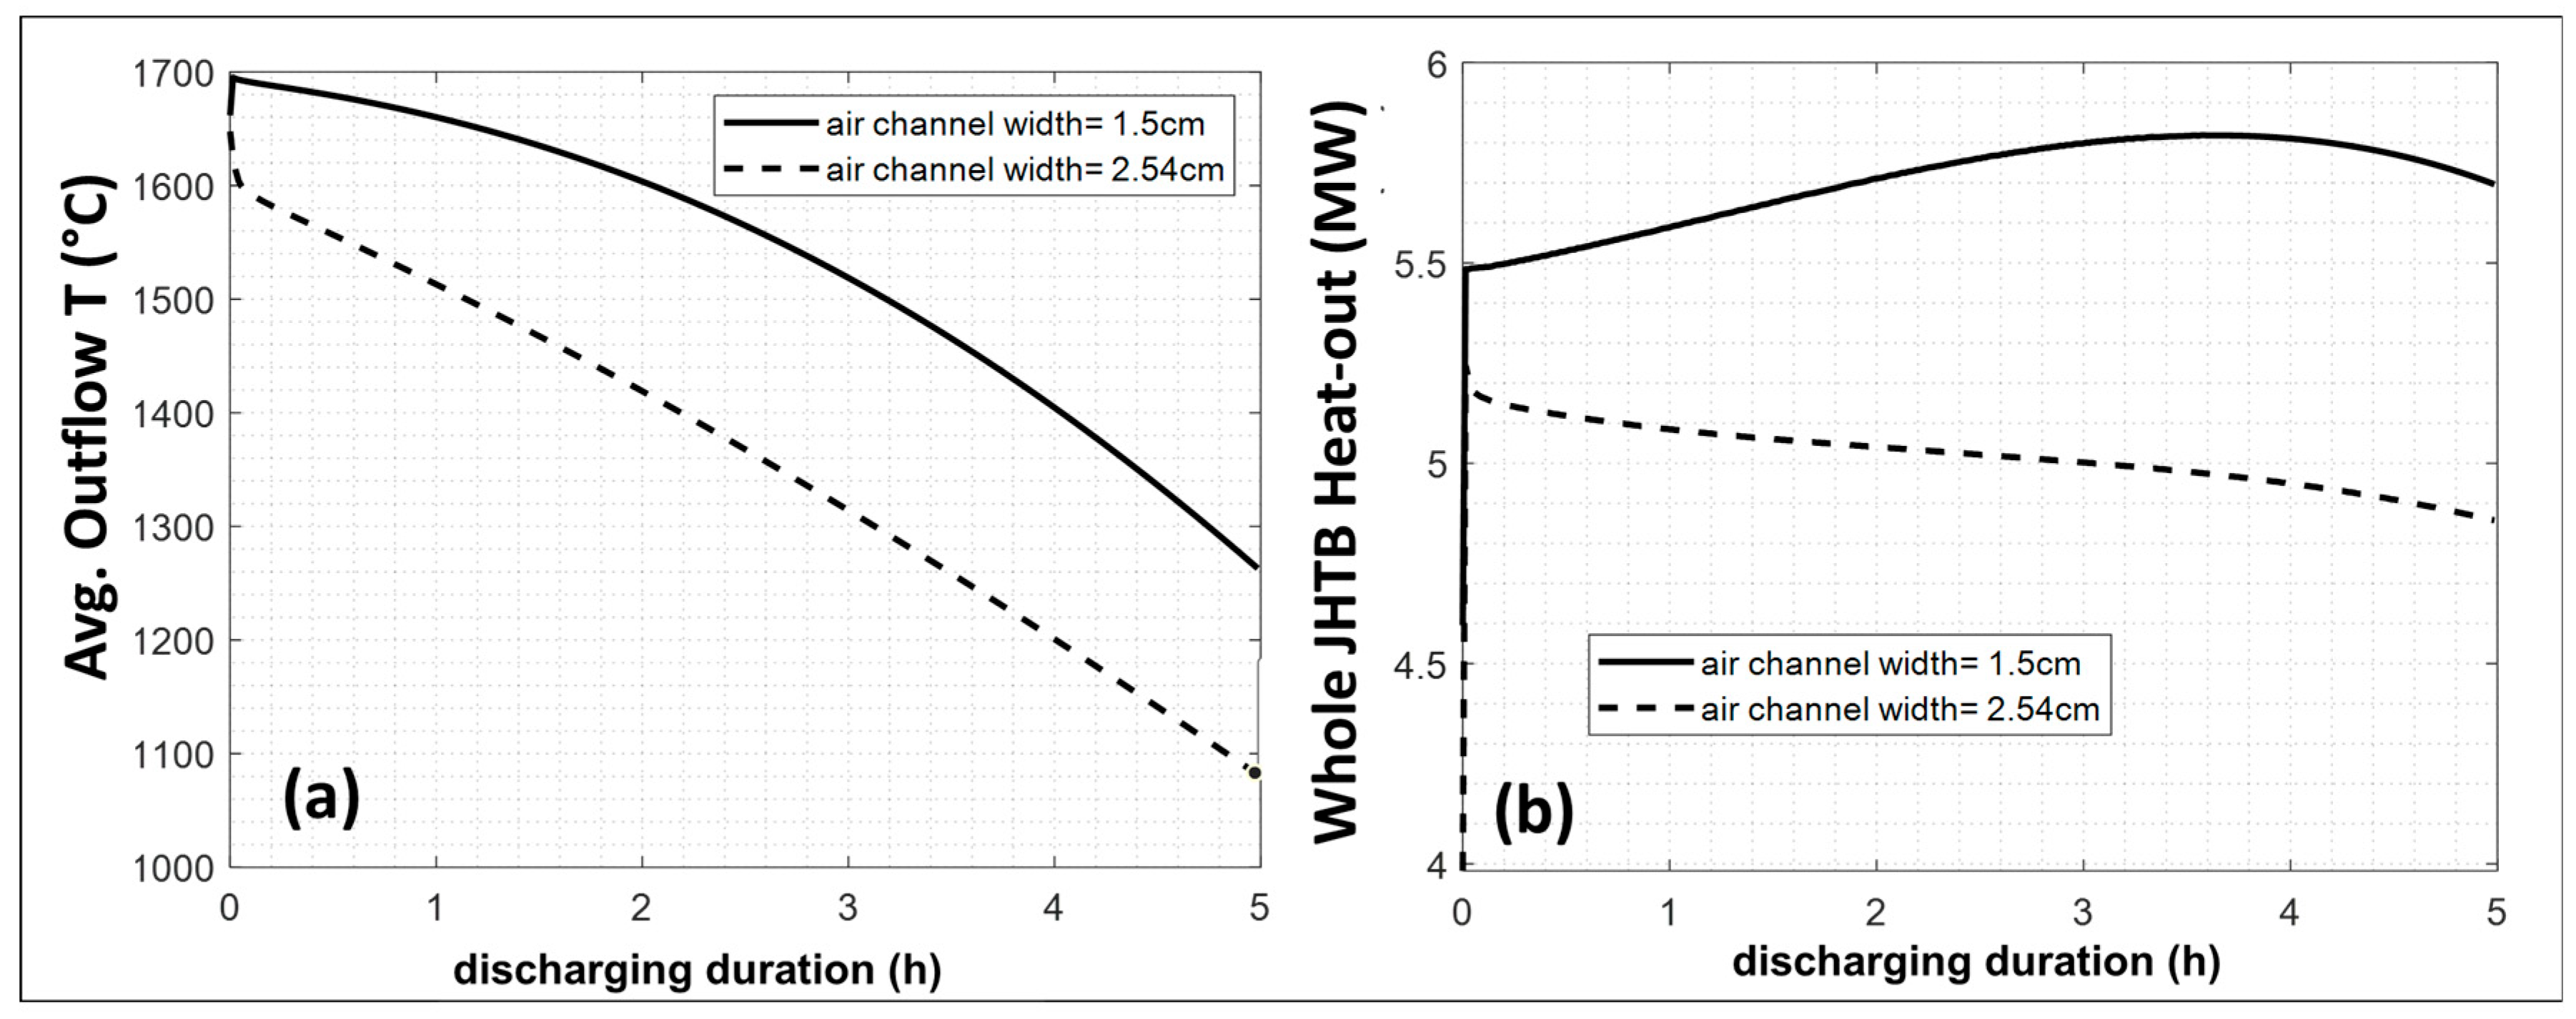
Figure 14a shows mass-flow averaged outlet temperatures with respect to discharging duration. As expected, averaged outlet temperatures are higher than the centerline air temperature, and for the 1.5 cm case, the outlet temperature becomes almost 1700 °C initially and stays well above 1200 °C for the entire five-hour period. Figure 14a displays the results for both channel widths, while the total mass flow inlet and number of channels are the same for both cases. Both cases start at a 1700 °C initial condition, which is also valid for the air in the channel. At around t = 0 s, the wider channel case shows a rapid decrease in outlet temperatures compared to the 1.5 cm channel case. This is because lower inlet velocities and thus lower convective heat transfer rates are expected in the wider channel width case. In fact, the 2.54 cm channel case’s average outlet temperature is about 200 °C lower than the baseline 1.5 cm channel case. For this case, the outlet temperature does not rapidly increase to 1700 °C as in the thinner channel case, but it maintains air temperatures more than 1000 °C.
To examine the overall JHTB system’s performance, outgoing heat must be calculated. To accomplish that, heat flux at the exterior wall of the I-Brick, the air channel wall, is integrated over the entire 48 rows. Then, the necessary geometrical parameters (number of channels, and JHTB height) are accounted for. The resultant JHTB heat output is plotted in Figure 14b for both channels. For the 2.54 cm channel width case, the output power decreases with time, which implies that the depletion of power with time and decreasing wall temperatures are more dominant effects than the increasing mass flow (due to the applied mass flow ratio). The balance between the two factors reverses for the 1.5 cm channel case before about 4 h, which signals that increasing the mass flow rate is more dominant. In other words, the declining power output due to energy depletion is delayed for the 1.5 cm case because the 1.5 cm design’s heat transfer performance is better than that of the 2.5 cm case. For both cases, the output power does not drastically decrease with discharge duration since more mass flow goes through the system with time due to the increasing mass flow rate ratio. Over five hours, the 1.5 cm and 2.54 cm channel width cases’ overall heat output averages 5.7 MW and 5.0 MW, respectively. Both cases demonstrate that the system is capable of delivering 5 MW for 5 h with air temperatures higher than 1000 °C.

4. Conclusions

This paper contributed to the literature by providing first-of-a-kind experimental and numerical data of Joule-heated electrically conductive bricks. It provided unique data for charging and discharging thermal battery technology in small (laboratory) and large (industrial) scales. It used the only new type of heating element invented in the last few decades for high-temperature applications. This was also the first study in the open literature experimentally showing that stacking bricks and building larger electrical circuits made of ceramics are practical and working.
This study presented a two-part analysis of the Joule Hive™ Thermal Battery (JHTB) developed by Electrified Thermal Solutions, Inc., focusing first on its core technology and the second on system-scale thermal performance. The first part involved experimental and numerical evaluation of the battery’s electrically conductive bricks (E-Bricks), which function as both heating elements and thermal storage media. A steady-state charge experiment was conducted on a 0.3-m E-Brick stack in a 1500 °C radiative furnace. Results showed good agreement with a two-way coupled thermal–electric model that accounted for temperature-dependent material properties, Joule heating, and radiative–convective losses. A structural model, informed by the thermal–electric simulation, revealed compressive stress at the E-Brick core and tensile stresses near the surfaces of the E-Bricks due to thermal expansion. The second part of the study modeled the discharging performance of the full JHTB system using high-fidelity conjugate heat transfer simulations. The transient model incorporated mass, momentum, and energy conservation, turbulent flow (via SST k-ω), and surface-to-surface radiation. Simulations showed that JHTB can deliver at least 5 MW of thermal power for five hours with outlet air temperatures exceeding 1000 °C across multiple channel configurations. These results validate JHTB’s performance and potential for high-temperature industrial decarbonization.

Author Contributions

Conceptualization, M.E.A., B.T., D.S. and J.K.; methodology, M.E.A. and D.M.; software, M.E.A.; validation, M.E.A.; formal analysis, M.E.A.; investigation, M.E.A. and D.M.; resources, M.E.A. and D.M.; data curation, M.E.A. and D.M.; writing—original draft preparation, M.E.A.; writing—review and editing, M.E.A., D.M. and B.T.; visualization, M.E.A.; supervision, B.T. and J.K.; project administration, B.T.; funding acquisition, B.T., D.S. and J.K. All authors have read and agreed to the published version of the manuscript.

Funding

The authors would like to acknowledge the financial support from the Advanced Research Projects Agency-Energy (ARPA-E, Award No. DE-AR0001481).

Data Availability Statement

The datasets presented in this article are not readily available because the data is proprietary material of Electrified Thermal Solutions. Inc. Requests to access the datasets should be directed at the corresponding author.

Conflicts of Interest

Authors Munevver Elif Asar, Daniel McKinley, Bao Truong, Joey Kabel and Daniel Stack were employed by the company Electrified Thermal Solutions, Inc. The authors declare that the research was conducted in the absence of any commercial or financial relationships that could be construed as a potential conflict of interest.

Nomenclature

AArea(m2)
D Elastic stiffness (stress–strain) matrix(Pa)
E Electric field in the thermal–electric model; or Young’s Modulus in the structural model, dmissive power in radiation equations(V/m; Pa; W/m2)
F i j View factor between surfaces i and j(-)
G Shear modulus(Pa)
G k Generation of k due to mean velocity gradients(kg/m/s3)
G ω Generation of ω (kg/m3/s3)
h c o n v Convection heat transfer coefficient(W/m2/K)
J Electric current density in thermal–electric equations, radiosity (in radiation), mass flux (in energy equation)(A/m2; W/m2; (kg/m2/s))
kThermal conductivity or turbulent kinetic energy(W/m2/K; m2/s2)
P Power dissipated due to Ohmic loss(W/m3)
q Energy flux(W/m2)
q i Net heat flux from surface i(W/m2)
q j o Radiosity (outgoing radiative flux) flux for surface j(W/m2)
Q g e n Volumetric heat generation term(W/m3)
RMSRoot mean square(-)
ReReynolds number(-)
SStrain rate(s−1)
tTime(s)
T Temperature(°C)
T B Bulk temperature of the adjacent fluid(°C)
T i Absolute temperature of surface i(K)
T h s Heat sink temperature(°C)
T s Surface temperature(°C)
uVelocity(m/s)
α s e Secant coefficient of thermal expansion(m/°C)
δ i j Kronecker delta(-)
v Poisson’s ratio(-)
σ Stress vector in structural equations(Pa)
Y k Dissipation of k due to turbulence(kg/m/s3)
Y ω Dissipation of ω due to turbulence(kg/m3/s3)
Γ Effective diffusivity(Pa-s)
ε Strain in the structural model (m/m)
εEmissivity in the thermal–electric model (-)
ε t h Thermal strain vector(m/m)
ρ Density, or electrical resistivity in thermal–electric equations, or reflectivity in radiation equations (kg/m3;Ohm-m; -)
ω Specific turbulent dissipation rate(s−1)
σ Stefan–Boltzmann
Constant in radiation equations
(W/m2/K4)
δ i j Visibility constant, 1 if d A i is visible to d A j and 0 if d A i is not visible to d A j (-)
φ Electric scalar potential(V)
τ ̿ Stress tensor(Pa)
µ Dynamic viscosity(Pa-s)
Subscripts
F#Front face measurement location of #th brick(-)
SC#Side center measurement location of #th brick(-)
x,y,zIn x, y, or z direction(-)
effEffective(-)
inIncoming(-)
kRelated to surface k(-)
outOutgoing(-)
tTurbulent(-)

References

  1. McKinsey & Company. Net-Zero Heat: Long Duration Energy Storage to Accelerate Energy System Decarbonization; LDES Council: Brussels, Belgium, 2022. [Google Scholar]
  2. Thiel, G.P.; Stark, A.K. To Decarbonize Industry, We Must Decarbonize Heat. Joule 2021, 5, 531–550. [Google Scholar] [CrossRef]
  3. Rissman, J.; Bataille, C.; Manaset, E.; Aden, N.; Morrow III, W.; Zhou, N.; Elliot, N.; Dell, R.; Heeren, N.; Huckestein, B.; et al. Technologies and Policies to Decarbonize Global Industry—Review and Assessment of Mitigation Drivers Through 2070. Appl. Energy 2020, 266, 114848. [Google Scholar] [CrossRef]
  4. U.S. Department of Energy. Industrial Decarbonization Roadmap; United States Department of Energy: Washington, DC, USA, 2022.
  5. Vishal, S.; Renil, A.; Gaitonde, U.; Rangan, B. Performance Analysis for glass Furnace Generator. Appl. Energy 2011, 88, 4451–4458. [Google Scholar]
  6. Laing, D.; Zunft, S. Using Concrete and other Solid Storage Media in Thermal Energy Storate System. In Advances in Thermal Energy Storage System; Elsevier: Amsterdam, The Netherlands, 2015; pp. 65–86. [Google Scholar]
  7. Gasia, J.; Miro, L.; Lusia, C. Review on Systerm and Materials Requirements for High Temperature Thermal Energy Storage. Part 1: General Requirements. Renew. Sustain. Energy Rev. 2017, 75, 1320–1338. [Google Scholar] [CrossRef]
  8. Gil, A.; Marc, M.; Martorell, I.; Lázaro, A.; Dolado, P.; Zalba, B.; Cabez, L. State of the Art on High Temperature Thermal Energy Storage for Power Generation. Part 1—Concepts, Materials and Modellization. Renew. Sustain. Energy Rev. 2010, 14, 31–35. [Google Scholar] [CrossRef]
  9. Sepulveda, N.; Jenkins, J.; Edington, A.; Mallapragada, D.; Lester, R. The Design Space for Long-Duration Energy Storage in Decarbonized Power Systems. Nat. Energy 2021, 6, 505–516. [Google Scholar] [CrossRef]
  10. Resistance Heating Alloys and Systems for Industrial Systems. Available online: https://www.kanthal.de/globalassets/kanthal-global/downloads/resistance-heating-alloys-and-systems-for-industrial-furnaces_b_eng_lr.pdf (accessed on 1 August 2023).
  11. Friedmann, S.Z.; Tang, K. Low-Carbon Heat Solutions for Heavy Industry, Sources, Options and Costs Today; Columbia|SIPA Centre for Global Energy Policy: New York, NY, USA, 2019. [Google Scholar]
  12. IRENA. Making Breakthrough: Green Hydrogen Policies and Technology Costs; IRNEA: Abu Dhabi, United Arab Emirates, 2021. [Google Scholar]
  13. Stack, D. Development of High Temperature FireBrick Resistance-Heated Enery Storage (FIRES) Using Doped Ceramic Heating System. Ph.D. Thesis, MIT, Cambridge, MA, USA, 2021. [Google Scholar]
  14. Hensler, J.; Henry, E. Electrical Resistance of Some Refractory Oxides and Their Mixtures in the Temperature Range 600 to 1600C. J. Am. Ceram. Soc. 1953, 36, 76–83. [Google Scholar] [CrossRef]
  15. Stack, D.; Forsberg, C. Electrically Conductive Firebrick System. United States Patent US20220132633A1, 31 August 2021. [Google Scholar]
  16. IEA. The Challenge of Reaching Zero Emissions in Heavy Industry; IEA: Paris, France, 2020. [Google Scholar]
  17. Stack, D.; Curtis, D.; Forsberg, C. Performance of Firebrick Resistance Energy Storage for Industrial Heat Applications and Round Trip Electricity Storage. Appl. Energy 2019, 242, 782–796. [Google Scholar] [CrossRef]
  18. Zetterholm, J.; Ji, X.; Sundelin, B.; Martin, P.; Wang, C. Model Development of a Blast Furnace Stove. In Proceedings of the 7th International Conference on Applied Energy, Milan, Italy, 28–31 March 2015. [Google Scholar]
  19. Serrazina, R.; Vilarinho, P.M.; Senos, A.M.; Pereria, L.; Reaney, I.M.; Dean, J. Modelling the particle contact influence on the Joule heating and temperature distribution during FLASH sintering. J. Eur. Ceram. Soc. 2020, 40, 1205–1211. [Google Scholar] [CrossRef]
  20. Holland, T.; Anselmi-Tamburini, U.; Quach, D.; Tran, T.B.; Mukherjee, A.K. Effects of Local Joule Heating During the Field Assisted Sintering of Ionic Ceramics. J. Eur. Ceram. Soc. 2012, 32, 3667–3674. [Google Scholar] [CrossRef]
  21. Grasso, S.; Sakka, Y.; Rendtorff, N.; Hu, C.; Maizza, G.; Borodianska, H.; Vasylkiv, O. Modeling of the temperature distribution of flash sintered zirconia. J. Ceram. Soc. Jpn. 2011, 119, 144–146. [Google Scholar] [CrossRef]
  22. Liu, F.; Zhao, Z.; Ma, Y.G.Y.; Li, J.; Hu, X.; Ye, Z.; Dong, D. Robust Joule-heating ceramic reactors for catalytic CO oxidation. J. Adv. Ceram. 2022, 11, 1163–1171. [Google Scholar] [CrossRef]
  23. Ansys Mechanical, Finite Element Analysis (FEA) Software for Structural Engineering. Available online: https://www.ansys.com/products/structures/ansys-mechanical (accessed on 30 September 2024).
  24. Ansys Fluent Fluid Simulation Software. Available online: https://www.ansys.com/products/fluids/ansys-fluent (accessed on 20 October 2023).
  25. Asar, M.E.; Stack, D.C.; Truong, B. Conjugate Heat Transfer Analysis of Discharging Joule Hive Thermal Battery. In Proceedings of the ASTFE 9th Thermal and Fluids Engineering Conference, Corvallis, OR, USA, 21–24 April 2024. [Google Scholar]
  26. Asar, M.E.; McKinley, D.; Truong, B.; Kabel, J. Characterizing Thermal, Electric, and Structural Responses of Electrically Charged Firebricks For Industrial Thermal Battery Applications. In Proceedings of the American Society of Thermal and Fluids Engineers (ASTFE) 10th Thermal and Fluids Engineering Conference, Washington, DC, USA, 9–12 March 2025. [Google Scholar]
  27. ANSYS. Theory Reference; ANSYS Inc.: Canonsburg, PA, USA, 2023. [Google Scholar]
  28. ANSYS. Ansys Fluent Theory Guide; ANSYS Inc.: Canonburg, PA, USA, 2023. [Google Scholar]
Figure 1. (a) Computational domain of the numerical model: quarter brick stack and furnace floor, (b) symmetry planes, and (c) dimensions of the numerical domain.
Energies 18 04461 g001
Figure 2. Mesh elements of (a) the thermal–electric model and (b) the structural model—zoomed-in visual.
Energies 18 04461 g002
Figure 3. Experimental setup: (a) high-temperature refractory furnace-rear and side walls; (b,c) brick stack in two different angles on the furnace floor and the platinum rod in (b); (d,e) CAD model of E-Brick and I-Brick stack illustrating probe locations, platinum electrodes, and the holes made for diagnostics.
Energies 18 04461 g003
Figure 4. Thermal–electric model results. Electric current density map of entire E-Brick (left) and at a cross section of E-Brick with zoomed-in visual (right).
Energies 18 04461 g004
Figure 5. Thermal–electric model results: (a) voltage and (b) Joule heat in the E-Brick body; (c) temperature and (d) temperature gradient magnitude in E- and I-Brick bodies. (All absolute magnitudes, no normalization).
Energies 18 04461 g005
Figure 6. Static–structural model results. (a) Total deformation magnitude and direction; (b) normalized stress magnitudes and vector principal directions of (b) maximum principal stress, and (c) minimum principal stress.
Energies 18 04461 g006
Figure 7. The JHTB system comprises 48 × N (column × row) bricks and N-1 parallel air channels.
Energies 18 04461 g007
Figure 8. Computational domain of 48 rows of bricks and a close-up image showing the first 2.5 rows.
Energies 18 04461 g008
Figure 9. Mesh elements on a portion of the computational domain (half of row 1) for the case with a 1.5 cm air channel.
Energies 18 04461 g009
Figure 10. Time-step-size dependency analysis results with Tinit = 1500 °C and 1.5 cm air channel. (a) Normalized heat output and (b) average output temperatures with four different time step sizes.
Energies 18 04461 g010
Figure 11. Mesh-size dependency results conducted with dt = 1 s and Tinit = 1500 °C and 1.5 cm air channel. (a) Normalized heat output and (b) average output temperatures with five different time step sizes.
Energies 18 04461 g011
Figure 12. Mass flow rate ratio vs. discharging duration.
Energies 18 04461 g012
Figure 13. Temperature at different locations at (a) t = 100 s, (bf) t = 1–5 h for channel width of 1.5 cm (Case 1).
Energies 18 04461 g013
Figure 14. (a) Average outlet temperature and (b) JHTB system heat-out vs. discharging duration for two air channel widths.
Energies 18 04461 g014
Table 1. Mesh dependency analysis of the structural model.
Mesh SizeNormalized
Maximum σ 1
% Difference Between the
1 mm Case
Maximum Total
Deformation
% Difference Between the
1 mm Case
[m][Pa/Pa] [m]
0.0050.98621.37%0.0041410%
0.0040.99040.95%0.0041410%
0.0030.99350.63%0.0041410%
0.0020.99720.28%0.0041410%
0.0011 0.004141
Table 2. Comparison of experimental and numerical data at Ths = 1500 °C and for the selected input current.
X-Location
[mm]
Y-Location
[mm]
Z-Location
[mm]
ExperimentalNumericalError (num.-exp.)
TF1 [°C]8338.101545.6 ± 4.861548.63 (6.6%)
TF2 [°C]83114.301555.7 ± 4.861561.65.3 (9.5%)
TF4 [°C]83266.701559.5 ± 4.861557−2.5 (−4.2%)
TSC2 [°C]0114.314.71583.0 ± 4.861576.9−6.1 (7.3%)
ΔVSC1-SC4 [V]012.6–241.412.733.03 ± 1.5134.071.04 (3.01%)
Table 3. Operating conditions.
Case 1Case 2
Air channel width1.5 cm2.54 cm
Total mass flow rate across all air channels in JHTB5 kg/s × (mass flow rate ratio)5 kg/s × (mass flow rate ratio)
Mass flow rate ratioVaries from 0.6 to 0.9 as a function of time/discharge duration, see Figure 12Same as Case 1
Tinlet,flow25 °C25 °C
Initial temperature of JHTB1700 °C1700 °C
Disclaimer/Publisher’s Note: The statements, opinions and data contained in all publications are solely those of the individual author(s) and contributor(s) and not of MDPI and/or the editor(s). MDPI and/or the editor(s) disclaim responsibility for any injury to people or property resulting from any ideas, methods, instructions or products referred to in the content.