Article

Heat Exchange Effectiveness and Influence Mechanism of Coaxial Downhole in the Alpine Region of Xining City, Qinghai Province

1
Key Laboratory of Environmental Geology of Qinghai Province, Bureau of Environmental Geology Exploration of Qinghai Province, Xining 810007, China
2
Qinghai Engineering Research Center of Geoenvironment Protection and Geohazard Prevention, Xining 810007, China
3
Qinghai 906 Engineering Survey and Design Institute Co., Ltd., Xining 810000, China
4
School of Water Resources and Environment, Hebei GEO University, Shijiazhuang 050031, China
*
Author to whom correspondence should be addressed.
Energies 2025, 18(16), 4451; https://doi.org/10.3390/en18164451
Submission received: 17 June 2025 / Revised: 13 August 2025 / Accepted: 19 August 2025 / Published: 21 August 2025

Abstract

To enhance the development efficiency of medium–deep geothermal resources in cold regions, this study focuses on a coaxial borehole heat exchanger (CBHE) located in Dapuzi Town, Xining City, Qinghai Province. Based on field-scale heat exchange experiments, a three-dimensional numerical model of the CBHE was developed using COMSOL Multiphysics 6.2, incorporating both conductive heat transfer in the surrounding geological formation and convective heat transfer within the wellbore. The model was calibrated and validated against measured data. On this basis, the effects of wellhead injection flow rate, injection temperature, and the thermal conductivity of the inner pipe on heat exchange performance were systematically analyzed. The results show that in cold regions with high altitudes (2000–3000 m) and medium–deep low-temperature geothermal reservoirs (68.8 °C), using a coaxial heat exchange system for space heating delivers good heat extraction performance, with a maximum average power output of 282.37 kW. Among the parameters, the injection flow rate has the most significant impact on heat extraction. When the flow rate increases from 10 m3/h to 30 m3/h, the heat extraction power increases by 57.58%. An increase in injection temperature helps suppress thermal short-circuiting and improves the effluent temperature, but excessively high temperatures lead to a decline in heat extraction. Additionally, increasing the thermal conductivity of the inner pipe significantly intensifies thermal short-circuiting and reduces overall heat exchange capacity. Under constant reservoir conditions, the thermal influence radius expands with both depth and operating time, reaching a maximum of 10.04 m by the end of the heating period. For the CBHE system in Dapuzi, maintaining an injection flow rate of 20–25 m3/h and an injection temperature of approximately 20 °C can achieve an optimal balance between effluent temperature and heat extraction.

1. Introduction

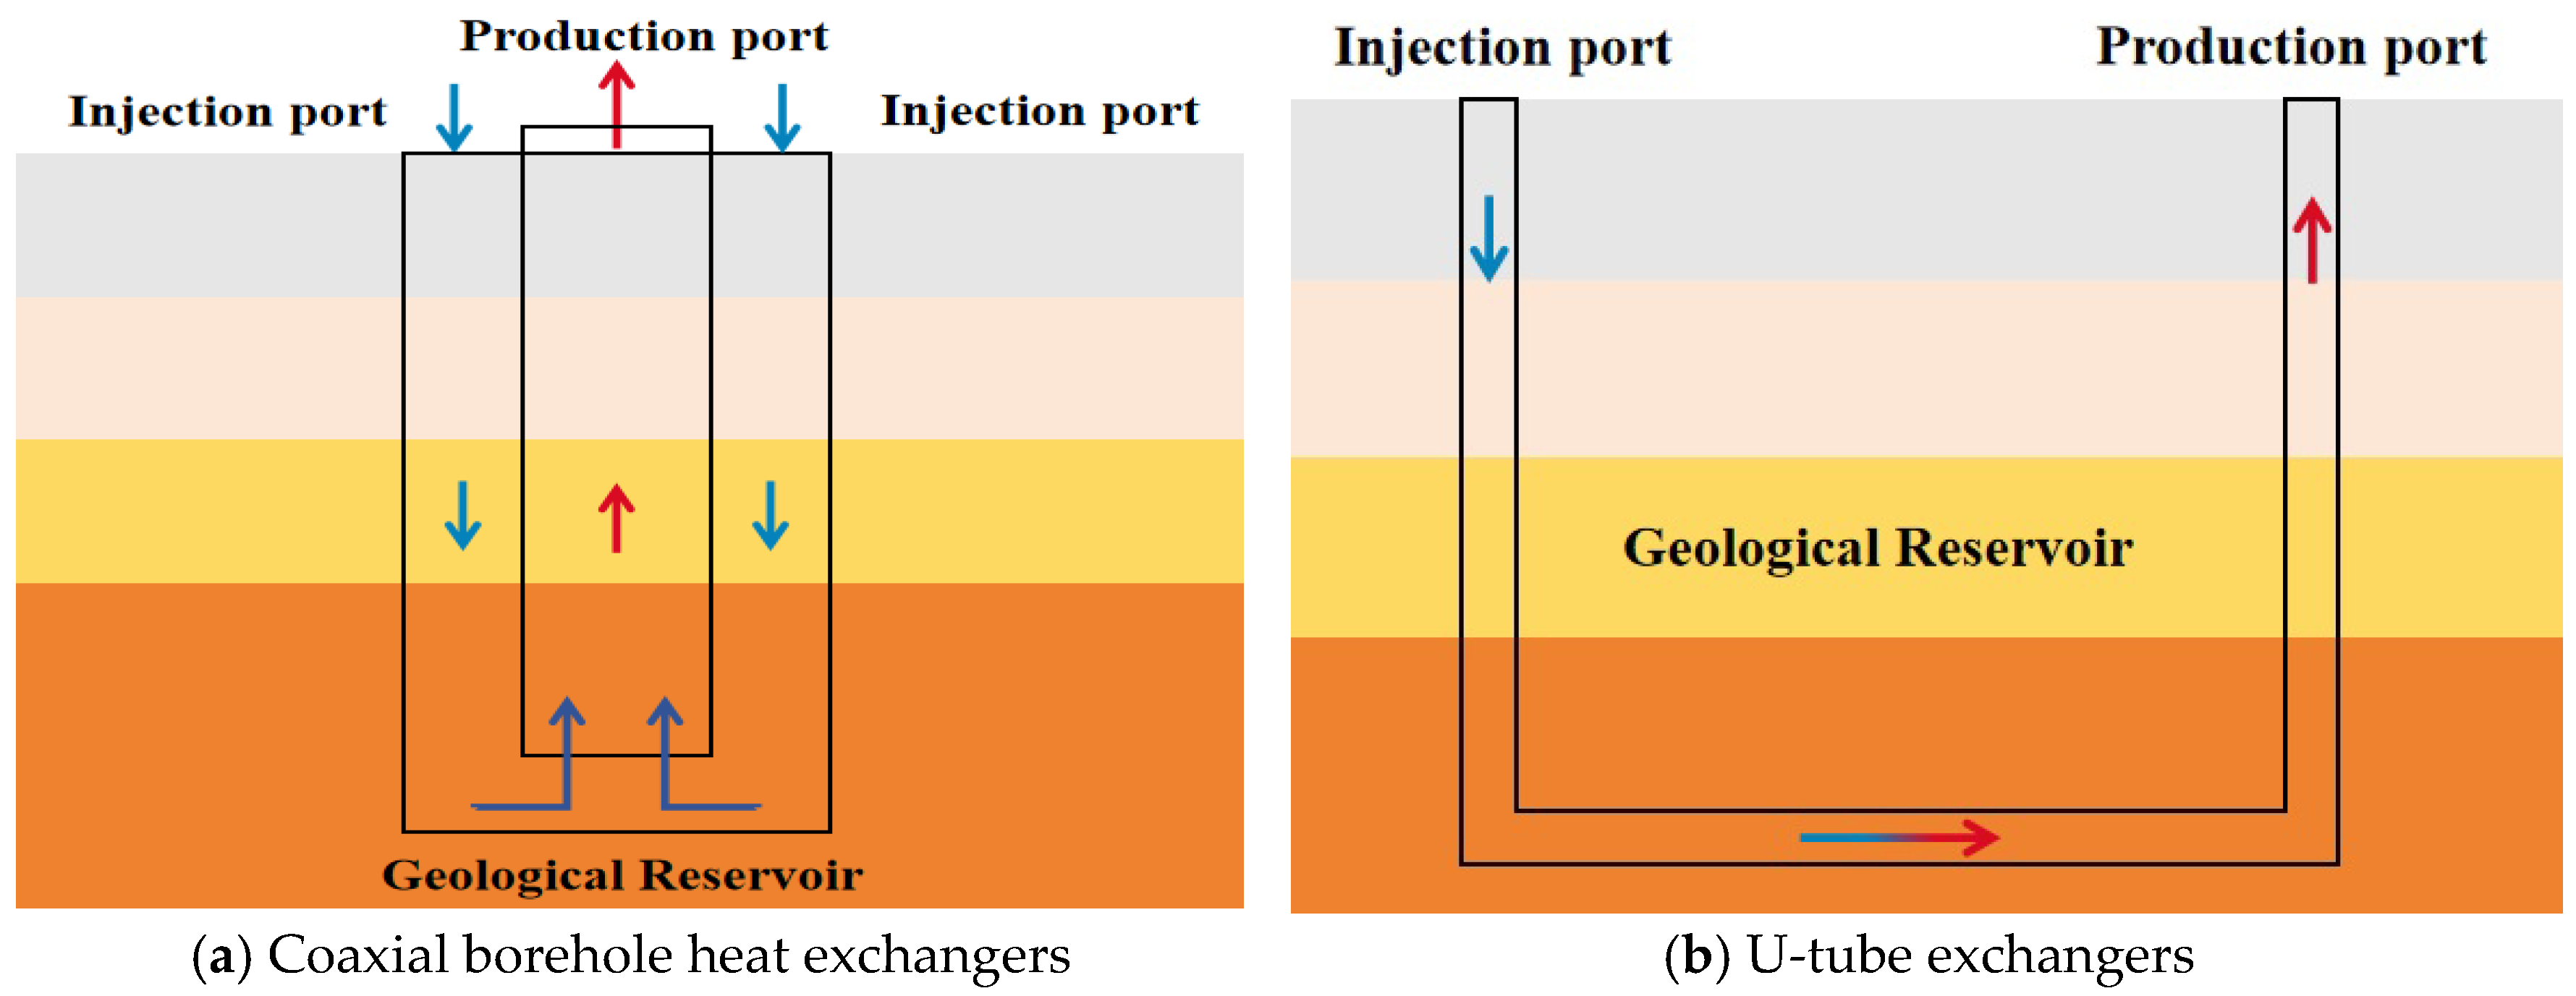
Geothermal energy, noted for its low environmental impact, high reliability, and long-term sustainability [1,2], has emerged as a key contributor to the global energy transition and to efforts aimed at energy conservation and greenhouse gas emissions reduction [3]. The primary applications of geothermal energy currently include power generation, space heating, aquaculture, agricultural cultivation, and spa-based balneotherapy [4]. Geothermal utilization systems can be categorized into open-loop systems (Figure 1) and closed-loop heat exchange systems (Figure 2) based on the method of heat extraction from geothermal wells [5]. The open-loop systems include enhanced geothermal systems (EGS) and groundwater-based “pump-and-reinject” schemes, where geothermal energy is extracted either by injecting water into the reservoir and subsequently producing it, or by directly extracting geothermal water followed by reinjection. This approach is relatively simple and exhibits high heat exchange effectiveness [6]. However, it faces several challenges, such as difficulties in reinjecting geothermal water [7], reservoir temperature decline at production wells, potential thermal pollution of the reservoir [8], and stringent requirements on water quality [9]. Closed-loop geothermal systems typically extract heat via heat exchangers by circulating a working fluid through subsurface loops. This approach achieves the goal of “heat extraction without water withdrawal”, as the entire process is sealed and recirculating, thereby avoiding many of the issues associated with open-loop systems. However, closed-loop systems generally suffer from relatively low heat exchange effectiveness and are influenced by numerous operational and geological factors [10]. As such, investigating the factors affecting heat transfer performance and improving the effectiveness of closed-loop systems has become a prominent research focus in recent years [11]. Currently, two main types of heat exchangers are used in closed-loop systems: U-tube exchangers and coaxial borehole heat exchangers (CBHEs). Among them, CBHEs have gained widespread application due to their ease of installation [12] and superior heat transfer performance [13].
Research on the heat transfer performance of CBHEs has primarily been conducted through field experiments and numerical simulations. In earlier studies, experimental testing was the dominant approach, involving the use of laboratory setups or on-site field trials to evaluate the thermal performance of CBHEs. Zhao et al. [14] conducted experimental studies using a packed bed of glass microspheres to simulate the convective geothermal formation surrounding a coaxial downhole heat exchanger. Their work focused on analyzing the temperature distribution, its variation during heat exchange, and the key influencing factors. Gordon et al. [15], through experimental investigations within a validated composite coaxial model, found that increasing the diameter of the inner pipe reduces the required heat exchanger length and enhances overall thermal performance. With the advancement of computer simulation technologies, an increasing number of numerical modeling tools have been developed, making numerical simulation an essential approach for investigating the thermal performance of CBHEs. Li et al. [16] proposed an enhanced coaxial borehole heat exchanger design and conducted numerical simulations to evaluate its impact on the surrounding formation and reservoir. Their findings demonstrated that compared to conventional coaxial exchangers, the proposed design significantly improved heat exchange effectiveness. Wang et al. [17] performed simulations on CBHEs with triangular fins attached to the outer wall, revealing that both the outlet temperature and heat extraction rate increased with greater fin length and quantity. Zhao et al. [18] developed a numerical model using CO2 as the working fluid, incorporating transient heat transfer within the formation, and analyzed the thermal performance of the system. Among various simulation platforms, COMSOL Multiphysics 6.2 has been widely adopted in CBHE research due to its user-friendly interface and powerful multi-physics coupling capabilities. Zanchini et al. [19] utilized COMSOL to investigate the effects of thermal short-circuiting, flow rate, construction materials, and cross-sectional geometry on CBHE performance. Their study suggested that using low-conductivity materials for the inner pipe effectively mitigates thermal short-circuiting. Wang et al. [20] proposed a multi-level, multi-branch horizontal coaxial borehole heat exchanger system and developed a three-dimensional conductive model for the formation and a one-dimensional convective model for the wellbore using COMSOL to evaluate its heat transfer characteristics. Niu et al. [21] conducted field-scale CBHE experiments in the Matouying Uplift hot dry rock reservoir and used COMSOL simulations to assess the influencing factors of subsurface heat extraction, providing recommendations for site selection and system optimization.
The performance of CBHE systems Is strongly Influenced by site-specific geological conditions, climatic characteristics, and reservoir thermal properties. Site suitability assessment is, therefore, a key scientific issue in the development and utilization of geothermal energy. Pokhrel et al. [22] conducted a performance study on a CBHE system in a 500 m geothermal well located in a high-temperature reservoir area of Oita Prefecture, Japan, and reported a stable effluent temperature of 98 °C. Liu et al. [23] developed a numerical heat transfer model for a coaxial geothermal heat exchanger under soil freezing conditions by combining the finite difference method with the effective heat capacity approach. Gascuel et al. [24] conducted a one-year comparative study on CBHE operation in a cold sedimentary basin, investigating the effects of parameters such as the thermal conductivity of the inner pipe and the properties of cementing slurry on heat exchange performance. Ma et al. [25] performed numerical simulations of a deep CBHE system in the Songliao Basin, China, to evaluate its applicability in cold regions. At present, in addition to its application in regions with favorable geothermal conditions, an increasing number of studies have focused on the applicability of CBHE systems in cold regions. However, limited research has been conducted on their heating performance in high-altitude cold areas with moderate geothermal conditions and low reservoir permeability.
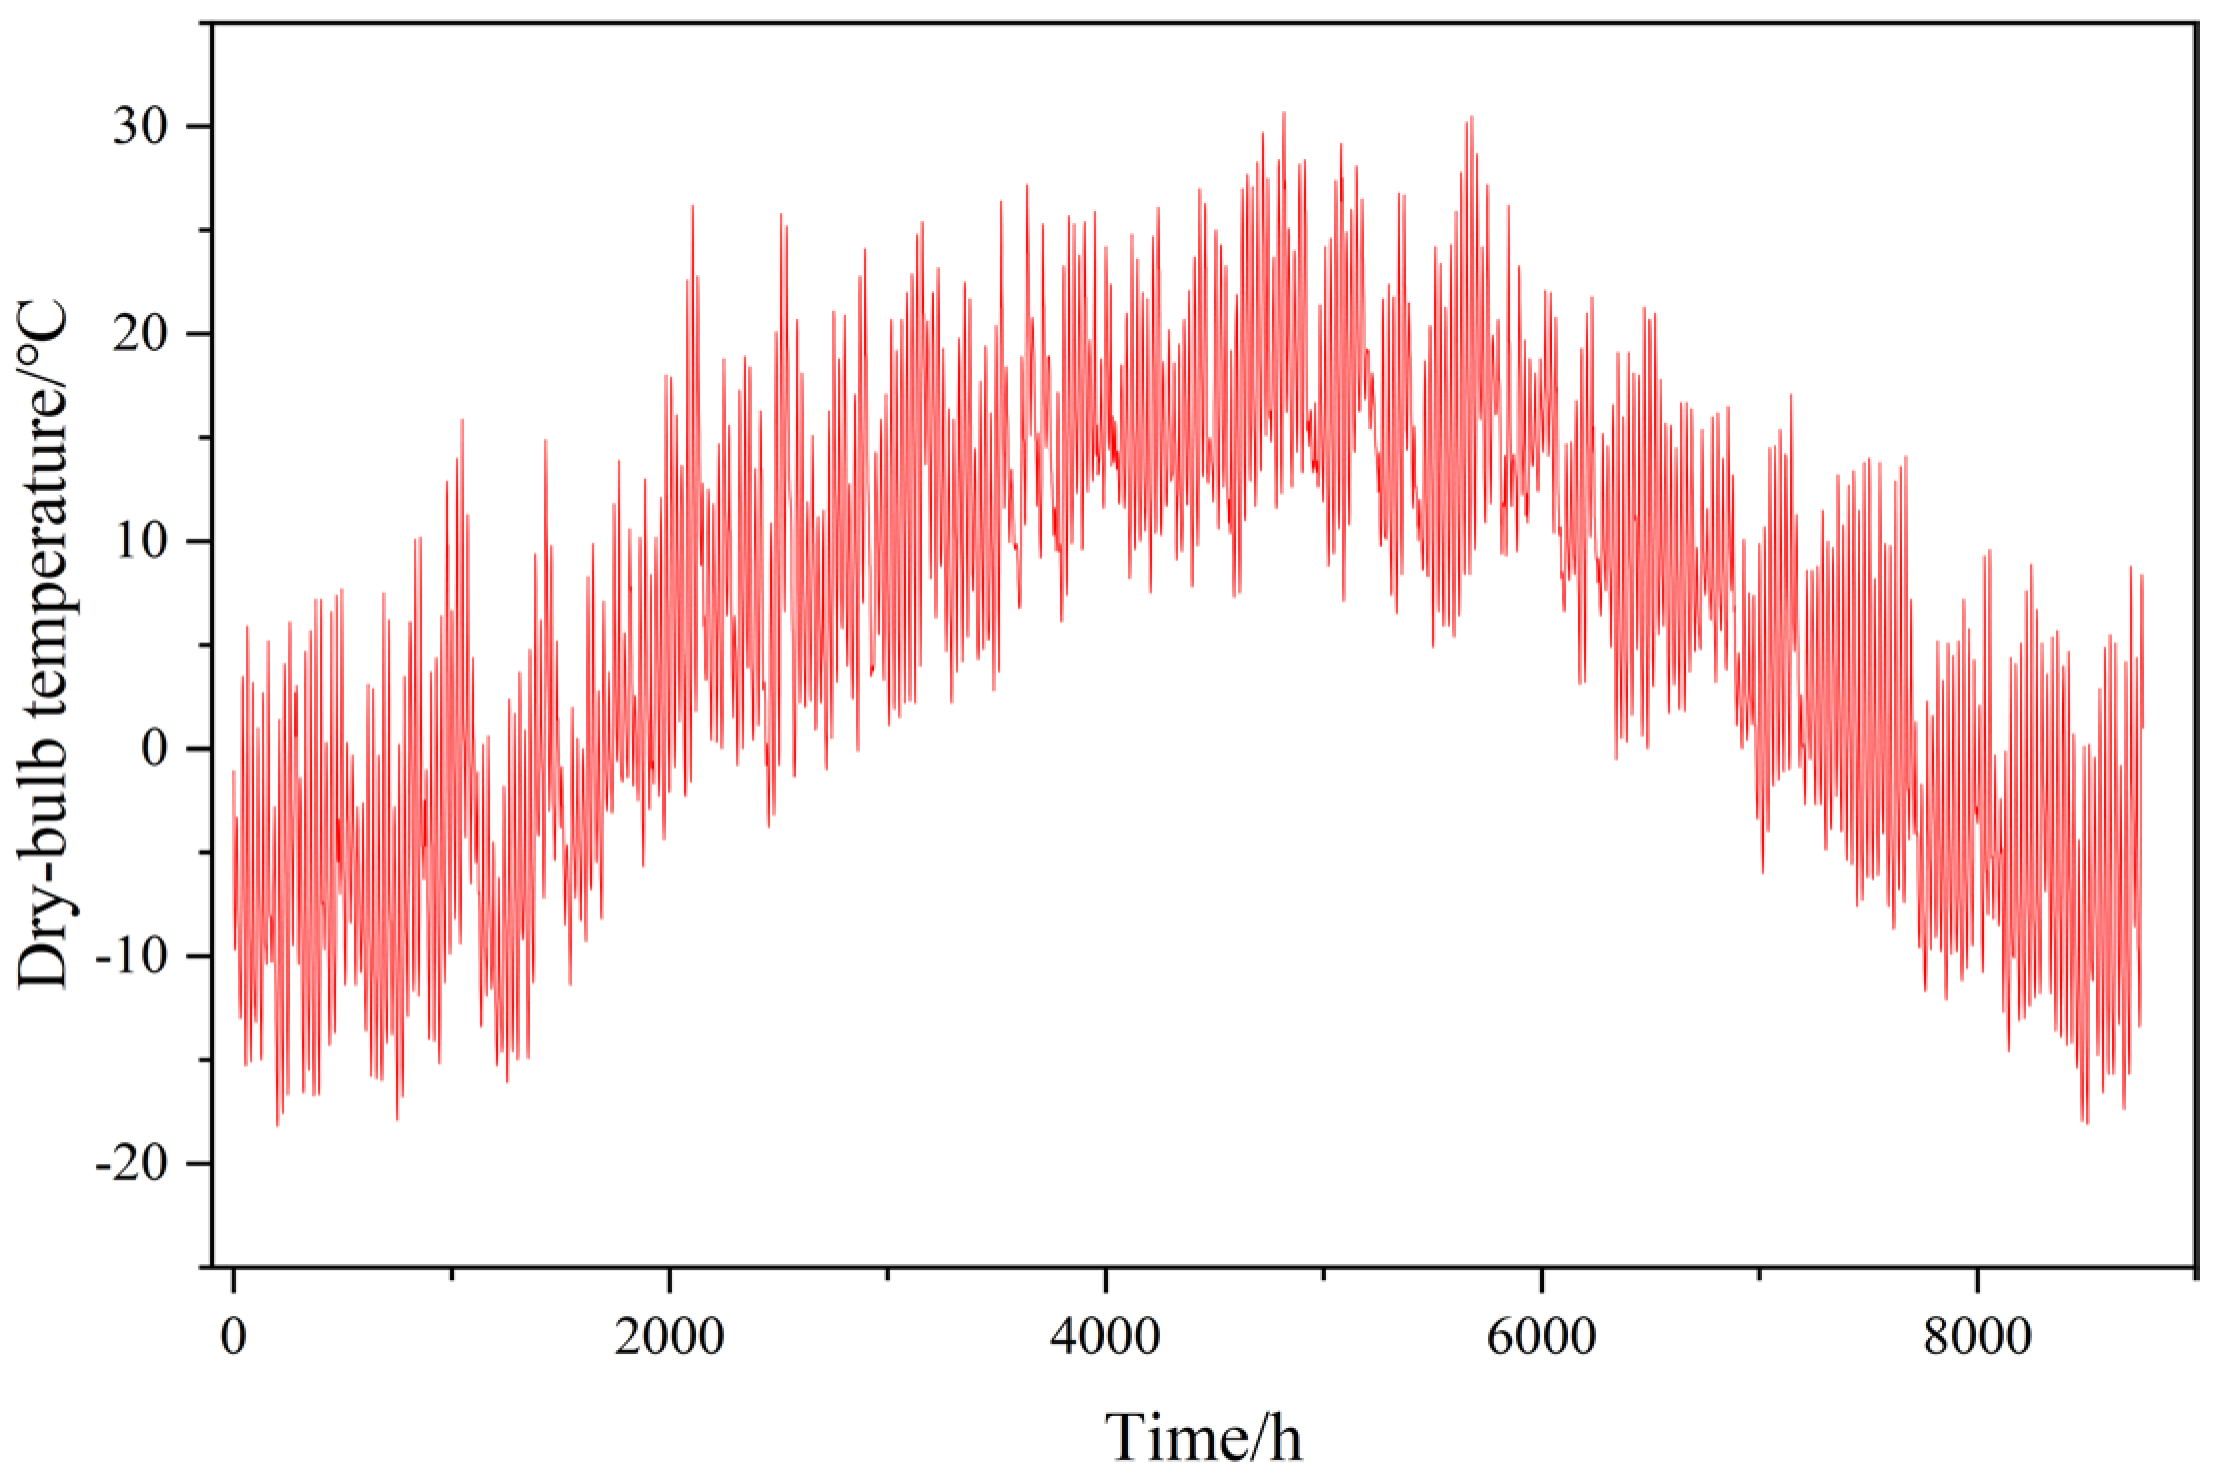
Xining City is located on the northeastern margin of the Qinghai–Tibet Plateau and is strongly influenced by the Himalayan orogeny, which has resulted in intense tectonic activity in the region. These geological conditions have rendered the area a promising target for medium- to low-temperature geothermal resources. The average geothermal gradient of the geothermal field ranges from 3.89 °C/100 m to 5.74 °C/100 m [26], indicating substantial development potential. Due to characteristics such as weak lithologic cementation, low porosity and permeability, and high clay content in the regional strata [27], the formation exhibits poor hydraulic conductivity. In addition, the geothermal water is highly mineralized [28], with a tendency to cause corrosion and scaling, making reinjection particularly challenging. Therefore, the traditional “pump-and-reinject” heat extraction mode is limited in this region, whereas the use of CBHE systems enables heat extraction without withdrawing geothermal water, effectively overcoming the challenges associated with reinjection. However, winters in Xining are long and extremely cold, with minimum temperatures dropping below −20 °C (Figure 3), which places high demands on heat exchange efficiency. In addition, the geothermal reservoir in the Xining Basin is mainly characterized by medium–low temperatures, low permeability, and high mineralization, and the region experiences a high-altitude climate with a prolonged heating season. These conditions may significantly affect the efficiency of downhole heat exchange. To date, no coaxial heat exchange engineering studies have been conducted in the Xining Basin. Therefore, in this high-altitude region with significant heating demand and harsh climatic conditions, the suitability of coaxial heat exchange for space heating, its operational performance, and the key mechanisms governing downhole heat transfer constitute the primary focus of this study.
Given this background, this study takes the coaxial borehole heat exchanger in Dapuzi Town, Xining City, Qinghai Province as the research object. Based on field-scale heat exchange experiments, a three-dimensional numerical model for medium–deep geothermal coaxial heat exchange was developed using COMSOL Multiphysics 6.2, and the model was calibrated and validated with in situ experimental data. On this basis, the effects of key parameters—including inlet water temperature, flow rate, and the thermal conductivity of the inner pipe—on heat exchange performance were systematically investigated. Compared with existing studies, the main innovations of this work are as follows: (1) it fills the research gap in the application of closed-loop geothermal heat extraction systems in the Xining Basin; (2) it develops and validates a three-dimensional heat exchange model suitable for cold-region geothermal wells, and systematically analyzes the influence of key parameters on heat extraction performance as well as the mechanism of thermal short-circuiting; (3) it proposes optimized operational recommendations for geothermal heating in cold regions, providing theoretical support and engineering guidance for the efficient utilization of medium–deep geothermal energy.

2. Overview of the Study Area

2.1. Geothermal Geological Conditions of the Site

The study site is located in Dapuzi Village, Dapuzi Town, Xining City, Qinghai Province. The region experiences an average annual temperature ranging between 5 °C and 8 °C. While summer temperatures are generally mild, winters are considerably colder. From December to February each year, temperatures can drop to as low as −10 °C, indicating a substantial demand for space heating during the winter season. According to geophysical exploration data, the basement in the Dapuzi site area consists of Paleoproterozoic metamorphic rocks, with a burial depth of approximately 950 m. The primary geothermal reservoir is located within the Cretaceous formation, which is overlain by Quaternary and Tertiary strata that act as cap rocks. The Cretaceous formation lies at a depth of 450–950 m, with a thickness of approximately 500 m, and is mainly composed of sandstone, sandy conglomerate interbedded with argillaceous siltstone, and mudstone. The Tertiary formation extends from 50 m to 450 m in depth, with a thickness of about 400 m; its lower part consists primarily of sandstone and sandy conglomerate (serving as a secondary reservoir), while the upper part is dominated by mudstone and functions as a regional cap layer. The overlying Quaternary unconsolidated sediments have an average thickness of approximately 50 m.
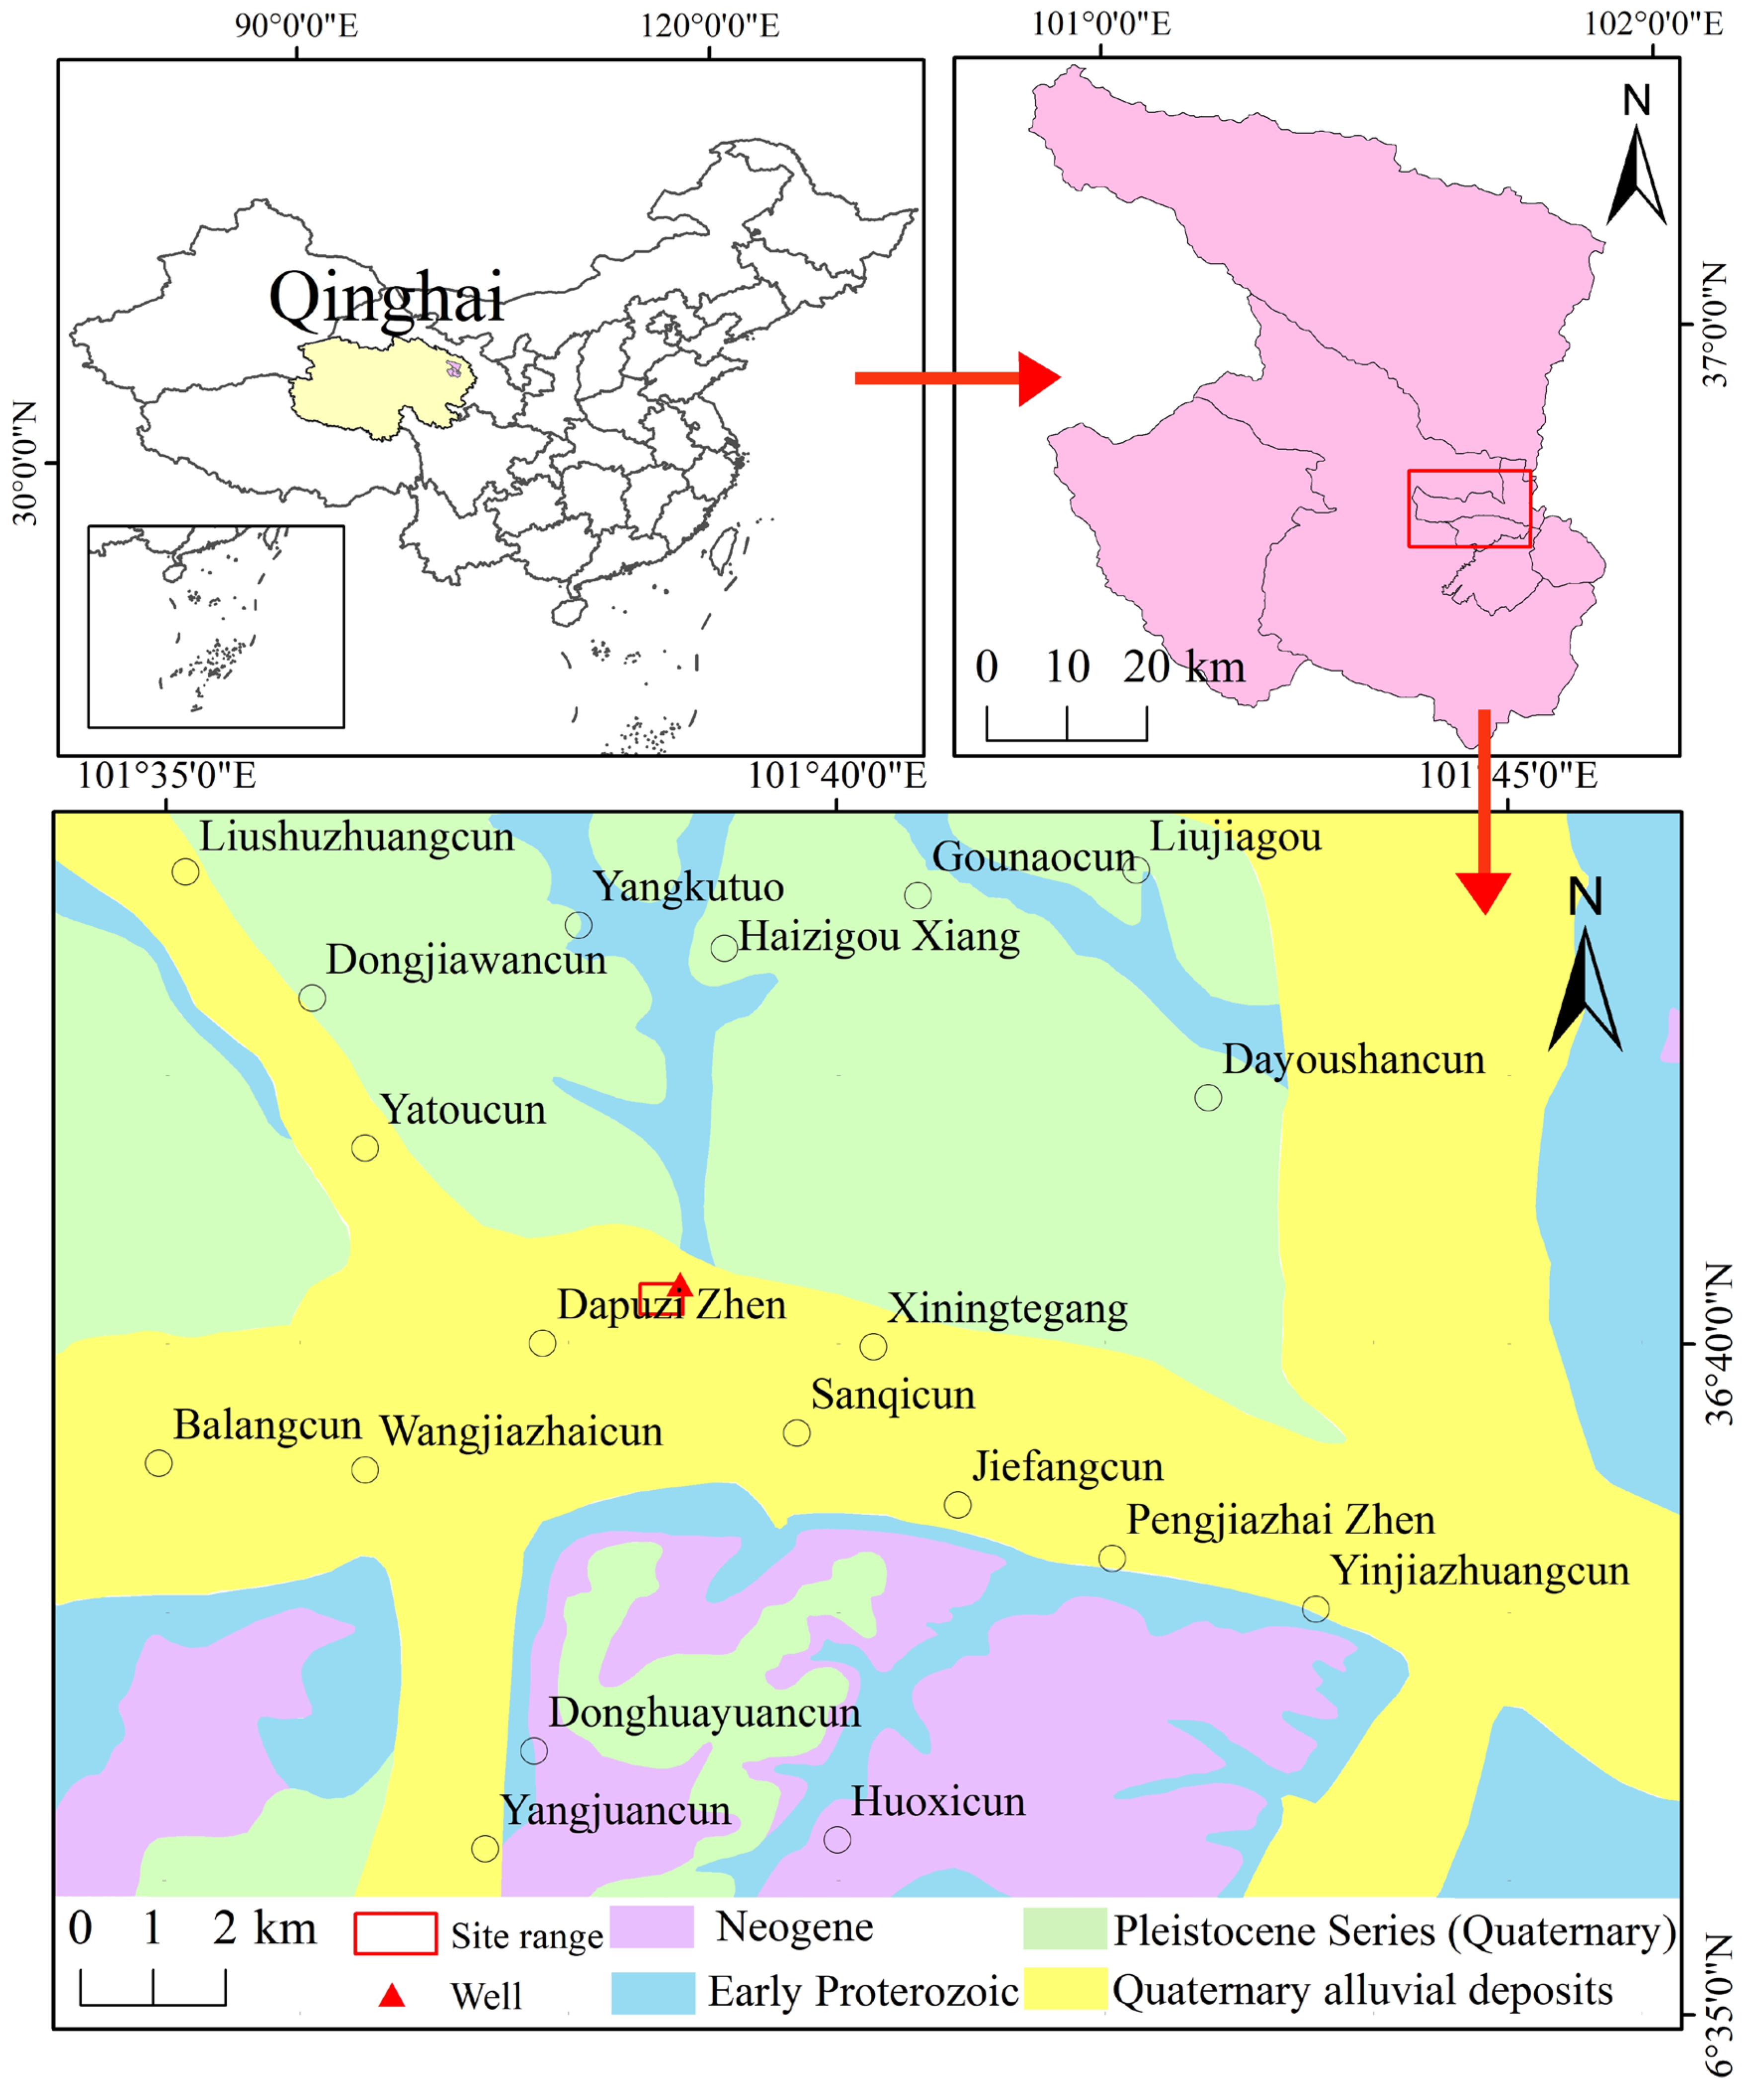
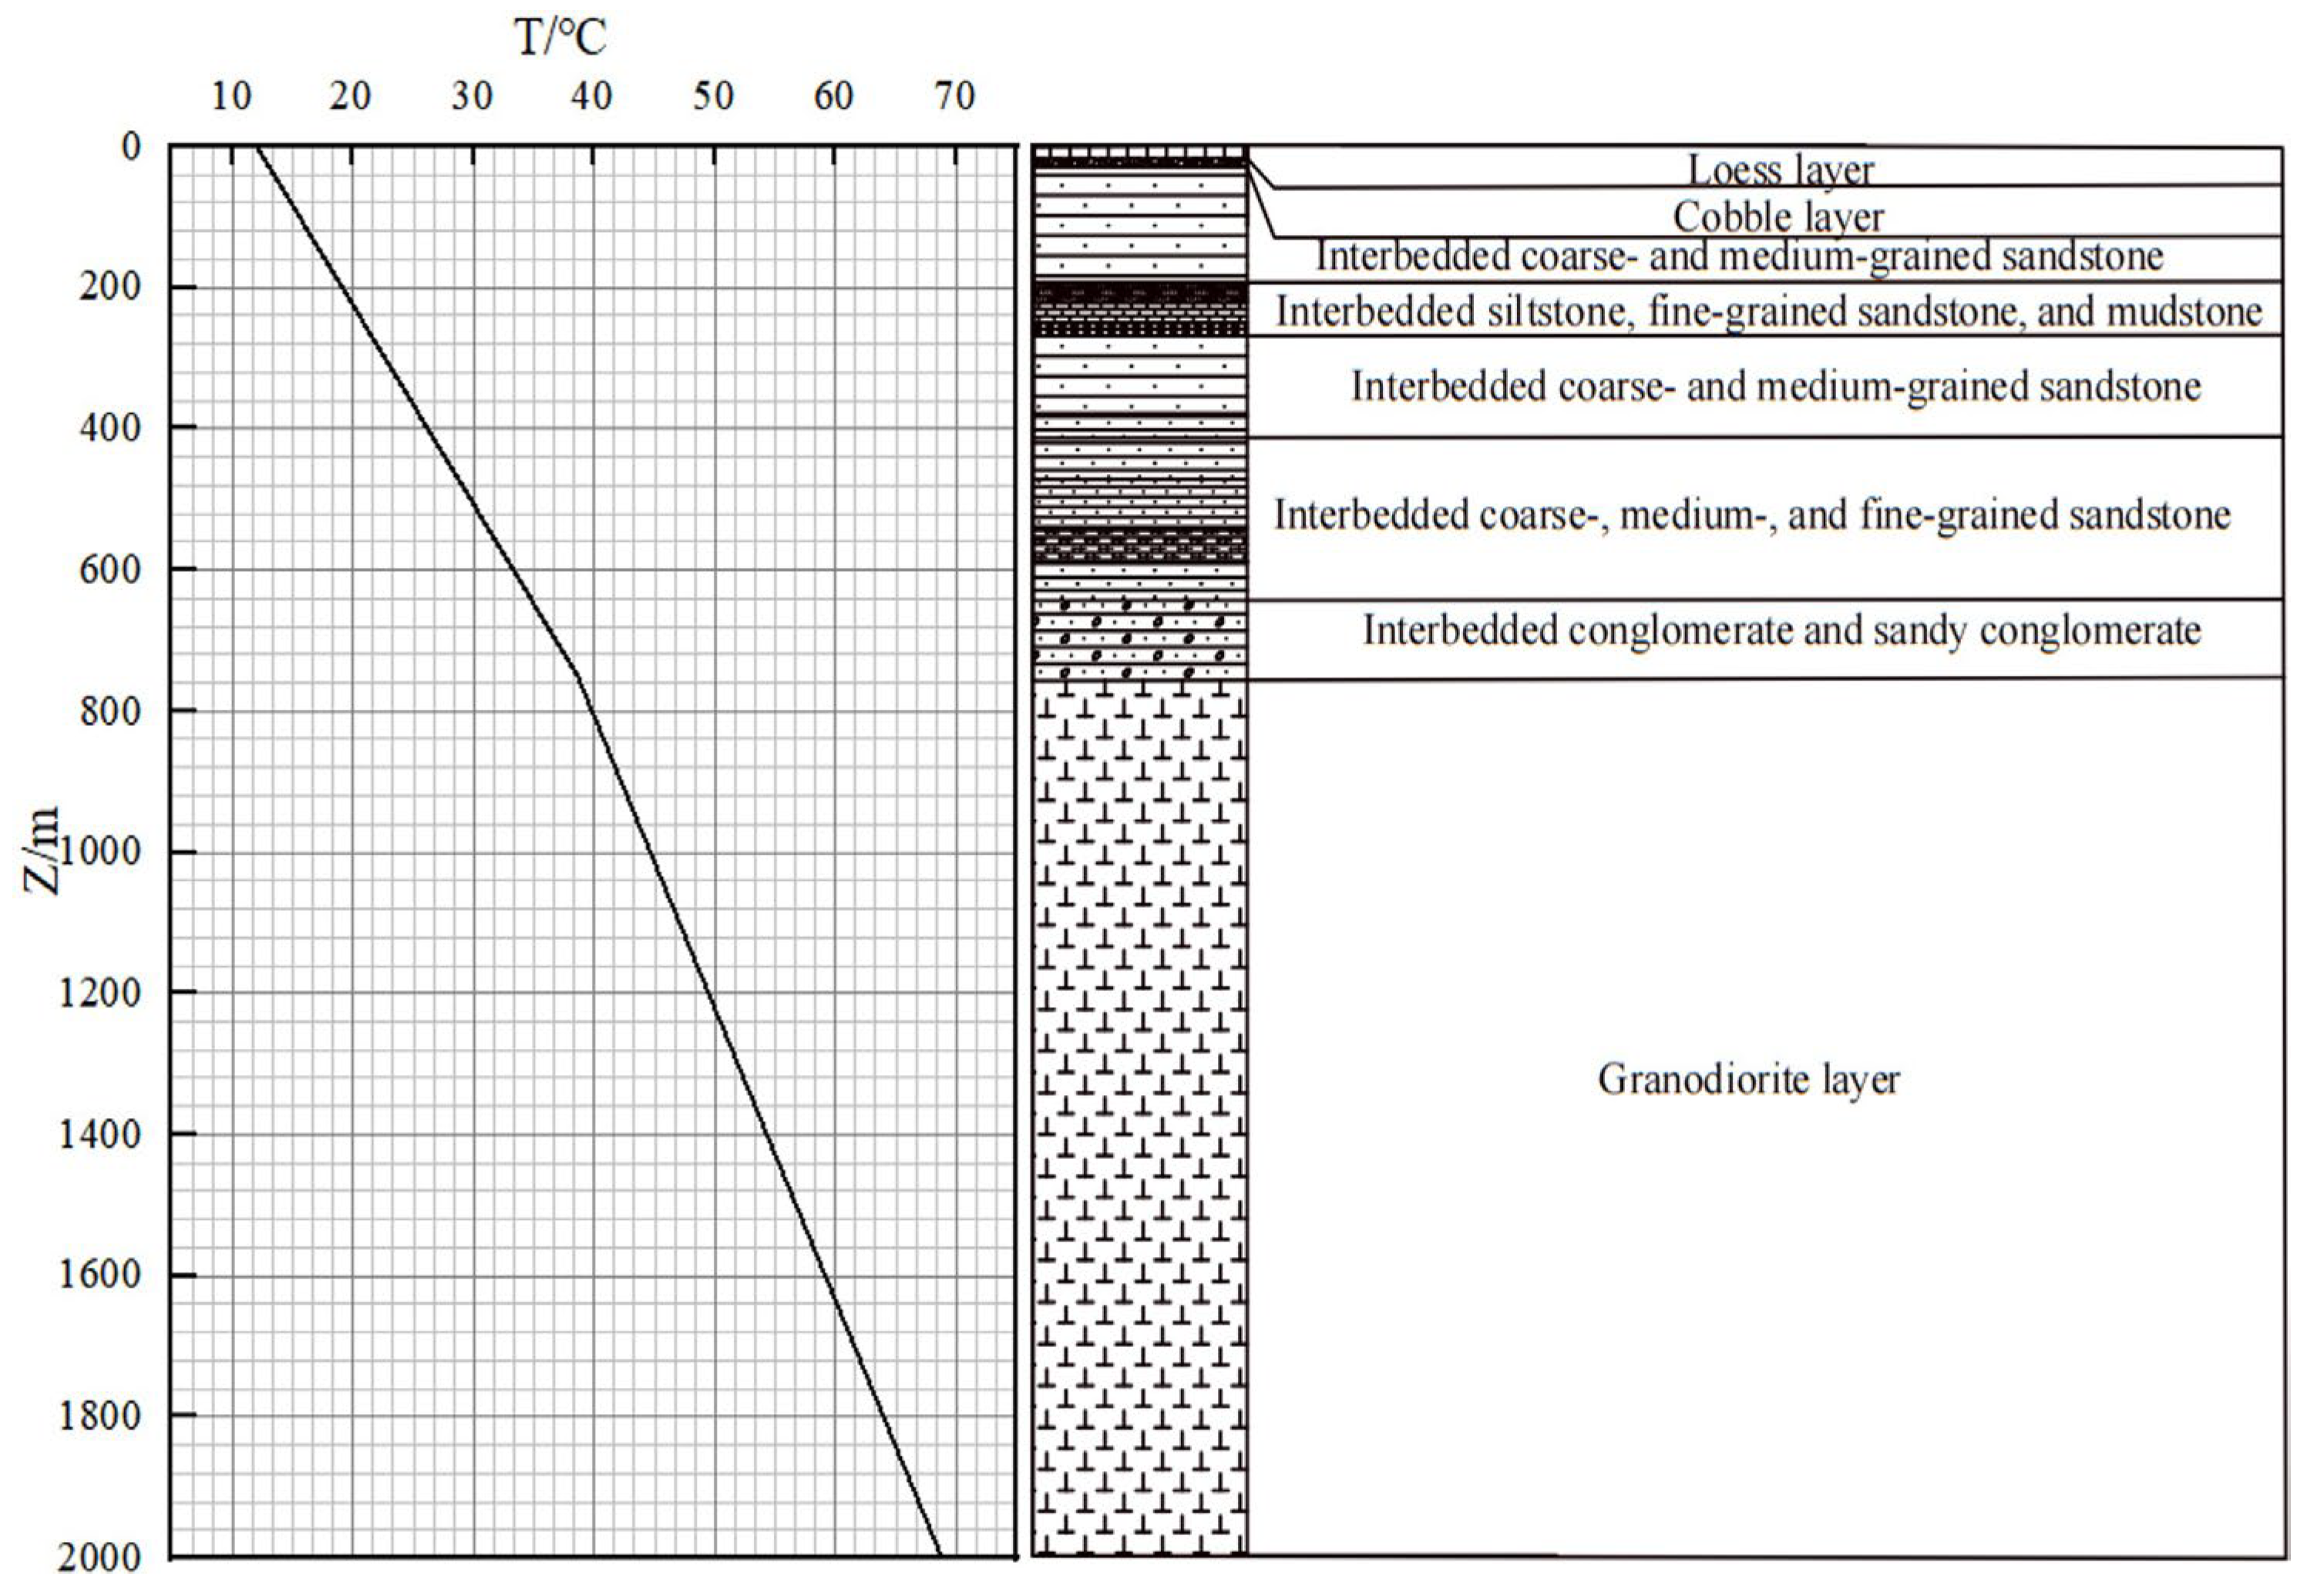
The coaxial geothermal well is located in the northeastern corner of the study area (Figure 4), with a total depth of 2013 m. Based on the exposed lithology, the surrounding strata along the wellbore are divided into eight layers (Figure 5), and the thickness and thermal conductivity of each layer were measured (Table 1). According to existing data, the top of the constant-temperature zone in Xining is buried at a depth of 25 m, with a stable temperature of 12.02 °C. Geophysical well-logging data from the geothermal well indicate that the average geothermal gradient from the surface to a depth of 750 m is 3.5 °C/100 m, resulting in a temperature of 38.6 °C at 750 m. From 750 m to 2000 m, the average geothermal gradient is 2.4 °C/100 m, with a corresponding formation temperature of 68.8 °C at 2000 m. The geothermal temperature profile of the well at different depths is shown in Figure 5.

2.2. Geothermal Well Structure Model

The conceptual model of the coaxial borehole heat exchanger is illustrated in Figure 6. It primarily consists of an inner pipe, an annular space, an outer pipe, and backfill materials. The borehole has a diameter of 241.3 mm and a depth of 2013 m. After drilling, a 177.8 mm diameter steel casing was installed as the outer pipe, with a wall thickness of 9.20 mm. The annular space between the casing and the surrounding formation was naturally sealed using drilling mud. The coaxial inner pipe is made of heat-resistant PERT (polyethylene of raised temperature resistance), with an outer diameter of 110 mm and a wall thickness of 10 mm. Cement grouting was applied at the wellhead to secure the pipe structure. The heat transfer fluid enters the system through the annular space between the inner and outer pipes and returns to the surface through the inner pipe. During circulation, thermal energy is transferred from the surrounding formation to the working fluid, enabling the extraction of medium–deep geothermal energy to the surface. Upon reaching the surface, the fluid transfers heat either directly to the end user via a heat exchanger or in combination with a heat pump system to provide building heating. After releasing heat, the cooled fluid is re-injected into the annular space, completing the closed-loop circulation.

2.3. Field Coaxial Heat Exchange Test

To evaluate the heat exchange capacity of the coaxial geothermal well at the study site, assess the overall heat exchange performance of the field, and provide calibration and validation data for the numerical model, a field-scale coaxial heat exchange experiment was conducted using the well. Two experimental conditions were implemented. In Condition 1, the average injection flow rate at the wellhead was 20.66 m3/h, and the injection temperature was 22.81 °C. In Condition 2, the average injection flow rate was 21.35 m3/h, with an injection temperature of 24.17 °C. At both the inlet and outlet of the heat exchange well, an electronic thermometer (measuring range: 1–105 °C; accuracy: ±0.01 °C) and an ultrasonic flowmeter (measuring range: 4–200 m3/h; accuracy: ±0.5%) were installed to monitor the variation in water temperature and flow rate (Figure 7). A data acquisition system was used to automatically record the measurements. To eliminate errors caused by unstable system operation and to ensure data accuracy and continuity, data recording began 30 h after stable operation was achieved. The monitoring interval was set to 1 h, and each experimental condition was maintained for no less than 90 h.

3. Coaxial Heat Exchange Numerical Model Construction

3.1. Model Assumptions

Given that the lithology at the study site is predominantly composed of sandstone and mudstone, with low formation permeability, and considering the complexity of the actual heat exchange process within the borehole, the following assumptions were made to simplify the numerical model [29,30]:
(1) The rock mass is assumed to be a homogeneous and isotropic medium. (2) Heat transfer in the reservoir is assumed to be dominated by conduction, and convective heat transfer caused by pore water flow is neglected. (3) The heat transfer fluid is assumed to be incompressible, flowing predominantly in the axial direction, and the flow is considered to be in a turbulent regime. (4) The lateral and bottom boundaries of the reservoir are defined based on the geothermal gradient, and no lateral heat exchange is considered.

3.2. Heat Transfer Equation for the Thermal Storage Layer

The Heat Transfer in Solids module was used to simulate thermal conduction between the reservoir and the wellbore. The governing equation is as follows:
ρ r C r T t = · k r T + Q
where ρ r is the density of the formation, kg/m3; C r is the specific heat capacity of the formation, J/(kg·k); T is the temperature of the formation, °C; is the divergence operator; k r is the thermal conductivity of the formation, W/(m·k); and Q is the heat source term.

3.3. Heat Transfer Equation in the Wellbore

The Non-Isothermal Pipe Flow physics interface was employed to simulate the forced convective heat transfer between the working fluid and the pipe wall. The governing equations are as follows [31]:
( A p ρ f ) t   +   · ( A p ρ f U f )   =   0
ρ f U f t = p f - 1 2 f D ρ f d p | U f | U f
A p ρ f c p , f T f t + A p ρ f U f · T f = · ( A p λ f T f ) + 1 2 f D A p ρ f D h | U f | 3 + Q wall
where Ap is the cross-sectional area of the pipe, m2; ρ f is the density of the working fluid, kg/m3; U f is the velocity of the working fluid, m/s; p f is the pressure inside the pipe, Pa; D h is the hydraulic diameter, m; c p , f is the specific heat capacity of the working fluid, J/(kg·°C); T f is the temperature of the working fluid, °C; λ f is the thermal conductivity of the working fluid, W/(m·°C); f D is the Darcy friction factor; and Q wall is the heat transferred from the surrounding formation to the working fluid through the pipe wall, calculated as follows:
Q wall = h e f f Z T o u t T f
where Z is the perimeter of the pipe wall, m; Tout is the external (formation) temperature, °C; and heff is the convective heat transfer coefficient, W/(m2·°C). For the circular pipe used in this study, the effective heat transfer coefficient is calculated as follows:
N u = f D 8 ( Re 1000 ) P r 1 + 12.7 f D 8 ( P r 2 / 3 1 )
h i n t = N u i n t · λ f D h , i n t
h o u t = N u o u t · λ f D h , o u t
h e f f = 1 h o u t + r o l n r o / r i λ p + r o r i h i n t 1
where Nu is the Nusselt number; Re and Pr are the Reynolds number and Prandtl number, respectively. Equation (6) is valid for the parameter ranges Re = 3000–6 × 10⁶ and Pr = 0.5–2000; λ p is the thermal conductivity of the pipe wall, W/(m·°C); ri and ro are the inner and outer radii of the pipe, m; hint and hout are the convective heat transfer coefficients on the inner and outer surfaces of the pipe, respectively, W/(m2·°C); and Dh,int and Dh,out are the hydraulic diameters of the inner and outer pipes, respectively.

3.4. Mesh Generation

Due to the significant depth of the geothermal well (2013 m), a radial extent of 100 m and an additional 50 m in depth below the well bottom were selected for the computational domain to avoid boundary effects that could distort the simulation results. As a result, the model domain has a total radius of 100 m and a depth of 2063 m.
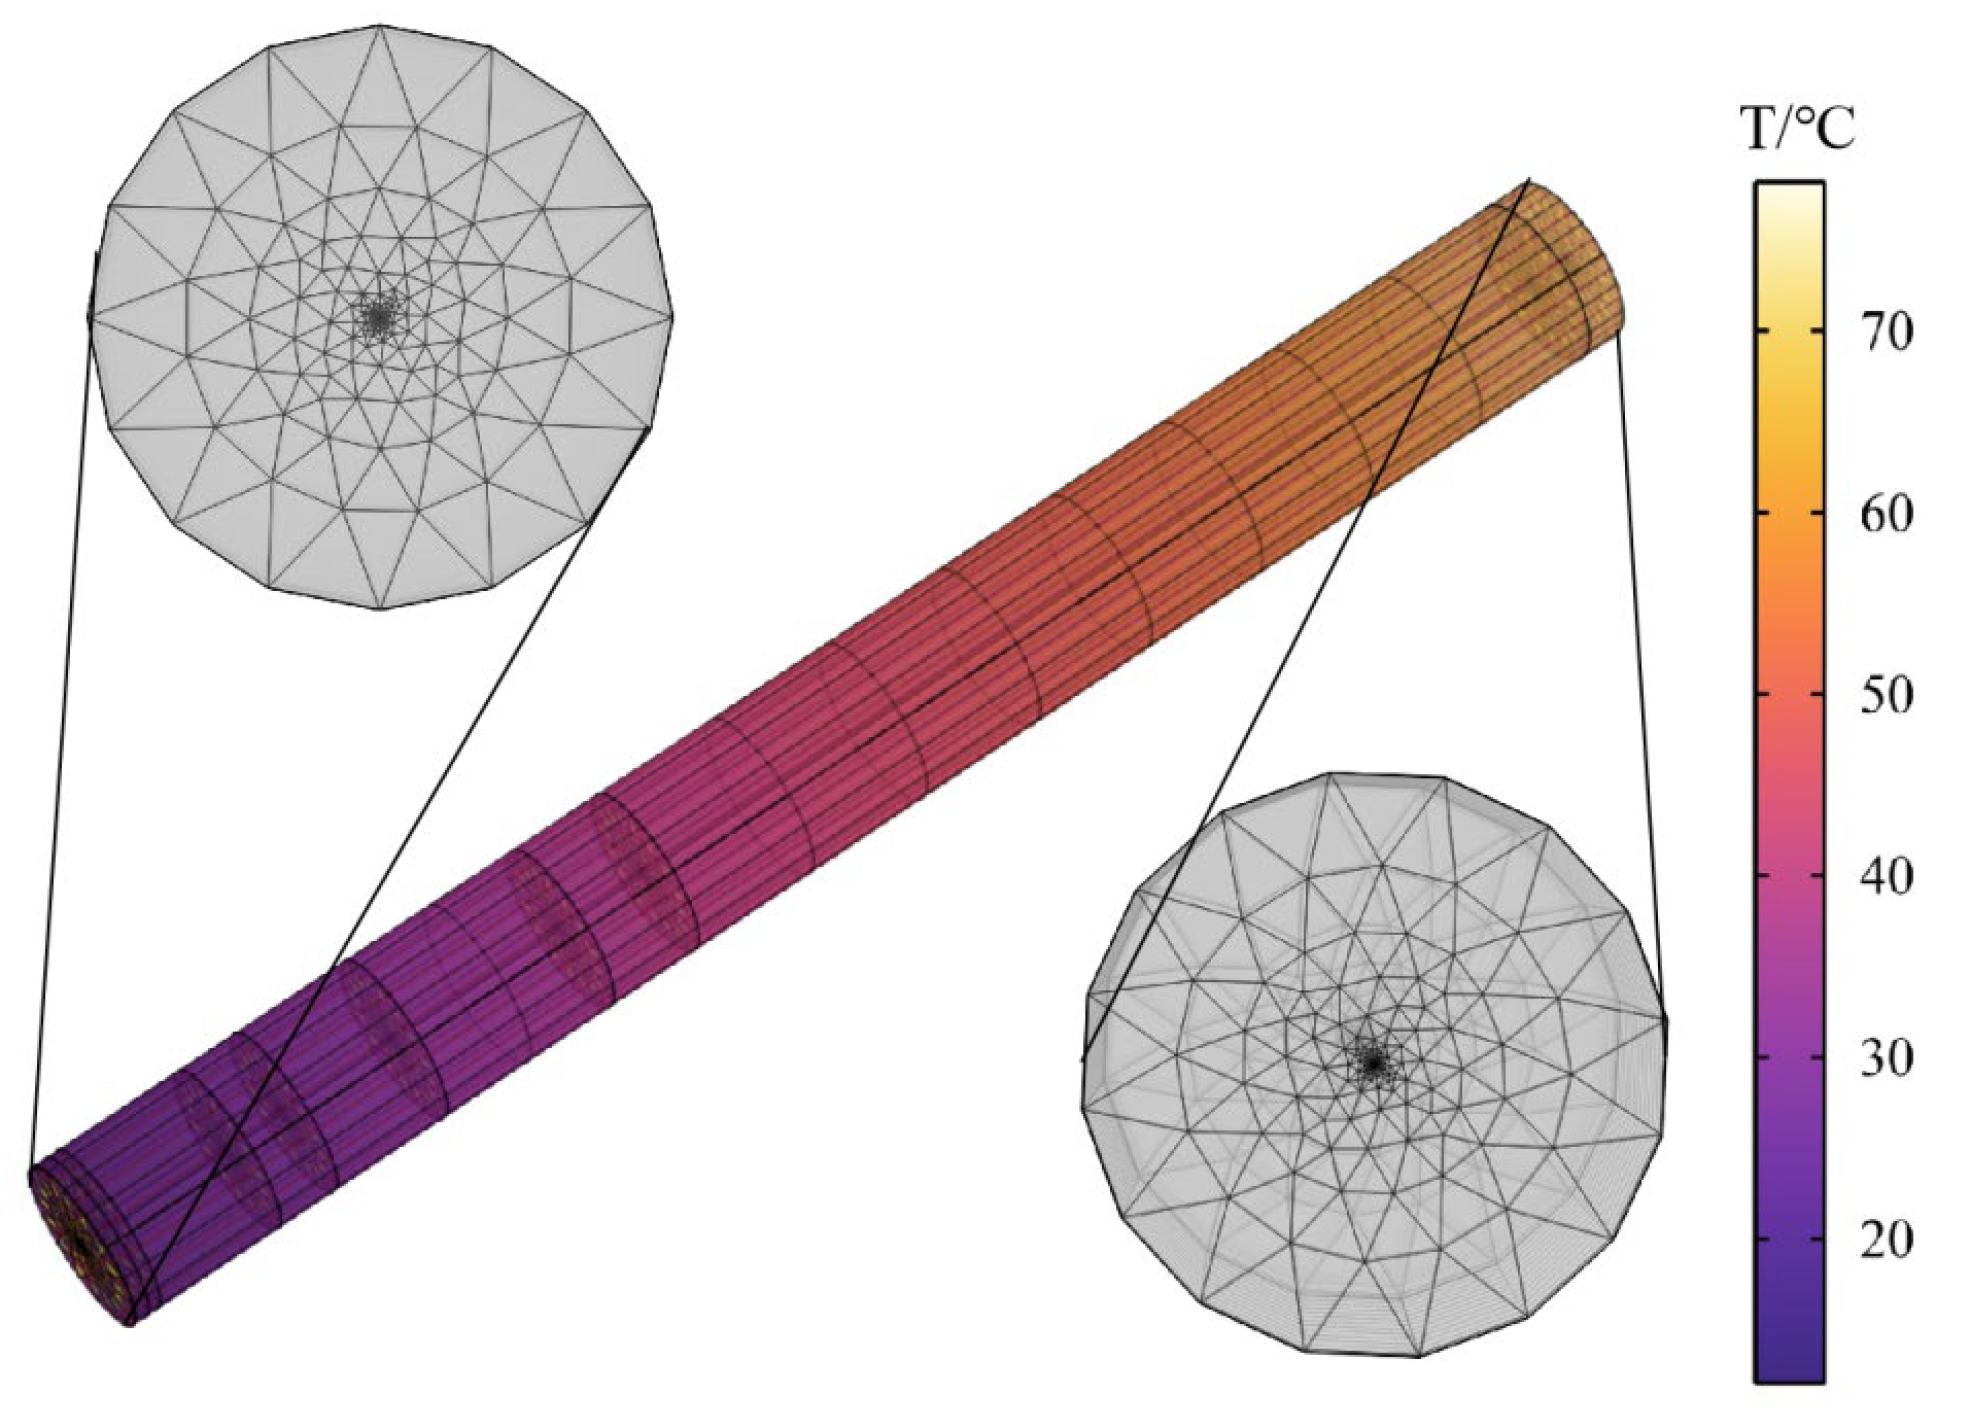
During the stratification process of the model, the formation surrounding the wellbore was divided into eight layers based on the actual geological conditions of the study area. The stratigraphic divisions are summarized in Table 1. The Heat Transfer in Solids module in COMSOL was used to simulate the thermal behavior of the geothermal reservoir, while the Non-Isothermal Pipe Flow module was employed to simulate the self-circulating process of the working fluid inside the wellbore. To minimize numerical errors caused by mesh resolution, a mesh independence analysis was conducted to evaluate the relationship between the number of mesh elements and the outlet fluid temperature. The results are shown in Figure 8. To balance the trade-off between computational accuracy and effectiveness, a total of 4968 mesh elements were used in this study. The mesh distribution is shown in Figure 9.

3.5. Initial and Boundary Conditions

The boundary conditions of the model were defined as follows, and the specific parameters of the initial conditions are listed in Table 2.
(1)
Based on the average winter air temperature in Xining, the top boundary of the model was set as a constant temperature boundary:
T|z=0=3 °C
(2)
Based on the geothermal gradient of the rock reservoir, the lateral and bottom boundaries of the model were set as geothermal gradient boundaries:
T = 12.02 0.035 × Z 1   ( 750 Z 1 < 0 )
T = 38.6 0.025 × Z 2 + 750 ( 2063 Z 2 < 750 )
(3)
The inlet boundary was defined with a fixed temperature and fixed flow rate:
T = Tin
U = Q in A
where Tin is the inlet temperature, °C; Qin is the inlet flow rate, m3/s; and A is the cross-sectional area of the pipe, m2.
(4)
The outlet boundary of the model was set as a thermal outflow boundary, where heat transfer occurs only in the direction of convection. The temperature gradient in the normal direction was set to zero, and radiative heat transfer was neglected:
n · Δ T = 0
n is the unit normal vector at the outlet boundary; Δ T is the temperature gradient.
(5)
Two general extrusion operators were used to map the temperature conditions onto the pipe wall:
T c , i r , z , t = T outer r , z , t
T c , o r , z , t = T inner r , z , t
where (r,z) are the coordinates on the target boundary; (r′,z′), (r″,z″) are the coordinates in the source regions, which are determined using general extrusion functions. This mapping reflects the thermal coupling between the inner and outer temperature fields of the wellbore.

3.6. Solution Method

The specific solution settings of the model were configured as follows:
(1)
The model equations were spatially discretized using the finite element method (FEM). Second-order Lagrange elements, as provided by COMSOL, were selected to ensure computational accuracy.
The mass conservation equation is given as follows:
ρ t + ρ u = 0
The energy conservation equation is given as follows:
ρ c p T t +   u · T = · k T + Q
where ρ is the fluid density, kg/m3; c p is the specific heat capacity at constant pressure, J/(kg·K); u is the velocity vector, m/s; T is the temperature, °C; k is the thermal conductivity, W/(m·k); and Q is the volumetric heat source term. This equation describes heat conduction in solids and axial convective heat transfer in the pipe flow.
(2)
The Non-Isothermal Pipe Flow module in COMSOL was employed to simulate the heat transfer process within the wellbore. This module is based on the assumption of one-dimensional axial incompressible flow, and it simultaneously solves the mass and energy conservation equations to achieve a coupled solution for fluid velocity, pressure, and temperature fields. In the model, the flow velocity is assumed to exist only in the axial direction ( u = u z ), with no tangential or radial components, thereby simplifying the computational complexity and reflecting the dominant flow characteristics within vertical wellbores.
(3)
The nonlinear terms in the model were solved using the Newton–Raphson iterative method:
X n + 1 = X n J 1 X n F X n
where J is the Jacobian matrix; F is the residual vector of the equation system.
(4)
For temporal discretization, the implicit Backward Differentiation Formula (BDF) was employed. The maximum order was set to 2, and an adaptive time stepping scheme was used to ensure numerical stability and convergence. The time discretization is expressed as follows:
3 u n + 1 4 u n + u n 1 2 Δ t u t
(5)
In the model, the wellbore flow corresponds to a high Reynolds number regime, indicating turbulent flow. Instead of using an explicit turbulence model, empirical Nusselt number correlations embedded in the Non-Isothermal Pipe Flow module were used to account for convective heat transfer under turbulent conditions. Specifically, the Gnielinski correlation, as presented in Equation (6), was applied during the simulation.
(6)
To ensure the convergence of the nonlinear equation system, the solver settings were configured with a relative tolerance of 0.001, an absolute tolerance factor of 1, and a maximum of 4 nonlinear iterations per time step. The convergence criterion for each time step is evaluated using the following expression:
F X n + 1 F X ( 0 ) 10 3
where F(x) is the fully coupled residual function; X(n) is the solution vector at the n-th iteration.

4. Results and Discussion

4.1. Analysis of Field Coaxial Heat Exchange Experiment Results

Two sets of heat exchange results under different operating conditions were obtained from the on-site coaxial heat exchange experiment (Figure 10). The monitoring period ranged from 1 to 100 h. As the inlet flow rate was recorded as an instantaneous value, it fluctuated within a stable range throughout the test. The outlet water temperature was initially high at the beginning of the system operation, but decreased significantly in the early stage. After approximately 30 h, the temperature became relatively stable. Over time, the outlet temperature continued to exhibit a downward trend. Meanwhile, the inlet temperature also showed a slight decrease, corresponding to the decline in outlet temperature.
Under Operating Condition 1, the average inlet flow rate was 20.72 m3/h. After 30 h of system operation, the average inlet and outlet temperatures were 22.81 °C and 34.53 °C, respectively, with a corresponding heat exchange power of 282.37 kW. Under Operating Condition 2, the average inlet flow rate was 21.17 m3/h, and after 30 h, the average inlet and outlet temperatures were 24.17 °C and 34.92 °C, respectively, with a corresponding heat exchange power of 264.35 kW. In both conditions, the temperature difference between the inlet and outlet remained around 11 °C, indicating a relatively good overall heat exchange performance at the test site. The gradual decline in outlet temperature may be attributed to several factors, including the thermal conductivity characteristics of the formation, scaling on the inner wall of the heat exchanger, and a decrease in reservoir temperature over time.

4.2. Model Identification and Validation Results and Analysis

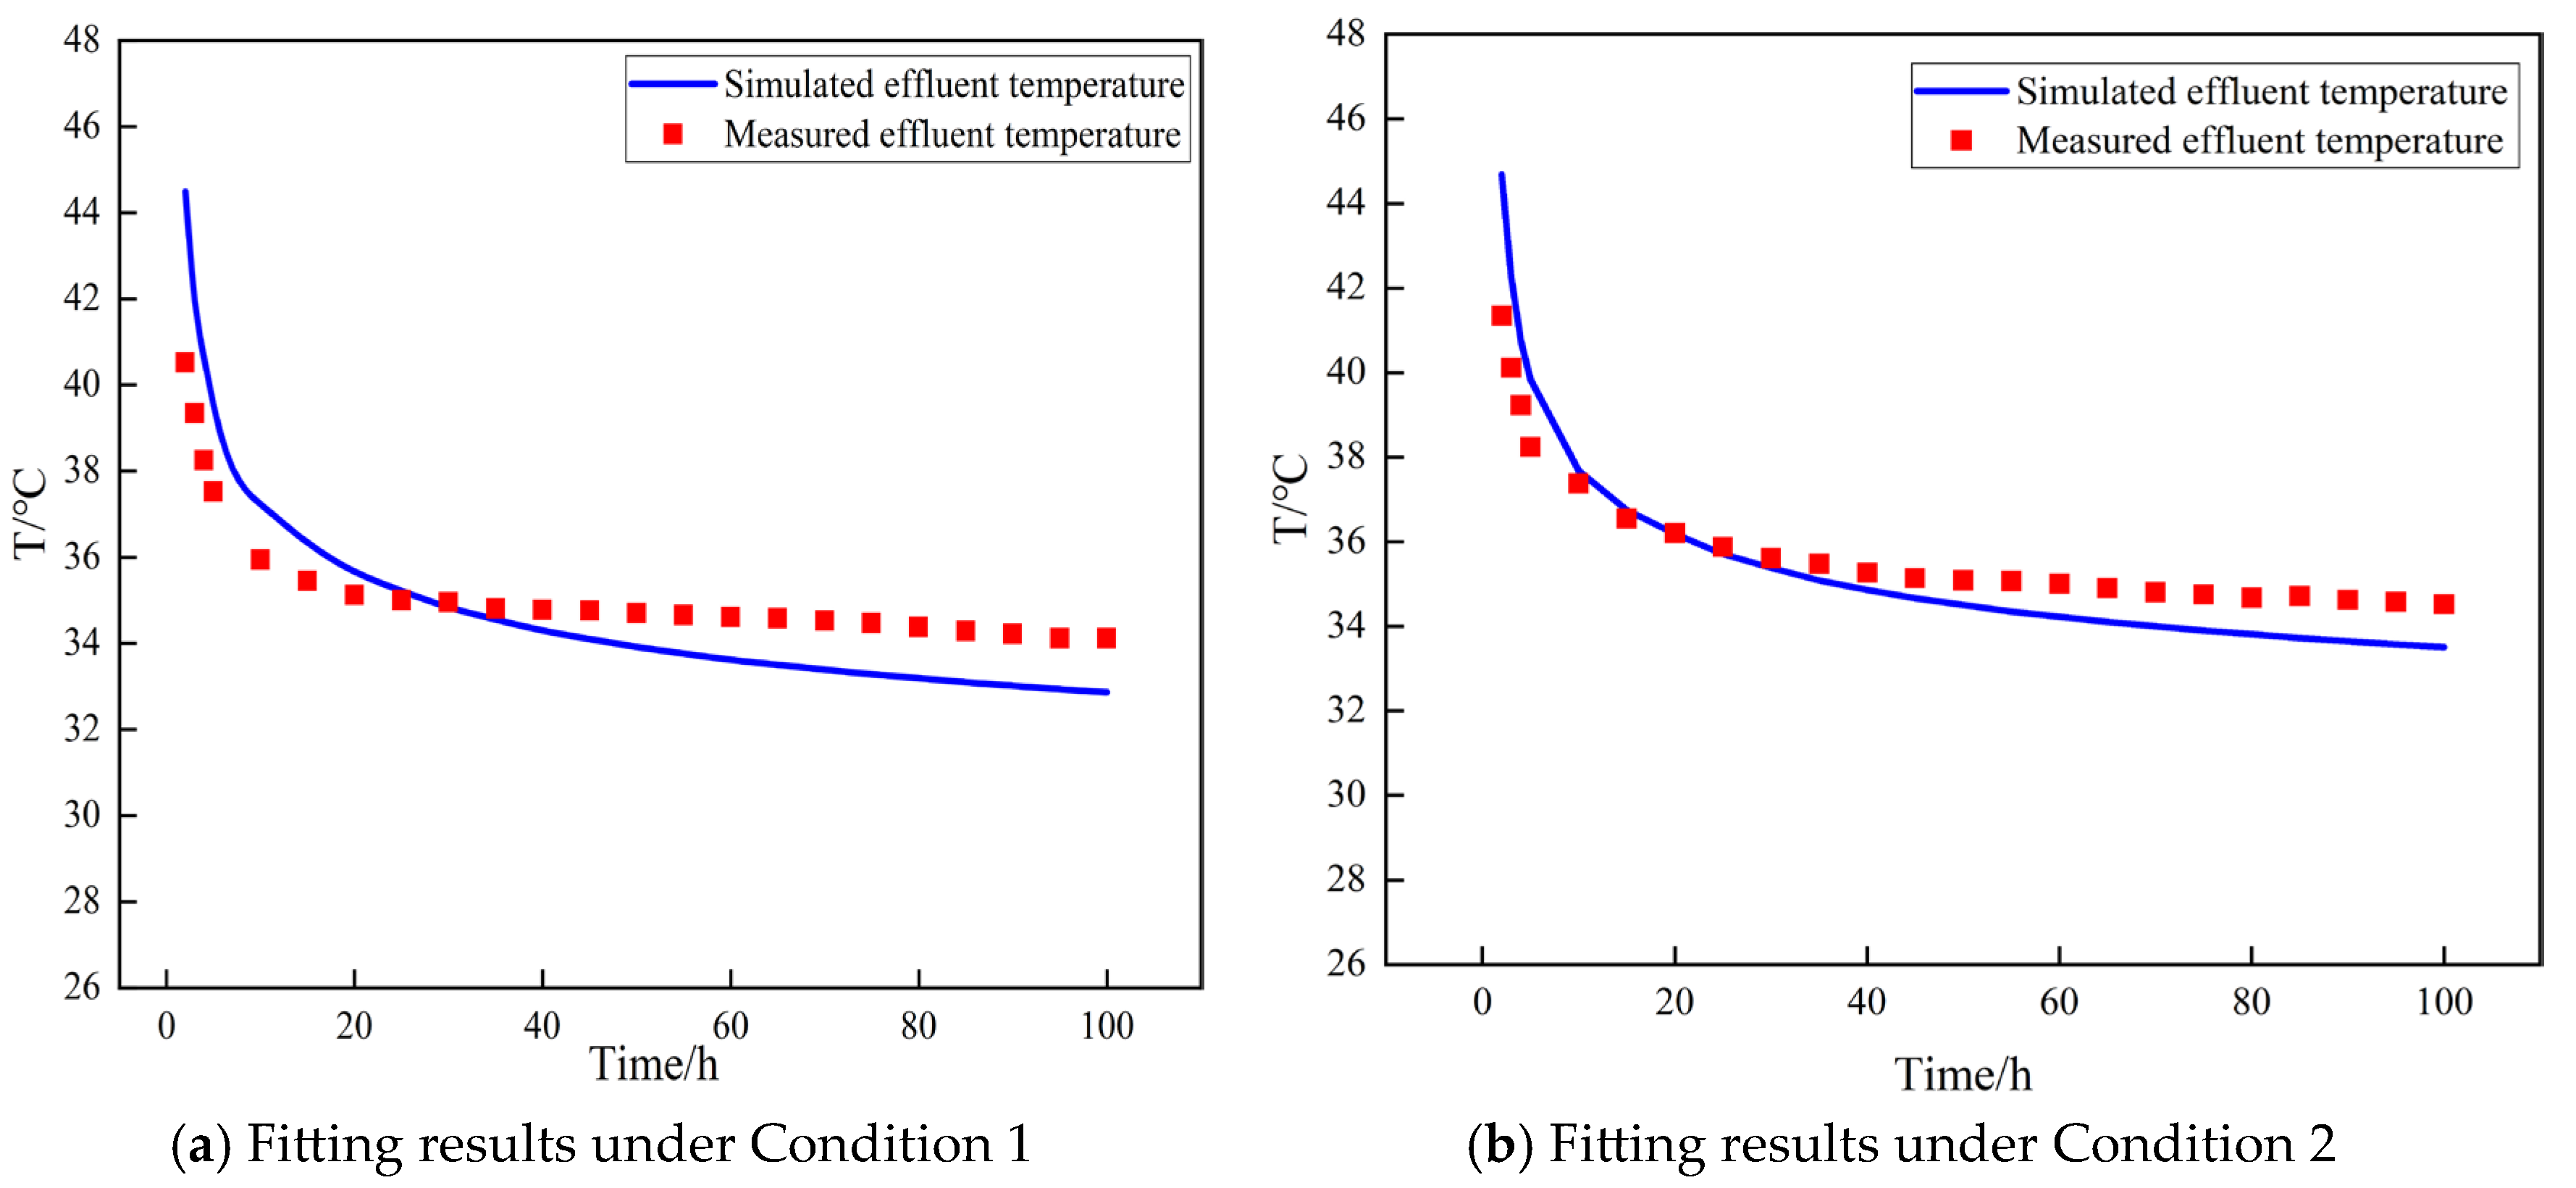
The established numerical model of coaxial heat exchange was used to simulate the heat transfer performance under the two observed operating conditions. The simulation results were then fitted to the experimental data to identify model parameters and validate the model’s accuracy.
Based on the comparison between the simulated and measured outlet temperatures (Figure 11), the root mean square error (RMSE) was 1.39 °C under Operating Condition 1 and 1.13 °C under Operating Condition 2, indicating that the model demonstrates good overall agreement with the experimental data.
The coaxial heat exchanger numerical simulation model was constructed to calculate the heat transfer effects for the two actual field conditions above, and the results were compared with the observed data for model parameter identification and accuracy verification. Possible sources of error include (1) the assumption that the rock mass is a homogeneous, isotropic medium, while the actual strata may exhibit vertical and horizontal differences in thermal conductivity; (2) the use of a linear temperature gradient in the model, while the actual geothermal gradient is nonlinear; (3) while the strata in the region have poor permeability, there is still some seepage, and the thermal convection effects due to seepage were neglected.

4.3. Thermal Performance Indicators

(1)
The heat exchange power of the well was calculated based on the inlet and outlet temperatures of the working fluid:
Q = ρ c p q v T out T in
where Q is the heat exchange power, W; ρ is the fluid density, kg/m3; c p is the specific heat capacity of the fluid, J/kg °C; q v is the volumetric flow rate, m3/s; and T out and T in are the outlet and inlet temperatures of the fluid, respectively, °C.
(2)
The heat exchanger effectiveness was used to evaluate the heat exchange performance, representing the percentage ratio of the actual heat transfer to the theoretical maximum heat transfer:
E = Q a c t Q m a x = ρ c p q v T o u t T i n ρ c p q v T g T i n = T o u t T i n T g T i n
where Qact is the actual heat exchange power, W; Qmax is the theoretical maximum heat exchange power, W; and Tg is the initial formation temperature, °C. As the formation temperature in the model is assumed to vary linearly with depth, the weighted average temperature of the rock and soil at a depth of 2013 m was calculated to be 41.74 °C [32].
(3)
During the heat transfer process in a coaxial heat exchanger, thermal interaction occurs between the injected low-temperature water in the annular space and the rising high-temperature water in the inner pipe. This leads to an increase in inlet temperature and a decrease in outlet temperature, thereby reducing the overall heat exchange effectiveness. This phenomenon is referred to as thermal short-circuiting in coaxial heat exchangers. The temperature difference between the water at the bottom of the inner pipe and the outlet water is defined as the thermal short-circuit value.

4.4. Factors Affecting the Heat Transfer Performance of Heat Exchanger Wells

During the operation of the heat exchange well, both the operating parameters of the working fluid and the material properties of the tubing affect the overall heat transfer performance of the geothermal system. Using the validated coaxial heat exchange numerical model, three key parameters—inlet flow rate, inlet temperature, and thermal conductivity of the inner pipe—were varied to investigate their influence on the heat exchange performance and underlying mechanisms. The simulation was conducted for a typical heating season, with a total duration of 1800 h. This corresponds to the heating period in Xining, which spans from 15 October to 15 April of the following year. Given that the heat exchange system operates intermittently with an average daily runtime of 10 h, the total model runtime was set to 1800 h.

4.4.1. The Impact of Wellhead Injection Flow Rate on Heat Transfer Performance

To investigate the influence of inlet flow rate on the heat exchange performance, the inlet flow rate was set to 10 m3/h, 15 m3/h, 20 m3/h, 25 m3/h, and 30 m3/h, respectively. The inlet temperature was fixed at 22 °C, and all the other parameters were set according to the values identified and validated in the base model.
The calculated outlet temperature and heat exchange power of the coaxial heat exchange well under different inlet flow rates are shown in Figure 12. As the inlet flow rate increased from 10 m3/h to 30 m3/h in increments of 5 m3/h, the outlet temperature decreased from 32.65 °C to 27.58 °C, representing a total reduction of 15.53%. Meanwhile, the corresponding heat exchange power increased from 122.97 kW to 193.78 kW, showing a total increase of 57.58%. As the inlet flow rate increases, the outlet temperature gradually decreases. This is because a higher flow rate shortens the residence time of the working fluid within the heat exchange well, thereby reducing the duration of heat transfer with the surrounding geothermal formation. In contrast, the heat exchange power continues to increase with higher flow rates. This is attributed to two factors: (1) the increase in Reynolds number enhances turbulence, which improves convective heat transfer within the pipe; (2) the overall mass flow rate of the fluid increases, allowing more thermal energy to be transported per unit time. Therefore, despite the decrease in outlet temperature, the total heat exchange power continues to rise.
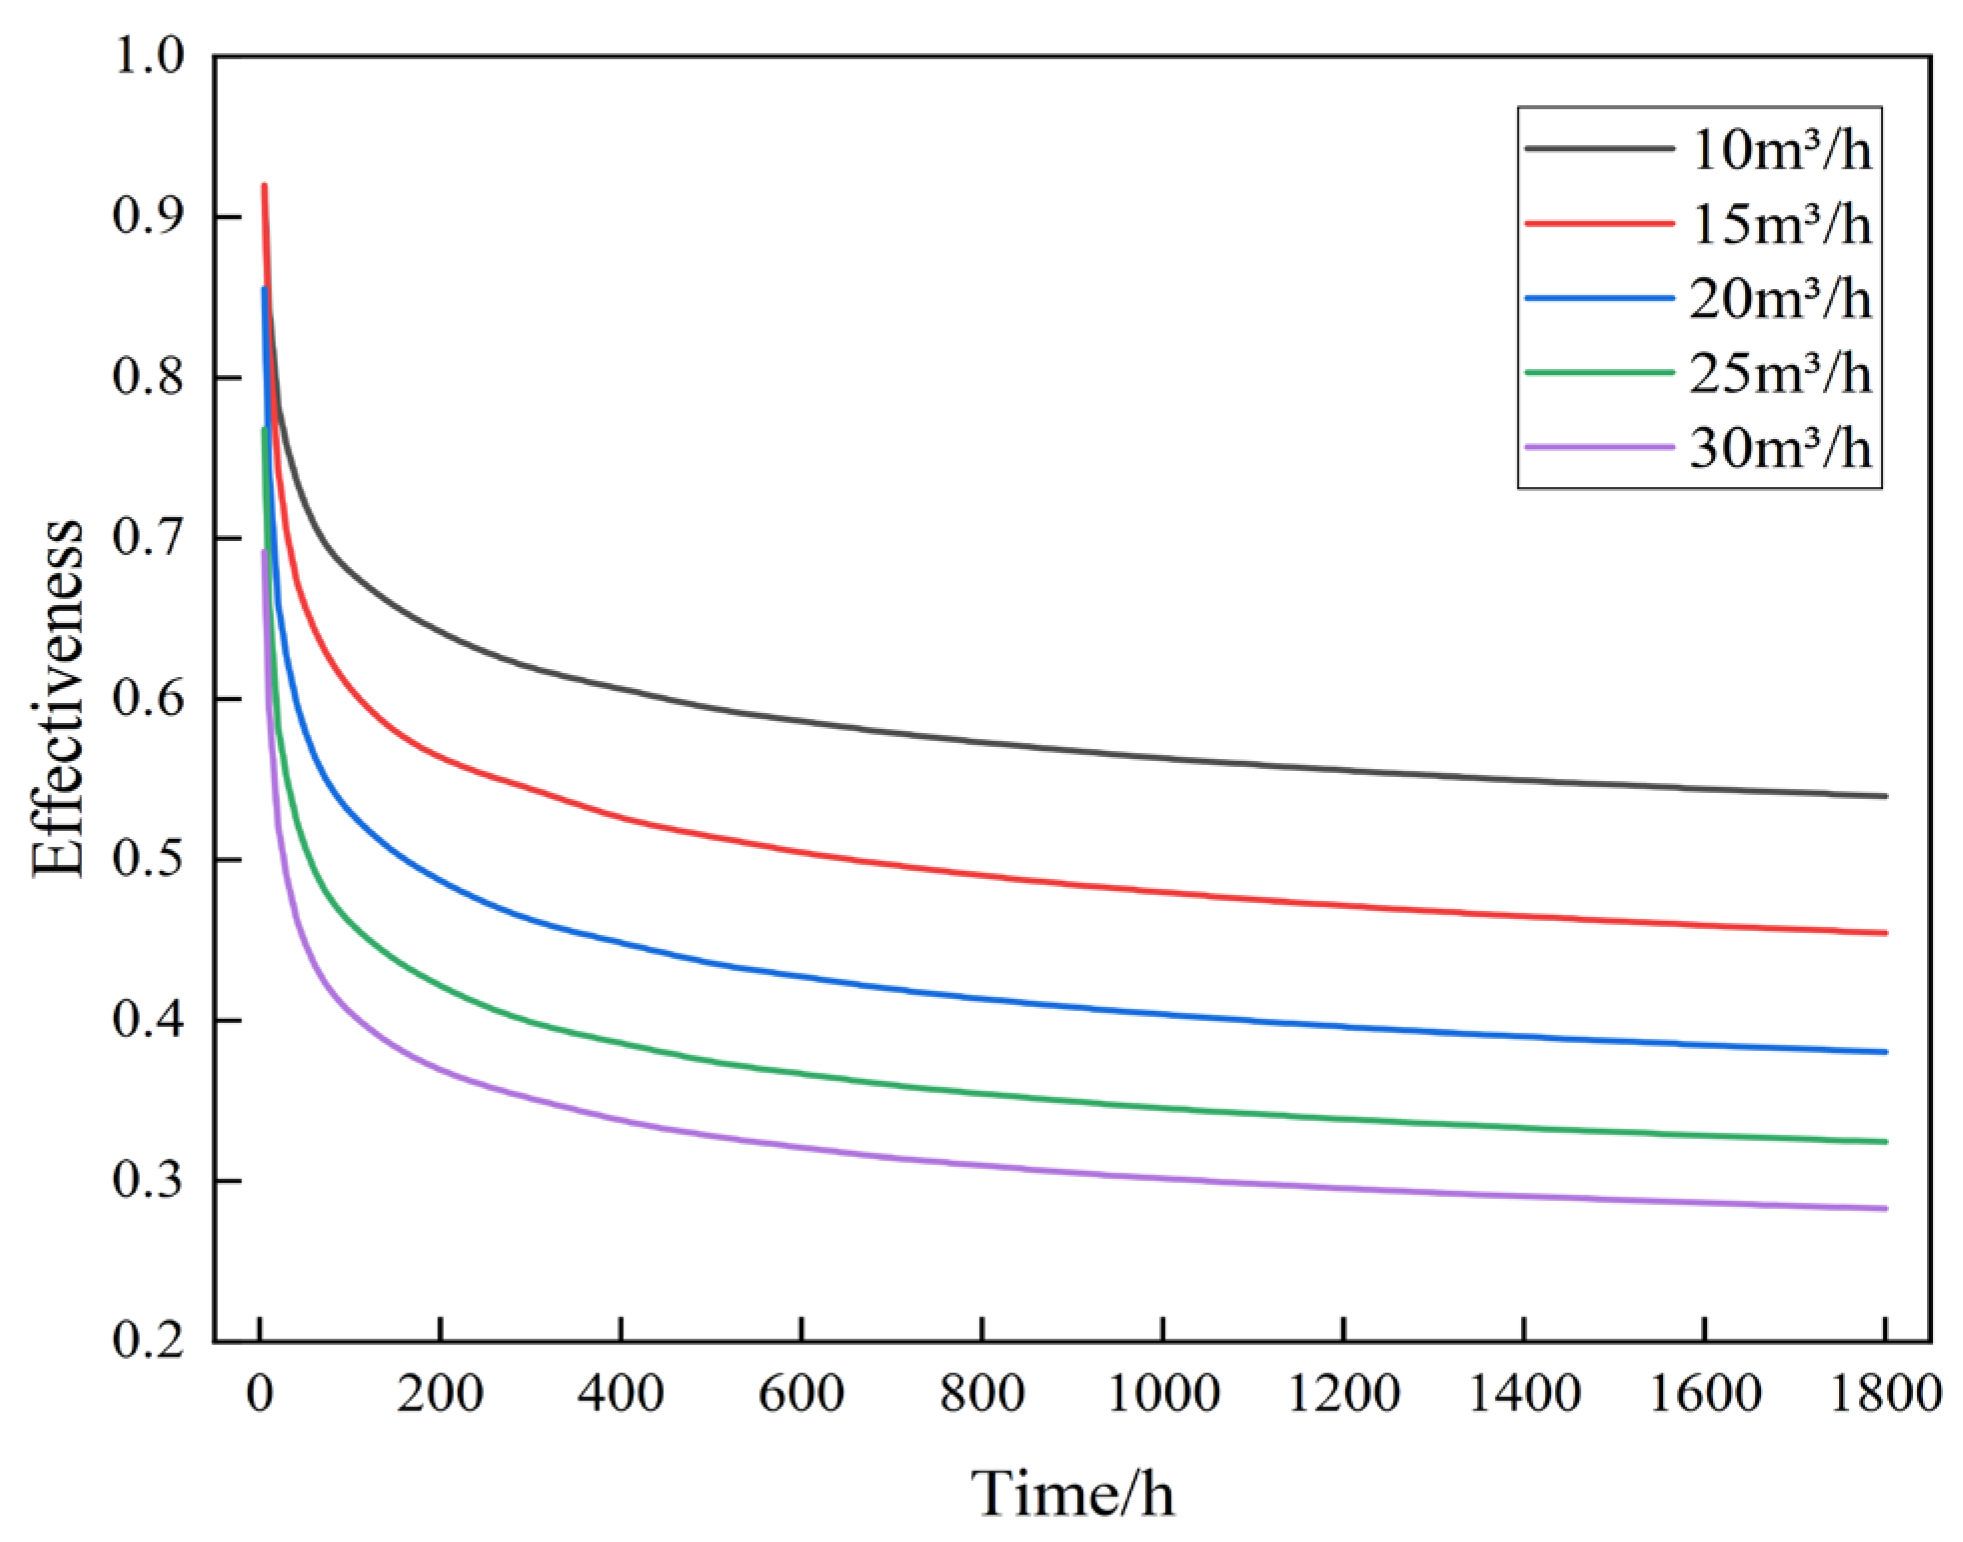
Figure 13 illustrates the variation in heat exchanger effectiveness under different inlet flow rates. With the inlet temperature held constant, an increase in flow rate leads to a noticeable decrease in heat exchanger effectiveness. This is primarily because the higher flow velocity reduces the residence time of the fluid within the wellbore, thereby lowering the outlet temperature and consequently reducing the effectiveness. Figure 14 shows the pipe wall temperature profiles at 1800 h under varying flow rates. As the inlet flow rate increases, the temperature difference between the bottom and top of the well decreases, indicating a weakening of the thermal short-circuit effect.

4.4.2. Influence of Inlet Water Temperature on Heat Exchange Performance

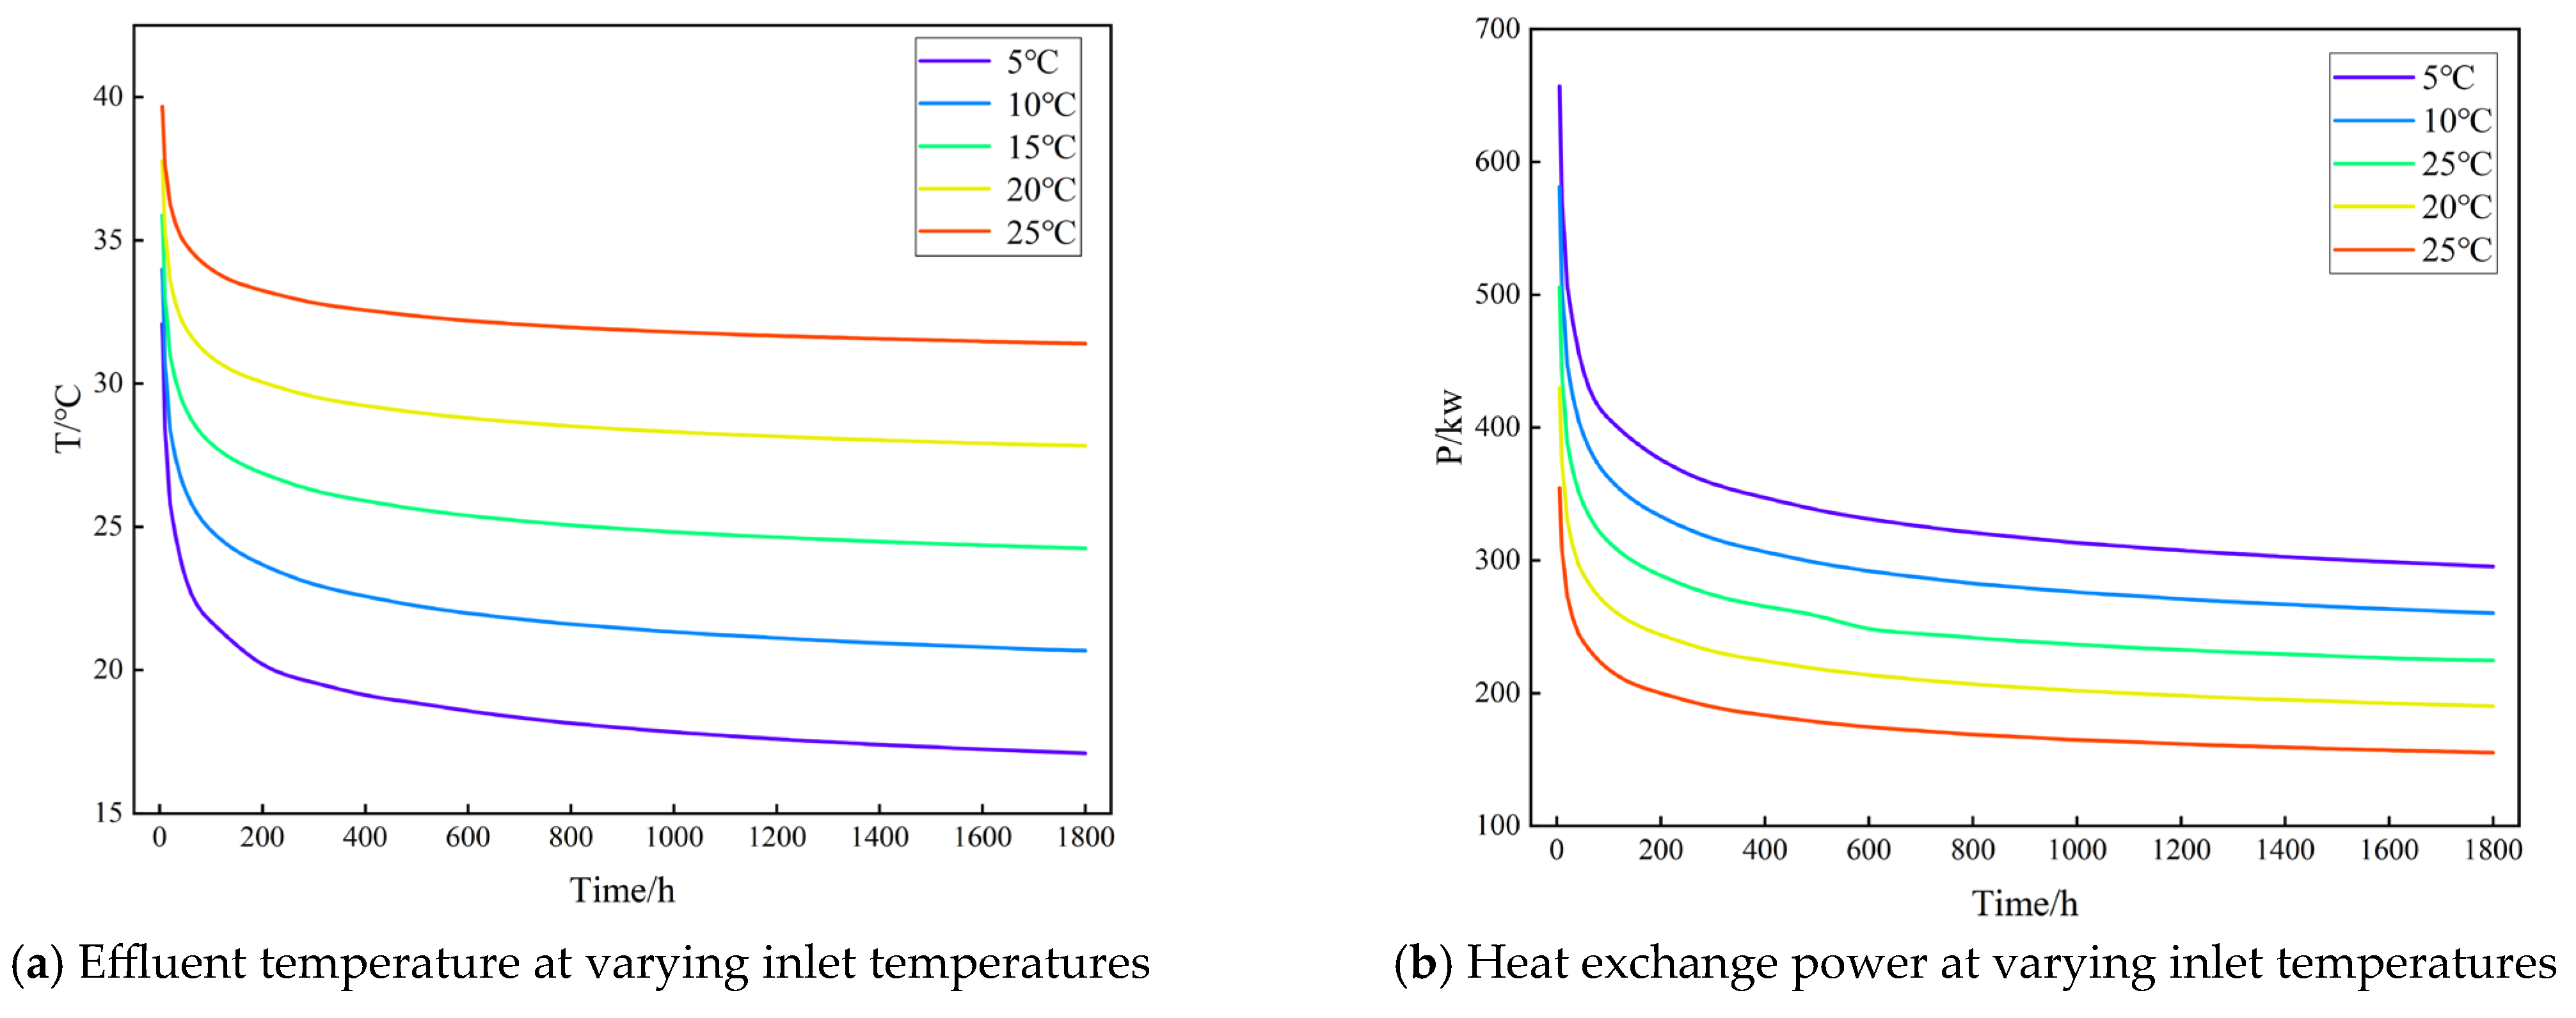
To investigate the effect of inlet temperature on heat exchange performance, the inlet temperature was set to 5 °C, 10 °C, 15 °C, 20 °C, and 25 °C, respectively. The inlet flow rate was fixed at 21 m3/h, and all the other parameters were set according to the values identified and validated in the base model.
The calculated outlet temperature and heat exchange power of the coaxial heat exchange well under different inlet temperatures are shown in Figure 15. As the inlet temperature increased from 5 °C to 25 °C in increments of 5 °C, the outlet temperature rose from 17.10 °C to 31.40 °C, representing a total increase of 83.63%. In contrast, the heat exchange power decreased from 295.44 kW to 155.26 kW, corresponding to a total reduction of 47.45%. As the inlet temperature increases, the outlet temperature also rises accordingly. However, the heat exchange power decreases. This is because lower inlet temperatures result in a larger temperature gradient between the wellbore fluid and the surrounding formation, which enhances both conductive and convective heat transfer. The increased temperature gradient strengthens the thermal driving force, leading to a higher heat flux from the formation into the wellbore and thus improving the overall heat exchange performance. As the inlet temperature continues to rise, the temperature gradient diminishes, resulting in a gradual decrease in heat exchange power.
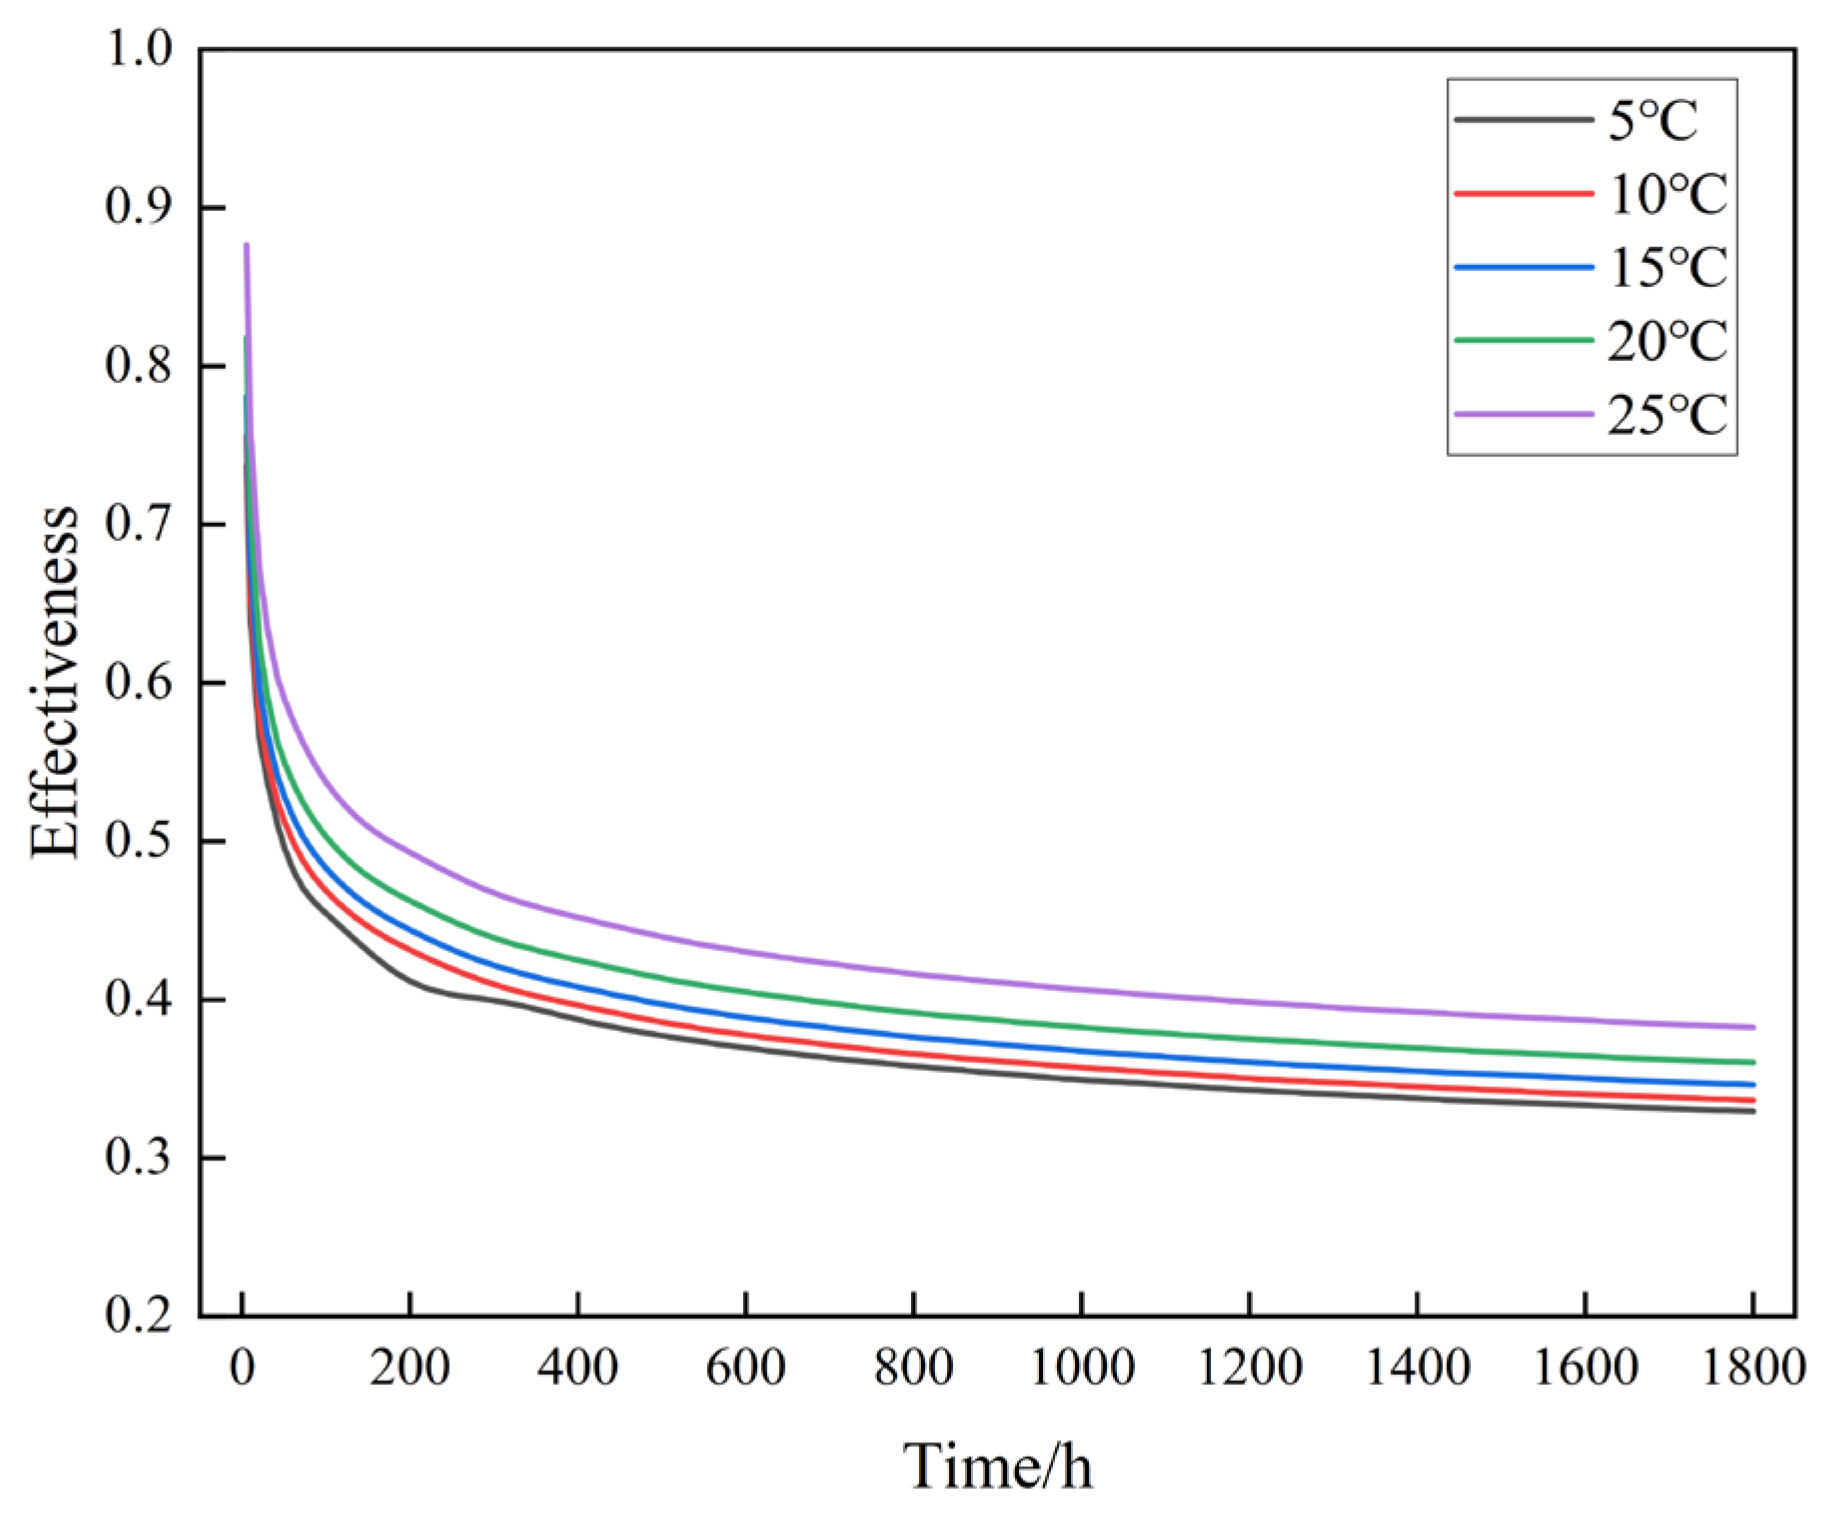
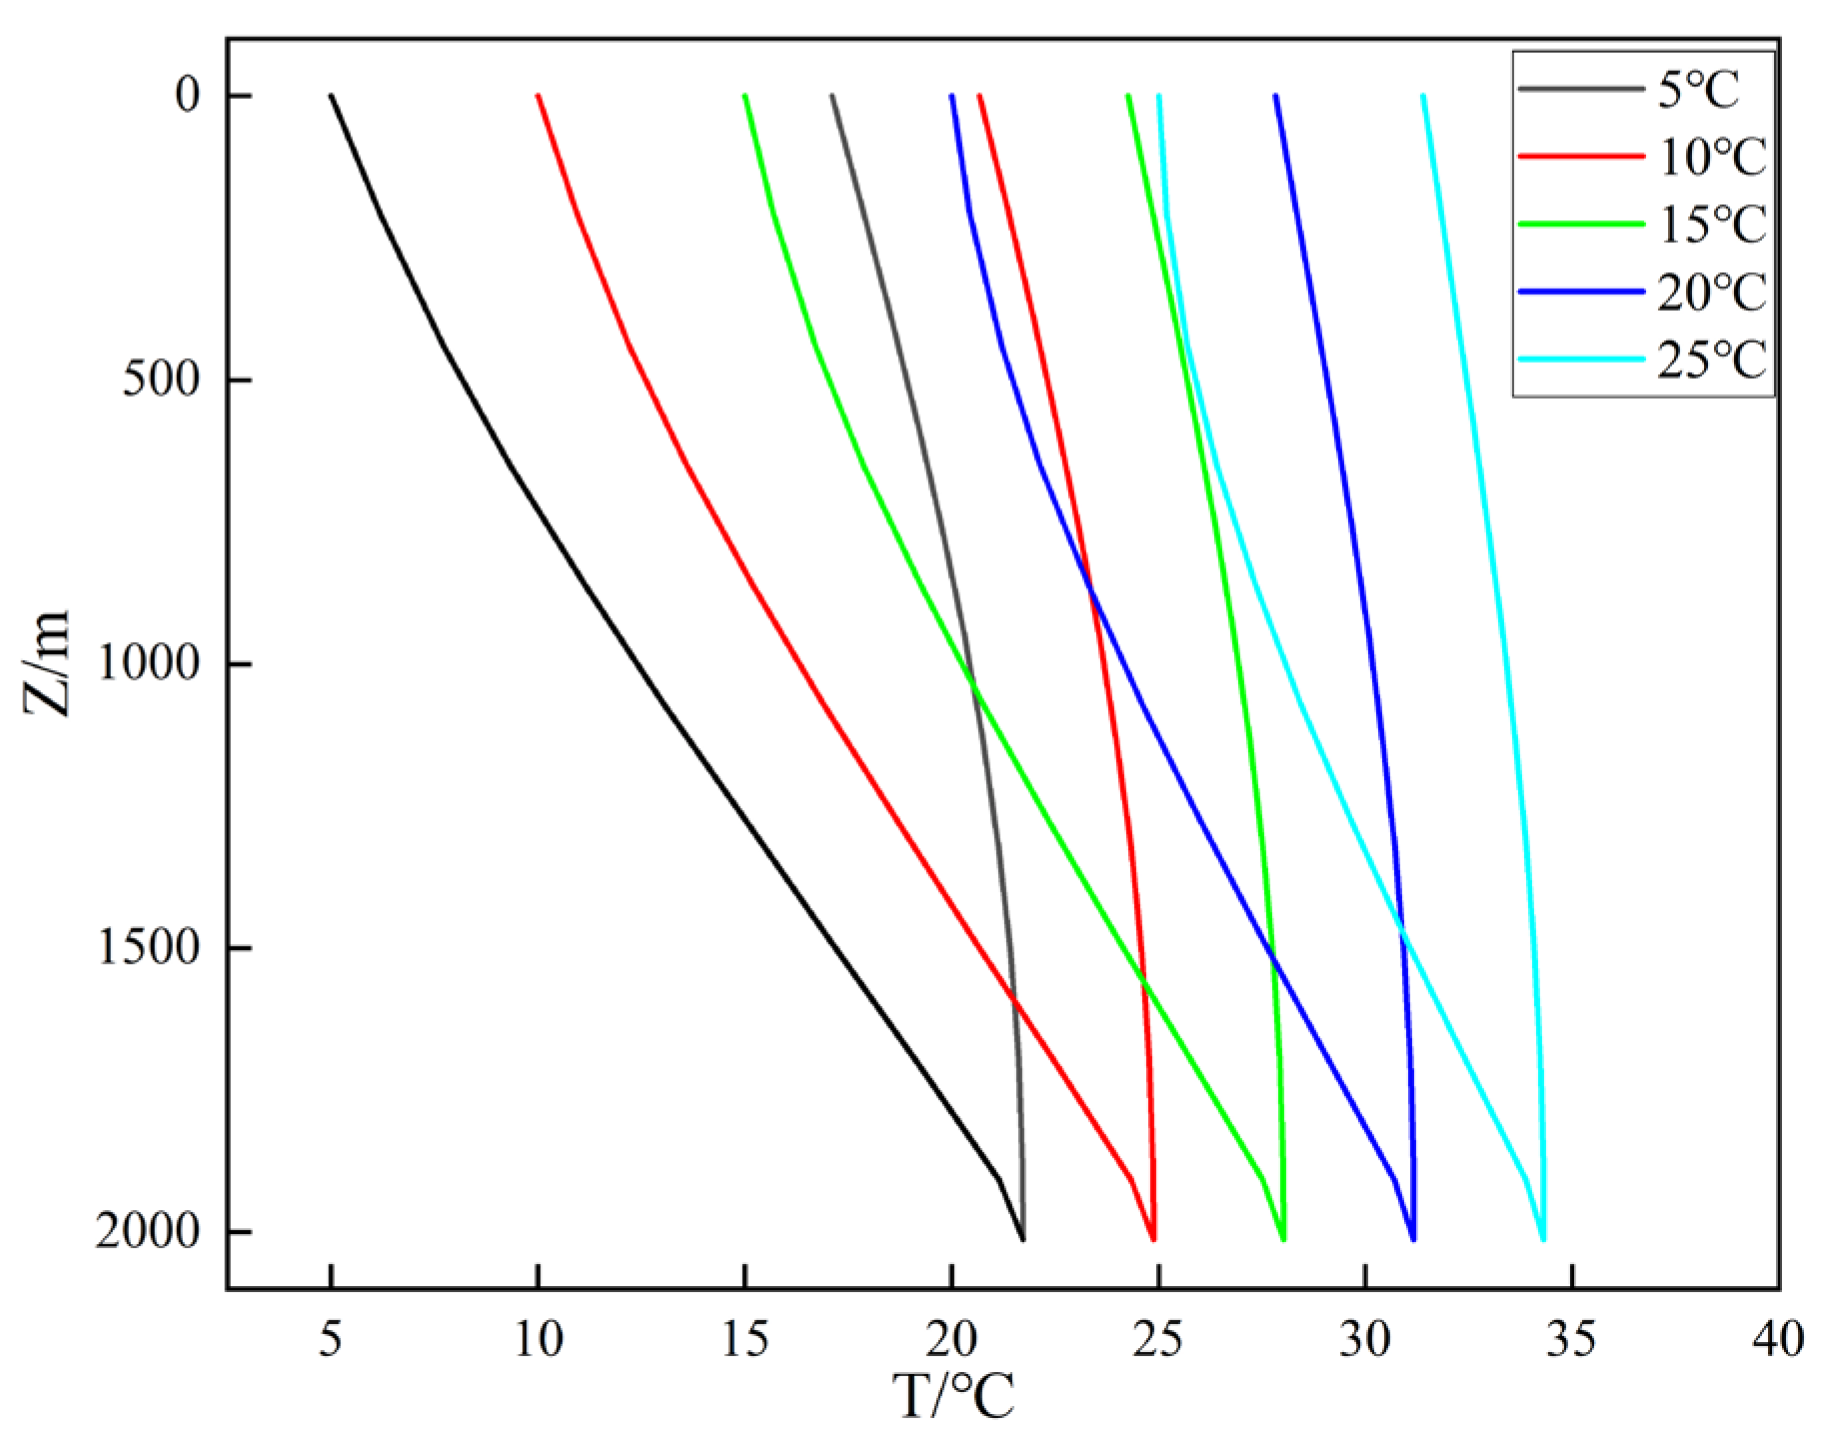
Figure 16 shows the variation in heat exchanger effectiveness under different inlet temperatures. With the flow rate held constant, increasing the inlet temperature leads to an increase in heat exchanger effectiveness. This is because the temperature difference between the inlet and outlet decreases as water temperature rises, resulting in a lower theoretical maximum heat exchange power. Consequently, the actual effectiveness becomes closer to the theoretical maximum. Figure 17 presents the pipe wall temperature distribution at 1800 h under varying inlet temperatures. As the inlet temperature increases, the temperature difference between the bottom and top of the well gradually decreases, indicating a reduction in the thermal short-circuit effect.

4.4.3. The Effect of the Thermal Conductivity of the Central Pipe on Heat Transfer Performance

To investigate the effect of the central pipe’s thermal conductivity on heat exchange performance, the thermal conductivity was set to 0.1 W/(m·K), 0.2 W/(m·K), 0.3 W/(m·K), 0.4 W/(m·K), and 0.5 W/(m·K), respectively. The inlet flow rate and inlet temperature were fixed at 21 m3/h and 22 °C, while all the other parameters were based on the values identified and validated in the numerical model.
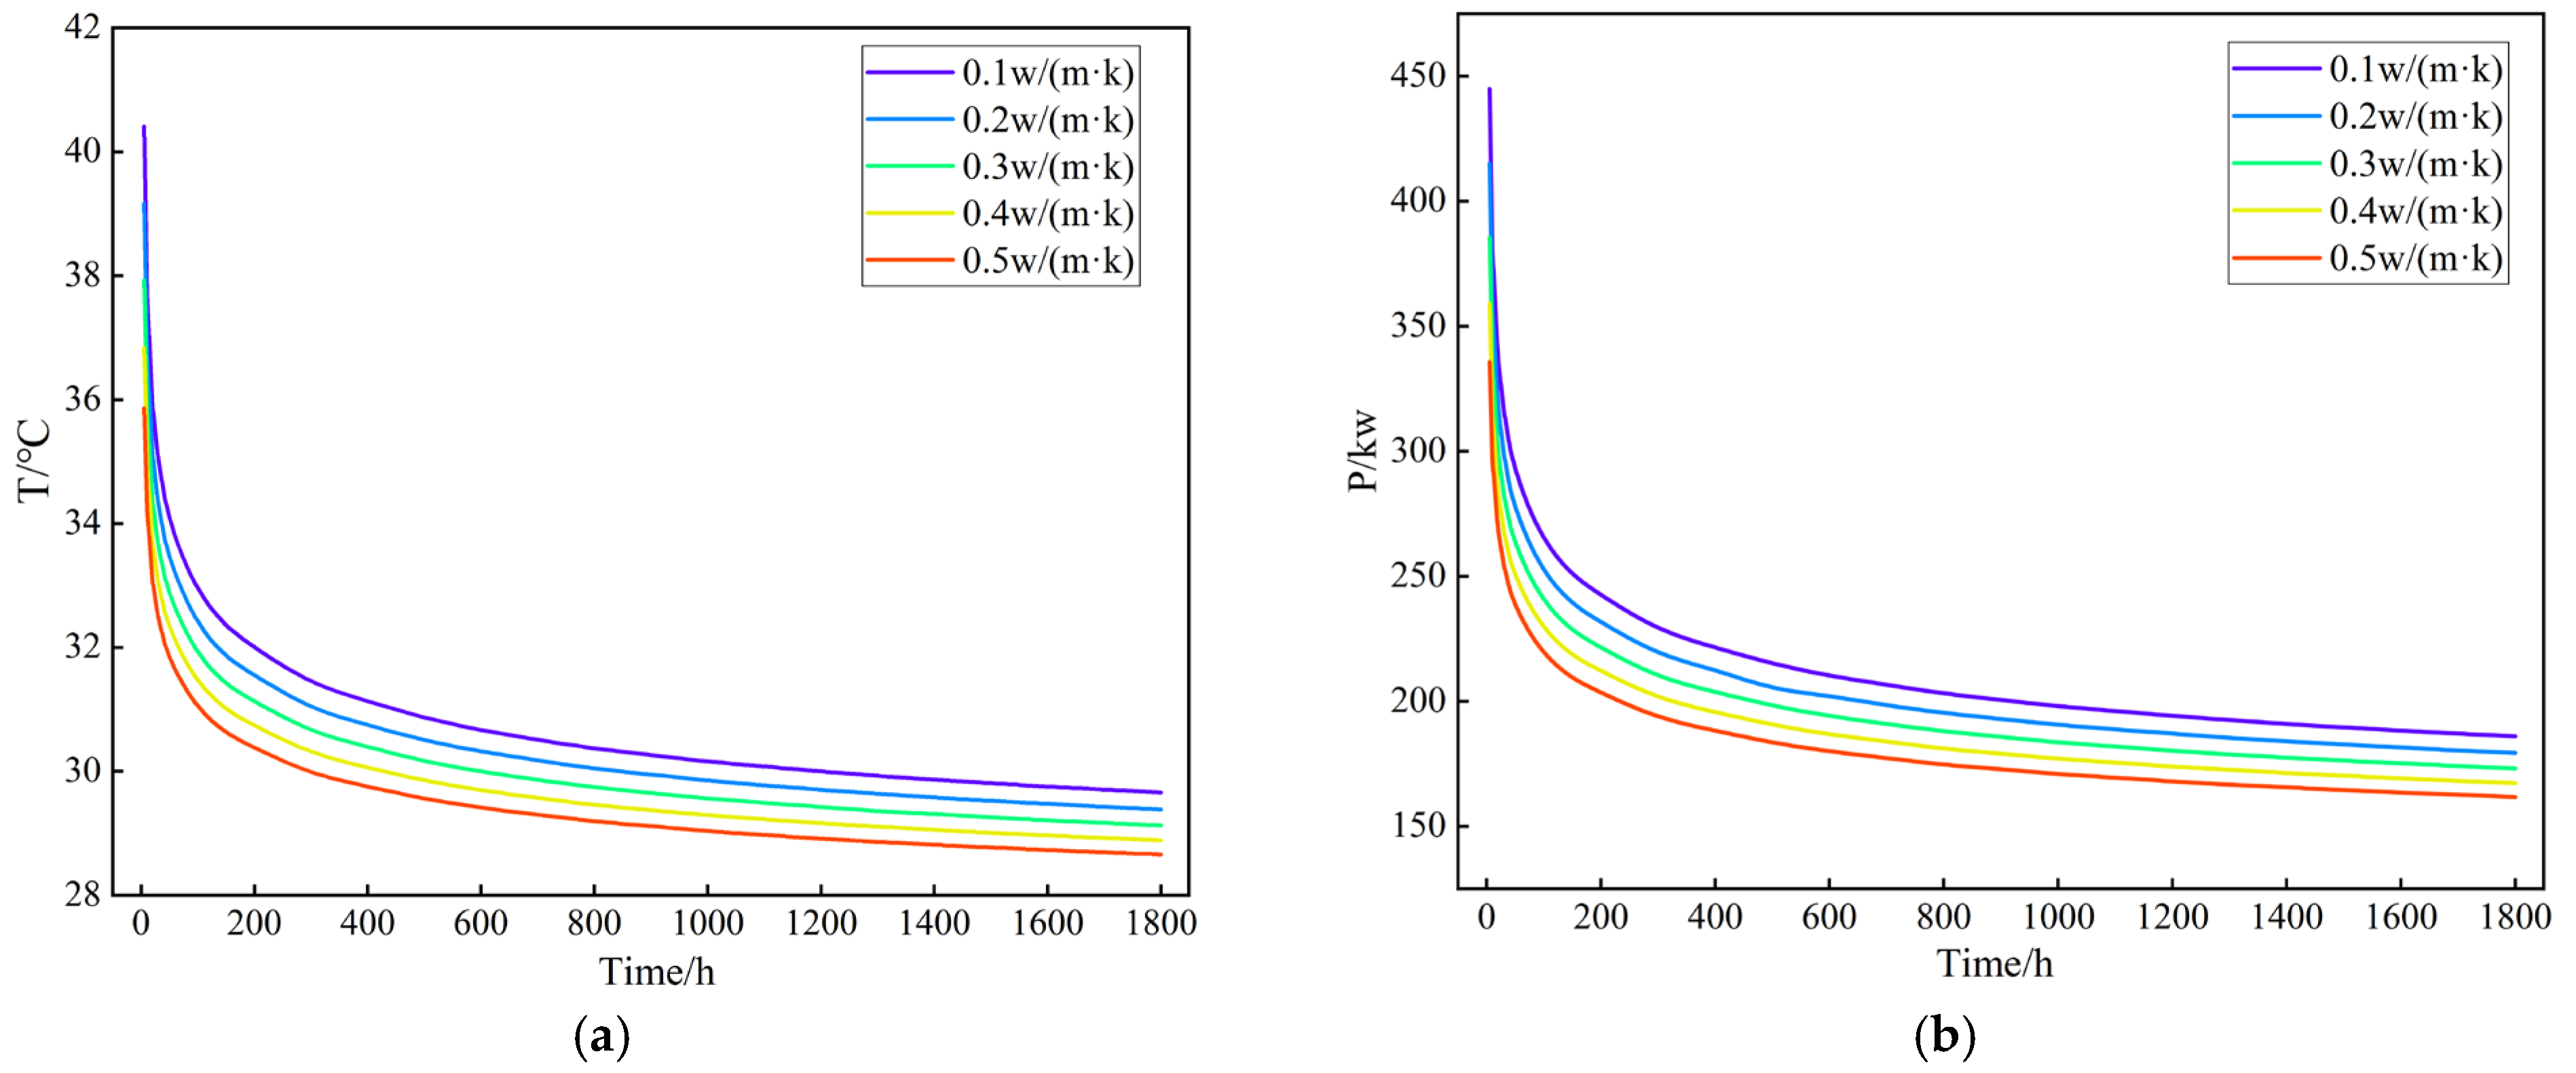
The calculated outlet temperature and heat exchange power under different thermal conductivities of the central pipe are shown in Figure 18. As the thermal conductivity increased from 0.1 W/(m·K) to 0.5 W/(m·K), both the outlet temperature and heat exchange power showed a decreasing trend. Specifically, the outlet temperature dropped from 29.66 °C to 28.66 °C, representing a total decrease of 3.41%. Meanwhile, the heat exchange power decreased from 185.99 kW to 161.78 kW, a reduction of 13.7%. Figure 19 presents the variation in heat exchanger effectiveness under different thermal conductivities, which shows a trend consistent with that of outlet temperature and heat exchange power.
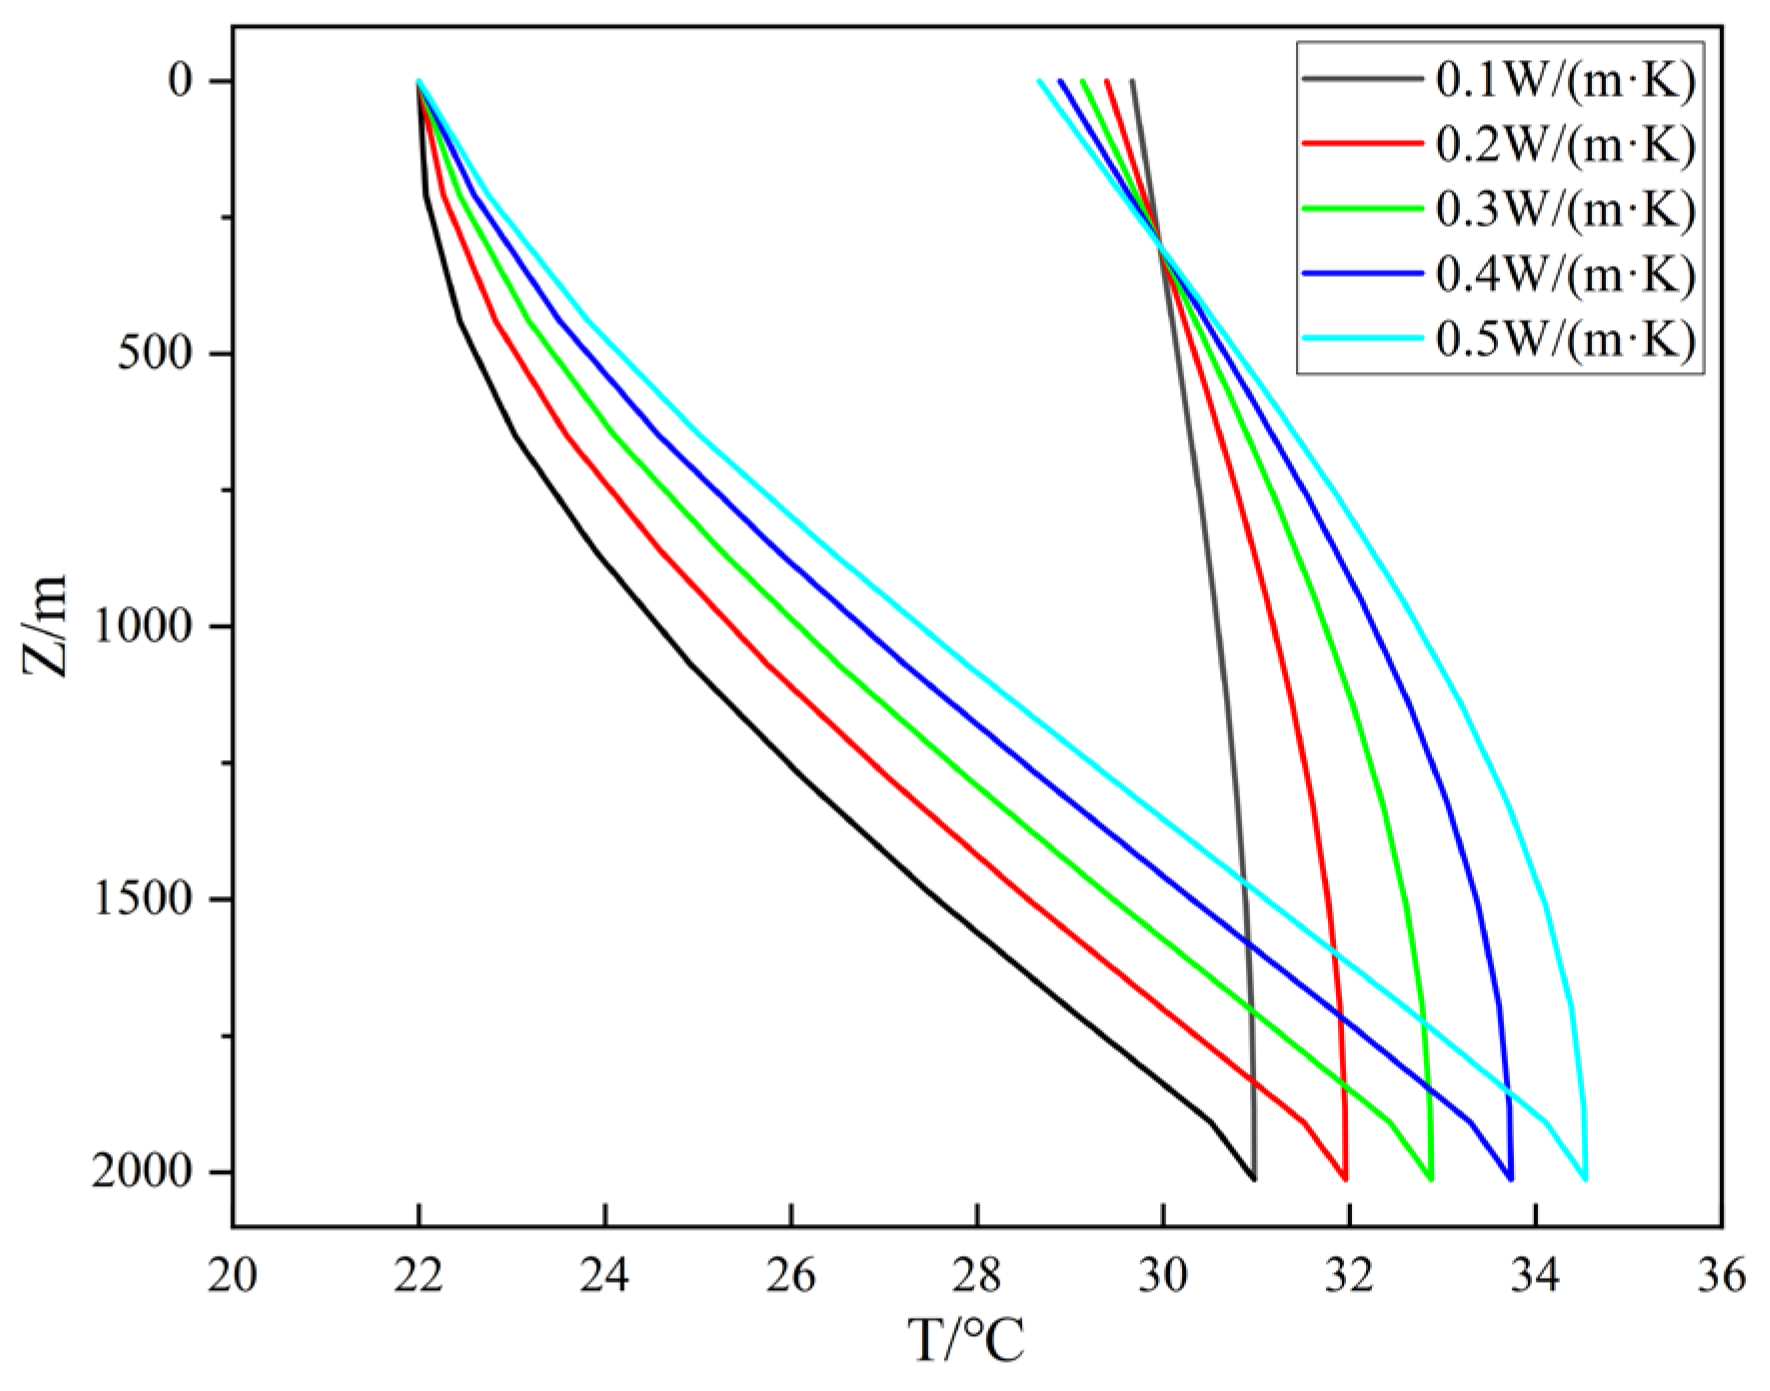
Figure 20 shows the pipe wall temperature distribution at 1800 h under different thermal conductivities of the central pipe. As the thermal conductivity increases, the temperature difference between the bottom and the top of the well gradually widens, indicating an enhancement of the thermal short-circuit effect. Additionally, temperature intersection points are observed between curves with different thermal conductivities. This phenomenon is attributed to a dynamic balance between thermal conduction and convection during the upward flow of the working fluid.
The results indicate that under long-term operation, increasing the thermal conductivity of the central pipe in a coaxial heat exchange well leads to an overall reduction in outlet temperature, heat exchange power, and heat exchanger effectiveness. This suggests that a higher thermal conductivity of the central pipe enhances heat loss from the pipe to the surrounding formation. As more heat dissipates outward through the pipe wall, the fluid temperature decreases during its upward transport within the wellbore, ultimately resulting in a lower outlet temperature and reduced overall heat exchange performance of the system.

4.5. Impact of Downhole Heat Exchange on the Temperature of the Heat Storage Layer

The above analysis demonstrates that the inlet flow rate, inlet temperature, and the thermal conductivity of the central pipe all significantly influence the heat exchange performance of the coaxial well. To evaluate the heat extraction performance of the coaxial heat exchange well in Dapuzi Town over a single heating season, and to assess its impact on the formation temperature field, a predictive simulation was conducted. The goal was also to optimize the operating parameters of the field system. Based on actual test conditions, the simulation was carried out with an inlet flow rate of 21 m3/h, an inlet temperature of 22 °C, and a central pipe thermal conductivity of 0.25 W/(m·K). This configuration was used to predict the thermal response of the reservoir over a full heating season.

4.5.1. Impact of Downhole Heat Exchange on the Temperature Field of the Heat Storage Layer

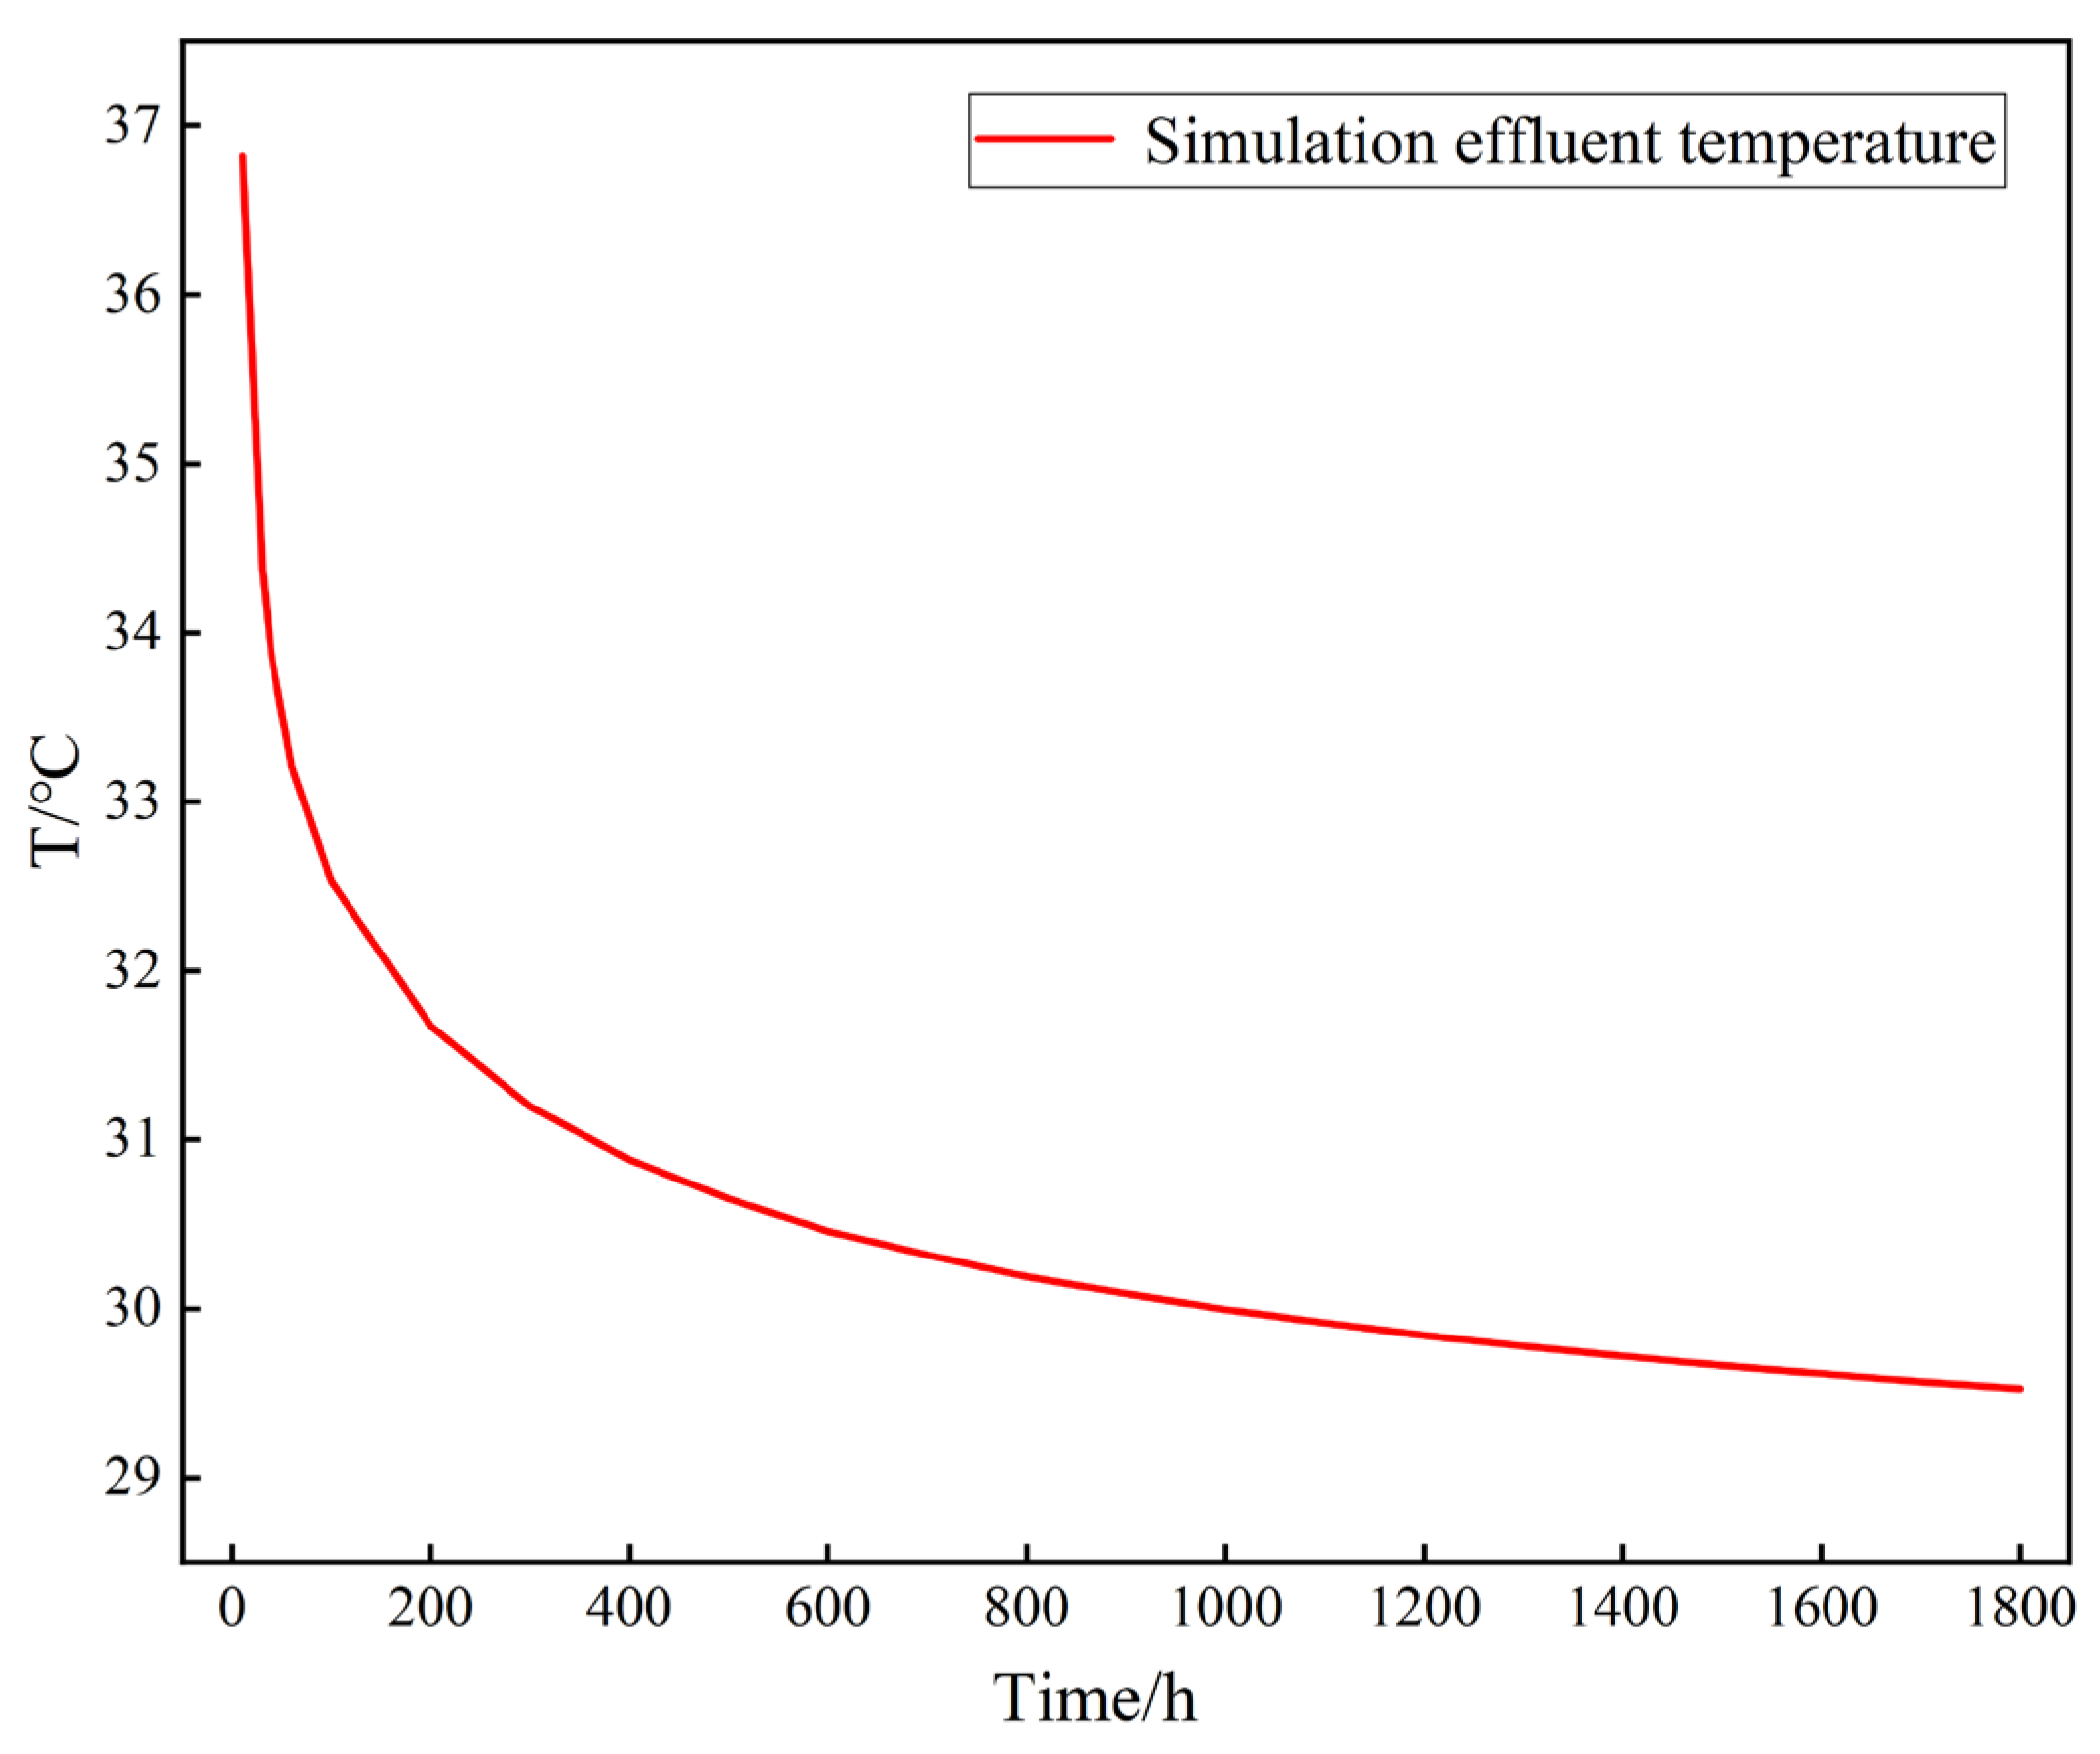
A prediction was conducted for the variation in outlet temperature at the coaxial heat exchange well in the Dapuzi test site over the heating season. As shown in Figure 21, the outlet temperature gradually decreases with increasing operating time. By the end of the simulation period (1800 h), the outlet temperature reaches 29.53 °C, indicating a progressive reduction in heat extraction effectiveness over time.
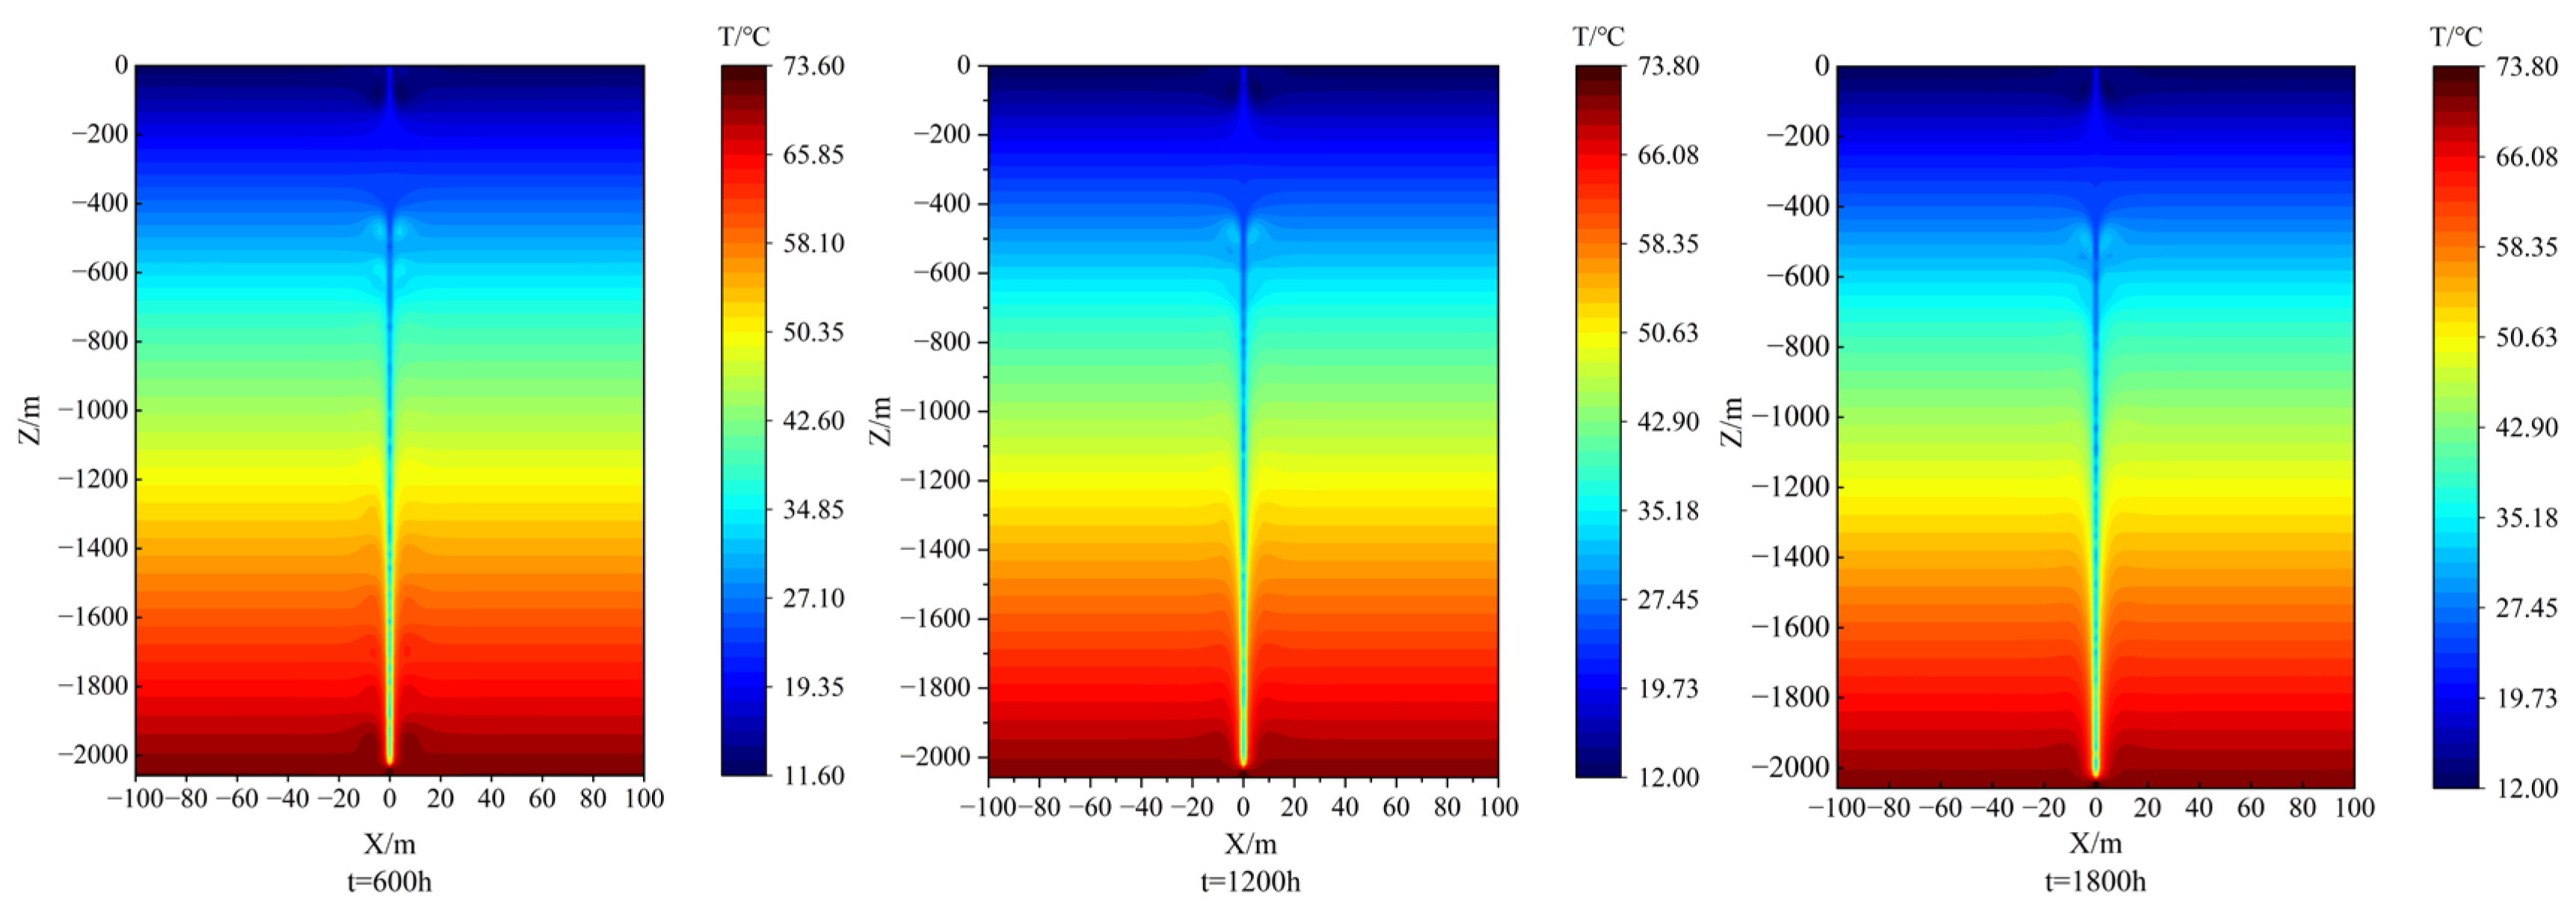
Figure 22 presents the temperature isotherms of the thermal reservoir at different simulation times. As operation time increases, the deeper sections of the reservoir are increasingly affected by the heat exchange well, with both the extent and magnitude of temperature decline becoming more pronounced. Notably, the isotherms exhibit distinct shapes at different depths: in shallow regions, the contours bulge upward, while in deeper zones, they curve downward. This pattern is primarily due to the dominant heat transfer occurring near the pipe wall. In the upper part of the well, the returning warm water leads to higher temperatures and faster thermal diffusion, resulting in upward-convex isotherms. In contrast, in the lower part, the incoming cold water extracts heat from the surrounding formation, causing a local temperature drop and the formation of downward-concave isotherms.

4.5.2. Influence Radius of Geothermal Reservoir Temperature

The thermal influence radius of the reservoir refers to the spatial extent within which the operation of the heat exchange well causes a significant temperature change in the surrounding formation. It reflects the thermal disturbance capability of the well and serves as an indicator of its impact on reservoir temperature during the heat exchange process. Additionally, temperature attenuation isotherms are used to represent the degree of temperature reduction at different locations relative to the initial geothermal conditions. The spatial distribution of these isotherms intuitively reveals both the range and intensity of the thermal influence. To determine the thermal influence radius of the coaxial heat exchange well on the reservoir, temperature attenuation isotherms were plotted at different depths and operating times (Figure 23 and Figure 24).
As the depth of the heat exchange well increases, the thermal influence radius of the reservoir expands accordingly. After 1800 h of operation, the maximum thermal influence radii at depths of 600 m, 1200 m, and 1800 m were 7.87 m, 9.29 m, and 10.04 m, respectively. Meanwhile, the influence radius also increases with longer operating times. For example, at a depth of 1800 m, the maximum thermal influence radius increased from 6.14 m at 600 h to 8.17 m at 1200 h, and further to 10.04 m at 1800 h.
The above analysis of factors influencing the heat exchange performance of the coaxial well indicates that in practical applications, the inlet flow rate should be carefully selected to balance between heat exchange effectiveness and outlet temperature. Excessively high or low flow rates may lead to undesirably low outlet temperatures or insufficient heat exchange power, thereby compromising the overall performance of the system. Similarly, the inlet temperature should be chosen to ensure a reasonable increase in outlet temperature while maintaining adequate heat extraction; it should not be set too high or too low. Regarding the central pipe material, a lower thermal conductivity is preferred—within the constraints of engineering cost—to reduce heat loss through the pipe wall and minimize temperature drop of the rising fluid. For the Dapuzi test site, in order to achieve a balance between outlet temperature and heat exchange power, it is recommended to maintain an inlet flow rate of 20–25 m3/h and an inlet temperature around 20 °C.

5. Conclusions

This study uses COMSOL Multiphysics 6.2 to perform a numerical simulation of the coaxial heat exchange system at a site in Dapuzi Town, Xining, focusing on the 2013 m deep coaxial heat exchange well. By altering the wellhead injection flow rate, wellhead injection temperature, and the thermal conductivity of the central pipe, the impact on the effluent temperature and heat exchange power under different conditions was investigated. Additionally, based on the actual site operational conditions, the temperature changes in the production fluid and the thermal reservoir after one heating season were predicted. The results show the following:
(1)
Under medium–low temperature geothermal reservoir conditions in cold regions, the coaxial borehole heat exchanger demonstrates effective heat extraction performance, with a maximum average outlet temperature of 34.92 °C and a peak heat exchange power of 282.37 kW under actual operating conditions.
(2)
Among the three selected influencing factors, the inlet flow rate is the dominant factor affecting heat exchange power. When the inlet flow rate increases from 10 m3/h to 30 m3/h, the heat exchange power rises by 57.58%. However, due to the reduced residence time of the working fluid in the heat exchanger, both the outlet temperature and heat exchange efficiency decrease. This results in a nonlinear response characterized by “increased power–decreased temperature”.
(3)
The inlet water temperature primarily affects the thermal driving force and the outlet temperature. As the inlet temperature increases from 5 °C to 25 °C, the outlet temperature rises by 83.63%, while thermal short-circuiting is reduced and heat exchanger efficiency improves. However, due to the decreasing temperature difference between the formation and the fluid, the heat exchange power drops by 47.45%, indicating that excessively high inlet temperatures can weaken the system’s heat extraction capacity.
(4)
An increase in the thermal conductivity of the inner pipe intensifies thermal short-circuiting between the inner and outer fluid flows, thereby reducing the overall heat exchange performance. When the thermal conductivity of the inner pipe increases from 0.10 W/(m·K) to 0.50 W/(m·K), the outlet temperature decreases by 3.41%, and the heat exchange power drops by 13.7%, indicating a suppressed overall system performance.
(5)
Simulation of a full heating cycle shows that the outlet temperature gradually decreases to 29.53 °C, while the thermal influence radius of the reservoir expands progressively with both depth and operating time, reaching a maximum extent of 10.04 m.
(6)
For the coaxial borehole heat exchanger at the Dapuzi site, maintaining an inlet flow rate between 20 and 25 m3/h and an inlet temperature around 20 °C can achieve a balance between outlet temperature and heat exchange power, thereby optimizing overall heat exchange efficiency.
The research findings provide a quantitative design basis for the closed-loop utilization of medium–deep geothermal resources in cold regions. The study clarifies the mechanisms of key influencing factors and their quantitative response relationships, demonstrating strong engineering applicability and regional scalability. These results offer valuable guidance for the optimization of geothermal systems under long-duration heating conditions in high-altitude cold regions.

Author Contributions

Conceptualization, Z.Z. and G.Q.; Methodology, Z.Z. and G.Q.; Software, Z.Z. and X.Z.; Validation, X.Z.; Data curation, Y.Y.; Writing—original draft, X.Z. and B.Y.; Writing—review & editing, B.Y.; Visualization, Y.Y. All authors have read and agreed to the published version of the manuscript.

Funding

This work was financially supported by the Science and Technology Plan Project of Qinghai Provincial Environmental Geological Exploration Bureau (2023-KJ-03).

Data Availability Statement

The datasets used and/or analyzed during the current study are available from the corresponding author upon reasonable request.

Conflicts of Interest

Authors Zhen Zhao and Guangxiong Qin were employed by Qinghai 906 Engineering Survey and Design Institute Co., Ltd. The remaining authors declare that the research was conducted in the absence of any commercial or financial relationships that could be construed as a potential conflict of interest.

References

  1. Beier, R.A. Thermal response tests on deep borehole heat exchangers with geothermal gradient. Appl. Therm. Eng. 2020, 178, 115447. [Google Scholar] [CrossRef]
  2. Tang, F.; Nowamooz, H. Factors influencing the performance of shallow borehole heat exchanger. Energy Convers. Manag. 2019, 181, 571–583. [Google Scholar] [CrossRef]
  3. Lund, J.W.; Aniko, N.T. Direct utilization of geothermal energy 2020 worldwide review. Geothermics 2021, 90, 101915. [Google Scholar] [CrossRef]
  4. Yin, H.; Song, C.; Ma, L.; Gao, L.; Yang, X.; Li, W.; Zhao, J. Analysis of flow and thermal breakthrough in leaky downhole coaxial open loop geothermal system. Appl. Therm. Eng. 2021, 194, 117098. [Google Scholar] [CrossRef]
  5. Liu, Z.; Yang, M.; Huang, L.; Liao, K.; Zhang, J. Review on geothermal energy development technology and numerical simulation of abandoned wells. Acta Energiae Solaris Sin. 2023, 44, 311–318. [Google Scholar]
  6. Cheng, N.; Zhou, C.; Luo, Y.; Shen, J.; Tian, Z.; Sun, D.; Fan, J.; Zhang, L.; Deng, J.; Rosen, M.A. Thermal behavior and performance of shallow-deep-mixed borehole heat exchanger array for sustainable building cooling and heating. Energy Build. 2023, 291, 113108. [Google Scholar] [CrossRef]
  7. Hu, Z.; Wang, Y.; Jie, K.; Ren, X.; Hu, P.; Fei, L. Application of tube-in-tube type ground-source heat pump technology to hotel building. Refrig. Air-Cond. 2016, 8, 68–73. [Google Scholar]
  8. Luo, J.; Zhang, Y.; Liu, Q.; Li, X.; Lou, J. Numerical simulation of heat transfer performance of spiral vane reinforced medium and deep geothermal coaxial heat exchanger. World Geol. 2023, 42, 740–748. [Google Scholar]
  9. Wang, Y.; Liu, H.; Zhang, Q.; Zhang, L. Thermal performance analysis of a deep coaxial borehole heat exchanger with a horizontal well based on a novel semi-analytical model. Renew. Energy 2025, 239, 122073. [Google Scholar] [CrossRef]
  10. Li, M.; Shi, Y.; Chen, H.; Liu, C.; Li, H. Study on the heat transfer performance of coaxial casing heat exchanger for medium and deep geothermal energy in cold regions. Renew. Energy 2024, 237, 121666. [Google Scholar] [CrossRef]
  11. Akram, M.W.; Chen, Q.; Nortz, G.; Nortz, P. Experimental investigation and numerical modeling of an innovative horizontal coaxial ground heat exchanger (HCGHE) for geothermal heat pump applications. Appl. Therm. Eng. 2024, 257, 124492. [Google Scholar] [CrossRef]
  12. Guo, Z.; Dai, Y.; Zhang, J.; Gui, X.; He, Y. Improved modeling analysis on heat transfer performance of deep coaxial borehole heat exchanger with different operation modes. Energy Rep. 2024, 11, 355–368. [Google Scholar] [CrossRef]
  13. Liu, Q.; Zhang, Y.; Luo, J.; Zheng, J.; Cheng, Y. Numerical study on heat transfer and flow characteristics of coaxial geothermal heat exchangers with helical finned inner tubes. J. Build. Eng. 2023, 65, 105752. [Google Scholar] [CrossRef]
  14. Zhao, J.; Tu, F.; Dai, C.; Li, X.; Zhu, Q.; Yuan, W. The experimental simulation on downhole coaxial heat exchanger in convective heat storage. Acta Energiae Solaris Sin. 2002, 6, 696–698. [Google Scholar]
  15. Gordon, D.; Bolisetti, T.; Ting, D.S.-K.; Reitsma, S. Experimental and analytical investigation on pipe sizes for a coaxial borehole heat exchanger. Renew. Energy 2018, 115, 946–953. [Google Scholar] [CrossRef]
  16. Li, P.; Zhao, G.; He, Z.; Jia, Y.; Liang, Z. Production capacity of enhanced coaxial borehole heat exchangers in horizontal wells through forced seepage. Appl. Therm. Eng. 2025, 270, 126248. [Google Scholar] [CrossRef]
  17. Wang, M.; Wang, J. Enhanced heat extraction for coaxial medium-deep borehole heat exchangers by adding triangular fins on the outer tube wall. Renew. Energy 2025, 242, 122448. [Google Scholar] [CrossRef]
  18. Zhao, G.; Wang, L.; Liang, Z.; Liu, Q.; Jiang, F. Thermal response analysis of a medium-deep coaxial borehole heat exchanger by circulating CO2. Geothermics 2023, 112, 102746. [Google Scholar] [CrossRef]
  19. Zanchini, E.; Lazzari, S.; Priarone, A. Improving the thermal performance of coaxial borehole heat exchangers. Energy 2010, 35, 657–666. [Google Scholar] [CrossRef]
  20. Wang, G.; Zhou, F.; Jia, H.; Wang, L.; Klitzsch, N.; Feng, G.; Yan, C.; Ma, H.; Liu, S.; Yin, Q.; et al. Heat extraction performance of multi-level, multi-branch, closed loop coaxial horizontal borehole heat exchanger geothermal system. Appl. Therm. Eng. 2025, 269, 126045. [Google Scholar] [CrossRef]
  21. Niu, Q.; Ma, K.; Wang, W.; Pan, J.; Wang, Q.; Du, Z.; Wang, Z.; Yuan, W.; Zheng, Y.; Shangguan, S.; et al. Multifactor analysis of heat extraction performance of coaxial heat exchanger applied to hot dry rock resources exploration: A case study in matouying uplift, Tangshan, China. Energy 2023, 282, 128277. [Google Scholar] [CrossRef]
  22. Pokhrel, S.; Sasmito, A.P.; Sainoki, A.; Tosha, T.; Tanaka, T.; Nagai, C.; Ghoreishi-Madiseh, S.A. Field-scale experimental and numerical analysis of a downhole coaxial heat exchanger for geothermal energy production. Renew. Energy 2022, 182, 521–535. [Google Scholar] [CrossRef]
  23. Liu, R.; Zhang, W.; Han, S.; Du, H.; Cui, P.; Ma, Z.; Feng, X.; Zhang, W. A numerical heat transfer model and performance evaluation of coaxial geothermal heat exchanger under soil freezing conditions. Appl. Therm. Eng. 2025, 266, 125538. [Google Scholar] [CrossRef]
  24. Gascuel, V.; Raymond, J.; Rivard, C.; Marcil, J.-S.; Comeau, F.-A. Design and optimization of deep coaxial borehole heat exchangers for cold sedimentary basins. Geothermics 2022, 105, 102504. [Google Scholar] [CrossRef]
  25. Ma, Y.; Yang, F.; Zhu, R.; Zhou, X.; Liu, G.; Yuan, L.; Wang, X.; Dong, J.; Lü, H.; Li, C.; et al. A numerical study on the sustainability and efficiency of deep coaxial borehole heat exchanger systems in the cold region of northeast China. Renew. Energy 2024, 237, 121562. [Google Scholar] [CrossRef]
  26. Zhao, Z.; Yu, P.; Chen, H.; Luo, Y.; Zhao, D.; Bian, J. Genetic analysis and resource evaluation of the Xining geothermal field in Qinghai Province. Geol. China 2015, 42, 803–810. [Google Scholar]
  27. Chao, J. Study on Risk Assessment of Formation Blockage in Geothermal Water Reinjection in Xining Basin. Ph.D. Thesis, China University of Petroleum, Qingdao, China, 2021. [Google Scholar]
  28. Sun, H.; Wang, G.; Lin, W. Distribution characteristics and enrichment mechanism of TDS geothermal water in Xining Basin. Bull. Geol. Sci. Technol. 2022, 41, 278–287+299. [Google Scholar]
  29. Li, T.; Qiao, Y.; Meng, N.; Li, J.; Zhou, K.; Gao, X. Full life cycle heat extraction and power generation performance comparison of enhanced geothermal system with water and carbon dioxide as heat carrier. Appl. Therm. Eng. 2025, 269, 125997. [Google Scholar] [CrossRef]
  30. Hu, X.; Banks, J.; Wu, L.; Liu, W.V. Numerical modeling of a coaxial borehole heat exchanger to exploit geothermal energy from abandoned petroleum wells in Hinton, Alberta. Renew. Energy 2020, 148, 1110–1123. [Google Scholar] [CrossRef]
  31. Zhang, Y.; Yu, C.; Li, G.; Guo, X.; Wang, G.; Shi, Y.; Peng, C.; Tan, Y. Performance analysis of a downhole coaxial heat exchanger geothermal system with various working fluids. Appl. Therm. Eng. 2019, 163, 114317. [Google Scholar] [CrossRef]
  32. Li, F.; Han, E.; Liang, L.; Wu, J.; Lu, B. Long-term heat transfer performance of underground coaxial heat exchanger for medium-deep geothermal. Coal Geol. Explor. 2023, 49, 194–201. [Google Scholar]
Figure 1. Open-loop systems.
Energies 18 04451 g001
Figure 2. Closed-loop heat exchange systems.
Energies 18 04451 g002
Figure 3. Hourly dry-bulb temperature in Xining City.
Energies 18 04451 g003
Figure 4. Overview of the study area and location of the heat exchanger well.
Energies 18 04451 g004
Figure 5. Lithology of the strata and variation in geothermal temperature with depth.
Energies 18 04451 g005
Figure 6. Physical model of the coaxial heat exchanger well.
Energies 18 04451 g006
Figure 7. Flow and temperature sensors.
Energies 18 04451 g007
Figure 8. Effluent temperature and computation time under different mesh densities.
Energies 18 04451 g008
Figure 9. Schematic diagrams of model mesh division and initial formation temperature.
Energies 18 04451 g009
Figure 10. Measured data for experimental monitoring groups.
Energies 18 04451 g010
Figure 11. Model fitting results.
Energies 18 04451 g011
Figure 12. Effluent temperature and heat exchange power at varying flow rates.
Energies 18 04451 g012
Figure 13. Heat exchanger effectiveness at varying flow rates.
Energies 18 04451 g013
Figure 14. Pipe wall temperature distribution at 1800 h under different inlet flow rates.
Energies 18 04451 g014
Figure 15. Effluent temperature and heat exchange power at varying inlet temperatures.
Energies 18 04451 g015
Figure 16. Heat exchanger effectiveness at varying inlet temperatures.
Energies 18 04451 g016
Figure 17. Pipe wall temperature distribution at 1800 h under different inlet water temperatures.
Energies 18 04451 g017
Figure 18. Effluent temperature and heat exchange power at varying central pipe thermal conductivities: (a) effluent temperature at varying central pipe thermal conductivities; (b) heat exchange power at varying central pipe thermal conductivities.
Energies 18 04451 g018
Figure 19. Heat exchange effectiveness at varying central pipe thermal conductivities.
Energies 18 04451 g019
Figure 20. Pipe wall temperature distribution at 1800 h under varying central pipe thermal conductivities.
Energies 18 04451 g020
Figure 21. Simulated effluent temperature variation at the wellhead.
Energies 18 04451 g021
Figure 22. Geothermal contour map at different stages of model operation.
Energies 18 04451 g022
Figure 23. The temperature decay diagram at different depths after 1800 h of heat exchange.
Energies 18 04451 g023
Figure 24. The temperature decay diagram at a depth of 1800 m under different heat exchange times.
Energies 18 04451 g024
Table 1. Lithological classification of strata in the study area.
NO.Stratigraphic LithologyThickness/(m)Thermal Conductivity (W/(m·K))
1Loess layer16.800.8
2Cobble layer15.502.2
3Interbedded coarse- and medium-grained sandstone158.852.8
4Interbedded siltstone, fine-grained sandstone, and mudstone75.002.2
5Interbedded coarse- and medium-grained sandstone147.252.6
6Interbedded coarse-, medium-, and fine-grained sandstone225.052.8
7Interbedded conglomerate and sandy conglomerate115.753.0
8Granodiorite layer1258.803.3
Table 2. Summary of model parameters.
ParametersValuesParametersValues
Well Depth (m)2013.00Outer Pipe Wall Thickness (mm)9.20
Hole Diameter (mm)241.30Inner Pipe Wall Thickness (mm)10.00
Inner Diameter of Inner Pipe
(mm)
90.00Cement Grout Thermal Conductivity (W/(m·K))2.0
Outer Diameter of Inner Pipe
(mm)
110.00Outer Pipe Thermal Conductivity (W/(m·K))48.00
Inner Diameter of Outer Pipe
(mm)
159.40Inner Pipe Thermal Conductivity (W/(m·K))0.25
Outer Diameter of Outer Pipe
(mm)
177.80
Disclaimer/Publisher’s Note: The statements, opinions and data contained in all publications are solely those of the individual author(s) and contributor(s) and not of MDPI and/or the editor(s). MDPI and/or the editor(s) disclaim responsibility for any injury to people or property resulting from any ideas, methods, instructions or products referred to in the content.