Article

Powering the Woods Hole X-Spar Buoy with Ocean Wave Energy—A Control Co-Design Feasibility Study

1
Sandia National Laboratories, Albuquerque, NM 87185, USA
2
Woods Hole Oceanographic Institution, Woods Hole, MA 02543, USA
3
Johns Department of Environmental Health and Engineering, Hopkins University, Baltimore, MD 21218, USA
*
Author to whom correspondence should be addressed.
Energies 2025, 18(16), 4442; https://doi.org/10.3390/en18164442
Submission received: 7 July 2025 / Revised: 1 August 2025 / Accepted: 7 August 2025 / Published: 21 August 2025
(This article belongs to the Section A3: Wind, Wave and Tidal Energy)

Abstract

Despite its success in measuring air–sea exchange, the Woods Hole Oceanographic Institution’s (WHOI) X-Spar Buoy faces operational limitations due to energy constraints, motivating the integration of an energy harvesting apparatus to improve its deployment duration and capabilities. This work explores the feasibility of an augmented, self-powered system in two parts. Part 1 presents the collaborative design between X-Spar developers and wave energy researchers translating user needs into specific functional requirements. Based on requirements like desired power levels, deployability, survivability, and minimal interference with environmental data collection, unsuitable concepts are pre-eliminated from further feasibility study consideration. In part 2, we focus on one of the promising concepts: an internal rigid body wave energy converter. We apply control co-design methods to consider commercial of the shelf hardware components in the dynamic models and investigate the concept’s power conversion capabilities using linear 2-port wave-to-wire models with concurrently optimized control algorithms that are distinct for every considered hardware configuration. During this feasibility study we utilize two different control algorithms, the numerically optimal (but acausal) benchmark and the optimized damping feedback. We assess the sensitivity of average power to variations in drive-train friction, a parameter with high uncertainty, and analyze stroke limitations to ensure operational constraints are met. Our results indicate that a well-designed power take-off (PTO) system could significantly extend the WEC-Spar’s mission by providing additional electrical power without compromising data quality.

1. Introduction

To improve our understanding of the Earth’s changing climate, we need to improve data collection at sea [1]. Fluxes of heat, moisture, and momentum between the ocean and atmosphere constitute a significant fraction of the global energy balance [2]. Most observations of surface flows are primarily conducted on terrestrial regions, while satellite measurements provide global assessment of the energy balance at the top of the atmosphere [2]. In recent decades, there have been efforts to improve data collection at the air–water boundary of the oceans in remote and inhabitable regions. These efforts aim to fill a gap in the spatially sparse knowledge of the air–sea exchange, which is essential for understanding the Earth’s energy balance and consequently understanding climate change. Graber et al. developed the ASIS buoy to enable high-resolution measurements of waves and atmospheric fluxes in the open ocean [3]. Previous to the buoy development, oceanic surface, oceanic surface meteorology, and air–sea flux estimates have been based on observations from merchant ships and surface buoys [4], i.e., either spatially limited to near-shore, or temporarily limited. Motivated by ASIS, and to improve upon its performance in highly energetic sea states, Clayson et al. conceptualized a free-drifting spar buoy system capable of directly measuring air–sea turbulent fluxes and bulk parameters in remote, inhospitable regions [5]. This novel spar is relatively low-cost and telemeters all data ashore, thus the system may be considered eXpendable, giving it its name “X-Spar” [6].
The X-Spar has a design life of six months to one year, depending on the specific sensor and battery package of each deployment. If more electrical power were available, the sensor package(s) and mission duration of the X-Spar could be dramatically enhanced to provide additional scientific data over longer mission durations. Longer mission durations would enable understanding seasonal changes in air–sea exchange. Given the limited payload capacity, simply adding more batteries is not a feasible solution due to weight and space constraints. Instead, harnessing energy from the operating environment may be a more effective approach.
It is helpful for the reader to think about this work in two parts. The structure of the study is visualized in Figure 1 to illustrate how Part 1 serves as foundation for Part 2, as well as the energy harvesting concepts that warrant future research. Part 1 details the collaborative design between the X-Spar developers and wave energy researchers, which resulted in functional design requirements for an energy converter and pre-eliminated concepts violating those requirements for further consideration during the more detailed design. The bulk of this work, part 2, investigates the feasibility of augmenting the X-Spar with an internal wave energy converter (WEC) to provide the additional electrical power. We will call this hypothetical augmented system the “WEC-Spar”. While this is not a fully-detailed design study, it does consider realistic hardware components and their dynamics in wave-to-wire models and the control co-optimization methods.
The functional requirements are detailed in the Section 2 (“Collaborative Design”). Section 3.1 (“Dynamic Model”) presents linear wave-to-wire models. We introduced a numerically optimal controller and a proportional controller optimized for maximizing average electrical power in Section 3.3 (“Control”). In Section 4 (“Results”), we describe the different power take-off (PTO) configurations based on realistic hardware to create a well-matched WEC-PTO system. Within Section 5 (“Conclusions”), we conclude that the average electrical power levels predicted from the numeric models would improve the X-Spars mission as intended, but drive-train friction uncertainty and nonlinear control approach should be investigated in the future.

2. Collaborative Design

For accurate air–sea flux estimates, either via bulk formula or direct covariance, it is important that the wind measurements are of the highest possible quality. Three primary factors can degrade the observations. First of these is flow distortion caused by the platform carrying the sensor, an extreme example being a ship. This can be mitigated by streamlining and minimizing the platform cross section. Second is the influence of surface waves on airflow [7,8]—which can be addressed by positioning the sensor at a higher elevation. Third is the motion of the 3-axis sonic anemometer itself—while motion can be quantified and corrected for in data post-processing, minimizing the sensor’s motion reduces noise and thus increases accuracy. A spar platform effectively addresses these challenges: it can be designed with small cross section to minimize flow distortion, allows for high freeboard to sample above zone directly influenced by surface wave effects, and can be engineered for pitch stability through a large metacentric height and heave stability by incorporating features such as a perforated plate at its base to increase drag and added mass.
So, in an ideal scenario, oceanographers would benefit from a perfectly still platform for their measurements, while wave energy converter engineers would prefer a system that naturally responds to the dynamics of ocean waves.
However, the X-Spar’s stable design also presents a unique opportunity; it provides a robust platform that is relatively insensitive to waves to react against. In theory, provided that the fundamental hydrostatic properties remain unchanged, modifying the center section should not compromise data quality while not actively converting wave energy. In practice, capturing wave energy inevitably requires reactive forces against the X-Spar resulting in larger than usual motion. These conflicting objectives create a complex design problem that requires close collaboration between all stakeholders to establish suitable requirements for the energy harvesting apparatus.
Participatory design offers practices aimed at involving people in the co-design of the technologies they use [9]. Given the significant engagement of all involved stakeholders, we will refer to our approach as collaborative design. We intentionally refrain from using the term “co-design” in all other sections to prevent any confusion with control co-design, which refers to the concurrent design of hardware and control algorithms.
Developing WECs to supply power to ocean observing platforms has gained attention in recent years [10,11,12]. Several researchers have reviewed existing technologies, possibilities, and studies related to wave-powered ocean measurement [13,14,15]. Lindroth and Leijon (2011) note that a challenge for wave-powered data buoys, which were mostly designed as oscillating water column- (OWC-) type WECs, included low power generation [14]. McLeod and Ringwood (2022) summarize the applications since 2011, of which there are eight distinct power take-off (PTO) types presented across 24 publications [13]. Since 2022, numerous others have presented concepts that explore WECs for ocean observation (OO) applications. Commonly, electromagnetic energy transducers (i.e., generators) offer higher power densities compared to PTO’s without them (mW to W based on recent empirical data). While most generators are rotary machines, two recent successful prototypes deploy linear generators, first in the form of a fully contained heave oscillator [16], and second a linear generator reacting against two hydrodynamic bodies’ relative motion [17]. A class with a lot of traction is fully contained pendulums, for example, a prototype with stable vertical pendulum [18], a 20 kg horizontal pendulum studied numerically [19], and a prototype of a smaller horizontal pendulum [20]. A novel pitch resonator design [21] is currently undergoing design iterations towards an inverted pendulum to also potentially enhance an existing ocean observation system.
Ocean glider technologies are another example of ocean scientists using the ocean environment to sustain ocean observation [22]. As opposed to electrically powered ocean measurement technologies described previously, gliders use either changes in their own buoyancy [23] or mechanical power from ocean waves [24] for direct propulsion with no conversion to electrical energy. These gliders still require and are limited by the batteries that power onboard sensors.
The majority of the existing literature on WECs for ocean observation rely on custom components. Due to the expandable nature of the X-Spar we conceptualize a WEC with mostly commercial off-the-shelf (COTS) components in this manuscript. COTS components will keep the overall system cost low.

2.1. Functional Requirements

In this section, we present the functional requirements for an energy converter that meets the needs of the X-Spar buoy and its users. To achieve this, we employed quality function deployment (QFD), a structured methodology that translates user needs into technical specifications [25]. The project partners at WHOI, also functioning as main stakeholders, played a crucial role in this process by directly quantifying the importance of each functional requirement relative to each other. By systematically investigating and prioritizing these requirements, we aim to establish a robust framework that supports the development of an energy converter capable of harnessing energy during deployment effectively, while not jeopardizing the X-Spar’s (i.e., WEC-Spar’s) mission. This approach is fundamentally different from designing a wave energy converter for maximizing exportable power. We present the ranked functional design requirements in Table 1.
The most important design requirements are: (1) producing an average electrical power in the order of tens of Watts; (2) not complicating deployment and recovery operations; (3) enabling X-Spar to follow waves in extreme sea environments (improving survivability); and (4) not negatively impacting data quality (by compromising the X-Spar’s motion response).

2.2. Pre-Elimination of Concepts

These requirements eliminates solar photovoltaics (location, season, and infrastructure), wind turbines (infrastructure and pitch characteristics), piezo-electric energy transducers (power levels for given infrastructure), and most external wave energy converters (complicating deployment because of the added infrastructure preventing horizontal placement on a work boat) as energy sources. However, there are a variety of ocean WECs that could meet those requirements.

2.3. WEC Concepts to Augment the X-Spar

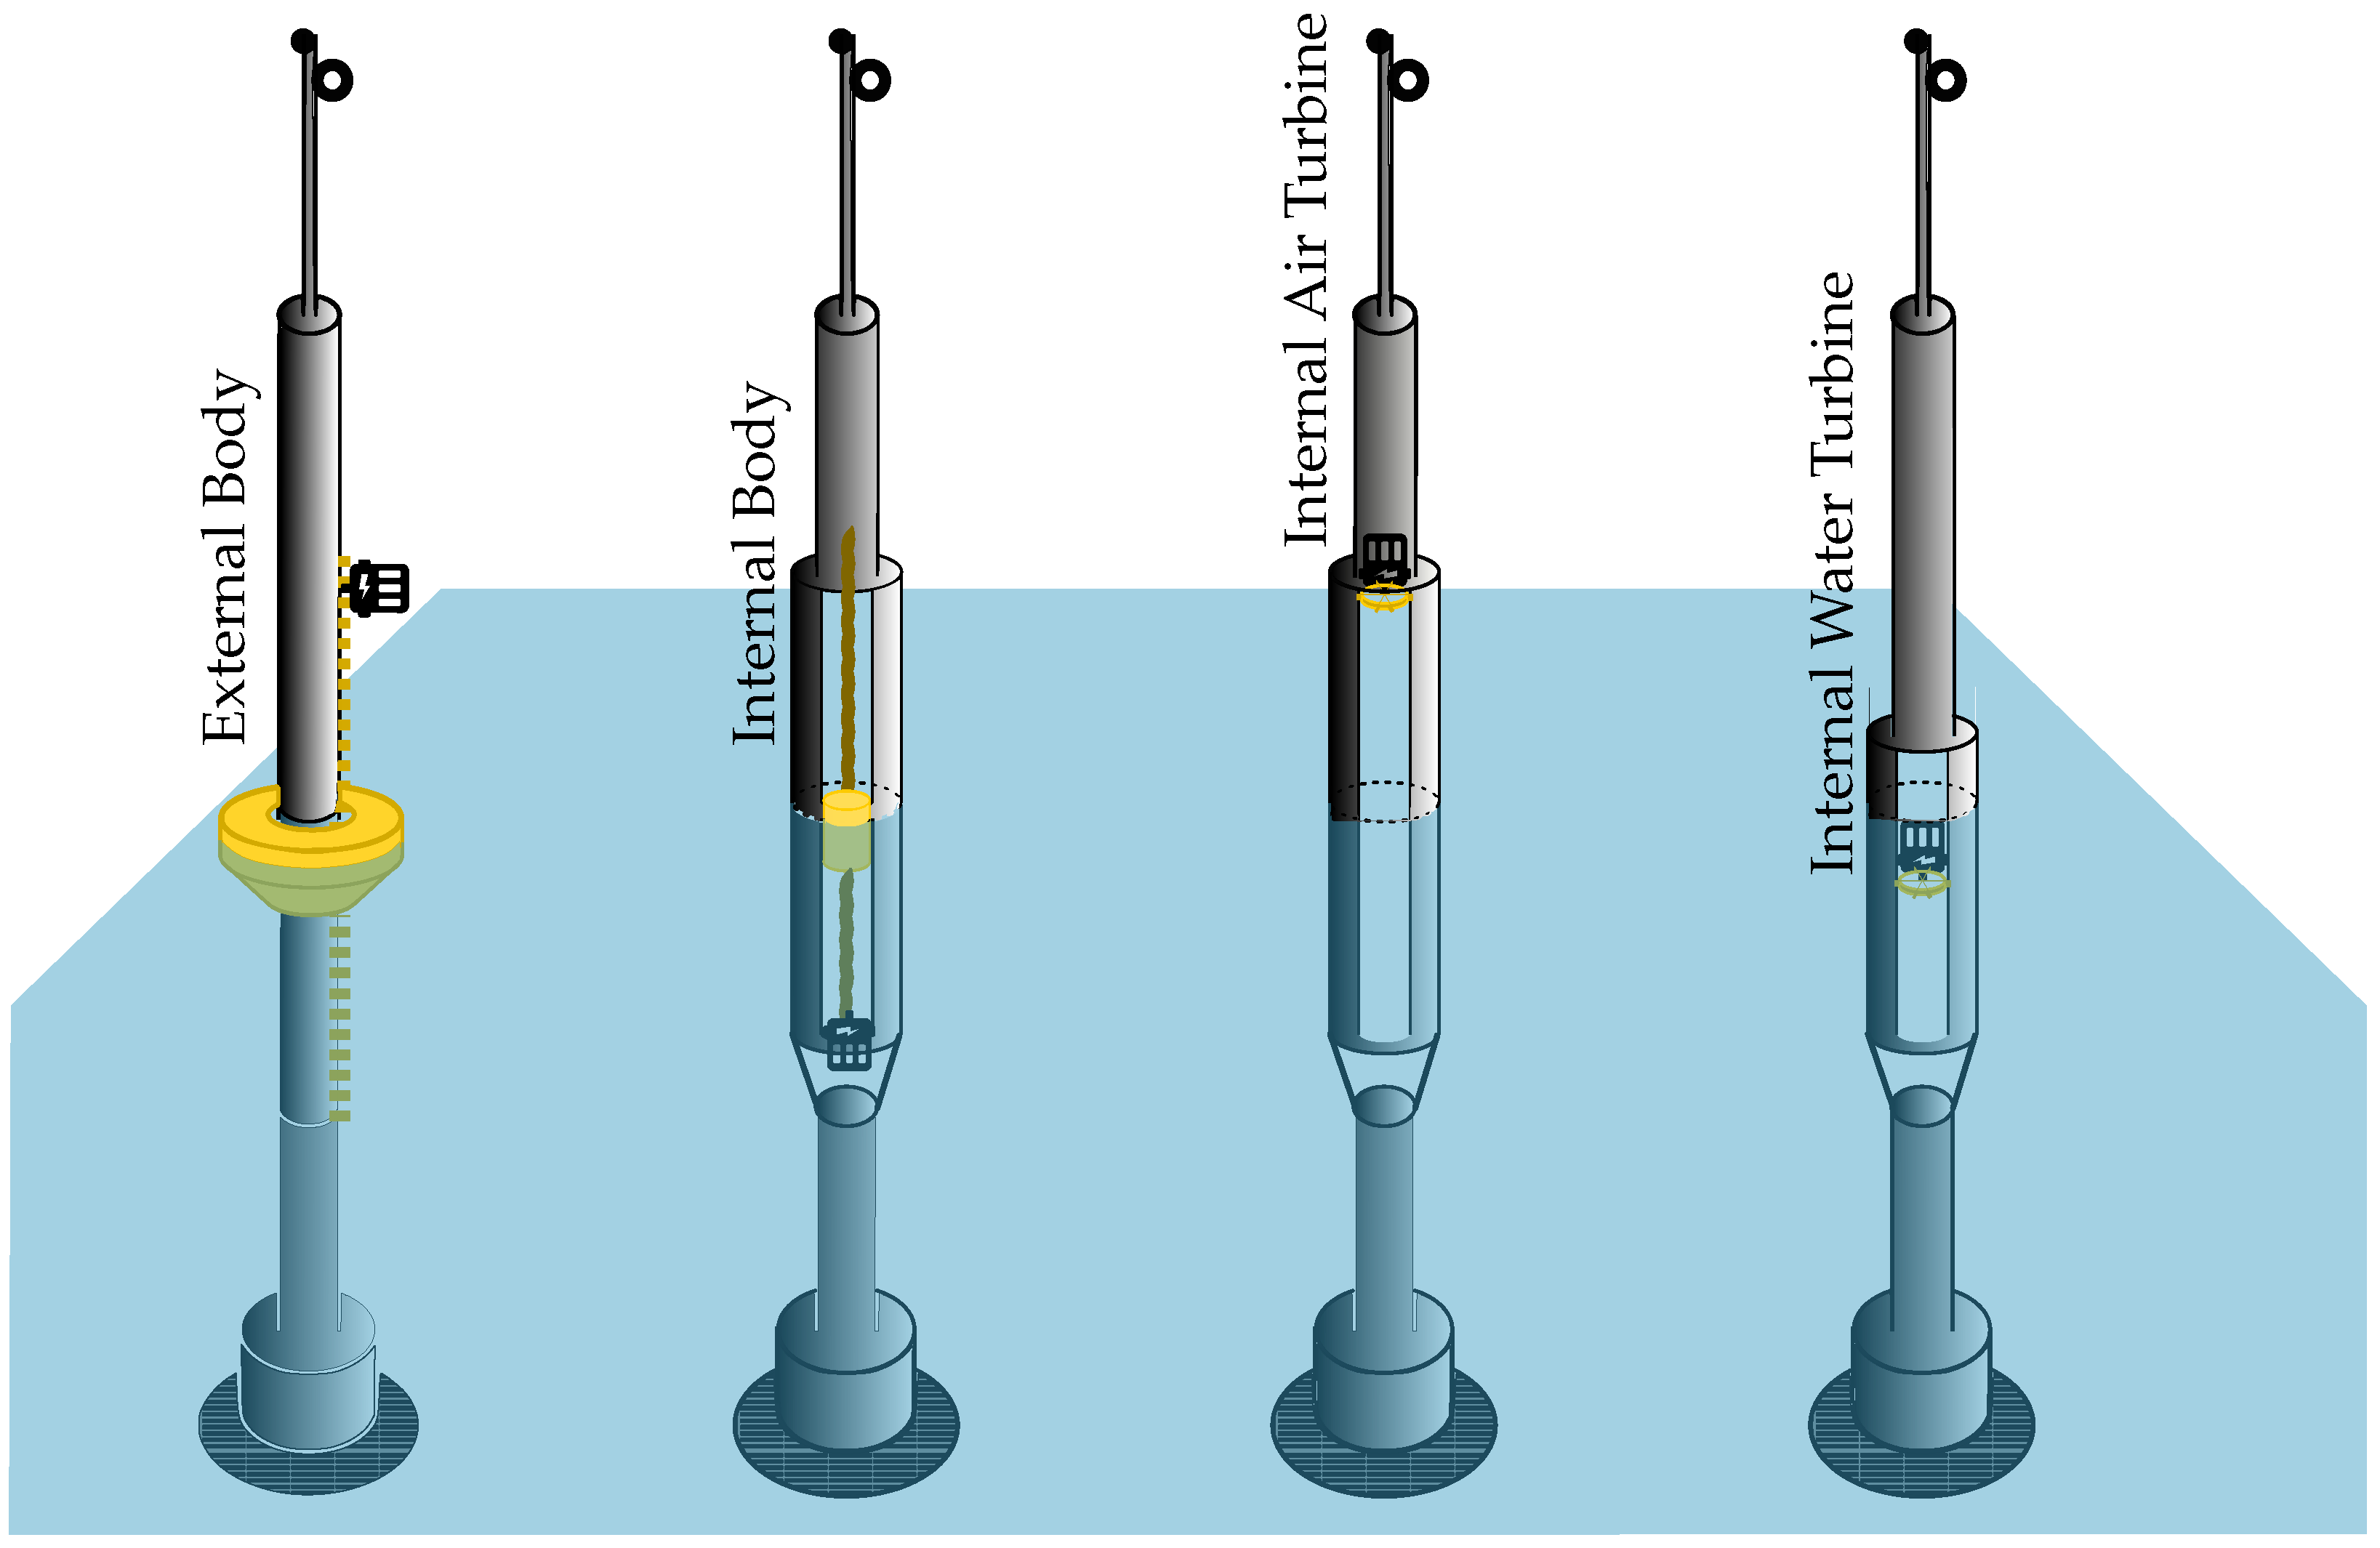
Potential WEC concepts are illustrated in Figure 2.
Promising concepts fell into two categories of implementing rigid oscillating bodies and fluid turbines: air and water. We then explore engineering concerns that could be examined without the need for complex simulations, as detailed in Table 2.
We do not prioritize investigations of requirements (6) cost, and (7) reliable energy production at this stage. To assess each concept’s viability based on the criteria in Table 1, we estimate the following metrics: (5) survivability, and (2) deployability using literature and expert knowledge; requirements (1) power-conversion, (4) data-quality, and (3) wave-following require more detailed numerical modeling. We do not include maintainability as a requirement at this feasibility study stage, as it contributes to operational expenditure (which is necessary to consider for the performance of dedicated WECs [26]). Given the short X-Spar mission duration of approximately one year, maintenance on the WEC and fatigue load analysis would only be performed on land after the buoy is recovered. The integration of the WEC into the existing DC bus is not discussed in detail, since the power electronics design does not alter the WEC system dynamics. Nonetheless, compatibility with existing infrastructure and load management will need to be considered during the detailed design.

2.4. Design Feasibility Study

For the rest of this manuscript, we focus exclusively on the X-Spar augmented with the internal body. We opt for the internal rigid body over the external body due to its ease of deployment (while the detailed design is not part of this study, materials such as marine grade polymers, or even cork, might be suitable). While internal turbines present promising concepts, their distinct modeling techniques necessitate further investigation in future studies ([27] investigates air turbines in spar tubes of similar dimensions).
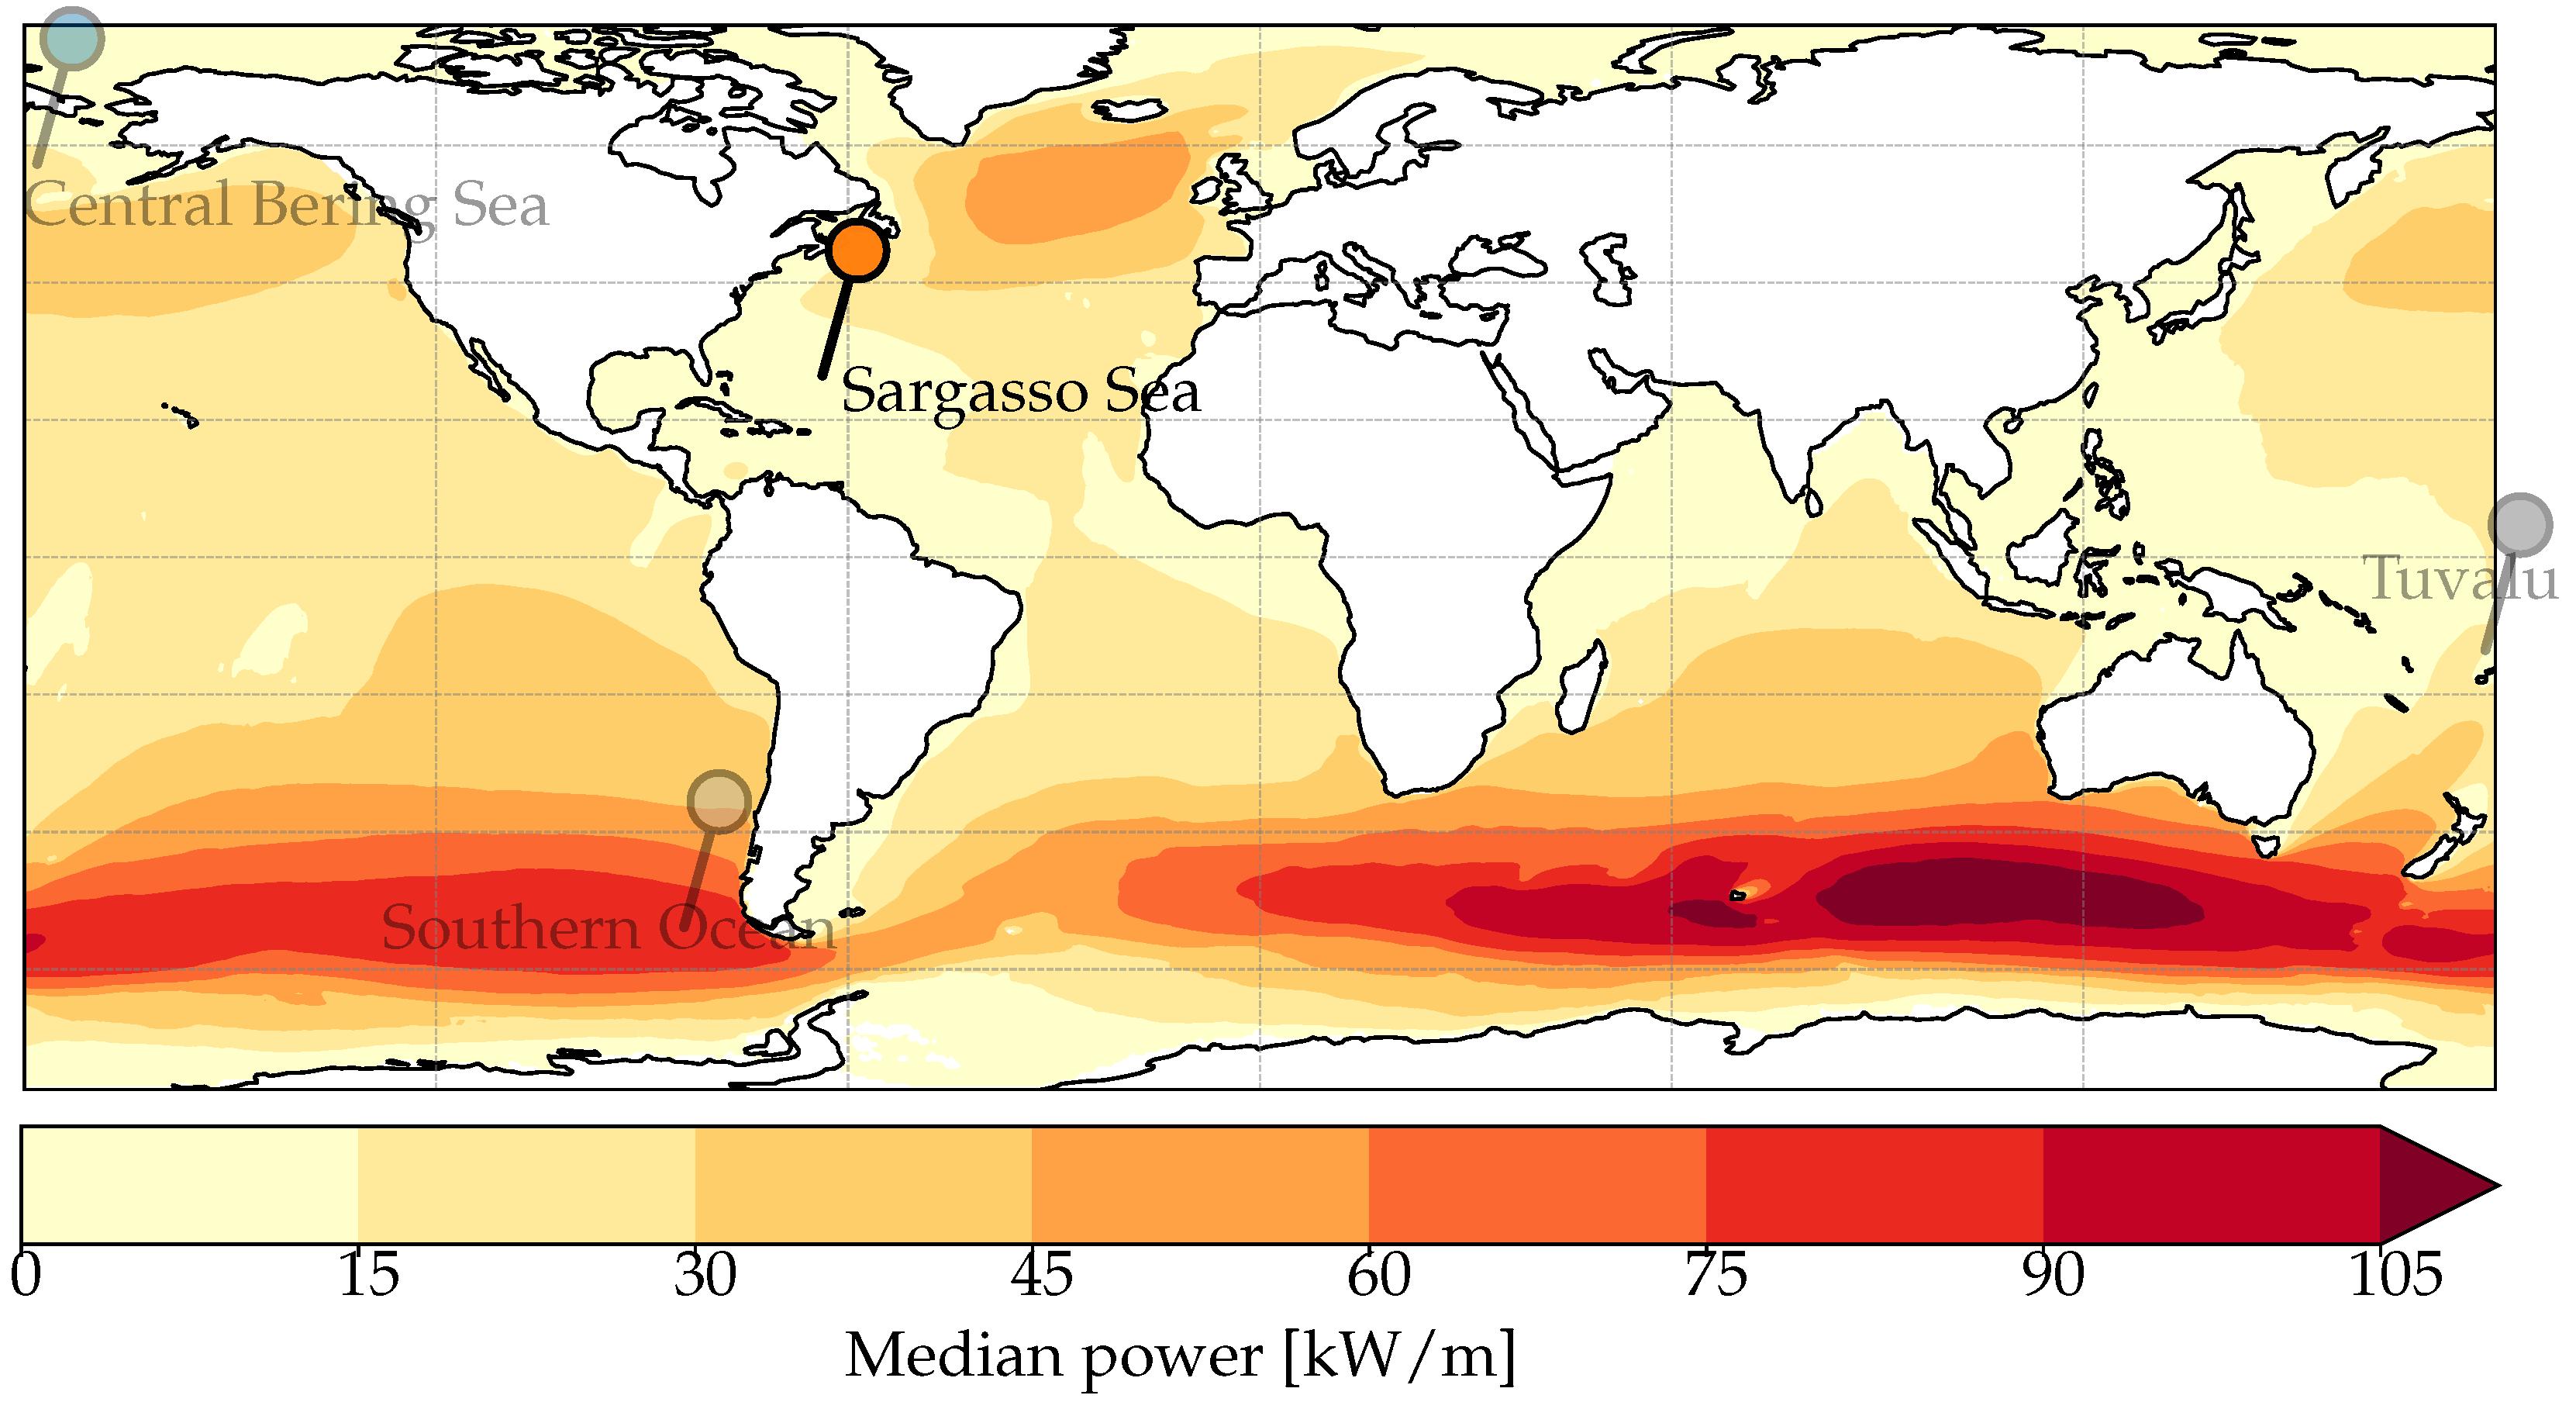
The X-Spar buoys are intended to be deployed in locations all around the world, with specific locations of interest including the Sargasso Sea (which is south of Bermuda), the Southern Ocean, the Western Equatorial Pacific–Tuvalu, and the Bering Sea (see Figure 3).
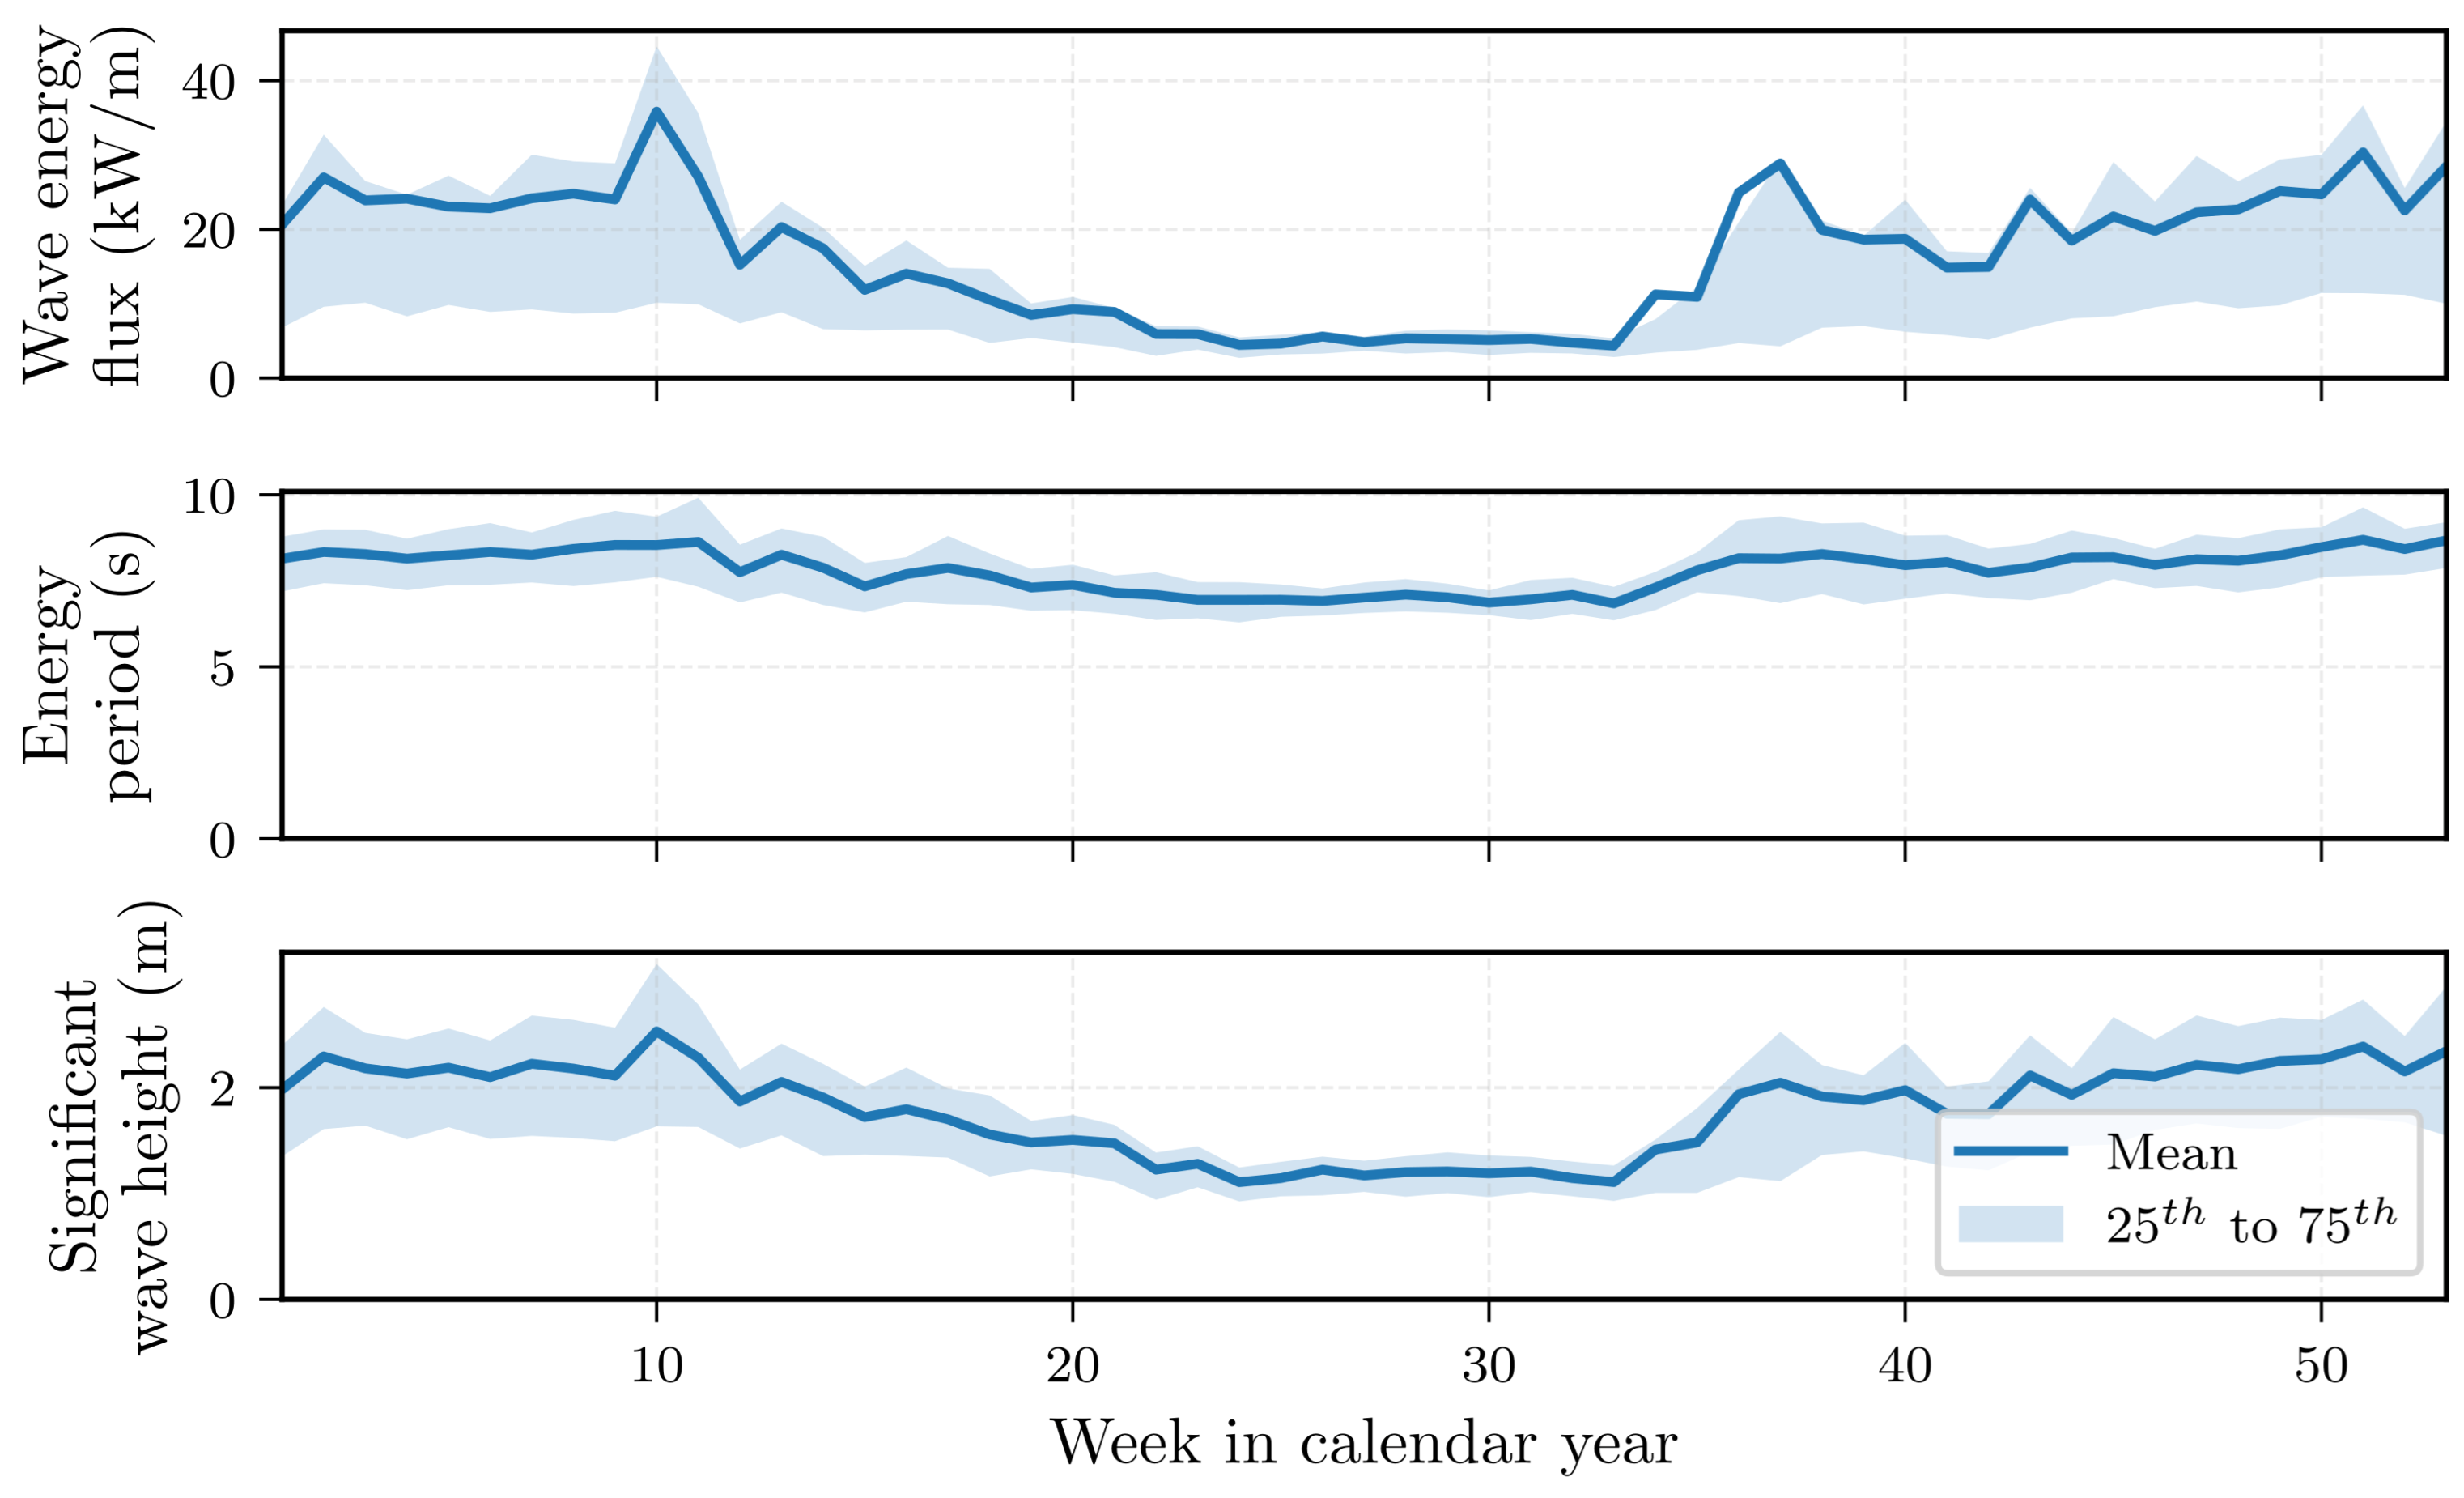
This study presents results specifically optimized for the Sargasso Sea as it is the location with the lowest wave resource, making it the most challenging site for converting the desired amount of electrical power. The underlying averaged weekly sea states derived from 14 years (2009–2023) of spectral wave density data collected from the National Data Buoy Center (NDBC) buoy #41049 are illustrated in Figure 4, along with a confidence interval that indicates the range within which a respective quantity is expected to fall with 50% likelihood.
Some findings are not tied to the Bermuda conditions, although are generally applicable as they relate to sea states (as a function of wave energy period T e and significant wave height H s ).    

3. Internal Body WEC Control Co-Design

For meaningful control co-design, it is essential to model all relevant and interacting dynamics. In the following sections, we introduce the full coupled power conversion chain from ocean waves to electrical power at the load.

3.1. Dynamic Model

3.1.1. Hydrodynamic Model

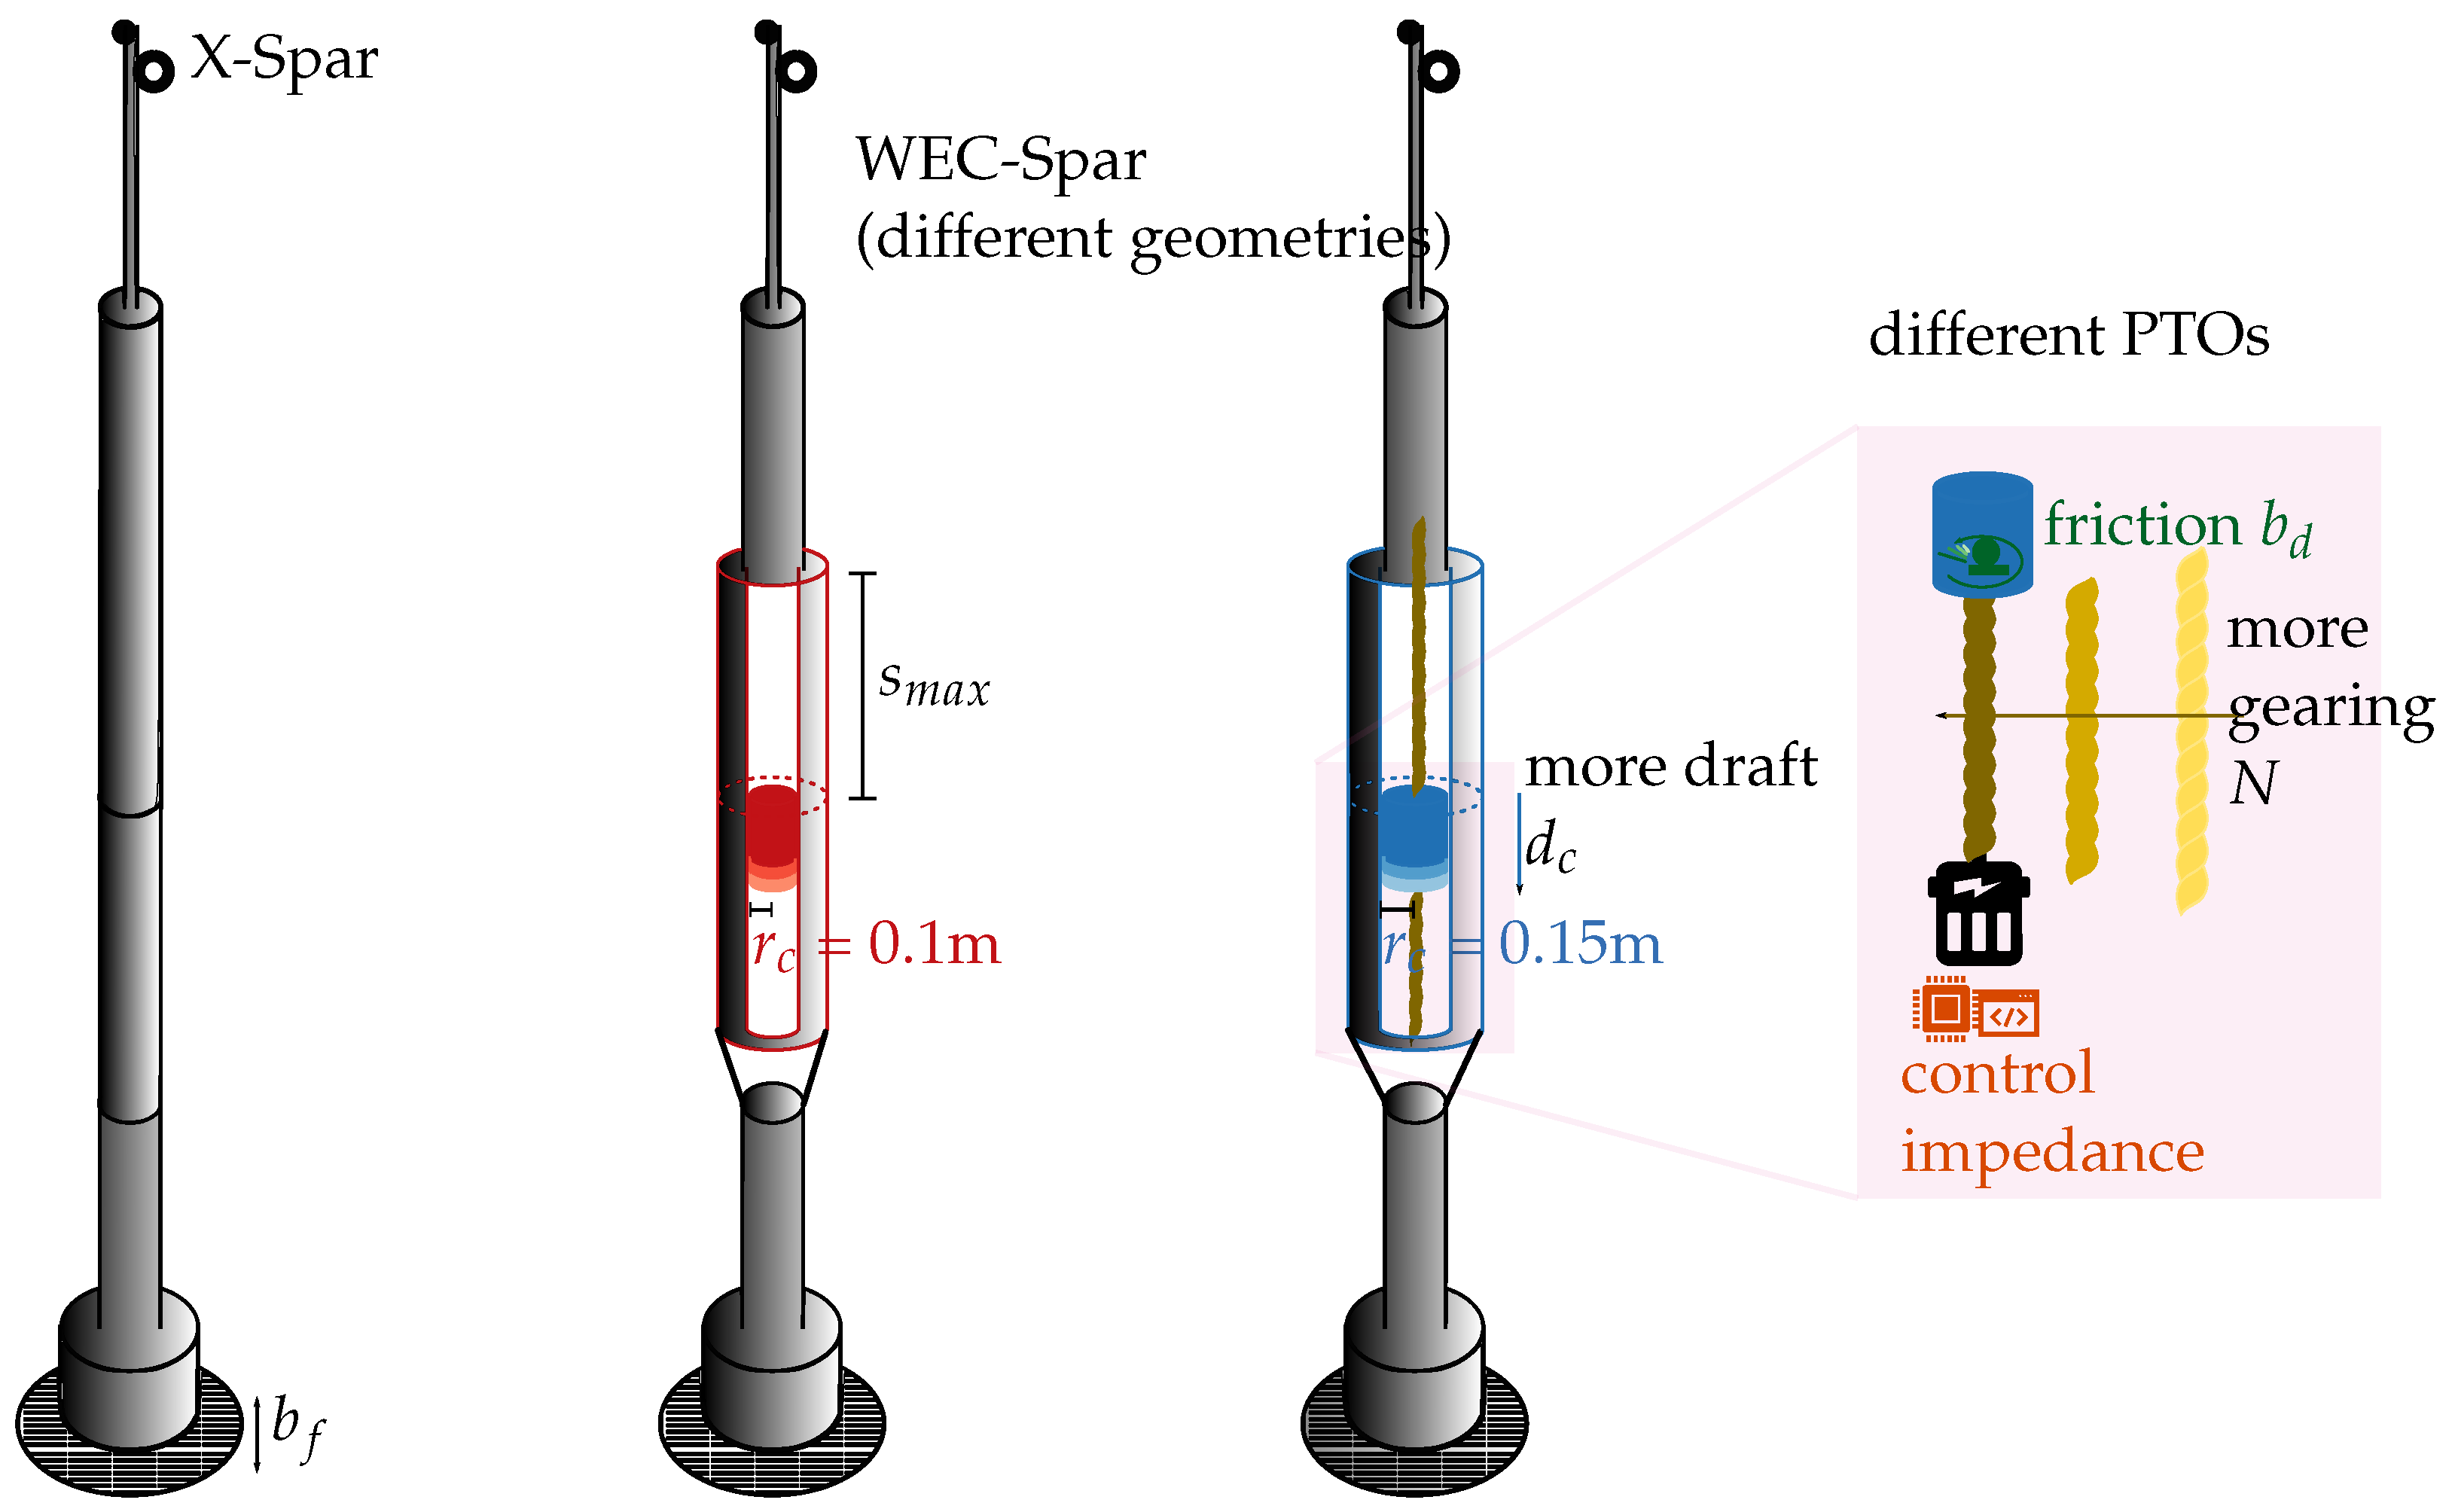
This study models hydrodynamics by combining empirical and numerical data (obtained with the boundary element method (BEM)). Please note that both the empirical and BEM models are linear and, therefore, cannot accurately represent the system response under extreme sea conditions, which are likely nonlinear. If the design progresses beyond the feasibility study stage, extreme and nonlinear responses will need to be investigated using methods other than those that model linear steady-state responses for average power conversion, for example, modeling nonlinearities via multiple linear models and incorporating a velocity dependent friction term [28]. Specifically, we use system identification (SID) techniques to estimate a coefficient capturing heave damping ( b f ) present in the X-Spar, since the BEM could not capture the viscous drag associated with the perforated plate at the bottom of the X-Spar (compare Figure 5). The X-Spar geometry is then altered and denoted as “WEC-Spar”, to allow for an internal body absorbing waves, to compute two body hydrodynamics with the BEM, and to add the heave damping to account for the unchanged perforated plate.
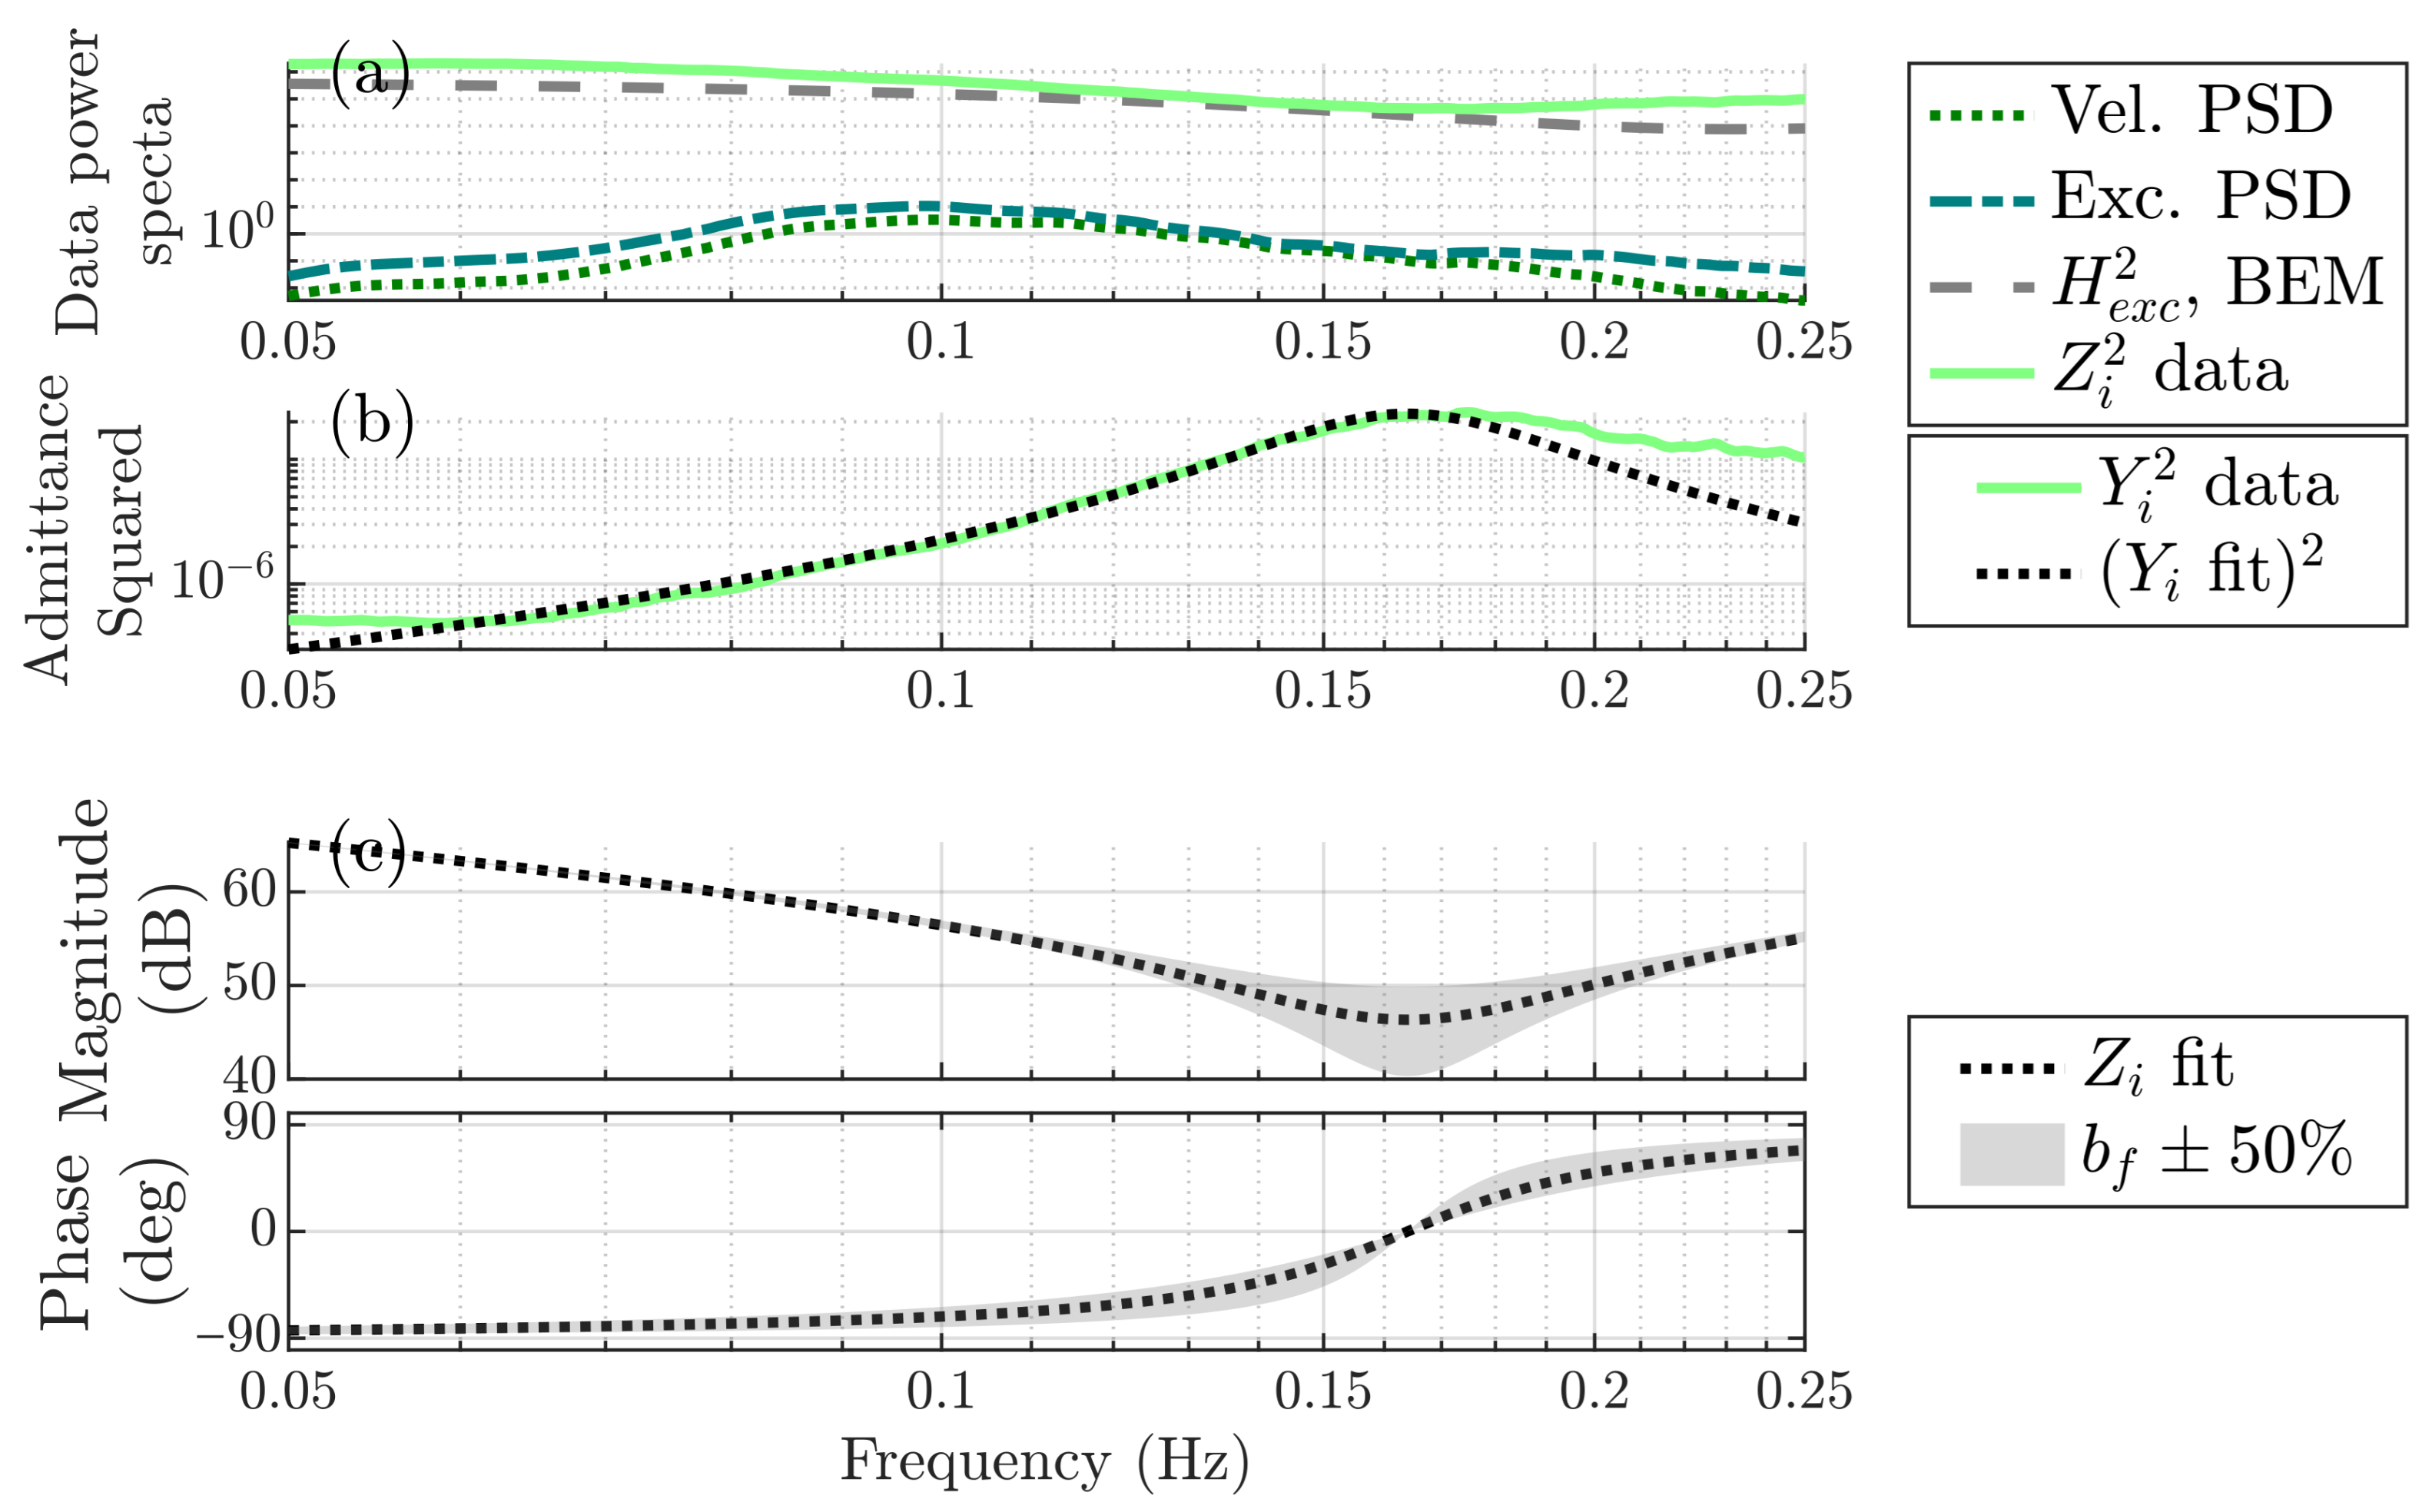
For the system identification, we use data from an onboard inertial measurement unit (IMU) for velocity and position information as well as pressure readings from a sensor mounted partially down the spar tube for the relative water depth from a two-day test deployment of the X-Spar in November 2019 south of Cape Cod. The recorded waves’ peak period ranged from approximately 6 s to 10 s. The X-Spar’s data acquisition system was never intended to provide information for a system identification campaign. Consequently, likely due to issues with the phase shift between distinct sensors, the methods presented by Bacelli et al. [28] could not identify inertia values that we could validate against the known X-Spar’s rigid body mass. Instead, we chose an approach based on identifying the X-Spar dynamics based on purely real power spectral densities (PSDs), i.e., the results become insensitive to the phase. The major underlying assumptions are, first, that the excitation PSD ( S e x c , d a t a ) is equal to the wave height signals PSD, since the X-Spar behaves like a low pass filter. This method is limited to floating structures that are mostly driven by hydrostatics. The second assumption is that the BEM code capytaine can predict the excitation transfer function coefficient ( H e x c , B E M ) sufficiently well. Together with the PSD of the velocity measurements S v , data averaged over the entire deployment length, the following expression can be used for the square of the intrinsic admittance ( Y i ):
Y i , data 2 = S v , data H e x c , B E M 2 S e x c , d a t a .
The third assumption (and limitation of the method) is that the X-Spar dynamics can be described by a second order mass-spring damper system with mass (m), stiffness ( k h ), and damping ( b f ), and consequently, we can state the model to be fitted either in intrinsic admittance ( Y i , fit ), or reciprocally as intrinsic impedance ( Z i , fit ) form,
Y i , fit = 1 Z i , fit = 1 b f + i ( m ω k h / ω ) .
Here, i denotes the imaginary unit and ω the radial frequency vector. All introduced quantities are in the top axes of Figure 6. After algebraic manipulation of (2), we can define an error model (e) between the squared admittance based on data and the manipulated model:
e = Y i , data 2 Z i , fit 2 Z i , fit 4 = Y i , data 2 ( R 2 + I 2 ) with R = b f b f 2 + ( m ω k h / ω ) 2 , and I = m ω k h / ω b f 2 + ( m ω k h / ω ) 2 .
Note that although (2) is complex, the expression (3) is purely real. We solve for the combination of parameters that minimize the weighted squared error, with a weight proportional to the PSD of the velocity signals:
min b f , m , k h ( w v e ) 2 , where w v S v , d a t a .
This results in the following estimated coefficients capturing heave damping ( b f ), mass (m), and hydrostatic stiffness ( k h ).
  • b f = 207.6 N   s / m , which is the SID parameter of interest.
  • m = 593.3 k g , which is is 97.9% of the buoy’s measured dry weight of 606 k g .
  • k h = 629.8 N / m , which under-predicts the analytical stiffness of 729.8 N / m by 13.7%.
Using these identified coefficients, we may plot the squared fitted admittance model ( Y i , f i t ) 2 in axes (b) of Figure 6 along with the underlying data. Based on Figure 6b, we find that the parametric model has good agreement with the data for 0.06 f 0.17 Hz ( 5.9 T 16.7 s), i.e., the constant parameters describe the measured dynamics well over the frequency range, which is most important for ocean wave energy conversion. Beyond that range (for shorter period waves), the goodness of the fit decreases, which could be explained by a frequency dependency of the damping coefficient that we neglect for this work. Figure 6c shows the fitted intrinsic impedance (2) within a shaded area that represents the sensitivity of Z i , fit to altering the identified friction coefficient b f within ± 50 % to qualitatively access magnitude and phase sensitivity. We learn that a potential error in b f does not significantly impact the phase, but the magnitude at the natural frequency is sensitive to b f .
For the rest of this study, we will use the estimated heave damping coefficient b f = 207.6   N   s / m assuming the perforated plate remains unchanged and rely on BEM results to compute the frequency dependent quantities that describe the hydro-dynamics for varying geometries in terms of the intrinsic impedance,
Z i = B ( ω ) + b f + i ω ( m + A ( ω ) ) k h ω .
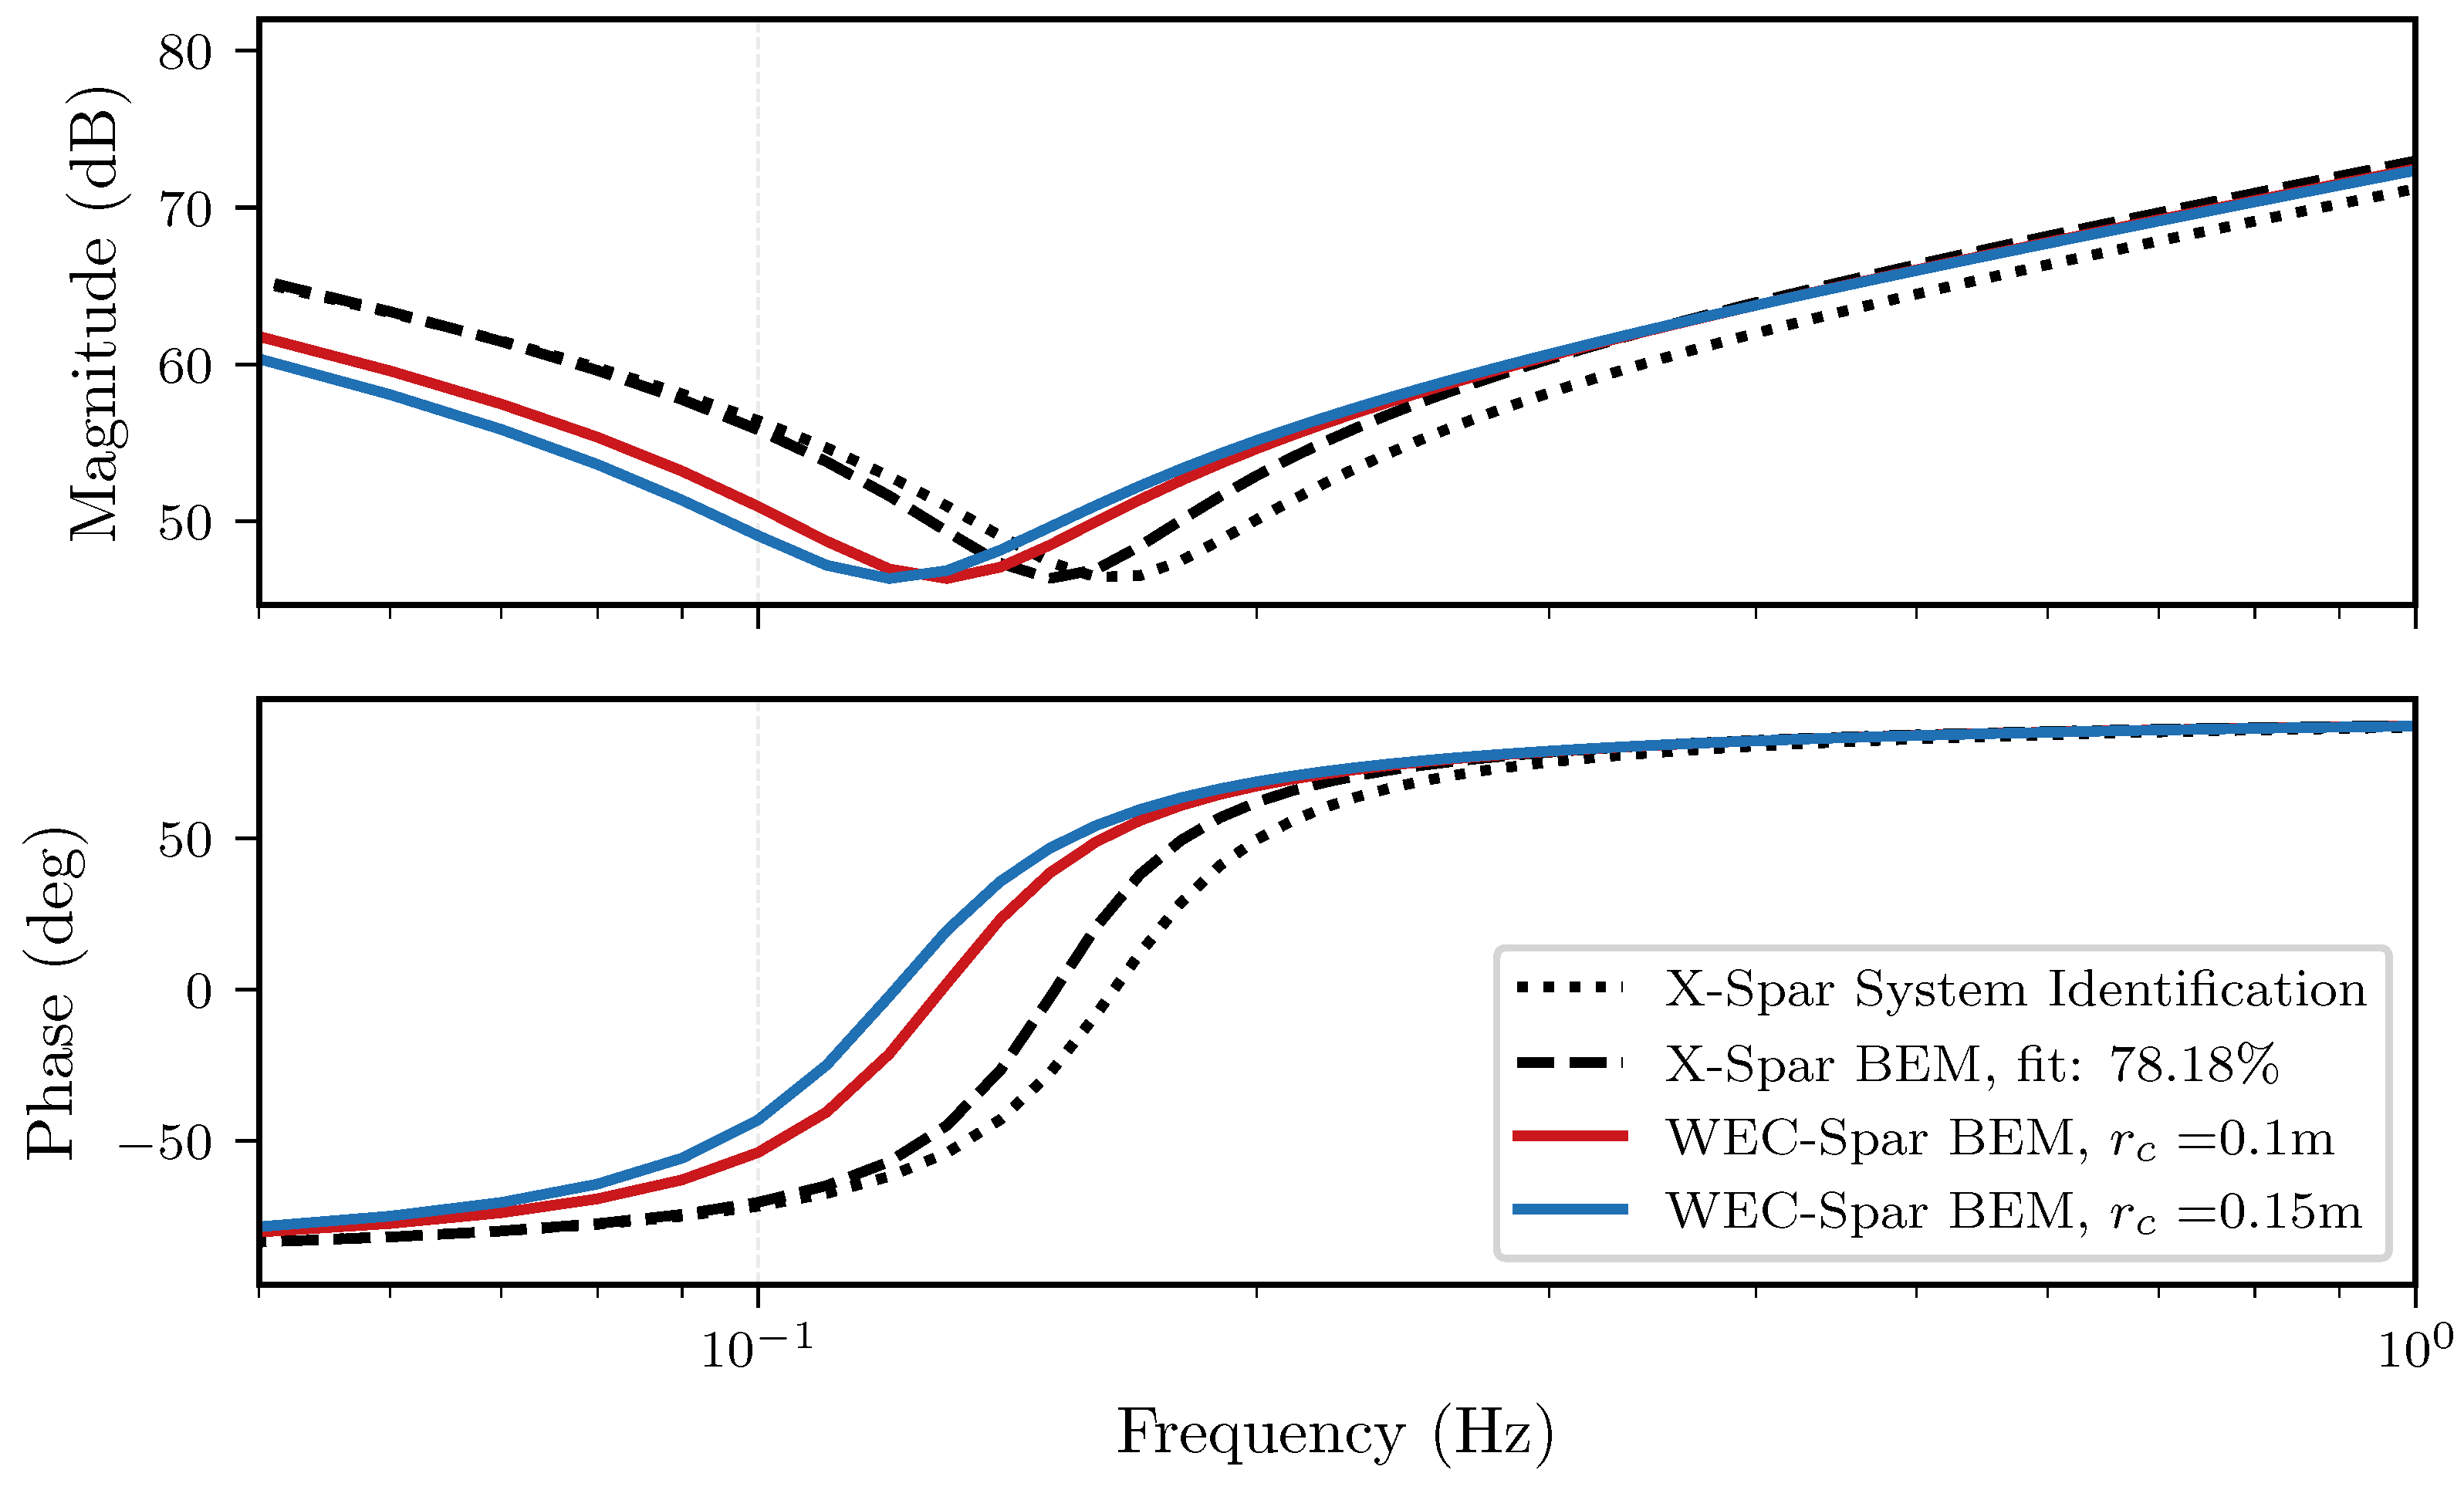
Here, A ( ω ) is the added mass and B ( ω ) is the radiation damping. Aside from the validation of the known parameters, we also compare the X-Spar’s intrinsic impedance obtained from BEM augmented with b f (dashed line) with the identified second order model (dotted line) in Figure 7.
The goodness of fit, quantified at 78.18%, indicates that our BEM model adequately predicts the hydrodynamic behavior, thereby providing a solid basis for proceeding with further analyses. Next, we obtain the hydrodynamic coefficients for the two body system (WEC-Spar and internal rigid cylinder) for two distinct radii of the cylinder ( r c ) and three different values for the cylinder draft ( d c ). The intrinsic impedance of the two distinct WEC-Spar geometries is also plotted in Figure 7. As expected, increasing the diameter reduces the natural frequency, as seen by the decreasing frequency of the phase’s zero crossing. For linear models, two-body dynamics can be reduced to an equivalent single-mode system [29]. We reduce the two body dynamics ( Z i v ) relative to the PTO degree of freedom, which is the relative heave velocity Δ v = K v between WEC-Spar and internal cylinder, with kinematics K = [ 1 , 1 ] . We state the equivalent dynamics as
( K Z i 1 K T ) 1 Z eq Δ v = ( K Z i 1 K T ) 1 Z eq K Z i 1 F exc F eq , exc F pto Z eq Δ v = F eq , exc F pto .
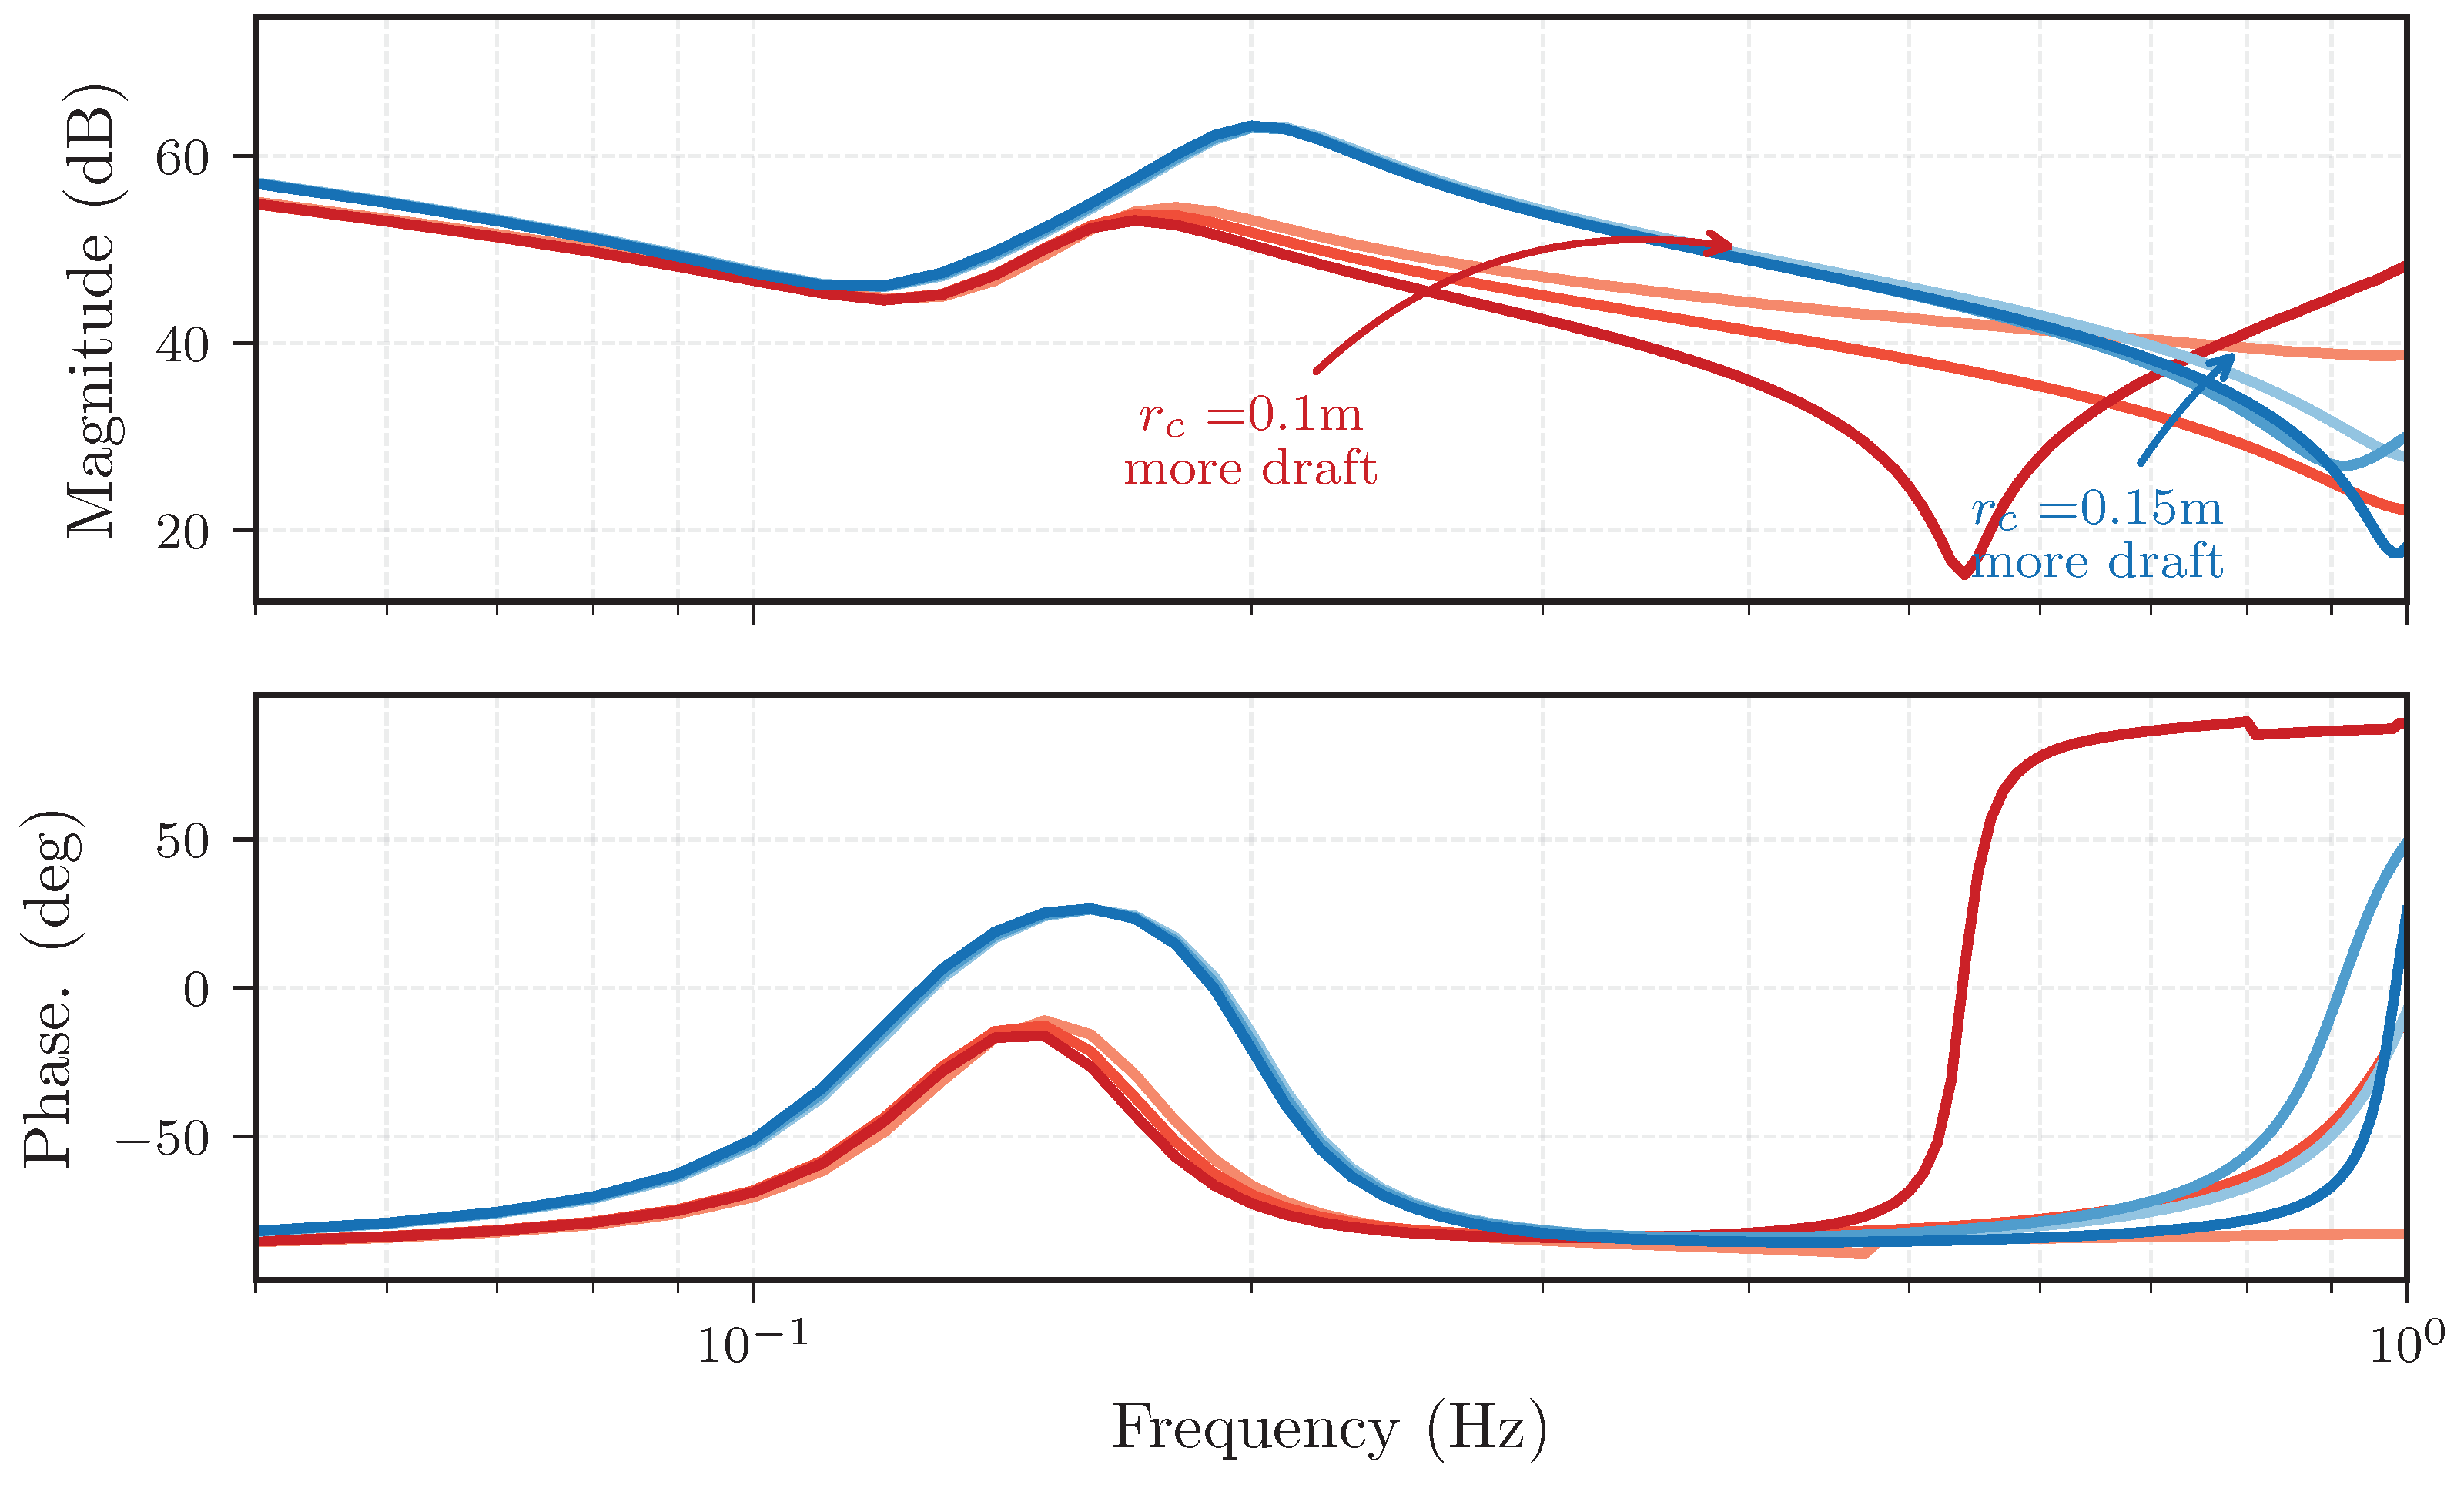
Here, F P t o is the linear PTO force, which acts equal and opposite on WEC-spar and cylinder with force vector F p t o = K T F pto . The superscript T denotes a matrix transpose. The equivalent intrinsic impedance for the six considered geometries are illustrated in Figure 8.

3.1.2. Power Take-Off (PTO) Model

For any study concerning wave energy conversion, either practical design or on a feasibility level like this, it is important to consider realistic PTO dynamics and losses due to the dynamically-coupled nature of the problem. Furthermore, any study should consider the final desired form of power, in this case electricity, as the objective. If one instead would focus on the maximization of wave absorption (i.e., mechanical power), one would obtain vastly different design configurations both in terms of control trajectories (higher force amplitudes) and requirements for the hardware.
Ideally, a detailed design study would consider a variety of different hardware options, but for this scoping level effort we choose one representative commercial off the shelf generator. Specifically, the 48V Maxon IDX 70 L □70 mm, brushless, 900 W, with integrated brake, Hall sensors and Encoder EASY INT 1024CPT (https://www.maxongroup.com/maxon/view/product/motor/ecmotor/IDX-MOTOR/IDX-70-MOTOR/IDX-70-L-MOTOR/IDX70LABSTD4Y558B, accessed on 6 August 2025). To model the generator’s dynamics, we use the manufacturer provided winding resistance R w = 0.0718   Ω , and inductance L w = 0.0002   H 0 to quantify the winding impedance Z w . We will neglect the imaginary part of Z w , since the electrical current dynamics are orders of magnitude faster (due to the small inductance) than the hydrodynamics.
Z w = R w + j ω L w R w
This generator’s torque constant is k τ = 0.164   N   m / A . To convert the relative motion between the WEC-Spar and the internal cylinder into rotary motion, a ball screw mechanism presents a robust solution. Ball screws are back-drivable, a characteristic that is essential for the oscillating power conversion and for reactive control, while their low friction is an additional benefit for power conversion efficiency. In most ball-screw applications, back-driving is an unwanted effect when no actuation is desired, but a linear force causes a torque that overcomes the ball screw’s static friction and causes motion. Ball screw back-drivability depends on its screw lead and its friction. The desire to provide reactive power at certain times is why we do not consider a hydraulic linear-to-rotary motion transducer. Supplying reactive power with hydraulic machines necessitates more complex hydraulic circuits, and we are not aware of any off-the-shelf components suitable for the immediate application. However, the dynamic model utilized in this work could also simulate a hydraulic PTO with different parameters, particularly for the damping control. Hydraulic systems offer the advantage of achieving larger gear ratios without a significant increase in friction compared to ball screws. A priori estimates suggest that the suitable gear ratio N for the conversion from linear to rotary motion is in the range of 50 rad/m to 70 rad / m , which will be investigated in the following sections. This would translate to a screw lead of about 0.125 m to 0.09 m , which is a rather large lead for most common applications, but should still yield very low friction. We note that many ball screws have linear to rotary gear ratios on the order of hundreds of rad / m . Quantifying the actual amount of viscous and Coulomb friction in the drive-train is uncertain, especially for varying screw leads. Additionally a ball screw’s friction is dependent on temperature and axial loads [30,31], and further wear and corrosion would increase friction, which may vary over time. Consequently, a time-varying system damping would alter the optimal control damping [32], necessitating the tracking of these conditions for optimal performance. Currently, determining the friction experimentally and considering it to be time varying would be out of scope. Instead, for this study, we consider the drive-train friction coefficient b d as a free variable in order to investigate the sensitivity of the average power to a change in b d (we define the b d parameter range broadly around two reference points: (1) a ball screw with 0.005 m lead and about b d 0.0003 N s / rad [30]; (2) a ball screw with 0.016 m lead and b d within 0.004 Ns/rad to 0.015 N s / rad [31]. Compare Table 3). The drive-train dynamics are captured with the drive-train impedance ( Z d ),
Z d = b d varied + j ω J d constant k d ω 0 . energy storage
We consider the drive-train moment of inertia ( J d ) (which also contains the generator’s moment of inertia) to be constant and do not consider any additional stiffness k d . For future studies, those energy storing components are promising variables to improve the power flow from wave to kinetic energy and will warrant studies taking a flywheel and rotational springs into consideration.

3.2. WEC-Spar PTO Multi-Port Model

We capture the PTO and control dynamics with a multi-port model [33]. We relate the mechanical power variables with the inverse transmission matrix ( [ b ] ) to compute the electrical power variables, the output voltage ( o u t , effort) and current ( I o u t , flow), respectively:
o u t I o u t = [ b ] F p t o Δ v with [ b ] = 1 k τ N Z w N 2 ( k τ 2 + Z d Z w ) 1 N 2 Z d .
The active power at the load per frequency is then given by
P = 1 2 { o u t I o u t * } .
The superscript * denotes the complex conjugate. The active power (10) is electrical power, which becomes fully defined if we modulate the output current I o u t as a function of the rotational speed ( N Δ v ) with controller,
C = I o u t N Δ v ,
which in turn determines the load impedance that relates the electrical power variables with each other.
Z = k τ C Z w = out I out .
While this study focuses on analyzing electrical power, but also touches upon how well the WEC multi-port system is “matched". For more detailed discussions on the concept of bi-conjugate impedance matching (albeit with different WECs) the readers are referred to [33]. Thus, we state the definition of the input and output impedance [33], respectively:
Z i n = N 2 Z d + k τ 2 N 2 Z + Z w
Z o u t = Z w + k τ 2 N 2 Z e q + N 2 Z d .

3.3. Control

For any WEC-PTO configuration considered in this work, we utilize controllers that maximize the average electrical power at the motor leads, subject to the controller’s restrictions. The one exception is explained in Section 4.4 (“Stroke Limitation with Control”), where the optimized control damping gain is intentionally perturbed for demonstration purposes. Optimizing the control algorithm (software) for every different WEC-PTO configuration in the considered hardware design space is a fundamental principle in control co-design. The linear multi-port models enable the definition of a numerically optimal controller, which we will use as a reference and benchmark for the upper limit of power conversion. For most of this study, we use a simple damping control to obtain conservative estimates for power performance, while using a control law that could easily be implemented in hardware. Hardware implementation would require a low-power micro controller to process the velocity sensor signal (for example from the motor encoder) and a motor drive that regulates the instantaneous generator torque based on the micro controller feedback. The hotel load for these systems would be in the m W range and a damping-only control does not consume additional power from the batteries. There are several control archetypes, such as Proportional-Integral and Model Predictive Control, that could be feasible. However, if optimized for average power, they would all fall somewhere between the considered optimized damping and the numerically optimal control in terms of performance.

3.3.1. Numerically Optimal Control

The numerically optimal controller ensures that the load impedance perfectly matches the output impedance:
Z o p t = Z o u t *
C opt = k τ Z o u t * + Z w .
Consequently, the average electrical power flow to the load is maximized. However, in all likelihood, C o p t will be acausal (depending on Z o u t , but it is the case for most heaving WECs) and thus cannot be directly implemented in hardware.

3.3.2. Optimized Damping Control

For the simple damping control law, or “P control” (for proportional control) we will use a gain k p as the control impedance ( C P ) that modulates the current ( I o u t ) proportional to the rotational velocity and defines the damping load impedance ( Z P ):
C P = k p
I o u t = C P N Δ v = k p N Δ v
Z P = k τ k p Z w .
The numeric value of the damping gain maximizes the average electrical power ( P ¯ e l e c ) for the considered WEC-PTO configuration in the considered sea state, i.e.,
min k p P ¯ e l e c ( Z P ) s . t . 0 k p k τ { Z w } .

3.4. Metrics

Metrics were already introduced during the definition of the functional requirements warranting this more detailed numerical campaign. These metrics are now defined in the mathematical sense. The average electrical power ( P ¯ e l e c ) will be given the most emphasis and is defined as the sum over the frequency spectrum of the power at the load ( P ):
P ¯ e l e c = i = 1 N f P ( ω i ) .
The annual energy A e is then the sum of the weekly average power P ¯ w , elec scaled by hours per week h w ,
A e = h w w = 1 52 P ¯ w , elec .
Also in great detail, we will address the maximal stroke that can be expected over time. First, we integrate the PTO velocity (i.e., the relative velocity) in the frequency domain, s P T O = Δ v i ω , to receive the frequency domain PTO stroke complex amplitudes s P T O . Next, we use random phase realizations to generate N r = 500 trajectories, each with a repeat period of 100 s as dictated by our chosen frequency spacing of 0.01 Hz . For each random trajectory we determine the maximal value of the stroke magnitude and take the 90th percentile:
s m a x 90 t h = 90 t h percentile max | s ^ 1 ( t ) | | s ^ 2 ( t ) | | s ^ N r ( t ) |
with s ^ r ( t ) = F 1 { s P T O e i ω ϕ r }
In a similar manner, we examine the maximum velocity that the WEC-Spar may experience. To achieve this, we first simulate the system using equivalent dynamics, then used the PTO force spectrum to compute the dynamics of the two-body system,
v = Z i 1 ( F e x c K T F p t o )
v W E C S p a r = [ 1 , 0 ] v
The 90th percentile of the maximal WEC-Spar velocity is obtained equivalently to (23). Further, we compare the WEC-Spar’s velocity with the X-Spar’s velocity. The X-Spar’s velocity can be computed by using the same wave amplitude spectrum, the BEM quantities introduced in Section 3.1.1 (“Hydrodynamic Model”), and no external forces. The last metrics detailed in Section 4 (“Results”) quantify the power reflections and losses throughout the WEC-Spar. The input and output transmission coefficient are
1 Γ in = 1 Z i n Z e q * Z i n + Z e q 2 ,
1 Γ out = 1 Z Z o u t * Z + Z o u t 2 .
These transmission coefficients quantify how well the respective input and output impedance is matched across the frequencies. The transmission coefficients do not capture dissipative losses (such as mechanical friction and winding resistance). Those loss effects are, however, captured in the the wave-to-wire efficiency G T and the PTO efficiency G O .

4. Results

This section highlights aspects of the proposed WEC augmentation of the X-Spar buoy to extend its mission life: some are metrics for the functional requirements, others help foster an understanding of the system. The most prevalent metric that we consider is the average electric power P ¯ e l e c (measured at the motor leads) that different WEC configurations could convert from ocean waves, usually averaged over one week of time.

4.1. Parameter Space

The design parameter space for the WEC-Spar PTO co-optimization considered in this study is presented in Table 3. While the parameter space is not all-encompassing, it covers enough of the design space to identify trends that will help inform further design directions.
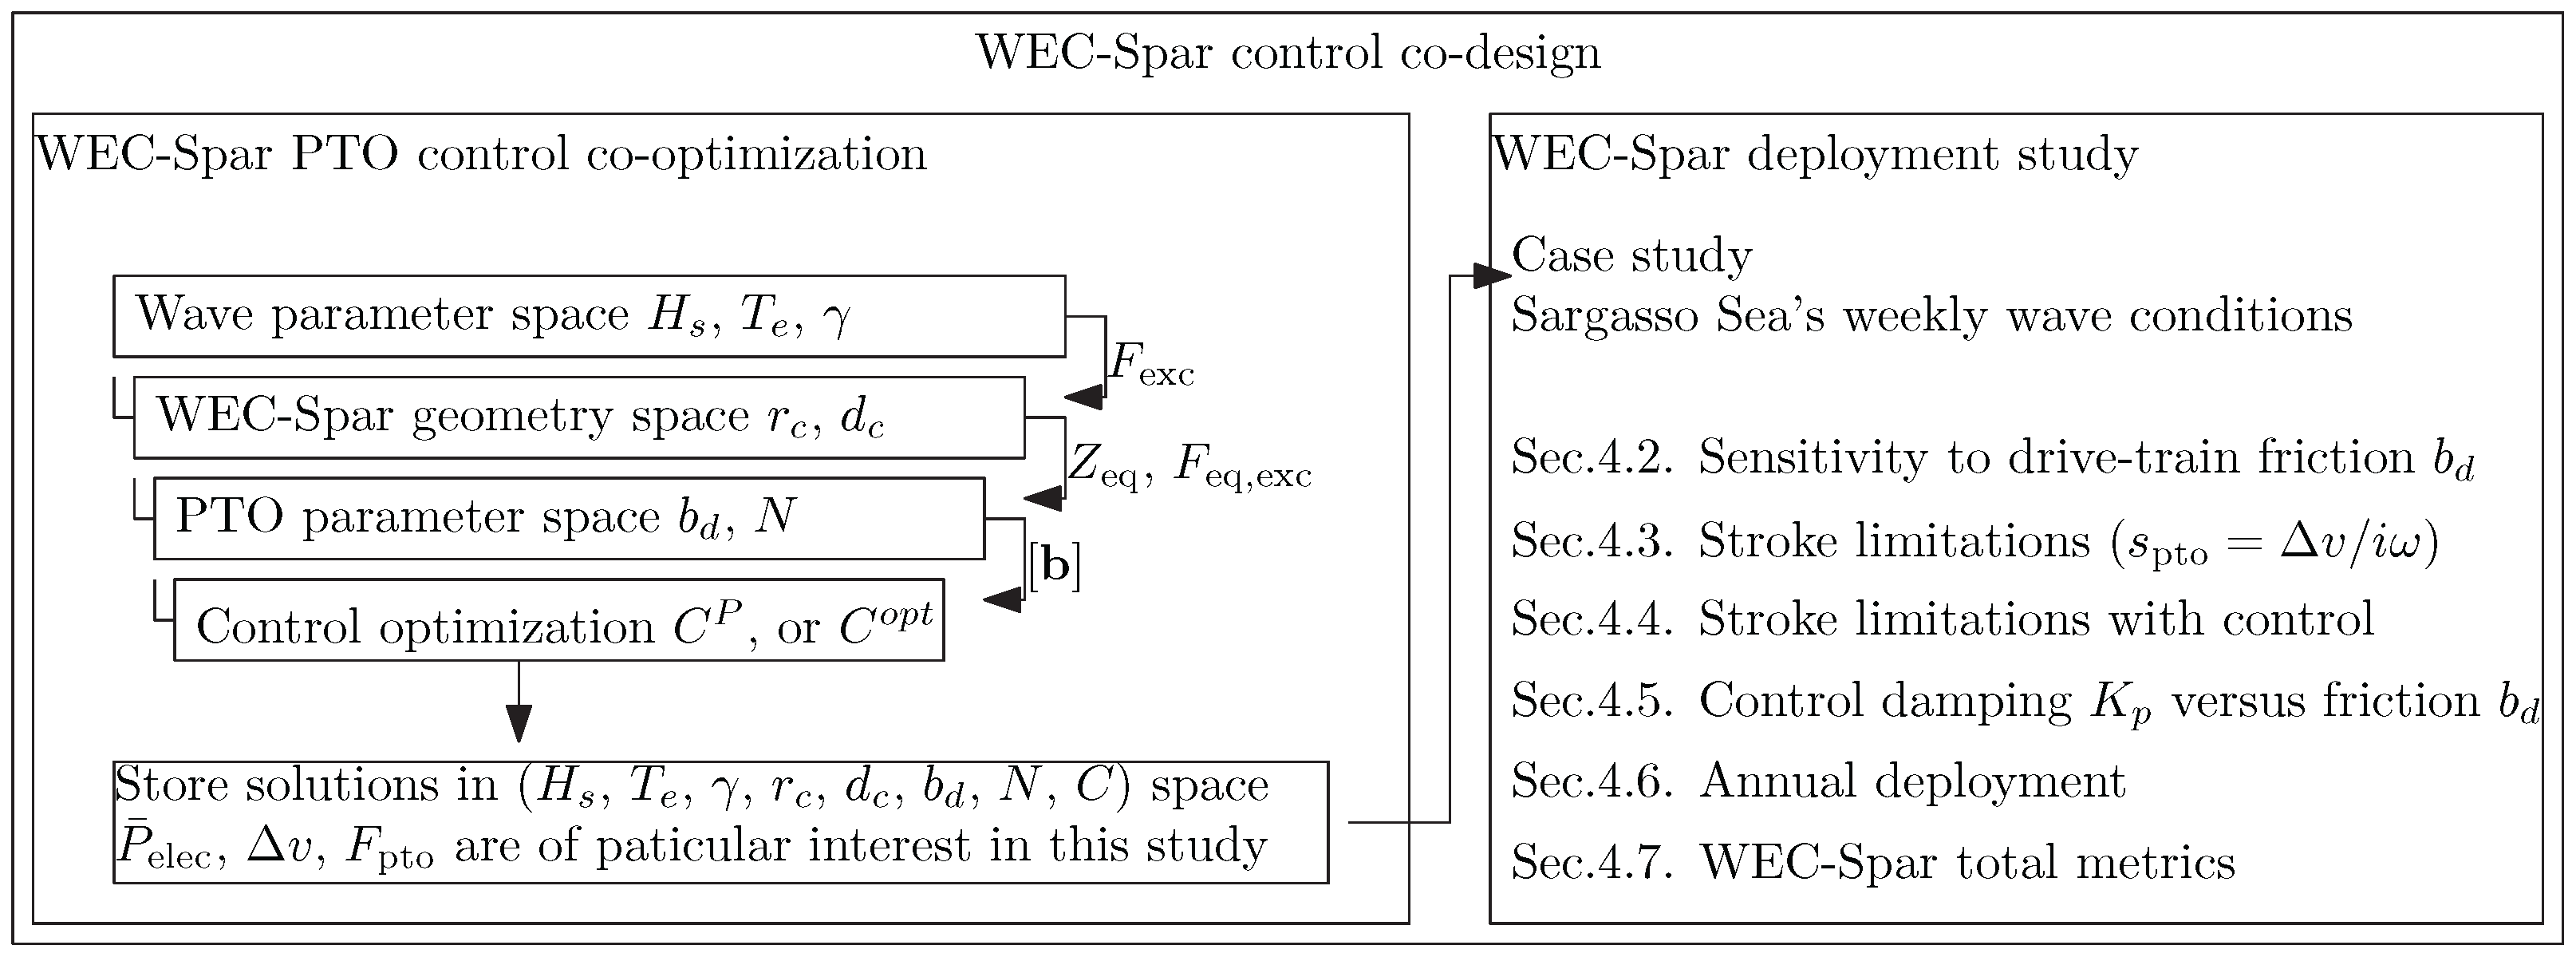
We create a multi-dimensional dataset encompassing all dimensions of the WEC and PTO parameter space, along with three dimensions to represent wave spectra. We populate all coordinate combinations of the dataset by sweeping over all combinations, as illustrated by the nested loops in Figure 9. If the sole objective were to find the globally optimal solution, then the brute-force method would not be computationally efficient, as it captures many suboptimal solutions. However, during the feasibility study stage, we aim to explore trends in the design space to guide future efforts.
For this study, we evaluate the co-optimization dataset for the average weekly wave conditions in the Sargossa Sea (Figure 4) and study the metrics presented on the right side of Figure 9 throughout the next sub-sections.

4.2. Sensitivity to Drive-Train Friction

As previously discussed, the friction coefficient of the ball-screw is uncertain. Consequently, b d is considered a free variable in this study.
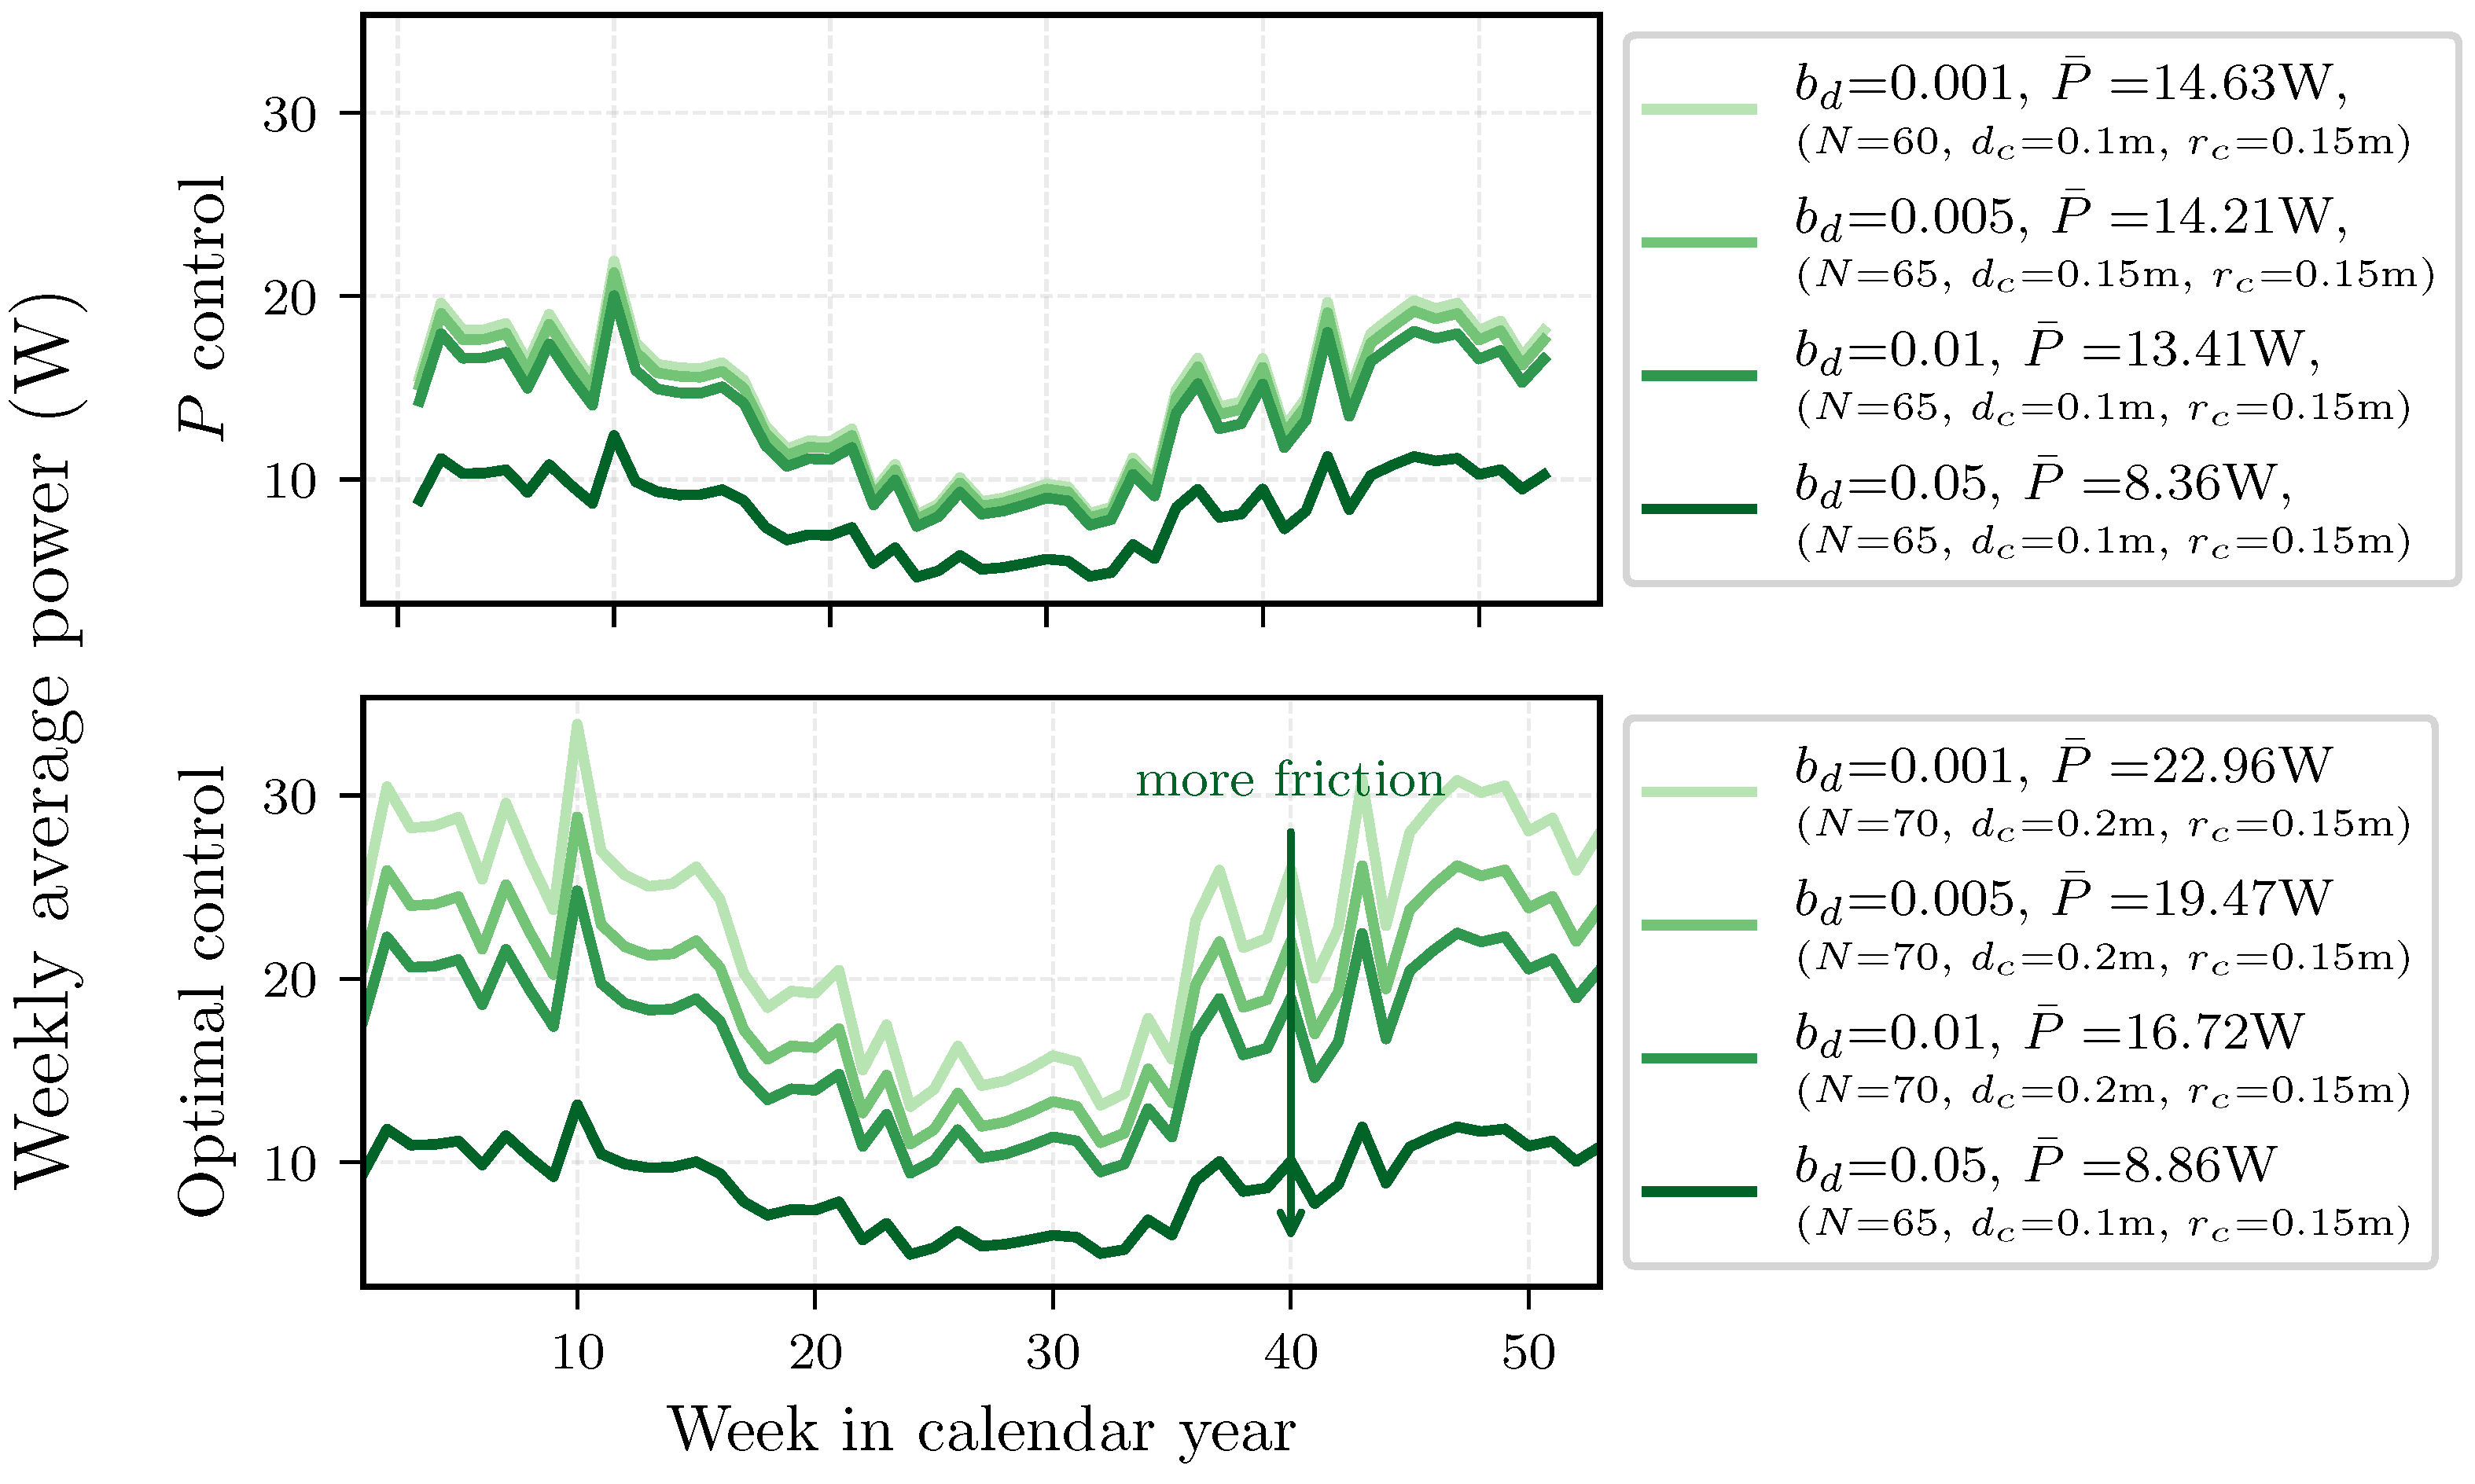
While the actual magnitude of mechanical friction cannot be arbitrarily selected in practical applications, permitting its variation allows us to assess the sensitivity of the average power to changes in friction. For the annual average power trajectories plotted in Figure 10, we fixed the friction b d to each value in the variable space and only considered either a numerically optimal controller (matches the output port impedance, Z = Z o u t * ), or a simple damping controller- (“P” for proportional control). The remaining parameters were then optimized for maximizing annual energy A e . There are three main takeaways from this analysis. First, if the drive-train (ball screw) friction exceeds b d > 0.05   N   m   s / rad , the average power would drop below the desired 10 W . Second, for low-to-medium friction 0.001 N m s/rad to 0.01 N   m   s / rad (i.e., an order of magnitude increase in friction), the average power does not drop substantially, quantified at 8.4%, when altering the configuration and the optimal control parameters. Third, the optimal control becomes less impactful in terms of more power, as drive-train friction is increased.

4.3. Stroke Limitations

For a real-world WEC and its components, it is vital to operate within specified limits, such as stroke length and allowable forces. In this subsection, we demonstrate that the simulated dynamics remain within the limitations, ensuring that performance levels are not overestimated due to excessive motion amplitudes.
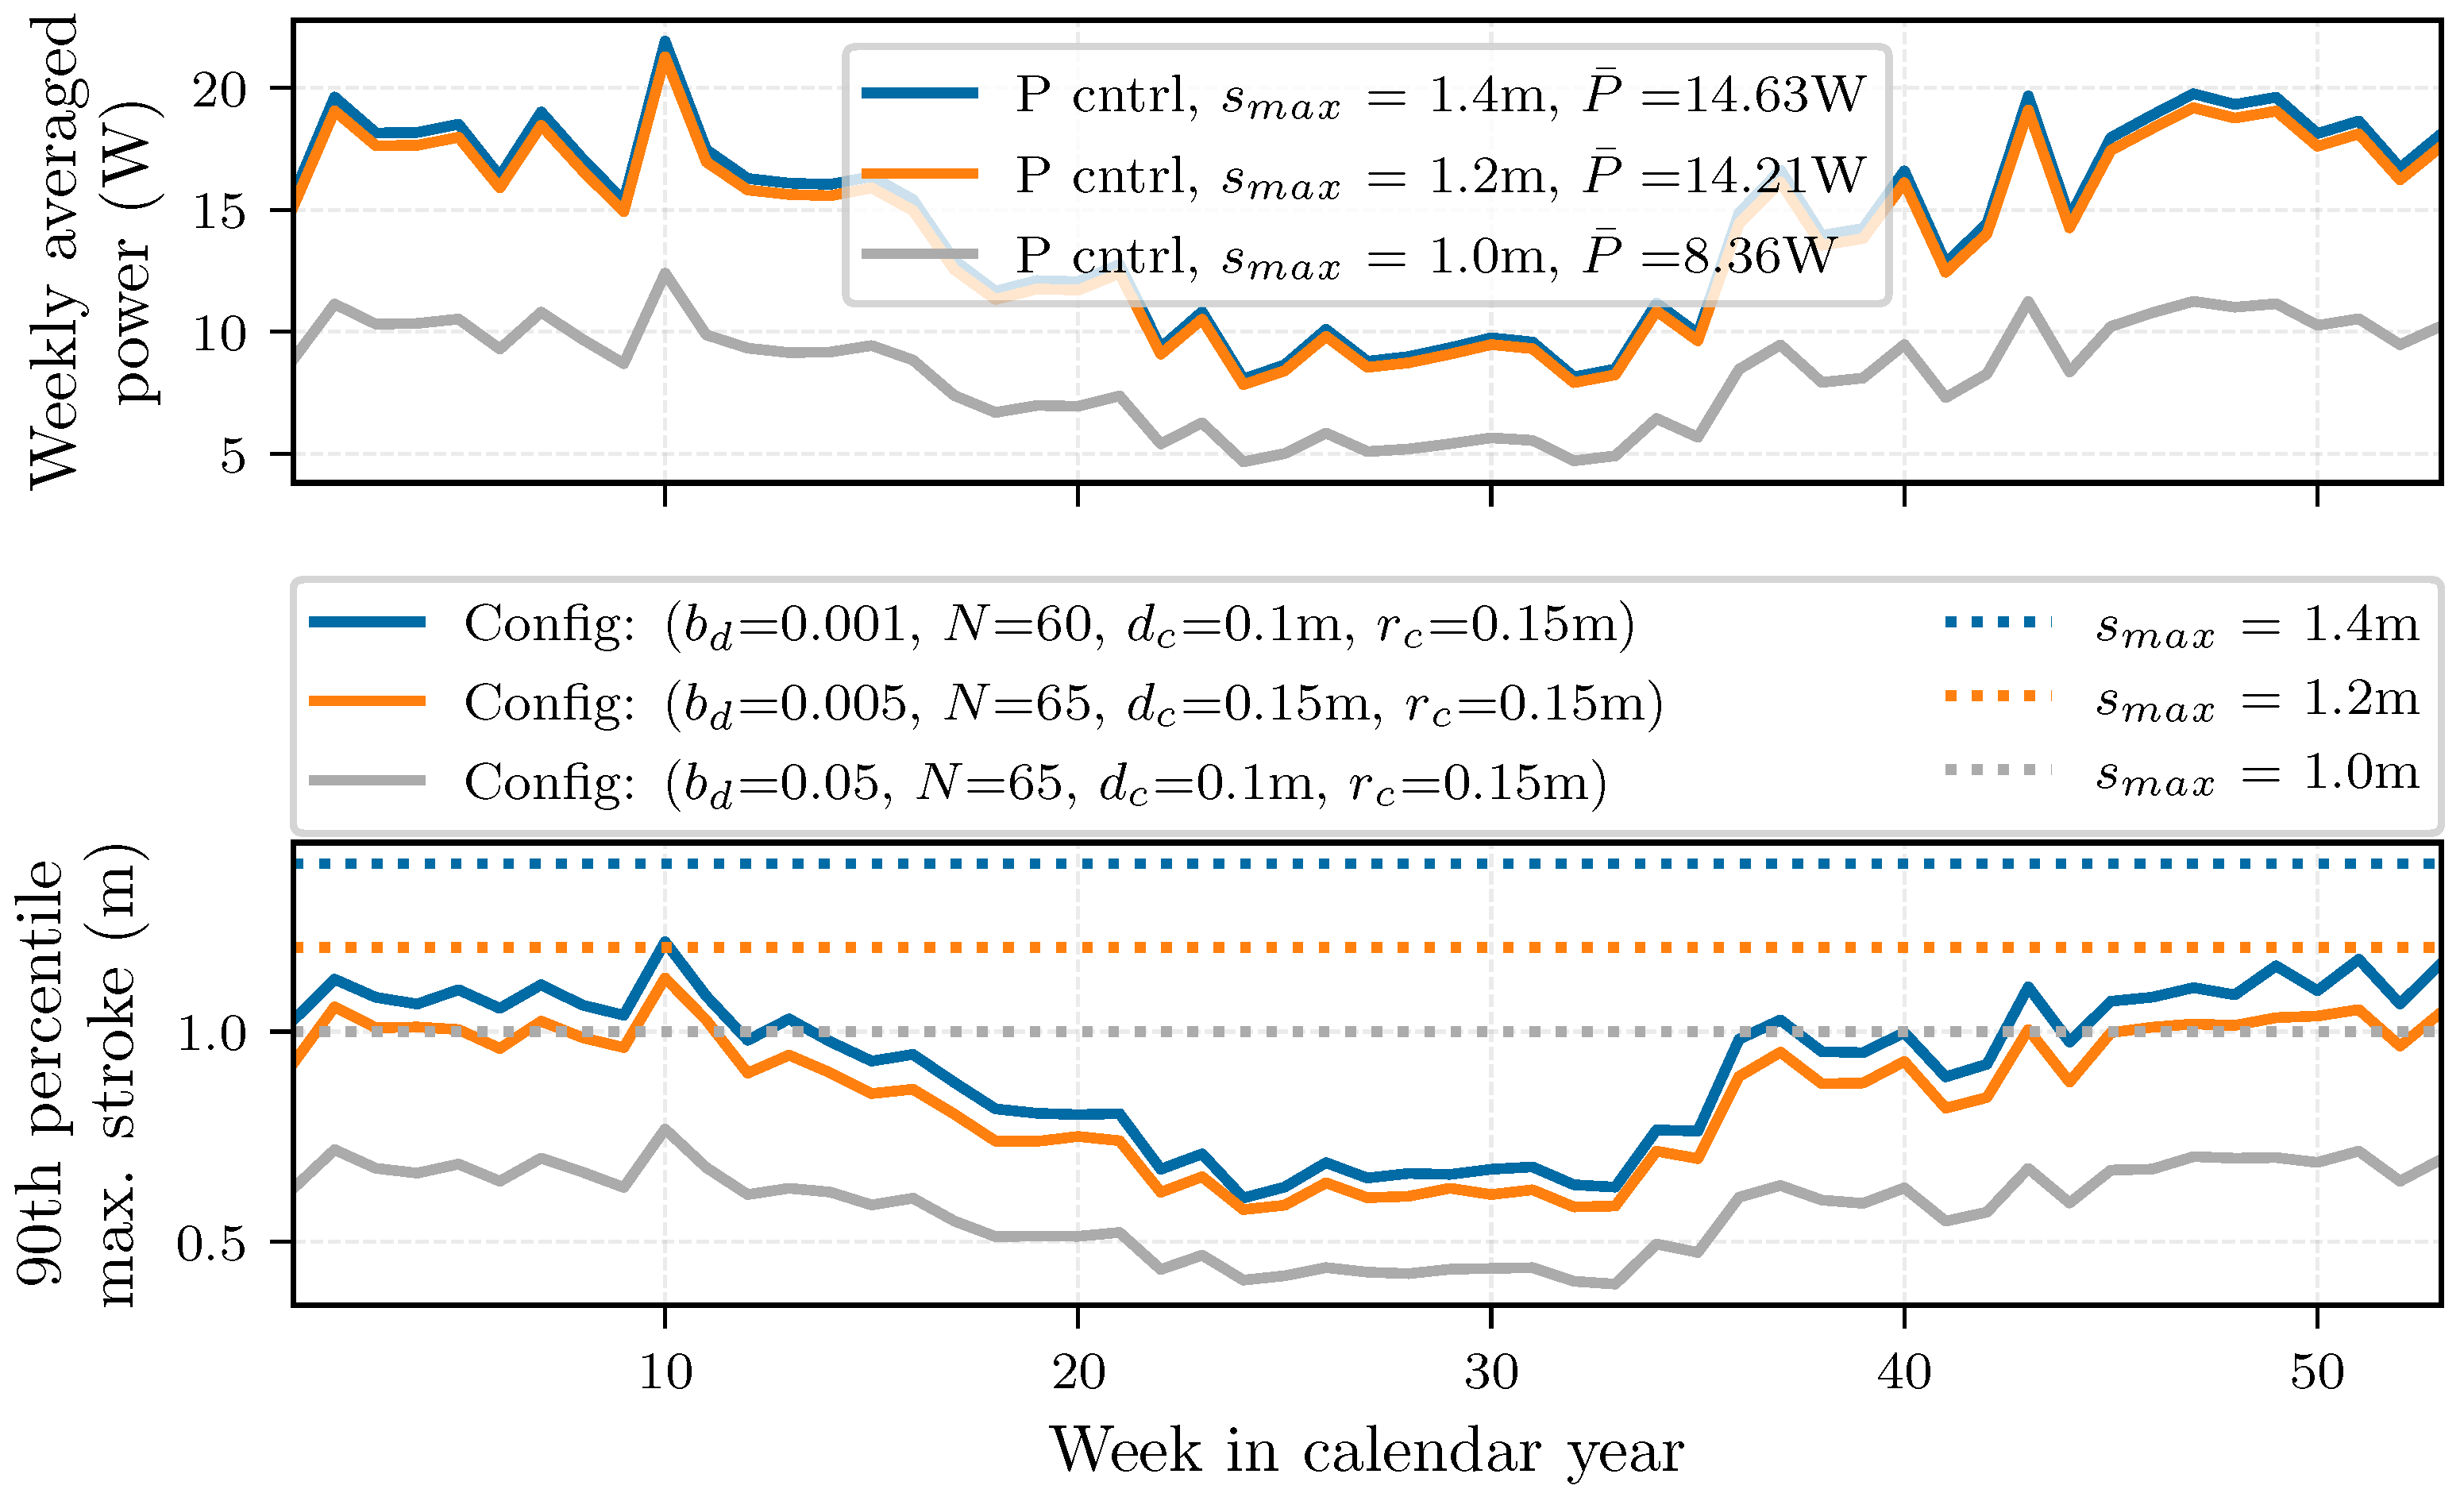
For linear feedback controllers, one generally must compromise between optimal performance and constraint handling, but in this sub-analysis we only consider the proportional control and investigate the subset of solutions that have the optimal annual energy, while being within different levels of PTO stroke s m a x , specifically 1.4 m , 1.2 m , and 1.0 m . Currently, we anticipate that a stroke length of 1.2 m is possible to realize in hardware.
Figure 11 demonstrates that the configurations from the previous solution space also appear in this analysis and we learn that, for example, the lowest considered drive-train friction value would not satisfy the stroke constraint (albeit only marginally at week 10, as seen for the darkest (blue) line). Of course, if a low-friction scenario can be achieved in practice, we would not dismiss this drive-train configuration. Instead, we would explore other variables to influence the maximum stroke.
For example, in future studies, we will formulate the limitations as constraints in mathematical optimization problems. Another approach involves using nonlinear control, which increases the PTO’s opposing force more than proportionally as a function of the stroke. This method can help maintain compliance with operational limits without compromising performance during normal operation. As a last resort, brakes could be installed to dissipate the converted kinetic energy as heat, rendering it unusable.

4.4. Stroke Limitations with Control

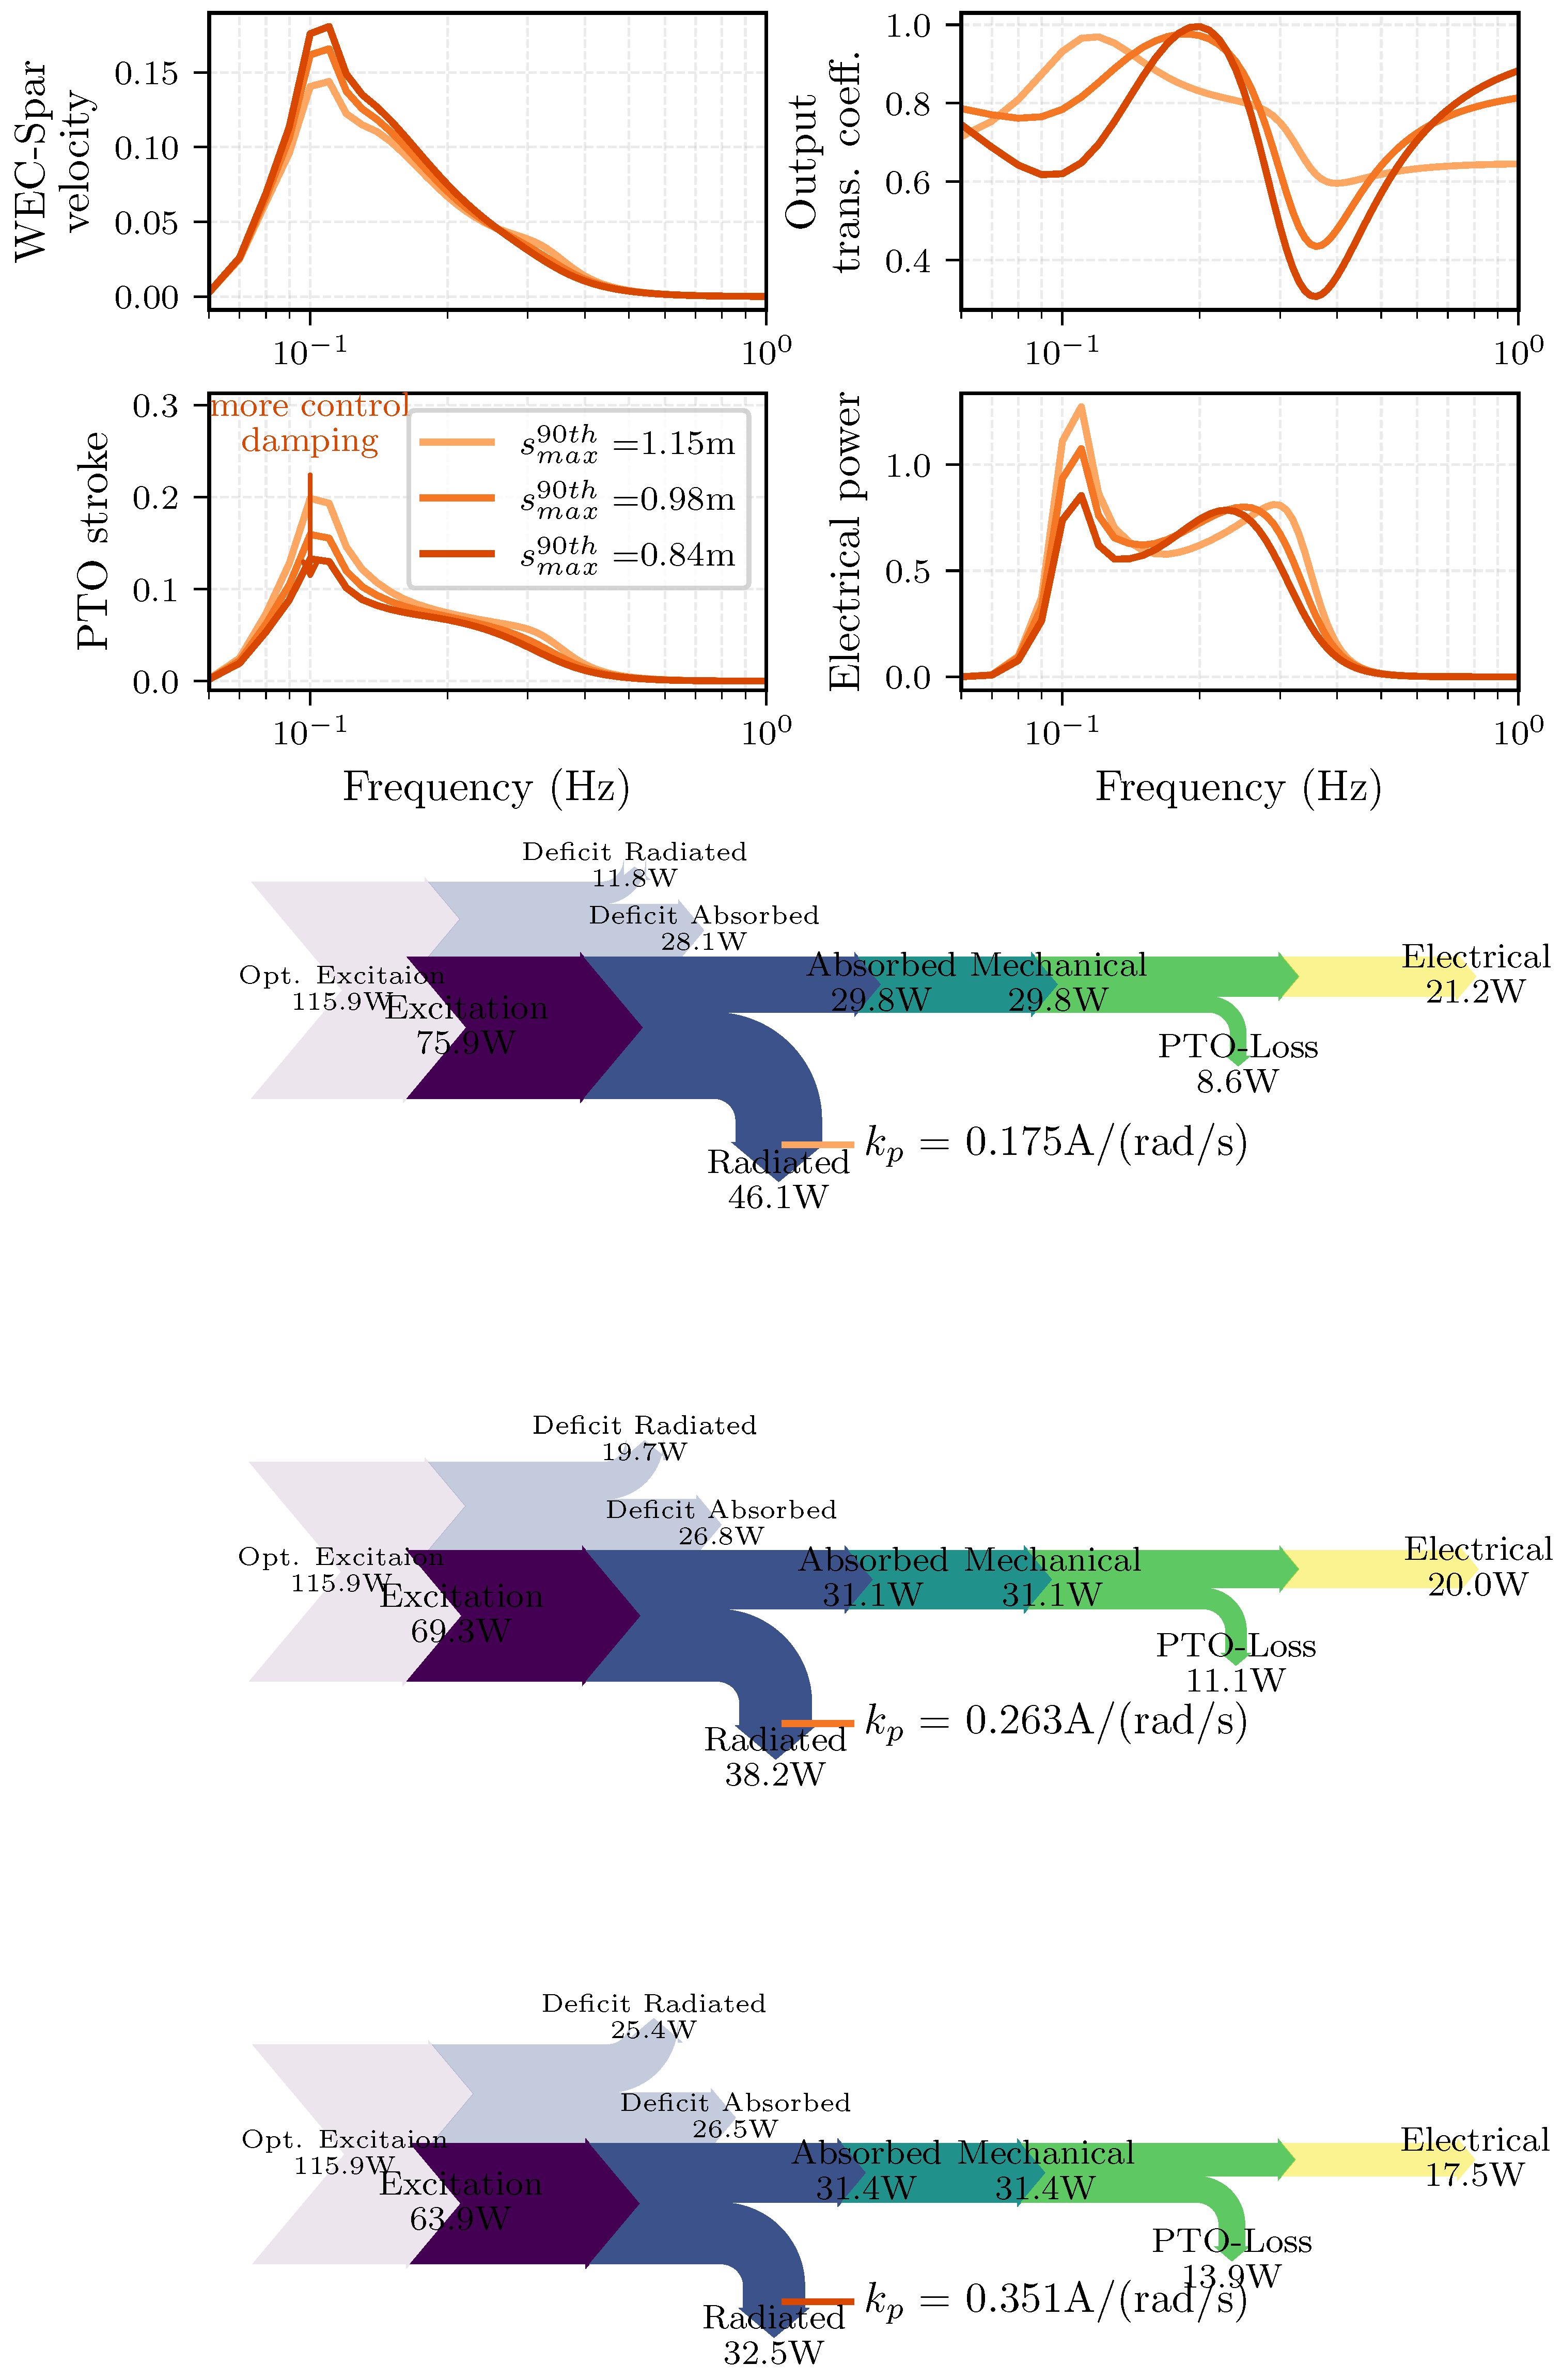
In the next analysis, we show that several parameters influence the maximum stroke, one of which is the active control mechanism. The real system would also implement soft, passive, end-stops to limit the stroke during extreme conditions. These cases do not contribute significantly to the average power and are out of scope for this analysis. Previously, our optimization efforts focused on maximizing average electrical power through controller adjustments. Figure 12 shows sub-optimal solutions concerning power output, demonstrating how these alternatives can further constrain the stroke while still facilitating electrical conversion, even if the average power flows through the system change. We use Sankey diagrams to visualize the average power flows from wave to wire. More details on the calculation of the numeric quantities in the diagrams are available in Appendix A. Starting from the optimal damping control value, visualized with the lightest hue and in the top Sankey power flow diagram, we increase the damping value by 50% and 100%, respectively, and simulate the response during the highest energy sea state at Week 10.
From the first subplot (left, top corner), we learn that an increased PTO damping increases the WEC-Spar velocity for frequencies below 0.25 Hz , where the internal cylinder responds most and marginally reduces the WEC-spar velocity for frequencies higher than that. This also results in a decrease in electrical power across the low frequencies (right, lower corner).
A notable observation can be drawn from the output power transmission coefficient (upper right axes) in combination with the Sankey diagrams: as control damping increases (starting from the optimal), less power is transmitted to the load (or equivalently, more power is reflected from the load). Specifically, although higher damping leads to a reduction in the conversion of wave excitation, it simultaneously allows for an increase in the absorbed power entering the system. However, this power does not reach the load, as it is reflected back and ultimately dissipated within the PTO. Consequently, the hardware must exert additional effort to stay within the stroke limitations. Our analysis indicates that increasing the damping reduced the maximum stroke during this sea state by approximately 27%, while also resulting in a 17% decrease in average power. It is worth noting that nonlinear control may present a viable alternative, potentially mitigating the trade-off associated with average power reduction.

4.5. Control Damping Versus Friction

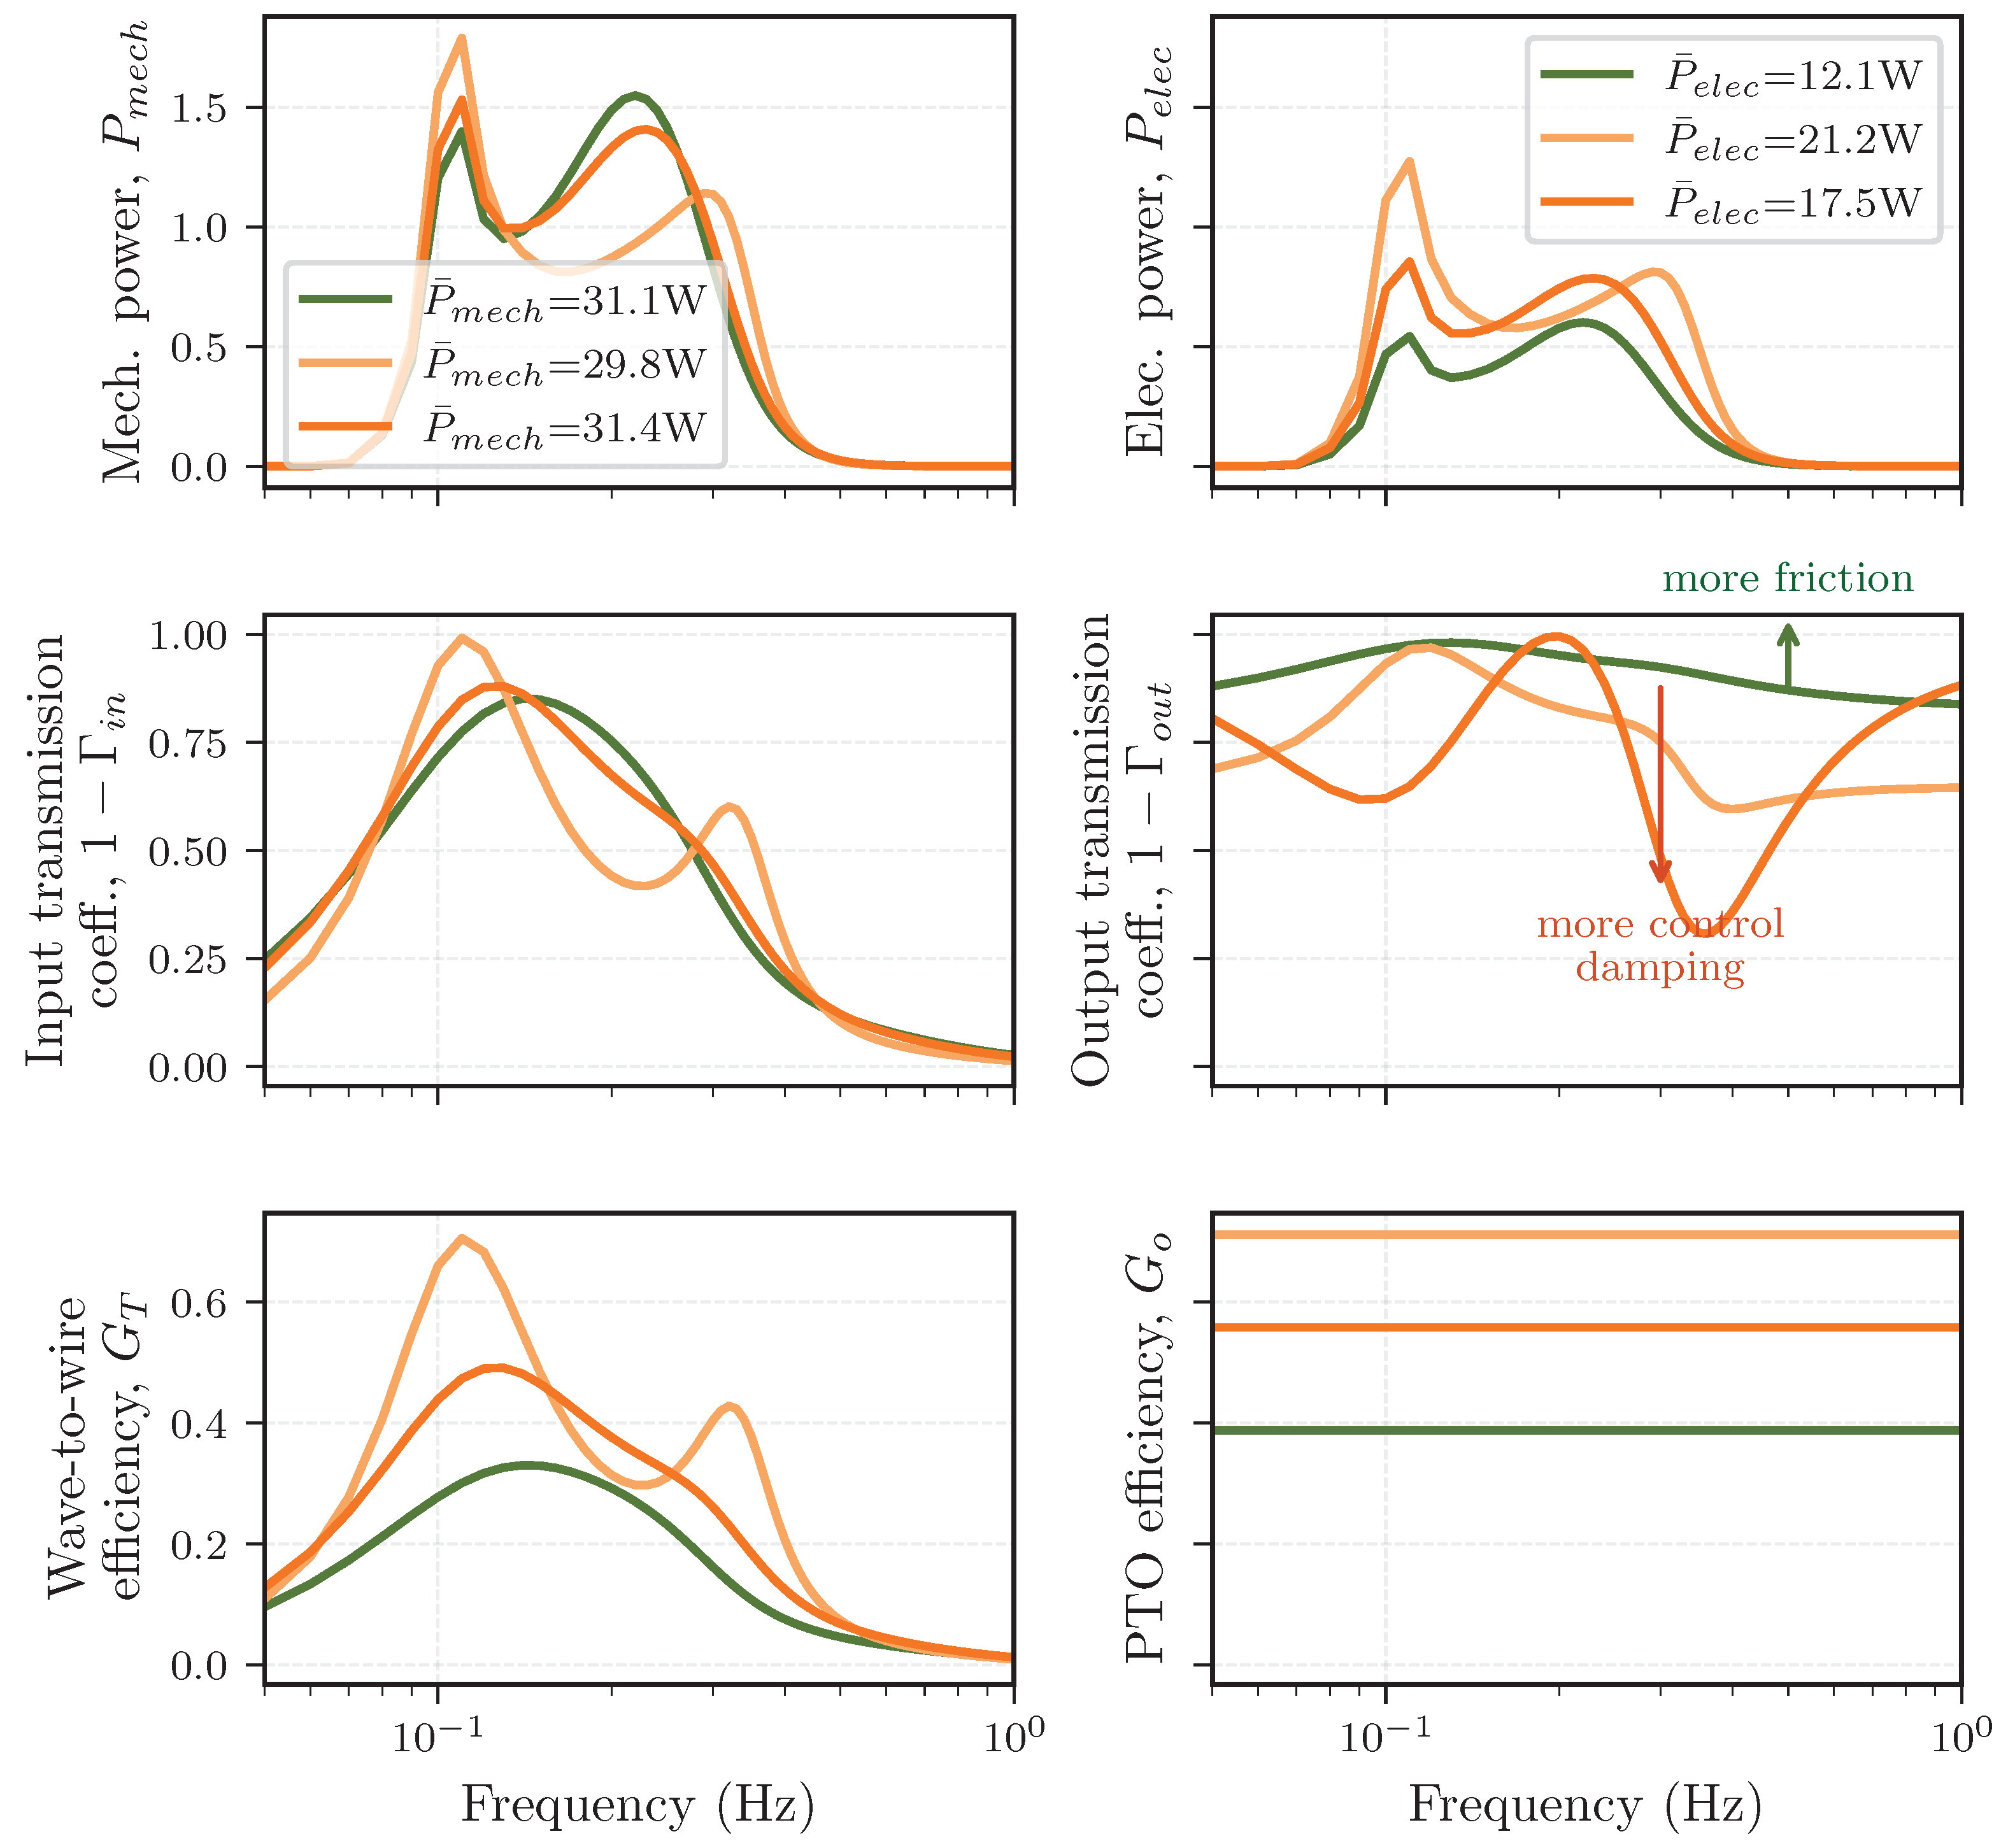
We compare the effects of friction versus control damping based on power, power transmission, and efficiency based on Figure 13. This comparison starts with the original configuration from Figure 12 and illustrates a significant damping increase alongside an increase in drive-train friction (to the highest value tested b d = 0.05   N   m   s / rad ).
There are a few notable conclusions from Figure 13. First, as noted in Section 3.1.2 (“PTO Model”), the absorbed mechanical power is misleading if it were used as an objective. Both increasing the friction or increasing the damping (from its optimized value), caused an increase in mechanical power absorption, but results in a deficit in converted electrical power. We cannot draw any quantitative conclusions from the magnitude of any quantity presented in Figure 13 because of the arbitrary perturbations. However, for the WEC-Spar, increased PTO friction and control damping cause similar trends across most measures, as both contribute to greater resistance against the relative velocity. The notable difference lies in the opposite trend observed in the output power transmission coefficient. For an increased drive-train friction (represented by the green line), the optimized damping control for the specific configuration is better able to match the WEC-Spar’s output impedance. The increased friction broadens the total system response, allowing the damping control to effectively match it over a wider range. However, a better-matched output in isolation could be misleading regarding the objective of maximizing electrical power, as evidenced by the significant decrease in efficiency and, consequently, average electrical power. The “wrong” controller primarily causes the difference in converted electrical power by mismatching the load to the overall system dynamics, preventing the absorbed power from effectively entering the load.

4.6. Annual Deployment

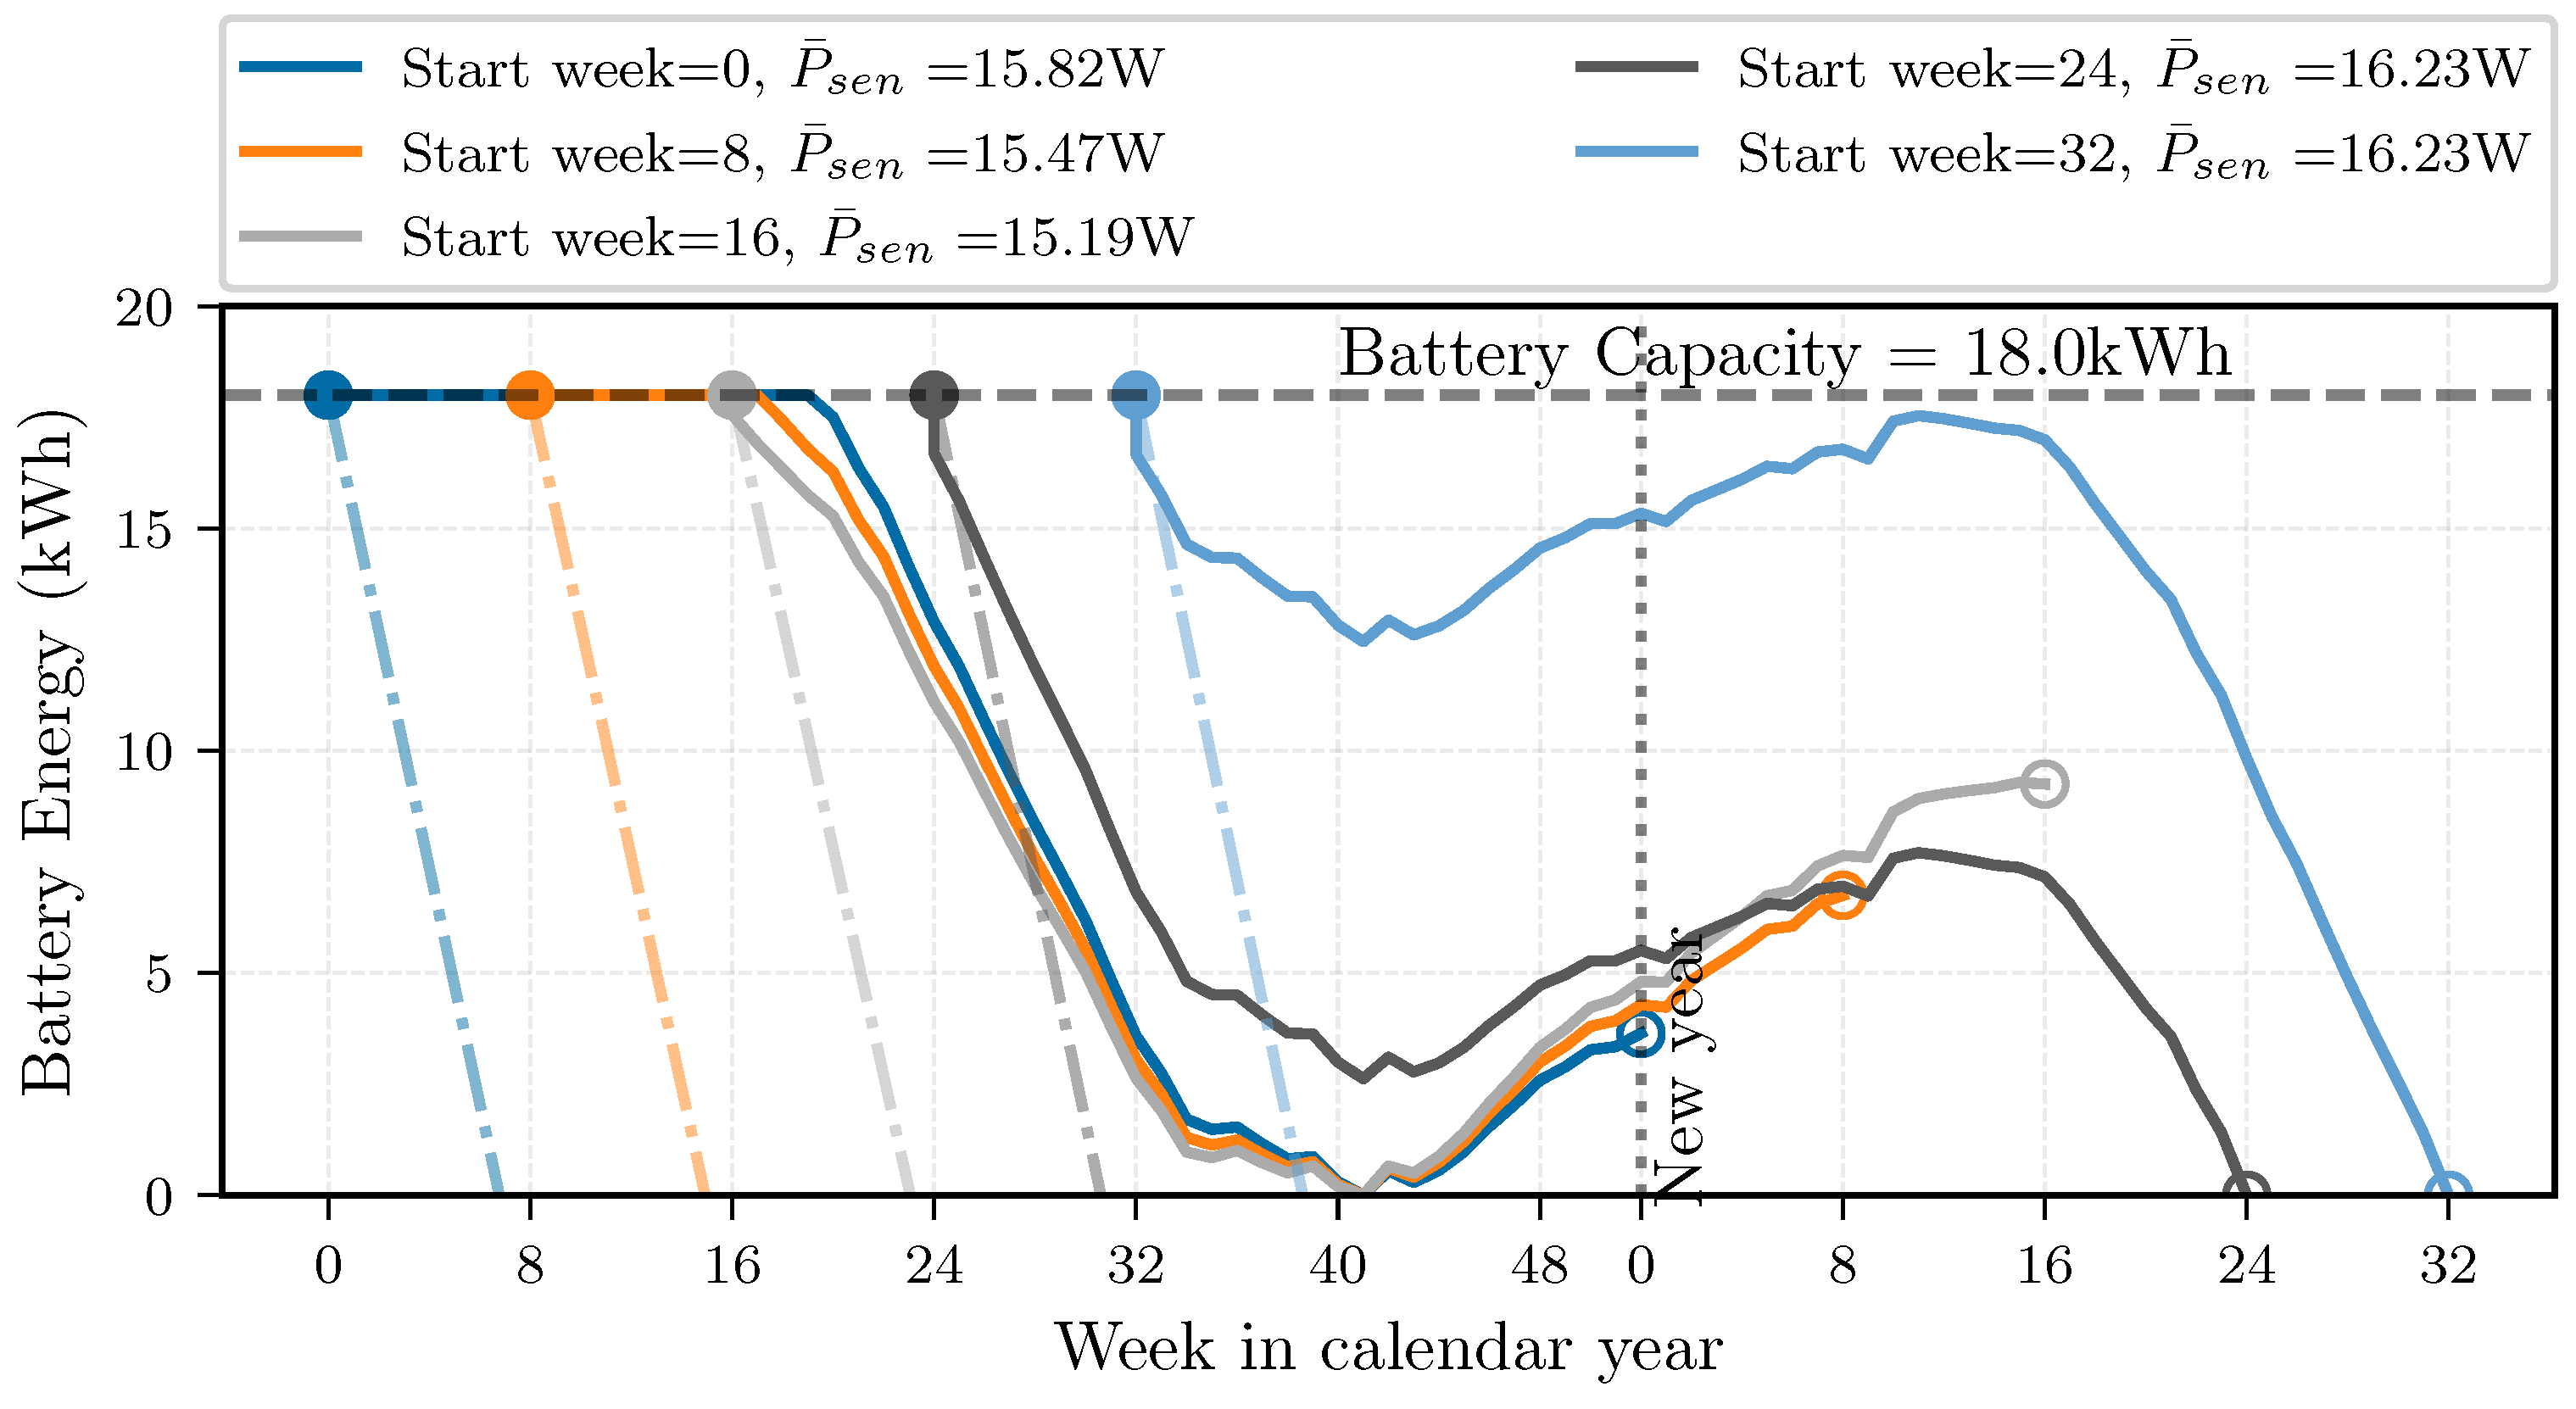
This section details how much the X-Spar missions could be extended or enhanced if the augmented WEC-Spar system were deployed. Again, we use the Sargossa Sea as a case study due to its relatively low wave energy resource (compare Figure 3). We formulate a hypothetical scenario in which the objective is to collect a full year’s worth of data. In this context, we aim to determine the maximum average power P ¯ s e n that sensors could draw so that the battery would not run out of charge until the end of the year-long mission with start week s w . For simplicity, we assume this load is constant. We compute the energy stored in the battery B ( W ) in week W as a cumulative sum of the difference between the varying weekly generated power and the constant sensor draw.
B ( W ) = B 0 + h w w = s w W P ¯ w , elec P ¯ sen , if B ( W ) < B cap B cap , else .
The conditional function ensures that the weekly battery charge does not exceed the full battery capacity B cap . In practice, additional electrical power could be dissipated across a resistor as heat. We assume the initial state of the battery B 0 to be fully charged. The optimization problem that maximizes the average power draw, while ensuring that the battery never fully discharges, is
min P ¯ sen s . t . B ( W ) 0 W .
We use the configuration that naturally stays within the s m a x < 1.2   m and choose different deployment start dates (see Figure 14). The battery capacity B cap that is currently installed on the X-Spar is 18 k W h , which equates to 2.05 W average power over an entire year. The installed capacity is obtained with multiple D-Cell non-rechargeable batteries. Rechargeable D-Cell batteries are available from multiple manufacturers off the shelf, but will likely come at a higher price point.
We can see from the results of the different battery energy trajectories that the allowable average power ranges from 15.2 W to 16.2 W , which would enable a substantial improvement of the sensor suite that the WEC-Spar could power. We recall that the current power requirements of the X-Spar are significantly lower, so this additional available power could enable additional sensors. However, it is important to note that the average electrical power is measured at the motor leads, and additional losses will occur in the circuits responsible for battery charging and sensor operation. These losses are not currently accounted for; however, since they do not impact the hydrodynamic and electromechanical processes, they will likely not influence the optimal WEC design.

4.7. WEC-Spar Total Metrics

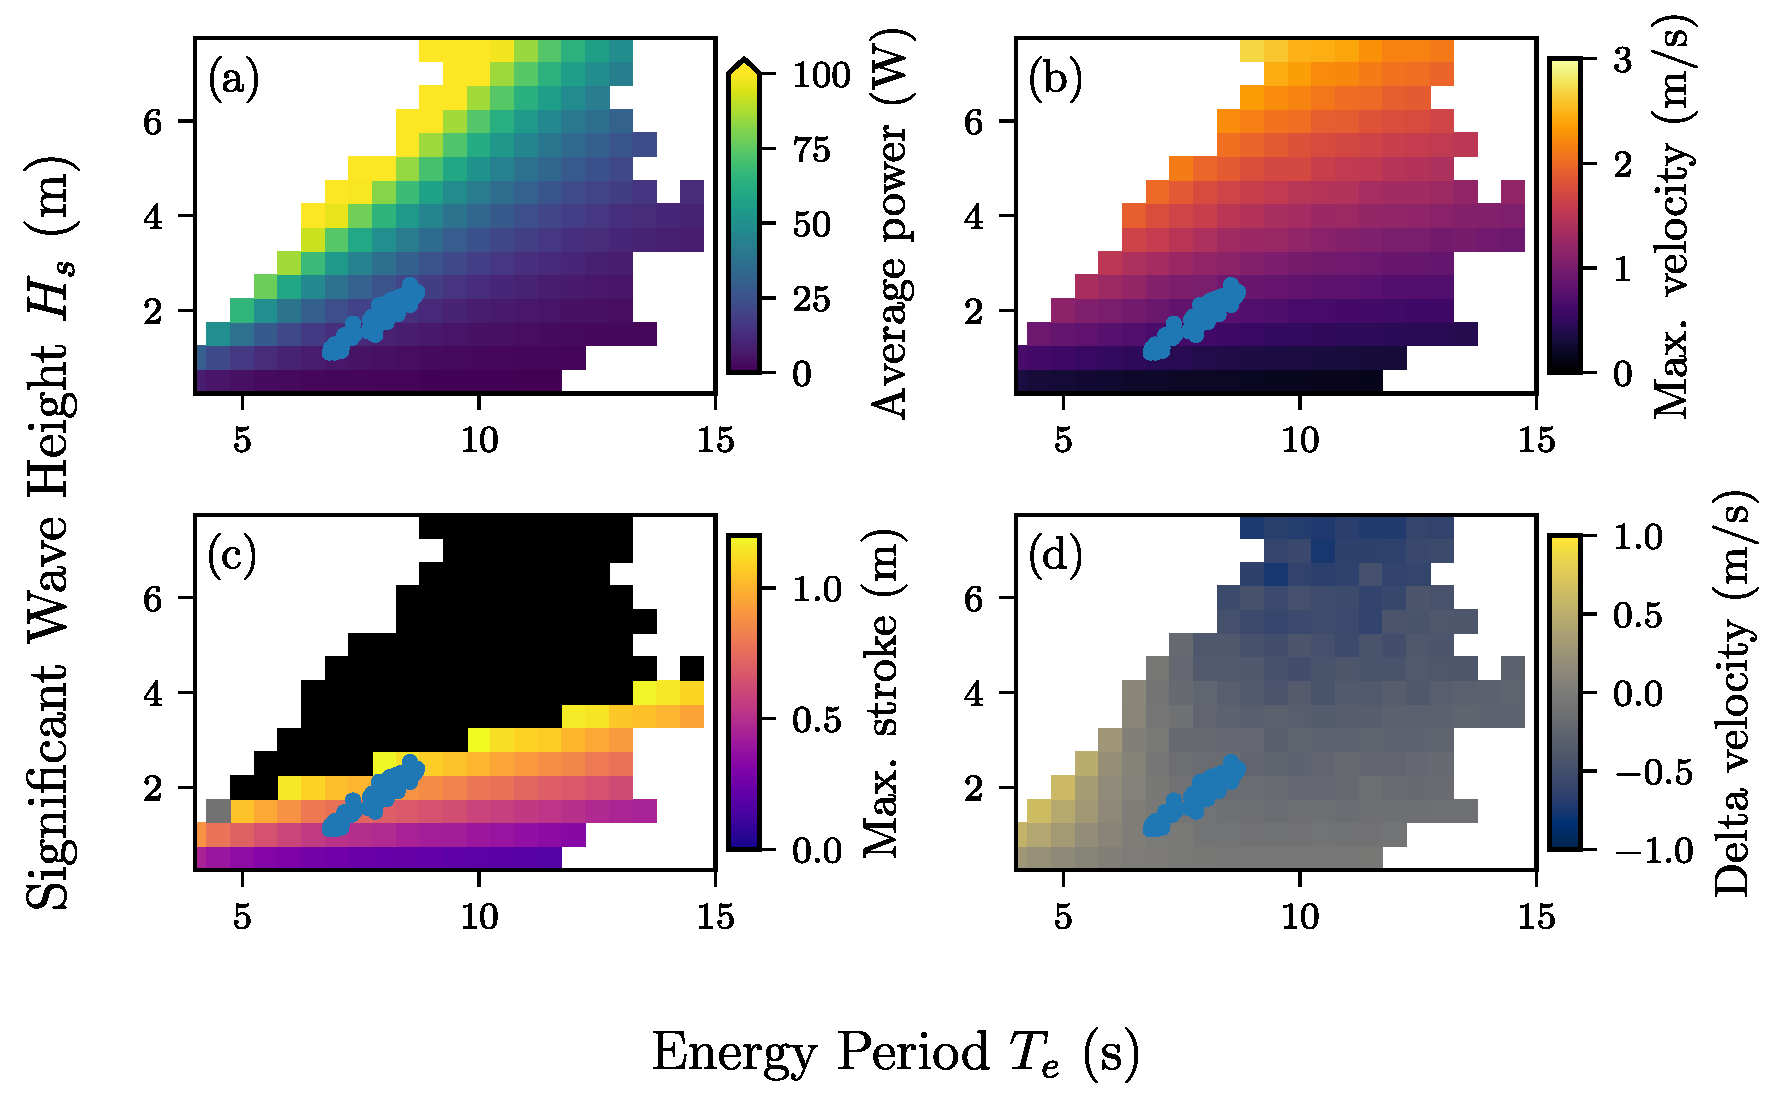
For this last results section, we investigate sea states beyond the median conditions (compare Figure 4) and consider any sea state that appears in the histogram for the Sargasso Sea location. Figure 15 shows the average power, maximum PTO stroke, maximum PTO velocity, and difference between the original X-Spar and the proposed WEC-Spar velocity as a function of the significant wave height and energy period. Many of those sea states will be found in other locations, but the optimal configuration underlying the results in Figure 15 is optimal in terms of the average weekly sea states South of Bermuda. These mean sea states are illustrated with the blue round scattered markers on top of the bivariate histograms.
The first thing to notice in Figure 15, subplot (c)—for the maximal stroke—is that the stroke limit of 1.2 m is just maintained for the most energetic sea states (compare Subplot (a)) for the mean weekly conditions. We manually colored the bins beyond the stroke limit black. For those more energetic sea states, the right approach would be to compromise between power and motion and choose sub-optimal control in terms of electricity conversion (compare Section 4.4 (“Stroke Limitation with Control”)). Subplot (a) illustrates that the sea states of concern would yield more than 30 W of electrical power, far exceeding the desired power levels. Increasing the control impedance would also decrease the maximal velocity that would be experienced and is presented in Subplot (c). We also compare the WEC-Spar’s velocity with the X-Spar’s velocity in Subplot (d). Generally, the WEC-Spar’s velocity is greater at lower periods (especially around 5 s), this is where the X-Spar has very little response to the waves. The WEC-Spar responds less in the more energetic sea states which should, in theory, improve survivability. However, the extreme wave response should be studied in more detail in future studies.

5. Discussion

This study investigated the feasibility of augmenting the X-Spar buoy with a WEC to extend its mission and enhance its operational capabilities, a variant named the WEC-Spar. Our project team included the the X-Spar developers, who took on the function of “customers” during the QFD process to translate the X-Spar needs into functional requirements, including desired power levels, deployability, and the need to avoid negative interference with data collection. We iterated on various designs, some of which might be feasible and will require future analysis. This study ultimately focused on an internal rigid body that met established criteria. We investigated the power conversion capabilities using linear wave-to-wire models simulated in the Sargossa Sea south of Bermuda, characterized by its moderately low wave resource, leading to conservative power estimates. The results indicated that a well-designed PTO system can significantly improve the WEC-Spar’s mission by providing additional electrical power, while not impacting data quality and, theoretically, improved extreme sea following capabilities.
We want to emphasize that this is not supposed to be a detailed design study, but a feasibility study that goes beyond wave absorption to electrical power, by considering feasible PTO components and controllers. We sought to find a compromise between extensive design space exploration and the practical integration of real-world off-the-shelf components, such as the generator selected for the evaluations and the envisioned ball screw drive-train transmission to convert linear to rotary motion. Friction is a parameter that is often challenging to quantify. Therefore, we investigated the sensitivity of average power to variations in drive-train friction. Notably, when friction exceeds 0.05 N   m   s / rad , the average power dropped below the target threshold. Conversely, for low to medium friction levels, the average power remained relatively stable, suggesting that design optimizations can mitigate the impacts of friction to some extent. Further research is required to quantify the expected friction of the envisioned ball screw drive-train experimentally.
We analyzed the maximum stroke versus its limitations to ensure the validity of the results obtained from the linear models. The importance of staying within operational constraints for survivability will be the subject of future studies.
Our simulations confirmed that while a well matched PTO is desirable for maximizing average power, intentionally mismatching the load impedance by increasing the control damping beyond optimal values for power conversion provides an avenue to reduce the operating stroke. When moving closer to real word implementation, it is essential to consider the trade-offs between power output and stroke limitations.
Furthermore, our broadly-applicable findings regarding control damping versus friction illustrate that both factors contribute similarly to resistance against relative velocity, impacting power transmission and efficiency. The distinction in output power transmission coefficients emphasized that a poorly matched controller can lead to significant deficits in electrical power conversion, as absorbed power fails to effectively enter the load. The results of the different sections are summarized in Table 4.
Future work will immediately focus on more detailed design studies, decreasing uncertainty in the input variables and increasing the parameter space through bench testing of components and pier testing of the combined PTO system in an empty tube. Looking ahead, future research directions include modeling nonlinear dynamics the design of nonlinear feedback controllers that increase the damping more than proportionally when approaching the stroke limitations.
In conclusion, this study enhances our understanding of PTO systems in wave energy converters (to some extend in general) and lays the groundwork for future research and development aimed at improving the mission capabilities of the X-Spar buoy.

Author Contributions

Cconceptualization, D.T.G., R.G.C., G.B. and J.T.; methodology, D.T.G., R.G.C. and G.B.; software, D.T.G. and R.G.C.; validation, D.T.G. and G.B.; formal analysis, D.T.G.; investigation, D.T.G.; resources, R.G.C., G.B., T.L., P.F., U.A.K. and J.T.; data curation, D.T.G.; writing—original draft preparation, D.T.G.; writing—review and editing, D.T.G., R.G.C., G.B., T.L., P.F., U.A.K. and J.T.; visualization, D.T.G.; supervision, R.G.C. and J.T.; project administration, D.T.G., R.G.C. and J.T.; funding acquisition, R.G.C., U.A.K. and J.T. All authors have read and agreed to the published version of the manuscript.

Funding

This research was supported by the U.S. Department of Energy’s Water Power Technologies Office. Sandia National Laboratories is a multi-mission laboratory managed and operated by National Technology and Engineering Solutions of Sandia, LLC., a wholly owned subsidiary of Honeywell International, Inc., for the U.S. Department of Energy’s National Nuclear Security Administration under contract DE-NA0003525. This paper describes objective technical results and analysis. Any subjective views or opinions that might be expressed in the paper do not necessarily represent the views of the U.S. Department of Energy or the United States Government.

Data Availability Statement

Data and models are available upon request.

Acknowledgments

The authors would like to thank Alicia Keow for writing the original optimization problem for the Y i 2 system identification and Jantzen Lee for advise on hardware components.

Conflicts of Interest

The authors declare no conflicts of interest.

Appendix A. Sankey Power Flow Diagram Calculations

The calculation of the numeric values found in the Sankey power flow diagrams in Figure 12 is summarized in Table A1. The first three rows shall only be used as references and not design objectives and are thus illustrate with a more transparent background. They assume optimal control for maximizing the absorbed power from the waves, which is mechanical power. The interested reader is referred to Falnes’ book on Ocean Waves and oscillating Systems chapter 6.3 [34]. These benchmark quantities only dependent on the potential wave-body interactions, but do not consider the PTO dynamics. Generally, the optimal WEC-PTO-control configuration for average electrical power is distinct from the design maximizing the mechanical power. The actual average power flows obtained for every single configuration considered in this work are excitation power, radiated power, absorbed power, mechanical power, PTO-loss power, and electrical power.
Table A1. WEC-Spar average power calculation for the quantities found in Sankey diagrams in Figure 12.
Optimal excitation = 2× max. absorbed P ¯ exc opt = 2 P ¯ abs max = 2 | F eq , e x c | 2 8 { Z eq , e x c }
Deficit absorbed P ¯ Δ abs = P ¯ abs max P ¯ abs
Deficit radiated P ¯ Δ rad = ( P ¯ exc opt P ¯ exc ) Deficit Excitation P ¯ Δ abs
Excitation P ¯ exc = 1 2 { F eq , e x c Δ v * }
Radiated P ¯ rad = 1 2 { Z eq , e x c } Δ v Δ v *
Absorbed P ¯ abs = P ¯ exc P ¯ rad
Mechanical P ¯ mech = 1 2 { F pto v * }
PTO-loss P ¯ loss = P P ¯ mech
Electrical P = 1 2 { o u t I o u t * }

References

  1. Stammer, D.; Bracco, A.; AchutaRao, K.; Beal, L.; Bindoff, N.L.; Braconnot, P.; Cai, W.; Chen, D.; Collins, M.; Danabasoglu, G.; et al. Ocean Climate Observing Requirements in Support of Climate Research and Climate Information. Front. Mar. Sci. 2019, 6, 444. [Google Scholar] [CrossRef]
  2. Stephens, G.L.; Li, J.; Wild, M.; Clayson, C.A.; Loeb, N.; Kato, S.; L’Ecuyer, T.; Stackhouse, P.W.; Lebsock, M.; Andrews, T. An update on Earth’s energy balance in light of the latest global observations. Nat. Geosci. 2012, 5, 691–696. [Google Scholar] [CrossRef]
  3. Graber, H.C.; Terray, E.A.; Donelan, M.A.; Drennan, W.M.; Leer, J.C.V.; Peters, D.B. ASIS—A New Air-Sea Interaction Spar Buoy: Design and Performance at Sea. J. Atmos. Ocean. Technol. 2000, 17, 708–720. [Google Scholar] [CrossRef]
  4. Davis, R.E.; Talley, L.D.; Roemmich, D.; Owens, W.B.; Rudnick, D.L.; Toole, J.; Weller, R.; McPhaden, M.J.; Barth, J.A. 100 Years of Progress in Ocean Observing Systems. Meteorol. Monogr. 2019, 59, 3.1–3.46. [Google Scholar] [CrossRef]
  5. Clayson, C.A.; Edson, J.B.; Toole, J.M. Observing Air-Sea Exchange with a Free-Drifting Spar Buoy; Technical Report; Woods Hole Oceanographic Institution: Woods Hole, MA, USA, 2014; Available online: https://geo-prose.com/pdfs/alps/Clayson.pdf (accessed on 16 December 2024).
  6. Zimmerman, M.T.; Jayne, S.R.; Rainville, L.; Lee, C.M.; Toole, J.M.; Edson, J.B.; Clayson, C.A.; Ekholm, A.K.; Densmore, C.R. Observations of the Upper Ocean from Autonomous Platforms During the Passage of Extratropical Cyclone Epsilon (2020). Oceanography 2024, 37, 48–57. [Google Scholar] [CrossRef]
  7. Cronin, M.; Bourassa, M.; Clayson, C.; Edson, J.; Fairall, C.; Feely, R.; Harrison, D.; Josey, S.; Kubota, M.; Kumar, B.; et al. White Paper #11—Wind Stress and Air Sea Fluxes Observations: Status, Implementation and Gaps. In Report of the Tropical Pacific Observing System 2020 Workshop (TPOS 2020); Technical Report GCOS Report 184; Scripps Institution of Oceanography: La Jolla, CA, USA, 2014. [Google Scholar]
  8. Hara, T.; Sullivan, P.P. Wave Boundary Layer Turbulence over Surface Waves in a Strongly Forced Condition. J. Phys. Oceanogr. 2015, 45, 868–883. [Google Scholar] [CrossRef]
  9. Robertson, T.; Simonsen, J. Challenges and Opportunities in Contemporary Participatory Design. Des. Issues 2012, 28, 3–9. [Google Scholar] [CrossRef]
  10. Copping, A.; LiVecchi, A.; Spence, H.; Gorton, A.; Jenne, S.; Preus, R.; Gill, G.; Robichaud, R.; Gore, S. Maritime renewable energy markets: Power from the sea. Mar. Technol. Soc. J. 2018, 52, 99–109. [Google Scholar] [CrossRef]
  11. LiVecchi, A.; Copping, A.; Jenne, D.; Gorton, A.; Preus, R.; Gill, G.; Robichaud, R.; Green, R.; Geerlofs, S.; Gore, S.; et al. Powering the Blue Economy: Exploring Opportunities for Marine Renewable Energy in Maritime Markets; Technical Report; U.S. Department of Energy, Office of Energy Efficiency and Renewable Energy: Washington, DC, USA, 2019.
  12. Cavagnaro, R.J.; Copping, A.E.; Green, R.; Greene, D.; Jenne, S.; Rose, D.; Overhus, D. Powering the Blue Economy: Progress Exploring Marine Renewable Energy Integration With Ocean Observations. Mar. Technol. Soc. J. 2020, 54, 114–125. [Google Scholar] [CrossRef]
  13. McLeod, I.; Ringwood, J.V. Powering data buoys using wave energy: A review of possibilities. J. Ocean. Eng. Mar. Energy 2022, 8, 417–432. [Google Scholar] [CrossRef]
  14. Lindroth, S.; Leijon, M. Offshore wave power measurements—A review. Renew. Sustain. Energy Rev. 2011, 15, 4274–4285. [Google Scholar] [CrossRef]
  15. Xu, R.; Wang, H.; Xi, Z.; Wang, W.; Xu, M. Recent progress on wave energy marine buoys. J. Mar. Sci. Eng. 2022, 10, 566. [Google Scholar] [CrossRef]
  16. Vella, N.; Foley, J.; Sloat, J.; Sandoval, A.; D’Attile, L.; Masoumi, M. A Modular Wave Energy Converter for Observational and Navigational Buoys. Fluids 2022, 7, 88. [Google Scholar] [CrossRef]
  17. Harms, J.; Hollm, M.; Dostal, L.; Kern, T.A.; Seifried, R. Design and optimization of a wave energy converter for drifting sensor platforms in realistic ocean waves. Appl. Energy 2022, 321, 119303. [Google Scholar] [CrossRef]
  18. Wang, L.; Li, H.; Jiang, J. A high-efficiency wave-powered marine observation buoy: Design, analysis, and experimental tests. Energy Convers. Manag. 2022, 270, 116154. [Google Scholar] [CrossRef]
  19. Dizon, C.; Cavagnaro, R.J.; Robertson, B.; Brekken, T.K. Modular horizontal pendulum wave energy converter: Exploring feasibility to power ocean observation applications in the U.S. pacific northwest. IET Renew. Power Gener. 2021, 15, 3354–3367. [Google Scholar] [CrossRef]
  20. Li, Y.; Ma, X.; Tang, T.; Zha, F.; Chen, Z.; Liu, H.; Sun, L. High-efficient built-in wave energy harvesting technology: From laboratory to open ocean test. Appl. Energy 2022, 322, 119498. [Google Scholar] [CrossRef]
  21. Coe, R.; Lee, J.; Bacelli, G.; Spencer, S.; Dullea, K.; Plueddemann, A.; Buffitt, D.; Reine, J.; Peters, D.; Spinneken, J.; et al. Pioneer WEC Concept Design Report; Sandia National Laboratories: Albuquerque, NM, USA, 2023. [Google Scholar] [CrossRef]
  22. Lin, M.; Yang, C. Ocean observation technologies: A review. Chin. J. Mech. Eng. 2020, 33, 32. [Google Scholar] [CrossRef]
  23. Schofield, O.; Kohut, J.; Aragon, D.; Creed, L.; Graver, J.; Haldeman, C.; Kerfoot, J.; Roarty, H.; Jones, C.; Webb, D.; et al. Slocum gliders: Robust and ready. J. Field Robot. 2007, 24, 473–485. [Google Scholar] [CrossRef]
  24. Daniel, T.; Manley, J.; Trenaman, N. The Wave Glider: Enabling a new approach to persistent ocean observation and research. Ocean. Dyn. 2011, 61, 1509–1520. [Google Scholar] [CrossRef]
  25. Ullman, D.G. The Mechanical Design Process: Part 2; McGraw-Hill: Columbus, OH, USA, 2010. [Google Scholar]
  26. Weber, J.; Costello, R.; Ringwood, J.V. WEC technology performance levels (TPLs)- metric for successful development of economic WEC technology. In Proceedings of the 10th European Wave and Tidal Energy Conference, Aalborg, Denmark, 2–5 September 2013. [Google Scholar]
  27. Korde, U.A.; Gish, L.A.; Bacelli, G.; Coe, R.G. Wave energy conversion using a small tubular free-floating device. J. Ocean. Eng. Mar. Energy 2024, 10, 57–69. [Google Scholar] [CrossRef]
  28. Bacelli, G.; Coe, R.; Patterson, D.; Wilson, D. System Identification of a Heaving Point Absorber: Design of Experiment and Device Modeling. Energies 2017, 10, 472. [Google Scholar] [CrossRef]
  29. Falnes, J. Wave-Energy Conversion Through Relative Motion Between Two Single-Mode Oscillating Bodies. J. Offshore Mech. Arct. Eng. 1999, 121, 32–38. [Google Scholar] [CrossRef]
  30. Olaru, D.; Puiu, G.C.; Balan, L.C.; Puiu, V. A New Model to Estimate Friction Torque in a Ball Screw System. In Product Engineering: Eco-Design, Technologies and Green Energy; Talabă, D., Roche, T., Eds.; Springer: Dordrecht, The Netherlands, 2005; pp. 333–346. [Google Scholar] [CrossRef]
  31. Qiu, Y.L.; Zhou, C.G.; Feng, F.T.; Zhang, L.C. The influence of temperature rise on the friction torque of ball screw during low speed operation. Results Phys. 2023, 51, 106703. [Google Scholar] [CrossRef]
  32. Skrovanek, D.; Brekken, T. Impact of Biofouling on Point Absorber Wave Energy Converter Performance and Control. In Proceedings of the 2024 American Control Conference (ACC), Toronto, ON, Canada, 8–9 July 2024; pp. 3328–3333. [Google Scholar] [CrossRef]
  33. Coe, R.G.; Bacelli, G.; Gaebele, D.; Keow, A.; Forbush, D. Co-Design of a Wave Energy Converter Through Bi-Conjugate Impedance Matching. SSRN, 2024; preprint. [Google Scholar] [CrossRef]
  34. Falnes, J. Ocean Waves and Oscillating Systems: Linear Interactions Including Wave-Energy Extraction; Cambridge University Press: Cambridge, UK, 2002. [Google Scholar]
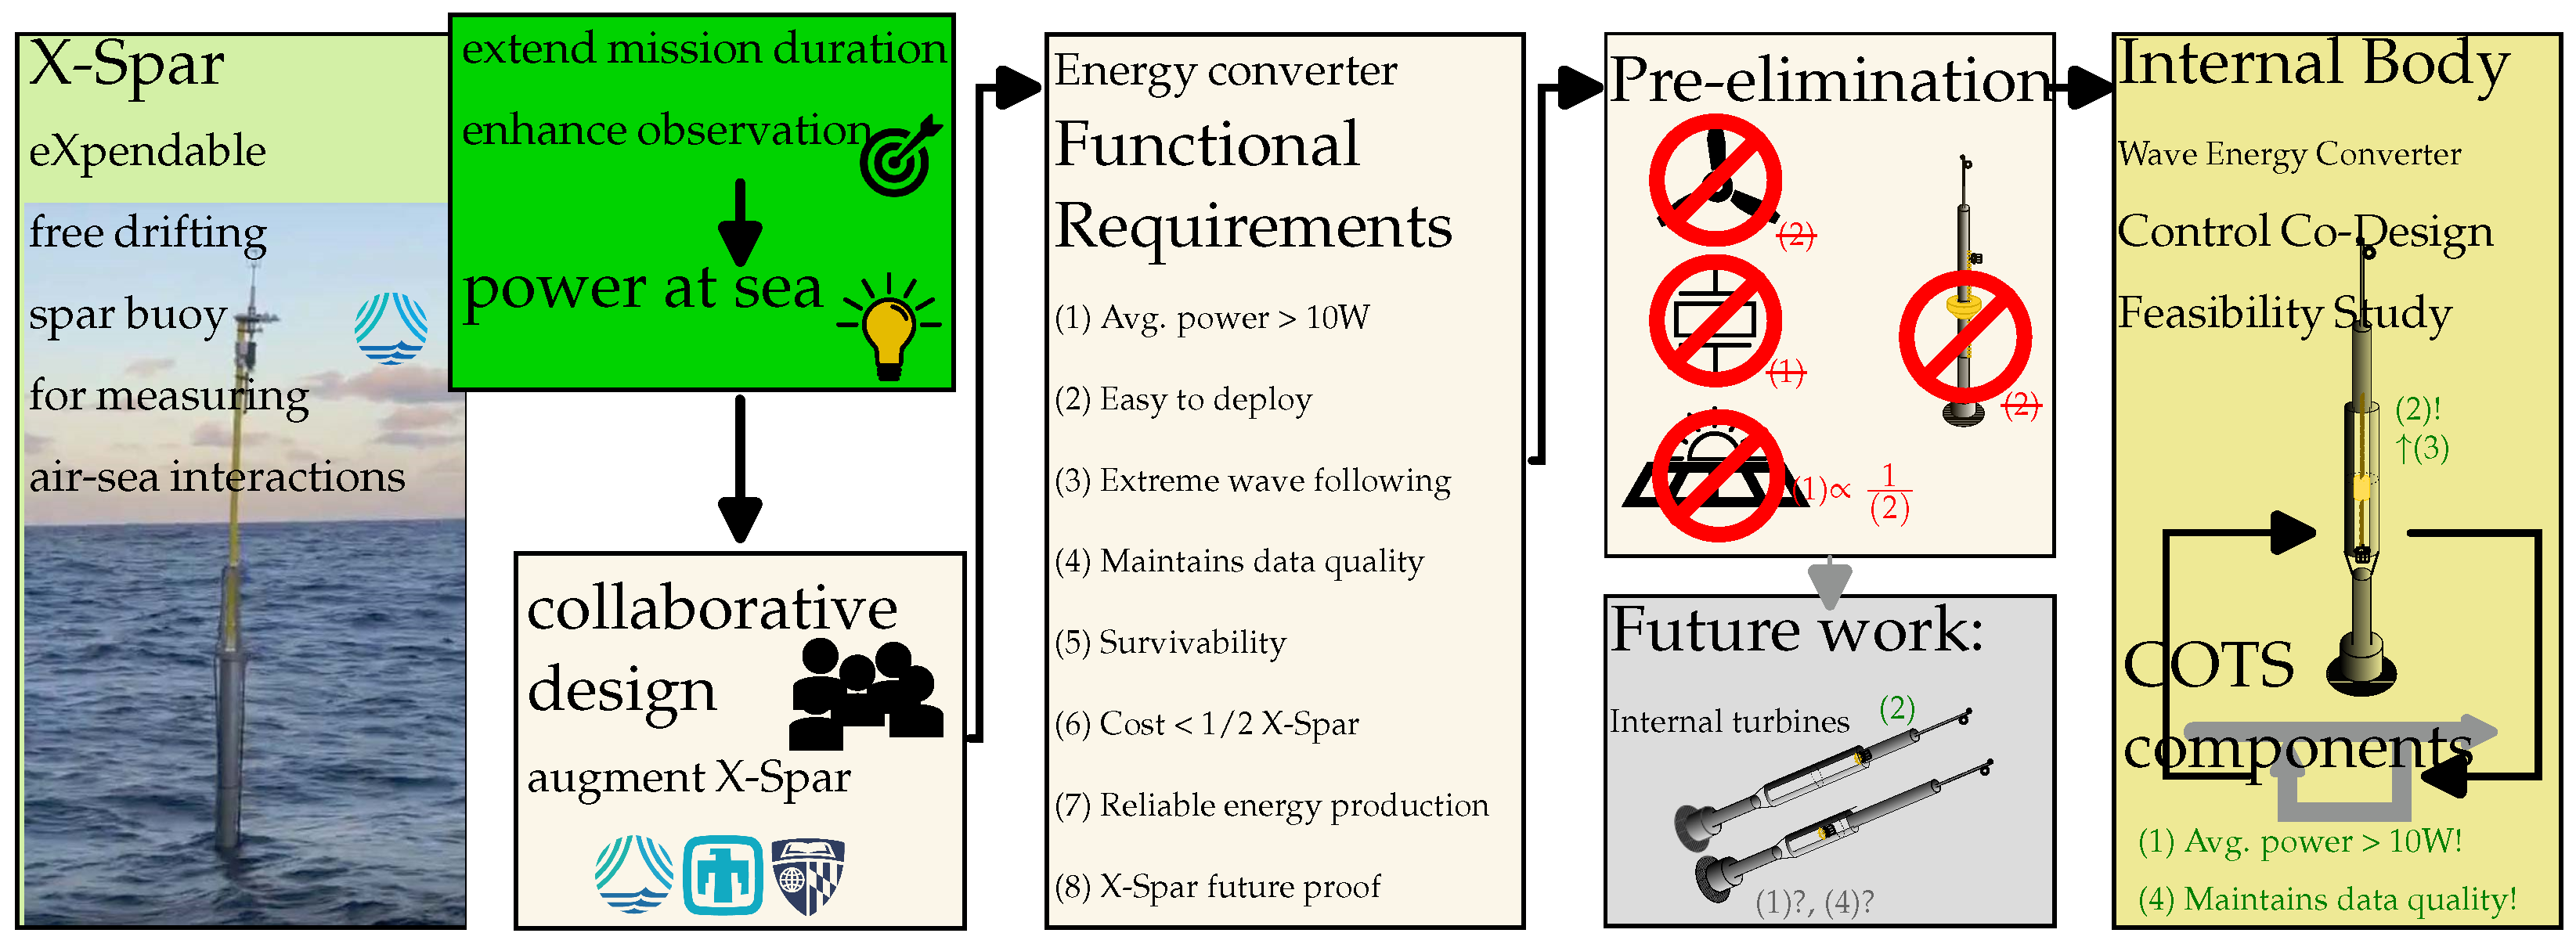
Figure 1. Visual overview of the study. From left to right, a photograph of the deployed X-Spar and the objective of enhancing its mission through power generation at sea. This objective initiated a collaborative design effort to establish the functional requirements for an energy converter, as detailed in this manuscript. Following this, several concepts were pre-eliminated based on these requirements. The feasibility of an internal body wave energy converter, referred to as the WEC-Spar, is examined and confirmed in the second part of this work, utilizing commercial off-the-shelf components within the dynamic models using control co-design methods. Future research will also focus on internal turbines that successfully passed the pre-elimination phase.
Energies 18 04442 g001
Figure 2. Early WEC design concepts considered. Modifications to the X-Spar center section expose the inside to ocean water and the atmosphere. From left to right: External Body—unchanged X-Spar with torus-shaped float connected to generator; Internal Body—modified X-Spar with internal floating body connected to generator (above water or submerged); Internal Air Turbine—modified X-Spar with air turbine and generator above water; Internal Water Turbine—modified X-Spar with submerged water turbine and generator.
Energies 18 04442 g002
Figure 3. Map of design sites with median wave power. This study focuses on the Sargasso Sea, which has the smallest wave resource, providing a conservative estimate for power conversion capabilities. Future study sites include Tuvalu, Central Bering Sea, and the Southern Ocean, which may require different hardware and controller gains.
Energies 18 04442 g003
Figure 4. Averaged weekly wave conditions in the Sargasso Sea south of Bermuda from National Data Buoy Center (NDBC) buoy #41049. Data is averaged over 14 years, from 2009 to 2023.
Energies 18 04442 g004
Figure 5. Schematic representation of the systems: the original system, X-Spar, is shown on the left, while the augmented system, “WEC-Spar”, incorporating a power take-off module for capturing ocean wave energy, is depicted on the right. Design optimization variables include the cylinder radius r c , the cylinder draft d c , the drive-train friction b d , the linear to rotary gear ratio N, and the control impedance. The maximal stroke s m a x is a hardware constraint.
Energies 18 04442 g005
Figure 6. Averaged power spectral density (PSD) of the onboard X-Spar data (a) to identify the X-Spar squared intrinsic admittance ( Y i 2 ) (b) and the corresponding intrinsic impedance ( Z i ) with sensitivity to the heave damping coefficient ( b f ) (c).
Energies 18 04442 g006
Figure 7. Intrinsic impedance Bode diagram of the identified system from the X-Spar deployment, the tuned X-Spar BEM response, and the same tuning applied to the BEM results of the altered WEC-Spar geometries for different cylinder radii ( r c , compare Figure 5).
Energies 18 04442 g007
Figure 8. Equivalent hydrodynamic impedance Z eq Bode diagram observed at the PTO of the WEC-Spar system for different geometry dimensions.
Energies 18 04442 g008
Figure 9. Visualization of the WEC-Spar control co-design study structure.
Energies 18 04442 g009
Figure 10. Weekly average power for enforced drive-train friction coefficient b d and two distinct control approaches (damping control and numerically optimal control). The legend labels indicate the sub-optimal configuration for the respective friction and control.
Energies 18 04442 g010
Figure 11. Weekly averaged power and 90th percentile of the maximal observed stroke for three sub-optimal configurations to stay within three distinct values of PTO stroke s m a x . The levels of PTO stroke limit are illustrated with the dashed lines.
Energies 18 04442 g011
Figure 12. Illustration of the impact of increased PTO damping on velocity, power transmission, PTO stroke, and electrical power conversion shown through performance metrics (top) and Sankey average power flow diagrams (bottom, refer to Appendix A). Increasing the control damping (beyond the optimal value for maximizing average electrical power) causes power reflection within the PTO (top right axis) resulting in reduced electrical power (middle right axis) but increased total absorbed power (Sankey diagrams), while decreasing the WEC motion (left axes).
Energies 18 04442 g012
Figure 13. Illustration of the impact of control damping versus drive-train fiction based on power, power transmission coefficients, and efficiencies. While added friction and unnecessarily high damping show similar trends, the output transmission coefficient highlights that a bad controller mostly causes deficits in electrical power because the power cannot enter the load.
Energies 18 04442 g013
Figure 14. Annual battery energy trajectories with maximum average sensor draw P ¯ sen to sustain operation for an entire year for different deployment starts. The dash-dotted lines illustrate the rate at which the battery would be depleted assuming the increased sensor draw, but no additional generation.
Energies 18 04442 g014
Figure 15. Different metrics for variable sea states for the optimal configuration for South Bermuda staying within the stroke constraints for the mean annual conditions. (a) Average power, (b) 90th percentile of the maximal WEC-Spar velocity, (c) 90th percentile of the maximal PTO stroke, and (d) the difference between WEC-Spar and X-Spar 90th percentile maximal velocity (positive values indicate WEC-Spar velocity > X-Spar velocity.)
Energies 18 04442 g015
Table 1. WEC design requirements and ratings. Less important requirements are indicated with less tinted background color.
RequirementImportanceRequirementImportance
(1) Produce average power above 10 wattVery High(5) Mechanical survivabilityHigh
(2) Easy to deployVery High(6) WEC cost less than 50% X-Spar CapExHigh
(3) Ability to follow waves in extreme seasVery High(7) Reliable energy productionMedium
(4) Does not negatively impact data qualityVery High(8) Integrate into future X-Spar iterationsMedium
Table 2. Practical engineering concerns for different WEC archetypes powering the X-Spar buoy. Positive impacts are colored green (dark) and negative impacts yellow (light).
Follow Extreme WavesMoving PartsImpact CB/CGFatigue ( 5 × 10 6 Cycles)Stiction
External bodyWave following if locked or actively controlledPrimary mover and drive-trainNo impactSurvivability issue before fatigueRack and pinion issue, gear ratio trade-off between generator size and cogging force
Internal bodyAids wave following if locked or actively controlledPrimary mover and drive-trainNo impactFatigue needs to be considered for designRack and pinion issue, gear ratio trade-off between generator size and cogging force
Internal air turbineNo impactLeast moving partsNegative on CB-CGLess issues if adequate bearingsLow stiction: same rotational direction
Water turbineNo impactDepends on rectificationNo or little impactDepends on type of rectificationLow stiction: same rotational speed
Table 3. WEC and PTO design parameter space.
Parameter Value Range
Radius cylinder r c 0.1 and 0.15 m
D r a f t   c y l i n d e r d c 0.1, 0.15 and 0.2 m
F r i c t i o n   c o e f f i c i e n t b d 0.0001, 0.005, 0.01 and 0.05 N   m   s / rad
B a l l   s c r e w   g e a r   r a t i o N55, 60, 65 and 70 rad / m
C o n t r o l   i m p e d a n c e Copt. damping C P or numerically optimal controller C opt
Table 4. Summary table outlining the various sections and figures, emphasizing key configurations and significant results and the considered time frame for each.
Section 4.2 Sensitivity to drive-train friction b d
Figure 10Optimal configuration with optimized damping control:week W
b d = 0.001   N   m   s / rad , N = 60 , d c = 0.1   m , r c = 0.15   m .
Increased drive-train friction sub-optimal configuration with optimized damping control:
b d = 0.005   N   m   s / rad , N = 65 , d c = 0.15   m , r c = 0.15   m .
Section 4.3 Stroke limitations.
Figure 11Configuration that is naturally within stroke limitations:week W
b d = 0.005   N   m   s / rad , N = 65 , d c = 0.15   m , r c = 0.15   m .
Section 4.4 Stroke limitations with control.
Figure 12Config: b d = 0.005   N   m   s / rad , N = 65 , d c = 0.15   m , r c = 0.15   m .week 10
From optimal k p = 0.175   A   s / rad to k p = 0.35   A   s / rad decreases stroke by 27% and average power by 17%.
Section 4.5 Control damping versus friction.
Figure 13Config: b d = 0.005   N   m   s / rad , N = 65 , d c = 0.15   m , r c = 0.15   m .week 10
Comparing k p = 0.175   A   s / rad with k p = 0.35   A   s / rad , and with b d = 0.05   N   m   s / rad & C P qualitatively.
Section 4.6 Annual deployment.
Figure 14 b d = 0.005   N   m   s / rad , N = 65 , d c = 0.15   m , r c = 0.15   m & C P ( W ) .week W
The sub-optimal configuration would allow an average sensor power draw between 15.2 W to 16.2 W .
Section 4.7 WEC-Spar total metrics.
Figure 15 b d = 0.005   N   m   s / rad , N = 65 , d c = 0.15   m , r c = 0.15   m & C P ( H s ,   T e ) H s , T e
Average power, max. velocity, max. stroke, and difference between X-Spar and WEC-Spar velocity for variable sea states.
Disclaimer/Publisher’s Note: The statements, opinions and data contained in all publications are solely those of the individual author(s) and contributor(s) and not of MDPI and/or the editor(s). MDPI and/or the editor(s) disclaim responsibility for any injury to people or property resulting from any ideas, methods, instructions or products referred to in the content.