Abstract
As the installed power of wind turbines increases, new challenges for the implementation of wind energy in the national power system emerge. Several hours of high energy productivity from wind turbines, together with the periodic occurrence of relatively low energy consumption (at a national scale), sometimes result in the need to stop their operation and, much more often, result in very low revenues for electricity. One of the ways to reduce these phenomena, from a technical and economic point of view, is to use energy storage. However, managing such energy storage poses many challenges due to the unpredictably different duration of favorable and unfavorable wind conditions. Based on historical data on wind turbine energy generation and market data on electricity prices, the impact of using an energy storage with an effective capacity of 2.4 MWh (total 4 MWh) with a maximum charging and discharging power (set parameter) of 1.2 MW in cooperation with a wind turbine (capacity 3 MW) was analyzed. Using simulation methods for energy production and price data from 34,964 h (4 years), the potential additional revenue for the energy storage installed at the wind turbine was calculated. The developed model considered various values: minimum charging power, maximum charging power; and as elements of price signals: price averaging period, level of price deviation from the average electricity price.
1. Introduction
Over the past few years, electricity prices have been rising significantly. Additionally, a recurring phenomenon is the co-occurrence of relatively lower electricity prices with high volumes of wind power generation. Figure 1 illustrates electricity prices for the period 2021–2024 in the Day-Ahead Market (DAM), while Figure 2 shows the relationship between electricity prices and hourly wind power generation values. Since 2023, prices have increasingly approached or even fallen below zero during periods of high wind turbine generation. This observation inspired an investigation into whether the application of an energy storage system alongside a wind turbine could lead to increased revenues from a combined wind turbine and energy storage installation.
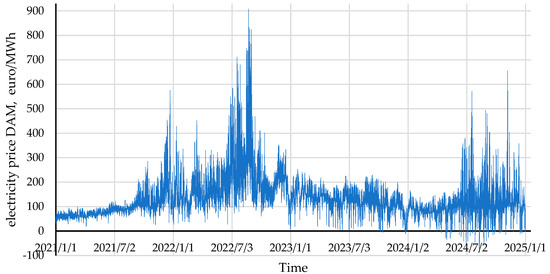
Figure 1.
Day-Ahead Market electricity price from January 2021 to December 2024. Source: own study based on [1].
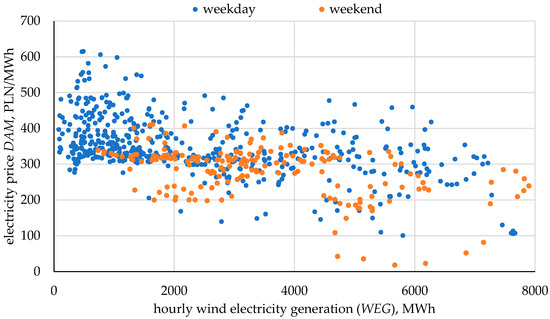
Figure 2.
An example of the dependence of energy prices on the volume of energy produced by wind turbines—March 2024. Source: own study based on [1,2].
An energy storage facility can be a way of storing energy until low wind conditions and/or higher electricity prices occur, as demonstrated by Olczak [3] for a 1 MWp PV farm. Piwowar et al. [4] analyzed the operating conditions of wind turbines in relation to windiness, as well as the operating conditions of other renewable energy sources, for the development of low-emission technologies in Poland and its southern neighboring countries. Canales et al. [5] examined long-term changes, including wind speed variations over several decades, for areas such as that of Poland. This has key implications for assessing the potential of these technologies in Poland, particularly in addressing the research question of whether productivity potential is increasing or decreasing in the long term.
Danish et al. analyzed the application of solar and wind energy to meet national-scale energy demands. In their study, they applied machine learning methods and assessed the opportunities and threats associated with the development of these technologies, especially in the context of the growing prevalence of electric vehicles, which represent a rising share of energy consumption. In the machine learning domain, the focus was on improving the efficiency of both direct and indirect use of energy generated by wind turbines and photovoltaic systems [6].
Komorowska and Olczak [7] investigated the application of energy storage in the context of arbitrage profitability. Their results on the economic viability of such systems across different European energy markets were based on a highly optimistic scenario, assuming full foresight of market prices and ideal power-to-capacity ratios. They demonstrated that, even under such favorable assumptions, economic viability remains distant [7]. Furthermore, non-market re-dispatching—such as curtailment of energy production from photovoltaic or wind sources [8]—also undermines the profitability potential of energy storage by reducing occurrences of extremely low or negative electricity prices.
Subsidy programs by the National Fund for Environmental Protection and Water Management (NFOS) [9] may contribute in the future to increasing storage capacities. However, they may also act as barriers to the development of flexible generation sources—such as gas-fired cogeneration—in the capacity market [10]. Another flexibility approach involves linking energy storage with demand-side response strategies for utilizing renewable energy, as demonstrated by Díaz-Bello et al. [11], who also explored energy management forecasting. Manso-Burgos et al. examined energy storage requirements depending on the structure and installed units in local energy communities [12].
Sánchez et al. [13] studied three renewable energy systems (wind, PV, biomass) and demonstrated their efficiency in cooperation with four different storage technologies (battery, hydrogen, methane, and ammonia) in selected Spanish case studies. Their results addressed both economic and social dimensions, identifying threshold values for the profitability of various technology combinations. However, their study did not incorporate long-term historical market and production data [13]. The Spanish context, characterized by installed capacities three times higher than those in Poland, was previously explored by Segura-Heras [14].
Msigwa et al. [15] demonstrated how increased deployment of wind energy—primarily through installed capacity—can contribute to reductions in greenhouse gas emissions. They also identified various challenges associated with wind energy production, including current technical and economic barriers.
Ligęza et al. [16] proposed an innovative approach for centralized hydrogen production using offshore wind farms (e.g., a 600 MW example), highlighting technical and economic barriers as well as challenges related to electrolyzer selection. These findings align with the broader discussion on energy storage profitability—whether in lithium-ion batteries or pumped hydro storage facilities. In this context, Bartela et al. [17] analyzed a compressed air energy storage (CAES) system, achieving a round-trip efficiency of 70.44% and a storage capacity of up to 140 MWh. However, they did not consider market conditions or smaller-scale wind turbines [17]. Kulpa et al. [18] further analyzed gravitational energy storage systems, concluding that operational costs remain high, which questions their profitability even under favorable price scenarios.
Wyrobek et al. assessed financial aspects of wind energy investments. Their 2021 publication was based on pre-2022 energy price levels, when the levelized cost of electricity (LCOE) for wind turbines [19] was slightly above average market prices, which posed a barrier to investment [20]. At that time, market factors were not strongly influenced by short-term wind productivity variations. Today, although average electricity prices are relatively attractive, high wind energy production volumes—especially outside the evening demand peak—often lead to prices near or below zero.
Szostok and Stanek [21] analyzed solar and wind energy technologies (classified as Variable Renewable Energy, VRE) and assessed configurations in which these technologies could be considered reasonably stable energy sources for diverse applications in Katowice, Poland—such as hydrogen production for fuel cell vehicles, as shown by Stecuła et al. [22]. Chomać-Pierzecka et al. [23] conducted a literature review of various market aspects of wind energy in Poland and Lithuania. They highlighted both economic and technical factors relevant to micro- and macro-level development of installed renewable energy capacity. Żołądek et al. [24] analyzed a microgrid consisting of a wind turbine, PV installations, biomass gasification, and hydrogen-based storage using dynamic TRNSYS simulations. Their findings compared different implementation levels for a city in Poland and another in Greece, showing varying degrees of energy autonomy. In isolated systems—such as those in Mediterranean islands—there is a strong need for such solutions, emphasizing the importance of technological advancement [25,26]. Gajewski and Pieńkowski demonstrated how cooperation between solar and wind energy with battery storage can satisfy energy demands. They focused on technical aspects of wind turbine and PV energy generation [27]. Emrani and Berrada [28] analyzed various aspects of wind and PV systems integrated with gravitational energy storage systems involving lifting and lowering of weights by tens-of-meters. They identified certain economic advantages of this approach, despite the lack of long-term data analyses, though technical efficiency was shown to be high.
Aazami et al. [29] studied the use of energy storage in microgrids to mitigate variability in wind energy production. These fluctuations are caused by wind speed variability, and the analysis was conducted using MATLAB-based simulations, https://www.mdpi.com/2071-1050/14/10/6183 (accessed on 8 August 2025). Silva de Siqueira and Peng [30] demonstrated that battery energy storage is the most effective solution to reduce fluctuations in wind energy production. Proper sizing of the storage system, based on short-term production forecasts, is essential for effective energy management. Mitali et al. [31] explored how energy storage, in conjunction with various energy markets and generation sources, could contribute to reducing global CO2 emissions. They critically reviewed the development of energy storage technologies from the mid-19th century to the present.
Dadashi et al. demonstrated that the sale of energy generated from wind turbines typically occurs at a price lower than the average market price. A method to increase revenue is to utilize energy storage. In their research, they showed the economic effect of combining multiple producers and energy storage owners into a virtual power plant (VPP). Using stochastic processes, energy sales schedules are chosen in the form of bids on the Day-Ahead Market (DAM) [32]. For VPPs, a research problem exists in scheduling due to price uncertainty and the uncertainty of energy production from wind turbines. A solution in this area, in the form of a multi-component management system with optimized utilization of energy resources and consideration of uncertainty related to the VPP called upon by the system operator to activate reserves, was presented by Baringo et al. [33].
Khosravi et al. demonstrated the impact of wind turbine participation on the DAM using different types of bidding schedules, implemented with linear programming-based energy management. Scenarios for generating bids on the DAM for a hybrid wind turbine and energy storage system are realized using the Monte Carlo method. Importantly, this is carried out while considering the maximum set input and output powers [34]. Yang et al. performed revenue maximization for wind farms on the DAM using optimization methods, and also for the case of cooperation between wind turbines and a shared energy storage resource [35].
There is currently a lack of analyses that account for time spans of several days—or more significantly, years—based on large datasets consisting of tens of thousands of hourly energy production values and electricity market prices. Based on the literature collected, there is also limited research presenting truly optimal strategies for co-located wind-storage arbitrage under real market conditions. Comprehensive reviews and case studies of optimal operation strategies remain scarce. For example, despite recent works introducing rolling-horizon optimization frameworks, these are typically limited to short-term scenarios or hypothetical input data research [36]. Few studies combine long multi-year datasets, realistic price dynamics including negative pricing, and algorithmic strategy design applied to single-site configurations. The applicability of charging strategies and their dependence on economic viability has also not been adequately addressed in the literature. Additionally, an original algorithm for controlling the charging and discharging process was proposed.
2. Materials and Methods
The primary objective of this study was to evaluate the operational efficiency of a wind turbine integrated with a battery energy storage system (BESS). The effectiveness of this configuration was compared against a reference scenario involving a standalone wind turbine without energy storage.
In the non-storage scenario, the electricity generated by the wind turbine was directly fed into the market and sold at prices from the Polish Power Exchange (Towarowa Giełda Energii, TGE). Electricity price variability was determined based on market data—specifically, hourly prices from the Day-Ahead Market () index over the four-year period from 2021 to 2024, and denoted for each hour as .
Wind energy generation efficiency was determined using data from Polskie Sieci Elektroenergetyczne (PSE). For research purposes, this data was rescaled to the capacity of a 3 MW wind turbine (). Wind generation data () was sourced from ENTSO-E [2].
The maximum usable capacity of the battery storage system was set to 4 MWh, with a useful energy capacity of 2.4 MWh, corresponding to a state of charge () window from 20% to 80% of the total available capacity.
Below, we present the formulas and expressions used to estimate the technical and economic performance of the wind turbine and storage system, as implemented in the proposed research methodology.
Amount of wind energy generated in each hour is as follows:
where:
—hourly wind energy generation for wind turbine (capacity = ), kWh
—hourly wind energy generation to national grid—whole country scale, PSE data, MWh
—wind turbine capacity, 3 MW
—single and following hours in the period of years: January 2021–December 2024.
First estimation of the amount of energy available for storage is as follows:
where:
—energy generated by a wind turbine that is potentially technically storable, kWh.
—wind turbine energy generation in hourly scale, kWh.
—minimum of wind energy generation allowed to start energy charging process, kWh.
—maximum energy charging/discharging in hourly scale, kWh.
Minimum price threshold for initiating the charging process, assuming economic optimization of storage operation (triggered when the market price of electricity falls sufficiently low):
where:
—the amount of energy that can be stored from a wind turbine, taking into account the loading and unloading of the storage and the adopted limit values of the energy price, kWh
hourly mean of day-ahead market electricity price, euro/MWh;
—price averaging period (range in calculations: 10–72 h)
—factor price—deviation from the average market price of energy for the storage charging or discharging signal, %
—round trip efficiency for energy storage, 86%.
Averaging of electricity prices DAM by period :
First approximation of the maximum discharge potential of the storage system—energy quantity:
where:
—first estimation of energy discharge, kWh
—maximum of energy charging/discharging in hourly scale, kWh
Approximation of the amount of usable energy stored in the battery, expressed as the energy balance between time steps and , reflecting actual charging (from wind turbine generation) and discharging operations to the grid.
where:
—recent amount of energy stored in energy storage in hour , kWh
—energy storage balance approximation for hour and
Calculation of energy storage balance ():
where:
—is useful capacity included degradation ratio—Equation (7).
where:
—energy storage degradation ratio in yearly scale, 0.0155 per year [37,38]
—is maximum useful capacity 2.4 MWh (total capacity 4 MWh) for between 20 and 80%.
Estimation of the real value of charging energy:
where:
—charging efficiency: 0.95 [39]
Estimation of the real value of discharging process:
where:
—discharging efficiency 0.9 [40,41]
Income for wind turbine together with energy storage:
—energy consumption for energy storage devices: heating, cooling, ventilation, control system, fix for each hour 1.5 kWh per hour [42,43]
Income for wind turbine without energy storage:
The revenue effect, defined as the difference between the wind turbine operation scenario with energy storage and without storage, was estimated using the following formula:
where:
—difference in revenues of the turbine operation scenario with and without energy storage, in thousands of EUR
The block diagram of the research process, i.e., the energy management algorithm in the system integrated with a wind turbine and energy storage, is shown in Figure 3.
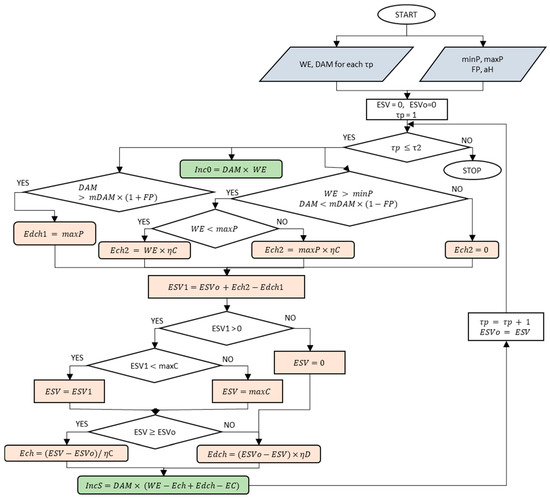
Figure 3.
Computational algorithm—block diagram. This simplified flowchart presents the logic behind the computations defined in Equations (1)–(11). Compared to the original equations, the representation of the stored energy from the previous hour was simplified: instead of , the variable was used to avoid repeating the time index (τp) throughout the flowchart. Source: authors’ own elaboration.
The algorithm was divided into six stages based on the type of operations performed:
Stage 1: Initialization
For each hour of the analyzed period (), the values of wind energy production (WE) and electricity price on the Day-Ahead Market (DAM) are assigned. Control variables are initialized: (energy in the storage for a given hour) and (energy at the beginning of the iteration). The time index is set as .
Stage 2: Input conditions for operational decisions
For each hour, revenue from the direct sale of wind energy to the grid is calculated as: .
Then, the market situation is evaluated against the average historical price (as in Equation (3)) and the charging/discharging conditions are verified:
If , discharging is allowed (i.e., market price is higher than the average), and Edch1 = maxP.
If and , charging is allowed. Depending on the available energy:
If , then
Otherwise:
In all other cases: (no charging from wind turbine generation).
Stage 3: Energy balance in the storage system
The energy balance is estimated based on Equation (5), using:
Then, storage capacity limits are assessed:
If , then (actual usable energy in the battery lies within operational range).
If , then , which means the storage is full and no energy is lost—charging is capped at the maximum capacity.
Stage 4: Determining actual charging/discharging volume, based on ESV calculated
Charging is defined as:
If , then
Discharging occurs if and is calculated as:
Stage 5: Final financial balance
The total revenue for a given hour is the sum of direct sale and storage operations revenue, calculated as:
where EC can be defined as the cost of keeping the storage system in an operational (ready-to-charge/discharge) state.
Stage 6: Iteration
The model proceeds to the next time step by incrementing the time variable () and updating the initial storage state ().
This process continues until , where corresponds to the total number of hours in the 4-year period (4 years × 365 days × 24 h).
Based on data on wind turbine energy production and electricity prices, and considering the control parameter values listed in Table 1, the algorithm performed hourly calculations over the last four years (2021–2024).

Table 1.
Parameters and their values included in the computational model and Equations (1)–(11).
For each hour, the algorithm determined the volume of energy directed to storage and the potential amount available for discharge, based on market price signals and turbine output levels. Subsequently, total revenues from energy sales were calculated for both scenarios—with and without energy storage.
The input data used in Equations (1)–(12) are presented in Table 1.
In total, combinations of computational scenarios were analyzed to identify those yielding the highest revenues—defined as revenues from energy sales with storage—in comparison to the baseline revenue of the wind turbine operating without energy storage ().
The calculations assumed market-based electricity sales at Day-Ahead Market (DAM) prices. Other market mechanisms such as Intraday Market (IDM) were not considered to have a significant impact [44].
Additionally number of charging and discharging calculated cycles NoC (based on amount of charged energy) is calculated by:
3. Results
The calculation results for variables (DAM, WE) for the sample 2 days are presented in Figure 4.
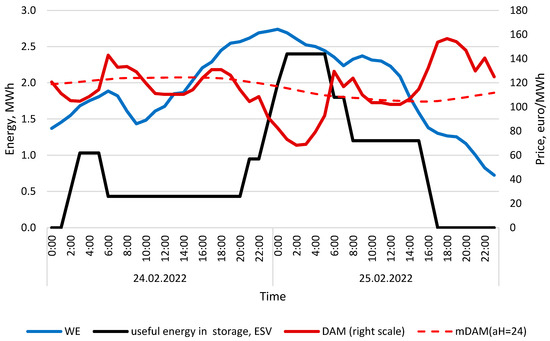
Figure 4.
Day-ahead electricity price (DAM) and 24-h mean of DAM, wind turbine energy generation and amount of useful energy in storage, calculated for 24 and 25 February 2022. Calculation conditions: minP′ = 100 kW, maxP′ = 600 kW, maxC = 2400 kWh, FP = 0.12, aH = 24. Source: own study.
The figure illustrates the relationship between the amount of energy stored in the battery, electricity market prices, and wind turbine generation. The average electricity price over the analyzed period was also calculated (based on period 24 h).
The two-day period under analysis was characterized by relatively high wind power productivity, mostly exceeding 50% of the capacity factor. Electricity price fluctuations ranged from €69/MWh to €157/MWh. The lowest electricity price was recorded during the night valley on 25 February 2022, while the highest prices occurred between 5:00 p.m. and 8:00 p.m. on the same day.
Higher wind energy generation was observed during the night of 24–25 February. The maximum state of charge of the storage system was reached between 1:00 a.m. and 5:00 a.m. Detailed information on the price signals and the exact start times of charging and discharging operations is provided in Figure 5.
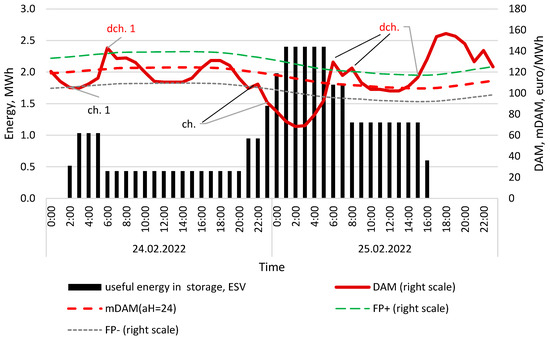
Figure 5.
Day-ahead electricity price (DAM) and 24-h mean of DAM () with range based on , wind turbine energy generation and amount of useful energy in storage, calculated for 24 and 25 February 2022. Calculation conditions: minP′ = 100 kW, maxP′ = 600 kW, maxC = 2400 kWh, FP = 0.12, aH = 24. Source: own study.
For signal (ch.1): at 2:00 a.m., a price signal was detected indicating that the electricity market price had dropped below the average by at least the predefined FP threshold. At the same time, wind turbine generation was sufficient, and the state of charge (SOC) of the storage system had not yet reached its upper limit. The fulfillment of these conditions triggered the initiation of the charging process.
In the subsequent hours, the price conditions were no longer met, leading to the termination of the charging operation.
For signal (dch.1), at approximately 6:00 a.m., a favorable price signal allowed for the discharging of the storage system, resulting in the release of 600 kWh to the grid.
Over the next several hours, no additional price signals met the criteria for either charging or discharging and, consequently, no further operations were performed during this period.
Later, in the evening at around 9:00 p.m., due to both ongoing wind power generation and favorable price conditions (i.e., low market price), a new charging cycle was initiated. The maximum state of charge was reached at around 1:00 a.m. and was maintained until approximately 5:00 a.m. on the second day.
Following this, during the morning peak demand hours, two additional discharging operations occurred. During the evening peak, the entire usable energy stored in the battery was discharged, completing the cycle.
To incorporate economic income, these data were integrated with the results from Figure 5 and subsequently visualized in Figure 6.
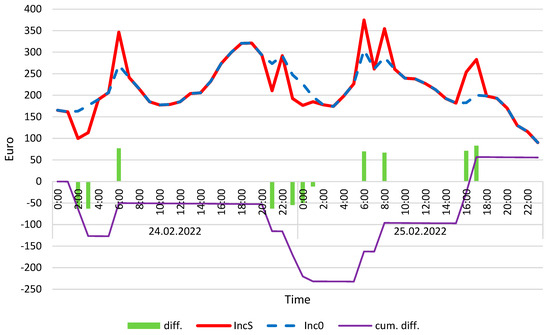
Figure 6.
Income from wind turbine with energy storage (IncS) and without (Inc0) and also differences between both values, calculated for 24 and 25 February 2022. Calculation conditions: minP′ = 100 kW, maxP′ = 600 kW, maxC = 2400 kWh, FP = 0.12, aH = 24. Source: own study.
The charging and discharging operations of the energy storage system, as illustrated in the above figures, directly influenced the difference of revenue generated on the electricity market. Notably, the very first charging event led to a situation in which the revenue from the wind turbine without storage would have been higher. However, it should be emphasized that the two analyzed days were deliberately selected so that the amount of stored energy at both the beginning and end of the period was zero. This allowed for an accurate comparison of revenue differences between the storage and non-storage scenarios.
Hourly revenue differences are marked with green bars. In many hours, a slightly negative value is observed, which is attributed to the energy required for operating the storage system. The purple line represents the cumulative revenue difference between the two analyzed variants. The plot also reveals a negative correlation between the cumulative revenue and the amount of currently stored energy, as presented in the preceding figure.
Based on the described selection algorithm and the method of calculating revenue differences, an analysis was conducted on multiple variant combinations. For example, results for different values of (1200 kW) for the same two days are presented in Appendix B. This analysis allowed for the computation of revenues generated by integrating an energy storage system into a wind turbine system. From all possible combinations, the maximum revenue values and the variants close to them were identified. The results are summarized in the table below.
The relatively small differences between results obtained stem from the fact that the range of decision parameters was deliberately narrowed compared to the full interval considered in Table 1. The highest revenue from energy storage utilization was achieved under the following configuration:
- Minimum charging power (): 0 kW,
- Maximum charging/discharging power (): 600 kW,
- Price signal deviation threshold (): 0.1,
- Price averaging period (): 22 h.
The relationship between the achieved Income and the technical parameters—i.e., the minimum charging power and the maximum charging/discharging power—is illustrated in Figure 7, based on a fixed value of 0.1 and a price averaging period of 22 h.
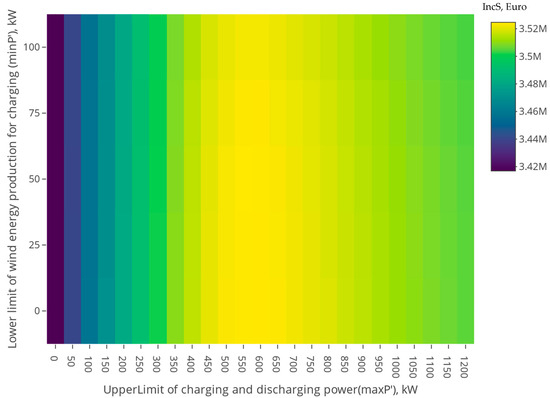
Figure 7.
Income as function of lower limit of wind energy generation and limit of charging and discharging power . Source: own study.
Within the assumed range of minimum charging and discharging power, a significant impact of the maximum power values on the revenue generated from wind turbine electricity sales was observed. As shown in Table 2, although the maximum charging and discharging power was set at 1.2 MW, the highest revenue levels were achieved with a 0.6 MW power limit under the adopted operational strategy.
Table 2.
Results in the form of IncS for selected calculation variants.
The dependence of on the minimum available power from the wind turbine (left part of the chart) proved to be less significant within the analyzed range. However, setting a minimum generation threshold for turbine output allocated to battery charging remains important for the storage system’s operational logic.
In the following section, the best-performing results from Table 2 are presented separately for the years 2021–2024 in Table 3.
Table 3.
Chosen results for the best scenario.
The year-to-year variations observed in the results are primarily driven by electricity price levels (Figure 1), which fluctuated across the analyzed period. It can be noted that the revenue from electricity sales, IncS, in 2024 was approximately 16% higher than in 2021. However, the difference between energy storage and non-storage scenarios increased by about 256% over the same period. This is partly due to the increasing correlation between electricity prices and wind power generation.
The share of energy allocated for charging the storage system (Ech) remained at around 10% of the total energy produced by the wind turbine. The most frequently occurring charging hours for this scenario are presented in the figure below. As shown, the majority of energy was stored during nighttime hours, corresponding to numerous favorable price signals.
Figure 8 illustrates the hourly dynamics of energy storage discharge operations throughout the day. The majority of discharge events occurred during the evening peak in electricity demand. The second most frequent period of discharge was during the morning peak demand hours. Figure 9 illustrates the hourly sum of energy charging for every year of calculation.
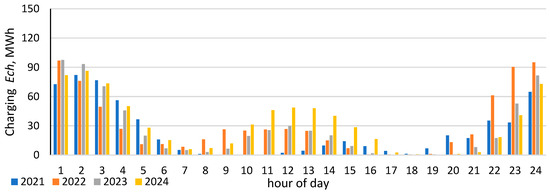
Figure 8.
Energy charge in daily scale—sum for years. Source: own study.
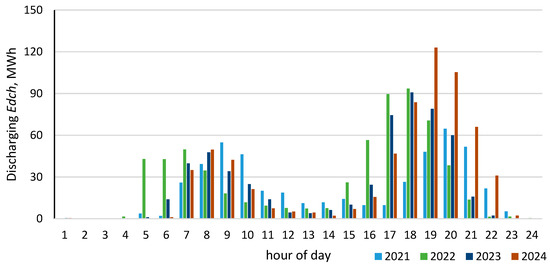
Figure 9.
Energy discharge on a daily scale. Source: own study.
To illustrate the differences between the energy storage and non-storage scenarios, Figure 10 presents the weekly revenue values and their respective differences. The weekly perspective serves as a compromise between daily and annual analysis—this time interval enables generalization of findings without being biased by the initial and final states of charge of the storage system.
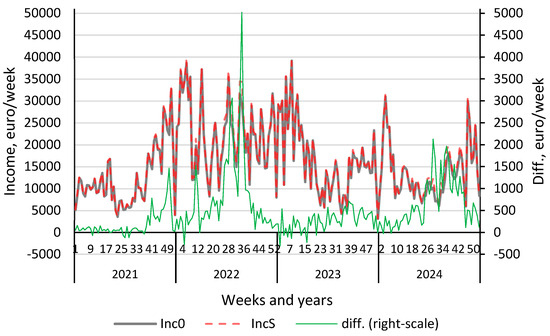
Figure 10.
Weekly sum of income values and their differences in the variant with/without energy storage. Source: own study.
The differences between the storage and non-storage variants reach up to approximately €5000 per week, while the maximum weekly revenues slightly exceed €40,000.
Figure 10 further enables an analysis of the minimum and maximum revenue values in both scenarios. The most significant positive deviations are observed around week 32 of 2022, corresponding to exceptionally high electricity prices on the Polish Power Exchange (TGE) (see Figure 1). Conversely, negative deviations (local minima) result from a combination of factors, including differences in initial state of charge of the storage system, low market prices and low price fluctuation amplitudes, as well as storage maintenance costs and underutilization of the system—for example, due to a low volume of energy discharged to the grid () compared with energy charged. When analyzing Figure 10, the extreme minimum and maximum values can be seen.
4. Conclusions
The study analyzed the operation of an energy storage system in conjunction with a wind turbine and compared it to a reference scenario in which the wind turbine operated without storage. Effectiveness was assessed based on the difference in revenue from electricity sales. Revenue in the no-storage scenario came purely from direct sale on the day-ahead market while, in the storage variant, electricity was sold opportunistically at higher prices through arbitrage-driven charging/discharging. Capital expenditures were excluded under a differential approach, but hourly operational cost of storage (1.5 kWh/h) was included.
The wind turbine had a rated power of 3 MW and was paired with a 2.4 MWh battery (SOC 20–80%). Round-trip efficiency was assumed as that for charging 95% and discharging 90%. The analysis incorporated a broad parametric study based on realistic market and generation data, with the following input variability ranges: day-ahead price averaging period (6–60 h), minimum wind turbine output for charging activation (0–100 kW), maximum charge/discharge power (0–1200 kW), and price deviation threshold (0.05–0.30 of the average price). Hourly wind generation values (0–3 MWh) were derived from actual ENTSO-E and TGE market data, while mean price reference values were dynamically calculated. This approach allowed the evaluation of over 50 parameter combinations, offering a unique insight into the sensitivity of arbitrage profitability to market and operational conditions.
The optimization identified ±10% deviation from the mean day-ahead price, a 22-h averaging window, zero minimum turbine output for charging, and 600 kW maximum storage power as the most effective configuration. Simulations over 2021–2024 yielded a revenue increase of €42.6 k in 2022 (≈ 4% of annual revenue) and €101.15 thousand cumulatively over four years. Charging energy accounted for <10% of total turbine output, and the system performed roughly 300 full calculated cycles annually NoC. Despite these optimizations and favorable price conditions (including an increasing number of zero and negative prices since 2023), the additional revenue remained insufficient to justify the investment when capital expenditures are considered.
Previous works often rely on short-term case studies or simplified models, lacking extensive sensitivity analysis across wide parameter ranges. This study represents a methodological advancement by demonstrating how systematic variation of key operational parameters and direct use of high-resolution market and production data can provide robust, realistic profitability benchmarks. There is also a lack of research presenting truly optimal strategies for wind-storage arbitrage under real market conditions. Most existing studies focus on short-term scenarios or rely on hypothetical input data, limiting their practical applicability. Comprehensive analyses combining multi-year datasets, realistic price dynamics—including the increasing occurrence of negative pricing—and algorithmic design of operational strategies for single-site installations remain scarce. The approach adopted in this study, involving a broad analysis of key input parameter impacts and validation against real market data, represents a significant step forward in the practical development of this research field.
The findings confirm that standalone wind-turbine storage projects limited to price arbitrage face structural profitability constraints. However, the presented framework establishes a replicable basis for further research, including integration with PV and hydrogen storage, participation in ancillary service markets, hybrid community-scale energy systems, and machine-learning-based forecasting to enhance strategy precision.
Author Contributions
Conceptualization, P.O. and M.K.; Methodology, P.O.; Validation, M.K.; Formal analysis, M.K.; Investigation, M.K.; Writing—original draft, P.O. and M.K.; Writing—review & editing, M.K.; Visualization, P.O.; Supervision, P.O.; Project administration, P.O. All authors have read and agreed to the published version of the manuscript.
Funding
This research received no external funding.
Data Availability Statement
The raw data supporting the conclusions of this article will be made available by the authors on request.
Conflicts of Interest
The authors declare no conflicts of interest.
Appendix A
Figure A1 presents the power output of the wind turbine over the years 2021–2024. The energy production across the analyzed years remains relatively consistent, indicating that the revenue-related outcomes obtained in this study are primarily a result of other assumed parameters and market price variations.


Figure A1.
Wind turbine power (WE’) for four years of operation: (A) 2021, (B) 2022, (C) 2023, (D) 2024.
Appendix B
Appendix B presents results and assumptions, similar to those in Figure 4, Figure 5 and Figure 6, but excludes the maximum power () of 1200 kW. Figure A2 shows the calculated values for the variables DAM and WE for the two sample days.

Figure A2.
Day-ahead electricity price (DAM) and 24-h mean of DAM, wind turbine Energy generation and amount of useful energy in storage, calculated for 24 and 25 February 2022. Calculation conditions: minP′ = 100 kW, maxP′ = 1200 kW, maxC = 2400 kWh, FP = 0.12, aH = 24. Source: own study.
Detailed information on the price signals and the exact start times of charging and discharging operations is provided in Figure A3.

Figure A3.
Day-ahead electricity price (DAM) and 24-h mean of DAM (mDAM) with range based on FP, wind turbine energy generation and amount of useful energy in storage, calculated for 24 and 25 February 2022. Calculation conditions: minP′ = 100 kW, maxP′ = 1200 kW, maxC = 2400 kWh, FP = 0.12, aH = 24. Source: own study.
To incorporate economic income, these data were integrated with the results from Figure A2 and subsequently visualized in Figure A4.

Figure A4.
Income from wind turbine with energy storage (IncS) and without (Inc0) and also differences between both values, calculated for 24 and 25 February 2022. Calculation conditions: minP′ = 100 kW, maxP′ = 1200 kW, maxC = 2400 kWh, FP = 0.12, aH = 24. Source: own study.
References
- TGE SA Polish Day-Ahead Market. Available online: https://tge.pl/ (accessed on 18 June 2025).
- ENTSOE Generation by Fuel. Available online: http://energy.instrat.pl/generation_by_fuel (accessed on 14 June 2025).
- Ross, K.; Matuszewska, D.; Olczak, P. Analysis of Using Hybrid 1 MWp PV-Farm with Energy Storage in Poland. Energies 2023, 16, 7654. [Google Scholar] [CrossRef]
- Piwowar, A.; Dzikuć, M.; Dzikuć, M. The potential of wind energy development in Poland in the context of legal and economic changes. Acta Polytech. Hung. 2023, 20, 145–156. [Google Scholar] [CrossRef]
- Canales, F.A.; Jadwiszczak, P.; Jurasz, J.; Wdowikowski, M.; Ciapała, B.; Kaźmierczak, B. The impact of long-term changes in air temperature on renewable energy in Poland. Sci. Total Environ. 2020, 729, 138965. [Google Scholar] [CrossRef]
- Danish, A.; Lim, H.R.; Munawaroh, H.; Ma, Z.; Kit Wayne, C.; Show, P.-L. Machine learning and the renewable energy revolution: Exploring solar and wind energy solutions for a sustainable future including innovations in energy storage. Sustain. Dev. 2024, 32, 3953–3978. [Google Scholar] [CrossRef]
- Komorowska, A.; Olczak, P. Economic viability of Li-ion batteries based on the price arbitrage in the European day-ahead markets. Energy 2024, 290, 130009. [Google Scholar] [CrossRef]
- PSE. Summary of Quantitive Data on the Functioning of the National Power System in 2023; PSE: Warsaw, Poland, 2024. [Google Scholar]
- NFOŚiGW My Electricity IV. Available online: https://mojprad.gov.pl/o-programie/nabor-iv (accessed on 15 September 2023).
- Kryzia, D.; Kopacz, M.; Kryzia, K. The Valuation of the Operational Flexibility of the Energy Investment Project Based on a Gas-Fired Power Plant. Energies 2020, 13, 1567. [Google Scholar] [CrossRef]
- Díaz-Bello, D.; Vargas-Salgado, C.; Alcázar-Ortega, M.; Gómez-Navarro, T. Demand response of prosumers integrating storage system for optimizing grid-connected photovoltaics through time-pricing. J. Energy Storage 2024, 88, 111536. [Google Scholar] [CrossRef]
- Manso-Burgos, Á.; Ribó-Pérez, D.; Gómez-Navarro, T.; Alcázar-Ortega, M. Local energy communities modelling and optimisation considering storage, demand configuration and sharing strategies: A case study in Valencia (Spain). Energy Rep. 2022, 8, 10395–10408. [Google Scholar] [CrossRef]
- Sánchez, A.; Zhang, Q.; Martín, M.; Vega, P. Towards a new renewable power system using energy storage: An economic and social analysis. Energy Convers. Manag. 2022, 252, 115056. [Google Scholar] [CrossRef]
- Segura-Heras, I.; Escrivá-Escrivá, G.; Alcázar-Ortega, M. Wind farm electrical power production model for load flow analysis. Renew. Energy 2011, 36, 1008–1013. [Google Scholar] [CrossRef]
- Msigwa, G.; Ighalo, J.O.; Yap, P.-S. Considerations on environmental, economic, and energy impacts of wind energy generation: Projections towards sustainability initiatives. Sci. Total Environ. 2022, 849, 157755. [Google Scholar] [CrossRef]
- Ligęza, K.; Łaciak, M.; Ligęza, B. Centralized Offshore Hydrogen Production from Wind Farms in the Baltic Sea Area—A Study Case for Poland. Energies 2023, 16, 630. [Google Scholar] [CrossRef]
- Bartela, Ł.; Ochmann, J.; Waniczek, S.; Lutyński, M.; Smolnik, G.; Rulik, S. Evaluation of the energy potential of an adiabatic compressed air energy storage system based on a novel thermal energy storage system in a post mining shaft. J. Energy Storage 2022, 54, 105282. [Google Scholar] [CrossRef]
- Kulpa, J.; Kamiński, P.; Stecuła, K.; Prostański, D.; Matusiak, P.; Kowol, D.; Kopacz, M.; Olczak, P. Technical and Economic Aspects of Electric Energy Storage in a Mine Shaft—Budryk Case Study. Energies 2021, 14, 7337. [Google Scholar] [CrossRef]
- Paska, J.; Surma, T.; Terlikowski, P.; Zagrajek, K. Electricity generation from renewable energy sources in Poland as a part of commitment to the polish and EU energy policy. Energies 2020, 13, 4261. [Google Scholar] [CrossRef]
- Wyrobek, J.; Popławski, Ł.; Dzikuć, M. Analysis of Financial Problems of Wind Farms in Poland. Energies 2021, 14, 1239. [Google Scholar] [CrossRef]
- Szostok, A.; Stanek, W. Thermo-ecological analysis of the power system based on renewable energy sources integrated with energy storage system. Renew. Energy 2023, 216, 119035. [Google Scholar] [CrossRef]
- Stecuła, K.; Olczak, P.; Kamiński, P.; Matuszewska, D.; Duong Duc, H. Towards Sustainable Transport: Techno-Economic Analysis of Investing in Hydrogen Buses in Public Transport in the Selected City of Poland. Energies 2022, 15, 9456. [Google Scholar] [CrossRef]
- Chomać-Pierzecka, E.; Gąsiński, H.; Rogozińska-Mitrut, J.; Soboń, D.; Zupok, S. Review of Selected Aspects of Wind Energy Market Development in Poland and Lithuania in the Face of Current Challenges. Energies 2023, 16, 473. [Google Scholar] [CrossRef]
- Żołądek, M.; Kafetzis, A.; Figaj, R.; Panopoulos, K. Energy-Economic Assessment of Islanded Microgrid with Wind Turbine, Photovoltaic Field, Wood Gasifier, Battery, and Hydrogen Energy Storage. Sustainability 2022, 14, 2470. [Google Scholar] [CrossRef]
- Khosravi, A.; Koury, R.N.N.; Machado, L.; Pabon, J.J.G. Energy, exergy and economic analysis of a hybrid renewable energy with hydrogen storage system. Energy 2018, 148, 1087–1102. [Google Scholar] [CrossRef]
- Nastasi, B.; Mazzoni, S.; Groppi, D.; Romagnoli, A.; Astiaso Garcia, D. Optimized integration of Hydrogen technologies in Island energy systems. Renew. Energy 2021, 174, 850–864. [Google Scholar] [CrossRef]
- Gajewski, P.; Pieńkowski, K. Control of the Hybrid Renewable Energy System with Wind Turbine, Photovoltaic Panels and Battery Energy Storage. Energies 2021, 14, 1595. [Google Scholar] [CrossRef]
- Emrani, A.; Berrada, A.; Bakhouya, M. Optimal sizing and deployment of gravity energy storage system in hybrid PV-Wind power plant. Renew. Energy 2022, 183, 12–27. [Google Scholar] [CrossRef]
- Aazami, R.; Heydari, O.; Tavoosi, J.; Shirkhani, M.; Mohammadzadeh, A.; Mosavi, A. Optimal Control of an Energy-Storage System in a Microgrid for Reducing Wind-Power Fluctuations. Sustainability 2022, 14, 6183. [Google Scholar] [CrossRef]
- de Siqueira, L.M.S.; Peng, W. Control strategy to smooth wind power output using battery energy storage system: A review. J. Energy Storage 2021, 35, 102252. [Google Scholar] [CrossRef]
- Mitali, J.; Dhinakaran, S.; Mohamad, A.A. Energy storage systems: A review. Energy Storage Sav. 2022, 1, 166–216. [Google Scholar] [CrossRef]
- Dadashi, M.; Zare, K.; Seyedi, H.; Shafie-khah, M. Coordination of wind power producers with an energy storage system for the optimal participation in wholesale electricity markets. Int. J. Electr. Power Energy Syst. 2022, 136, 107672. [Google Scholar] [CrossRef]
- Baringo, A.; Baringo, L.; Arroyo, J.M. Day-Ahead Self-Scheduling of a Virtual Power Plant in Energy and Reserve Electricity Markets Under Uncertainty. IEEE Trans. Power Syst. 2019, 34, 1881–1894. [Google Scholar] [CrossRef]
- Khosravi, M.; Afsharnia, S.; Farhangi, S. Stochastic power management strategy for optimal day-ahead scheduling of wind-HESS considering wind power generation and market price uncertainties. Int. J. Electr. Power Energy Syst. 2022, 134, 107429. [Google Scholar] [CrossRef]
- Yang, X.; Fan, L.; Li, X.; Meng, L. Day-ahead and real-time market bidding and scheduling strategy for wind power participation based on shared energy storage. Electr. Power Syst. Res. 2023, 214, 108903. [Google Scholar] [CrossRef]
- Chen, R.; Gao, C.; Ming, H. Rolling-horizon optimization strategy for wind-storage system in electricity market. IET Renew. Power Gener. 2024, 18, 825–836. [Google Scholar] [CrossRef]
- Gräf, D.; Marschewski, J.; Ibing, L.; Huckebrink, D.; Fiebrandt, M.; Hanau, G.; Bertsch, V. What drives capacity degradation in utility-scale battery energy storage systems? The impact of operating strategy and temperature in different grid applications. J. Energy Storage 2021, 47, 103533. [Google Scholar] [CrossRef]
- Bereczki, B.; Hartmann, B.; Kertész, S. Industrial Application of Battery Energy Storage Systems: Peak shaving. In Proceedings of the 2019 7th International Youth Conference on Energy (IYCE), Bled, Slovenia, 3–6 July 2019; pp. 1–5. [Google Scholar]
- Yu, X.; Fan, J.; Wu, Z.; Hong, H.; Xie, H.; Dong, L.; Li, Y. Simulation and Optimization of a Hybrid Photovoltaic/Li-Ion Battery System. Batteries 2024, 10, 393. [Google Scholar] [CrossRef]
- Grimaldi, A.; Minuto, F.D.; Perol, A.; Casagrande, S.; Lanzini, A. Techno-economic optimization of utility-scale battery storage integration with a wind farm for wholesale energy arbitrage considering wind curtailment and battery degradation. J. Energy Storage 2025, 112, 115500. [Google Scholar] [CrossRef]
- DiOrio, N.; Denholm, P.; Hobbs, W.B. A model for evaluating the configuration and dispatch of PV plus battery power plants. Appl. Energy 2020, 262, 114465. [Google Scholar] [CrossRef]
- TLS Designing an HVAC System for a BESS Container: Power, Efficiency, and Operational Strategy. Available online: https://www.tls-containers.com/tls-blog/designing-an-hvac-system-for-a-bess-container-power-efficiency-and-operational-strategy (accessed on 5 April 2025).
- Zhang, R.; Lee, M.; Huang, L.; Ni, M. Optimization of battery energy storage system (BESS) sizing in different electricity market types considering BESS utilization mechanisms and ownerships. J. Clean. Prod. 2024, 470, 143317. [Google Scholar] [CrossRef]
- Olczak, P.; Gucwa, A. Evaluation of economic profitability using energy storage in context of using renewable energy. Polityka Energ. Energy Policy J. 2024, 27, 27–46. [Google Scholar] [CrossRef]
Disclaimer/Publisher’s Note: The statements, opinions and data contained in all publications are solely those of the individual author(s) and contributor(s) and not of MDPI and/or the editor(s). MDPI and/or the editor(s) disclaim responsibility for any injury to people or property resulting from any ideas, methods, instructions or products referred to in the content. |
© 2025 by the authors. Licensee MDPI, Basel, Switzerland. This article is an open access article distributed under the terms and conditions of the Creative Commons Attribution (CC BY) license (https://creativecommons.org/licenses/by/4.0/).