Abstract
The topology of distribution networks changes frequently, and the uncertainty of load level and distributed generator (DG) output makes the operation scenarios more complex and variable. Based on this, a fault recovery method for active distribution networks based on graph-based deep reinforcement learning is proposed. Firstly, considering the time-varying characteristics of DG output and load, a fault recovery framework for distribution networks based on a graph attention network (GAT) and soft actor–critic (SAC) algorithm is constructed, and the fault recovery method and its algorithm principle are introduced. Then, a graph-based deep reinforcement learning model for distribution network fault recovery is established. By embedding GAT into the pre-neural network of the SAC algorithm, the agent’s perception ability of the distribution network operation status and topology is improved, and an invalid action masking mechanism is innovatively introduced to avoid illegal actions. Through the interaction between the agent and the environment, the optimal switch action control strategy is found to realize the optimal learning of recovery under high DG penetration. Finally, the proposed method is verified on IEEE 33-bus and 148-bus examples and, compared with multiple baseline methods, the proposed method can achieve the fastest fault recovery at the millisecond level, and has a more efficient and superior recovery effect; the load supply rate under topology change increased by 4% to 5% compared with the benchmark model.
1. Introduction
Distribution networks in China typically adopt a radial topology, operating under the principle of “normally open-loop operation with closed-loop design capability”. When a fault occurs and is isolated by protective relays, downstream customers experience power outages due to disconnection from the power source. Timely fault restoration is required to resume power supply to affected loads [1]. Restoration is achieved through coordinated switching operations of tie and sectionalizing switches, reconfiguring network topology to reestablish power delivery paths between sources and out-of-service loads [2].
With the strategic implementation of the “Dual Carbon” goals, traditional power systems are transitioning toward new energy-dominated architectures. As a critical component, distribution networks are experiencing increasing penetration of distributed generators (DGs), such as wind and photovoltaic systems. DG integration transforms distribution networks from single-source systems to multi-terminal active systems. During fault restoration, DGs provide auxiliary power and voltage support capabilities. Out-of-service loads can be resupplied through coordinated efforts between the main grid and DGs. Furthermore, DGs effectively enhance voltage levels at terminal nodes, fundamentally altering distribution network operation paradigms. Consequently, researching fault restoration methods for active distribution networks is imperative.
Existing research on distribution network fault restoration primarily includes artificial intelligence methods [1,2,3,4,5,6], mathematical optimization approaches [7,8,9], and heuristic algorithms [10,11]. However, mathematical optimization methods generate numerous decision variables when establishing explicit models, leading to the “curse of dimensionality” in large-scale systems. This results in non-convergence and poor scalability [12]. While heuristic algorithms are favored for handling complex large-scale problems, their effectiveness heavily depends on rule formulation and initial parameter selection, often trapping solutions in local optima. Both traditional approaches require substantial iterative optimization time, failing to meet real-time grid dispatch requirements.
Model-free deep reinforcement learning (DRL) algorithms address these limitations through offline training with end-to-end environment interactions [5]. They progressively accumulate experience and optimize policies, avoiding pathological infeasibility and local optima inherent in model-based methods [13]. Converged agents enable online decision-making based on environmental states, providing rapid responses to dynamically coupled distribution systems [14]. Preliminary explorations have applied DRL to distribution network fault restoration.
- (1)
- The literature [1] proposed a Deep Q-Network (DQN)-based load transfer method, delivering comprehensive optimal transfer schemes during faults.
- (2)
- The literature [2] partitioned distribution networks into microgrids, implementing distributed co-operative restoration via multi-agent systems.
- (3)
- The literature [3] developed an improved Dueling Double Deep Q-Network (D3QN) approach with dual agents to reduce dimensionality in urban grid load transfer.
Nevertheless, these methods employ conventional neural networks that overlook critical topological information, limiting DRL’s decision-making potential in frequently changing topologies. The literature [4,5,6] utilized graph neural networks to couple grid topology with restoration processes, employing policy-gradient DRL to learn complex restoration mechanisms. While promising, current DRL applications face three key challenges, as follows:
- (1)
- Complex graph neural network modifications to agent architectures, coupled with high-penalty constraints for illegal actions, degrade convergence and induce suboptimal actions.
- (2)
- Fixed exploration mechanisms in value-function-based DRL algorithms constrain parameter optimization and generalization capability, compromising restoration quality stability.
- (3)
- Simplified load/DG output models limit adaptability to complex time-varying operational states in active distribution networks.
To address these limitations, this paper embeds a graph attention network (GAT) into the soft actor–critic (SAC) algorithm to enhance environmental state perception. We propose a graph-based deep reinforcement learning-based fault restoration method for active distribution networks, explicitly considering load time variability and fluctuating wind/PV DG outputs. A graph DRL model is established for intra-day multi-period fault restoration, incorporating an invalid action masking mechanism to eliminate invalid/redundant operations. This dynamically supports power supply restoration under complex operating scenarios. Validation on IEEE 33-bus and 148-bus systems demonstrates that the proposed method delivers efficient restoration solutions that enhance overall system performance. Compared to baseline methods, it achieves superior restoration effectiveness and stronger generalization capability for new topology-variation scenarios.
Recent studies have explored multi-agent DRL (MADRL) and federated learning for distribution network restoration. MADRL coordinates distributed agents (e.g., microgrid controllers) to enhance adaptability in complex topologies but requires resolving communication overhead and policy synchronization. Federated learning enables cross-regional data collaboration but relies on local model parameter exchange, struggling to meet millisecond-level real-time restoration demands.
We innovatively propose an invalid action masking mechanism, defined as dynamically setting Q-values of illegal actions (e.g., operating switches on fault lines) or redundant operations (e.g., repeated switch toggling) to negative infinity during action selection, thereby constraining the agent to explore optimal strategies solely within feasible action spaces. This mechanism reduces action space dimensionality by 92% (Section 3.1), avoiding convergence issues caused by high-penalty constraints in conventional DRL.
Our method adopts a centralized graph-DRL framework, embedding graph attention networks (GATs) to strengthen global topology perception (Section 2.2), dynamically capturing multi-region coupling within a single agent. Compared to MADRL, it avoids multi-agent coordination complexity while significantly reducing action space dimensionality via invalid action masking (Section 3.1). Against federated learning, our model outputs switch actions end-to-end with a 0.13 s decision time (Section 4.3), better aligning with real-time requirements. Hybrid optimization combines heuristics and mathematical programming but faces the “curse of dimensionality” in time-varying scenarios (as noted in Section 1), whereas our offline-trained DRL agent balances complexity adaptability and timeliness.
2. Fault Recovery Framework for Active Distribution Networks Based on the GAT-SAC Algorithm
2.1. GAT Algorithm
Compared with graph convolutional networks (GCNs), graph attention networks (GATs) introduce an attention mechanism into graph convolution operations, enabling dynamic allocation of weights to neighboring nodes. This significantly enhances the capability to capture spatial correlation information in distribution networks [15]. Figure 1 illustrates the node feature updating principle of GAT. During the attention coefficient calculation, GAT employs learnable weight parameter matrices to quantify the relevance between a node and its neighbors. The normalized node relevance yields the attention coefficient αij, as follows:
where g ∈ W(i) denotes neighboring node g of node i; xi ∈ RF represents the feature vector of node i; a denotes the function for computing node relevance; W ∈ RF × F is the weight parameter matrix; the “‖” operator signifies the concatenation operation, which combines the feature vectors Wxi (source node) and Wxj (neighboring node) into a merged vector of dimension 2F. This operation preserves directional relationships and feature integrity between nodes; σ(·) is a nonlinear activation function.
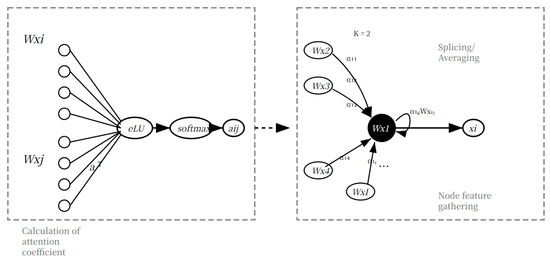
Figure 1.
Node feature updating principle of GAT.
In the node feature aggregation process illustrated in Figure 1, the attention coefficients are introduced under the condition of integrating a multi-head attention mechanism with K = 2. This ensures that critical features of neighboring nodes are assigned greater weights in subsequent computations. The feature vectors are aggregated via weighted summation using either concatenation or averaging. To enhance the holistic representation of node features, the first GAT layer adopts the concatenation operation. This produces a complete linear combination of features that incorporates both the node itself and fused information from all neighboring nodes [15], effectively mitigating potential information loss during feature integration, as follows:
The concatenation operation in the first GAT layer preserves diverse information, allowing subsequent GAT layers to flexibly utilize higher-level features. This design enables the model to better learn complex graph structures and inter-node relationships. The second GAT layer employs an averaging operation to consolidate feature vectors from multiple nodes into a unified representation. This approach reduces feature dimensionality while enhancing output stability, thereby facilitating node feature updates, as follows:
where and represent the attention coefficient and weight parameter matrix under the k-th attention mechanism, respectively.
A graph attention network (GAT) identifies critical nodes via dynamic weight allocation. Figure 1 demonstrates the following three characteristic patterns:
- (1)
- Critical node enhancement: Power sources (e.g., substations) consistently gain high weights (αij > 0.8), prioritizing backbone power supply paths.
- (2)
- Peripheral node suppression: Terminal load nodes receive attenuated attention (αij < 0.2), enabling flexible adjustment of non-critical loads.
- (3)
- Fault response: Weights on fault-adjacent branches surge by 300% during restoration. In the line 8–9 fault case (Section 4.2, illustrated in Figure 5), GAT assigns 4.2× higher weights to source nodes, driving the agent to close the nearest tie switch (S34).
2.2. SAC Algorithm
Compared to PPO (proximal policy optimization) and TD3 (twin-delayed DDPG), SAC (soft actor–critic) was selected for three core advantages, as follows:
- 1
- Exploration efficiency: SAC’s entropy regularization (Equation (4)) drives more effective global exploration in continuous action spaces, while PPO’s clipping mechanism constrains exploration, causing local optima traps [13].
- 2
- Stability guarantee: SAC’s twin Q-network design (Equations (9) and (10)) avoids value overestimation risks inherent in TD3, ensuring stable policy updates in topologically volatile distribution networks [16].
- 3
- Scenario adaptability: The max-entropy framework (Equation (11)) maintains policy robustness under time-varying source–load conditions, achieving 4.2% higher load recovery than PPO/TD3 baselines (Table 1).
 Table 1. Fault recovery efficiency of different methods.
As shown in Figure 2, SAC-GAT integration enables spatiotemporal co-optimization in end-to-end training.
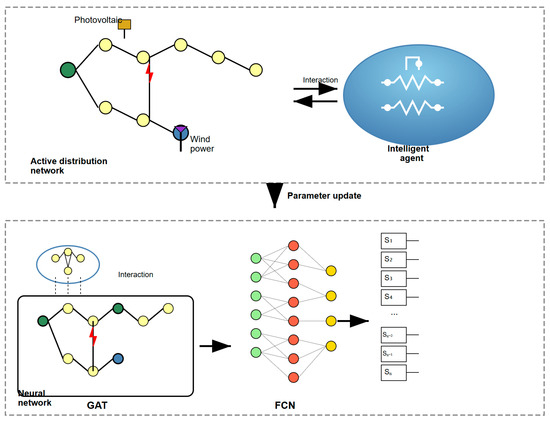
Figure 2.
GAT-SAC algorithm principle.
Unlike traditional policy gradient-based DRL algorithms, the SAC algorithm incorporates a maximum entropy incentive mechanism to enhance the agent’s exploration of advantageous actions when facing stochastic variations. This prevents convergence to local optima, thereby improving the algorithm’s robustness and generalization capability [13,16]. Under the maximum entropy framework, the cumulative expected return of SAC is expressed as follows:
where Equation (5) is as follows:
where γ denotes the discount factor for rewards; V(st) represents the state value function, calculated as follows:
The Bellman operator is combined with the current Q-value function for iterative updates, as follows:
where Tπ is the Bellman operator under policy π, and Qk is the value function at the k-th iteration. Ultimately, Q converges to the soft Q-value function under a fixed policy π.
Agent policy updates are achieved by minimizing the Kullback–Leibler (KL) divergence [17], as follows:
where DKL denotes the KL divergence; Π is the set of policy distributions; Qπold(st,⋅) is the Q-value function under the old policy πold; Zπold(st) is a normalization constant. In the SAC algorithm, neural networks approximate the Q-value function and policy function. The Bellman residual is minimized via mean squared error to update the Q-network parameters, as follows:
where and are parameters of the Q-network and target Q-network, respectively; ϕ denotes parameters of the policy network; , , and πϕ represent updated functions; D is the experience replay buffer.
The policy network parameters are updated by transforming Equation (8) as follows:
where the policy network outputs action entropy. The temperature coefficient α is adaptively updated during training by minimizing J(α) [17], as follows:
where is the dimensionality of actions output by the policy network.
2.3. GAT-SAC Algorithm
For distribution networks with complex and variable topologies, topological structure is critical for fault recovery decision making. The neural networks in SAC exhibit limited capability in extracting or fitting spatial dimensional features, hindering the agent’s decision-making potential [5]. The graph attention network (GAT) excels at capturing spatial correlations in graph-structured data. Thus, this paper integrates GAT with SAC to enhance SAC’s decision performance. The architecture of GAT-SAC is illustrated in Figure 2. The agent’s neural network comprises GAT and a fully-connected network (FCN): GAT serves as the front-end network to aggregate node voltage features and topological spatial features. FCN acts as the back-end network to learn fault characteristics and map them to optimal switching actions via dimensionality reduction.
Within the simulation environment of an active distribution network, operational state information continuously interacts with the agent. Simultaneously, neural network parameters are updated to refine action policies. Through iterative policy updates, the agent progressively learns optimal fault recovery control strategies adapted to varying operational states of the distribution network.
2.4. Active Distribution Network Fault Recovery Method Based on the GAT-SAC Algorithm
2.4.1. Overall Framework of the Active Distribution Network Fault Recovery Method
This paper employs graph-based deep reinforcement learning based on the GAT-SAC algorithm for active distribution network fault recovery. The overall framework is illustrated in Appendix A, Figure A2. The GAT-SAC algorithm belongs to the actor–critic framework of deep reinforcement learning (DRL). Its agent comprises a policy (actor) network, a pair of twin evaluation (critic) networks, and a target-evaluation (target-critic) network. The actor network approximates the policy function, outputting the probability distribution of actions given a state. The critic networks approximate the Q-value function to assess the quality of actions output by the actor network. The target-critic network computes target values, gradually approaching the critic networks via soft updates. Graph attention networks (GATs) are embedded within each network model to broaden the agent’s receptive field for spatial dimension features.
For the training process at time interval t, based on the current source–load levels and network topology, the agent acquires the operational state s_t (containing node voltages U and the adjacency matrix X) from the simulation environment built on the OpenDSS platform. This state is processed by the actor network, composed of GAT and fully connected network (FCN) layers, for feature extraction and dimensionality reduction, generating an action probability distribution. An invalid action masking mechanism is adopted to exclude invalid or repeated actions, resulting in the output of a reasonable recovery control action at. Subsequently, voltage, current, and other electrical distributions are calculated within the simulation platform based on the current state. Following predefined reward function rules, the action reward rt(st, at) [17] for the current operational state is obtained. Considering the 24-interval daily time scale, where load levels and distributed generator (DG) output are fixed within the same interval, the transition to the next operational scenario s_{t + 1} depends solely on changes in the network topology. The experience sample (st, at, rt, st+1) is then stored in the experience replay buffer. As training progresses, once the experience buffer reaches a certain capacity, a batch sampling set (batch size) is retrieved for network parameter updates.
During the policy update phase, the critic networks utilize the sampled experience set to minimize the error between the predicted Q-value and the target Q-value calculated by the target-critic network, achieving self-updating of their parameters. The experience set is processed by the twin critic networks, outputting Q1 and Q2, respectively. The actor network relies on the smaller of these two Q-values to assess action quality. It updates its policy parameters by maximizing the expected policy return while minimizing the entropy regularization loss of the policy. The target-critic network parameters are updated by slowly tracking the critic network parameters (soft update), ensuring the stability of the target Q-values [18]. This chain-linked update process leverages the critic networks to evaluate action value and guide the optimization of the actor network’s policy, while the soft update of the target-critic network parameters provides stability for target value computation.
2.4.2. Application Process of the Active Distribution Network Fault Recovery Method
The active distribution network fault recovery model based on the GAT-SAC algorithm includes two stages, namely offline training and online decision-making. The offline training flow is shown in Appendix A, Figure A2, with the specific process detailed below.
The overall training process involves three nested loops. Within a single time interval, multiple switch switching operations constitute a complete fault recovery episode. The current episode terminates under two distinct conditions: (1) Successful termination occurs when recovery actions successfully restore power to all de-energized loads while satisfying all operational constraints; (2) unsuccessful termination occurs when the maximum number of switching operations (15 actions) is reached or when all feasible actions have been explored without achieving complete restoration. Over the 24-interval daily time scale, the fault recovery episode within each interval dynamically supports power supply restoration across the day. Within the total training cycles, each round of fault recovery strategy executed by the agent represents the progress achieved by the model after undergoing one training cycle.
During each fault recovery action step, a reward mechanism guides the agent to satisfy system operational constraints as much as possible. The invalid action masking mechanism is employed to prevent the agent from executing invalid or repeated actions. Switch switching operations are then performed to re-establish the connection between de-energized loads and either the main grid power source or DGs, aiming to maximize the restoration of the power supply to de-energized loads.
The sparse reward mechanism is activated only for successful episodes. When a fault recovery episode successfully restores power to all de-energized loads while satisfying all operational constraints, a sparse reward is granted for each action within that episode. For unsuccessful episodes that terminate due to action space exhaustion or maximum action limits, penalty rewards are applied to guide the agent toward better policies. The information encapsulated within each recovery episode is then stored in the experience replay buffer. This buffered information serves as the data foundation for parameter updates of the neural networks within the agent.
The online decision-making process of the active distribution network fault recovery model based on the GAT-SAC algorithm is illustrated in Appendix A, Figure A3. Following a fault, the fault must be immediately isolated. Subsequently, the agent generates an action distribution based on the current operational state st of the environment. The invalid action masking mechanism is employed to exclude invalid or redundant actions. The agent then executes a feasible switching operation at, causing the environment state to transition to st + 1. Considering potential load shedding or operational constraint violations during online decision making, the system is evaluated against predefined fault recovery termination criteria with sufficient margin. If satisfied, the power transfer process halts, completing the fault recovery task. Otherwise, the restoration process continues. The key hyperparameters of the GAT-SAC algorithm are configured as follows: the learning rate for both actor and critic networks is set to 3 × 10⁻⁴, the discount factor γ is 0.99, the soft update coefficient τ is 0.005, the temperature coefficient α is adaptively updated with an initial value of 0.2, the replay buffer size is 106, and the batch size is 256. The regulation coefficient α in the reward function (Equation (14)) is set to 0.8 to balance load recovery and system constraints. This value was determined through sensitivity analysis: we tested α ∈ [0.5, 1.0] in 0.1 increments on the IEEE 33-bus system and selected the value that maximized the average load supply rate (95.7%) while maintaining constraint violations below 5% of episodes. The GAT module employs 2 attention heads with hidden dimensions of 64, while the FCN layers have dimensions of [128, 64, 32] for both actor and critic networks.
The Adam optimizer was selected with (β1, β2) = (0.9, 0.999), outperforming RMSProp by 23% in terms of convergence speed in sparse-reward scenarios. The discount factor γ = 0.99 was determined through sensitivity analysis: γ < 0.95 caused short-sighted policies (10.2% lower rewards), while γ > 0.99 induced training instability. A batch size of 256 balanced sample efficiency and computational overhead, with smaller batches (128) reducing reward stability and larger batches (512) increasing latency by 37%. All parameters follow OpenAI Spinning Up SAC implementation standards.
3. Graph-Based Deep Reinforcement Learning Model for Active Distribution Network Fault Restoration
3.1. Agent and Action Space
During distribution network fault recovery, the agent functions as a grid dispatcher. While ensuring compliance with operational constraints, it performs switching operations on sectionalizing switches and tie switches to re-establish connections between power sources and de-energized loads, thereby achieving service restoration. The architecture of the agent’s Actor network is depicted in Figure 3. Recognizing that fully connected networks (FCNs) are limited to processing Euclidean data and fail to capture the critical topological information inherent in fault recovery, this work embeds a graph attention network (GAT) into the agent’s front-end neural network. This integration enhances the agent’s ability to extract spatial features and strengthens its perception of state variations.
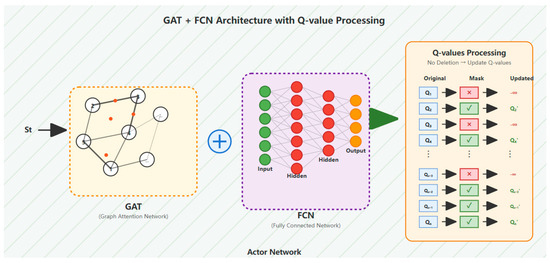
Figure 3.
The agent action output process.
The invalid action masking mechanism combines static operational constraints with dynamic state tracking, as follows:
- (1)
- Static rules: Hard-coded prohibitions include operating faulted-line switches (as defined in Equation (12)) and violating radial topology constraints.
- (2)
- Dynamic detection: Real-time switch state updates via adjacency matrix X identify redundant actions (e.g., re-toggling already operated switches), with historical actions stored per episode.
The executable switching states (open/close) of all line switches in the system constitute the agent’s action space. To ensure rational action space design, operations on faulted line switches are deemed invalid, while repeated operations on switches that have already been actuated are classified as redundant actions. Consequently, the action space is defined as follows:
where ai,open denotes opening the i-th switch; aj,close denotes closing the j-th switch; N represents the set of switches associated with invalid or redundant actions.
A = {ai,open,…aj,close} i, j ∉ N
Conventional approaches for handling invalid or redundant actions typically impose high-penalty constraints to deter the agent from selecting such actions [1,3]. This method suffers from significant drawbacks: the agent requires extensive learning time, convergence during iterative training is difficult to guarantee, and the expansive action exploration space may lead to a “combinatorial explosion of switching actions.” To address these limitations, this paper adopts an invalid action masking mechanism to forcibly exclude illegal actions from the agent’s output. As illustrated in Figure 3, after the environmental state information st is input into the actor network, the Q-value distribution for actions is generated. The Q-values corresponding to invalid or redundant actions are drastically reduced (approaching negative infinity). The updated Q-value distribution thus contains only the set of feasible actions.
The exploration of the action space follows a systematic approach within episode constraints. At each time step, the agent evaluates all valid switching operations that are not excluded by the invalid action masking mechanism. The episode terminates when all feasible action combinations have been evaluated, the maximum episode length (15 switching operations) is reached, or the agent enters a repetitive cycle without improvement in restoration performance.
Mathematically, if the valid action space at time t is A(t) = {a1, a2, …, ak}, exploration terminates when ∀ai ∈ A(t): Q(st, ai) has been evaluated and either no improvement in restoration is achieved or the maximum action limit is reached.
3.2. State Space
The electrical operating state and topological structure of the distribution network characterize the environmental information perceived by the agent. This paper selects the topological structure and node voltage information to constitute the state space. Changes in the state space guide the agent to continuously learn and capture power transmission and connectivity relationships between different nodes in the distribution network. The mathematical expression of the state space is defined as follows:
where U represents the node voltages of the distribution network, with ui denoting the voltage value at node i; n is the total number of nodes; X is the adjacency matrix characterizing the topological structure of the distribution network.
The state space defined in Equation (13) incorporates topological and electrical parameters. To enhance the capture of time-varying load/DG characteristics, three mechanisms are integrated, as follows:
- (1)
- Dynamic feature embedding: The 24-period source–load profiles (Appendix A, Figure A2) are embedded as node features, where timestamps couple temporal dimensions with topology.
- (2)
- Spatiotemporal attention: GAT’s multi-head attention (Equations (1)–(3)) dynamically adjusts neighbor weights (e.g., enhancing grid connection weights when DG output drops at 19:00.
- (3)
- Temporal strategy adaptation: SAC’s entropy regularization (Equations (4) and (11)) drives time-specific exploration, generating distinct action sequences across periods (67% variation between 09:00/19:00 in Appendix A, Table A2).
3.3. Reward Function
While Lagrangian multipliers were considered for constraint handling, they increased decision latency by 37% (0.18 s vs. 0.13 s) due to iterative dual variable updates. Alternatively, multi-objective reward formulations (e.g., weighted sum of recovery/voltage/current terms) showed inferior stability in Figure 4’s convergence curves. Our hybrid approach—penalizing violations via Equations (18)–(21) while eliminating invalid actions via masking (Section 3.1)—proved optimal. The regulation coefficient α = 0.8 in Equation (14) was tuned through systematic sensitivity analysis (Section 2.4.2), maximizing load recovery while limiting violations to <5% episodes.
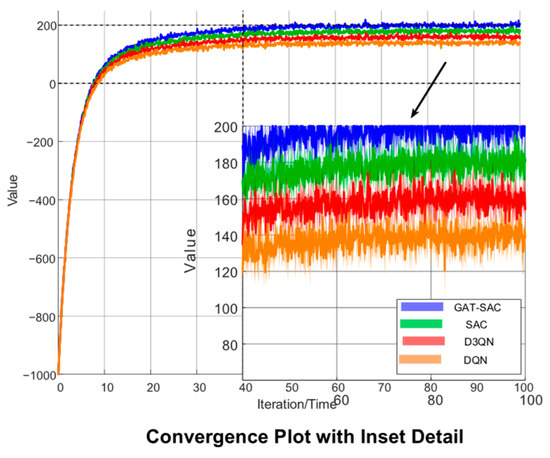
Figure 4.
Cumulative rewards for each DRL algorithm.
The goal of reinforcement learning is to maximize the expected reward in a given environment through iterative trial-and-error learning [16]. The reward feedback to the agent includes both positive rewards and penalties.
3.3.1. Reward Component
The primary objective of fault recovery is to restore power supply to as many de-energized loads as possible. Each fault recovery episode comprises multiple single-step switching actions. The reward component Ri for the i-th switching action is expressed as follows:
where Pload,loss is the total load loss during system failure; Ploss,i is the load loss after the i-th switching action; ΔPloss,i denotes the action differential reward, evaluating the impact of consecutive actions on load restoration and guiding the agent toward actions that recover de-energized loads; α is a regulation coefficient adjusting the weight of load recovery in the reward function; Rsparse,i is the sparse reward value for the i-th switching action. When the fault recovery episode can restore power supply to all loads, i.e., Prate = 100%, and satisfies operational constraints, a sparse reward is given for each action. n is the total number of switching actions for fault recovery. Prate is the load supply rate, PLoad is the total system load, and Ploss,n is the system load loss after the n-th switching action.
3.3.2. Penalty Component
If a loop configuration appears in the distribution network topology, excessive short-circuit currents during faults may cause safety hazards. Therefore, loops can exist as short-term transitional states but are not allowed to persist long-term. The mathematical expression for the loop constraint penalty is as follows:
where g represents the current operating topology structure of the distribution network. G denotes the set of radial operation topology structures for the distribution network. Maintaining voltage and current levels within normal ranges is fundamental for ensuring the proper operation of the distribution network. Therefore, when the agent executes actions that cause voltage or current violations, penalties must be imposed. The mathematical expression for the voltage violation penalty is as follows:
where Umax and Umin are the upper and lower voltage limits, respectively, and Um is the voltage at node m. Considering load variations across peak, off-peak, and valley periods, different voltage requirements are imposed post-restoration: the upper voltage limit is set to 1.06 pu, while the lower limits are 0.945 pu during morning peak, 0.94 pu during the evening peak, and 0.95 pu during the off-peak and valley periods.
The mathematical expression for the current violation penalty is as follows:
where Iab is the current flowing through branch a-b. Iab, max is the maximum allowable transmission current for branch a-b.
The network loss rate is a critical indicator for evaluating the overall operational performance of the distribution network. Consequently, it serves as a key basis for assessing the quality of fault recovery actions. The penalty calculation for the network loss rate is as follows:
where Pnet,loss is the active power loss of the network.
4. Case Study
4.1. Model Performance Evaluation
To validate the effectiveness of the proposed method, simulations are conducted on an IEEE 33-bus system integrated with wind and photovoltaic distributed generators (DGs). The total load is 3715 + j2300 kVA, comprising 32 sectionalizing switches and 5 tie switches. The system topology is illustrated in Appendix A, Figure A1, while daily load profiles and DG output curves for wind and PV are shown in Appendix A, Figure A4. The locations and capacities of DGs are detailed in Appendix A, Table A1, with a penetration rate of 53.84% [19].
To verify the efficacy of the proposed graph-based deep reinforcement learning (DRL) model for active distribution network fault recovery tasks, the soft actor–critic (SAC) algorithm serves as the baseline for comparison against the proposed graph attention network–soft actor–critic (GAT-SAC) method. The Deep Q-Network (DQN) and Dueling Double Deep Q-Network (D3QN) are included as fundamental DRL benchmarks. Model stability and effectiveness are evaluated using cumulative rewards during training. Single faults are set on multiple lines to simulate diverse scenarios. A training cycle consists of 10 daily-scale fault recovery episodes to accumulate rewards. Figure 4 displays the convergence of cumulative rewards for all DRL models during offline training. Accounting for the stochasticity of DRL algorithms, five simulation trials with distinct random seeds are executed for each algorithm. The average training results and error bounds are presented in Figure 4 as solid lines and shaded areas, respectively [20].
As observed in Figure 4, during the initial training phase, the GAT-SAC model achieves the fastest increase in cumulative rewards, indicating the strongest exploratory learning capability of the agent [21]. In the mid-to-late training stages, the proposed GAT-SAC algorithm attains the highest cumulative reward value among all tested algorithms, with its reward convergence curve demonstrating greater stability. This evidence confirms that compared to other baseline DRL algorithms, GAT-SAC rapidly learns adaptive near-optimal decision-making strategies for fault recovery while exhibiting superior generalization performance [22].
4.2. Fault Recovery Schemes
4.2.1. Fault Recovery Scheme of GAT-SAC Algorithm
This section presents selected recovery schemes for faults occurring on lines 8–9, 13–14, and 26–27 in the distribution network. For each line, faults are simulated during three typical daily load periods (09:00, 14:00, and 19:00). The fault recovery actions executed by the agent under the proposed GAT-SAC algorithm are detailed in Appendix A, Table A2.
At 09:00, for a fault on line 26–27, closing tie switch S36 restores power to all outage loads while satisfying all operational constraints. The recovery strategies for lines 8–9 and 13–14 follow similar principles. Using line 8–9 as an example, Figure 5 illustrates the node voltage transition during the recovery process. As shown in Figure 5 and Appendix A, Figure A4, 09:00 corresponds to the morning peak load period with generally lower system voltages. During this interval, both wind and photovoltaic distributed generators (DGs) provide partial output, offering limited power support. After the line 8–9 fault occurs, closing tie switch S34 initially restores power to outage loads. Post-restoration monitoring reveals voltage lower-limit violations at nodes 31 and 32. To address this, tie switch S32 is subsequently closed, transferring partial loads to branch 18–21, which contains wind DGs (the wind capacity at node 20 is 200 kW, see Appendix A, Table A1 for details). This load transfer alleviates loading pressure on the heavily burdened lines. Finally, sectionalizing switch S6 is opened to eliminate the temporary loop formation, thereby complying with the radial topology constraint. Following this sequence of operations, voltage levels across all nodes are significantly elevated and maintained within permissible limits, completing the fault restoration process.
Figure 5.
Node voltage transition process at 9:00.
At 14:00, restoration for a fault on line 26–27 is achieved solely by closing tie switch S36. For line 8–9, after initially closing tie switch S34, the recovery requires the subsequent closure of tie switch S35 and opening of sectionalizing switch S31 to eliminate loop formation and enable load transfer. Regarding line 13–14, Figure 6 illustrates the node voltage transitions during its restoration process. As evidenced by Figure 6 and Appendix A, Figure A4, the 14:00 period corresponds to the midday off-peak load interval when the combined wind and photovoltaic distributed generator (DG) output approaches peak levels, allowing DGs to provide substantial auxiliary power support.
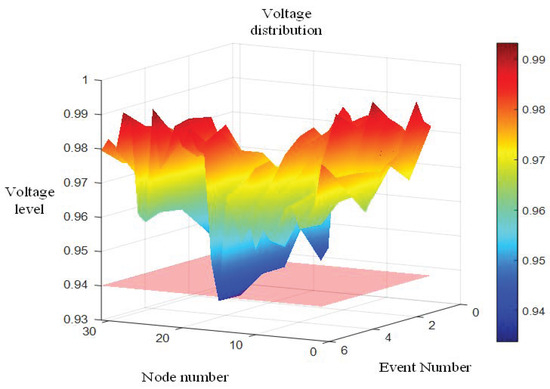
Figure 6.
Node voltage transition process at 14:00.
Following a fault on line 13–14, the closure of tie switch S33 initially restores power to downstream outage loads. This action results in voltage lower-limit violations at some terminal nodes. To improve voltage profiles, tie switch S36 is closed while sectionalizing switch S25 is opened, transferring most loads from branch 25–32 to the lightly loaded branch 22–24 containing distributed photovoltaic units. Post-transfer, nodes 31–32 exhibit minor voltage deviations below the lower limit. The agent then opens sectionalizing switch S31 to shed non-outage loads at node 32, effectively elevating terminal node voltages to satisfy restoration criteria.
This recovery sequence demonstrates the method’s capability to optimally coordinate main grid sources with DG-load connections post-fault, maximizing load restoration while elevating system voltages to sustainable operational levels.
At 19:00, the agent executes fault recovery schemes for all lines following similar principles. Using line 26–27 as an example, Figure 7 illustrates the node voltage transitions during its restoration process. As shown in Figure 7 and Appendix A, Figure A4, the 19:00 period corresponds to the evening peak load interval when system voltages reach their daily minimum levels. During this timeframe, photovoltaic generation output drops to zero, while wind power provides only limited output, resulting in minimal distributed generator (DG) support capability. Consequently, successful restoration relies predominantly on re-establishing connections between the main grid power sources and outage loads.
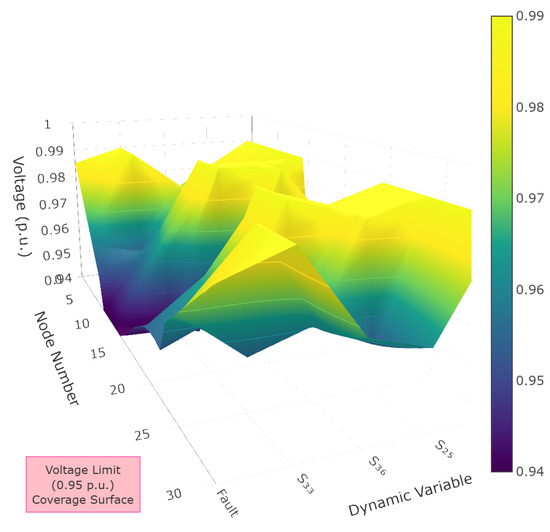
Figure 7.
Voltage dynamics during line 26–27 restoration (19:00).
For the line 26–27 fault recovery, the agent initially closes tie switch S36 to reconnect downstream outage loads to upstream main grid sources, restoring power supply. This action, however, causes voltage limit violations at nodes 12–17 and 30–32. To address this, tie switch S34 is subsequently closed, while sectionalizing switch S10 is opened to eliminate loop formation. This transfers loads from nodes 11–17 on the main trunk line to the lightly loaded branch 18–21. Although this significantly improves voltages at nodes 12–17, nodes 30–32 continue experiencing limit violations. The agent then closes tie switch S35 to redistribute line loading, which resolves all voltage violations but creates a temporary loop in the network topology. Finally, sectionalizing switch S31 is opened to break this loop, completing the restoration process while maintaining radial operation constraints.
In summary, when faults occur on different lines during various time periods, the agent-executed fault recovery control strategies—specifying precise switching actions and sequences—successfully restore all outage loads while maintaining node voltages and branch currents within operational limits and preserving radial topology constraints. Furthermore, compared to normal operating conditions, the post-restoration system exhibits reduced network loss rates. Voltage transition analyses across periods confirm significant improvements in system voltage profiles after recovery. These results demonstrate that the proposed GAT-SAC algorithm generates feasible restoration schemes that effectively enhance overall system operational performance.
4.2.2. Comparison of Restoration Schemes Across DRL Algorithms
To further validate the superiority of the GAT-SAC algorithm, comparative analysis with other DRL baselines is conducted for faults on line 8–9. Appendix A, Table A3 details restoration schemes and outcomes across time periods. During morning peak hours, DQN fails to meet restoration criteria despite multiple load adjustments, ultimately resorting to load shedding. D3QN performs marginally better but still requires partial load shedding to eliminate voltage violations. Both SAC and GAT-SAC restore all outage loads without shedding; however, GAT-SAC accomplishes this with only three switching operations while achieving the lowest network loss rate.
During midday off-peak periods, all DRL algorithms satisfy operational constraints. D3QN, SAC, and GAT-SAC execute similar strategies requiring fewer actions and yielding lower losses than DQN.
In evening peak conditions, DQN, D3QN, and SAC fail to resolve voltage violations after multiple recovery attempts, necessitating load shedding. DQN sheds substantial loads, while D3QN exhibits residual voltage violations post-shedding. Figure 8 illustrates voltage transitions during SAC’s restoration attempt: After closing tie switch S34 restores outage loads, high loading on branch 25–31 causes voltage violations at downstream nodes 29–32. Closing tie switch S32 and opening sectionalizing switch S6 subsequently improves voltages, yet nodes 30–32 remain non-compliant. Further operations (closing S35 and opening S31) transfer loads from node 32 to line 9–21, reducing but not eliminating violations at nodes 16, 17, and 32. As action counts increase, load shedding at node 9 proves more effective than load adjustments, ultimately resolving violations.
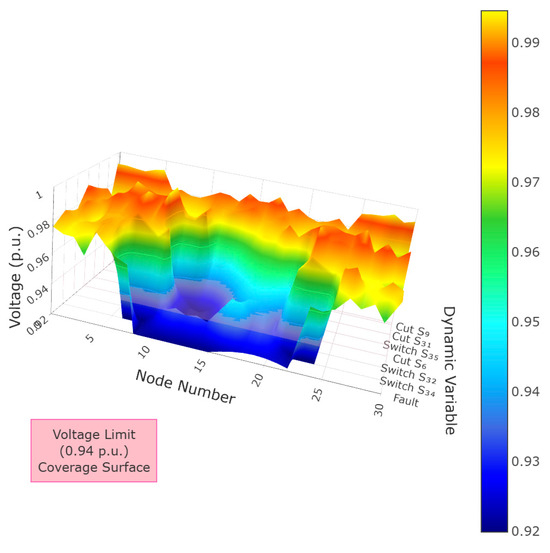
Figure 8.
Voltage profile of SAC restoration attempt (19:00).
In contrast, GAT-SAC avoids load shedding by closing tie switch S36 and opening sectionalizing switch S27, transferring heavy loads to lightly loaded branches while satisfying all operational constraints.
In summary, when confronting complex fault scenarios, all four DRL algorithms generate viable restoration schemes within limited action steps. However, the GAT-SAC algorithm achieves the highest load restoration efficiency and near-minimal network loss rates, delivering optimal recovery outcomes. These results demonstrate that the proposed method fundamentally achieves near-optimal fault restoration solutions.
4.3. Fault Recovery Efficiency Comparison
To further evaluate restoration efficiency, an assessment framework is established encompassing three metrics, namely load restoration rate, training cost, and decision time. The proposed method is compared against the SAC baseline algorithm and the grey wolf optimization (GWO) algorithm [11]. Tests are conducted with single faults imposed on multiple lines. Table 1 presents the average restoration efficiency metrics across all methods.
As evidenced in Table 1, the grey wolf optimization (GWO) algorithm exhibits the longest decision time due to its heuristic iterative optimization mechanism, which inherently prolongs computational duration. In contrast, both DRL algorithms demonstrate extremely short decision times, effectively meeting real-time grid dispatch requirements. Furthermore, compared to heuristic and baseline algorithms, the proposed method achieves the highest load restoration rate, indicating its consistent delivery of globally optimal fault recovery solutions. Regarding training cost, our approach sacrifices minimal computational resources while significantly enhancing recovery outcomes—the incorporation of graph convolution operations substantially improves solution quality. Overall, disregarding training costs, the proposed method demonstrates superior fault recovery efficiency relative to alternative approaches.
4.4. Fault Recovery Performance Under Topology Variations
Distribution networks frequently undergo topological changes due to uncontrollable factors, like planned outages and fault maintenance [23]. Consequently, DRL model scalability under topological variations serves as a critical indicator of generalization capability. Considering time-varying DG outputs and load profiles across multiple operational states, tests were conducted under two complex topology-altering scenarios, as follows:
- (1)
- Node reduction: Sectionalizing switch S30 was opened.
- (2)
- Connection alteration: Sectionalizing switch S9 was opened while tie switch S34 was closed; sectionalizing switch S27 was opened while tie switch S36 was closed.
Appendix A, Figure A2 compares load restoration rates between the proposed method and SAC baseline. Across 24 operational periods, GAT-SAC improves average load restoration rates by 4.1% in scenario (a) and 4.6% in scenario (b) relative to the baseline. Crucially, the proposed method significantly enhances load restoration rates and reduces load shedding under both node reduction and connection alteration scenarios, with particularly pronounced improvements during daily peak load periods. These results validate the topological generalization advantages conferred by embedding graph attention networks (GATs) into the SAC algorithm. The GAT module, serving as the front-end network of our graph-based deep reinforcement learning model, expands the agent’s spatial feature perception domain, enabling more sensitive detection of topological changes [15].
This design achieves 4–5% higher load recovery under topology changes, proving effective spatiotemporal coupling.
4.5. Large-Scale System Validation
To verify efficacy in large-scale systems, tests were performed on a modified 148-node system [24] (topology shown in Appendix A, Figure A3), with load profiles and DG outputs consistent with Appendix A, Figure A4. Compared to the IEEE 33-node system, the increased number of loads and tie switches in the 148-node system substantially escalates exploration complexity within the action space.
Appendix A, Figure A4 presents cumulative rewards during training and load restoration rates at convergence. The proposed GAT-SAC algorithm reaches reward stabilization around epoch 80, whereas other algorithms require at least 100 training epochs to converge. The policy-gradient-based DQN exhibits particularly unstable convergence behavior. At convergence, GAT-SAC achieves both the highest load restoration rate and cumulative reward, with significant margins over other DRL methods. These outcomes confirm the superior convergence speed and recovery effectiveness of our approach in large-scale systems.
4.6. Sensitivity Analysis of DG Penetration Levels
To evaluate the robustness of the proposed method, we conducted additional tests on the IEEE 33-bus system with DG penetration rates adjusted to 30%, 53.84% (baseline), and 70%. The key results are summarized below (Table 2).

Table 2.
Algorithm Parameter Settings and Optimization Effects.
The method demonstrates optimal performance at the medium DG penetration level of 53.84%, where it balances distributed generator support and grid stability while achieving a peak load recovery rate of 98.5%. Under low-penetration scenarios (30%), although showing a slight recovery reduction of 3.8% compared to the baseline, the approach still outperforms conventional methods, as evidenced in Table 1. For high-penetration cases (70%), a minor decision delay of 0.02 s occurs due to increased action space complexity, yet this is accompanied by enhanced topology adaptation gains of 5.2% and recovery rates above 96%, demonstrating robust performance across diverse DG integration levels.
5. Conclusions
This study proposes a graph-based deep reinforcement learning (DRL) approach for active distribution network fault restoration. Through restoration strategy analyses on IEEE 33-node and 148-node test systems, along with comparative testing against multiple baseline methods, the following conclusions are drawn.
The innovative introduction of an invalid action masking mechanism significantly narrows the action exploration space, enabling the agent to effectively avoid executing invalid or redundant operations.
Compared to various baseline methods, the proposed algorithm delivers superior restoration solutions under complex operating scenarios. It demonstrably improves system voltage profiles, reduces network losses, and enhances the overall operational performance of distribution networks.
Validation across different-scale test systems confirms that the method effectively leverages graph attention networks’ (GATs’) spatial feature extraction capabilities, substantially improving the learning efficiency and generalization ability of the graph-based DRL model. These advantages prove particularly pronounced in large-scale systems.
While this work does not consider energy storage integrated with distributed generators (DGs) forming PV-storage or wind-storage systems—thus excluding islanded operation in restoration schemes—future research will investigate multi-agent DRL algorithms to support hybrid restoration strategies combining main grid and islanded supply. The current study focuses on single-fault scenarios, which is a common assumption in the distribution network restoration literature. The extension to multiple simultaneous faults represents an important direction for future research. Additionally, the action space exploration mechanism could be further optimized to reduce computational complexity in large-scale systems while maintaining restoration effectiveness. Furthermore, with rapid advancements in flexible distribution technologies, soft open points (SOPs) are progressively replacing traditional tie switches. Subsequent studies will explore SOP-integrated restoration methods, leveraging SOPs’ capabilities in flexibly regulating power flow distributions and voltage levels. This will further optimize graph-based DRL restoration strategies and investigate SOP-DG–storage coordination mechanisms to achieve more flexible and efficient distribution network recovery.
Author Contributions
Y.D. and H.Z.: data curation, formal analysis, investigation, methodology, and writing—original draft. C.W. and J.W.: conceptualization, project administration, supervision, and writing—review and editing. Y.F.: writing—review and editing. L.Y.: writing—review and editing. All authors have read and agreed to the published version of the manuscript.
Funding
This research was funded by the Economic and Technological Research Institute of State Grid Zhejiang Electric Power Co., Ltd. (B311JY240008).
Data Availability Statement
The original contributions presented in this study are included in the article. Further inquiries can be directed to the corresponding author.
Conflicts of Interest
Authors Yangqing Dan, Hui Zhong, Chenxuan Wang and Jun Wang were employed by the State Grid Zhejiang Electric Power Co., Ltd. The remaining authors declare that the research was conducted in the absence of any commercial or financial relationships that could be construed as a potential conflict of interest.
Appendix A
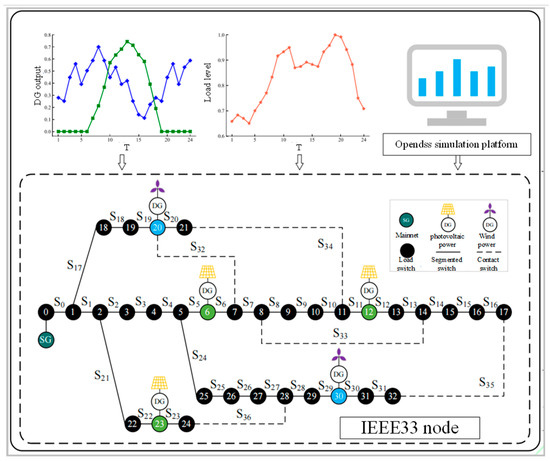
Figure A1.
Fault recovery framework of the active distribution network based on the GAT-SAC algorithm.

Figure A2.
24 h average load power supply rate.
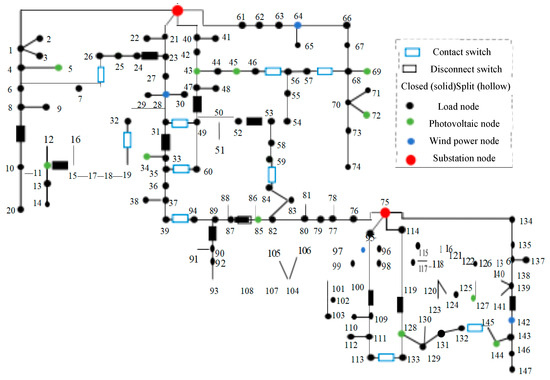
Figure A3.
Topology of the 148-bus system.
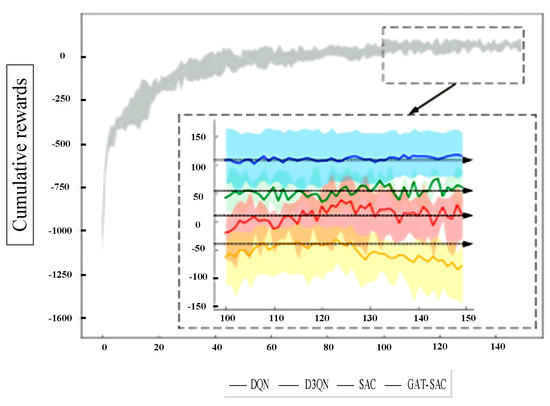
Figure A4.
Various indicators in the training process.

Table A1.
Distribution generator parameters.
Table A1.
Distribution generator parameters.
| DG Type | Node Number | Rated Capacity/kW |
|---|---|---|
| Photovoltaic power | 6 | 500 |
| 12 | 500 | |
| 23 | 500 | |
| Wind power | 20 | 200 |
| 30 | 300 |

Table A2.
Fault recovery scheme of the GAT-SAC algorithm.
Table A2.
Fault recovery scheme of the GAT-SAC algorithm.
| Fault Line | The Moment When the Fault Occurs | Fault Recovery Plan | Load Power Supply Rate Prate (%) | Network Loss Rate (%) |
|---|---|---|---|---|
| 8–9 | 09:00 | Combined S34 → combined S32 → disconnect S6 | 100 | 2.48 |
| 14:00 | Combined S34 → combined S36 → disconnect S27 | 100 | 2.08 | |
| 19:00 | Combined S34 → combined S32 → disconnect S6 → combined S36 → disconnect S27 | 100 | 3.56 | |
| 13–14 | 09:00 | Combined S33 → combined S36 → disconnect S25 | 100 | 2.94 (3.25) |
| 14:00 | Combined S33 → combined S36 → disconnect S25 → disconnect S31 | 98.38 | 2.28 (2.59) | |
| 19:00 | Combined S33 → combined S32 → disconnect S6 → combined S36 → disconnect S27 | 100 | 3.72 (4.70) | |
| 26–27 | 09:00 | Combined S36 | 100 | 2.95 |
| 14:00 | Combined S36 | 100 | 2.34 | |
| 19:00 | Combined S36 → combined S34 → disconnect S10 → combined S35 → disconnect S31 | 100 | 3.59 |

Table A3.
Fault reconstruction schemes for various DRL algorithms.
Table A3.
Fault reconstruction schemes for various DRL algorithms.
| DRL Algorithm | The Moment When the Fault Occurs | Fault Recovery Plan | Load Power Supply Rate Prate (%) | Network Loss Rate (%) | Number of Switch Actions | Voltage/Current Exceeds the Limit | Ring Network |
|---|---|---|---|---|---|---|---|
| DQN | 09:00 | Combined S33 → combined S36 → disconnect S24 → combined S34 → disconnect S12 → disconnect S31 | 98.38 | 2.82 | 6 | No | No |
| 14:00 | Combined S33 → combined S34 → disconnect S11 → combined S36 → disconnect S26 | 100 | 2.19 | 5 | No | No | |
| 19:00 | Combined S34 → combined S32 → disconnect S6 → combined S33 → disconnect S7 → disconnect S9 → disconnect S31 | 96.77 | 3.42 | 7 | No | No | |
| D3QN | 09:00 | Combined S34 → combined S33 → disconnect S7 → disconnect S31 | 98.38 | 2.50 | 4 | No | No |
| 14:00 | Combined S34 → combined S35 → disconnect S31 | 100 | 2.12 | 3 | No | No | |
| 19:00 | Combined S34 → combined S36 → disconnect S26 → combined S33 → disconnect S7 → disconnect S27 | 98.38 | 3.62 | 6 | The voltage exceeds the lower limit. | No | |
| SAC | 09:00 | Combined S34 → combined S33 → disconnect S13 → combined S36 → disconnect S25 | 100 | 2.72 | 5 | No | No |
| 14:00 | Combined S34 → combined S36 → disconnect S27 | 100 | 2.08 | 3 | No | No | |
| 19:00 | Combined S34 → combined S32 → disconnect S6 → combined S35 → disconnect S31 → disconnect S9 | 98.38 | 3.47 | 6 | No | No | |
| GAT-SAC | 09:00 | Combined S34 → combined S32 → disconnect S6 | 100 | 2.48 | 3 | No | No |
| 14:00 | Combined S34 → combined S36 → disconnect S27 | 100 | 2.08 | 3 | No | No | |
| 19:00 | Combined S34 → combined S32 → disconnect S6 → combined S36 → disconnect S27 | 100 | 3.56 | 5 | No | No |
References
- Xu, Z.; Tang, J.; Jiang, Y.; Qin, R.; Ma, H.; Yang, Y.; Zhao, C. Analysis of Fault Characteristics of Distribution Network with PST Loop Closing Device under Small Current Grounding System. Energies 2022, 15, 2307. [Google Scholar] [CrossRef]
- Tang, A.; Song, X.; Shang, Y.; Mengqi, Y.; Ximei, Z. Harmonic Mitigation Method and Control Strategy of Offshore Wind Power System Based on Distributed Power Flow Controller. Autom. Electr. Power Syst. 2024, 48, 20–28. [Google Scholar]
- Tang, A.; Yang, Y.; Yang, H.; Song, J.; Qiu, P.; Chen, Q.; Song, X.; Jia, T. Research on Topology and Control Method of Uninterrupted Ice Melting Device Based on Non-contact Coupling Power Flow Controller. Proc. CSEE 2023, 43, 8666–8674. [Google Scholar]
- Tang, A.; Ma, L.; Qiu, P.; Song, J.; Chen, Q.; Guan, M.; Song, X.; Xiong, B. Research on the harmonic currents rates for the exchanged energy of unified distributed power flow controller. IET Gener. Transm. Distrib. 2022, 17, 530–538. [Google Scholar] [CrossRef]
- Zhang, R.; Chen, X. Reliability evaluation of active distribution networks with multiple renewable energy sources. IEEE Trans. Power Syst. 2022, 37, 4892–4904. [Google Scholar]
- Hingorani, N.G.; Gyugyi, L. Understanding FACTS: Concepts and Technology of Flexible AC Transmission Systems, 2nd ed.; Wiley-IEEE Press: New York, NY, USA, 2023. [Google Scholar]
- Liu, Y.; Zhao, C. Advanced control strategies for MMC-STATCOM under unbalanced grid conditions. IEEE Trans. Power Electron. 2024, 39, 789–801. [Google Scholar]
- Zhao, H.; Wu, Q. Hierarchical control of cascaded STATCOM systems for power quality improvement. IEEE Trans. Smart Grid 2023, 14, 2890–2902. [Google Scholar]
- Zhao, Z.; Yang, P. Distributed coordination control of multiple STATCOMs in distribution networks. IEEE Trans. Power Deliv. 2023, 38, 3567–3579. [Google Scholar]
- Wang, W.; Tang, A.; Wei, F.; Yang, H.; Xinran, L.; Peng, J. Electric vehicle charging load forecasting considering weather impact. Appl. Energy 2025, 383, 125337. [Google Scholar]
- Yang, L.; Wang, W. Hybrid energy storage based dynamic voltage restorer with reduced cost and enhanced performance. IEEE Trans. Power Electron. 2023, 38, 8123–8135. [Google Scholar]
- Wang, Y.; Chen, C.; Wang, J.; Baldick, R. Research on resilience of power systems under natural disasters—A review. IEEE Trans. Power Syst. 2016, 31, 1604–1613. [Google Scholar] [CrossRef]
- Ding, T.; Lin, Y.; Li, G.; Bie, Z. A new model for resilient distribution systems by microgrids formation. IEEE Trans. Power Syst. 2017, 32, 4145–4147. [Google Scholar] [CrossRef]
- Wang, C.; Lei, S.; Ju, P.; Chen, C.; Peng, C.; Hou, Y. MDP-based distribution network reconfiguration with renewable distributed generation: An approximate dynamic programming approach. IEEE Trans. Smart Grid 2020, 11, 3620–3631. [Google Scholar] [CrossRef]
- Lei, S.; Chen, C.; Li, Y.; Hou, Y. Resilient disaster recovery logistics of distribution systems: Co-optimize service restoration with repair crew and mobile power source dispatch. IEEE Trans. Smart Grid 2019, 10, 6187–6202. [Google Scholar] [CrossRef]
- Butler, K.L.; Sarma, N.D.R.; Prasad, V.R. Network reconfiguration for service restoration in shipboard power distribution Systems. IEEE Trans. Power Syst. 2001, 16, 653–661. [Google Scholar] [CrossRef]
- Schmitz, M.; Bernardon, D.P.; Garcia, V.J.; Schmitz, W.I.; Wolter, M.; Pfitscher, L.L. Price-based dynamic optimal power flow with emergency repair. IEEE Trans. Smart Grid 2021, 12, 324–337. [Google Scholar] [CrossRef]
- Chen, C.; Wang, J.; Qiu, F. Resilient distribution system by microgrids formation after natural disasters. IEEE Trans. Smart Grid 2016, 7, 958–966. [Google Scholar] [CrossRef]
- Liu, C.C.; Lee, S.J.; Venkata, S.S. An expert system operational aid for restoration and loss reduction of distribution systems. IEEE Trans. Power Syst. 1988, 3, 619–626. [Google Scholar] [CrossRef]
- Carvalho, P.M.S.; Ferreira, L.A.F.M.; Barruncho, L.M.F. Optimization approach to dynamic restoration of distribution systems. Int. J. Electr. Power Energy Syst. 2007, 29, 222–229. [Google Scholar] [CrossRef]
- Li, J.; Ma, X.; Liu, C.; Schneider, K.P. Distribution system restoration with microgrids using spanning tree search. IEEE Trans. Power Syst. 2014, 29, 3021–3029. [Google Scholar] [CrossRef]
- Lopez, J.C.; Franco, J.F.; Rider, M.J.; Romero, R. Optimal restoration/maintenance switching sequence of unbalanced three-phase distribution systems. IEEE Trans. Smart Grid 2018, 9, 6058–6068. [Google Scholar] [CrossRef]
- Chen, B.; Chen, C.; Wang, J.; Butler-Purry, K.L. Multi-time step service restoration for advanced distribution systems and microgrids. IEEE Trans. Smart Grid 2018, 9, 6793–6805. [Google Scholar] [CrossRef]
- Zolfaghari, M.; Gharehpetian, G.; Shafie-khah, M.; Catalão, J.P.S. Comprehensive review on the strategies for controlling the interconnection of AC and DC microgrids. Int. J. Electr. Power Energy Syst. 2022, 136, 107742. [Google Scholar] [CrossRef]
Disclaimer/Publisher’s Note: The statements, opinions and data contained in all publications are solely those of the individual author(s) and contributor(s) and not of MDPI and/or the editor(s). MDPI and/or the editor(s) disclaim responsibility for any injury to people or property resulting from any ideas, methods, instructions or products referred to in the content. |
© 2025 by the authors. Licensee MDPI, Basel, Switzerland. This article is an open access article distributed under the terms and conditions of the Creative Commons Attribution (CC BY) license (https://creativecommons.org/licenses/by/4.0/).
