Article

Evaluation of Maintenance and Modernization of Road Lighting Systems Using Energy Performance Indicators

by
Roman Sikora
1,
Przemysław Markiewicz
1 and
Ewa Korzeniewska
2,*
1
Institute of Electrical Power Engineering, Faculty of Electrical, Electronic, Computer and Control Engineering, Lodz University of Technology, Stefanowski Street 20, 90-537 Lodz, Poland
2
Institute of Electrical Engineering Systems, Faculty of Electrical, Electronic, Computer and Control Engineering, Lodz University of Technology, Stefanowski Street 20, 90-537 Lodz, Poland
*
Author to whom correspondence should be addressed.
Energies 2025, 18(16), 4328; https://doi.org/10.3390/en18164328
Submission received: 4 July 2025 / Revised: 7 August 2025 / Accepted: 10 August 2025 / Published: 14 August 2025
(This article belongs to the Special Issue Forecasting and Optimization in Transport Energy Management Systems)

Abstract

This paper presents an assessment of the impact of maintenance of a road lighting luminaire with a high-pressure sodium lamp and an LED luminaire on the lighting parameters on the road and the energy efficiency of the entire road lighting installation. Improper maintenance of road lighting installations, especially of luminaires, can significantly worsen road traffic safety. In addition, after performing maintenance activities, e.g., after replacing a lamp in the luminaire, the energy consumption of the road lighting installation can increase. Both active and reactive energy can increase. Using the examples of a road luminaire with a high-pressure sodium lamp and an LED luminaire, it was shown that such a phenomenon can occur. An assessment of maintenance in terms of energy performance indicators was performed for the luminaire using the indicators described in the lightning standard and those proposed by the authors of this paper. This approach allows for a comprehensive assessment of maintenance on energy performance indicators—energy efficiency.

1. Introduction

The energy efficiency of a road lighting installation is influenced by many factors, such as a correctly executed project with correctly adopted assumptions, the installation carried out by an entity with the necessary qualifications and experience, and, as the last factor, the planned and proper operation of the road lighting installation. Planned and proper operation of the installation should be understood as, among others, carrying out its maintenance under the adopted schedule. As a result of the operation of the installation and the influence of environmental conditions, the process of natural degradation of the installation occurs. This is accompanied by a gradual decrease in the value of the luminous flux due to the abrasion of light sources, dirt or dulling of the luminaire shades, etc. This process is inevitable, practically every engineering object is subject to it, and this fact must already be considered at the stage of designing the installation. When selecting luminaires for specific road conditions, the designer is obliged to develop an appropriate maintenance plan for it. The problem of improving the energy efficiency of a road lighting installation is a current topic and discussed by many authors [1,2,3,4,5,6,7]. In [1], Silva et al. propose the use of two energy efficiency indicators to assess the energy efficiency of the installation and one to assess the efficiency of the lighting installation. The overall assessment is performed based on the values of the proposed indicators and their weighting factors. A comprehensive analysis of the energy efficiency of the lighting installation is presented in examples by Boyce et al. [2]. The authors analyze, among others, the lighting requirements applicable in various countries and the financial aspects of conducting road lighting investments. In [3], Kyba et al. described the problem of ensuring appropriate lighting conditions on the road while minimizing electricity consumption and reducing light pollution. Gutierrez-Escolar et al. present an analysis of the use of the light source labelling system for a quick and simple assessment of the energy efficiency of road lighting installations based on experience in the Spanish market [4]. Campisi et al. analyze the use of LED technology for a comprehensive improvement of the energy efficiency of lighting in Rome in the case of old and heavily used lighting installations [5]. According to Kostic et al. [6], the change in technology and the potential use of luminous flux regulation are ways to achieve savings in electricity consumption and thus improve the efficiency of the installation. Beccali et al. also discuss Italian experiences in the aspect of improving the energy efficiency of installations [7]. A study published by Djuretic et al. and Zima et al. [8,9] showed that replacing HPS with LED luminaires can result in energy savings of 31–60%, and the use of dynamic dimming (e.g., during night hours) can achieve up to 58% additional savings [9]. An additional energy-saving solution could be the use of piezoelectric technology to power road lighting [10,11,12].
Achieving high energy efficiency of the installation is a multi-stage activity. Already at the stage of project implementation, the installation variant with the best possible efficiency should be selected. Even the best-designed installation must be made under high standards and then properly maintained. In this context, laser-based systems seem promising as they can offer non-contact and precise methods for assessing the technical condition of luminaires, monitoring pollution levels, or verifying the degradation of light sources, enabling more effective and predictive management of the entire lighting infrastructure [13,14,15]. Errors made at the initial stage of investment implementation will have a negative impact on its operation, and attempts to repair it by the investor or user may not bring the expected results. When designing, constructing, and operating a road lighting installation, the overriding goal is always road safety. Other aspects related to the operation of the road lighting installation, including the reduction in electricity consumption, should not affect road safety. During the modernization process of road lighting installations, in addition to the modernization of existing luminaires, their replacement with LED technology luminaires may be considered. This issue is described by Khan et al. in [16]. They compare lighting variants of the analyzed area using high-pressure sodium lamp luminaires and LEDs along with an economic analysis of the expected operating costs of the installation. Replacing high-pressure sodium lamp luminaires with LED technology luminaires poses new challenges. During the operation of the installation, a natural process of wear of light sources occurs. Already at the stage of designing the installation, the degree of degradation of light sources measured by the relative decrease in luminous flux and the speed of this process should be predicted. This issue is widely discussed by the authors in [17,18]. The use of new technology creates the possibility of improving the energy efficiency of the installation through the use of an intelligent control system and powering the installation from renewable energy sources, which is discussed by Chiradeja et al. [19]. Implementing modern road lighting systems based on LED technology and intelligent control leads to significant improvements in energy efficiency (up to 80%) and lower operating costs and ensures a rapid return on investment. These measures not only reduce CO2 emissions but also bring real financial benefits to local governments and road infrastructure managers. However, it should be noted that there are studies indicating apparent energy savings when using LED lamps [20].
To obtain the desired shape of luminous intensity distribution, LED luminaires are equipped with optical systems. During the operation of the luminaire, the impurities collected on the optical system cause a reduction in the luminous flux of the luminaire. The issues related to the measurement of photometric parameters of a luminaire and the influence of the optical system are discussed in [21].
According to results presented in [22], replacing luminaires with HPS lamps with LED luminaires saves energy but does not maintain similar illumination levels. Authors in [23] provide a simple linear model for estimating average luminance, uniformity, and energy efficiency in road illumination systems. LED luminaires provided marginally higher luminance per watt increment. Rofaie et al. [24] provide information about the energy efficiency of replacing an HID luminaire with an LED luminaire. To prove the energy efficiency of the lighting installation, it is possible to consider replacing luminaires with high-pressure discharge lamps with LED luminaires at the design stage [25,26,27]. The effects of replacing high-pressure sodium lamp luminaires with LED luminaires are discussed by Gordic et al. [25]. Additionally, the authors point to the potential possibilities of using luminous flux regulation for LED luminaires to reduce the energy consumption of the lighting installation. For various reasons, it is not always possible to replace all light sources with new ones, and there is a need for a transition period when luminaires made using different technologies will be used in a given installation. This issue is analyzed in detail by Orzáez [26]. Replacing luminaires will have consequences for the lighting installation. There may be a need for reactive power compensation, of a capacitive nature, analysis of the effect of inrush currents on unwanted activation of existing protections used to protect the installation against the effects of short circuits and overloads. Orzáez et al. deal with these important issues in [27].
It is always necessary to remember the possible negative impact of luminaires on the supply network due to the occurrence of higher harmonics in the supply current [28]. An important and widely described problem in the literature is the improvement of the energy efficiency of road lighting. One of the possibilities for improving the energy efficiency of road lighting is the use of control systems, which are often an integral part of the “smart city” [29,30,31,32,33,34,35,36,37,38]. Kovács et al. present the possibilities of using renewable energy sources to power the lighting installation, which requires the use of a dedicated control system in the installation [29]. In [30], Yoomak’s group compares the advantages and disadvantages of various lighting fixture technologies used in road lighting. The estimated benefits in the field of improving the energy efficiency of lighting installations in Indonesia are presented by Irsyad et al. [31]. The authors point to the need to perform energy audits of existing installations and to take appropriate actions to achieve the desired goal: to improve energy efficiency while ensuring road safety. To improve energy efficiency, Rabaza’s group [32] uses optimization using a genetic algorithm. The adopted objective function is to minimize the costs of energy consumption. Optimization is also used by Pizzuti et al. [33] to improve energy efficiency, but they additionally present the possibility of predicting the consumption of electricity by a road lighting installation for one hour in advance. In [34], Radulovic et al. present a method of managing electricity used for the needs of a road lighting installation based on an exemplary city. During an investment decision regarding a lighting installation, several factors should be considered. To make this task easier for investors, Carli et al. [35] present their tool to support making the right decision. The important problem of the occurrence of inevitable energy losses in the installation caused by the flow of operating currents and their impact on the energy efficiency of the installation was raised by Lobăo’s team [36]. The concept of intelligent lighting control via a wireless network is presented by Shahzad’s group in [34]. The influence of control on the obtained effects of improving energy efficiency was presented by the authors in [38], based on their experience from one of the cities in Poland. The improvement of the energy efficiency of the installation can be achieved by reducing the power of the luminaire during, for example, reduced road traffic. At the same time, advanced road lighting control systems provide additional functionalities for the user of the installation in the form of real-time monitoring of the entire installation and ongoing detection of potential failures of individual luminaires. In the case of planning and modernization of existing installations, in addition to the analyzed energy efficiency, the economic aspect of such activities is also important [39]. It is convenient to use appropriate indicators to assess the energy efficiency of a lighting installation. They have been introduced in subject standards concerning lighting design [40,41,42,43]. Some authors dealing with these issues in their works also propose their way of defining them [44,45]. The indicators defined in [43] assume that only the active power drawn from the network is considered in the analysis. Regardless of the type of luminaire, especially when using luminous flux control systems, there is also a problem of reactive power consumption and the occurrence of higher harmonics in the current supplying the luminaires, which is described in [46,47]. Adequate measurement of the photometric parameters of road luminaires is also an important aspect. This issue is described in [48] and [49]. Sikora et al. [50] introduced the new energy performance indicators that consider reactive power and distortion power in addition to active power. Typically, the above indicators are used to compare different variants of road lighting during the design stage. This paper shows their use to assess the quality of maintenance activities for the case of road lighting installations. In [51], the comparative results of high-pressure sodium lamps with other light sources, such as commercially available LED and metal halide lamps, are presented. The light rays emitted by the sodium lamp cause the brightness to be the highest directly under the lamp. This lamp is characterized by longitudinal uniformity and total uniformity only slightly lower than the standard road lighting. The color rendering index is only 20 to 40, making it difficult to distinguish the color of objects under this light. Metal halide lamps, despite their high light efficiency, long operating time, and good color rendering, are not environmentally friendly due to the mercury contained in them.
According to information provided by Tomczuk et al. [52], approximately 3.3 million street luminaires were installed in Poland in 2021. Of this number, approximately 60% were sodium-vapor lamps (HPS or mercury vapor), which are characterized by lower efficiency and often a shorter lifespan. The remaining ~40% were LED luminaires, resulting in approximately 1.3 million LED lamps and 2.0 million sodium-vapor lamps [52]. HPS luminaires will be in use for a relatively long time. For this reason, installations with HPS luminaires should not be omitted from analyses of energy performance indicators.
For many years, road lighting has used luminaires with high-pressure sodium (HPS) lamps and metal halide lamps and, recently, LED luminaires. HPS luminaires and luminaires with metal halide lamps are similar in design and operating principles. However, LED luminaires are built using LEDs, which require a different power supply system. The basic element of a discharge lamp’s operating system is a magnetic or electronic ballast, and initiating the discharge in the lamp requires an ignition system. In the case of an electronic ballast, the ignition system is integrated with it. The optical systems of luminaires with discharge lamps used in road lighting consist of a reflector and a lens. In the case of LED luminaires, these primarily consist of lenses, which can also function as a lens. There are also many design solutions for LED luminaires, with lenses made of glass or plastic. Sodium-vapor luminaires are characterized by relatively high luminous efficacy (80–100 lm/W) at the expense of a low color rendering index Ra (20–30). Metal halide luminaires have a luminous efficiency of 60–80 lm/W, with a much higher color rendering index Ra (up to 95). The luminous efficiency of LED luminaires, depending on the LEDs used, ranges from approximately 100 lm/W to as much as 250 lm/W [8,24,26,27,53,54,55,56].
The magnetic ballast used to stabilize the discharge lamp current is a source of significant active power losses. The inductive character of the luminaire necessitates the use of a capacitor to compensate for reactive power, as without it, the power factor would be too low (around 0.6–0.8). Due to their design, discharge lamp luminaires generate higher power losses. Luminaires with discharge lamps using magnetic ballasts and capacitors for reactive power compensation generate disturbances in the mains in the form of higher current harmonics. Using an electronic ballast limits both the active power consumption of the ballast and the generated higher current harmonics [57,58]. In LED luminaires, the LED array is powered by direct current (DC). Modern switching power supplies used to power LED arrays are characterized by high efficiency, a high power factor, and low current distortion—the current THD can be less than 10%. The most important difference between LED luminaires and luminaires with discharge lamps is the ability to regulate the luminous flux (active power). The luminous flux of an LED luminaire can be regulated from 10% to 100%. In luminaires with discharge lamps, this range is usually smaller and depends on the control system used. LED luminaires typically last 50,000 to 100,000 h, which translates to 10–15 years without requiring replacement. In comparison, traditional HPS lamps require replacement every 3–5 years. This translates to a 60–80% reduction in service costs thanks to less frequent maintenance [8,24,26,27,53,54,55,56].
This paper presents the possibility of using the energy performance indicator on the energy efficiency and electrical power quality for two cases. The first case is the evaluation of maintenance performed for a road lighting luminaire with a 100 W high-pressure sodium lamp. The second is the selection of an LED luminaire used in the case of modernization of the road lighting installation for a road with previously used HPS luminaires. It was assumed that the road geometry and the spacing between the poles did not change. Four LED luminaires meeting the standard requirements regarding road lighting parameters were selected for analysis.
A comparative analysis of the impact of maintenance on the lighting parameters on the road was performed, and energy performance indicators were calculated in accordance with the standard [43] and the new indicators proposed in [47]. In order to calculate all energy performance indicators, an analysis of the voltages and currents must be carried out, and an apparent power decomposition must be performed. For this purpose, it is necessary to have the results of measurements of the electrical parameters of the luminaires made under laboratory conditions. In practice, it is often not possible to obtain such detailed information on the electrical parameters of luminaires. For luminaires whose current distortion is very small (for example, current THD of less than 10%), the analysis can be limited to active and reactive power only. This article presents the results of calculating total energy performance indicators, taking into account only active and reactive powers. In addition, the results obtained were compared with calculations considering active, reactive, and distortion powers.
Section 2 contains the relationships used to calculate the energy performance indicators. Section 3 contains the results of the comparative analysis of the photometric and electrical parameters of the luminaire and the lighting parameters on the road for the luminaire with an HPS lamp before and after maintenance. In Section 3, the calculation results of the lighting parameters on the road for LED luminaires with four optics are presented. Next, in Section 4, we present the results of the calculations of the energy performance indicators, which were used to assess the impact of maintenance and replacement of luminaires with an HPS lamp on energy efficiency.

2. Materials and Methods

2.1. Definition of Energy Performance Indicators

In the standard [43], two energy efficiency indicators were introduced: the power density indicator (PDI), marked as DP, and the annual electricity consumption indicator (AECI), marked as DE. The value of the DP indicator is determined from relationship (1):
D P = P i = 1 n E i ¯ A i
where P is the active power taken by the installation, Ē is the average value of lighting intensity in a given area, and Ai is the surface area of a given area. The value of the active power P is determined by Equation (2):
P = k = 1 n P k + P a d
where the power Pk is the active power of individual light points and the power Pad is the active power of other devices necessary for the proper functioning of the lighting installation. The second annual energy consumption indicator introduced in [43] is determined from relationship (3):
D E = j = 1 m P j t j A
where Pj is the active power of the j-th light point, tj is its operating time, and A is the surface area of the lit area.
The energy efficiency indicators introduced in [40] assume that the lighting installation receives only active power P from the supply network. Aspects related to the consumption of reactive and distorted power are omitted. Two new energy efficiency indicators, introduced in [50], take into account the fact that the installation draws reactive power, and these are the reactive power density indicator DQ and the annual reactive energy consumption indicator DEQ. The DQ index value is described by Equation (4):
D Q = Q 1 i = 1 n E i ¯ A i
The DEQ indicator is described by Equation (5):
D E Q = j = 1 m Q j t j A
All types of luminaires used in lighting are nonlinear receivers from the point of view of the supply network, and therefore, their operation is accompanied by the occurrence of higher harmonics in the supplying current. The effects of the distortion power on the energy efficiency of the installation are included in the distortion power density indicator DH and the annual distortion energy consumption indicator DEH. The value of the DH indicator is determined from Equation (6):
D H = S N i = 1 n E ¯ i · A i
The DEH indicator is determined from equation (7):
D E H = j = 1 m S N j t j A
In [50], the DT and DTE indicators described by Formulas (8) and (9) were also proposed. These indicators can be presented as a vector in the Cartesian coordinate system. As the length of the DT and DTE vectors shorten, the road lighting installation is characterized by lower electricity consumption and a smaller impact on the quality of the supply voltage.
D T = D P 2 + D Q 2 + D H 2
D T E = D E 2 + D E Q 2 + D E H 2
To calculate DH and DEH, it is unfortunately necessary to perform measurements, preferably in laboratory conditions. Manufacturers of luminaires do not provide information in their catalog cards that can be used to calculate the aforementioned indicators. If the measurement of higher harmonics is impossible, then the DT and DTE indicators can be calculated taking into account only the active and reactive power. Knowing the value of the power factor of the lighting luminaire, the value of the reactive power of the luminaire can be calculated. The relationships describing DT and DTE in such a case take the following forms:
D T P Q = D P 2 + D Q 2
D T E P Q = D E 2 + D E Q 2

2.2. Characteristics of the Selected Road Luminaires

A luminaire with a 100 W high-pressure sodium lamp and four luminaires made with LED technology were selected for the tests. The selected LED luminaires are substitutes for the luminaire with a high-pressure sodium lamp in terms of ensuring the lighting parameters required by the EN 13201 standard [40,41,42,43] on the road. The HPS luminaire used in the tests was dismantled from the existing road lighting installation. The technical condition of the luminaire required several maintenance activities to restore its required functionality. The operating time of an HPS luminaire is difficult to determine. However, it can be estimated at approximately 25–30 years. The lamp’s operating time, assuming a typical maintenance schedule and the durability of an HPS lamp, should not exceed 5 to 10 years.
Four commercially available LED luminaires were used for the tests. Each luminaire differs from the others in terms of both the LEDs used and the optical systems. In addition, each luminaire uses a different type of power supply/controller to power the LED matrix. LED luminaires are characterized by a different design of the housing, which functions as a heat sink, which also affects their operation. To present the usability of the energy performance indicators developed by the authors, calculations and comparisons of the aforementioned indicators were performed for the HPS luminaire before and after maintenance activities and for the LED luminaires. The possibilities offered by the use of the developed energy performance indicators were shown both in the assessment of maintenance activities and during the modernization of the road lighting installation.
The HPS luminaire directly dismantled from the installation was marked as “Before maintenance”, while after maintenance, it was marked as “After maintenance”. As mentioned earlier, one HPS luminaire dismantled from an existing road lighting installation was selected for testing. In the first stage, measurements were taken of the luminaire before maintenance was carried out. The luminaire was then maintained. Maintenance activities consisted of comprehensive cleaning of the interior of the luminaire, replacing the worn lampshade with a new one, and replacing the light source. A new high-pressure sodium lamp was used for testing. It was operated for 100 h to stabilize its photometric and electrical parameters. Traces of many years of use were found on the ballast, and a capacitor for reactive power compensation was missing. The capacitor was probably damaged and removed from the luminaire earlier, and a new one was not installed.
The electrical parameters of the tested road lighting luminaires were measured using the TOPAS 1000 power quality analyzer (LEM Norma GmbH, Wien, Austria). Before performing the measurements, the tested HPS and all LED luminaires were illuminated for 1 h for the purpose of stabilizing photometric and electrical parameters. To take into account the effect of supply voltage distortion, the luminaires were supplied with mains voltage. The luminous flux was measured in an integrating sphere with a diameter of 2 m and an L-100 luxmeter (Sonopan sp. z o.o., Białystok, Poland). To perform calculations of lighting parameters on the road, it is also necessary to use files containing data on light distribution curves. For this purpose, all tested luminaires were photometered using a goniophotometer. The measured values of the luminous flux of the HPS luminaire are included in Table 1. Table 2 summarizes the results of measurements of the electrical parameters of the HPS luminaire before and after maintenance activities.
The luminous flux of the HPS luminaire increased by 50.75% after maintenance, and its efficiency, calculated as the ratio of luminous flux to the light source power, rose by 36.07%. The main reasons for the increase in luminous flux and energy efficiency are primarily the replacement of the lampshade, cleaning of the reflector, and replacement of the lamp.
The lamp replacement caused a small increase of 4.76% in the active power drawn by the HPS luminaire. In addition, the reactive power consumption increased by 25.56%. This affects the value of the PFD and PFDD power factor, causing its value to decrease. The change in the active and reactive power values is most likely caused by the change in the ballast operating point because the new lamp draws more current and the operating point of the ballast-lamp system changes. The THDI coefficient value after the lamp replacement does not exceed 10%. The current distortion of the luminaire is, in this case, smaller than for luminaires equipped with a capacitor (for such luminaires, the THDI value usually does not exceed 30–40%). Performing maintenance activities resulted in a significant increase in the luminous efficacy of the luminaire by 36%.
The luminous intensity distribution obtained from the measurements before and after maintenance is presented in Figure 1a,b. The dirtiness of the lampshade significantly altered the intensity distribution curves.
The maintenance work increased the average value of directional luminous intensity by almost 50%. For the C90–C270 planes, thoroughly cleaning the remaining dirt caused a significant change in the luminous intensity distribution. Long-term use had a significant impact on the change in the shape of the luminous intensity distribution, obviously influencing the unfavorable change in lighting parameters on the road and energy efficiency.
As previously mentioned, four LED luminaires treated as HPS luminaire replacements were tested. They were marked as LUM1, LUM2, LUM3, and LUM4. The measurements of photometric and electrical parameters were performed in the same way, using the same measuring equipment as in the case of the HPS luminaire. The results of the measurements of electrical parameters of the LED luminaires are presented in Table 3.
The LUM2 luminaire has the lowest luminous flux and active power values of 5484 lm and 40.01 W, respectively. The highest luminous flux and active power values are in the luminaire marked as LUM4. The luminous flux of this luminaire is 9428 lm, and the active power is P = 56.20 W.
The lowest value of the luminous flux is characteristic of the LUM2 luminaire. It also draws the lowest active power value equal to 40.01 W. All LED luminaires are capacitive receivers. The highest reactive power is drawn by the LUM4 luminaire (Q = 14.55 var), and the lowest is drawn by LUM2 (Q = 8.46 var). None of the luminaires exceeded the permissible value of the tgφ = 0.4 coefficient. Of course, the permissible tgφ value may be different for each country. However, for European countries, the value of tgφ = 0.4 is often referred to in regulations.
Analyzing the current distortion of the luminaire based on the THDI coefficient value, it can be stated that the LUM3 luminaire has the highest value and the LUM2 luminaire the lowest. They are 29.23% and 7.17%, respectively.
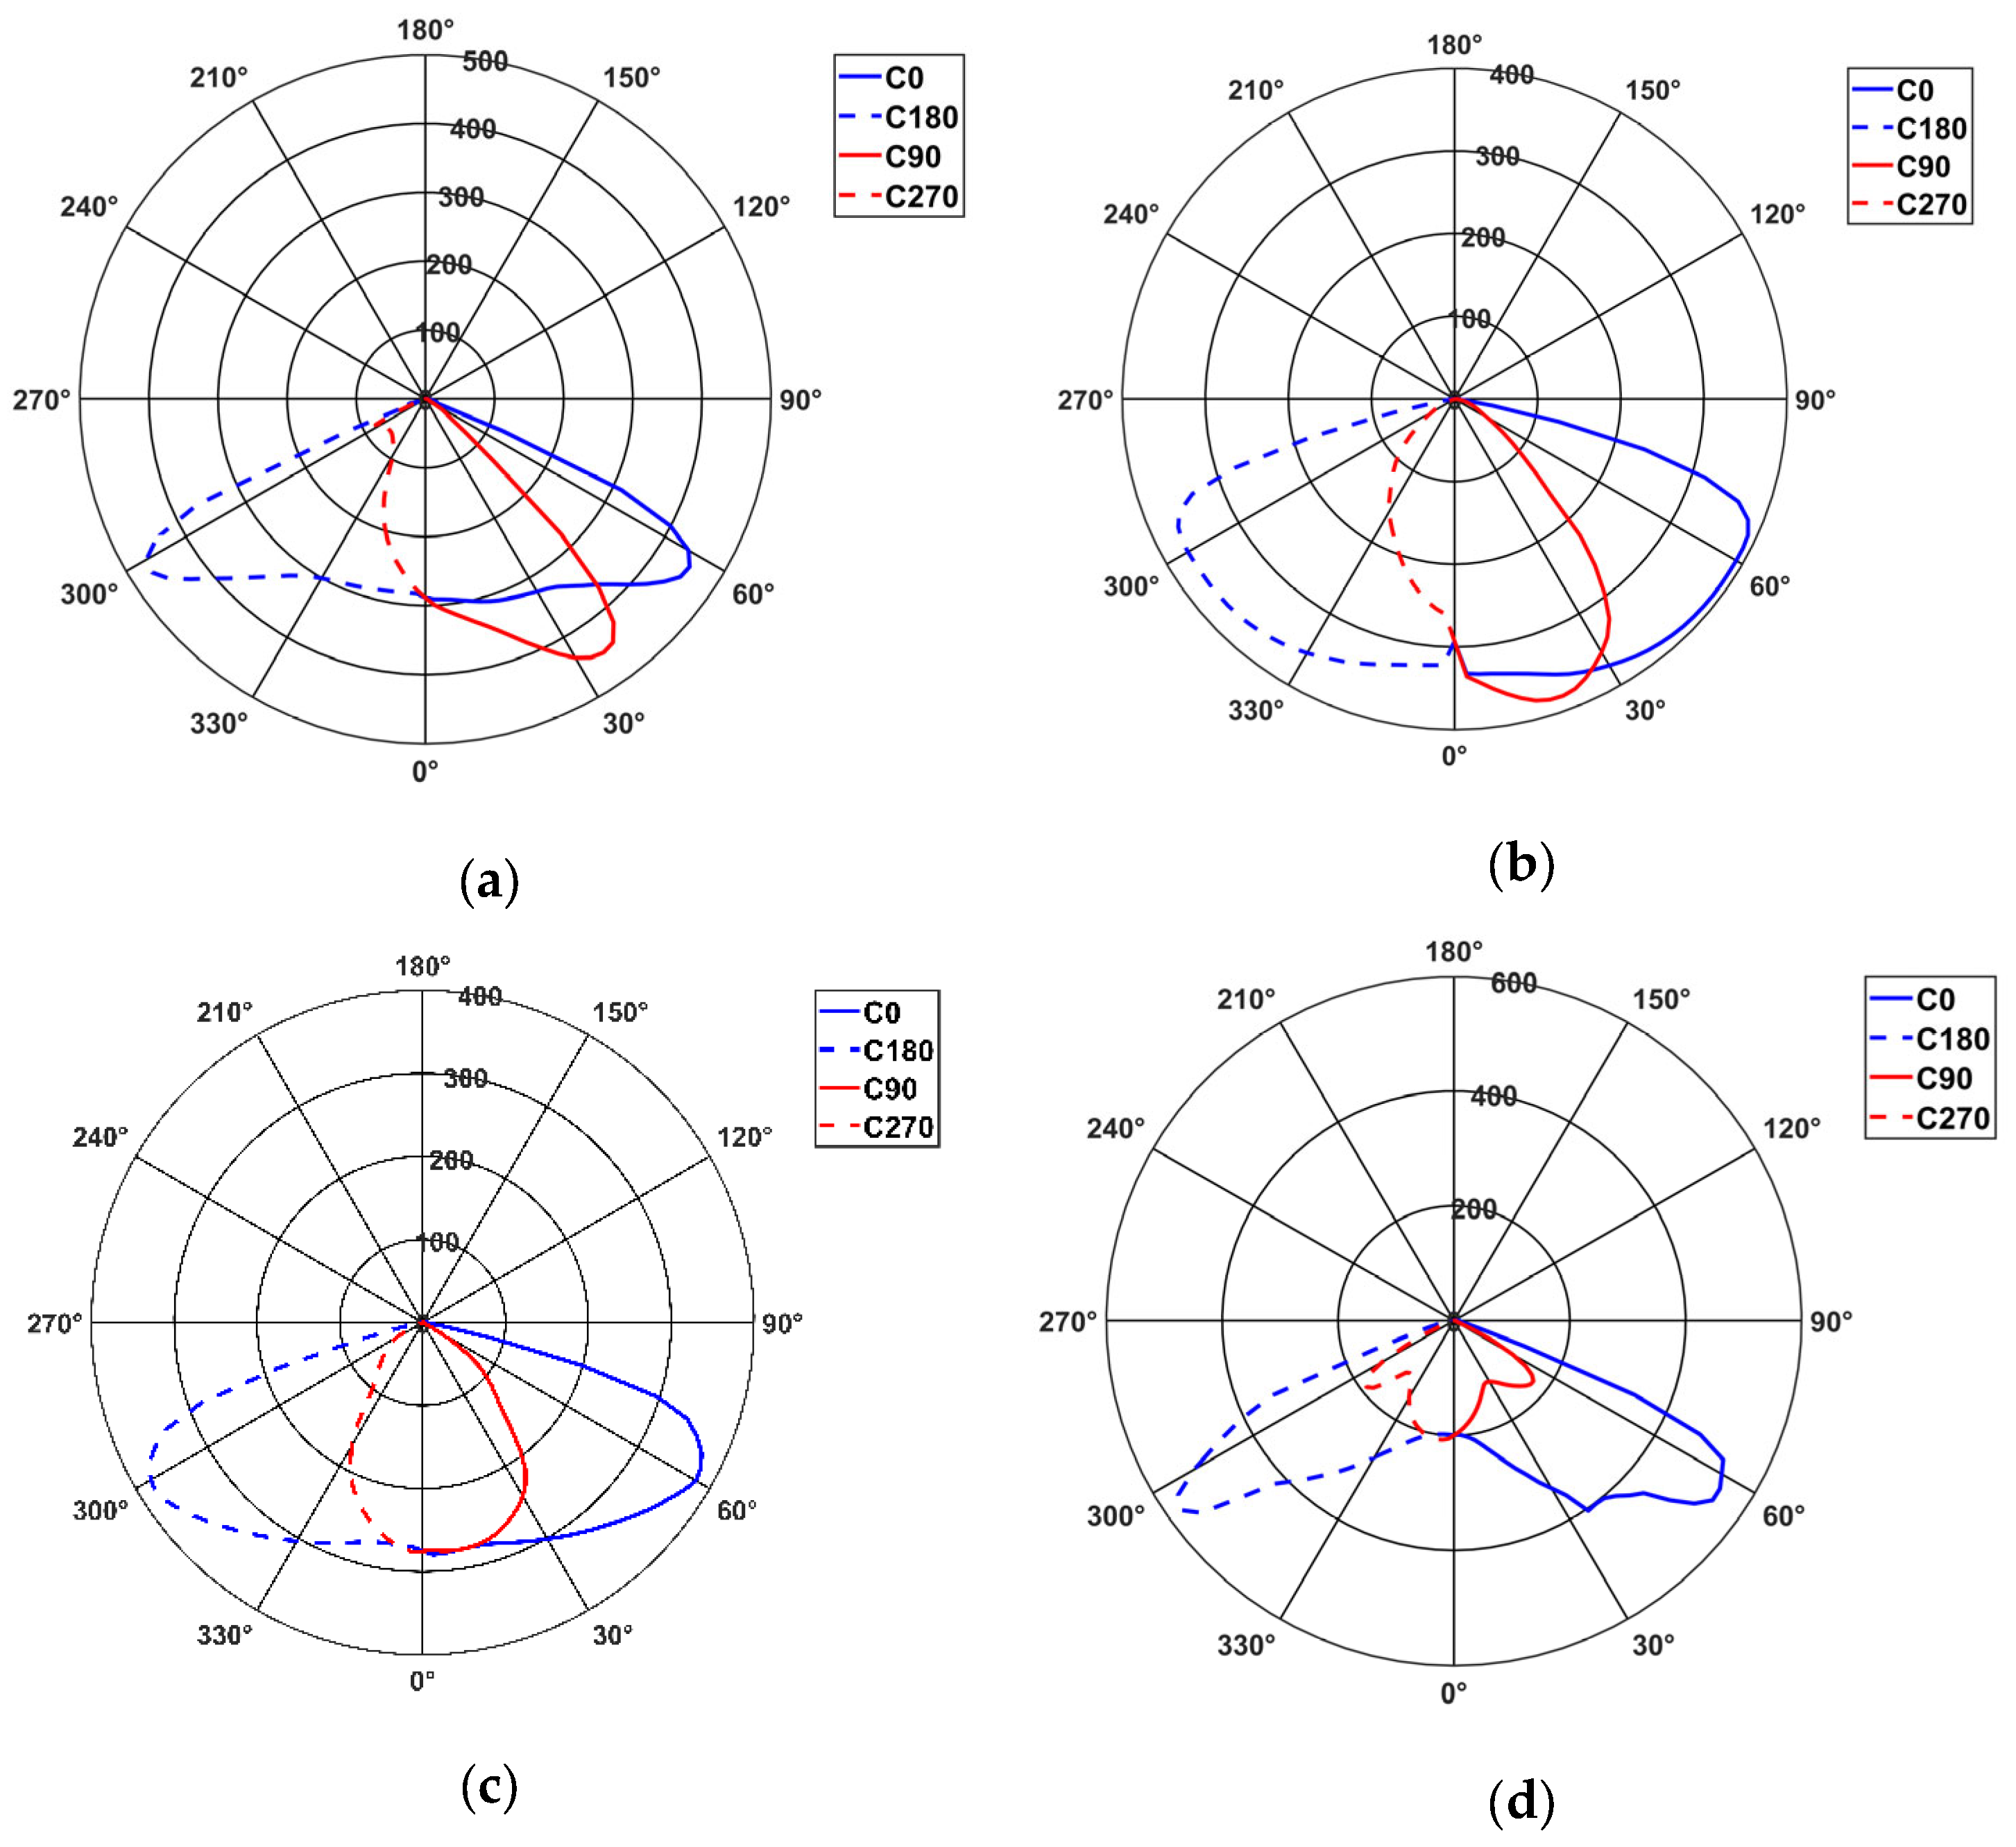
Figure 2 shows the measured luminous intensity distributions of the LED luminaires analyzed. The luminous intensity distributions of the LED luminaires are typical for luminaires used in road lighting. However, significant differences can be observed between them.

3. Results of the Lighting Parameters Calculation on the Road

A road with lighting class M4 and type of surface R3 was selected for the analysis. The geometric parameters of the analyzed road are presented in Table 4. The first stage of retrofitting is to carry out a lighting design. At this stage, a luminaire is selected that meets the requirements for the lighting class following the requirements of the standard [38]. Using the eulumdat files created based on measurements, calculations of lighting parameters on the road were performed in the DIALux program. The calculations were performed for the LED luminaires and HPS luminaires before and after maintenance activities. The calculations were based on the geometric parameters and lighting class of the road described in Table 4. The maintenance factor value assumed in the calculations was 0.70 for HPS luminaires and 0.80 for LED luminaires.
The results of the calculations performed in DIALux for the HPS luminaire before and after the maintenance activities are shown in Table 5.
Degradation and contamination of the HPS luminaire cover, together with the degradation of the light source itself, cause a significant reduction in the luminance value on the road. In this condition, the requirements for the assumed road class M4 are not met. Analyzing the requirements presented in [41], in this case, the requirements of only the lighting class M6 are met. It will obviously significantly worsen road traffic safety on the analyzed road section.
The exploitation level of the light source and the technical condition of other structural parts of the HPS luminaire result in a luminance drop of 40 to even 60%. The area where luminance is the highest changes significantly.
The results of calculations performed in the DIALux program for the LED luminaires are presented in Table 6. The normative requirements were met for all luminaire variants.

4. Use of Energy Performance Indicators to Compare the Electrical Energy Consumption of a Luminaire Before and After Maintenance

Energy performance indicators taken from the EN 13201-5 standard [43] and proposed by the authors in [50] were used to compare the electricity consumption of the analyzed road lighting installation before and after maintenance. The energy performance indicators were calculated based on the electrical parameters of the luminaire obtained from measurements and the road lighting design described in Section 2.2. The definitions and relationships describing the energy performance indicators are provided in Section 2.1. To calculate the DH distortion power density indicator and DEH annual distortion energy consumption indicator for a road lighting installation, it is necessary to perform power decomposition following the IEEE 1459 standard [59]. The results of current and voltage measurements and calculations are shown in Table 7. Table 8 presents the results of power decomposition following IEEE 1459 [59] for HPS and LED luminaires. The annual lighting time ta is required to calculate the annual energy consumption indicators. The value ta = 3950 h was assumed for the calculations, which was calculated based on the astronomical calendar. The indicators were calculated for the area illuminated by a single luminaire. The value of the average illuminance was obtained as a result of calculations in the DIALux program (Table 5 and Table 6). The calculations did not include power losses and powers Pa of other devices necessary for the operation of the road lighting installation.
In all analyzed cases, the luminaires were supplied from a mains in which the supply voltage is not a pure sinusoid. This fact is indicated by the non-zero values of the total voltage distortion coefficient THDV (Table 7). For the luminaire labeled “After maintenance,” the total apparent power taken from the mains is much greater than the same power for the luminaire labeled “Before maintenance.” After the decomposition of apparent power S for all tested luminaires, in addition to the total apparent power S1 for the fundamental harmonic current and voltage, its components appear, such as the distortion power resulting from the distortion of the supply current DI, the distortion power resulting from the distortion of the supply voltage DV, harmonic apparent power SH, and non-fundamental apparent power SN (Table 8).
Table 9 and Table 10 show the results of calculating the energy efficiency indices for the analyzed HPS luminaire and LED luminaires. The proposed energy efficiency indices are primarily intended to facilitate the comparison of lighting installations in terms of energy efficiency and power quality. The use of the indicators proposed in [47] means that not only the active power consumed by road lighting installations is taken into account but also the reactive and deformed power. In this way, the comparison of both new and modernized variants of road lighting installations will allow for the selection of the best solution in terms of energy efficiency and power quality. Additionally, the values of DPQT and DPQTE indicators, taking into account only reactive power, were calculated according to relations (10) and (11).
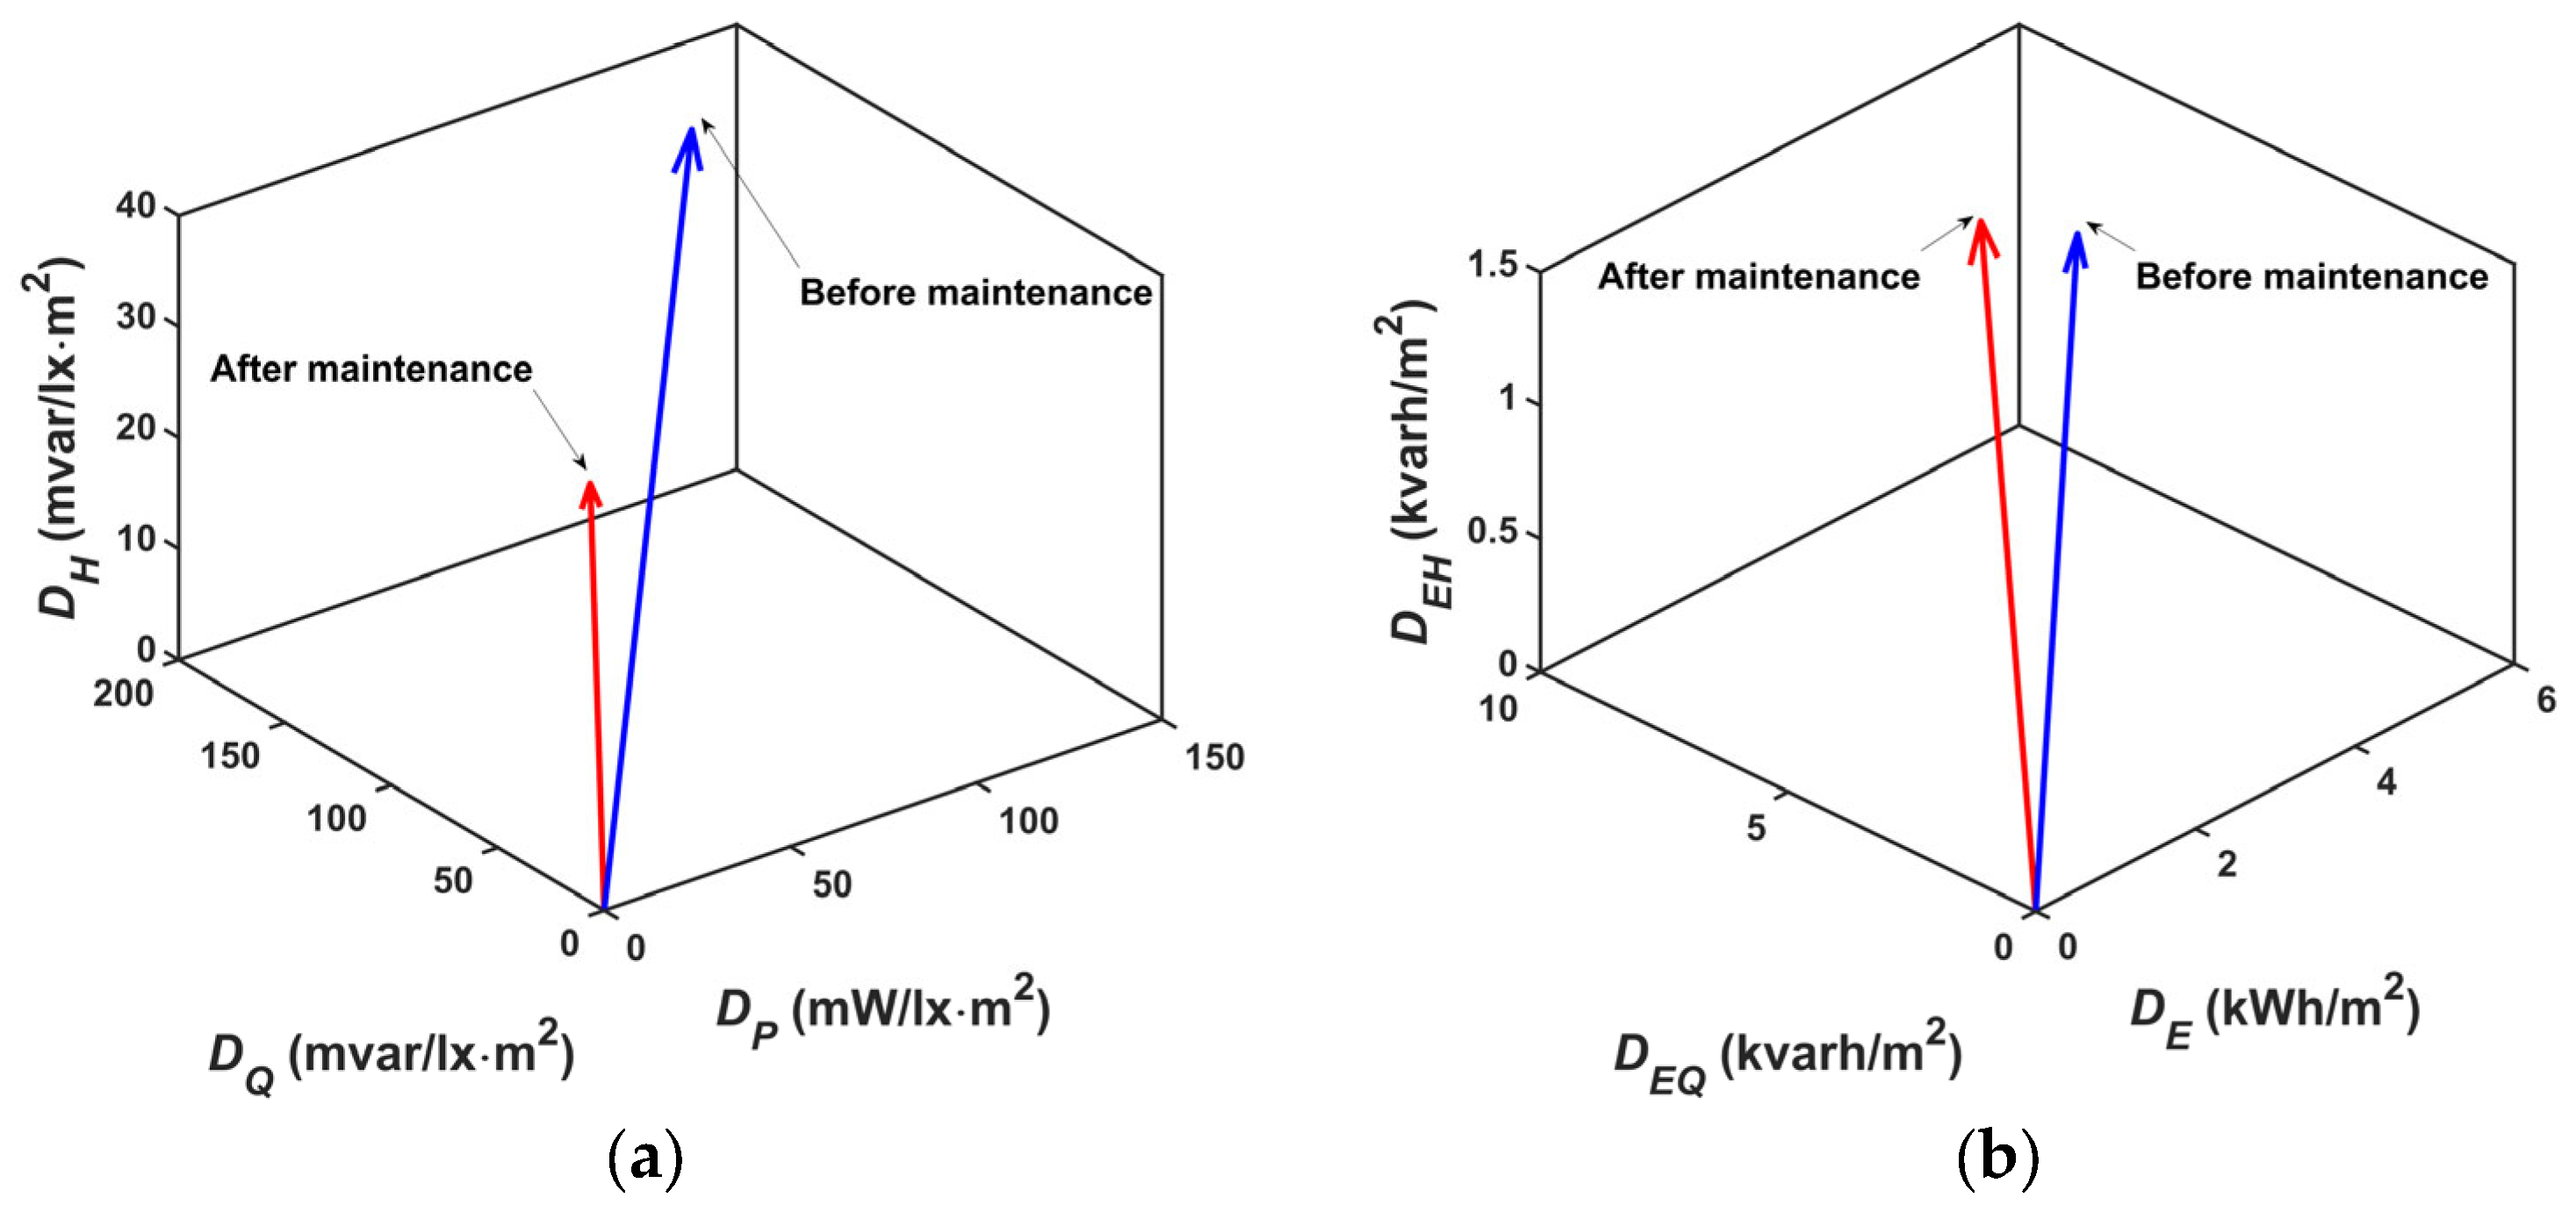
By analyzing the results obtained from the calculation of energy performance indicators for the HPS luminaire before and after maintenance, the following conclusions can be formulated. The performance of maintenance activities causes the active power density index DP to drop by as much as 42.22%. This is due to the significant drop in the average illuminance for the luminaire marked as “Before maintenance” despite drawing a similar active power value from the network as for the “After maintenance” luminaire. The value of the reactive power density index DQ behaves in a similar way, with the difference being that this drop is significantly smaller and amounts to 26.12%. The largest observed difference in the values of the indices occurs for the distortion power density indicator DH for both analyzed cases. Its value for the luminaire marked as “Before maintenance” is twice as high as for the one marked as “After maintenance”. The value of the DT indicator for the luminaire marked as “clean” is lower by 27.49% compared to the “dirty” luminaire. The drop in the value of the annual distortion energy consumption indicator DEH for the “clean” luminaire is a direct consequence of its smaller negative impact on the supply network, which is confirmed by the lower value of the THDI factor (Table 2). The remaining indicators, depending on the amount of energy consumed, are slightly higher for the “After maintenance” luminaire than for the “Before maintenance” luminaire, which results from a different operating point of the light source and, consequently, slightly higher power supplied from the supply network (Table 1). The determined DT and DTE indicators for the HPS luminaire before and after maintenance can be presented as vectors in the space of power or energy density, respectively, as shown in Figure 3. In this way, the differences in the values of the analyzed indicators, which are the lengths of the vectors shown in Figure 3, can be seen directly. The location of a given DT (DTE) vector in a given space depends on the share of individual components resulting from active and reactive power (energy) and deformation in its value. As can be seen, the values of the total energy consumption indicator DTE for the installation with the luminaire after maintenance increased by 24.84%. This is mainly due to the replacement of the light source. The luminaire with a new lamp consumes more active power, but the consumption of reactive power has increased significantly. If the analysis does not consider the influence of reactive power, then, when comparing the AECI DE indicator value, the increase in energy consumption will only increase by 4.45%.
In the case when only active and reactive powers are taken into account in the analysis, the DPQT and DPQTE indices can be presented as vectors in the 2D plane, as illustrated in Figure 4a,b. Neglecting the share of deformation power causes an underestimation of the luminaire before maintenance equal to 1.03% and 1.11% for DT and DTE, respectively. For the HPS luminaire after maintenance, the underestimation is even smaller and amounts to 0.50% for DT and 0.53% for DTE.
Energy performance indicator calculations were also performed for the LED luminaire, and the results are presented in Table 10. Based on the energy performance indicator calculations, it can be concluded that the best choice is to use the luminaire marked as LUM2. For this luminaire, all the indicator values are the lowest.
Failure to include the distortion power DI (SN) in the energy performance indicator calculations will result in a slight decrease in the values of the DT and DTE indicators. Failure to include the effect of the luminaire current distortion (distortion power) in the calculations for the LUM1 luminaire will result in a decrease in the DT and DTE values by 1.63% and 1.59%, respectively.
In the case of the luminaire marked as LUM2, the above indicators decreased by 0.32% and 0.59%. Due to the lowest current distortion, the decrease in the DT and DTE values is the smallest. The largest difference between DT and DPQT and DTE and DPQTE occurred in the case of the LUM3 luminaire by 4.22% and 4.42%, respectively. For the LUM4 luminaire, these differences are 0.55% for DT and 0.83% for DTE.
Limiting the calculation of energy performance indicators to active and reactive power only will result in an underestimation of the total DT and DTE indicators by less than 5%. From a practical point of view, this underestimation is acceptable. However, performing a full analysis taking into account active, reactive, and deformation power will enable an accurate comparative analysis of road lighting variants.
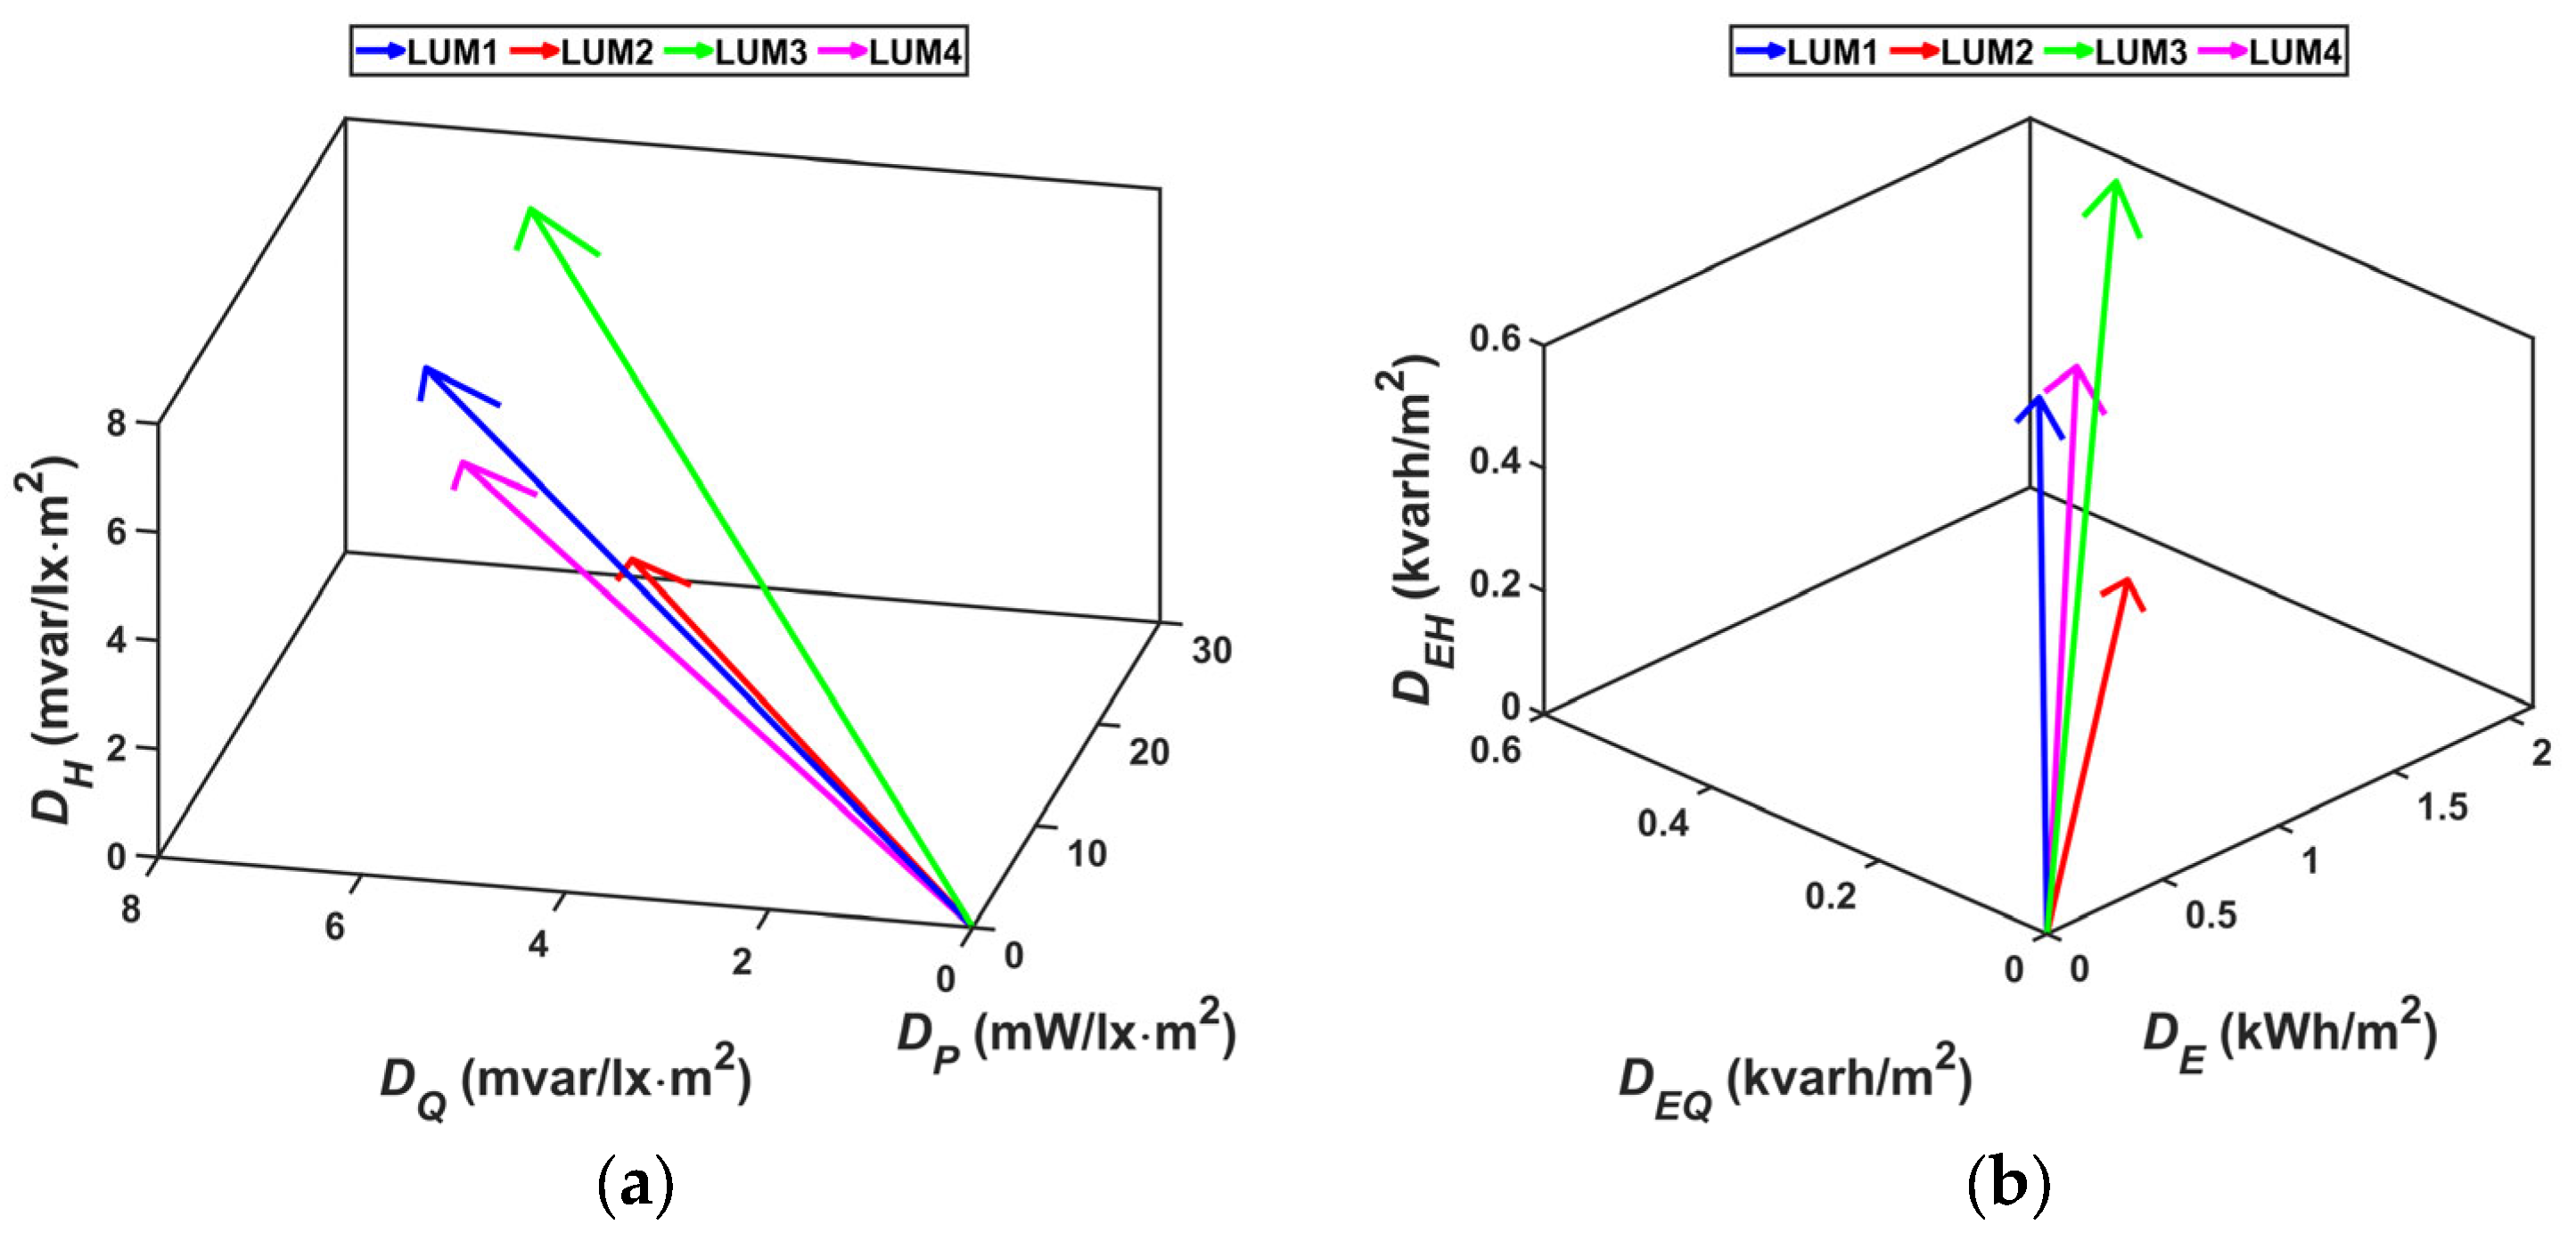
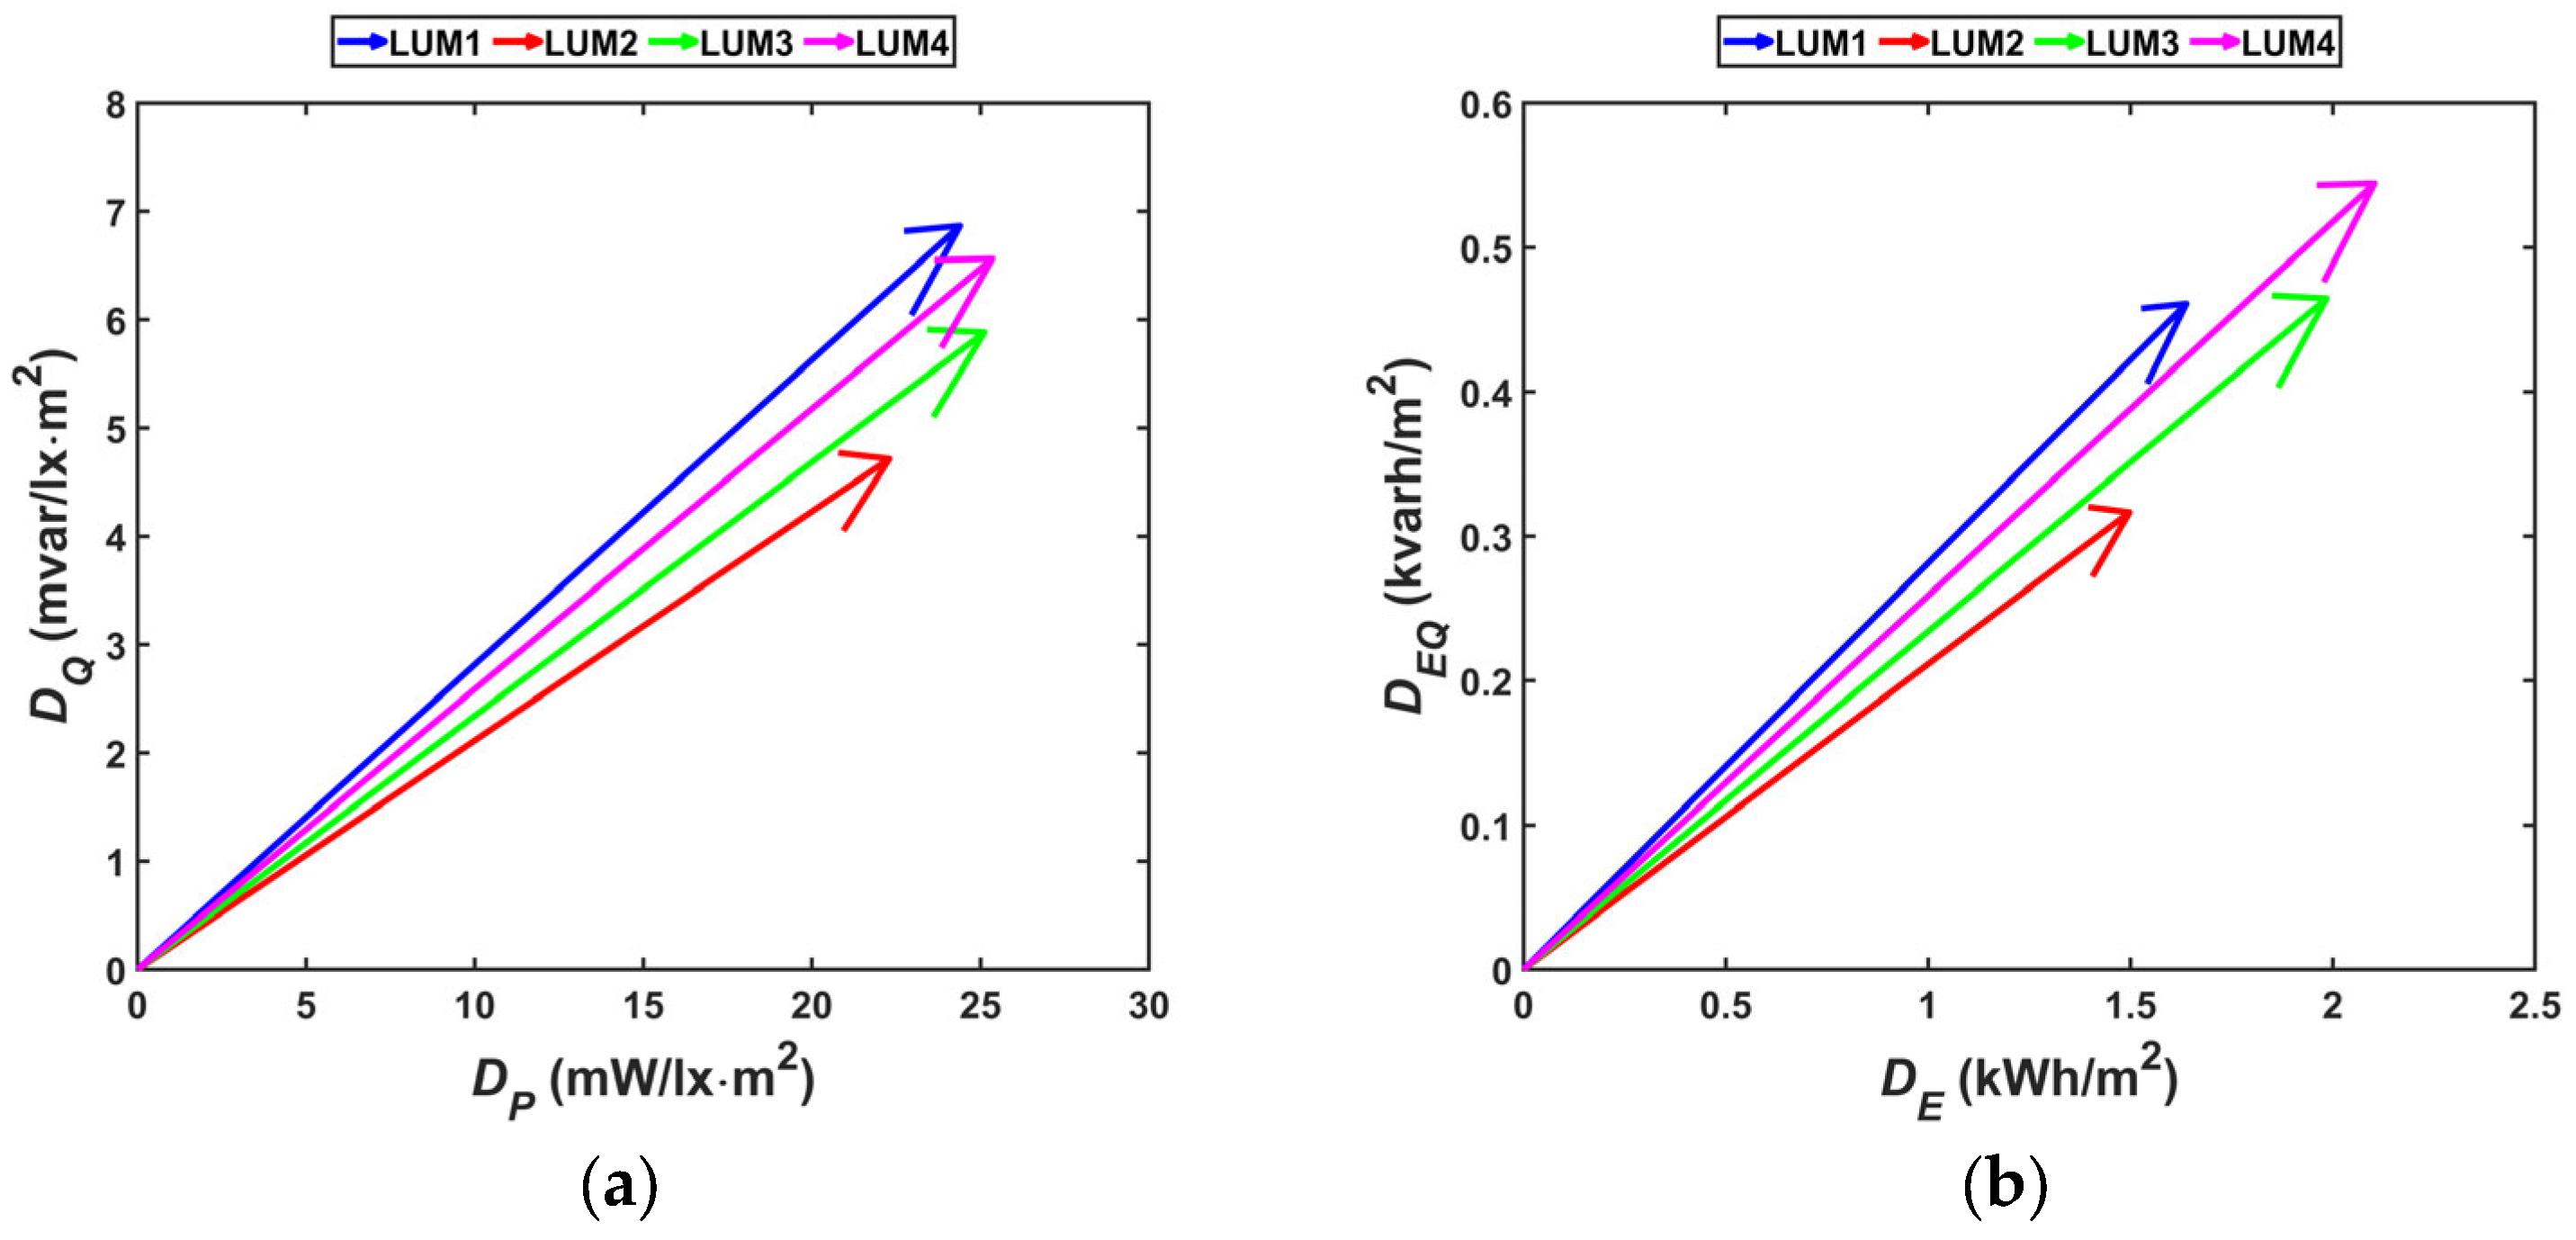
The graphical interpretation of the DT and DTE indicators is presented in Figure 5a,b. Figure 6a,b show the DPQT and DPQTE indicator vectors on a 2D plane. By comparing the lengths of the vectors, one can visually select the best road lighting variant, i.e., a luminaire.
The calculated values of energy performance indicator reduction for road lighting installations with HPS luminaires before and after maintenance, concerning the calculated energy performance indicators for the LUM2 luminaire, are presented in Table 11.

5. Conclusions

High energy efficiency is one of the basic features that every properly designed and operated lighting installation should have. It primarily determines the operating costs of a given installation and its impact on the natural environment by reducing the consumption of electricity, which, in turn, means a smaller amount of pollutants emitted into the atmosphere during the production of electricity. Conscious operation of the installation is a task that falls to the investor or end user. It is their responsibility to use it and perform any repairs and periodic maintenance. Those activities should be carried out by entities or people with appropriate knowledge and experience in this area. Failure to perform maintenance activities always leads to a significant deterioration of lighting conditions. This paper presents the results of a comparative analysis of road lighting installations using the energy performance indicators proposed previously by the authors.
The analysis was conducted to demonstrate the impact of neglecting maintenance activities on the operation of the installation and its energy efficiency on the example of an HPS luminaire. The operation of a worn-out lighting luminaire in the installation causes a significant increase in the active power density (Dp indicator value) and a noticeable increase in the reactive power density (DQ indicator value). An old and outdated installation significantly increases the negative impact of the lighting installation on the supply network (DH index value). Unfavorable aspects of the installation operation concerning reactive power (energy) and its impact on the supply network are visible only after supplementing the indicators proposed in the subject standards, additionally introduced by the authors.
The calculation of energy performance indicators based only on active and reactive power is, from a practical point of view, acceptable, particularly for LED luminaires, due to the relatively small deformation of the luminaire’s current. Manufacturers usually specify power factor values in their data sheets. Knowing the power factor value, one can easily calculate the reactive power and, thus, the DQ and DEQ factors.
The use of an LED luminaire, regardless of the variant of optics used, significantly improves the energy efficiency of the installation under consideration. This is expressed by a large decrease in all energy efficiency indicator values compared to a luminaire with an HPS lamp. If the distortion of the current received by the luminaires is relatively small, e.g., THDI less than 10–15%, the underestimation of the total energy performance indicators does not exceed 5%.
In the case of a multi-variant analysis of lighting conditions, the proposed method of assessing energy efficiency facilitates the selection of the best variant among those analyzed at the stage of designing the lighting installation. A comprehensive assessment of the installation operation should include an analysis of all possible phenomena that affect energy efficiency and, above all, lighting parameters on the road.

Author Contributions

Conceptualization, R.S. and P.M.; methodology, R.S. and P.M.; validation, R.S., P.M. and E.K.; data curation, R.S. and P.M.; writing—original draft preparation, R.S., P.M. and E.K.; writing—review and editing, R.S., P.M. and E.K.; supervision, E.K. All authors have read and agreed to the published version of the manuscript.

Funding

This research received no external funding.

Data Availability Statement

The data can be available on the request.

Conflicts of Interest

The authors declare no conflicts of interest.

References

  1. Silva, J.; Mendes, J.F.G.; Silva, L.T. Assessment of energy efficiency in street lighting design. WIT Trans. Ecol. Environ. 2010, 129, 705–715. [Google Scholar] [CrossRef]
  2. Boyce, P.R.; Fotios, S.; Richards, M. Road lighting and energy savings. Light. Res. Technol. 2009, 41, 245–260. [Google Scholar] [CrossRef]
  3. Kyba, C.C.M.; Hänel, A.; Hölker, F. Redefining efficiency for outdoor lighting. Energy Environ. Sci. 2014, 7, 1806. [Google Scholar] [CrossRef]
  4. Gutierrez-Escolar, A.; Castillo-Martinez, A.; Gomez-Pulido, J.M.; Escolar-Gutierrez, A.; Castillo-Martinez, A.; Gomez-Pulido, J.M.; Gutierrez-Martinez, J.M.; González-Seco, E.P.D.; Stapic, Z. A review of energy efficiency label of street lighting systems. Energy Effic. 2017, 10, 265–282. [Google Scholar] [CrossRef]
  5. Campisi, D.; Gitto, S.; Morea, D. Economic feasibility of energy improvements in street lighting systems in Rome. J. Clean. Prod. 2018, 175, 190–198. [Google Scholar] [CrossRef]
  6. Kostic, M.; Djokic, L. Recommendation for energy efficient and visually acceptable street lighting. Energy 2009, 34, 1565–1572. [Google Scholar] [CrossRef]
  7. Beccali, M.; Bonomolo, M.; Ciulla, G.; Galatioto, A.; Lo Brano, V. Improvement of energy efficiency and quality of street lighting in South Italy as an action of Sustainable Energy Action Plans. The case study of Comiso (RG). Energy 2015, 92, 394–408. [Google Scholar] [CrossRef]
  8. Djuretic, A.; Kostic, M. Actual energy savings when replacing high-pressure sodium with LED luminaires in street lighting. Energy 2018, 157, 367–378. [Google Scholar] [CrossRef]
  9. Zima, K.; Ciepłucha, W. Efficiency Analysis of Roadway Lighting Replacement in a Selected Polish Municipality. Appl. Sci. 2023, 13, 3257. [Google Scholar] [CrossRef]
  10. Vizzari, D.; Bahrani, N.; Fulco, G. Coexistence of Energy Harvesting Roads and Intelligent Transportation Systems (ITS). Infrastructures 2023, 8, 14. [Google Scholar] [CrossRef]
  11. Mou, K.; Ji, X.; Liu, J.; Zhou, H.; Tian, H.; Li, X.; Liu, H. Using piezoelectric technology to harvest energy from pavement: A review. J. Traffic Transp. Eng. 2025, 12, 68–86. [Google Scholar] [CrossRef]
  12. De Fazio, R.; De Giorgi, M.; Cafagna, D.; Del-Valle-Soto, C.; Visconti, P. Energy Harvesting Technologies and Devices from Vehicular Transit and Natural Sources on Roads for a Sustainable Transport: State-of-the-Art Analysis and Commercial Solutions. Energies 2023, 16, 3016. [Google Scholar] [CrossRef]
  13. Ren, J.; Li, Y.; Liu, H.; Li, K.; Hao, D.; Wang, Z. Analysis of Light Obstruction from Street Lighting in Road Scenes. Remote Sens. 2023, 15, 5655. [Google Scholar] [CrossRef]
  14. Mączka, M.; Hałdaś, G.; Pawłowski, S. QCL Active Area Modeling with a View to Being Applied to Chemical Substance Detection Systems. Sensors 2023, 23, 389. [Google Scholar] [CrossRef]
  15. Mączka, M.; Hałdaś, G. Voltage-Controlled and Injector Layer Thickness-Dependent Tuning of Quantum Cascade Laser for Terahertz Spectroscopy. ACS Appl. Mater. Interfaces 2025, 17, 26032–26044. [Google Scholar] [CrossRef]
  16. Khan, M.F.; Reddy, S.; Swanson, A.G. Replacement of HPS Luminaires with LED Luminaires for the Lighting Requirements of an Outdoor Electrical Substation. In Proceedings of the IEEE Sustainable Smart Lighting World Conference & Expo (LS18), Mumbai, India, 8–10 June 2023; pp. 1–6. [Google Scholar] [CrossRef]
  17. Padmasali, A.N.; Lokesh, J.; Kini, S.G. An Experimental Investigation on the Role of LEDs on the Lifetime Performance of Consumer LED Luminaires. IEEE Access 2022, 10, 131765–131771. [Google Scholar] [CrossRef]
  18. Padmasali, A.N.; Lokesh, J.; Kini, S.G. Design of Test Method for Analysis and Estimation of LED Luminaire Lifetime Performance Under Cycle Based Realistic Operating Conditions. IEEE Access 2024, 12, 87944–87953. [Google Scholar] [CrossRef]
  19. Chiradeja, P.; Yoomak, S.; Ngaopitakkul, A. Economic Analysis of Improving the Energy Efficiency of Nanogrid Solar Road Lighting Using Adaptive Lighting Control. IEEE Access 2020, 8, 202623–202638. [Google Scholar] [CrossRef]
  20. Fryc, I.; Listowski, M.; Martinsons, C.; Fan, J.; Czyżewski, D. A Paradox of LED Road Lighting: Reducing Light Pollution Is Not Always Linked to Energy Savings. Energies 2024, 17, 5727. [Google Scholar] [CrossRef]
  21. Yovchev, M.; Tsankov, P.; Stoyanov, I. Measurement and Analysis of Photometric Characteristics and Efficacy of LED Luminaires for Indoor, Industrial and Street Lighting with and without an Optical System. In Proceedings of the 2023 Eight Junior Conference on Lighting (Lighting), Sozopol, Bulgaria, 23–25 September 2023; pp. 1–6. [Google Scholar] [CrossRef]
  22. Jamaludin, M.H. Study of LED Retrofit Lamps in HSPV Luminaires Based on Photometric Method for Road Lighting. Pertanika J. Sci. Technol. 2024, 32, 1187–1201. [Google Scholar] [CrossRef]
  23. Bhattacharya, S.; Majumder, S.; Roy, S. Modelling of the effects of luminaire installation geometries and other factors on road illumination system photometric parameters and energy efficiency. World J. Eng. 2023, 22, 674–688. [Google Scholar] [CrossRef]
  24. Rofaie, N.; Phoong, S.; Mutalib, M. Light-Emitting Diode (LED) versus High-Pressure Sodium Vapour (HPSV) Efficiency: A Data Envelopment Analysis Approach with Undesirable Output. Energies 2022, 15, 4589. [Google Scholar] [CrossRef]
  25. Gordic, D.; Vukasinovic, V.; Kovacevic, Z.; Josijevic, M.; Zivkovic, D. Assessing the Techno-Economic Effects of Replacing Energy-Inefficient Street Lighting with LED Corn Bulbs. Energies 2021, 14, 3755. [Google Scholar] [CrossRef]
  26. Orzáez, M.J.H.; de Andrés Díaz, J.R. Comparative study of energy-efficiency and conservation systems for ceramic metal-halide discharge lamps. Energy 2013, 52, 258–264. [Google Scholar] [CrossRef]
  27. Orzáez, M.J.H.; Róchaz Sola, J.; Gago-Calderon, A. Electrical consequences of large-scale replacement of metal-halide by LED luminaires. Light. Res. Technol. 2016, 50, 282–293. [Google Scholar] [CrossRef]
  28. Wantuch, A. The influence of LED light sources on the deterioration of the quality of electricity. Przegląd Elektrotechniczny 2024, 1, 308–311. [Google Scholar]
  29. Kovács, A.; Bátai, R.; Csanád Csáji, B.; Dudás, P.; Háy, B.; Pedone, G.; Révész, T.; Váncza, J. Intelligent control for energy-positive street lighting. Energy 2016, 114, 40–51. [Google Scholar] [CrossRef]
  30. Yoomak, S.; Ngaopitakkul, A. Optimisation of quality and energy efficiency of LED luminaires in roadway lighting systems on different road surfaces. Sustain. Cities Soc. 2018, 38, 333–347. [Google Scholar] [CrossRef]
  31. Al Irsyad, M.I.; Nepal, R. A survey based approach to estimating the benefits of energy efficiency improvements in street lighting systems in Indonesia. Renew. Sustain. Energy Rev. 2016, 58, 1569–1577. [Google Scholar] [CrossRef]
  32. Rabaza, O.; Peña-García, A.; Pérez-Ocón, F.; Gómez-Lorente, D. A simple method for designing efficient public lighting, based on new parameter relationships. Expert Syst. Appl. 2013, 40, 7305–7315. [Google Scholar] [CrossRef]
  33. Pizzuti, S.; Annunziato, M.; Moretti, F. Smart street lighting management. Energy Effic. 2013, 6, 607–616. [Google Scholar] [CrossRef]
  34. Radulovic, D.; Skok, S.; Kirincic, V. Energy efficiency public lighting management in the cities. Energy 2011, 36, 1908–1915. [Google Scholar] [CrossRef]
  35. Raffaele Carli, R.; Dotoli, M.; Pellegrino, R. A decision-making tool for energy efficiency optimization of street lighting. Comput. Oper. Res. 2018, 96, 222–234. [Google Scholar] [CrossRef]
  36. Lobăo, J.A.; TDevezas, T.; Catalăo, J.P.S. Energy efficiency of lighting installations: Software application and experimental validation. Energy Rep. 2015, 1, 110–115. [Google Scholar] [CrossRef]
  37. Shahzad, G.; Yang, H.; Waheed Ahmad, A.; Lee, C. Energy-Efficient Intelligent Street Lighting System Using Traffic-Adaptive Control. IEEE Sens. J. 2016, 16, 5397–5405. [Google Scholar] [CrossRef]
  38. Kurkowski, M.; Popławski, T.; Zajkowski, M.; Kurkowski, B.; Szota, M. Effective Control of Road Luminaires—A Case Study on an Example of a Selected City in Poland. Energies 2022, 15, 5378. [Google Scholar] [CrossRef]
  39. Beccali, M.; Bonomolo, M.; Leccese, F.; Lista, D.; Salvadoni, G. On the impact of safety requirements, energy prices and investment costs in street lighting refurbishment design. Energy 2018, 165, 739–759. [Google Scholar] [CrossRef]
  40. EN 13201-1:2014; Light and Lighting. Road Lighting—Part 1: Guidelines on Selection of Lighting Class. European Union: Brussels, Belgium, 2014. Available online: https://wiedza.pkn.pl/web/guest/wyszukiwarka-norm (accessed on 2 June 2025).
  41. EN 13201-2:2015; Light and Lighting. Road Lighting—Part 2: Performance Requirements. European Union: Brussels, Belgium, 2015. Available online: https://wiedza.pkn.pl/web/guest/wyszukiwarka-norm (accessed on 2 June 2025).
  42. EN 13201-3:2015; Light and Lighting. Road Lighting—Part 3: Calculation of Performance. European Union: Brussels, Belgium, 2015. Available online: https://wiedza.pkn.pl/web/guest/wyszukiwarka-norm (accessed on 2 June 2025).
  43. EN 13201-5:2015; Light and Lighting. Road Lighting—Part 5: Energy Performance Indicators. European Union: Brussels, Belgium, 2015. Available online: https://wiedza.pkn.pl/web/guest/wyszukiwarka-norm (accessed on 2 June 2025).
  44. Lecce, F.; Salvadoni, G.; Rocca, M. Critical analysis of the energy performance indicators for road lighting systems in historical towns of central Italy. Energy 2017, 138, 616–628. [Google Scholar] [CrossRef]
  45. Pracki, P. A proposal to classify road lighting energy efficiency. Light. Res. Technol. 2011, 43, 271–280. [Google Scholar] [CrossRef]
  46. Sikora, R.; Markiewicz, P.; Pabjańczyk, W. Computing Active Power Losses Using a Mathematical Model of a Regulated Street Luminaire. Energies 2018, 11, 1386. [Google Scholar] [CrossRef]
  47. Pires, D.F.; Antunes, C.H.; Martins, A.G. NSGA-II with local search for a multi-objective reactive power compensation problem. Electr. Power Energy Syst. 2012, 43, 313–324. [Google Scholar] [CrossRef]
  48. Czyżewski, D. Oprawy oświetlenia drogowego ze źródłami światła typu LED. Przegląd Elektrotechniczny 2009, 85, 283–288. [Google Scholar]
  49. Czyżewski, D.; Fryc, I. The Influence of Luminaire Photometric Intensity Curve Measurements Quality on Road Lighting Design Parameters. Energies 2020, 13, 3301. [Google Scholar] [CrossRef]
  50. Sikora, R.; Markiewicz, P. A new approach to calculating energy performance indicators of road lighting. Sustain. Cities Soc. 2021, 75, 103232. [Google Scholar] [CrossRef]
  51. Du, W.; Cheng, H.; Wang, L.; Feng, D.; Wang, X. Measurement and Analysis Method of Light Intensity Distribution for Street Lamps. J. Phys. Conf. Ser. 2022, 2173, 012069. [Google Scholar] [CrossRef]
  52. Tomczuk, P.; Chrzanowicz, M.; Jaskowski, P.; Budzynski, M. Evaluation of Street Lighting Efficiency Using a Mobile Measurement System. Energies 2021, 14, 3872. [Google Scholar] [CrossRef]
  53. Tähkämö, L.; Halonen, L. Life cycle assessment of road lighting luminaires—Comparison of light-emitting diode and high-pressure sodium technologies. J. Clean. Prod. 2015, 93, 234–242. [Google Scholar] [CrossRef]
  54. Tähkämö, L.; Räsänen, R.; Halonen, L. Life cycle cost comparison of high-pressure sodium and light-emitting diode luminaires in street lighting. Int. J. Life Cycle Assess. 2016, 21, 137–145. [Google Scholar] [CrossRef]
  55. Jägerbrand, A.K. New Framework of Sustainable Indicators for Outdoor LED (Light Emitting Diodes) Lighting and SSL (Solid State Lighting). Sustainability 2015, 7, 1028–1063. [Google Scholar] [CrossRef]
  56. Hamas, I.; Abdullah, A.; Hakim, D. Performance analysis of Light Emitting Diode, High Sodium Pressure and Metal Halide Lights. J. Phys. Conf. Ser. 2019, 1402, 033083. [Google Scholar] [CrossRef]
  57. Sikora, R.; Markiewicz, P. Assessment of Colorimetric Parameters for HPS Lamp with Electromagnetic Control Gear and Electronic Ballast. Energies 2020, 13, 2909. [Google Scholar] [CrossRef]
  58. Sikora, R.; Markiewicz, P. Analysis of Electric Power Quantities of Road LED Luminaires under Sinusoidal and Non-Sinusoidal Conditions. Energies 2019, 12, 1109. [Google Scholar] [CrossRef]
  59. IEEE Std. 1459-2010; Definitions for the Measurement of Electric Power Quantities Under Sinusoidal, Nonsinusoidal, Balanced or Unbalanced Conditions. IEEE: New York, NY, USA, 2010. Available online: https://ieeexplore.ieee.org/document/5439063 (accessed on 2 June 2025).
Figure 1. Comparison of the luminous intensity distribution of the tested luminaire before (“Before maintenance”) and after maintenance (“After maintenance”). (a) comparison of planes C0–C180, (b) comparison of planes C90–C270.
Energies 18 04328 g001
Figure 2. The luminous intensity distribution of the LED luminaires (a) LUM1, (b) LUM2, (c) LUM3, and (d) LUM4.
Energies 18 04328 g002
Figure 3. Vectors (a) DT and (b) DTE for the “After maintenance” and “Before maintenance” luminaire in their component space.
Energies 18 04328 g003
Figure 4. Vectors (a) DT and (b) DTE for the “After maintenance” and “Before maintenance” luminaire in their component 2D.
Energies 18 04328 g004
Figure 5. Comparison of vectors (a) DT for LED luminaires and (b) DTE for LED luminaires.
Energies 18 04328 g005
Figure 6. Comparison of vectors (a) DT for LED luminaires and (b) DTE for LED luminaires—2D.
Energies 18 04328 g006
Table 1. Comparison of the luminous flux and luminous efficacy values of the high-pressure sodium lamp luminaire before and after maintenance.
LuminaireΦS (lm)ΦLUM (lm)η (−)
HPS 100 W—Before maintenance856233390.39
HPS 100 W—After maintenance11,11367790.61
Difference22.96%50.75%36.07%
Table 2. Summary of selected electrical parameters of the luminaire before and after maintenance.
LuminaireP (W)Q (var)I (A)PFDPFDDTHDI (%)η (lm/W)Tanφ
HPS 100 W—Before maintenance123.64177.810.950.570.5614.3127.001.44
HPS 100 W—After maintenance129.82238.861.190.480.479.9952.221.84
Difference4.76%25.56%19.63%−19.54%−18.89%−43.28%48.30%21.74%
P—active power, (W); Q—reactive power, (var); I—RMS current, (A); PFD—displacement power factor; PFDD—distortion power factor; THDI—current total harmonic distortion factor, (%).
Table 3. Summary of luminous flux and selected electrical parameters of the LED luminaire.
LuminairesΦLUM (lm)P (W)Q (var)I (mA)PFDPFDDTHDI (%)η (lm/W)Tanφ (−)
LUM1698743.7712.32200.720.9620.94618.08159.630.28
LUM2548440.018.46178.360.9780.9757.17137.070.21
LUM3767453.0312.42245.540.9740.93629.23144.710.23
LUM4942856.2014.55253.520.9680.96310.39167.760.26
Table 4. The geometric parameters and lighting class of the analyzed road.
The Geometric ParameterValue
width of the roadway (m)5
number of lanes2
pole spacing (m)19.00
mounting height (m)8.50
overhang (m)0.65
overhang slope (°)10.00
overhang length (m)1.00
arrangementone-sided at the top
Table 5. Summary of calculation results of lighting parameters on the road for the HPS luminaire after maintenance.
LuminaireValues Required Following the Standard for the Assumed Lighting ClassLm (cd/m2)UoUIfTI (%)EAVG (lx)
≥0.75≥0.40≥0.60≤15
Before maintenanceObserver 10.430.610.7838.80
Observer 20.410.610.653
Fulfilled or notnonoyesyes
After
maintenance
Observer 10.940.550.72517
Observer 20.890.540.696
Fulfilled or notyesyesyesyes
Lm—average luminance, (cd/m2); Uo—total luminance uniformity; UI—longitudinal luminance uniformity; fTI—threshold value increment, (%).
Table 6. Summary of calculation results of lighting parameters on the road for different variants of LED luminaire.
LuminaireValues Required Following the Standard for the Assumed Lighting ClassLm (cd/m2)UoUIfTI (%)EAVG (lx)
≥0.75≥0.40≥0.60≤15
LUM1Observer 10.940.660.84117
Observer 20.890.670.721
LUM2Observer 11.140.660.95517
Observer 21.050.670.956
LUM3Observer 11.380.600.96520
Observer 21.270.610.967
LED4Observer 11.460.500.74421
Observer 21.360.510.755
Table 7. Measured and calculated voltage and current.
LuminaireVoltageCurrent
V
(V)
V1
(V)
VH
(V)
THDV
(%)
I
(A)
I1
(A)
IH
(A)
HPS 100 W—Before maintenance229.85229.6010.721.950.960.950.14
HPS 100 W—After maintenance230.40230.364.291.891.191.180.12
LUM1230.46230.376.442.760.2010.1970.04
LUM2230.03229.965.672.320.1780.1780.01
LUM3231.34231.285.272.260.250.240.07
LED 3230.28230.215.682.310.2530.2520.03
Table 8. Apparent power decomposition.
LuminaireApparent Power Decomposition
S
(VA)
S1
(VA)
DI
(VAr)
DV
(VAr)
SH
(VA)
SN
(VA)
HPS 100 W—Before maintenance218.91217.2631.1110.141.4532.75
HPS 100 W—After maintenance273.30272.0827.235.070.5127.70
LUM146.2645.498.301.270.238.40
LUM241.0340.883.301.010.083.45
LUM356.6754.4816.021.240.3616.07
LED 358.3858.046.101.430.156.27
Table 9. The results of the energy performance indicator calculations for HPS luminaire. (↓—means less, ↑—means more).
IndicatorBefore MaintenanceAfter MaintenanceDifference (%)
DP (mW/lx·m2)147.7680.3645.61 ↓
DQ (mvar/lx·m2)212.57147.8130.46 ↓
DH (mvar/lx·m2)37.2116.8654.69 ↓
DT (mV·A/lx·m2)261.54169.0835.35 ↓
DPQT (mV·A/lx·m2)258.88168.2435.01 ↓
DE (kWh/m2)5.175.404.45 ↑
DEQ (kvarh/m2)7.399.9334.37 ↑
DEH (kvarh/m2)1.361.1515.44 ↓
DTE (kV·A/m2)9.1011.3624.84 ↑
DPQTE (kV·A/m2)9.0011.3025.56 ↑
Table 10. The results of the energy performance indicator calculations for LED luminaire variants.
IndicatorLUM1LUM2LUM3LUM4
DP (mW/lx·m2)27.1024.7727.9128.17
DQ (mvar/lx·m2)7.635.246.547.29
DH (mvar/lx·m2)5.142.048.433.06
DT (mV·A/lx·m2)28.6225.4029.8829.26
DPQT (mV·A/lx·m2)28.1625.3228.6729.10
DE (kWh/m2)1.821.662.202.34
DEQ (kvarh/m2)0.510.350.520.61
DEH (kvarh/m2)0.350.140.670.25
DTE (kV·A/m2)1.921.712.362.43
DPQTE (kV·A/m2)1.891.702.262.41
Table 11. Calculated values of energy performance indicator reduction for road lighting installations with HPS luminaires before and after maintenance, concerning the calculated energy performance indicators for the LUM2 luminaire.
IndicatorBefore Maintenance—LUM2After Maintenance—LUM2
DP (mW/lx·m2)496.53%224.42%
DQ (mvar/lx·m2)3956.68%2720.80%
DH (mvar/lx·m2)1724.02%726.47%
DT (mV·A/lx·m2)929.69%565.67%
DPQT (mV·A/lx·m2)922.43%564.45%
DE (kWh/m2)211.45%225.30%
DEQ (kvarh/m2)2011.43%2737.14%
DEH (kvarh/m2)871.43%721.43%
DTE (kV·A/m2)432.16%564.33%
DPQTE (kV·A/m2)429.41%564.71%
Disclaimer/Publisher’s Note: The statements, opinions and data contained in all publications are solely those of the individual author(s) and contributor(s) and not of MDPI and/or the editor(s). MDPI and/or the editor(s) disclaim responsibility for any injury to people or property resulting from any ideas, methods, instructions or products referred to in the content.