Article

Coordinated Electric Vehicle Demand Management in the Unit Commitment Problem Integrated with Transmission Constraints

by
Dimitrios Stamatakis
* and
Athanasios I. Tolis
*
Industrial Engineering Laboratory, Sector of Industrial Management and Operational Research, School of Mechanical Engineering, National Technical University of Athens, 157 72 Zografou, Greece
*
Authors to whom correspondence should be addressed.
Energies 2025, 18(16), 4293; https://doi.org/10.3390/en18164293
Submission received: 30 May 2025 / Revised: 4 August 2025 / Accepted: 9 August 2025 / Published: 12 August 2025

Abstract

Advancements in battery technology, marked by reduced costs and enhanced efficiency, are steadily making electric vehicles (EVs) more accessible to consumers. This trend is fueling global growth in EV fleet sizes, allowing EVs to compete directly with internal combustion engine vehicles. However, this rapid growth in EV numbers is likely to introduce challenges to the power grid, necessitating effective load management strategies. This work proposes an optimization method where EV load management is integrated into the Transmission Constrained Unit Commitment Problem (TCUCP). A Differential Evolution (DE) variant, enhanced with heuristic repair sub-algorithms, is employed to address the TCUCP. The heuristic sub-algorithms, adapted from earlier approaches to the simpler Unit Commitment Problem (UCP), are updated to incorporate power flow constraints and ensure the elimination of transmission line violations. Additionally, new repair mechanisms are introduced that combine priority lists with grid information to minimize violation. The proposed formulation considers EVs as both flexible loads and energy sources in a large urban environment powered by two grid nodes, accounting for the vehicles’ daily movement patterns. The algorithm exhibits exceptionally fast convergence to a feasible solution in fewer than 150 generations, despite the nonlinearity of the problem. Depending on the scenario, the total production cost is reduced by up to 45% within these generations. Moreover, the results of the proposed model, when compared with a MILP algorithm, achieve values with a relative difference of approximately 1%.

1. Introduction

This work aims to introduce a novel method for solving the Transmission-Constrained Unit Commitment Problem (TCUCP) and investigates the integration of electric vehicles (EVs) as both flexible loads and power sources. Specifically, it examines EVs in the Grid-to-Vehicle (G2V) operation, where they function as adjustable loads, and the Vehicle-to-Grid (V2G) operation, where they inject power back into the electric grid. The problem is solved via a Differential Evolution (DE) variant that belongs to the family of evolutionary inspired algorithms.

1.1. Literature Review

The growing adoption of EVs in national fleets due to their significant advantages has raised legitimate concerns about the impact of uncoordinated charging on the power grid. The unscheduled charging of EVs can cause significant load peaks in daily electricity demand. This can lead to multiple consecutive or heightened existing peaks [1], resulting in increased electricity production costs. Other concerns include voltage dips, fluctuations, phase imbalances, and higher total harmonic distortion (THD). Such loads can also shorten the lifespan of power grid components like transformers and transmission lines, mainly due to excessive power loading from simultaneous EV charging at maximum capacity.
Several strategies have been proposed to mitigate the aforementioned problems while taking advantage of the existence of the EVs connected to the grid. All these strategies have in common the load management of the EVs. According to [2] the load management of EVs can be categorized as decentralized coordination and centralized coordination. Under centralized coordination, the following operations can be present: (1) the G2V operation, where EV load is handled as a flexible load under Demand-Side Management controls, and (2) the V2G operation, which involves EVs supplying electric power to the power grid. The coordinated charging strategy takes advantage of the flexibility of the EVs as a load in order to create a charging schedule that doesn’t hinder the smooth operation of the power grid. In addition, the stored energy of these EVs can be used for load management, power quality control, and power regulation [3].
In decentralized coordination, EV owners control their charging schedules, while EV aggregators incentivize beneficial charging for an independent system operator (ISO) through demand response programs (DRP). These programs use price signalling, reduced or increased pricing and tariffs to encourage charging during off-peak hours or times advantageous to the power network [4]. A DRP integrated with TCUCP reduces costs compared with uncoordinated charging [5]. DRPs can be utilized to prevent transformer saturation [6] and manage EVs to update daily demand curves [7]. Several DRPs with EVs approaches have been proposed. A DRP approach, strictly for residential complexes that considers the profitability of the V2G operation by comparing electricity price and multiple discharge costs is proposed by [8]. A decentralized approach using blockchain for secure smart charging is proposed in [9]. Furthermore Vehicle-to-Vehicle (V2V) operation can be fund under decentralized charging approaches such as in [10] where EVs coordinate with each other to facilitate V2G and V2V operation without relying on a centralized control system. In [11] a DRP is combined with frequency control in a system with high wind penetration. A decentralized approach to handling small EV fleets at the distribution network level via a DRP is proposed in [12]. Another price signal approach is proposed by [13] for type 3 charging (fast charging) in the day-ahead market. A DRP approach considering environmental constraints is suggested in [14]. The literature proves that the DRP is a very flexible management tool, however it might not operate as planed due to the customers risk aversion [15] leading to the need for direct load control and load shedding. In this section of the literature review, additional optimization approaches can be considered, such as energy management systems for individual vehicles. The presence of such vehicles in future fleets, especially those using hydrogen fuel cells, can help reduce the stress on the power grid by reducing the number of plug-in electric vehicles. Smart energy management systems that integrate both batteries and hydrogen fuel cells will be essential for improving driving efficiency. In [16], a real-time energy management system for fuel cell vehicles is proposed, combining GPS data with information from the vehicle’s DC bus system to regulate hydrogen consumption. In [17], an energy management system is enhanced by a reinforcement learning algorithm that leverages trip history data to predict hydrogen consumption needs, aiming to optimize both travel efficiency and cabin environment control. In decentralized coordination charger deployment problems such as [18] can be integrated into energy management problems.
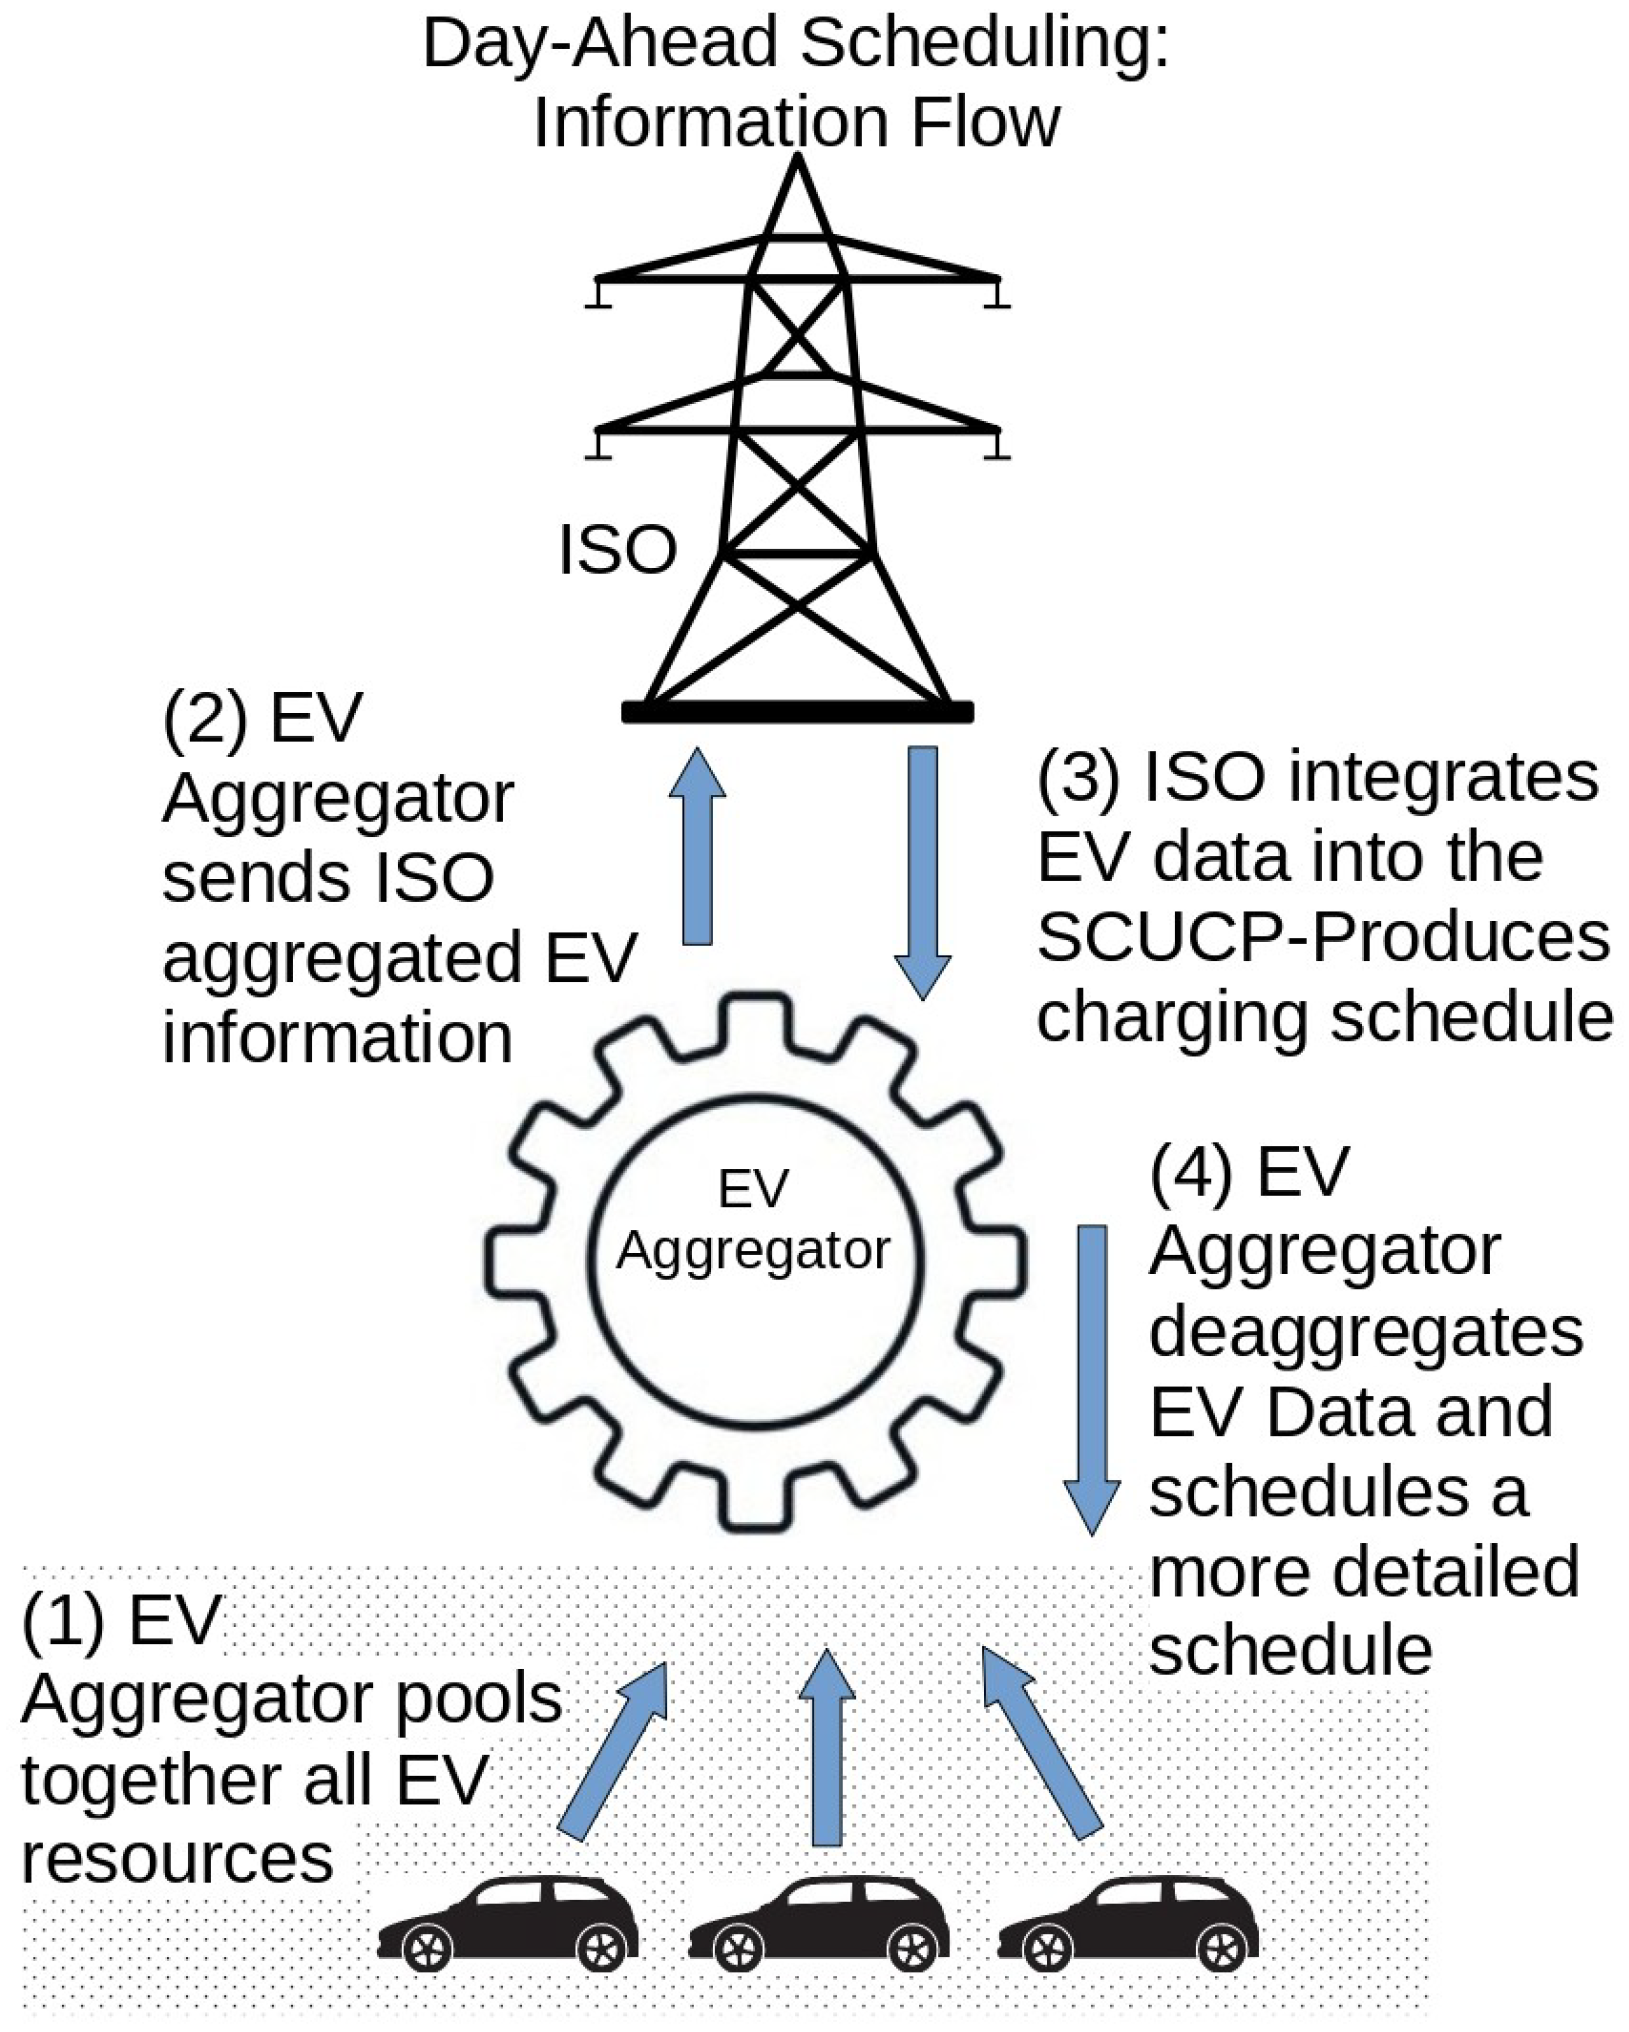
In centralized coordination, accountability for the EV charging lies mainly on the ISO, which, in cooperation with the EV aggregator, organizes the charging of the EV fleet attached to the system. The EV aggregator consolidates EV information, such as identification parameters, battery state of charge (SoC), customer priority profiles, and travel patterns. The EV data are processed for the creation of an effective charging schedule. The centralized coordinated charging schedule management may be a product of optimization from both the DSO and the aggregators, as depicted in Figure 1.
The centralized coordination problem may see a plethora of variations. For instance in [19], two different formulations of solving the centralized coordination problem are proposed. The first approach focuses on maximizing economic benefits by minimizing battery degradation and charging costs, while the second aims to reduce peak load and flatten the load curve by minimizing load deviations. Minimization of load deviation is also performed by [20] who also regulates EV charging power to stabilize voltage levels. In [21], three types of optimization are considered: (a) minimizing transmission line power loss and load variance, (b) minimizing charging cost for the EV owner, (c) maximizing aggregator profits. In [22], one of the EV charging criteria is customer satisfaction. Multi-objective optimization is employed by [23] to achieve economic benefits for charging station owners and EV users, as well as technological advantages for the power grid. Another criterion of centralized coordination is minimization of PV curtailment, as proposed by [24]. A distinct multi-objective algorithm is proposed by [25] to optimize electric vehicle (EV) load and enhance the voltage profile of the test system within an optimal power flow (OPF) optimization framework. Finally, the integration of EV charging scheduling into the UCP has been proposed as a means to facilitate the EV load management [26]. We refer to [27] for a part of the centralized coordination. This enables the establishment of realistic usage expectations and enhances the integration of the EV’s battery capacity across various energy markets, including day-ahead and regulation markets. Table 1 summarizes the main contributions of previous studies on centralized and decentralized charging coordination.
The TCUCP is a complex, nonlinear optimization problem solvable by deterministic or stochastic algorithms. Integrating EVs as flexible loads, especially in V2G mode, adds nonlinearities via battery degradation formulations, heightening optimization complexity, necessitating the use of more advanced and suitable computational tools such as stochastic algorithms.
Optimization algorithms can be categorized into deterministic and stochastic algorithms. The deterministic optimization algorithms utilize linear algebra and gradient methods in order to reach optimum solutions in an efficient manner. Stochastic algorithms or meta-heuristic algorithms utilize randomness in order to reach global near optimal solutions while managing to escape local optimal points by adopting nature inspired strategies.
Numerous deterministic algorithms have been employed in the literature to solve the UCP incorporating EVs, often utilizing various linearization techniques. Madzharov et al. [26] propose a MILP formulation that integrates EV charging into the UCP through load aggregation. However, the model excludes transmission constraints and V2G capabilities. The formulation focuses on optimizing valley-filling to achieve cost-efficient generation, without considering EVs as a potential energy source.
In [28], an MILP formulation is presented that engages in V2G operation, optimizing a 48 h UCP for greater flexibility than traditional 24 h schedules. This extended period better utilizes EV capacity to meet demand. However, EVs are evenly distributed across buses, preventing vehicle movement between them. Another deterministic formulation is proposed in [29], where a two-stage optimization approach was employed using Benders decomposition. In this formulation, EVs are modeled as a distributed battery storage system, where each network node represents a location at which stored energy can be injected into the power grid. Ref. [30] employs a second-order cone programming algorithm for TCUCP in distribution networks (DN), integrating natural gas, district heating, and EV constraints.
Stochastic algorithms have been employed in prior literature to address the TCUCP and the UCP incorporating EVs. In [31,32], a binary symmetric Particle Swarm Optimization (PSO) combined with a self-adaptive Differential Evolution algorithm is proposed to solve the UCP involving EVs. The two meta-heuristic algorithms were paired to determine the commitment schedule of the generators and their respective power generation, as well as the EV charging/discharging schedule. In their work, three constraint-handling mechanisms were used as suggested by [33]. DE has been utilized in [34] in order to reach near-optimal solutions to the optimal power flow problem, proving the versatility of the method. In [19], a Genetic Algorithm (GA) was utilized to minimize the charging cost of EVs aimed at charging cost reduction and battery degradation. A bat algorithm was used in [35] to solve the TCUCP with EVs while considering emission constraints in order to absorb considerable discharging energy from the EVs. A multi-objective optimization based on a Grey wolf algorithm that maximizes profits for the EV aggregator while minimizing the operating costs of the system by integrating the EV charging and discharging within the OPF is suggested in [36]. Meta-heuristic algorithms have proven highly effective in solving a wide range of optimization problems, particularly in energy applications [37].
Recent research has focused on improving meta-heuristic solvers for the UCP using specialized constraint handling algorithms (heuristic repair mechanisms) that led to improvements such as decreased convergence speed, reduced standard deviation, smaller convergence rates, and improved solutions. These gains are achieved by incorporating logical analyses of the real-world problem, which effectively create a filtering mechanism that guides the particles or agents of the meta-heuristic algorithm toward near-optimal global solutions. However, these methods have been successfully applied only to the UCP.
A prominent example of the application of heuristic methods is presented in [33], where a quantum binary Particle Swarm Optimization (PSO) algorithm is employed to solve the UCP. This approach has been adapted and extended in several subsequent studies. Three heuristic mechanisms were employed: the first addresses the minimum up and downtime constraints; the second ensures compliance with spinning reserve requirements by maintaining a sufficient number of generators in operation; and the third de-commits generator units to minimize the number of active generators, thereby reducing operational costs. These mechanisms were also integrated in the work of [27,38] who also introduced new mechanisms that repair the energy dispatch problem and the transmission line power flow violation. In [39] a hybrid optimization algorithm is employed that utilized a GA algorithm to solve the UCP using a priority list to initiate generators. Ref. [40] proposed a unit de-commitment and re-commitment module that is utilized in order to reduce voltage violation in a node. The module operates by manipulating the state of the generators, beginning from the closest ones to the furthest, until a result with no violation is obtained. A Lagrangian relaxation algorithm was proposed in [41] that utilized a spinning reserve handling technique to solve the UCP. Ref. [42] solves the UCP by including the reserve reduction heuristic repair mechanism in order to reduce the standard deviation of the solutions. On the operation of heuristic repair mechanisms rely other works such as [43], where the UCP with renewable energy production is solved via a PSO algorithm. In their work, the following three repair mechanisms are utilized: the Spinning reserve constraints repair mechanism, the minimum up/downtime repair mechanism, and the de-commitment of excess units repair mechanism. The same mechanisms are used in [44] where a priority list is integrated in the same mechanisms. A relevance matrix-inspired heuristic is introduced in [45] that increases the operational speed of their algorithm. Finally, a profit-based UCP is solved in [46] with the aid of the unit de-commitment repair mechanism and the ramp rate repair mechanism.

1.2. Motivation

As highlighted in the literature, most studies employing heuristic mechanisms primarily address the UCP. This focus arises from the fact that many widely used heuristics are effective at guiding solutions toward global optima in the UCP. However, when these heuristics are applied to the TCUCP, they often lead to solutions with transmission constraint violations, hindering convergence and compromising solution feasibility.
One commonly used heuristic involves the commitment of generators based on a priority list to ensure sufficient power reserve. While effective in the UCP, this approach can be problematic in the TCUCP. Specifically, when a generator essential for balancing the power network is ranked low on the priority list, it may not be committed, resulting in unaddressed transmission constraints. Consequently, the reliance on static priority-based commitment can impede the ability of the algorithm to maintain grid reliability under transmission constraints.
Another widely used heuristic is the enforcement of minimum up and minimum downtime constraints. Although this mechanism does not directly exacerbate power flow violations, it can hinder the optimization algorithm’s ability to find feasible schedules in the TCUCP. In particular, the inability to deactivate a generator at a specific hour, due to its minimum up time requirement, may prevent the mitigation of line overloads, thereby obstructing convergence to a feasible solution that satisfies both unit and transmission constraints.
A third popular heuristic is the de-commitment of generators to reduce excess reserve capacity. This approach is often employed to accelerate convergence in meta-heuristic algorithms by minimizing the number of active units. Typically, generators with lower capacity, often placed at the end of the priority list, are deactivated. While this strategy is effective in reducing operational costs and is frequently used to obtain cost-optimal schedules in the UCP, it poses significant challenges for the TCUCP. These smaller units often play a crucial role in reducing transmission violations. Their removal can destabilize power flow across the network, leading to severe violations of transmission constraints and undermining the performance of the optimization algorithm.
In many research studies, electric vehicles (EVs) are modeled as static loads or sources connected to fixed buses within the power network, without accounting for their mobility between different locations. This simplification is common across the referenced literature, including [5], where aggregated EV fleets are represented as virtual power plants centralized at a single node. Such approaches overlook the dynamic nature of EVs and their potential to impact multiple nodes within the network as they travel. However, only a limited number of works explore the possibility that EVs can move and connect to different buses over a 24 h period, thereby influencing multiple buses as they travel throughout the day. Additionally, while much of the literature posits that V2G operations can consistently reduce the system’s start-up, commitment, and unit commitment scheduling costs, some studies argue that EVs are less competitive compared with large-scale generators, especially when the system operator is required to replenish the energy utilized during V2G operations within the same 24 h period. This highlights the need for a tool that can optimize TCUCP while integrating EVs with V2G capabilities, accounting for complex nonlinearities such as battery degradation costs.

1.3. Contribution

This work presents a novel formulation of integrating electric vehicles in the TCUCP, representing the coordinated charging and discharging of a large EV fleet. The fleet of EVs belongs to a large urban environment where the EVs travel within the day. The formulation accounts for the daily movement of EVs within two nodes (buses) that supply the city with power, allowing charging or discharging whenever vehicles are available. This is a complex problem solved via a variant of Differential Evolution. The algorithm is enhanced by a series of heuristic repair mechanisms that lead the solution to the feasible region by following problem-specific rules. Each repair mechanism handles a discrete set of constraints of the problem, repairing the variables of the problem so that both the constraint violation and the operational cost are reduced. This work incorporates several heuristic mechanisms previously used in the literature for the simpler UCP, adapted and updated here to accommodate transmission constraints. In addition to those heuristics that include the ramp-rate repair mechanism, the minimum up and downtime repair mechanism, the energy dispatch repair mechanism, and the minimization of reserve repair mechanism, three novel mechanisms are introduced. Two of them are assigned to the transmission power flow constraints, and a third one that handles the charging and discharging of EVs.
The transmission constraints are handled by two heuristic repair mechanisms. These heuristics utilize information from the PTDF matrix to identify the nodes (buses) that have the greatest impact on the overloaded transmission lines. By appropriately adjusting load and generation at these key nodes, either increasing or decreasing them, the power flow violations can be effectively mitigated. The approach is further enhanced with the use of priority lists, which guide the search toward feasible solutions more efficiently, despite the NP-hard nature of the problem. Although many meta-heuristic algorithms over the years have incorporated priority lists, none have successfully solved the Unit Commitment Problem (UCP) while accounting for transmission constraints.
The first transmission repair algorithm builds upon the average production priority list proposed in [38], which has been updated and expanded to incorporate power grid data using Power Transfer Distribution Factors (PTDFs). This enhancement enables the algorithm to systematically commit generators to resolve violations on transmission lines where power flow exceeds specified limits. The priority list determines the most cost-effective generator commitments until both energy reserve and dispatch constraints are met. Power Transfer Distribution Factors dictate the power flow within the transmission system. Each line’s power flow is determined by the PTDF values associated with each node (bus). By adjusting the demand or production at each node, the algorithm alters power flows across transmission lines. The second mechanism serves as a constraint handling mechanism, adjusting the production of committed generators based on PTDF information to minimize transmission violations without undoing previous repair efforts. A third proposed mechanism focuses on managing EV charging. By incorporating PTDFs, this mechanism adjusts EV loads at each node to mitigate transmission line violations effectively.
In addition to these contributions, the unit de-commitment constraint handling technique, aimed at minimizing reserve capacity, is enhanced by introducing a new variable into the optimization model. This variable defines the maximum acceptable level of reserve in the final solution, allowing the DE mechanisms to set the total number of operational generators in the system. Furthermore, all repair mechanisms, mainly the constraint handling techniques of minimum up to minimum downtime, unit de-commitment and energy dispatch constraints, are suggested mainly in [33,38] and numerous other literature works, which are utilized in this work, are appropriately modified and expanded so as to retain their original purpose and not hinder the optimization process that engages with power grid constraints.
The proposed optimization method solves all sub-problems of the TCUCP and EVs in a single DE convergence. The proposed method, despite aiming to optimize the operation of electrical generators, can be utilized for any available production method, including renewable energy sources. Thus, the primary objective of this work is to develop an effective heuristic mechanism that integrates power grid information to support an evolutionary-inspired algorithm in solving complex optimization problems, specifically the TCUCP. The proposed method for solving the TCUCP with EVs is evaluated utilizing a small, intermediate, and large test system, demonstrating the robustness of the proposed meta-heuristic algorithm.
The EV formulation models a large urban area with two power nodes, allowing EVs to alternate their charging locations between the nodes over the course of the day. The charging of the EVs is coordinated and heavily constrained. This ensures that no negative effects such as power flow violations and peak loads affect the power grid and the energy production. To reduce the potential strain on the power network, each EV is restricted to a maximum charging rate of 3 kWh, which is considered as Level 1 charging [47]. Given the large number of vehicles, the charging process is managed in groups rather than individually, with the SoC of each group representing the average SoC of all vehicles within that group. It is further assumed that the SoC within each group is homogeneous. When a group of aggregated vehicles is combined with another group, it is assumed that the vehicles mix, and the new group’s SoC represents the average SoC of the combined vehicles. This approach allows for an estimation of vehicle movement throughout the day, which is essential because vehicles may change charging nodes as their schedule progresses. Previous studies have either considered EVs as part of the day-ahead demand without accounting for power network constraints or have modeled the entire fleet as charging at a single node. Additionally, some studies have assumed fixed EV populations at each node. In contrast, this work presents a formulation that accounts for spatial variability in the load.
The UCP primarily addresses the scheduling and operational cost of various network elements that impact the overall system cost in day-ahead planning and market operation. For this reason, the UCP typically uses a time resolution of one hour, aligning with the hourly scheduling intervals of the day-ahead market. One of the elements of the system can be considered to be EVs and their load, which could be optimized. In general, EVs are connected to the distribution system. However, in this work, all EVs and distribution system loads are aggregated into the system’s Nodes (buses) without causing significant differences in the total analysis.
The power production system interacts with EVs through two operations: G2V, where EVs are treated as flexible loads, and V2G, where EVs serve as power sources. The V2G operation accounts for battery degradation costs, a critical factor in many EV charging optimization models, as demonstrated by [48]. This consideration introduces significant nonlinearity into the optimization system.
2. Problem Formulation of the TCUCP with EVs

This work investigates three formulations of the TCUCP: (1) the TCUCP without the integration of EVs, (2) the TCUCP incorporating EVs as flexible loads under the G2V framework, and (3) the TCUCP with V2G integration, where EVs function both as flexible loads and as energy sources for the power system. The objective is to minimize the total operating cost of the generators, with the V2G formulation additionally considering the cost of EV battery degradation. The system is constrained by a set of generator and EV-specific constraints. The UCP formulation for generator costs is based on the works of [27,38], while the TCUCP integrates DC power flow modeling from [49], and the formulation follows closely the approach of [26].

2.1. Objective Function and Decision Variables

The objective function (Equation (1)) minimizes the system’s Total Cost (TC), including power production, start-up, and EV battery degradation costs. For L generators and EVF groups over K periods, production cost (Equation (2)) depends on c s l , k , a decision variable indicating generator state (1 = on, 0 = off). Power output is p r l , k . Start-up cost (Equation (3)) depends on prior offline duration (Equations (4) and (5)). Energy exchange variables are E n C h e v f , k (G2V) and E n D i s c e v d , k (V2G). All Constants, Variables and Sets are presented in Table 2, Table 3 and Table 4.
minimize   TC = k = 1 K l = 1 L [ G C l , k · T I + S C l , k ] + k = 1 K e v d = 1 E V D B D C e v d , k
G C l , k = ( a l + b l · p r l , k + c l · p r l , k 2 ) · c s l , k , x k , > 0 , k K ,   L
S C l , k = [ S U C l , k · ( 1 c s l , k 1 ) ] · c s l , k , k K ,   L
S U C l , k = h s c l , if   T d l T d e c o m l , k T d l + T c l d l c s c l , if   T d l + T c l d l T d e c o m l , k k K ,   L
T d e c o m l , k = 0 , if   c s l , k = 1 1 + T d e c o m l , k 1 , if   c s l , k = 0 k K ,   L
The battery life cycle is calculated according to Equation (6) [50]. In their work, the least square regression yields the following parameters in Equation (6), where d 0 = 2731.7 , d 1 = 0.679 , and d 2 = 1.614 . The type of battery considered is a lithium-ion battery, which is consistent with the one used in this work. The depth of discharge in the same equation is calculated in Equation (8). The battery degradation is estimated using Equation (7) according to [51]. The final cost of battery degradation, incorporated into the objective function, is computed using Equation (9). This equation calculates the cost of energy discharge during the discharging operation, as illustrated in Equation (10). It computes the total cost from the start ( t S ) to the end ( t E ) of the discharge cycle.
C l e v d , k = d 0 · D D e v d , k d 1 · exp ( d 2 · ( 1 D D e v d , k ) ) k K ,   e v d E V D
B d e v d , k ( S o C e v d , k ) = C o B e v d , k C l e v d , k , k K ,   e v d E V D
D D e v d , k = 1 S o C e v d , k C a p e v d , k k K ,   e v d E V D
B D C e v d , k = B d e v d , k ( S o C e v d , t E ) B d e v d , k ( S o C e v d , t S ) k K ,   e v d E V D
B D C e v d , k = B d e v d , k ( S o C e v d , t E ) B d e v d , k ( S o C e v d , t S ) , if   d i s c h a r g i n g 0 , if   c h a r g i n g
k K ,   e v d E V D

2.2. Constraints

The SCUC optimization problem incorporating EVs is constrained by several factors, including the operational limits of generators, the power flow through transmission lines, and the secure charging and discharging of the EVs. Additionally, the problem is constrained to ensure that its primary obligation, which is to meet the system’s power demand, is fulfilled. The power balance constraint is represented by Equation (11). The generator power production with the added discharge from the EVs must be equal to the day-ahead power demand P d k of the system and the demand of the EVs. In Equation (12) the energy reserve of the system is denoted. The energy reserve R e s k is set to be equal to 10 percent of the hourly system demand. EVs, due to their nature as flexible loads and the system’s capability to shed their loads, are not considered in the reserve calculation.
l = 1 L c s l , k · p r l , k · T I + e v g = 1 E V G E n D i s c h e v g , k = P d k + e v f = 1 E V F E n C h e v f , k k K
l = 1 L c s l , k · P r m a x l · T I P d k + R e s k k K
Equations (13)–(18) represent the electrical and mechanical characteristics of the power generators. Equation (13) represents the thermal limits of the generators where the power production of the generator is constrained between a minimum production level Prmin and a maximum Prmax. The power generators can increase or reduce their production level according to their ramp rate constraints that are shown in Equations (14) and (15). Once a generator is deactivated, it is required to remain offline for a specified number of periods in order to satisfy the minimum downtime constraint. Similarly, when a generator is activated, it must remain online for at least the minimum required period to comply with the minimum uptime constraint. The minimum up and minimum down constraints are expressed in Equations (18) and (16). The consecutive hours during which the generator remains operational are calculated using Equation (17).
P r m i n l , k p r l , k P r m a x l , k k K ,   L
P r m i n l , k = P m i n l , if   c s l , k 1 = 0 m a x ( P m a x l , p r l , k 1 R D n l ) , if   c s l , k 1 = 1
P r m a x l , k = P m a x l , if   c s l , k 1 = 0 m a x ( P m a x l , p r l , k 1 + R U n l ) , if   c s l , k 1 = 1
k K ,   L
( T o n l , k 1 M T U l ) · ( c s l , k 1 c s l , k ) 0 k K ,   L
T o n l , k = ( T o n l , k 1 + 1 ) · c s l , k k K ,   L
( T o f f l , k 1 M T D l ) · ( c s l , k c s l , k 1 ) 0 k K ,   L
The transmission constraints are determined using a DC power flow formulation. Incorporating AC power flow calculations can be computationally intensive, particularly in the context of the UCP framework [49]. This issue is exacerbated in our research due to the inclusion of heuristic power flow repair mechanisms, necessitating repeated power flow calculations in the same period k within each particle of the DE-based algorithm. Equation (19) represents the power flow of a transmission line without any power losses. The problem can be simplified by considering the voltage of the buses equal to 1 pu and the difference between the angles of the nodes is close to zero. Following the work of [49], Equations (20)–(22) are obtained. The limits of the transmission lines are represented by Equation (23).
p f a l n = | V N D M | · | V N D N | x l n s i n ( a n g l N D M a n g l N D N )
p f l n , k = ( b l n · I M A ) · ( I M A T · b l n , k · I M A ) 1 · p f n o d a l k
l n L N ,   k K
P T D F = ( b l n · I M A ) · ( I M A T · b l n · I M A ) 1
n o d e = 1 N D P F n o d a l = 0
P f l l n p f l n , k P f l l n l n L N ,   k K
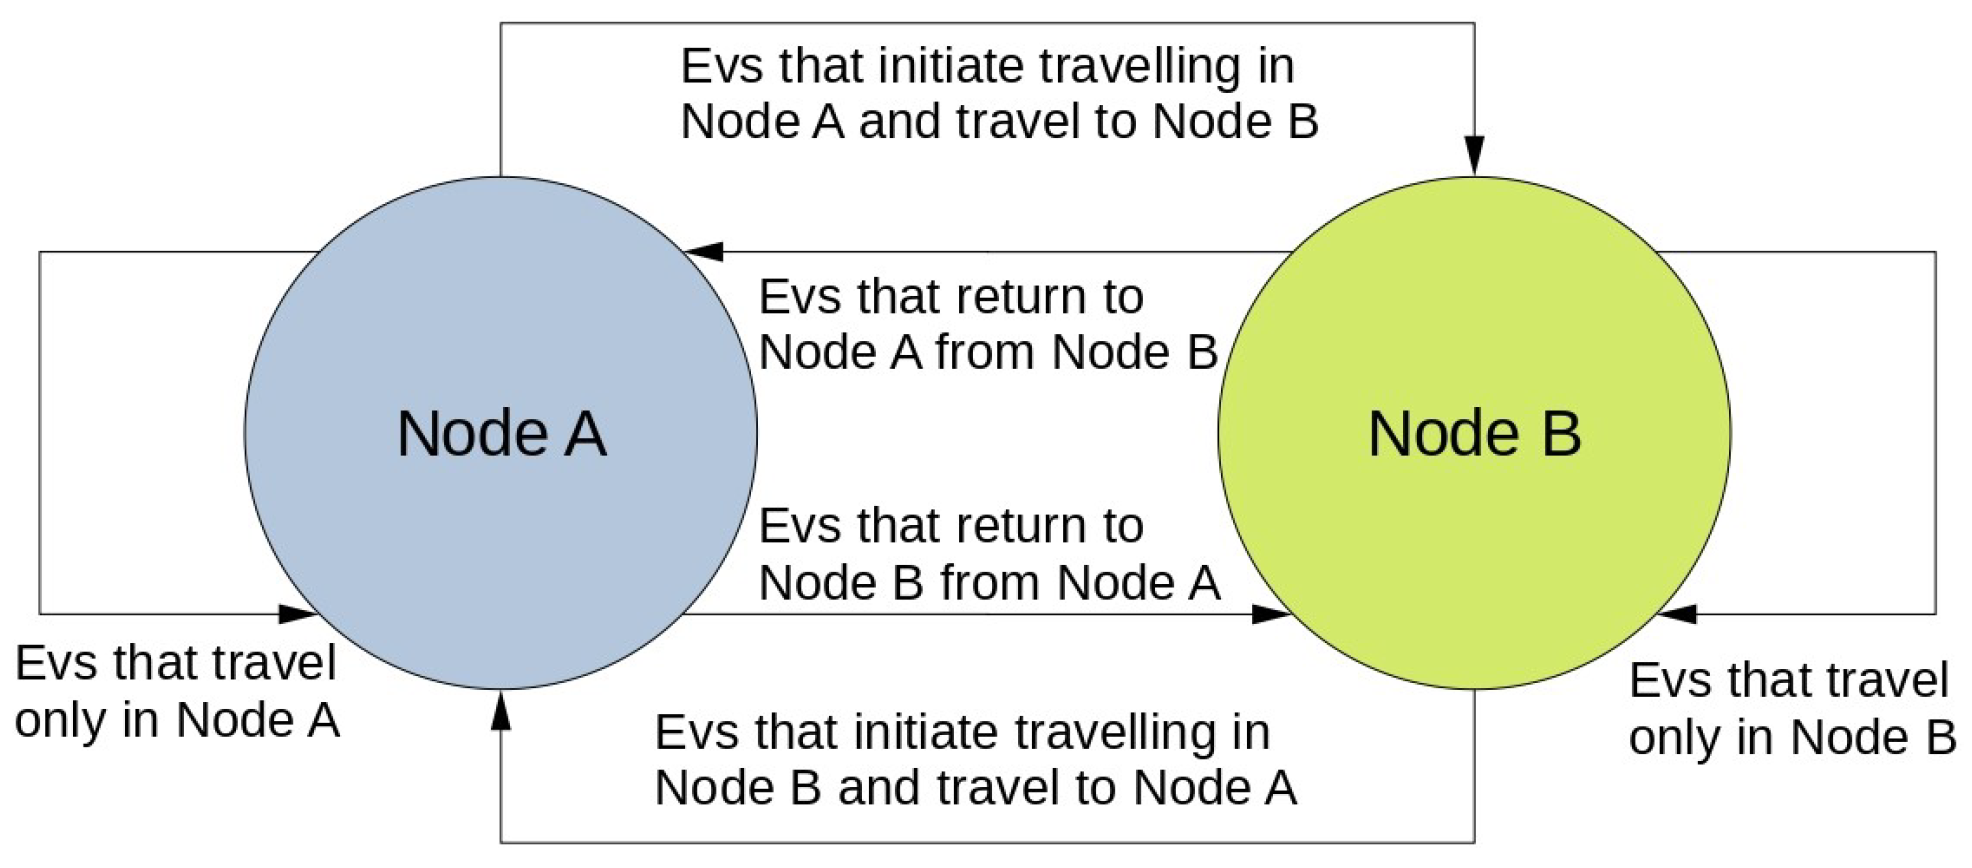
The EV charging and discharging problem in this work builds on the findings of Madzharov et al. [26], who suggest that electric vehicles (EVs) can be aggregated and managed as flexible loads, with an optimized charging schedule. The optimization of EV charging is based on the availability of aggregated EVs. This availability is primarily determined by the location of the EV’s connection to the power grid. EVs can either be in transit or parked and connected to one of two nodes. Consequently, the EV mix fluctuates as vehicles travel between nodes during the day. This approach enables the calculation of the SoC for all EVs at a given Node by classifying EV categories based on their travel patterns during the 24 h optimization period.
From this process, six 24 h SoC schedules are generated. Lines 1 and 4 of the SoC schedule represent the EV categories where all EVs remain connected throughout the day to bus A and bus B, respectively. Specifically, Line 1 of the EnCh variable represents the charging load of EVs added to the load of Node A, while Line 4 represents the charging load added to Node B. Lines 2 and 3 of the SoC variable reflect EVs that begin their travel at a location connected to Node A but reach at least one destination connected to Node B during the day. Line 2 of the EnCh variable represents the charging load connected to Node A before traveling to a location connected to Node B or after their return to a location connected to Node A, while Line 3 corresponds to the charging load added to Node B from EVs that initially traveled from Node A and are connected to Node B before traveling back to Node A. Similarly, Lines 5 and 6 represent EVs that begin their daily schedule connected to Node B but travel to at least one destination associated with Node A. Line 5 of the EnCh variable accounts for the charging load added to Node B from EVs connected to Node B, while Line 6 represents the load added to Node A by EVs that began their travel schedule at Node B. Figure 2 depicts the trip types of aggregated EVs. The formulation of trip schedules and EV numbers is generated as described in Appendix A.
The constants nt(x) from Table 5 were estimated from the existence of EVs at each Node by calculating the percentage of vehicles leaving a Node, as described in Appendix A. Table 5 explains the nt terms in Equations (35), (29), (28) and (39). In those equations, constants nt9 to nt16 serve the same purpose as constants nt1 to nt8; however, they represent trips with a duration of 2 h.
The following equations describe the charging and discharging behavior of EVs as well as the SoC of their batteries. Equations (24) through (35) define the dynamics of EVs traveling to a single Node only within their travels. Specifically, Equations (32) to (35) establish the constraints on the SoC for EVs that follow a 24 h charging schedule while traveling between nodes. In particular, Equations (24) to (31) represent the vehicles traveling from Node A to Node B. These same equations can also be applied to vehicles traveling from Node B to Node A within the 24 h period by reversing the variables an and bn within the equation.
S o C a n , k = I n S t a n + n e · E n C h a n , k + 1 n e · E n D i s c h a n , k , k = 1
S o C b n , k = I n S t b n + n e · E n C h b n , k + 1 n e · E n D i s c h b n , k , k = 1
S o C a n , k = S o C a n , k 1 + n e · E n C h a n , k + 1 n e · E n D i s c h a n , k , 1 < k 3
S o C b n , k = S o C b n , k 1 + n e · E n C h b n , k + 1 n e · E n D i s c h b n , k , 1 < k 3
S o C a n , k = S o C a n , k 1 + n e · E n C h a n , k + 1 n e · E n D i s c h a n , k n t 1 · S o C a n , k 1 + n t 2 · S o C a n , k 2 n t 3 · S o C a n , k 1 + n t 6 · S o C b n , k 2 n t 9 · S o C a n , k 1 + n t 10 · S o C a n , k 3 n t 11 · S o C a n , k 1 + n t 14 · S o C b n , k 3 1 n e · C E D a n , 3 < k K
S o C b n , k = S o C b n , k 1 + n · E n C h b n , k + 1 n e · E n D i s c h b n , k + n t 4 · S o C a n , k 2 n t 5 · S o C b n , k 1 n t 7 · S o C b n , k 1 + n t 12 · S o C a n , k 3 n t 13 · S o C b n , k 1 n t 15 · S o C b n , k 1 + n t 16 · S o C b n , k 3 1 n e · C E D b n , 3 < k K
When both indices a n and b n are used within the same equation, only the following two pairs are valid: (1) a n = 2 , b n = 3 , and (2) a n = 5 , b n = 6 .
S o C a n , k B c a p a n , k , 1 k K
S o C b n , k B c a p b n , k , 1 k K
S o C c n a , k = I n S t c n a + n e · E n C h c n a , k + 1 n e · E n D i s c h c n a , k , k = 1
S o C c n a , k = S o C c n a , k 1 + n e · E n C h c n a , k + 1 n e · E n D i s c h c n a , k , 1 < k 3
S o C c n a , k B c a p c n a , k , 1 k K
S o C c n a , k = S o C c n a , k 1 + n e · E n C h c n a , k + 1 n e · E n D i s c h c n a , k n t 1 · S o C c n a , k 1 + n t 2 · S o C c n a , k 2 n t 9 · S o C c n a , k 1 + n t 10 · S o C c n a , k 3 1 n e · C E D c n a , 3 < k K
S o C c n b , k = I n S t c n b + n e · E n C h c n b , k + 1 n e · E n D i s c h c n b , k , k = 1
S o C c n b , k = S o C c n b , k 1 + n e · E n C h c n b , k + 1 n e · E n D i s c h c n b , k , 1 < k 3
S o C c n b , k B c a p c n b , k , 1 k K
S o C c n b , k = S o C c n b , k 1 + n e · E n C h c n b , k + 1 n e · E n D i s c h c n b , k n t 7 · S o C c n b , k 1 + n t 8 · S o C c n b , k 2 n t 15 · S o C c n b , k 1 + n t 16 · S o C c n b , k 3 1 n e · C E D c n b , 3 < k K
E n C h e v f , k M a x T r a n s f e v f , k , 1 k K
E n D i s c h e v d , k M a x T r a n s f e v d , k , 1 k K
where M a x T r a n s f e v f , k is defined, according to Equation (42), as the maximum allowed power that can be transferred to and from EVs and is calculated prior to the optimization process, taking into consideration that the chosen charging type is type 1, allowing for up to 3 kW charging per vehicle, and the hourly availability of EVs.
M a x T r a n s f e v d , k = E V s a v a i l e v d , k · C h a r g T y p e , 1 k K
E n C h e v f , k B c a p e v f , k · u t ,
E n D i s c h e v d , k B c a p e v d , k · ( 1 u t )
u t { 0 , 1 }
The charging loads of the electric vehicles (EVs) are incorporated into the nodal injections by adding the EV charging load to the respective nodal load and subtracting the EV discharging load accordingly. The charging loads represented by lines 1, 2, and 6 of the variable EnCh are added to the load at Node A, while the charging loads represented by lines 3, 4, and 5 are added to the load at Node B.

3. Description of the Optimization Algorithm

The suggested optimization algorithm is a variant of a DE optimization algorithm with the inclusion of feasibility rules and problem-specific heuristics that act as violation repair mechanisms. The TCUCP with EVs problem is a constrained, mixed integer, nonlinear optimization problem that, by utilizing repair mechanisms, can be transferred in continuous space, thus giving the capability to utilize DE mechanisms. The nonlinearities of the formulated problem are strong and originate in the terms of battery degradation costs, in addition to the generators’ quadratic production cost, and the presence of variables that only receive integer values. Due to the existence of constraints, the Feasibility Rules with incorporation of Objective Function Information (FROFI) [52] tool has been utilized, which is a variant of DE that can handle constrained optimization problems with strong nonlinearities.
The complexity of the proposed general computational problem is very complicated, given the fact that the general computational model contains the mechanisms of a stochastic algorithm. Stochastic algorithms are based on randomness to reach a solution close to the global optimum, and thus the complexity of the algorithm heavily depends on the stopping criterion set by the user and the complexity of the problem. In this case, the problem solved is the TCUCP, which is an NP-hard problem. The solution finding of the problem is improved by the use of heuristic repair mechanisms that utilize priority lists, leading to faster convergence to a near-optimum solution. A simplified calculation of the complexity of the general computational model can be given by the following relationship: O(G*P*(D + Cf + Ch)), where G are the selected number of generations, P is the selected number of particles, Cf is the cost of calculating the cost of the objective function, D is the dimension of the system, and Ch is the cost of the heuristic mechanisms.
The time complexity of the problem depends heavily on the purpose of the algorithm. One of the main goals of this work is to research charging patterns in a large urban environment, where EVs travel and charge across different nodes of the power grid that serve the city. Since this is an optimization of coordinated, centralized charging for a single EV fleet, solving systems with more than 100 generators, extending beyond the national level, would be impractical. The number of EVs does not affect the computational cost or time complexity, as the charging variables represent an aggregated fleet. What does impact complexity is whether multiple EV fleets, operating across different nodes, are included in the analysis.

3.1. Differential Evolution

In the event of constraint violations, the FROFI algorithm employs feasibility rules to manage the constraints of the optimization problem while simultaneously accounting for the cost of the objective function. The target vector of the population of the DE is expressed in Equation (46). Where gen is the generation counter, D represents the number of optimization variables, and PP as the total number of population particles. In the first generation, the values of the variables are randomly assigned within their lower and upper limits. Following the initialization process, three evolutionary mechanisms are applied.
z n g e n = [ z n , 1 g e n , z n , 2 g e n , , z n , D g e n ]

3.1.1. Differential Evolution Operators

The mutation mechanisms utilized in FROFI is expressed in Equations (47) and (48). In comparison with the DE originally proposed by [53], FROFI utilizes two mutation processes that are chosen with equal probability.
  • DE/current-to-rand/1:
    w n g e n = z n g e n + U ( 0 , 1 ) · ( z r 1 g e n z n g e n ) + S F · ( z r 2 g e n z r 3 g e n )
  • DE/rand-to-best/1:
    w n g e n = z r 1 g e n + U ( 0 , 1 ) · ( z b e s t g e n z r 1 g e n ) + S F · ( z r 2 g e n z r 3 g e n )
where n is the DE particle index, z r 1 g e n , z r 2 g e n , z r 3 g e n are population vectors randomly sampled from the population from generation gen, and finally, S F is the scaling factor that is applied on the differential variation and is chosen from the pool S F p o o l = [ 1.0 , 0.8 , 0.6 ] .
The diversity of the solutions is increased with the crossover mechanism. The binomial crossover is implemented on the mutant vectors in order to create the trial vector t r n , i g e n according to Equation (49).
t r n , i g e n = w n , i g e n , if   r a n d i C R R   or   i = i r a n d z n , i g e n , otherwise  
where i = 1, …, D, r a n d i U ( 0 , 1 ) generated for every variable in the population, irand is a random index from [1, D], and finally, CRR is the crossover rate of the DE.

3.1.2. Feasibility Rules

Feasibility rules, as established by [54], are sequentially applied to the population. These rules involve a comparison between the trial vector and the parent vector in the following manner:
  • If both compared vectors produce infeasible solutions, the solution with the least violation is preferred.
  • If one vector produces a feasible solution and one an infeasible solution, the feasible solution is chosen.
  • If both vectors produce feasible solutions, then the vector that produces the solution with the lowest objective function cost is chosen.
In case of a trial vector not surviving to the next generation, it is stored in an archive ARC for usage in the selection mechanism.

3.1.3. FROFI Mechanisms

After creating the target vector, the greediness of the feasibility rules is mitigated by the selection mechanism. This mechanism leverages the vectors stored in ARC. The population of target vectors is sorted in descending order according to their objective function values. Subsequently, this population is divided into as many parts as the cardinality of ARC. For each division, the vector that produces the solution with the maximum violation is compared with the vector with the minimum constraint violation in the archive ARC. If the objective function value of the vector from the target vector exceeds that of the archive ARC, then the vector from the archive replaces the vector from the target vector and is removed from the archive. This process continues until either the archive is empty or all divided parts of the target vector have been updated.
If all vectors in the population are found to be infeasible, a final mutation is applied. In this process, a randomly selected population member, z r g e n , undergoes mutation by randomly altering one of its dimensions, assigning it a new value within the specified upper and lower bounds. If for this mutant vector m r g e n the cost of the objective function is lower than the objective function of the vector with the highest constrained violation of the next generation f ( m r g e n ) f ( z r g e n + 1 ) , then m r g e n replaces z r g e n + 1 .

3.1.4. Implementation of the Method

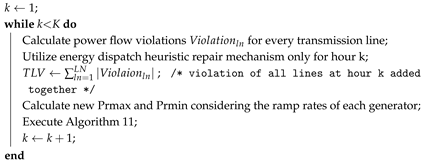
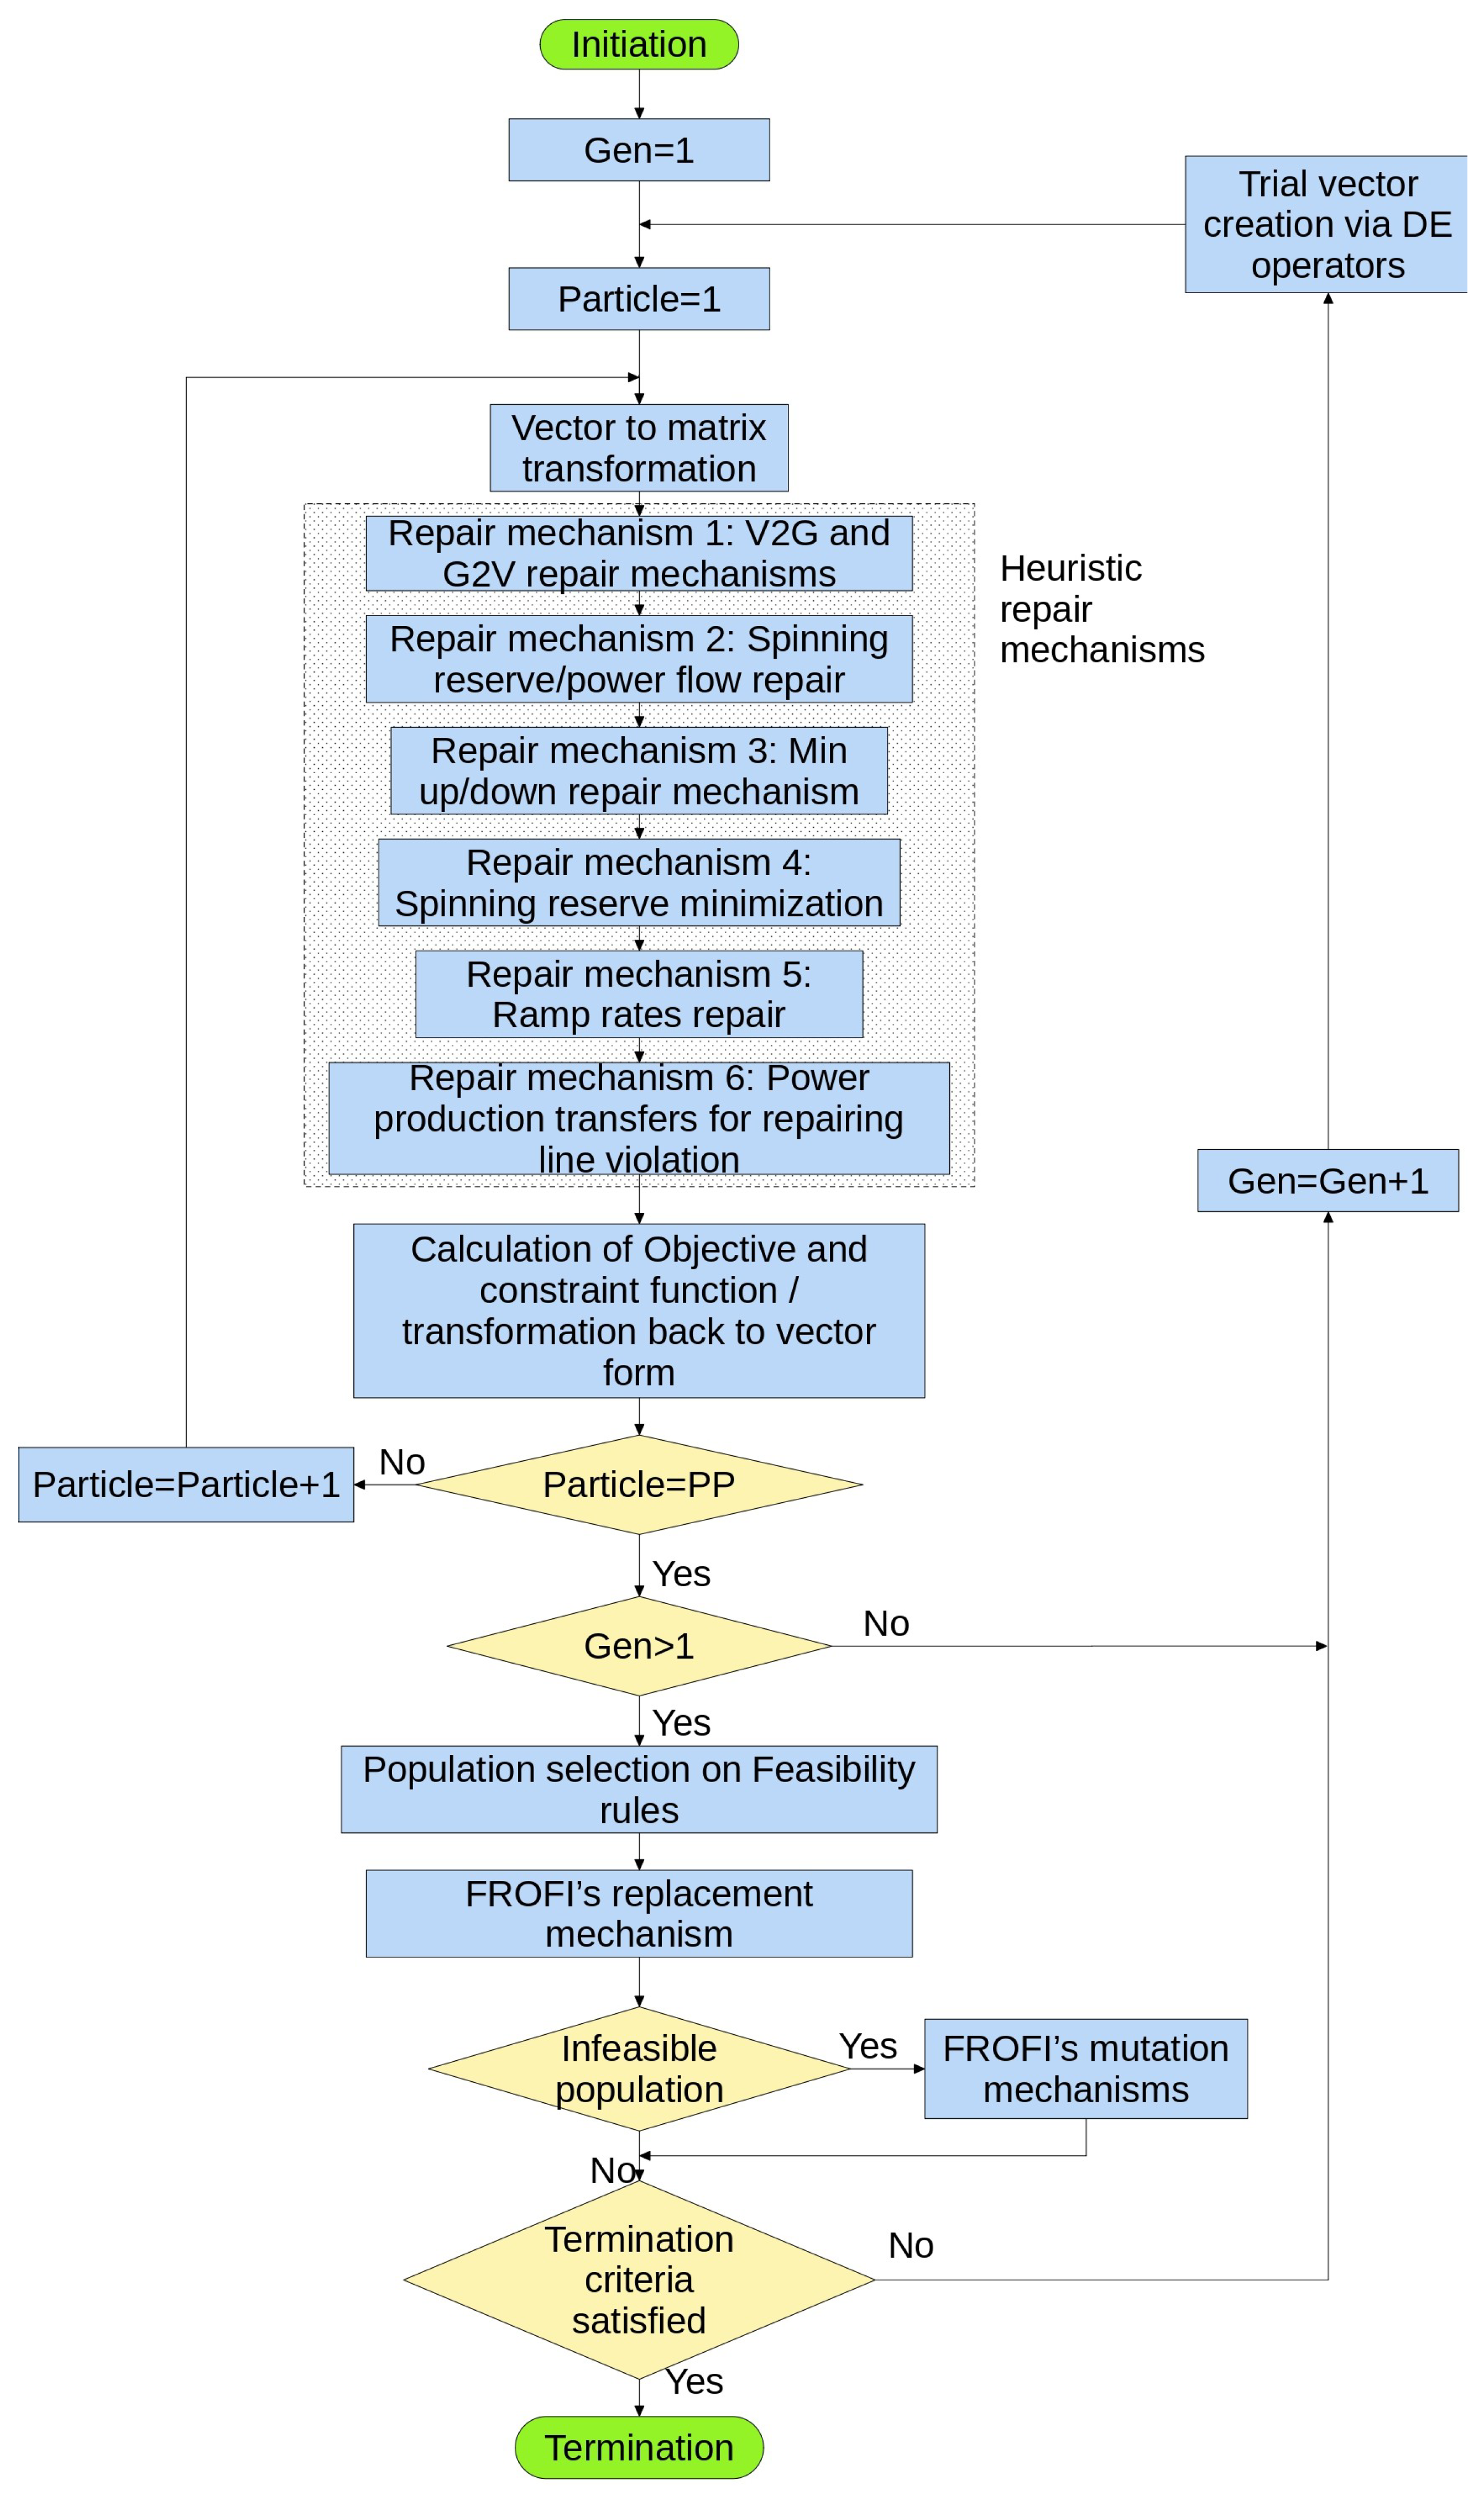
The optimization method is implemented with the following steps and is summarized in Figure 3:
  • Trial vectors equal to the chosen population number PP are created with the engagement of the FROFI mechanisms
  • Each vector is transformed into a matrix, with one matrix generated for each group of variables. The on/off schedule is determined as a by-product of the power production schedule ( p r l , k ). These matrices are subsequently processed using the heuristic mechanisms described in Section 3.3. The objective function and constraint violation for each particle are then evaluated. Finally, the matrices are converted back to their vector form.
  • The feasibility rules are then applied and the target vector of the next generation (gen + 1) is created.The trial vectors that did not survive but have a lower objective function value than the respective target vectors are stored in an auxiliary archive ARC.
  • The replacement process is engaged.
  • The FROFI mutation mechanism for dealing with a population of only infeasible solutions is engaged.
  • The termination condition is evaluated, specifically to check whether the predetermined number of function evaluations has been reached.

3.2. Structure of Solution Vector

The optimization algorithm solves a system of L generators in a time horizon of K hours. The system offers energy to 6 categories of EVs that can also provide energy back to the system in V2G operation. In addition, a variable is introduced in the system that dictates the operation of two repair mechanisms, one for every hour k, as depicted in the last term of the Equation (50). Thus, the solution of the TCUCP with V2G is a vector with the following dimensions:
D i m = L · K + E V F · K + E V D · K + 1 · K
The population vector size that is calculated according to Equation (50) changes with the engagement of different EV operations. With the engagement of only the power flow constraints and the UCP, E V F and E V D are set to zero. For the strict G2V operation of the EV charging, E V D is set to zero. The initial vector receives initial values randomly within the limits of each variable. The limit of variable P P C V k is dependent on the constant EPV. The constant EPV, which is determined experimentally, is multiplied by the maximum limit of the generator with the largest production capacity ( [ 0 ,   E P V · m a x ( P r m a x l ) ] ). This approach enables the repair algorithm to activate either a single large generator or multiple smaller generators as needed to balance transmission power flow constraints effectively. The DE is able to handle this integer problem in linear space by utilizing the following transformation function: if the generator production p r l , k is smaller than P r m i n l , then the decision variable c s l , k becomes 0, and if it is larger than P r m i n l , it takes value 1.

3.3. Description of Heuristic Repair Mechanisms

3.3.1. Repair Mechanism 1—Electric Vehicle Constraint Repair Mechanism

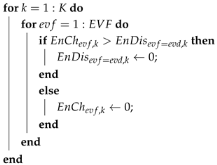
The proposed general computational model is built upon a variant of Differential Evolution (DE) that operates in continuous space. To address the mixed-integer nature of the V2G problem, the discrete variables are mapped to continuous space through the application of Algorithm 1. In this mechanism, if the charging energy exceeds the energy provided by the EVs, the discharged energy is set to zero; conversely, if the discharged energy is greater, the charging energy is set to zero.
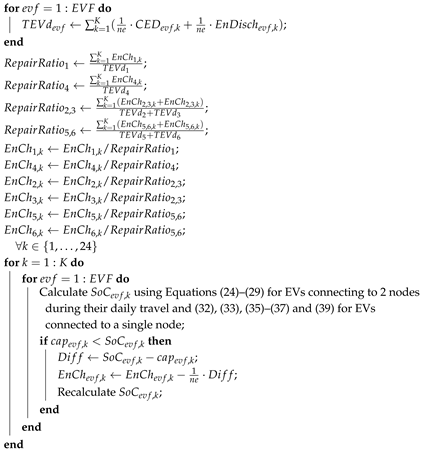
After the transfer of the problem to continuous space, the SoC is handled by two repair mechanisms. Initially, Algorithm 2 calculates the total power required by the EVs to replenish all the energy consumed over a 24 h period. This energy includes both the trips’ energy consumption and, in the case of V2G operations, the power supplied to the energy grid. A ratio is then calculated, representing the power provided by the power network, as determined by the heuristic mechanisms and the DE mechanisms, relative to the total energy consumed. This ratio is used to adjust the power supplied to the EVs, ensuring that by the end of the 24 h period, the EVs have stored the same amount of energy as they had at the beginning. According to Equations (30), (31), (34), and (38), the SoC for each category must not exceed the capacity of the EV batteries connected to the power network at each hour. If this occurs, the excess energy, divided by the EV charging efficiency, is subtracted from the power provided by the network by Algorithm 3, and the SoC is recalculated for use in the subsequent hour.
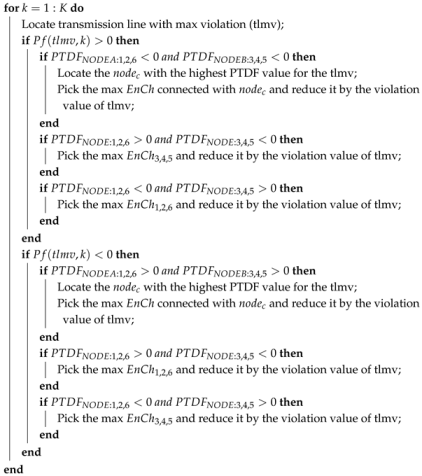
The demand of EVs during hours with line violations is reduced using Algorithm 3, which applies the PTDF method to decrease EV demand and consequently alleviate power flow on overloaded transmission lines. Unlike the approach in repair mechanism 6, which focuses on power generation, this method addresses demand. Thus, applying the opposite signs from those of the PTDF matrix will result in reduced power flow due to the inverse impact of demand in relation to production on line flow. This repair mechanism compares the PTDF of the nodes that the EVs are connected to, for the lines that are deemed problematic. These factors are the P T D F N O D E : 1 , 2 , 6 for EVs connected to Node A and P T D F N O D E : 3 , 4 , 5 for EVs connected to Node B. In the case that the power flow is positive and either one PTDF of Node A or B is negative, then when the demand connected to that Node is reduced, the power flow in that line is decreased.
Algorithm 1: Electric Vehicle heuristic repair mechanism that transfer the mixed integer V2G problem into linear space.
Energies 18 04293 i001
Algorithm 2: Electric Vehicle heuristic repair mechanism load reduction.
Energies 18 04293 i002
Algorithm 3: Electric Vehicle heuristic repair mechanism, total load repair, and SoC calculation.
Energies 18 04293 i003

3.3.2. Repair Mechanism 2—Spinning Reserve and Power Flow Repair Mechanism

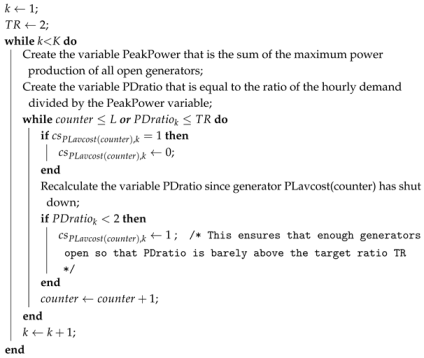
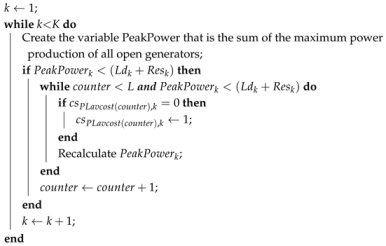
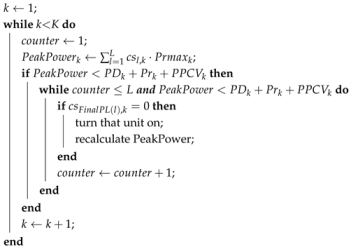
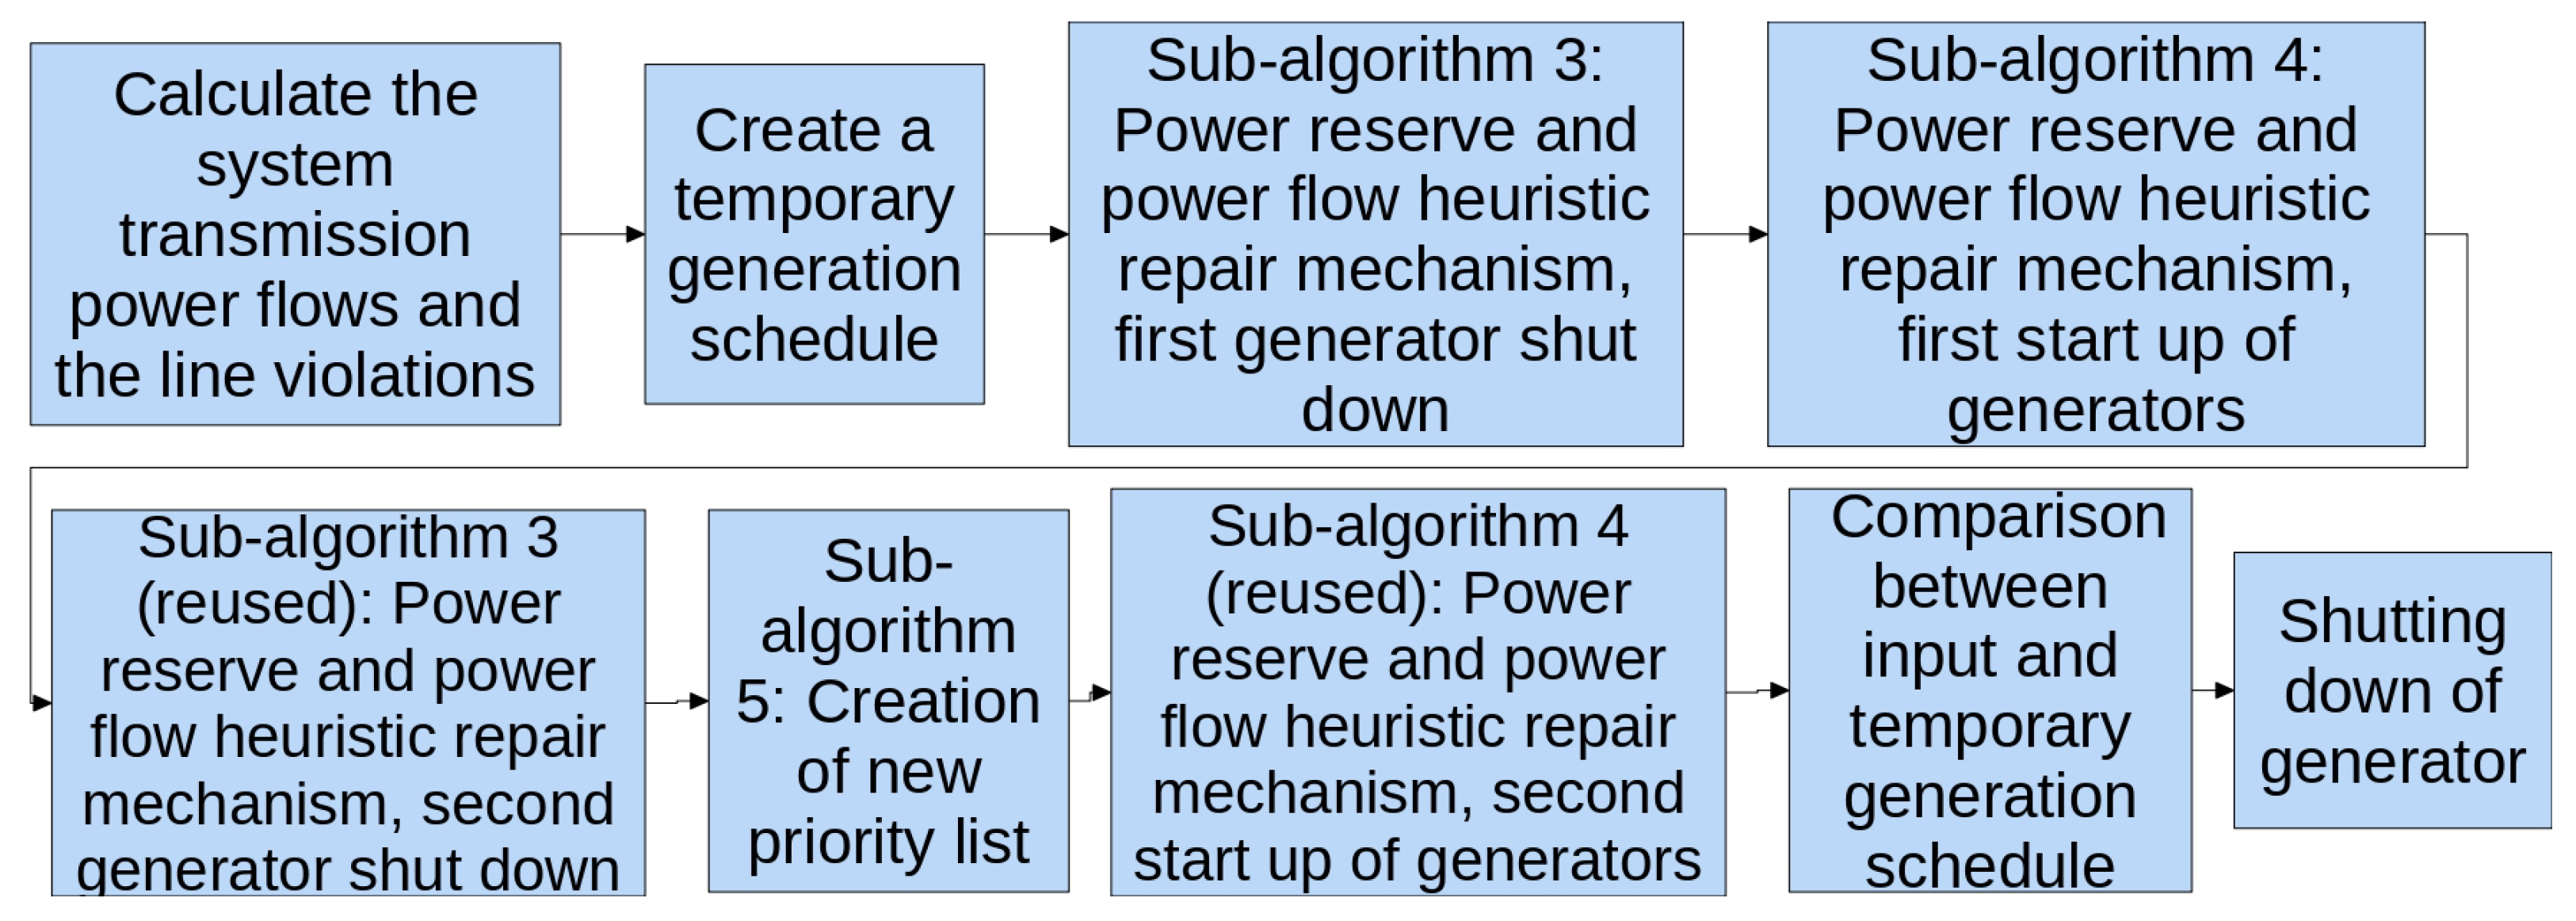
This heuristic repair mechanism is the first to engage with the TCUCP problem. Its primary function is to activate generators sequentially until the spinning reserve requirement is satisfied. The spinning reserve and power flow repair mechanisms generate schedules based on priority list methods from contemporary literature and the unique insights of the PTDF matrix. The heuristic mechanism initially creates a mirror schedule that is identical to the schedule received from the DE mechanisms. Algorithm 4 receives the DE mechanisms’ schedule and shuts down costly generators until the hourly demand to peak-power ratio (TR) equals 2 in a temporary variable. Algorithm 5 reopens generators until the system’s peak-power (sum of maximum production limits of all open generators) meets or exceeds the hourly demand plus required reserves. Algorithm 4 is called and shuts down generators until TR is less than 1. The second shutdown process aims to shut down all generators that were opened in previous generations by the proposed dynamic priority list, keeping open only generators from the Plavcost priority list (that is based on the average production cost of the generators, read [38] for the Plavcost). This approach aims to allocate sufficient capacity for the priority list containing grid information, ensuring it can accommodate the additional required reserve increased by the newly introduced variable PPCV while reducing power flow violation.
Algorithm 4: Power reserve and power flow heuristic repair mechanism, first shut down of generators.
Energies 18 04293 i004
Algorithm 5: Power reserve and power flow heuristic repair mechanism, first start-up of generators.
Energies 18 04293 i005
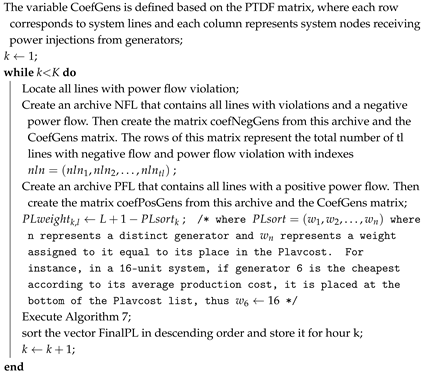
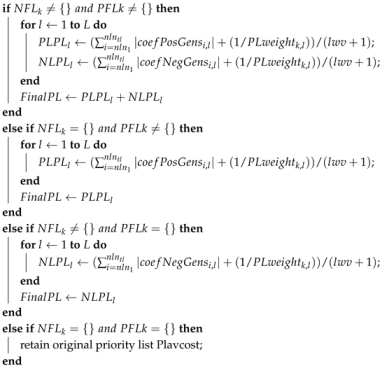
The Algorithm 6 creates the new priority list that consists of the Plavcost priority list in combination with the coefficients of the PTDF matrix. At first, the violation of every line within the 24 h schedule is calculated. Then the lines where the power flow exceeds the power transfer limit are utilized in order to sort the system’s generators. This is achieved by adding the absolute values of the PTDF coefficients of those lines. The lowest values end up at the bottom of the priority list since the effect of the generator on the violated lines is minimal, and turning those generators off or on will not significantly affect the power flow violation of the targeted lines. A value is assigned to every generator as shown in Algorithm 7, which consists of the sum of the absolute values of all violated transmission lines increased by 1 over P L w e i g h t k , l . This variable, as per Algorithm 6, receives a lower value the less expensive a generator is. Thus, a generator with a high P L w e i g h t k , l value (meaning the more expensive it is) with a small contribution of PTDF will be placed lower in the new priority list than a generator with small P L w e i g h t k , l value and with a large contribution to the violated lines. Thus, the further down a generator is in the FinalPL, the worse it is considered for the system, both due to cost and line violation. Upon the establishment of the updated priority list, a new phase of generator activation is initiated by Algorithm 8 using the new priority list “FinalPL” until the sum of the Prmax of all open generators is equal to the hourly demand added by the necessary reserves and the variable PPCV. After the execution of Algorithm 8, a comparison is performed between the schedule received by the DE mechanisms and the temporary schedule that resulted from Algorithms 4–8. If a generator is active in both schedules, its production in the temporary schedule is adjusted to match the output generated by the DE mechanisms. If more generators were open in the schedule provided by the DE and are closed in the temporary schedule, then those generators are turned on in the temporary schedule. The temporary schedule then becomes the new regular schedule. This way, information provided by the DE is retained.
Algorithm 6: Creation of dynamic priority list.
Energies 18 04293 i006
Following the comparison between the two schedules, a generator might shut down. This generator is the open generator that lies furthest down the FinalPL priority list. After the shutdown of this generator at hour k, the schedule of the same generator is altered in adjacent hours in a stochastic manner, in order to repair the minimum downtime constraint of the generator. This shutting down is performed under the following conditions: (1) the total line violation of the hour k is larger than 0.05 MW, (2) the peak power of the open generators divided by the pick power of all generators of the system (both opened and closed) is larger than 0.9, and P = U ( 0 , 1 ) > 0.4 . The repair of the minimum downtime of the generator follows some simple rules after counting the consecutive hours the generator is open before and after the hour k:
  • In a stochastic manner, pick an hour close to hour k from the range k M T D l + 1 till k and shut down all consecutive generators from the randomly selected hour until the minimum down constraint is satisfied.
  • If the shutdown of the previous step causes the minimum uptime to be disturbed, extend the operating hours of the generators.
  • If the shutting down of the generators creates conflict with the initial state of the system or the energy reserves of the system, then do not shut the generator down and perform the previous steps with the next generator from the FinalPL priority list.
  • If the power reserve is not satisfied by the shutdown of any generator, do not shut down a generator.
Algorithm 7: Algorithm of 6, calculation of the characterization number of every generator considering their PTDF coefficient and position on average cost priority list.
Energies 18 04293 i007
The complete flowchart of this heuristic is shown in Figure 4.
Algorithm 8: Power reserve and power flow heuristic repair mechanism, second start-up of generators.
Energies 18 04293 i008

3.3.3. Repair Mechanism 3—Minimum Up and Minimum Down Repair Mechanism

This mechanism is adopted from the work of [38], and readers are encouraged to consult this article for further details.

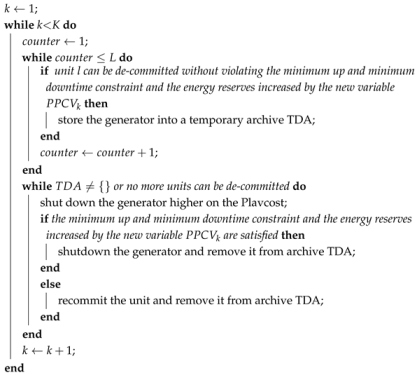
3.3.4. Repair Mechanism 4—Spinning Reserve Minimization/Shutdown of Excess Reserve

The mechanism employed in this work is adapted from [27,38] and others. The mechanism is presented in Algorithm 9 and aims to reduce the excessive reserve produced by the system by decreasing the number of operational generators. This minimizes the constant costs of generators, resulting in a more economical system. The process is only interrupted when the minimum up and minimum downtime constraints are violated.
Despite the reduction in operational time, the sub-algorithm’s design conflicts with the integration of transmission constraints, as, in many cases, generators would need to operate in greater numbers to satisfy these constraints. To address this issue, the optimization variable P P C V k is introduced as a control mechanism for the operation of several heuristics within the proposed general computational model. This variable P P C V k as used in Algorithm 9 decreases the amount of power that is perceived by the sub-algorithm as excessive reserve, reducing the number of generators that need to be shut down for achieving minimum reserve level, thus regulating the amount of excess peak power available each hour.
Algorithm 9: Power reserve minimization via shutdown of generators.
Energies 18 04293 i009

3.3.5. Repair Mechanism 5—Ramp Rates Repair

This mechanism is adopted from the work of [38], and readers are encouraged to consult their study for further details.

3.3.6. Repair Mechanism 6—Power Production Transfers for Repairing Line Violation

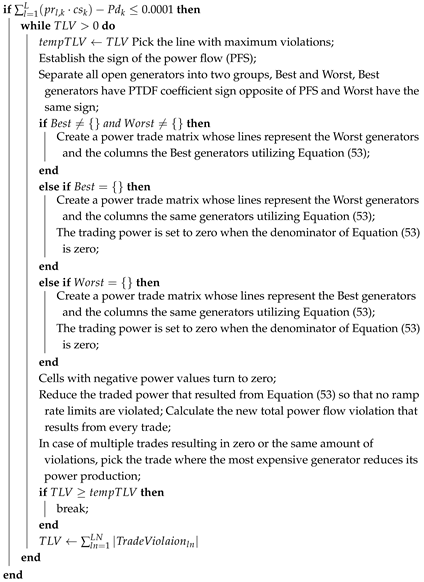
The operation of this mechanism uses information from the coefficients of the PTDF matrix to repair power flow constraint violations, and every action involves operational generators only. In this step, two generators at a time are paired, and an equal amount of power production is transferred from generator i to generator j. This trade is dictated by the sign of the power flow of the transmission line and the sign of the coefficient of the PTDF matrix of the corresponding node to which each generator is connected. The basic principle of the sub-algorithm is that an increase in production of a generator with a positive PTDF coefficient will reduce the power flow of a line with negative power flow and vice versa. The amount of power production that is traded is calculated by Equation (53). This equation is produced by Equation (51) if equal power production is transferred from generator i to generator j.
The process follows the steps in Algorithm 10: Initially, a demand constraint repair mechanism, used in [38], adjusts generator production to match day-ahead demand. This ensures energy dispatch meets the demand, preventing power flow violations in transmission lines. Next, power flows are computed, identifying lines with violations. The line with the highest violation guides subsequent energy trades. After each trade, power flows are recalculated, choosing trades that minimize the sum of violations across all lines. During the search for the optimal trade, the generators are classified into two distinct groups. The first group, referred to as the “Best group”, consists of generators whose PTDF coefficients have an opposite sign to the power flow on the transmission line exhibiting the highest violation. Conversely, the second group, termed the “Worst group”, includes generators whose PTDF coefficients share the same sign as the power flow on the most violated line. Algorithm 11 prioritizes trades to minimize energy exchange. Trades first occur between Worst and Best groups; if one is empty, then all generators are considered for trade within the same group. This way, evaluations are significantly reduced. If Best is empty, trades shift from higher to lower negative impact generators. If Worst is empty, trades move from positive to more positive impact generators.
Algorithm 10: Power generation and power flow heuristic repair mechanism, generation trades between open generators.
Energies 18 04293 i010
Trades are executed as long as the total sum of power flow violations across all transmission lines remains positive. The reason for evaluating the impact of each trade on the entire transmission network, rather than on individual lines, is that while a trade may reduce the violation on a specific line, it could simultaneously exacerbate violations on other lines. Therefore, it is crucial to prioritize trades that optimize the overall network performance, even if they do not fully eliminate the violation on the target transmission line. This holistic approach ensures that the overall power system operation is improved.
P o w e F l o w = c o n s t + P T D F i · p r i + P T D F j · p r j
Reduce the production from generator i by p r t MW and increase the production of generator j by the same amount:
( P T D F i P T D F j ) · p r t V i o l a t i o n
p r t | V i o l a t i o n | ( | | P T D F i | | P T D F j | | )
Algorithm 11: Power generation and power flow heuristic repair mechanism, generation trades between open generators—Algorithm of 10, cases depending on the existence of generators in “Best” and “Worst” archives.
Energies 18 04293 i011

4. Results

The TCUCP with EVs was solved using a variant of DE and is a real-coded approach implemented in MATLAB (2024a). All MILP formulations were optimized with MATLAB’s intlinprog algorithm. The simulations were executed on an Intel® C o r e T M i5-6402P CPU @ 2.80 GHz with 8.00 GB of RAM.

4.1. Objectives of the Experiments

This work set out to address six key objectives related to the integration of EVs into the TCUCP using a DE framework. First, a computational model was developed to allow DE, traditionally suited for continuous spaces, to handle mixed-integer variables. This was achieved by implementing heuristic repair mechanisms that transform solutions into a continuous domain. To validate the accuracy of this approach, results were compared with those from a MILP benchmark under the same linear problem formulation, specifically in scenarios without EVs and with G2V operation only. Despite DE being a stochastic metaheuristic and MILP a deterministic optimization method, the DE-based approach delivered results within 1% of the MILP solutions, demonstrating high solution quality in linear cases.
Second, the model introduced a novel variable to guide heuristic repairs under transmission constraints, allowing the algorithm to control the number of generators remaining online and ensuring feasibility. This was supported by sensitivity analysis showing improved convergence when the variable was active. Third, EV charging was modeled as a flexible load to smooth the system’s load profile, successfully preventing constraint violations and distributing demand more evenly throughout the day.
Fourth, the economic viability of EV discharging was explored; results show that it could reduce costs and prevent generator shutdowns when generator startup costs were considered, making it a competitive option under certain conditions. Fifth, the study accounted for EV fleet movement across multiple urban nodes, revealing that nearly half of EV charging occurred at destination nodes, an insight critical for planning charger placement and aggregation strategies. Finally, EV travel behavior and energy consumption were modeled using a stochastic trip chain approach. Despite introducing variability and increasing system costs, the algorithm effectively optimized schedules, demonstrating robustness under uncertainty. Together, these contributions offer a realistic and flexible framework for integrating EVs into short-term power system planning.

4.2. Results of the TCUCP Without EVs

The preliminary evaluation of the proposed general computational model was conducted in the absence of flexible loads. The proposed general computational model with its heuristic sub-algorithms was tested on three distinct power networks: a small-scale network with three generators, a medium-scale network with sixteen generators, and a large-scale system with fifty-four generators. This range of network sizes allows for a comprehensive assessment of the general computational model’s capacity to achieve near-optimal solutions across various scales of power systems. The input data for the power systems were obtained from [55] and were also used in [56,57] among other mentioned in the literature review. These networks and variations of them have been heavily used as test cases in many works. The total demand of every power system is presented in Appendix B.
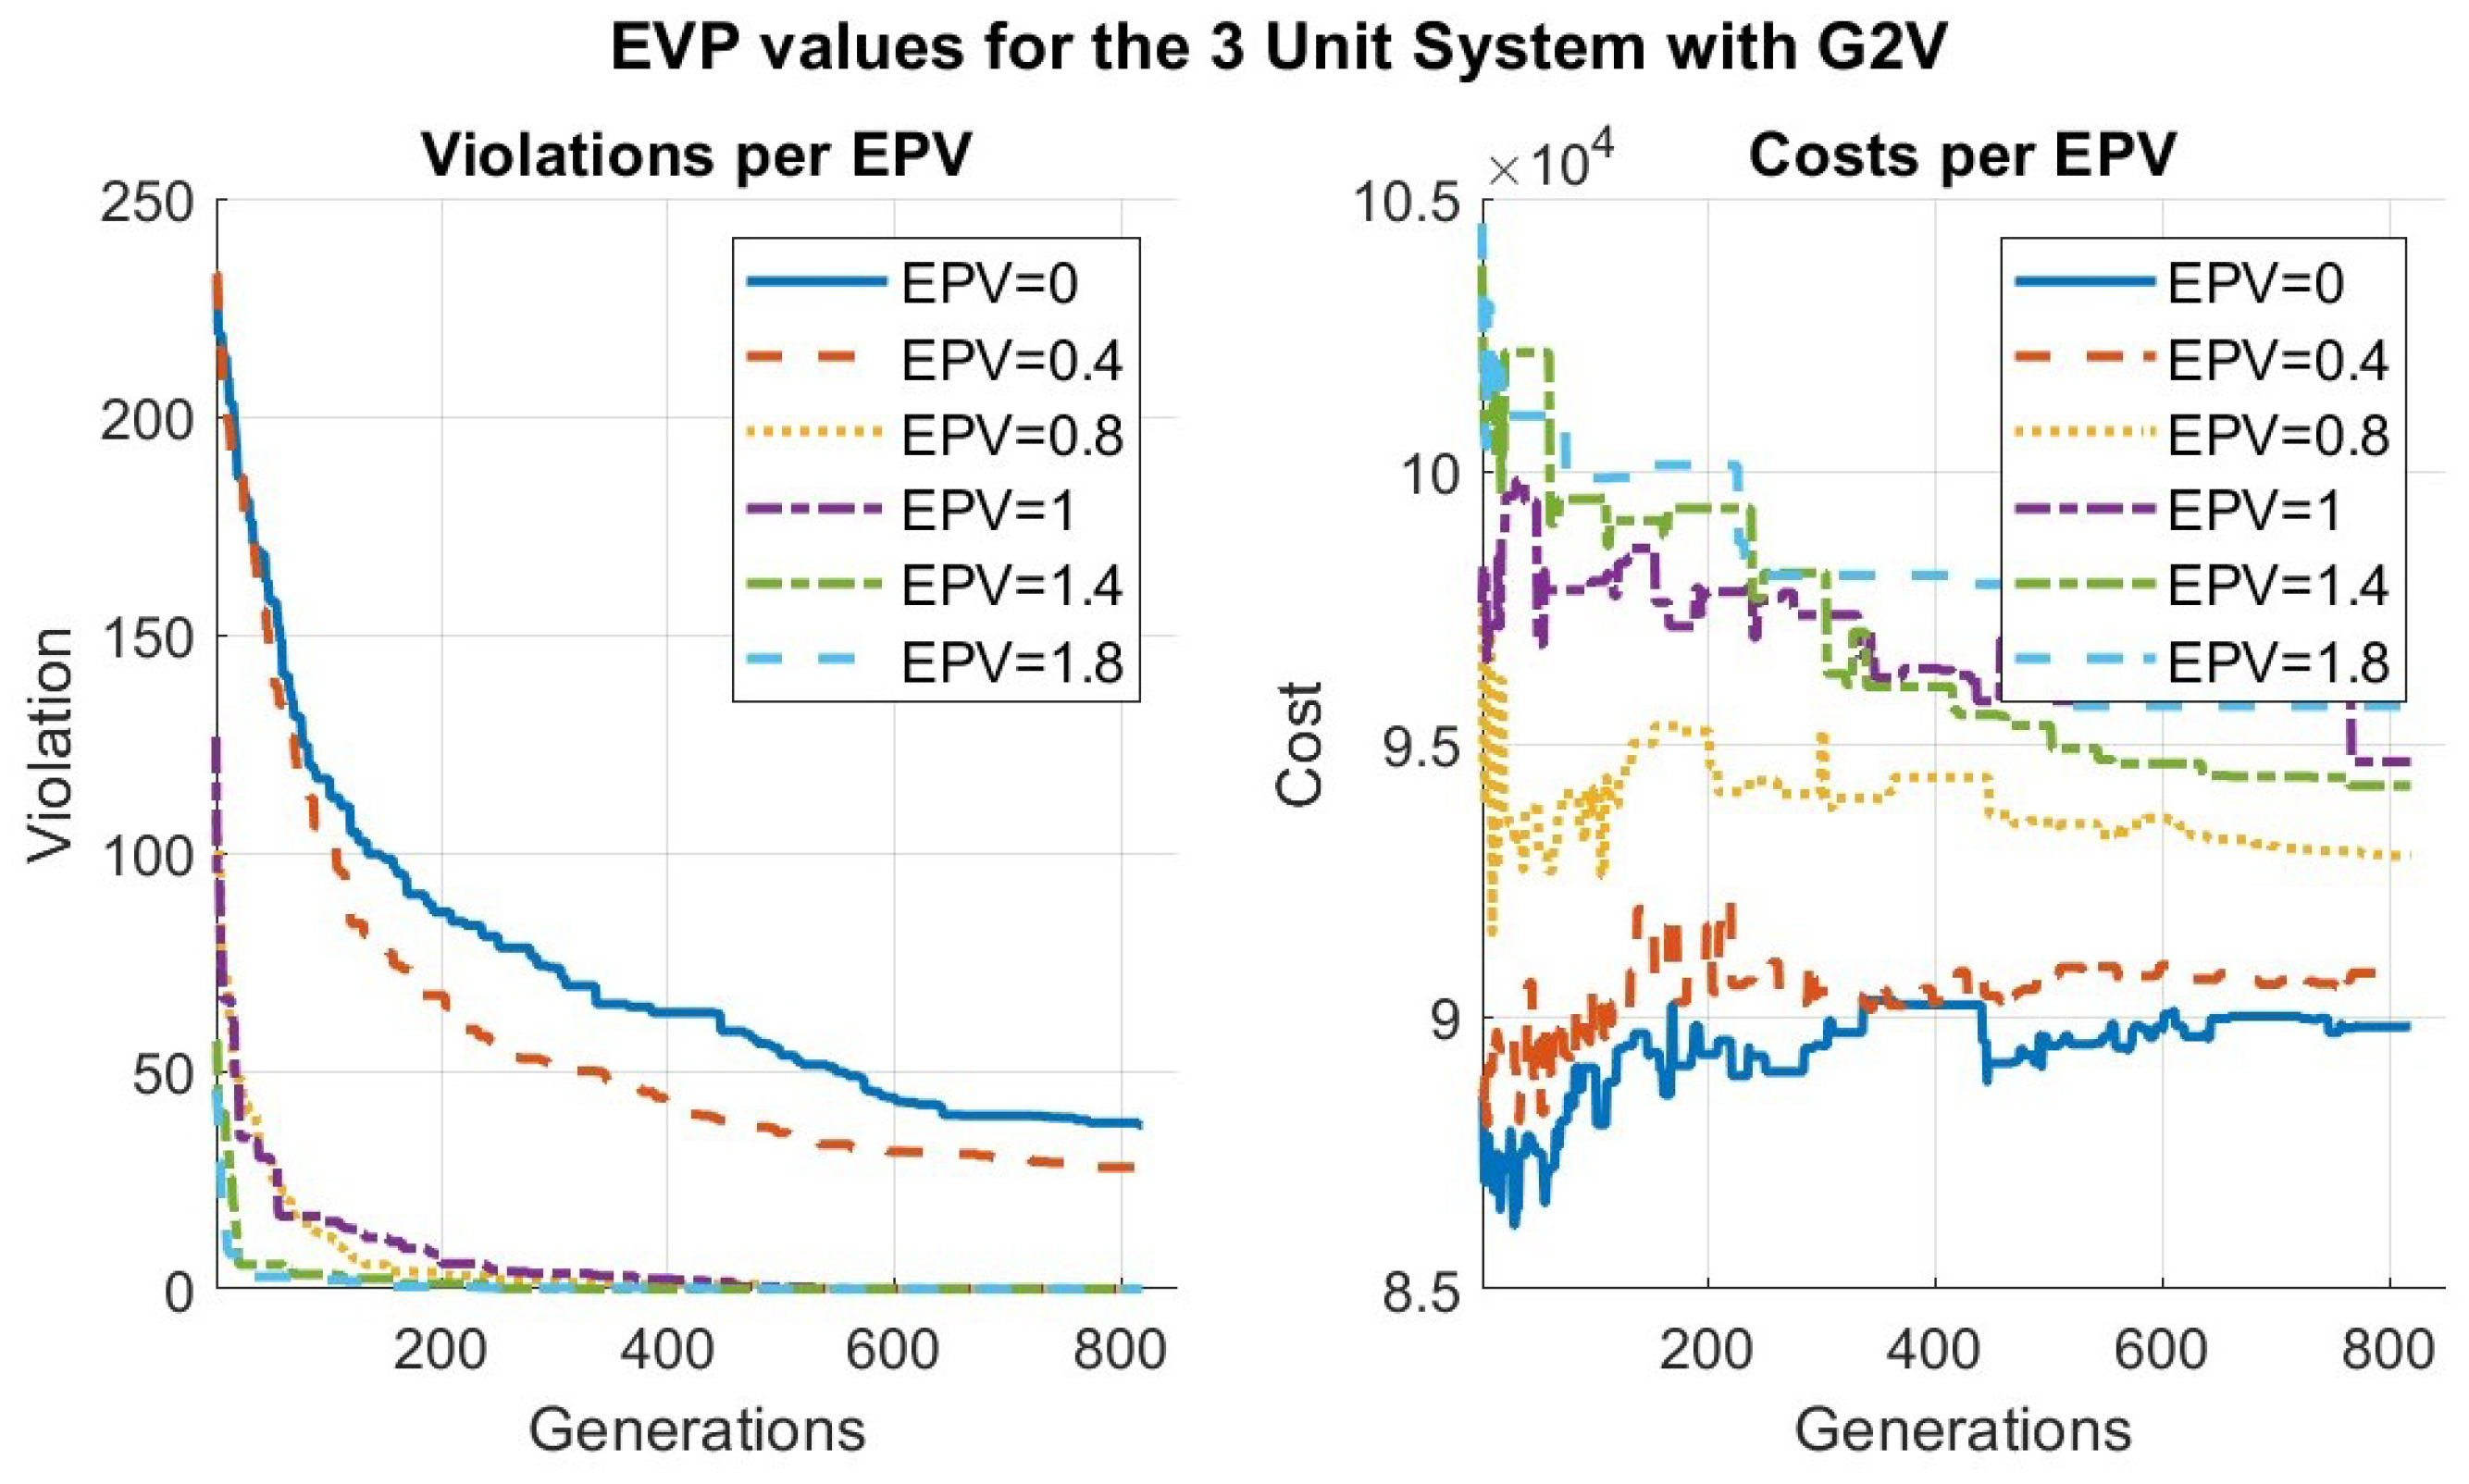
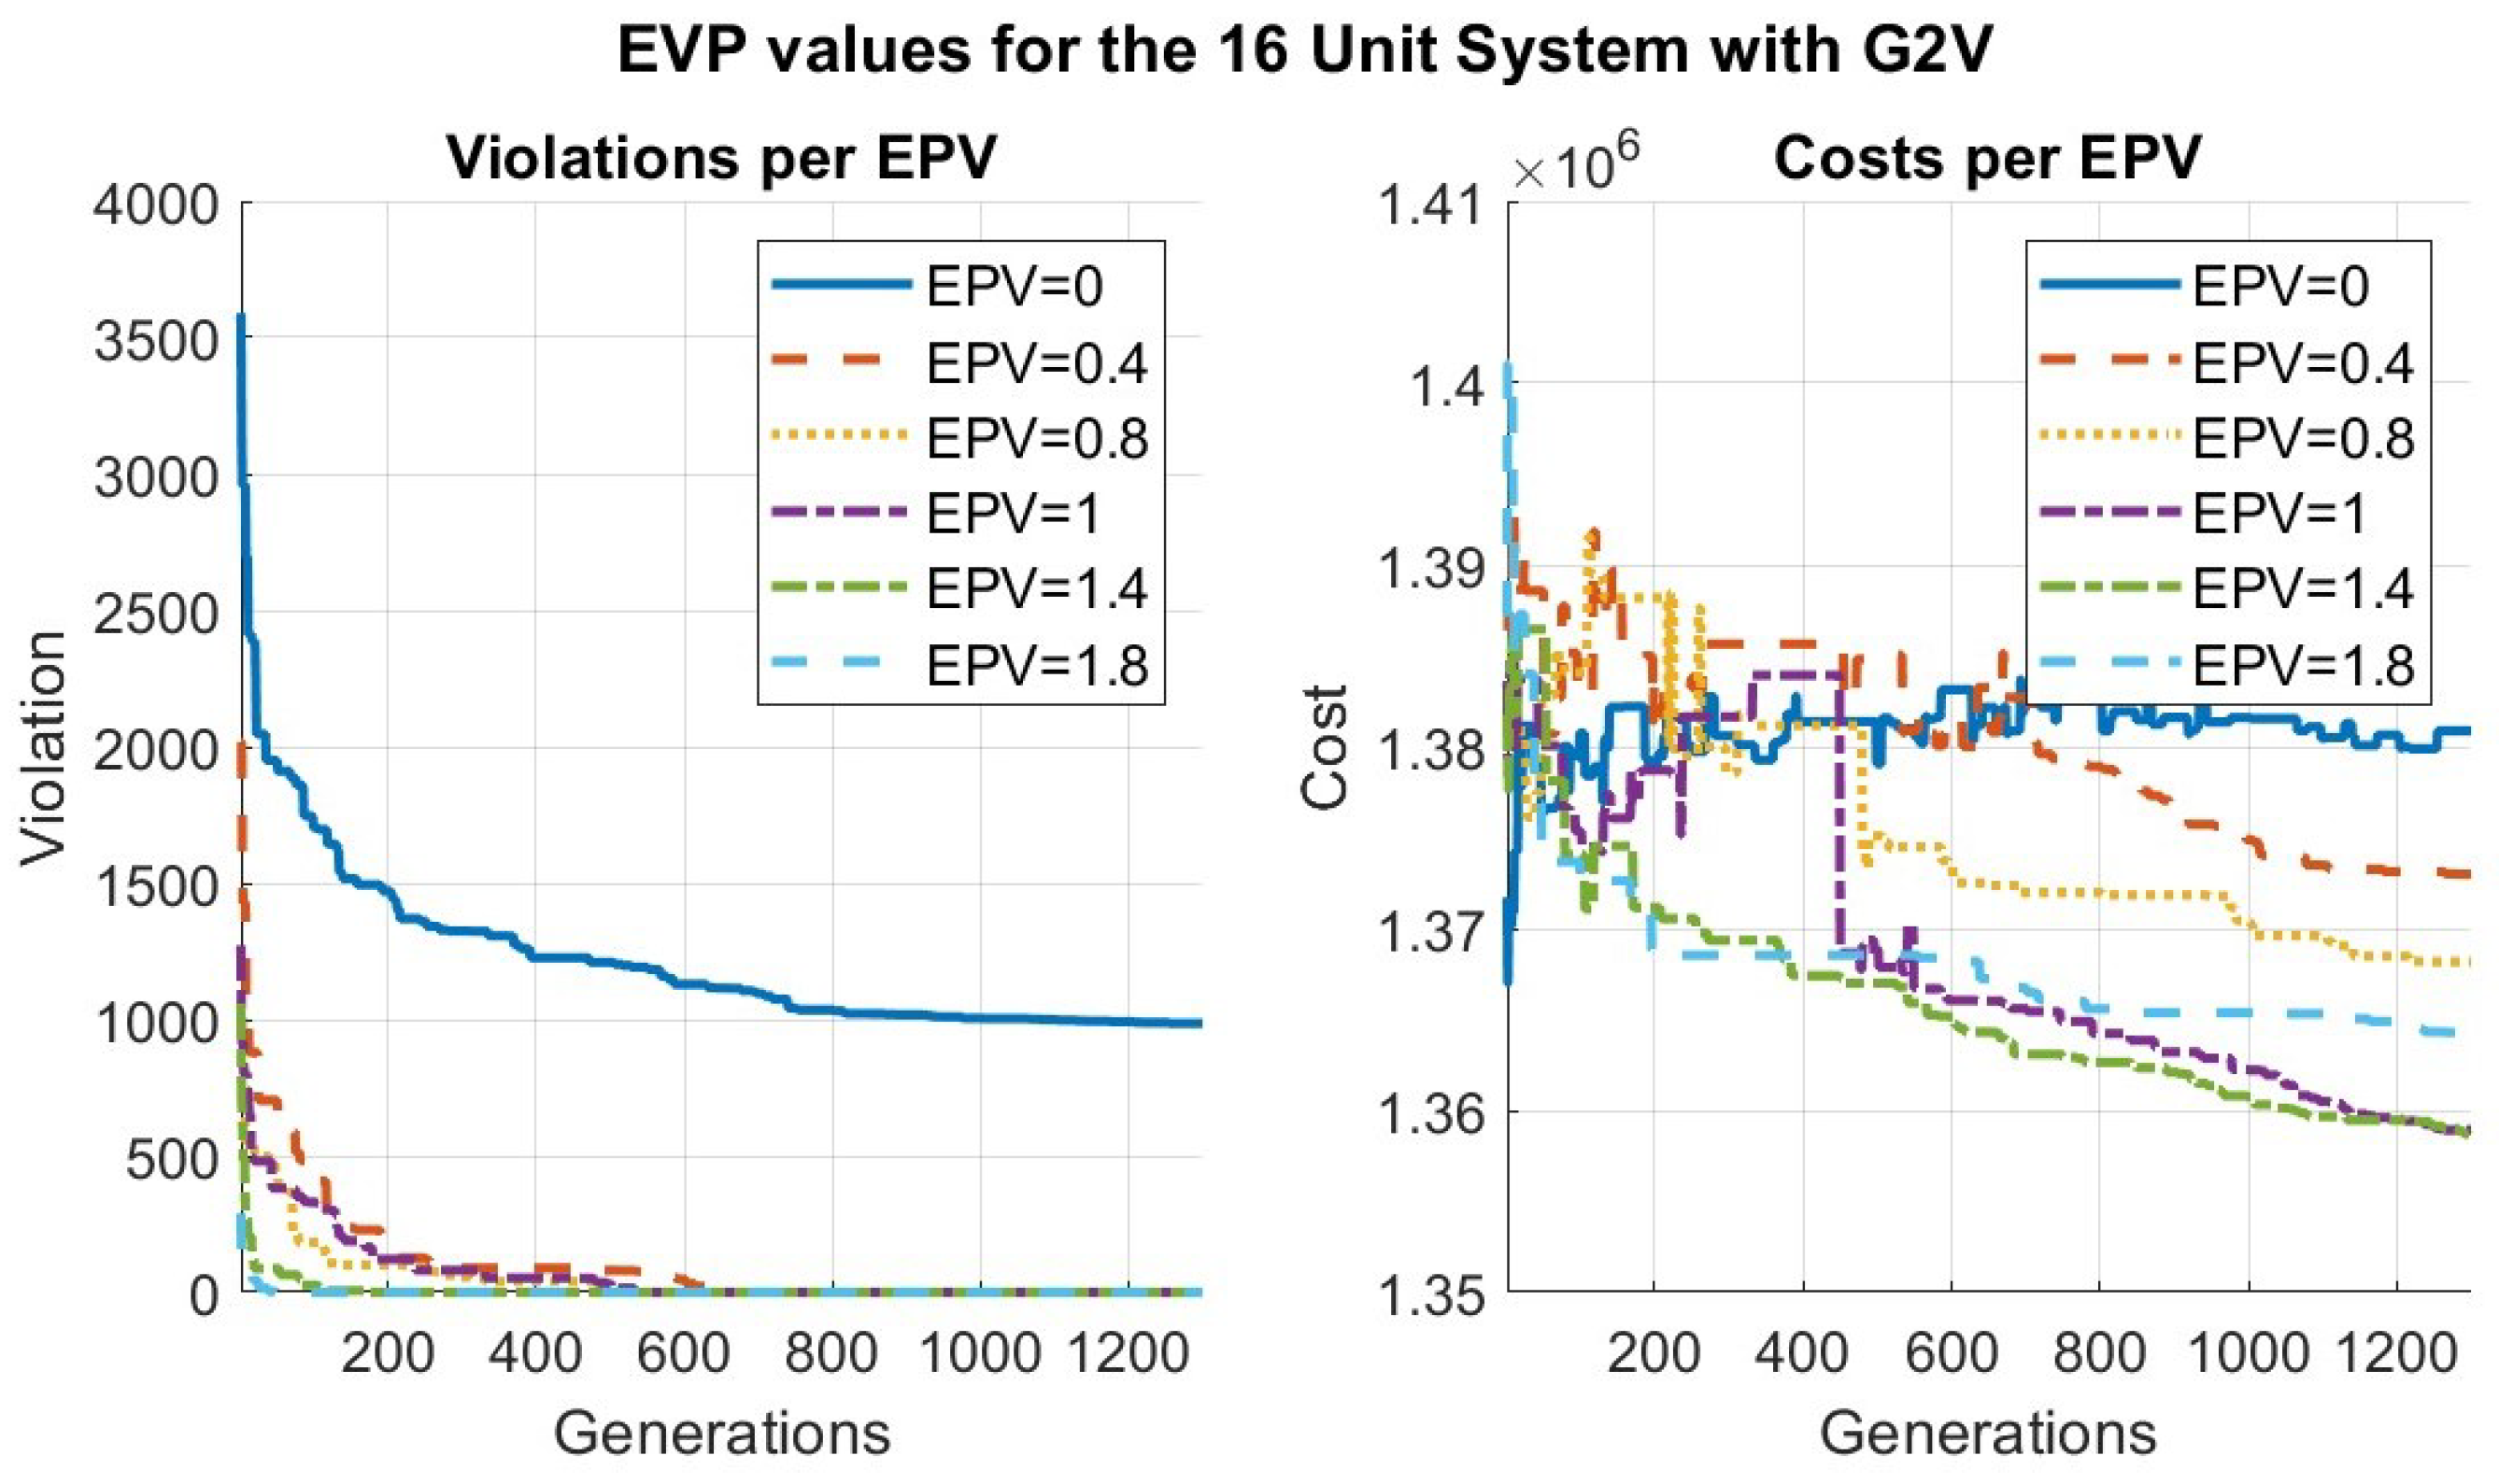
The boundaries of the PPCV variable were established experimentally and define the maximum allowable reserve within the system. The upper limit of the PPCV variable, represented by the EPV, was varied from 0 to 2.5. Each system demonstrated a distinct EPV threshold where the optimization algorithm produced optimal results. When the EPV exceeded this threshold, there was no further improvement in solution quality or convergence rate. The chosen EPV values are 0.8, 1, and 1.6 for the three power systems, respectively. The DE formulation’s termination criterion is the total function evaluations (FES) and was also determined experimentally, aiming for the DE solution to reach within approximately a 1% relative difference from the MILP solution. The results of the DE-based optimization algorithm are compared with the results of the MILP algorithm with the same formulation. The system’s hourly reserve is set at 10% of the hourly demand, with EV loads excluded from reserve calculations. The cost function was linearised in four segments. The schedule presented in Table 6 can be confirmed by [55] for the results of the classical DC power flow, with the same operating cost. In Table 7, the results of all the examined power systems are showcased. The results demonstrate that the total costs for the 3-unit and 16-unit systems are approximately the same when using the MILP formulation, while the 54-unit system shows a relative difference of slightly over 1%. All the following results depict the solution up to three decimals. The real solution contains eight decimals for a solution without violation.

4.3. Results of the TCUCP with EVs in G2V Operation

The G2V formulation was developed by integrating EVs at two Nodes of each system with significant load that represent an urban environment. The chosen Nodes are close to each other and are not directly connected via a transmission line. The chosen Nodes were the following: (1) Nodes 5 and 6 for the 3-unit system, (2) Nodes 3 and 10 for the 16-Unit system and (3) Nodes 86 and 90 for the 54-Unit system. The number of EVs assigned to each Node was determined based on the load profiles of these Nodes. The corresponding numbers of EVs are 100k, 1 mil, and 200k, respectively.
The selected numbers of EVs represent realistic scenarios of EV penetration in power generation systems. Fleet sizes were chosen to ensure that EV loads are comparable to the existing load at each node. These nodes represent large urban centers, with EV loads designed not to exceed the established load of the particular node of the test system.
In the 3-unit system, the total load connected to the node is 1125.7 MWh. An additional EV load, amounting to approximately one-fourth of this value, was assigned to the node, but it is not included in the connected load. In the 16-unit system, which has a connected load of 46,790.654 MWh, the assigned EV load was set to ten times that of the 3-unit system, while ensuring the total number of EVs remained below one million. In the 54-unit system, although the connected node load is similar to that of the 3-unit system, the EV load assigned was doubled due to the system’s larger scale. The charging schedule of the 3-unit system in G2V operation is presented in Table 8.
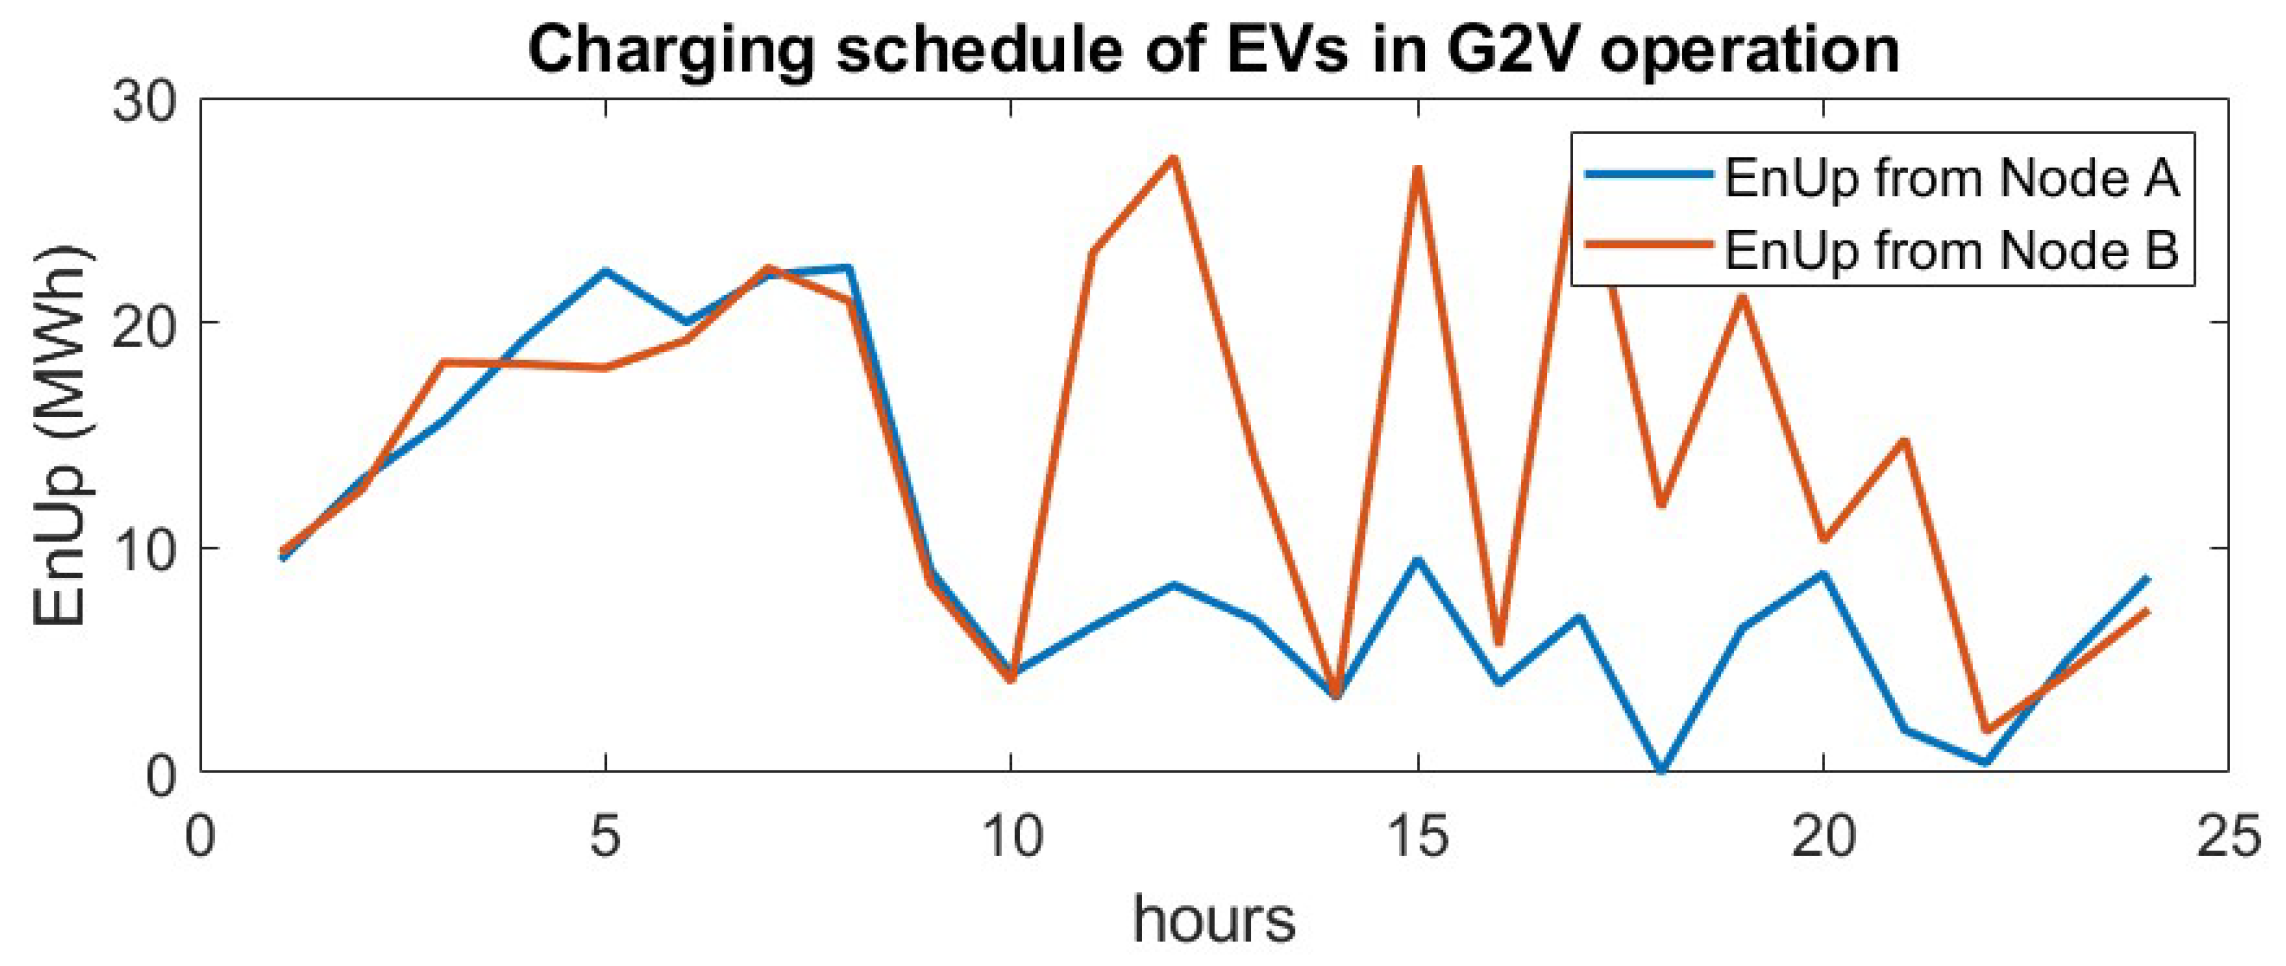
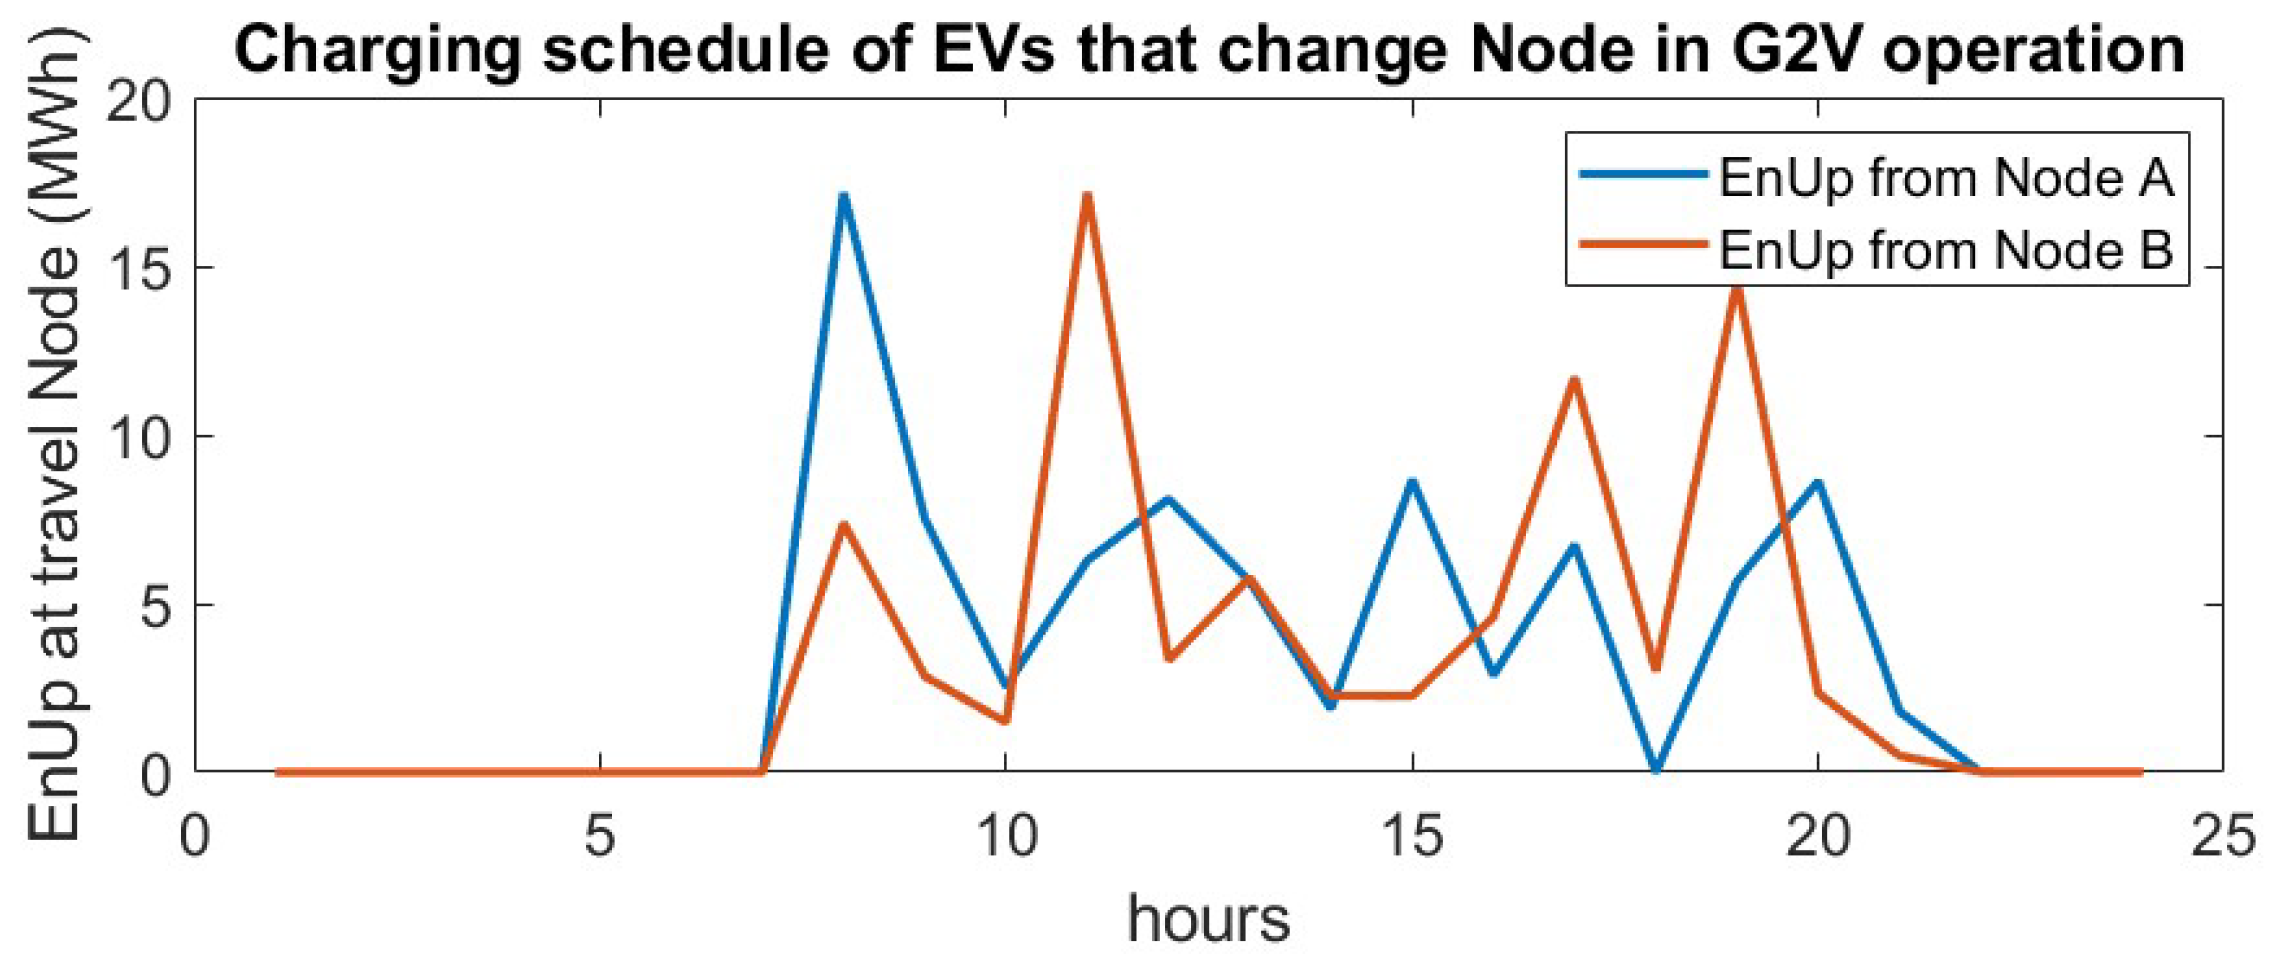
From the results presented in Table 8 and Figure 5, we observe the following:
  • EV Charging Patterns: EV charging is distributed evenly throughout the day, with no significant peaks as seen in Figure 5.
  • Charging at Travel Nodes: EVs traveling to different Nodes receive substantial charging power while parked at these locations as showcased in Figure 6. This highlights the importance of charging station availability across all travel destinations to support a smooth charging process.
  • EVs as Flexible Load: Utilizing EVs as a flexible load enables a considerable amount of power to be added to the hourly nodal load without causing power flow violations in the transmission lines.
Some notable aspects of the results can be observed in Table 7 and Table 9. Initially, the computation times for the 3-unit and 16-unit systems are comparable. This occurs due to the operation of the spinning reserve and power flow repair mechanism. In the 3-unit system, specifically in cases with EV inclusion, repair mechanism two frequently attempts to shut down generators nearly every hour, following the four rules presented in Section 3.3.2. The reason for this originates in the hourly fluctuations in demand due to the variability of the EV load. This forces the general computational model to explore shutting down generators in search of a solution without violations. In the test case without EVs, the complete algorithm infrequently initiates generator shutdowns, with exceptions occurring primarily during hours 17 to 20. However, with the inclusion of EVs, computational times increase substantially for the 3-unit system, as the general computational model expands the hours during which it attempts generator shutdowns. Notably, this instability in hourly demand due to the presence of EVs led to increased computational times across all systems.
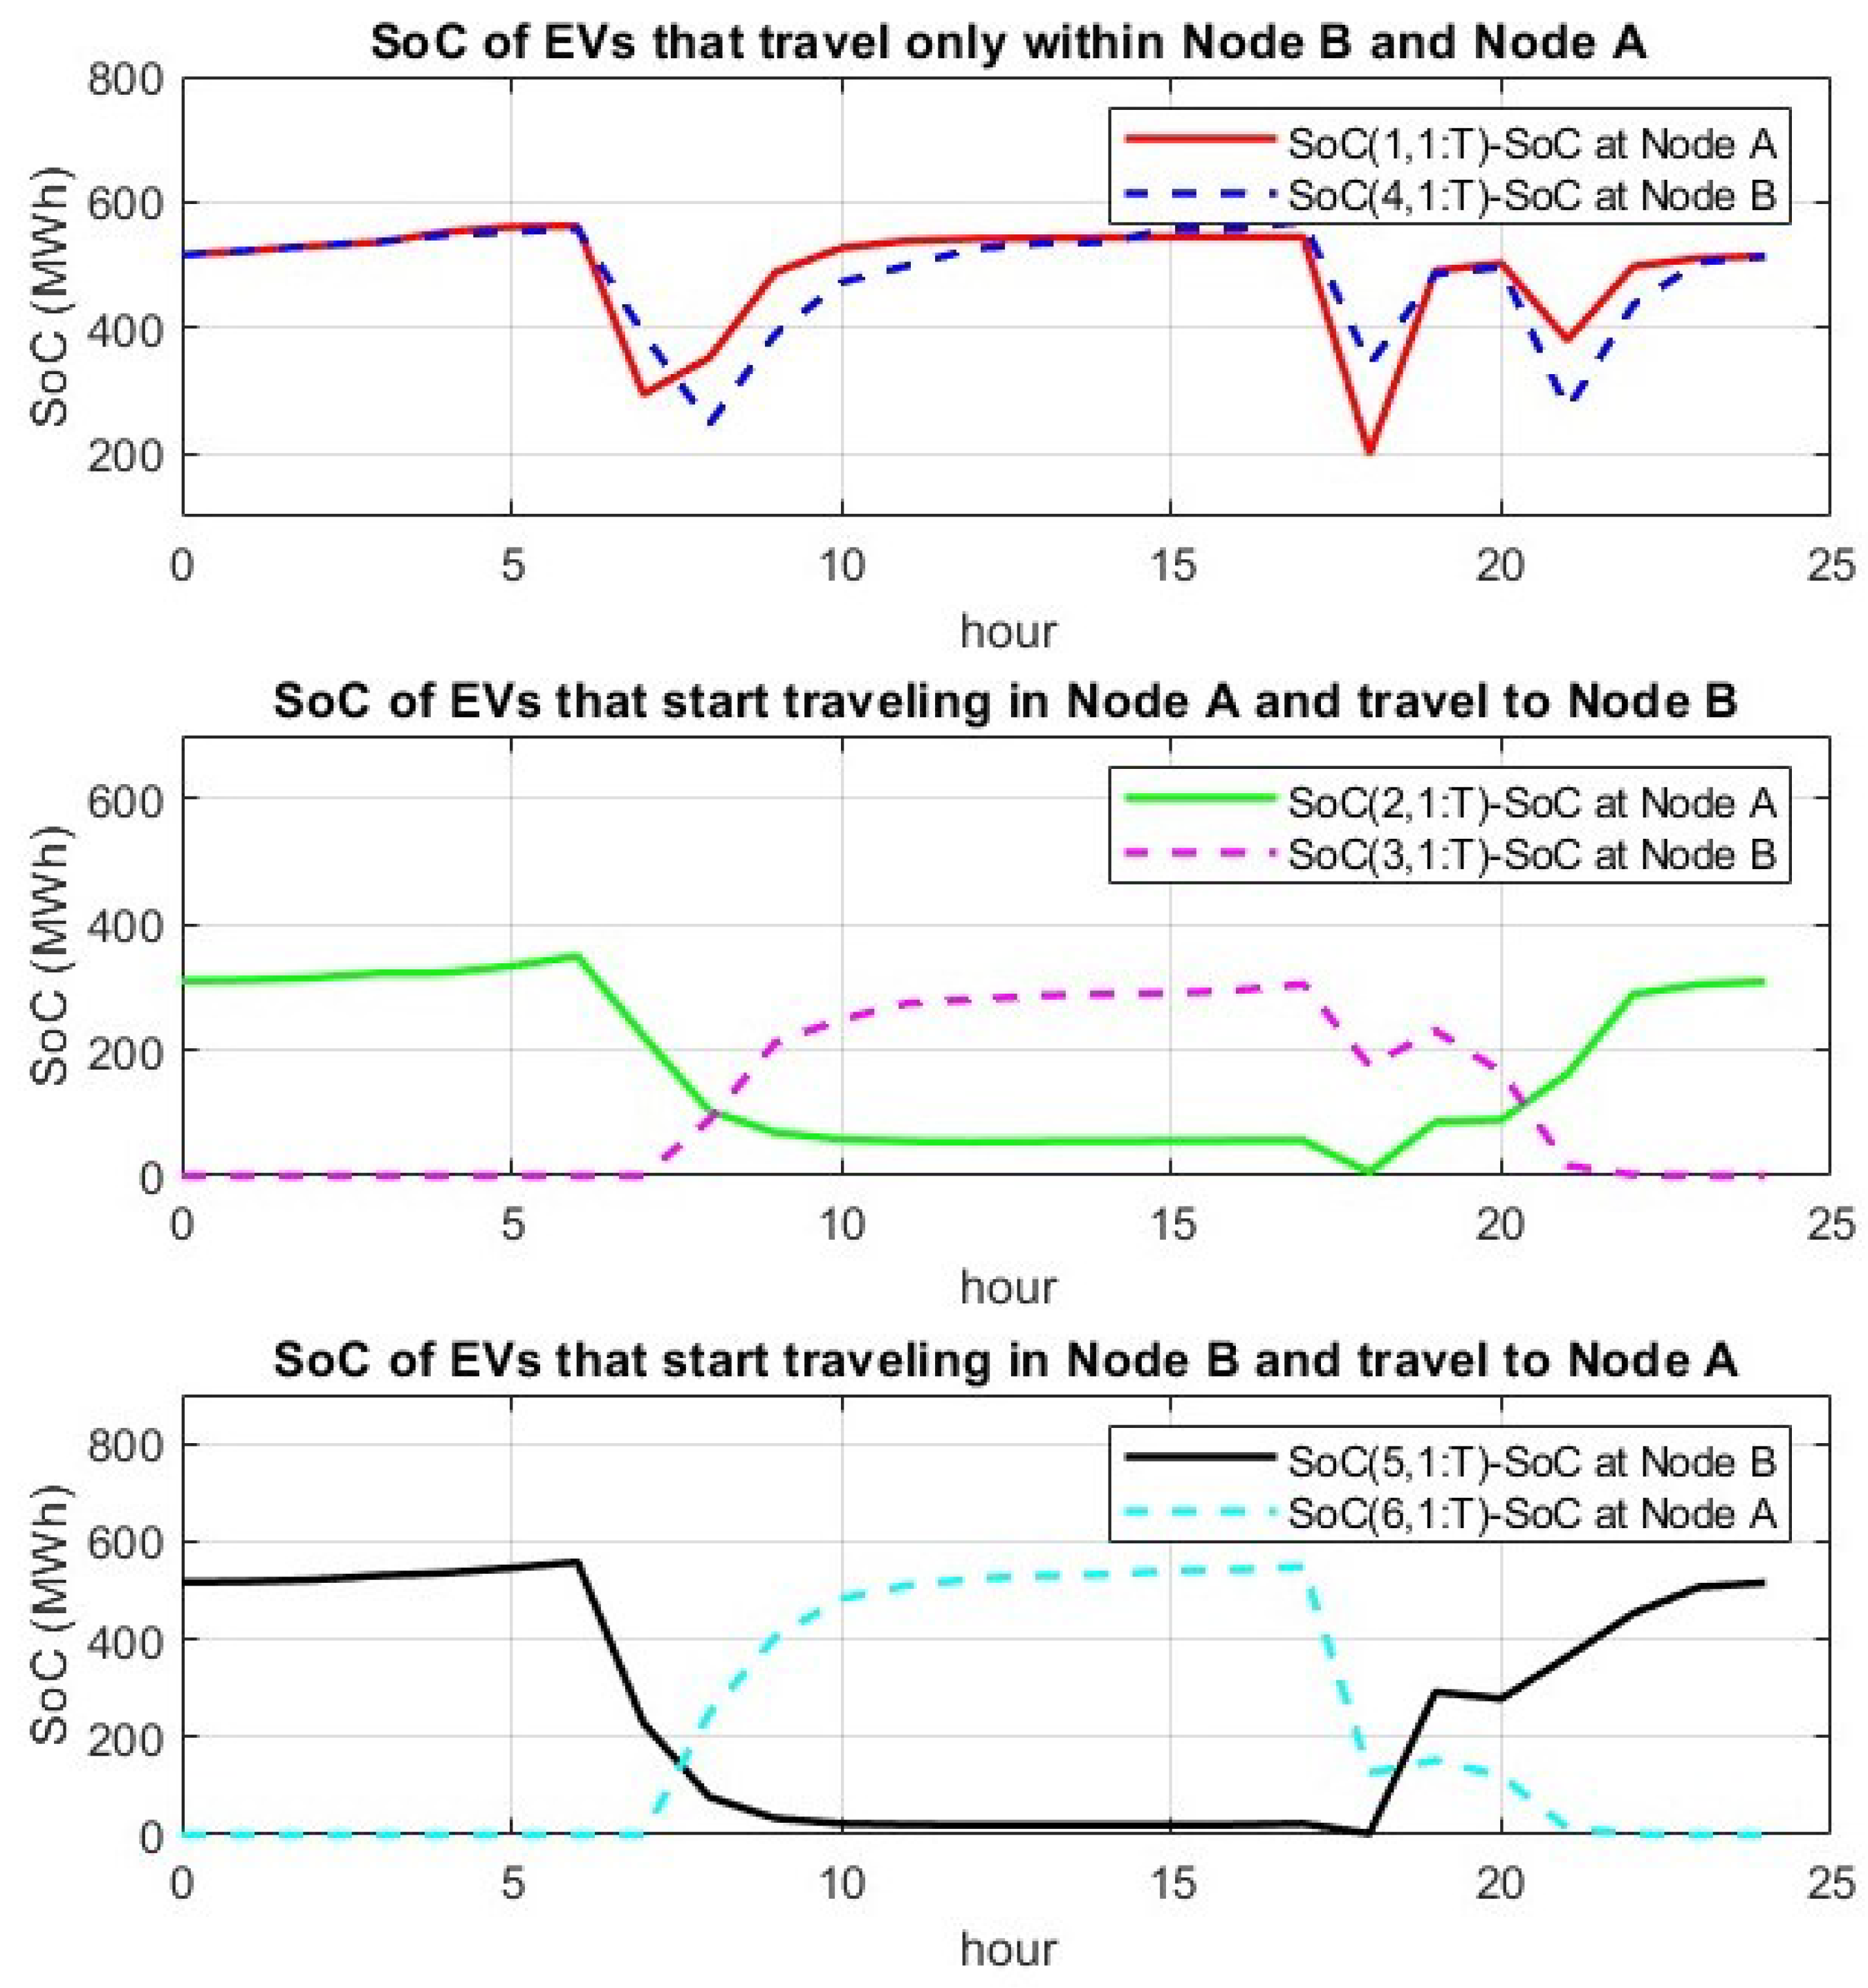
Figure 7 illustrates the SoC of the EVs for the day-ahead schedule. At hour 0, the initial state of the EVs is depicted, which is equal to the state at the end of the 24 h period for all three diagrams. The first diagram in the figure illustrates the SoC of EVs that remain within the range of a single node throughout the day. On the other hand, the second and third diagrams represent the categories of EVs that travel to different Nodes within the day. At the beginning of the 24 h schedule, EVs are not considered to be fully charged, nor are they required to reach a state where their batteries are fully charged. However, by the end of the 24 h schedule, they are forced to recover all the energy they discharged within the day. The same systems were optimized with a basic PSO algorithm, including the proposed heuristic repair algorithms. The results are presented in Table 10.

4.4. Results of the TCUCP with EVs in V2G Operation

This subsection presents the results for all three power systems in the V2G operation, with the overall results summarized in Table 11. By observing the general computational model’s behavior, it is clear (see Table 12) that V2G operation is utilized at hour 18, enabling all generators to remain active. In contrast, in the G2V schedule, as observed in Table 8, the second generator is shut down at hour 18 to meet power flow constraints. The V2G power injection, despite being minimal, effectively mitigates power flow violations, allowing generator 2 to stay online, as shown in Table 6, Table 8, and Table 12.
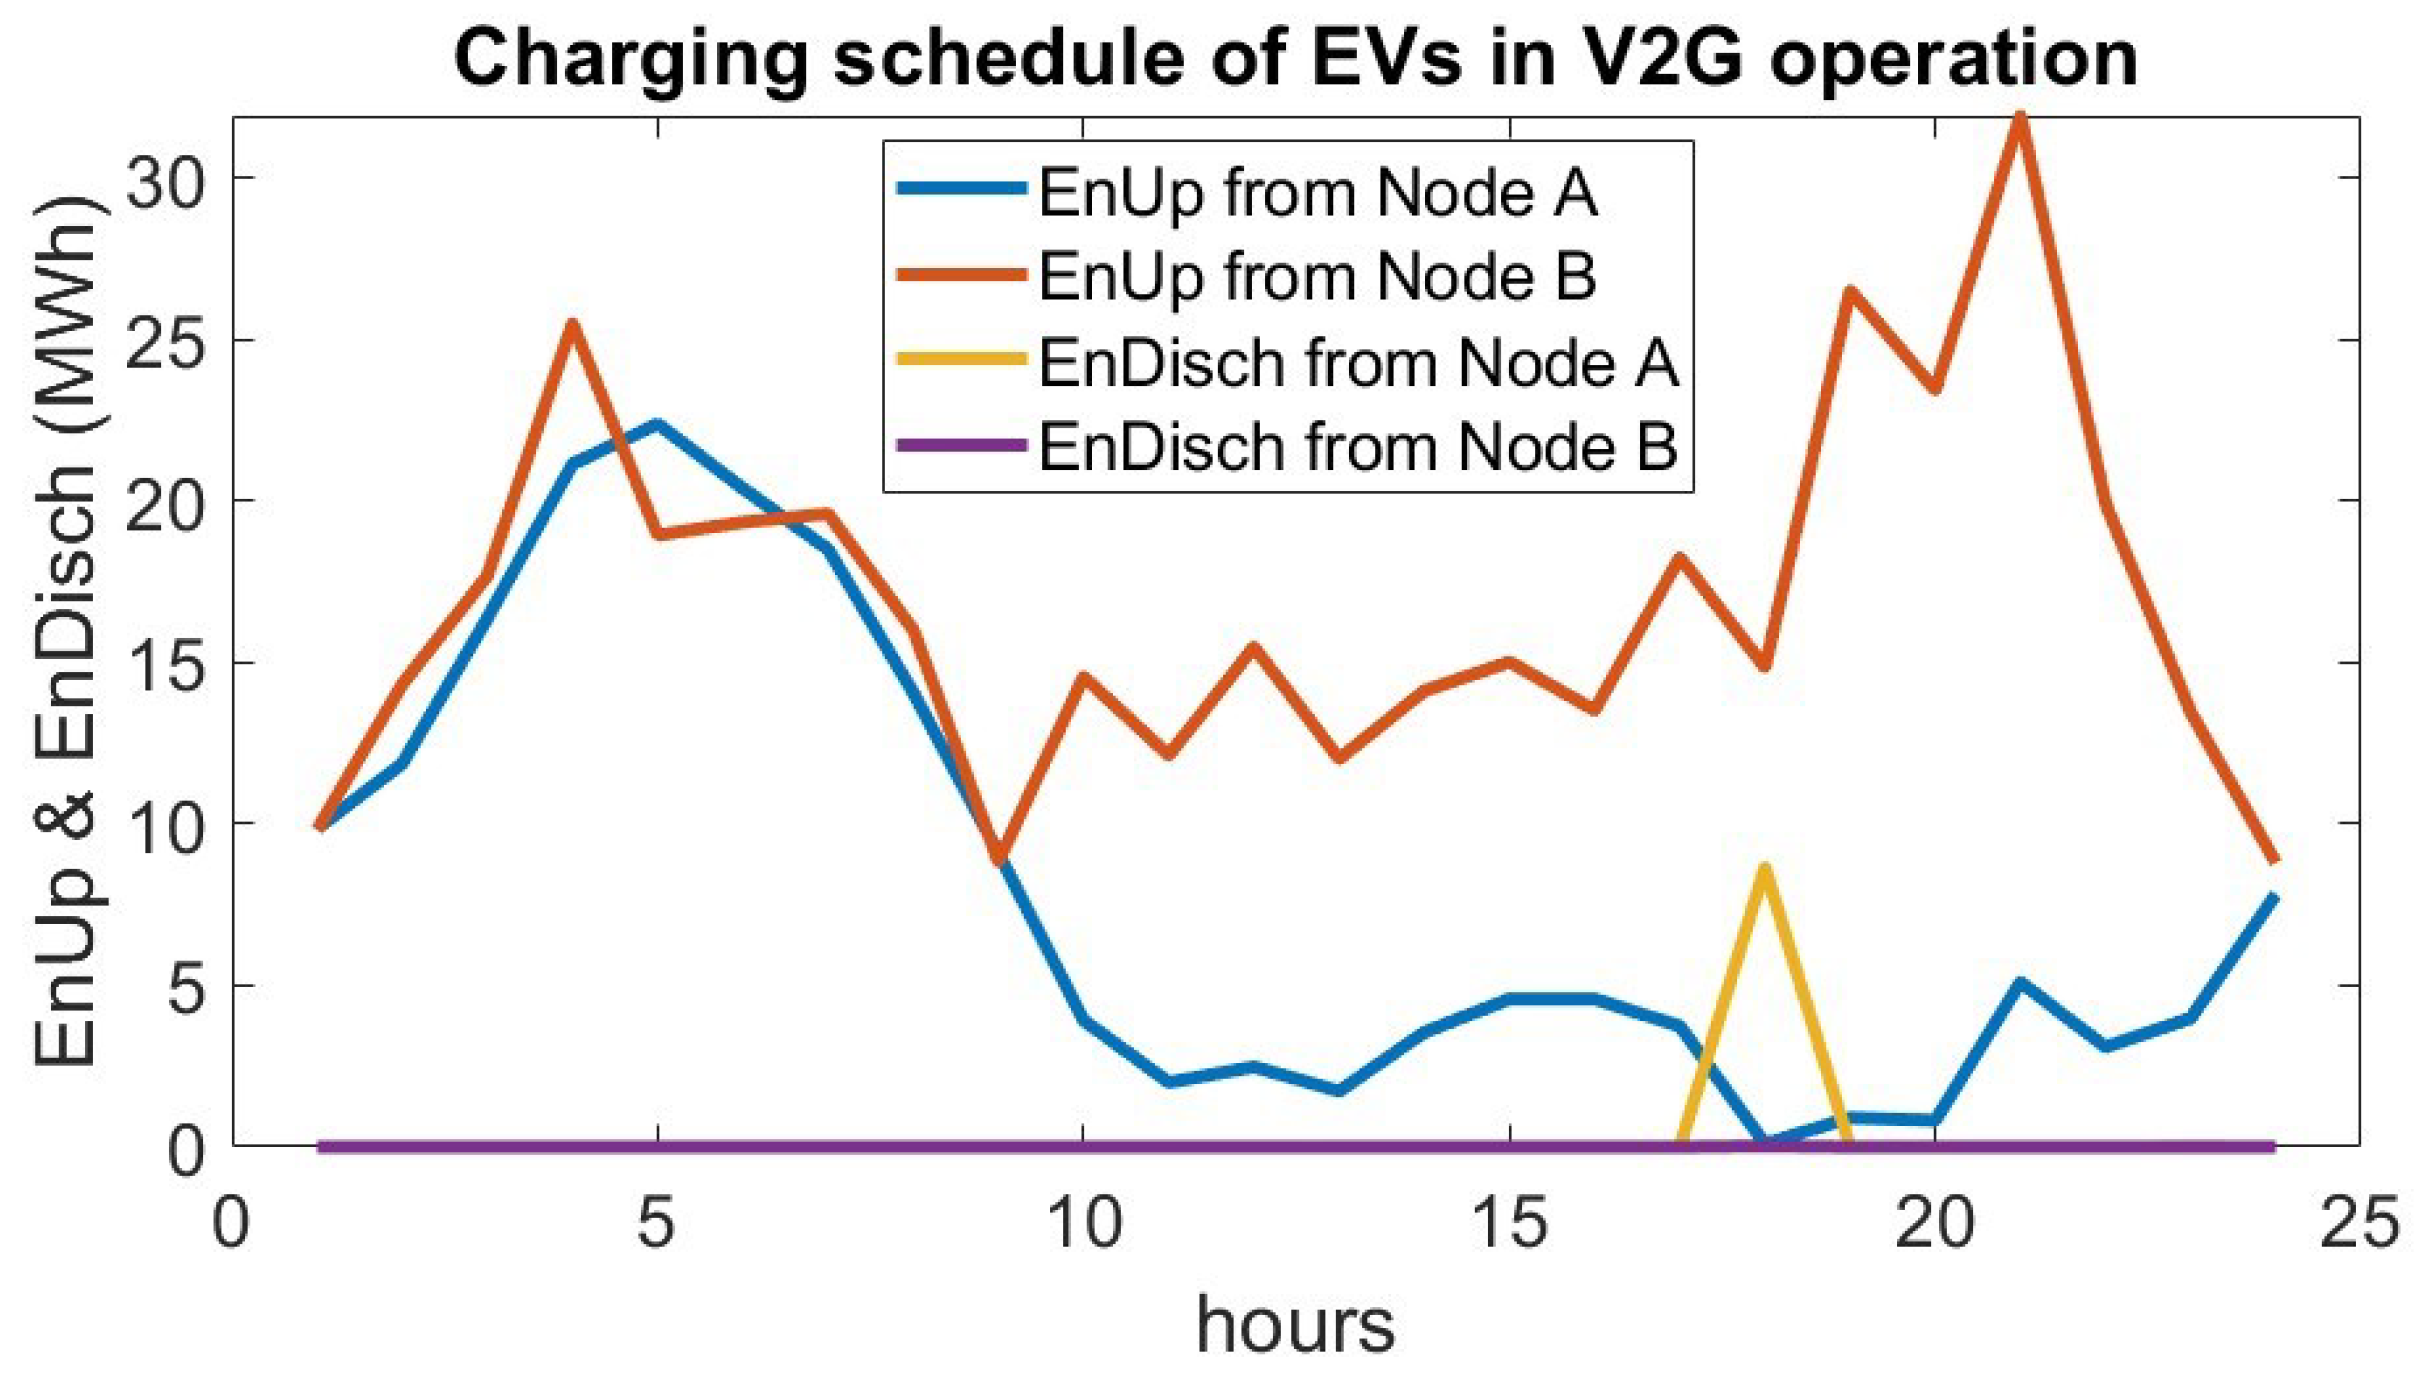
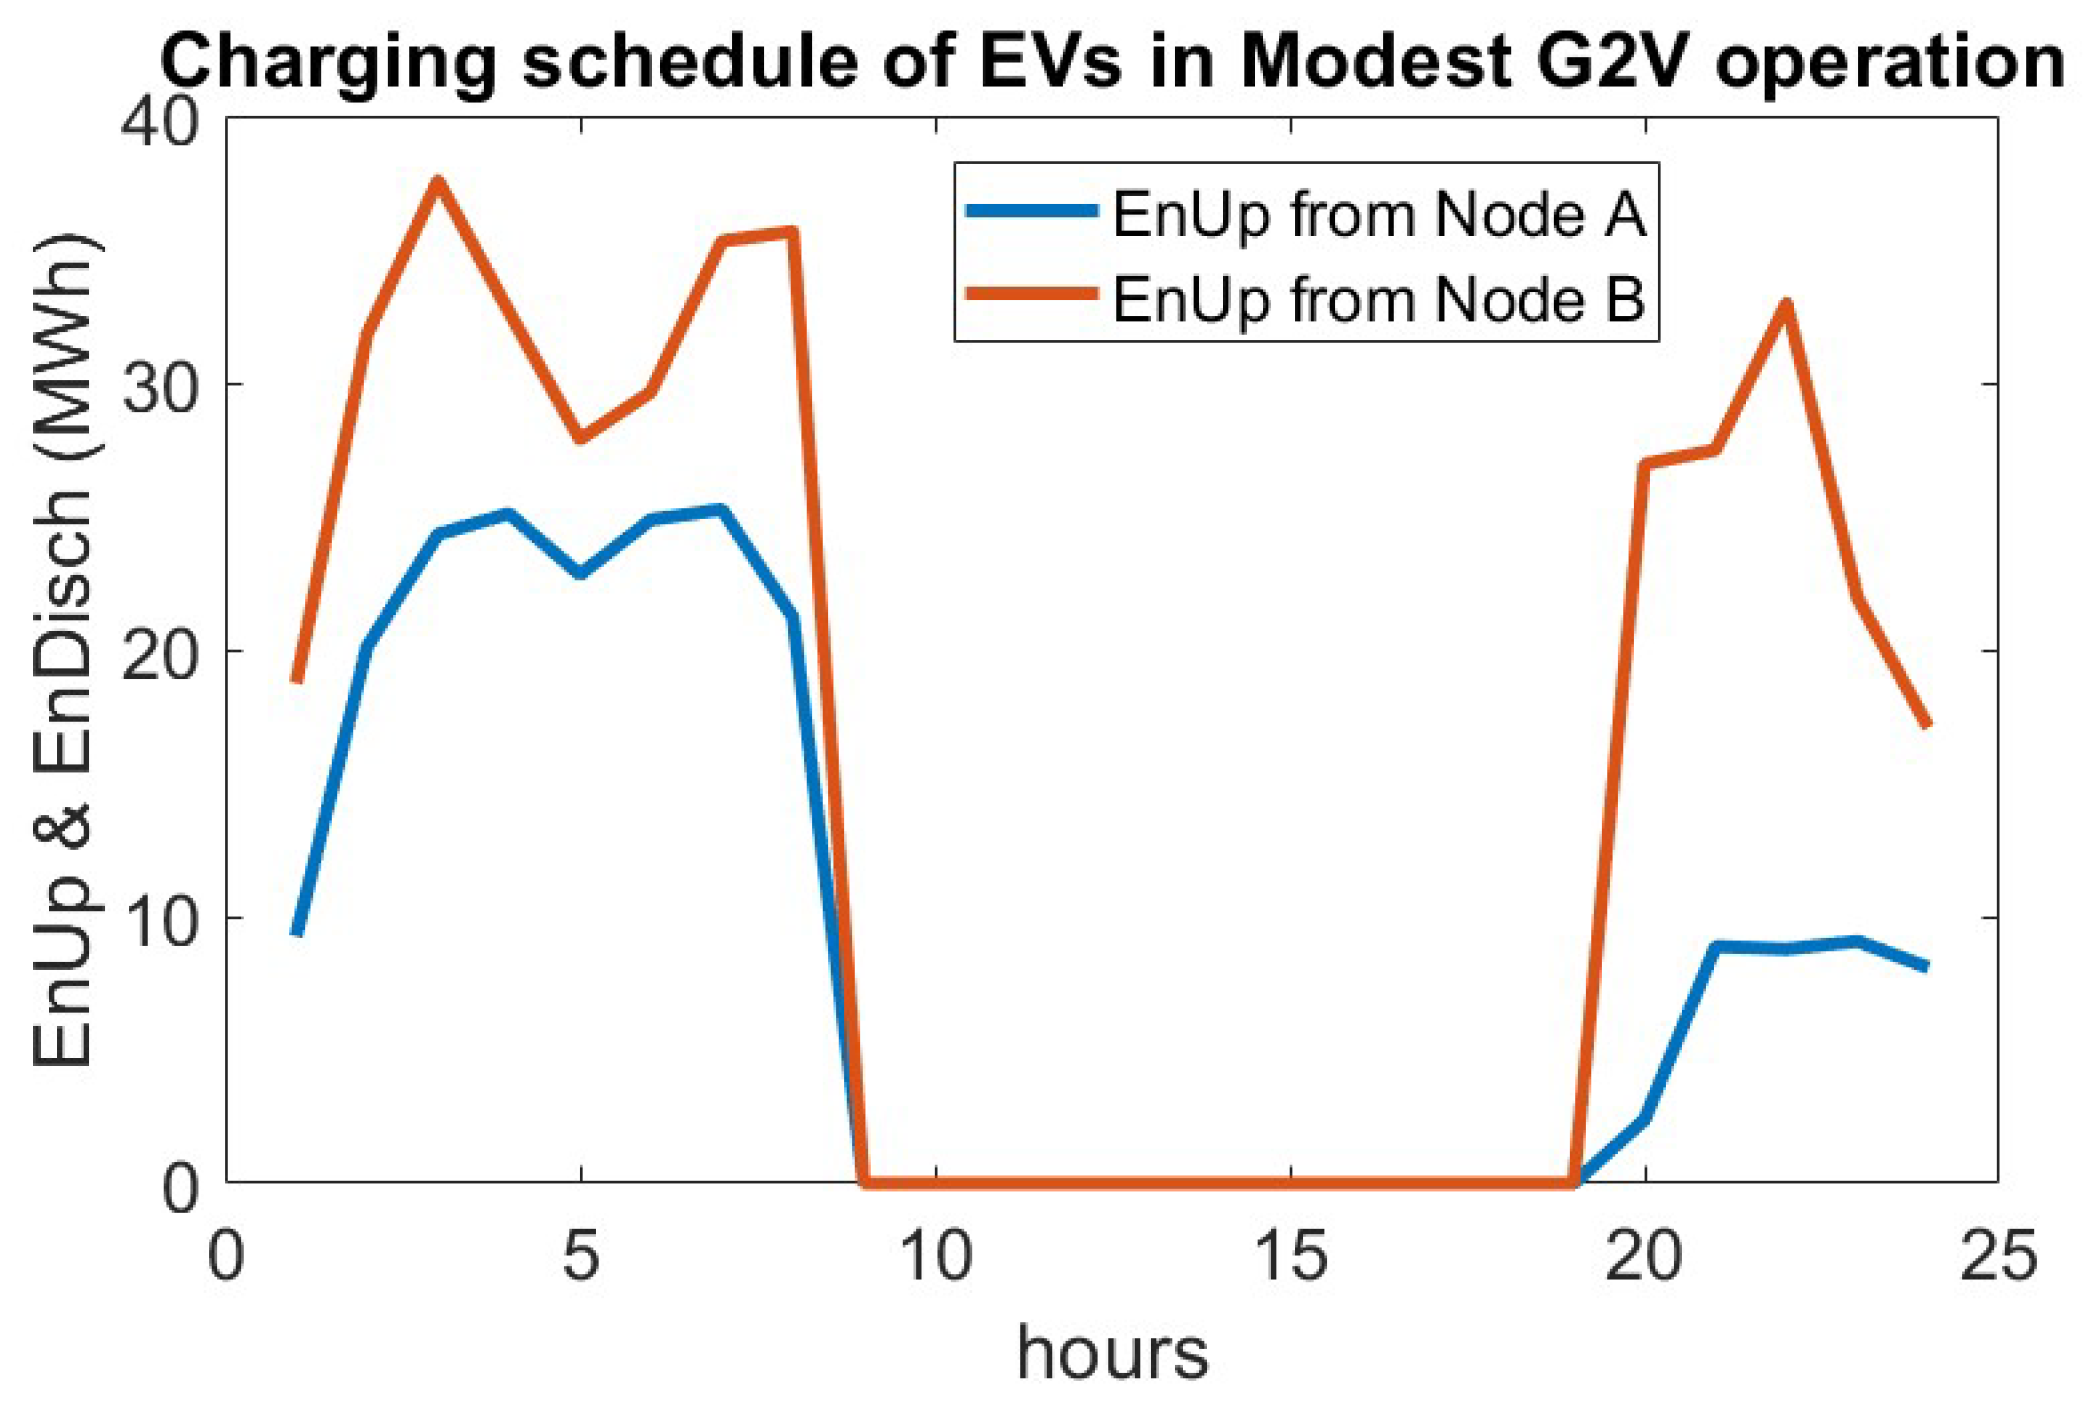
Despite maintaining a higher number of active generators, the generation schedule associated with the V2G formulation achieves a lower operational cost compared with the G2V configuration. The charging schedule of the V2G operation is presented in Figure 8. As observed at hour 18, charging and discharging cannot occur simultaneously at the same Node, and no power was extracted from EVs in Node B.
During the solution process of the 16-unit system under G2V operation (excluding V2G operation) using the DE-based algorithm, the activation of two additional generators for most hours produced a solution nearly identical to that achieved by the MILP algorithm. Notably, the DE-based algorithm bypassed one of the primary priority list generators for the entire time horizon, opting instead to activate generators further down the original priority list sequence. Unlike in the three-unit system, V2G operation was insufficient to counteract this bypass. This outcome is likely due to the larger scale of the system, which reduces the impact of EV discharge power on the scheduling process. Thus, the V2G power in the larger systems was close to zero MWh as showcased in Table 11. The relative difference between the MILP algorithm and the proposed computational method is unavailable (NA in Table 11) due to the absence of MILP results, attributed to significant model nonlinearities.
The results of the 16- and 54-unit power systems show that the system opts not to utilize power from EVs to meet the demand. This happens due to the degradation cost of the EVs’ batteries. More specifically:
The degradation cost of EV batteries in this study ranged from USD 33 to USD 110 per MWh, while the average production cost of the test case systems was below USD 19 per MWh. This significant cost gap, combined with the requirement to recharge the discharged energy within the same 24 h period, increases the overall system load and makes power from EVs less economical.
Although V2G operation can potentially help reduce extreme demand peaks, the coordinated charging of EVs already contributes to a flattened demand profile, often outperforming the benefits of V2G power injections. Under coordinated charging, the average power production cost was calculated at USD 9.87 per MWh for the 16-unit system and USD 14.02 per MWh for the 52-unit system, making EV discharging economically uncompetitive in these cases.
In contrast, in the 3-unit system, EV power injections led to a reduction in total production cost, primarily due to relief in power flow constraints. This was achieved through Generator 2 remaining online for two consecutive hours (avoiding shutdown and startup costs), reduced output from the most expensive generator, and the elimination of Generator 2’s startup events. These factors were sufficient to offset the additional battery degradation cost. In summary, V2G can provide economic benefit by eliminating start-up costs, and increased penetration could be achieved mainly by significantly reducing battery costs and by adding economic constraints via RES curtailment costs and emissions penalties.

4.5. Convergence of Proposed General Computational Model

The proposed heuristic repair mechanisms result in an algorithm with rapid convergence. Notably, the experimental results in Table 13 demonstrate that the general computational model converges quickly, yielding a feasible solution in most cases within 150 generations. The reduction in the objective function value from the initial random vector to the first feasible solution reaches up to 45%. Moreover, the first feasible solution is, in most cases, within 1.5% of the near-optimal solution.
In scenarios with stable demand, where no flexible demand from EVs is present, the general computational model exhibits exceptionally fast convergence, achieving a feasible solution in under 100 generations. Furthermore, the algorithm scales effectively with increasing system size. As shown in Table 7, Table 9 and Table 11, the standard deviation of the solutions remains below 1% of the mean value, indicating that the results are highly consistent and tightly clustered.
In Table 13, information about the operation of the general computational model is presented for all three systems and the three main operations (no EVs, G2V, and V2G) described in this work. When a meta-heuristic algorithm initiates its operation, a random vector is created, which is named the initial vector. The initial vector contains a cost and a degree of violation that are presented in this Table in the first two rows. For the 3-unit system, in the operation without EVs, the cost of the initial vector exceeds 5k in violation. The initial cost exceeds 143k in USD. The general computational model operates by proceeding through multiple generations. For the 3-unit system operating without EVs, a feasible solution, defined as one that satisfies all constraints, is found after seven generations, as shown in the corresponding Table. The cost for that first viable generation is USD 81.440 k, as shown in the following row. The relative difference (RD) between the initial vector and the first feasible solution is presented in the following row of the Table. The cost decreases by more than 43%, and the violation is entirely eliminated (100% reduction), marking a substantial improvement within only seven generations. Following the RD of the cost between the initial vector and the first feasible solution, the RD between the feasible solution and the lowest value recorded in the experiments is presented in the following row. This is a comparison between the lowest feasible solution presented in Table 13 and of the min value presented in Table 7. Finally, the chosen number of particles that process every generation is presented. All systems and operations use the same number of test cases. In Table 14, the total number of constraints is presented.

4.6. PPCV Control Variable Effect on General Computational System’s Operation and Convergence

In this section, a sensitivity analysis is conducted to depict the effect of the PPCV control variable and its upper value, EPV, on the operation of the general computational model. This variable controls the highest amount of reserve that can be considered as minimum reserve for the purposes of controlling the behavior of two heuristic mechanisms. The selected EPV value has a significant impact on the results. When it exceeds a certain threshold, the general computational model is able to optimize the problem without any issues.
In the case of the 3-unit system, for EPV values less than 0.8, the algorithm consistently fails to converge to a violation-free solution. This is evident in the violation diagram, as seen in Figure 9, where the blue and red lines never reach zero, and in the cost diagram, where the cost continuously increases as the DE mechanisms search unsuccessfully for a feasible solution. The selected EPV value of 0.8 demonstrates convergence behavior similar to that of higher values in terms of violations, while achieving faster cost reduction, as shown by the yellow lines in the cost diagram. Therefore, an EPV of 0.8 was chosen.
For the 16-unit system, which exhibits behavior very similar to the 54-unit system, an EPV value of 1 was selected. EPV values below 0.4 resulted in solutions with persistent constraint violations, as indicated by the blue line of the violation figure in Figure 10, while values between 0.4 and 1 led to suboptimal solutions, as shown by the yellow and red lines. EPV values of 1 and above produced the best results. The cost and violation values of the first generation for both systems were removed, as they were excessively high and disrupted the visual quality of the graphs.

4.7. V2G Traveling Schedule with Stochastic Inputs

This subsection presents the analysis of V2G operation under stochastic inputs. The optimization schedules that were produced in previous sub-sections were based on simulated patterns as described in Appendix A. These travel patterns are based on the daily routines of workers in a large urban environment, where vehicle movements are driven by departure times from home to work, and subsequently from work either to commercial areas or back home. However, it is also important to evaluate the algorithm’s performance under conditions of increased uncertainty. To simulate this uncertainty, a Monte Carlo analysis was conducted, treating departure time, energy consumption, and travel duration as stochastic EV inputs. The following stochastic inputs were considered: The departure times from home to work initiated at 07:00 and followed the Weibull distribution as described in [58] with scale parameter of 1 and shape parameter of 1.2. Same with the departure times from the commercial area. As far as the trip duration is concerned, it follows a normal distribution with a mean travel duration of 45 min (as was determined from the calculations in Appendix A) and a standard deviation of 15 min. Finally, the consumed energy during the trip also follows a normal distribution with a mean of 3kWh and with a standard deviation of 2kWh per trip. The results are presented in Table 15.
The power production cost of the system has increased noticeably, as the stochastic inputs led to higher energy consumption from EVs and reduced their availability during certain hours. Still, the results show only small deviations, mainly for two reasons. First, the optimization inherently shifts charging to hours when EVs are available, which leads to similar outcomes. Second, the large number of EVs being aggregated reduces the impact of variations in individual input data.

4.8. Modest Infrastructure and Delayed Charging

In the transition to EV fleets, it is likely that charging infrastructure will not be available at all of the destinations visited by EV owners. As a result, EVs may be forced to delay charging until they return to their home location. To reflect this limitation, a test case was created in which EVs are only allowed to charge when they are present at their home destination. This operation is formulated by setting the EnCh variable (the charging of the EVs) equal to zero in hours 08:00 to 19:00. This mode of charging is referenced as modest infrastructure [26,27] in contrast to the formulation that allows for charging within the entire 24 h system, which is referenced as perfect infrastructure. The results of the Perfect infrastructure are presented in Table 9. The results for the modest infrastructure are presented in Table 16. The charging schedule is presented in Figure 11. In the 3-unit system, the results are worse than those of Table 9, as anticipated due to increased load density. On the contrary, in the 16-unit and 54-unit systems, the results are almost the same. The explanation for this phenomenon lies in computational reasons rather than in the physical state itself. More specifically, since the final FES number was imposed to be the same in both cases (Perfect and Modest infrastructure), in the first case (G2V-Perfect infrastructure) the model was struggling to obtain the optimal state whilst in the second case (Modest infrastructure) it was much easier computationally for the model to achieve optimal state since the charging in a lot of hours was imposed to be zero.

4.9. Stochastic Heterogeneous Charging

The homogeneity in the formulation is represented by the coefficients in Table 5. These coefficients (nt1 to nt16) capture the movement of EVs between the two grid nodes that model the urban environment in which EVs charge and travel (see Figure 2). Each transfer coefficient is calculated by dividing the number of trips per hour by the number of EVs present at the departure node prior to the trip, specifically, one hour before for trips lasting less than one hour, and two hours before for trips lasting between one and two hours. Thus, each nt coefficient represents the proportion of EVs departing from a node and quantifies the corresponding transfer of power capacity between nodes.
To account for potential heterogeneity in EV load transfer between the two nodes, the transfer coefficient nt can be modeled as a stochastic variable. This variable follows a normal distribution with a mean defined by Equation (54) and a standard deviation from Equation (55), where Capfull represents the full battery capacity of the traveling EVs and Cap25p denotes the battery capacity at 25% charge for the same vehicles. This adjustment results in a power capacity transfer from Node A to Node B that is no longer strictly proportional to the EV population.
Despite this variation, other parameters, such as the maximum battery capacity of EVs remaining at the node and the maximum allowable power transfer (maximum allowable charging), remain unchanged. This introduces pressure on the optimized charging schedule. The impact of this heterogeneity is evident in the results obtained for the three power systems analyzed (Table 17), compared with the results under homogeneous G2V operation (Table 8). Under heterogeneous conditions, the total system cost increases by 0.5% due to the above-mentioned reasons.
m e a n = ( C a p f u l l + C a p 25 p ) / 2
s t d = ( C a p f u l l C a p 25 p ) / 6

5. Conclusions

The method presented in this research analyzes an approach for enhancing TCUCP through the integration of novel heuristics, a novel EV modeling, and V2G mechanisms.
This work developed an encompassing set of heuristics that consolidate commonly used heuristic repair mechanisms in the UCP, adapting them effectively for resolving the TCUCP with EVs. It is demonstrated that multiple heuristics may interfere with the seamless transition from UCP to TCUCP, severely impacting convergence. The analysis of the proposed repair mechanisms and their results, particularly the sensitivity analysis on the EVP (the upper limit of the PPCV variable), demonstrates that when the EVP approaches zero, no system is capable of converging to a violation-free solution. This confirms that heuristics commonly found in the literature, originally designed to solve the simpler Unit Commitment Problem (UCP), are insufficient to handle power flow constraints, underscoring the necessity of the proposed modifications.
Furthermore, two heuristic repair mechanisms for addressing transmission line violations were introduced. The proposed general computational model was tested in three distinct power systems (small, medium, and large-scale), confirming the flexibility of the new heuristics across varying scales, thus justifying the effort to construct a computational model that would not be case-specific. Finally, a third repair mechanism was suggested that repairs the EV constraint equations. The general computational algorithm demonstrates notably fast convergence, particularly in medium- and large-scale power systems, with the first feasible solution typically found within 150 generations as presented in Table 13. In addition, the general computational model reduces the objective function value by a large margin, of up to 40%, during the generations it takes for the proposed model to reach a feasible solution.
To evaluate the performance of the proposed general computational model, the corresponding mathematical formulation was also solved using an MILP algorithm. This comparison was feasible only for the linear cases, specifically, the scenario without EVs and the novel TCUCP formulation with EVs under G2V operation in the two-node system. The results from the general computational model closely matched those of the MILP algorithm, with relative differences close to 1% and in many cases under 1%.
This comparison is particularly important because MILP optimization methods are deterministic methods that solve mixed-integer problems through linear programming techniques and systematic procedures such as branch-and-bound, which can guarantee the global optimum. In contrast, DE is a stochastic, population-based meta-heuristic that operates in continuous space. Due to its reliance on randomness and heuristic search, DE cannot guarantee the exact global optimum but typically converges to high-quality, near-optimal solutions. Achieving results within 1% of the MILP benchmark demonstrates the ability of the DE-based method to deliver solutions very close to the global optimum, validating its effectiveness for complex, nonlinear cases.
In the case of the TCUCP with V2G operation, the formulation becomes nonlinear, making it incompatible with MILP-based solvers and therefore not suitable for direct comparison. However, comparing the results of G2V and V2G operation revealed that, in the 3-unit system, a slight discharge of EV batteries led to a lower-cost solution, approximately 1.7% less, by keeping a generator online and preventing a shutdown, as shown in Table 8 and Table 12. Nevertheless, in scenarios where generator startup costs were excluded, EV discharging proved less competitive than conventional generator power.
The optimization results of the TCUCP with G2V operation demonstrated that the EV load was distributed more evenly across the 24 h period, leading to optimized solutions that satisfied all constraints without violations. The experimental results in Section 4.3, illustrated in Figure 6, show that vehicles traveling between nodes charge nearly 50% of their energy at the destination node (rather than the origin node). This is a significant finding for aggregation strategies and should be carefully considered in both aggregator business models and the planning of EV chargers’ location (e.g., workplace, commercial places, etc.). More specifically, in the G2V case with modest infrastructure, the absence of chargers at travel destinations in the 3-unit system led to a 1.19% increase in system cost. Finally, the algorithm’s performance under stochastic inputs was evaluated. Specifically, travel duration, departure time, and energy consumption were modeled as stochastic variables, along with increased heterogeneity in the state of charge (SoC) among EVs. While the introduction of uncertainty led to a rise in overall system costs, ranging from 0.5% to 1.6%, the algorithm consistently generated optimized charging schedules that effectively minimized production costs despite the variability of inputs.
The problem that was solved is a fairly complicated problem with a large number of constraints. The MILP formulation contains 2911 constraints in the 3-unit-6-bus system, 13,436 constraints in the 16-unit-31-bus system, and 43,594 constraints in the 54-unit-118-bus system. These systems contain only thermal generators. Most test cases are solved with both MILP and DE algorithm, reaching solutions without violating any constraints while 100% satisfying the hourly demand.
The statistical analysis of the results for the three scenarios, of no EVs (Table 6), G2V operation (Table 9), and V2G operation (Table 11), showed very small dispersion, typically under 0.5%, proving the robustness of the algorithm.
Concerning the applicability of the model: The EV formulation developed in this work has shown potential for urban environments applicable in varying-sized systems. This formulation incorporates EV travel patterns, allowing for more precise generator scheduling. This approach also provides an improved perspective on battery state-of-charge distribution beyond simple node-based aggregation, offering valuable insights for EV aggregators when managing EV discharge availability and other discharging services across different energy markets. The results of this model can also provide a more secure and comprehensive guide for EV aggregators when scheduling the day-ahead charging and discharging of the EVs.
It is true that the DC power flow model has inherent limitations compared with the full AC power flow formulation. Specifically, it neglects voltage magnitude variations, reactive power flows, and transmission losses. In networks with significant voltage deviations or a high X/R ratio, these simplifications can result in non-negligible deviations between DC power flow and AC power flow solutions. Therefore, for improved accuracy, either an AC power flow analysis should accompany economic evaluations such as this, or the DC power flow model should be applied only to networks where its underlying assumptions are reasonably satisfied [59].
Future work includes two important aspects of the problem: One of the most important aspects of integrating EVs into national fleets, and replacing internal combustion engine (ICE) vehicles with fully electric, hydrogen, or biofuel-powered alternatives, is the reduction in CO 2 emissions. In this work, the test cases considered only thermal generation units. The proposed model estimates a net increase of approximately 6,000 tons of CO 2 emissions when transitioning from uncoordinated to coordinated EV charging. This increase is partially offset by an estimated 1,400 tons of CO 2 emissions avoided through the replacement of conventional vehicles with electric ones. However, it is important to note that the present work does not assess environmental impacts, as the IEEE test systems employed consist exclusively of conventional thermal power plants and do not incorporate Renewable Energy Sources (RES). In a real-world scenario, where EV charging would be powered by RES, the associated emissions would be significantly lower. If charging is predominantly sourced from renewable generation, as envisioned in modern grid planning, CO 2 emissions could even approach zero. Furthermore, integrating RES into such models would allow surplus renewable generation (i.e., production exceeding local demand) to be effectively used for EV charging. This would not only minimize renewable curtailment but also enhance grid flexibility, system efficiency, and overall sustainability. However, given the high complexity of modeling such interactions, a dedicated investigation is needed and is therefore identified as a promising direction for future research.
Another key aspect of the general computational model is the aggregation of EVs into a small number of decision variables. However, this aggregation could potentially lead to an overestimation of the state of charge across the fleet. For this reason, future work should incorporate a de-aggregation step, where the energy provided by the system is distributed more precisely to smaller EV groups, improving the accuracy of the charging representation.

Author Contributions

Conceptualization, D.S. and A.I.T.; Methodology, D.S.; Software, D.S.; Writing—original draft, D.S.; Writing—review & editing, A.I.T.; Supervision, A.I.T. All authors have read and agreed to the published version of the manuscript.

Funding

This research received no external funding.

Data Availability Statement

Data is contained within the article.

Conflicts of Interest

The authors declare no conflicts of interest.

Appendix A

The number of trips generated within this model is based on the model proposed by [60]. In their work, the authors created a mathematical formulation for estimating the availability of EVs in an urban environment where EVs were utilized as an energy reserve. The map that was utilized in their work was also applied in the estimation of consumed energy of EVs in this work, thus leading to the classification of EVs in the following three categories:
  • Home–Work–Home (HWH).
  • Home–Commercial Area–Home (HCH).
  • Home–Work–Commercial Area–Home (HWCH).
After defining the borders of all areas, the centroid of each area is calculated using the corresponding MATLAB function. The coordinates of each centroid, as shown in Table A1, are used to compute the distances between each area. The travel combinations are 20 for the Home–Work group, 12 for the Home-Commercial group, and 60 for the Home–Work-Commercial–Home group. Distances for the Home–Work–Commercial-Home group include calculations from both the HWH and HCH categories, as well as Commercial–Work distances.
For the HWH and HCH categories, two distinct trips are defined: leaving home and returning home, assumed to be of equal length. In HWCH, three trip types are defined: “leave home for work”, “leave work for commercial area”, and “return home”, each distinct from the initial departure from home. Trip durations are calculated for each category. Across all categories, trip durations are under 2 h, though some categories exceed 1 h. For trips under 1 h, the EV is considered offline for the full hour starting from the trip’s initiation hour. Starting from the hour after reaching their destination, EVs are considered online and available for charging or discharging. Trips exceeding 1 h result in the vehicle being offline for a full 2 h.
Table A1. Coordinates of all travel areas.
Locationx-axisy-axisLocationx-axisy-axis
11.22.3180.52
2−1.31.519−0.71
3−1.5220−30.1
41.5−1.5212−1
51.52220.80.5
6−1.8123−11.5
7−1.6−1.324−2.30.2
82−2251.5−0.5
91.52.1261.71.7
10−1.4227−2.31
11−2−1.528−2.4−0.6
121.8−2.2291.3−2
132.21301.72
14−2.51.131−1.20.8
15−1.71.832−2.5−0.3
16−1.8−2330.20.5
172.2−0.8
Classification of areas:
  • Home area 1 (H1) = [1 18 17 8 9]
  • Home area 2 (H2) = [25 26 28]
  • Home area 3 (H3) = [10 11 12 13 14 15]
  • Home area 4 (H4) = [20 21 23 27 13]
  • Work area 1 (W1) = [18 17 19 21 23 22]
  • Work area 2 (W2) = [26 27 28 29]
  • Work area 3 (W3) = [9 14 15 16]
  • Work area 4 (W4) = [3 5 8]
  • Work area 5 (W5) = [24 25 26]
  • Commercial area 1 (C1) = [22 23 27 26 24]
  • Commercial area 2 (C2) = [5 6 7 8]
  • Commercial area 3 (C3) = [13 14 16 20]
The next step in the test case creation is the calculation of the number of available EVs at each location. It is assumed that when an EV is not traveling, it is available for charging and discharging. Over the studied 24 h period, the following travel schedule is established:
EVs begin leaving home at 06:00. A curve fitting method (Equation (A1)) is used to estimate the number of EVs. At hour k, the number of trips generated from home location H is calculated using Equation (A2), where H is the home area where the trip originates, N is the total number of vehicles in area H, rr is the retention rate of EVs in the area, and X(k) is the trip generation function.
The number of trips from a home area to a work area is estimated using Equation (A3), where rr is the trip–chain ratio of EVs in the travel category (Table A2), and r r H W represents the ratio of trips from area H to W. The same logic applies to Equations (A4) and (A5). For additional details, readers are referred to [60].
Departure time from work is assumed to be at 18:00. The arrival time at work corresponds to the departure time from home, shifted by the trip duration plus one hour. For the HWCH category, the arrival time at commercial areas from work is calculated by shifting the work departure time by the duration of the trip from work to the commercial area, plus one hour.
The departure time from commercial areas for the same category is determined by assuming that EV owners stay in the commercial area for one hour after their arrival, departing the following hour. They then return home. In the HCH category, travel from commercial areas back home begins at 21:00. EVs in the HCH category depart from home towards commercial areas at 09:00 and begin their return journey at 21:00. The final step involves using this travel time information to map EV availability in each area. Each area, home, commercial, or work, is considered a distinct location where EVs may be present and available.
X ( k ) = 1 0.54 · e x p ( ( k 15.07 5.84 ) 2 ) 0.24 · e x p ( ( k 9.68 2.46 ) 2 )
T g H ( k ) = r r · N H · X ( k )
T H W ( k ) = r r 1 · r r H W · T g H ( k )
T H C ( k ) = r r 2 · r r H C · T g H ( k )
T H W C ( k ) = r r 3 · r r H W C · r r H W · T g H ( k )
Table A2. EV trip–chain ratio.
Trip–Chain Ratio
HWH ratio0.45
HCH ratio0.38
HWCH ratio0.17
All areas are assigned to one of the two categories that correspond to the network bus that supplies power to that particular area. The areas belong to one of the two Nodes as described by Table A3. These areas collectively form the three trip types outlined earlier. Every single combination of categories was characterized according to the arrival at each node during their daily trips. For instance, in the category HWH, there are four trip types. The first trip type contains the trips that originated in a Home area from Node A and traveled to a Work area belonging to the same Node. In the second type belong the trips that originated in a Home area in Node A and traveled to a Work area that belongs to Node B. In the third category belong all EVs that began their travel in a Home area belonging to Node B and traveled to a Work area in Node A. In the fourth category belong the vehicles that originated their travel at a Home area that is connected to Node B and travel to a Work area that is connected to Node B. For each of those trip types, there is a number of matrices that contain information regarding the initiation of a trip and the arrival time from the beginning until the end of the day, including every intermediate stop.
Table A3. Grid Node and Area connection.
AreaNode
Home 2Node 1
Home 4Node 1
Work 1Node 1
Work 2Node 1
Work 5Node 1
Commercial 1Node 1
Home 1Node 2
Home 3Node 2
Work 3Node 2
Work 4Node 2
Commercial 2Node 2
Commercial 3Node 2
According to Table A4, there are 16 travel categories for the HWCH category. However, from these combinations, all those that have a different Node at the home are invalid since the EVs must have the same final destination as their starting point. This reduces the number of combinations by half. Out of these 8 combinations, one of them has all its EVs travel throughout the day only within Node A, and another one only throughout Node B. Thus, the remaining 6 combinations contain EVs that travel to both Nodes throughout the day. Considering the number of home, work, and commercial areas, for this test case, there is a total of 60 different journey routes for the HWCH category. The HWH and HCH contain a total of four travel types, two for same-Node travel and two for different-Node travel. The total combination of journey routes for the given test case is 20 for HWH and 12 for the HCH category.
The new variables for every category are thus six in total and may contain any journey route from the HWH, HCH, and HWCH categories:
  • A variable that contains the number of all EVs that are connected in Node A and perform trips only within Node A during the 24 h day ahead.
  • A variable that contains the number of all EVs that are connected in Node A and have all EVs initiate their traveling schedule at Node A and travel within the day to Node B.
  • A variable that contains the number of all EVs that are connected in Node B and have all EVs initiate their traveling schedule at Node A and travel within the day to Node B.
  • A variable that contains the number of all EVs that are connected in Node B and have all EVs initiate their traveling schedule at Node B and travel within the day to Node A.
  • A variable that contains the number of all EVs that are connected in Node A and have all EVs initiate their traveling schedule at Node B and travel within the day to Node A.
  • A variable that contains the number of all EVs that are connected in Node b and perform trips only within Node b during the 24 h day ahead.
After all EVs at each variable have been added, the Multiplier nt of Table 5 is calculated. These multipliers are derived by calculating the percentages of the number of EVs that leave a Node and then are added to the destination Node.
Table A4. HWCH Node travel combination.
HomeWorkCommercialHome
11111
21112
31121
41122
51211
61212
71221
81222
92111
102112
112121
122122
132211
142212
152221
162222

Appendix B

In this section, the power demand of the chosen test cases is presented.
Table A5. Daily demand of the 3-unit system.
HourDemand (MWh)HourDemand (MWh)HourDemand (MWh)
1221.19226.717257.9
220410249.418283.4
3192.711255.119272.1
418712257.920269.2
5181.413255.121266.4
6184.214249.422260.7
718715246.623246.6
8198.416246.624229.6
Table A6. Daily demand of the 16-unit system.
HourDemand (MWh)HourDemand (MWh)HourDemand (MWh)
1250296957176652
22441107690187812
32197118056198056
42075128300207079
52502137995215188
63418147201224028
74809156591233174
85859166225242807
Table A7. Daily demand of the 54-unit system.
HourDemand (MWh)HourDemand (MWh)HourDemand (MWh)
13313.7394224.59174452.31
23010.11104679.96184755.84
32402.87114755.84195135.37
41036.59124376.32205439.01
51795.64134072.78215590.81
62554.68143769.14224831.83
73313.73154679.96234604.07
83920.97164831.83244224.55

References

  1. Dharmakeerthi, C.; Mithulananthan, N.; Saha, T.K. Overview of the impacts of plug-in electric vehicles on the power grid. In Proceedings of the 2011 IEEE PES Innovative Smart Grid Technologies, Perth, WA, Australia, 13–16 November 2011; pp. 1–8. [Google Scholar]
  2. Hussain, M.T.; Sulaiman, N.B.; Hussain, M.S.; Jabir, M. Optimal Management strategies to solve issues of grid having Electric Vehicles (EV): A review. J. Energy Storage 2021, 33, 102114. [Google Scholar] [CrossRef]
  3. Mahmud, K.; Town, G.E.; Morsalin, S.; Hossain, M. Integration of electric vehicles and management in the internet of energy. Renew. Sustain. Energy Rev. 2018, 82, 4179–4203. [Google Scholar] [CrossRef]
  4. Allwyn, R.G.; Al-Hinai, A.; Margaret, V. A comprehensive review on energy management strategy of microgrids. Energy Rep. 2023, 9, 5565–5591. [Google Scholar] [CrossRef]
  5. Rahmani, M.; Hosseinian, S.H.; Abedi, M. Optimal integration of Demand Response Programs and electric vehicles into the SCUC. Sustain. Energy Grids Netw. 2021, 26, 100414. [Google Scholar] [CrossRef]
  6. Zhang, K.; Xu, L.; Ouyang, M.; Wang, H.; Lu, L.; Li, J.; Li, Z. Optimal decentralized valley-filling charging strategy for electric vehicles. Energy Convers. Manag. 2014, 78, 537–550. [Google Scholar] [CrossRef]
  7. Barnabé, G.P.; Tofoli, F.L.; Mello, L.S.; Sampaio, R.F.; Antunes, F.L.M.; Leão, R.P.S. Non-intrusive demand response management strategy to mitigate the impacts of residential electric vehicle charging on distribution systems. Electr. Power Syst. Res. 2024, 235, 110849. [Google Scholar] [CrossRef]
  8. Samadi, M.; Fattahi, J. Effective self-committed V2G for residential complexes. Sustain. Energy Grids Netw. 2023, 35, 101114. [Google Scholar] [CrossRef]
  9. Saadatmandi, S.; Chicco, G.; Favenza, A.; Mozzato, A.; Giordano, F.; Arnone, M. Smart electric vehicle charging for reducing photovoltaic energy curtailment. Electr. Power Syst. Res. 2024, 230, 110181. [Google Scholar] [CrossRef]
  10. Chacko, P.J.; Sachidanandam, M. An optimized energy management system for vehicle to vehicle power transfer using micro grid charging station integrated Gridable Electric Vehicles. Sustain. Energy Grids Netw. 2021, 26, 100474. [Google Scholar] [CrossRef]
  11. Qian, M.; Wang, J.; Yang, D.; Yin, H.; Zhang, J. An optimization strategy for unit commitment in high wind power penetration power systems considering demand response and frequency stability constraints. Energies 2024, 17, 5725. [Google Scholar] [CrossRef]
  12. Meng, W.; Song, D.; Huang, L.; Chen, X.; Yang, J.; Dong, M.; Talaat, M. A Bi-level optimization strategy for electric vehicle retailers based on robust pricing and hybrid demand response. Energy 2024, 289, 129913. [Google Scholar] [CrossRef]
  13. Paudel, D.; Das, T.K. A deep reinforcement learning approach for power management of battery-assisted fast-charging EV hubs participating in day-ahead and real-time electricity markets. Energy 2023, 283, 129097. [Google Scholar] [CrossRef]
  14. Lee, W.; Koo, Y.; Kim, Y.g. Environmental time-of-use scheme: Strategic leveraging of financial and environmental incentives for greener electric vehicle charging. Energy 2024, 309, 133174. [Google Scholar] [CrossRef]
  15. Vardakas, J.S.; Zorba, N.; Verikoukis, C.V. A survey on demand response programs in smart grids: Pricing methods and optimization algorithms. IEEE Commun. Surv. Tutor. 2014, 17, 152–178. [Google Scholar] [CrossRef]
  16. Jia, C.; Liu, W.; He, H.; Chau, K.T. Superior energy management for fuel cell vehicles guided by improved DDPG algorithm: Integrating driving intention speed prediction and health-aware control. Appl. Energy 2025, 394, 126195. [Google Scholar] [CrossRef]
  17. Jia, C.; Liu, W.; He, H.; Chau, K.T. Deep reinforcement learning-based energy management strategy for fuel cell buses integrating future road information and cabin comfort control. Energy Convers. Manag. 2024, 321, 119032. [Google Scholar] [CrossRef]
  18. Kim, S.; Jeong, Y.; Nam, J.-W. Solving optimal electric vehicle charger deployment problem. Appl. Sci. 2024, 14, 5092. [Google Scholar] [CrossRef]
  19. Mehta, R.; Srinivasan, D.; Khambadkone, A.M.; Yang, J.; Trivedi, A. Smart charging strategies for optimal integration of plug-in electric vehicles within existing distribution system infrastructure. IEEE Trans. Smart Grid 2016, 9, 299–312. [Google Scholar] [CrossRef]
  20. Soares, F.J.; Almeida, P.R.; Lopes, J.P. Quasi-real-time management of electric vehicles charging. Electr. Power Syst. Res. 2014, 108, 293–303. [Google Scholar] [CrossRef]
  21. Zheng, Y.; Niu, S.; Shang, Y.; Shao, Z.; Jian, L. Integrating plug-in electric vehicles into power grids: A comprehensive review on power interaction mode, scheduling methodology and mathematical foundation. Renew. Sustain. Energy Rev. 2019, 112, 424–439. [Google Scholar] [CrossRef]
  22. Raad, N.G.; Swain, C.; Ayantayo, A.; Yang, B.; Rajendran, S. Hybrid regret-based p-robust and distributionally robust optimization models for electric vehicle charging station network design. Comput. Ind. Eng. 2024, 198, 110709. [Google Scholar] [CrossRef]
  23. Ferraz, R.S.; Ferraz, R.S.; Rueda-Medina, A.C.; Fardin, J.F. Novel variable charging pricing strategy applied to the multi-objective planning of integrated fast and slow electric vehicle charging stations and distributed energy resources. Electr. Power Syst. Res. 2025, 241, 111293. [Google Scholar] [CrossRef]
  24. Borray, A.F.C.; Merino, J.; Torres, E.; Garcés, A.; Mazón, J. Centralised coordination of EVs charging and PV active power curtailment over multiple aggregators in low voltage networks. Sustain. Energy Grids Netw. 2021, 27, 100470. [Google Scholar] [CrossRef]
  25. Ahmadi, B.; Shirazi, E. A heuristic-driven charging strategy of electric vehicle for grids with high EV penetration. Energies 2023, 16, 6959. [Google Scholar] [CrossRef]
  26. Madzharov, D.; Delarue, E.; D’haeseleer, W. Integrating electric vehicles as flexible load in unit commitment modeling. Energy 2014, 65, 285–294. [Google Scholar] [CrossRef]
  27. Semertzidis, G.; Stamatakis, D.; Tsalavoutis, V.; Tolis, A.I. Optimized electric vehicle charging integrated in the unit commitment problem. Oper. Res. 2022, 22, 5137–5204. [Google Scholar] [CrossRef]
  28. Egbue, O.; Uko, C.; Aldubaisi, A.; Santi, E. A unit commitment model for optimal vehicle-to-grid operation in a power system. Int. J. Electr. Power Energy Syst. 2022, 141, 108094. [Google Scholar] [CrossRef]
  29. Haddadian, G.; Khalili, N.; Khodayar, M.; Shahidehpour, M. Optimal scheduling of distributed battery storage for enhancing the security and the economics of electric power systems with emission constraints. Electr. Power Syst. Res. 2015, 124, 152–159. [Google Scholar] [CrossRef]
  30. Zeynali, S.; Nasiri, N.; Ravadanegh, S.N.; Kubler, S.; Le Traon, Y. Distributionally robust unit commitment in integrated multi-energy systems with coordinated electric vehicle fleets. Electr. Power Syst. Res. 2023, 225, 109832. [Google Scholar] [CrossRef]
  31. Yang, Z.; Li, K.; Guo, Y.; Feng, S.; Niu, Q.; Xue, Y.; Foley, A. A binary symmetric based hybrid meta-heuristic method for solving mixed integer unit commitment problem integrating with significant plug-in electric vehicles. Energy 2019, 170, 889–905. [Google Scholar] [CrossRef]
  32. Yang, Z.; Li, K.; Niu, Q.; Xue, Y. A comprehensive study of economic unit commitment of power systems integrating various renewable generations and plug-in electric vehicles. Energy Convers. Manag. 2017, 132, 460–481. [Google Scholar] [CrossRef]
  33. Jeong, Y.W.; Park, J.B.; Jang, S.H.; Lee, K.Y. A new quantum-inspired binary PSO: Application to unit commitment problems for power systems. IEEE Trans. Power Syst. 2010, 25, 1486–1495. [Google Scholar] [CrossRef]
  34. Li, S.; Gong, W.; Hu, C.; Yan, X.; Wang, L.; Gu, Q. Adaptive constraint differential evolution for optimal power flow. Energy 2021, 235, 121362. [Google Scholar] [CrossRef]
  35. Liang, H.; Liu, Y.; Li, F.; Shen, Y. Dynamic economic/emission dispatch including PEVs for peak shaving and valley filling. IEEE Trans. Ind. Electron. 2018, 66, 2880–2890. [Google Scholar] [CrossRef]
  36. Shamshirband, M.; Salehi, J.; Gazijahani, F.S. Look-ahead risk-averse power scheduling of heterogeneous electric vehicles aggregations enabling V2G and G2V systems based on information gap decision theory. Electr. Power Syst. Res. 2019, 173, 56–70. [Google Scholar] [CrossRef]
  37. Dokeroglu, T.; Sevinc, E.; Kucukyilmaz, T.; Cosar, A. A survey on new generation metaheuristic algorithms. Comput. Ind. Eng. 2019, 137, 106040. [Google Scholar] [CrossRef]
  38. Tsalavoutis, V.A.; Vrionis, C.G.; Tolis, A.I. Optimizing a unit commitment problem using an evolutionary algorithm and a plurality of priority lists. Oper. Res. 2021, 21, 1–54. [Google Scholar] [CrossRef]
  39. Nemati, M.; Braun, M.; Tenbohlen, S. Optimization of unit commitment and economic dispatch in microgrids based on genetic algorithm and mixed integer linear programming. Appl. energy 2018, 210, 944–963. [Google Scholar] [CrossRef]
  40. Parker, R.; Coffrin, C. Managing power balance and reserve feasibility in the AC unit commitment problem. arXiv 2024, arXiv:2404.00200. [Google Scholar] [CrossRef]
  41. Dieu, V.N.; Ongsakul, W. Augmented Lagrange Hopfield network based Lagrangian relaxation for unit commitment. Int. J. Electr. Power Energy Syst. 2011, 33, 522–530. [Google Scholar] [CrossRef]
  42. Karabaş, T.; Meral, S. An exact solution method and a genetic algorithm-based approach for the unit commitment problem in conventional power generation systems. Comput. Ind. Eng. 2023, 176, 108876. [Google Scholar] [CrossRef]
  43. Ji, B.; Yuan, X.; Chen, Z.; Tian, H. Improved gravitational search algorithm for unit commitment considering uncertainty of wind power. Energy 2014, 67, 52–62. [Google Scholar] [CrossRef]
  44. Moradi, S.; Khanmohammadi, S.; Hagh, M.T.; Mohammadi-ivatloo, B. A semi-analytical non-iterative primary approach based on priority list to solve unit commitment problem. Energy 2015, 88, 244–259. [Google Scholar] [CrossRef]
  45. de Oliveira, L.M.; da Silva Junior, I.C.; Abritta, R. A space reduction heuristic for thermal unit commitment considering ramp constraints and large-scale generation systems. Energies 2023, 16, 5370. [Google Scholar] [CrossRef]
  46. Anand, H.; Narang, N.; Dhillon, J. Profit based unit commitment using hybrid optimization technique. Energy 2018, 148, 701–715. [Google Scholar] [CrossRef]
  47. González, L.; Siavichay, E.; Espinoza, J. Impact of EV fast charging stations on the power distribution network of a Latin American intermediate city. Renew. Sustain. Energy Rev. 2019, 107, 309–318. [Google Scholar] [CrossRef]
  48. Huang, Z.; Zhang, B.; Xu, P.; Guo, F. Electric vehicle charging strategy for intercity travel: Impact of user perception and battery degradation. Comput. Ind. Eng. 2024, 193, 110266. [Google Scholar] [CrossRef]
  49. Van den Bergh, K.; Delarue, E.; D’haeseleer, W. DC Power Flow in Unit Commitment Models. KU Leuven Energy Institute. 2014. Available online: https://www.mech.kuleuven.be/en/tme/research/energy_environment/pdf/wpen2014-12.pdf (accessed on 1 August 2025).
  50. Mallon, K.R.; Assadian, F.; Fu, B. Analysis of on-board photovoltaics for a battery electric bus and their impact on battery lifespan. Energies 2017, 10, 943. [Google Scholar] [CrossRef]
  51. Lee, J.O.; Kim, Y.S. Novel battery degradation cost formulation for optimal scheduling of battery energy storage systems. Int. J. Electr. Power Energy Syst. 2022, 137, 107795. [Google Scholar] [CrossRef]
  52. Wang, Y.; Wang, B.C.; Li, H.X.; Yen, G.G. Incorporating objective function information into the feasibility rule for constrained evolutionary optimization. IEEE Trans. Cybern. 2015, 46, 2938–2952. [Google Scholar] [CrossRef]
  53. Storn, R.; Price, K. Differential evolution–a simple and efficient heuristic for global optimization over continuous spaces. J. Glob. Optim. 1997, 11, 341–359. [Google Scholar] [CrossRef]
  54. Deb, K. An efficient constraint handling method for genetic algorithms. Comput. Methods Appl. Mech. Eng. 2000, 186, 311–338. [Google Scholar] [CrossRef]
  55. Alvarez, G.E.; Marcovecchio, M.G.; Aguirre, P.A. Security constrained unit commitment scheduling: A new MILP formulation for solving transmission constraints. Comput. Chem. Eng. 2018, 115, 455–473. [Google Scholar] [CrossRef]
  56. Grey, A.; Sekar, A. Unified solution of security-constrained unit commitment problem using a linear programming methodology. IET Gener. Transm. Distrib. 2008, 2, 856–867. [Google Scholar] [CrossRef]
  57. Guo, S. A quick method for judging the feasibility of security-constrained unit commitment problems within Lagrangian relaxation framework. Energy Power Eng. 2012, 4, 432–438. [Google Scholar] [CrossRef]
  58. Brady, J.; O’Mahony, M. Modelling charging profiles of electric vehicles based on real-world electric vehicle charging data. Sustain. Cities Soc. 2016, 26, 203–216. [Google Scholar] [CrossRef]
  59. Purchala, K.; Meeus, L.; Van Dommelen, D.; Belmans, R. Usefulness of DC power flow for active power flow analysis. In Proceedings of the IEEE Power Engineering Society General Meeting, San Francisco, CA, USA, 12–16 June 2005; pp. 454–459. [Google Scholar]
  60. Deng, R.; Xiang, Y.; Huo, D.; Liu, Y.; Huang, Y.; Huang, C.; Liu, J. Exploring flexibility of electric vehicle aggregators as energy reserve. Electr. Power Syst. Res. 2020, 184, 106305. [Google Scholar] [CrossRef]
Figure 1. Aggregator’s operation model.
Energies 18 04293 g001
Figure 2. EVs travel types between two power system Nodes.
Energies 18 04293 g002
Figure 3. TCUCP and EVs general computational model flowchart.
Energies 18 04293 g003
Figure 4. Power reserve and power flow heuristic repair mechanism.
Energies 18 04293 g004
Figure 5. EV charging schedule in the G2V operation of all EV loads in Node A and in Node B.
Energies 18 04293 g005
Figure 6. EV charging schedule with G2V operation at Node A and Node B only for EVs that started their travel in a different Node, at their travel destination.
Energies 18 04293 g006
Figure 7. EVs’ state of charge for the 3-unit system with G2V operation.
Energies 18 04293 g007
Figure 8. EV charging and discharging schedule with V2G operation at Node A and Node B.
Energies 18 04293 g008
Figure 9. Sensitivity analysis on the effect of EPV on the 3-unit system.
Energies 18 04293 g009
Figure 10. Sensitivity analysis on the effect of EPV on the 16-unit system.
Energies 18 04293 g010
Figure 11. EV charging in G2V operation with modest infrastructure at Node A and Node B.
Energies 18 04293 g011
Table 1. Literature review contribution for coordinated and uncoordinated charging optimization.
Decentralized Coordination
ReferenceContribution
[5]DRP integrated with TCUCP.
[4]Price signaling and tariffs.
[6]DRP for transformer saturation.
[7]DRP for updates daily demand curves.
[8]DRP for small residential complexes that enables V2G operation of residents.
[9]Combines DRP with blockchain technology.
[10]V2V (Vehicle to Vehicle) technology within DRP framework.
[12]Small-scale EV fleet DRP in distribution network level.
[13]Price signaling optimization for type 3 chargers for dayahead scheduling.
[14]DRP with environmental constrains.
Centralized Coordination
ReferenceContribution
[19]Minimizes battery degradation and charging costs and flattens the load curve by minimizing load deviations.
[20]Minimization of charging load deviation and stabilization of voltage levels.
[21]Comparison between 3 types of optimization: minimizing transmission line power loss and load variance, minimizing charging cost for the EV owner, maximizing aggregator profits.
[22]Optimized charging considering customer satisfaction.
[23]Multi-objective optimization to balance between economic benefits for EV owners and grid stabilization.
[24]Optimizes charging schedule, reducing photovoltaic (PV) curtailment.
[26]Optimized charging considering multiple infrastructure levels.
Table 2. Constants.
Table 2. Constants.
SymbolsDescription
Constants
a l , b l , c l Quadratic equation costs of gen l, USD/h, USD/MWh, USD/MWh2.
an, bnEV aggregation category of EVs of the starting point Node a or b.
b D i a g Diagonal matrix susceptance of transmission line ln.
b l n Susceptance of transmission line ln.
cna, cnbEV aggregation category of EVs that travel within a single Node.
CEDConsumed energy of EV category evf in period k in MWh.
CoefGensMatrix created utilizing the PTDF matrix, containing only the columns with nodes that receive power injections from generators.
C o B e v d , k Cost of batteries of EVs connected to the node at hour k USD.
cscCold start-up cost of generator l in USD.
d0, d1, d2Least square regression results.
EPVMultiplier that determines the boundary of variable PPCV.
MaxTransfMaximum allowable transfer of power to and from EVs in MWh.
M T D l Minimum operational time of generator l.
M T U l Minimum shutdown time of generator l.
neEV charging and discharging efficiency.
PdSystem day-ahead power demand of period k in MWh.
P m a x l , P m i n l Maximum and minimum generation limit of generator in MW.
SCstart-up cost of generator l in period k in USD.
SUCstart-up cost of generator l in period k in USD.
TdTime down in hours.
ResSystem day-ahead reserves of period k in MWh.
EstEnergy storage of EV battery.
TITime interval.
DE constants
ARCExternal archive of the DE that stores all trial vectors that didn’t survive the feasibility rules.
CRRCrossover rate of the DE.
lwvLines with violation.
nDE particle index.
r1, r2, r3Indexes of population vectors.
SFDE scaling factor.
TDATemporary unit de-commitment archive.
wMutant vector of DE.
zPopulation vector of DE.
Table 3. Variables.
Table 3. Variables.
SymbolsDescription
anglNDVoltage angle at a node.
B D e v d , k Battery degradation cost of EVs of period k in USD.
B D C e v d , k Total battery degradation of EVs of cycle in period k in USD.
C l e v d , k Cycle lifetime of EV battery.
c s l , k Generator commitment status of generator l in period k, binary variable.
D D e v d , k Depth of discharge of EVs in period k.
E n C h e v f , k Power received from the power grid by each evf EV group in period k in MWh.
E n D i s c h e v d , k Power sent to the power grid by each evd EV group in period k in MWh.
G C l , k Power production cost of generator l in period k in USD.
P f l n , k power flow in line ln in period k in WM.
PF nodalPower injections at node nd including transmission power flow.
p f a l n power flow in line ln in period k in WM.
pfnodalPower injections at node nd without transmission power flow.
PlavcostPriority list of generators created by sorting all generators according to their average production cost.
PlmaxcostPriority list of generators created by sorting all generators according to their maximum average production cost.
P P C V k Peak power control variable is an optimization variable that dictates the maximum available peak power of the system, for every hour k in MWh.
p r l , k Power production of generator l in period k in MW.
P r m a x l , P r m i n l Maximum and minimum allowable generation limit of generator l in period k in MW.
S o C e v d , k State of charge of the batteries of EVF groups of EVs in T total hours in MWh.
TdecomConsecutive time where generator is de-committed.
TonTotal number of consecutive operational hours of generator l up to hour k.
u t Decision variable of G2V and V2G operation.
VNDVoltage at node (bus) ND.
Table 4. Sets.
Table 4. Sets.
SymbolsDescription
LSet of indexes of the generating units.
KSet of indexes of the time periods.
EVDSet of indexes of the EV groups in V2G operation.
EVFSet of indexes of the EV groups during charging as a flexible load.
NDSet of indexes of system’s nodes (buses).
LNSet of indexes of the transmission lines.
Table 5. Multipliers representing EV movement between two nodes.
MultiplierNode Traveling CategoryDeparture and Arrival DistinctionTrip Duration (hours)Dependent SoC
nt1Na to Nadeparture from a1 S o C a , k 1
nt2Na to Naarrival to a1 S o C a , k 2
nt3Na to Nbdeparture from a1 S o C a , k 1
nt4Na to Nbarrival to b1 S o C a , k 2
nt5Nb to Nadeparture from b1 S o C b , k 1
nt6Nb to Naarrival to a1 S o C b , k 2
nt7Nb to Nbdeparture from b1 S o C b , k 1
nt8Nb to Nbarrival to b1 S o C b , k 2
Table 6. Generator 24 h operation schedule for the 3-unit system without the presence of EVs. (A value of 1 indicates that the generator is operational, and 0 indicates that it is shut down).
Hour
123456789101112131415161718192021222324
Generator
G1111111111111111111111111
G2000000000111111110011110
G3000000000000000001111000
Table 7. Results and stochastic algorithm statistics of the proposed general computational model for all three cases with DC power flow, without EVs, and comparison with the TCUCP MILP formulation.
Power System3 Units—6 Bus16 Units—31 Bus54 Units—118 Bus
min77.797 k USD1.295 M USD1.367 M USD
mean77.858 k USD1.296 M USD1.367 M USD
max78.125 k USD1.296 M USD1.368 M USD
std116.073 USD466.154 USD313.684 USD
average time (min)24.31924.07756.288
runs201515
FES50 k160 k300 k
relative difference with MILP00.000730.01144
Table 8. Generator 24 h operation schedule for the 3-unit system with G2V operation. (A value of 1 indicates that the generator is operational, and 0 indicates that it is shut down).
Hour
123456789101112131415161718192021222324
Generator
G1111111111111111111111111
G2100000001111111100111111
G3000000110011101011111000
Table 9. Results and stochastic algorithm statistics of the proposed general computational model for all three cases of the TCUCP with G2V operation with DE variant and comparison with MILP formulation.
Power System3 Units—6 Bus16 Units—31 Bus54 Units—118 Bus
min93.710 k USD1.357 M USD1.379 M USD
mean94.495 k USD1.359 M USD1.381 M USD
max95.986 k USD1.361 M USD1.383 M USD
std (USD)532.7801259.416706.000
average time (min)68.85944.81357.531
runs1001515
FES300 k200 k300 k
relative difference with MILP0.016910.004660.01144
Table 10. Results and stochastic algorithm statistics of basic PSO for all three cases of the TCUCP with G2V operation.
Power System3 Units—6 Bus16 Units—31 Bus54 Units—118 Bus
min99.3 k USD1.4169 M USD1.479 M USD
mean100.24 k USD1.4303 M USD1.4876 M USD
max100.997 k USD1.438 M USD1.4953 M USD
std (USD)645.526616.15430.481
time (min)79.1854.6764.14
Table 11. Results and stochastic algorithm statistics of the proposed general computational model for all three cases of the TCUCP with V2G operation.
Power System3 Units—6 Bus16 Units—31 Bus54 Units—118 Bus
min92.523 k USD1.354 M USD1.379 M USD
Mean92.946 k USD1.357 M USD1.380 M USD
Max93.782 k USD1.358 M USD1.382 M USD
Std (USD)571.9511190.587643.518
average time (min)57.53159.79689.915
runs1001515
FES200 k200 k300 k
relative difference with MILPNANANA
Table 12. Generator 24 h operation schedule for the 3-unit system with V2G operation. (A value of 1 indicates that the generator is operational, and 0 indicates that it is shut down).
Hour
123456789101112131415161718192021222324
Generator
G1111111111111111111111111
G2100000001111111111111111
G3000100000111111111111110
Table 13. Convergence of the proposed general computational model for all cases of the TCUCP. * RD stands for Relative Difference.
Power System3 Units—6 Bus16 Units—31 Bus54 Units—118 Bus
No Evs Operation
Cost of Initial Vector143.73 k USD2.20685 M USD1.50342 M USD
Violation of Initial Vector5.375 k174.61 k60.686 k
Generation until Feasible75510
Cost of feasible solution81.440 k USD1.3092 M USD1.37357 M USD
RD * of Initial Vector (%)43.3440.678.64
RD of min value (%)4.471.110.48
Particles808080
G2V operation
Cost of Initial Vector122.081 k USD2.1433 M USD1.5311 M USD
Violation of Initial Vector3.628 k170.090 k52.833 k
Generation until Feasible3811373
Cost of Feasible Solution97.021 k USD1.3757 M USD1.3937 M USD
RD of Initial Vector (%)20.5335.818.98
RD of min value (%)3.411.390.99
Particles808080
V2G operation
Cost of Initial Vector177.817 k USD2.4908 M USD1.5951 k USD
Violation of Initial Vector3.42 k133.420 k49.303 k
Generation until Feasible4151258
Cost of Feasible Solution96.26 k USD1.3750 M USD1.3917 M USD
RD of Initial Vector (%)45.8644.812.75
RD of min value (%)3.091.520.86
Particles808080
Table 14. Number of constraints.
Power System3 Units—6 Bus16 Units—31 Bus54 Units—118 Bus
Constraints291113,43643,594
Table 15. Results for the three test systems for V2G operation with stochastic inputs.
Power System3 Units—6 Bus16 Units—31 Bus54 Units—118 Bus
min95.209 k USD1.37615 k USD1.3849 M USD
mean95.298 k USD1.37758 M USD1.38694 M USD
max95.47 k USD1.37921 M USD1.38906 M USD
std111.02750.2351169.032
Table 16. Results for the three test systems for the Modest infrastructure.
Power System3 Units—6 Bus16 Units—31 Bus54 Units—118 Bus
min95.12 k USD1.35613 M USD1.380033 M USD
mean95.63 k USD1.35719 M USD1.380432 M USD
max96.72 k USD1.35799 M USD1.38105 M USD
std566.602814.321444.5187
Table 17. Results for the three test systems for the stochastic heterogeneous charging.
Power System3 Units—6 Bus16 Units—31 Bus54 Units—118 Bus
min94.226 k USD1.3772 M USD1.38683 M USD
mean94.94 k USD1.3794 M USD1.38782 M USD
max95.675 k USD1.3827 M USD1.38984 M USD
std745.9141528.67787.21
Disclaimer/Publisher’s Note: The statements, opinions and data contained in all publications are solely those of the individual author(s) and contributor(s) and not of MDPI and/or the editor(s). MDPI and/or the editor(s) disclaim responsibility for any injury to people or property resulting from any ideas, methods, instructions or products referred to in the content.