To ensure temporal consistency in the research data, this study defined the observation period from 2013 to 2024. The target population included all prefecture-level and higher administrative regions. Considering variations in administrative structures and statistical reporting methods across cities, rigorous screening was applied to ensure data completeness and continuity to guarantee the scientific validity and accuracy of the findings: (1) Seven prefecture-level cities established after 2007 were excluded due to insufficient data continuity. (2) An additional six cities were eliminated owing to incomplete data records. After comprehensive screening, 284 prefecture-level and higher cities were ultimately selected as the research sample. The observational data were collected from national and local statistical yearbooks (2013–2024), municipal statistical bulletins, and government open-data systems, with unified statistical coverage across entire municipal administrative boundaries. To better assess governmental digital engagement, this study reviewed 2013–2024 local government work reports, extracting policy indicators related to digital twin technology development to construct a government attention index for digital twin technology.
3.1. Characterization of Fundamental Facts Regarding Digital Twin Technology in Energy Sustainable Development
The application of digital twin technology in the energy sector has enhanced energy utilization efficiency and provided a green blueprint for sustainable urban development [
25]. Total electricity consumption across society is a key indicator of urban energy use and directly reflects the demand for electricity driven by economic and social activities [
26]. Through smart meters and other devices, digital twin technology collects users’ electricity consumption data in real time, enabling an accurate grasp of trends in total electricity usage. Based on electricity data, digital twin technology can help power departments accurately forecast electricity demand and optimize electricity production and scheduling plans. According to electricity usage patterns across different regions and industries, power generation equipment can be reasonably scheduled, reducing the number of times generators are started or stopped, lowering generation costs and energy loss. Meanwhile, by analyzing users’ electricity consumption behavior, policies such as time-of-use pricing can be implemented to guide users toward rational electricity use, reduce peak loads, and improve the overall operational efficiency of the power system [
27]. Therefore, the total electricity consumption of society can be regarded as a representative indicator for assessing the operational scale of digital twin technology within IoT-based power systems, thereby reflecting the efficiency and performance of energy and electricity system operations. To optimize energy use, ensuring the stable supply of clean energy is a key component of sustainable development. Manufactured gas and natural gas, as relatively clean fossil fuels, reflect the capacity and reliability of clean energy supply in cities. Therefore, applying digital twin technology to the supply systems of manufactured gas and natural gas can help optimize urban energy structures, reduce the use of traditional energy sources such as coal, lower pollutant emissions, and improve urban environmental quality [
28]. Based on this, the total supply of manufactured gas and natural gas in urban areas can be employed as an indicator to evaluate the coverage of IoT-based gas management systems, thereby facilitating the optimization and upgrading of the energy utilization framework. The total supply of liquefied petroleum gas is an indicator that reflects the diversity and flexibility of urban energy supply. The application of digital twin technology in liquefied petroleum gas (LPG) supply systems helps cities allocate energy resources reasonably according to the characteristics of different regions and users, enhancing the adaptability and coverage of energy supply [
29]. Accordingly, the total supply of LPG can be utilized as an indicator to assess the application of digital twin technology in energy supply, thereby providing a clearer representation of the diversity within urban energy systems.
The penetration rate of electronic gas meters is an important indicator of gas service coverage and can thus be used to measure the level of urban energy services for residents, reflecting the degree to which citizens enjoy clean and convenient energy services. The improvement of gas service coverage depends on the application of digital twin technology in urban gas supply infrastructure, thereby enhancing urban energy efficiency, optimizing the energy structure, and promoting sustainable urban development [
30]. Therefore, the gas coverage rate can serve as a metric for evaluating the penetration of electronic gas meters, thereby offering valuable insights into the effectiveness of gas utilization in advancing energy sustainability. The evaluation indicators for sustainable development in the energy industry are as shown in
Table 4. Shown in
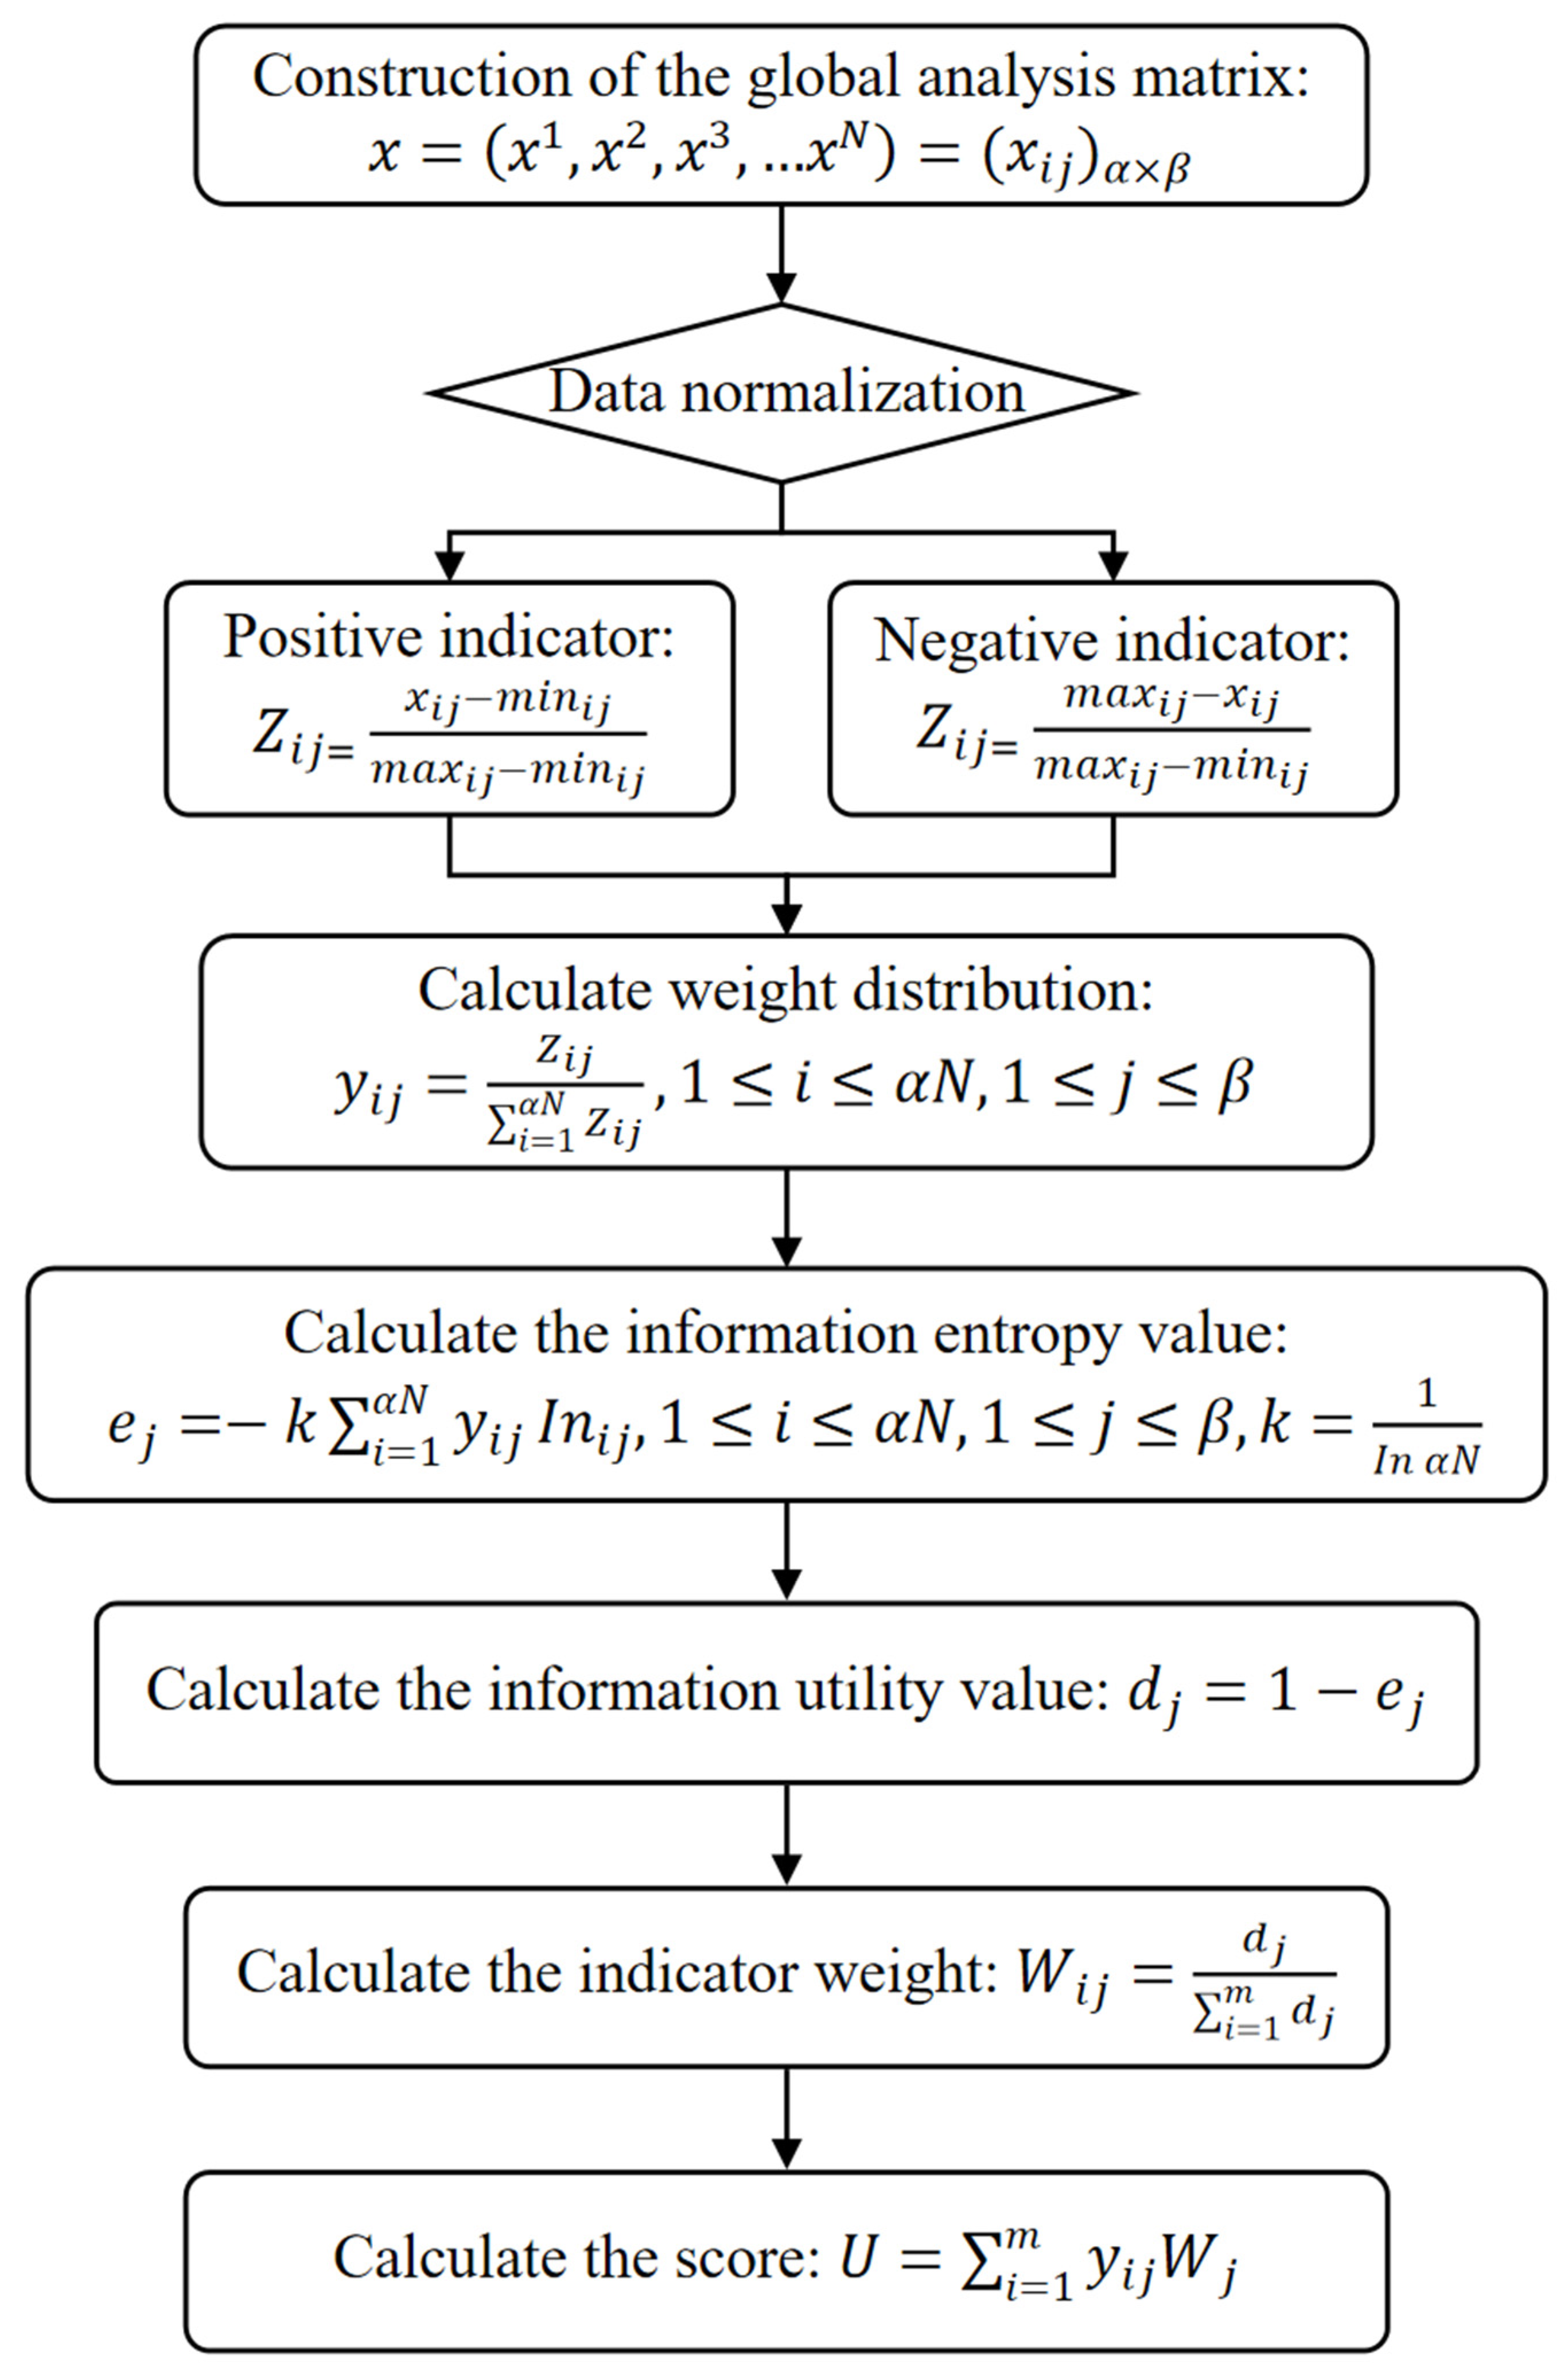
Table 1, the weighting coefficients of the indicators were determined using the entropy method, which objectively captured the degree of information dispersion among the indicators. This approach ensured a more impartial and data-driven evaluation of their relative significance in the context of sustainable energy development. Data sources are shown in
Appendix A.
The above indicators are designed to measure the application of digital twin technology in the field of sustainable energy development. The weights of these indicators are determined using the entropy weight method, which offers a scientifically grounded and objective approach to indicator weighting. By analyzing the degree of dispersion or variability within the data, the entropy method assigns higher weights to indicators that carry more information and have greater influence on the sustainable energy evaluation system. This not only avoids subjective bias in the sustainable energy assessment process but also ensures that the composite evaluation accurately reflects the actual contribution of each indicator. Consequently, it enhances the credibility and robustness of sustainable energy evaluation results, providing a reliable basis for analyzing the impact of digital twin technology on energy sustainability.
Specifically, China is divided into four regions according to the official classification standards of the National Bureau of Statistics. The provinces and five representative cities in each region are as follows: (1) Eastern Region: Beijing, Tianjin, Hebei, Shanghai, Jiangsu, Zhejiang, Fujian, Shandong, Guangdong, and Hainan. Representative cities include Beijing, Shanghai, Shenzhen, Hangzhou, Guangzhou, et al. (2) Central Region: Shanxi, Anhui, Jiangxi, Henan, Hubei, and Hunan. Representative cities include Wuhan, Zhengzhou, Changsha, Hefei, Nanchang, et al. (3) Western Region: Inner Mongolia, Guangxi, Chongqing, Sichuan, Guizhou, Yunnan, Tibet, Shaanxi, Gansu, Qinghai, Ningxia, and Xinjiang. Representative cities include Chengdu, Chongqing, Xi’an, Kunming, Urumqi, et al. (4) Northeastern Region: Liaoning, Jilin, and Heilongjiang. Representative Cities include Shenyang, Dalian, Changchun, Harbin, Anshan, and so on.
3.1.1. Evolution Trend of Sustainable Development in the Energy Industry
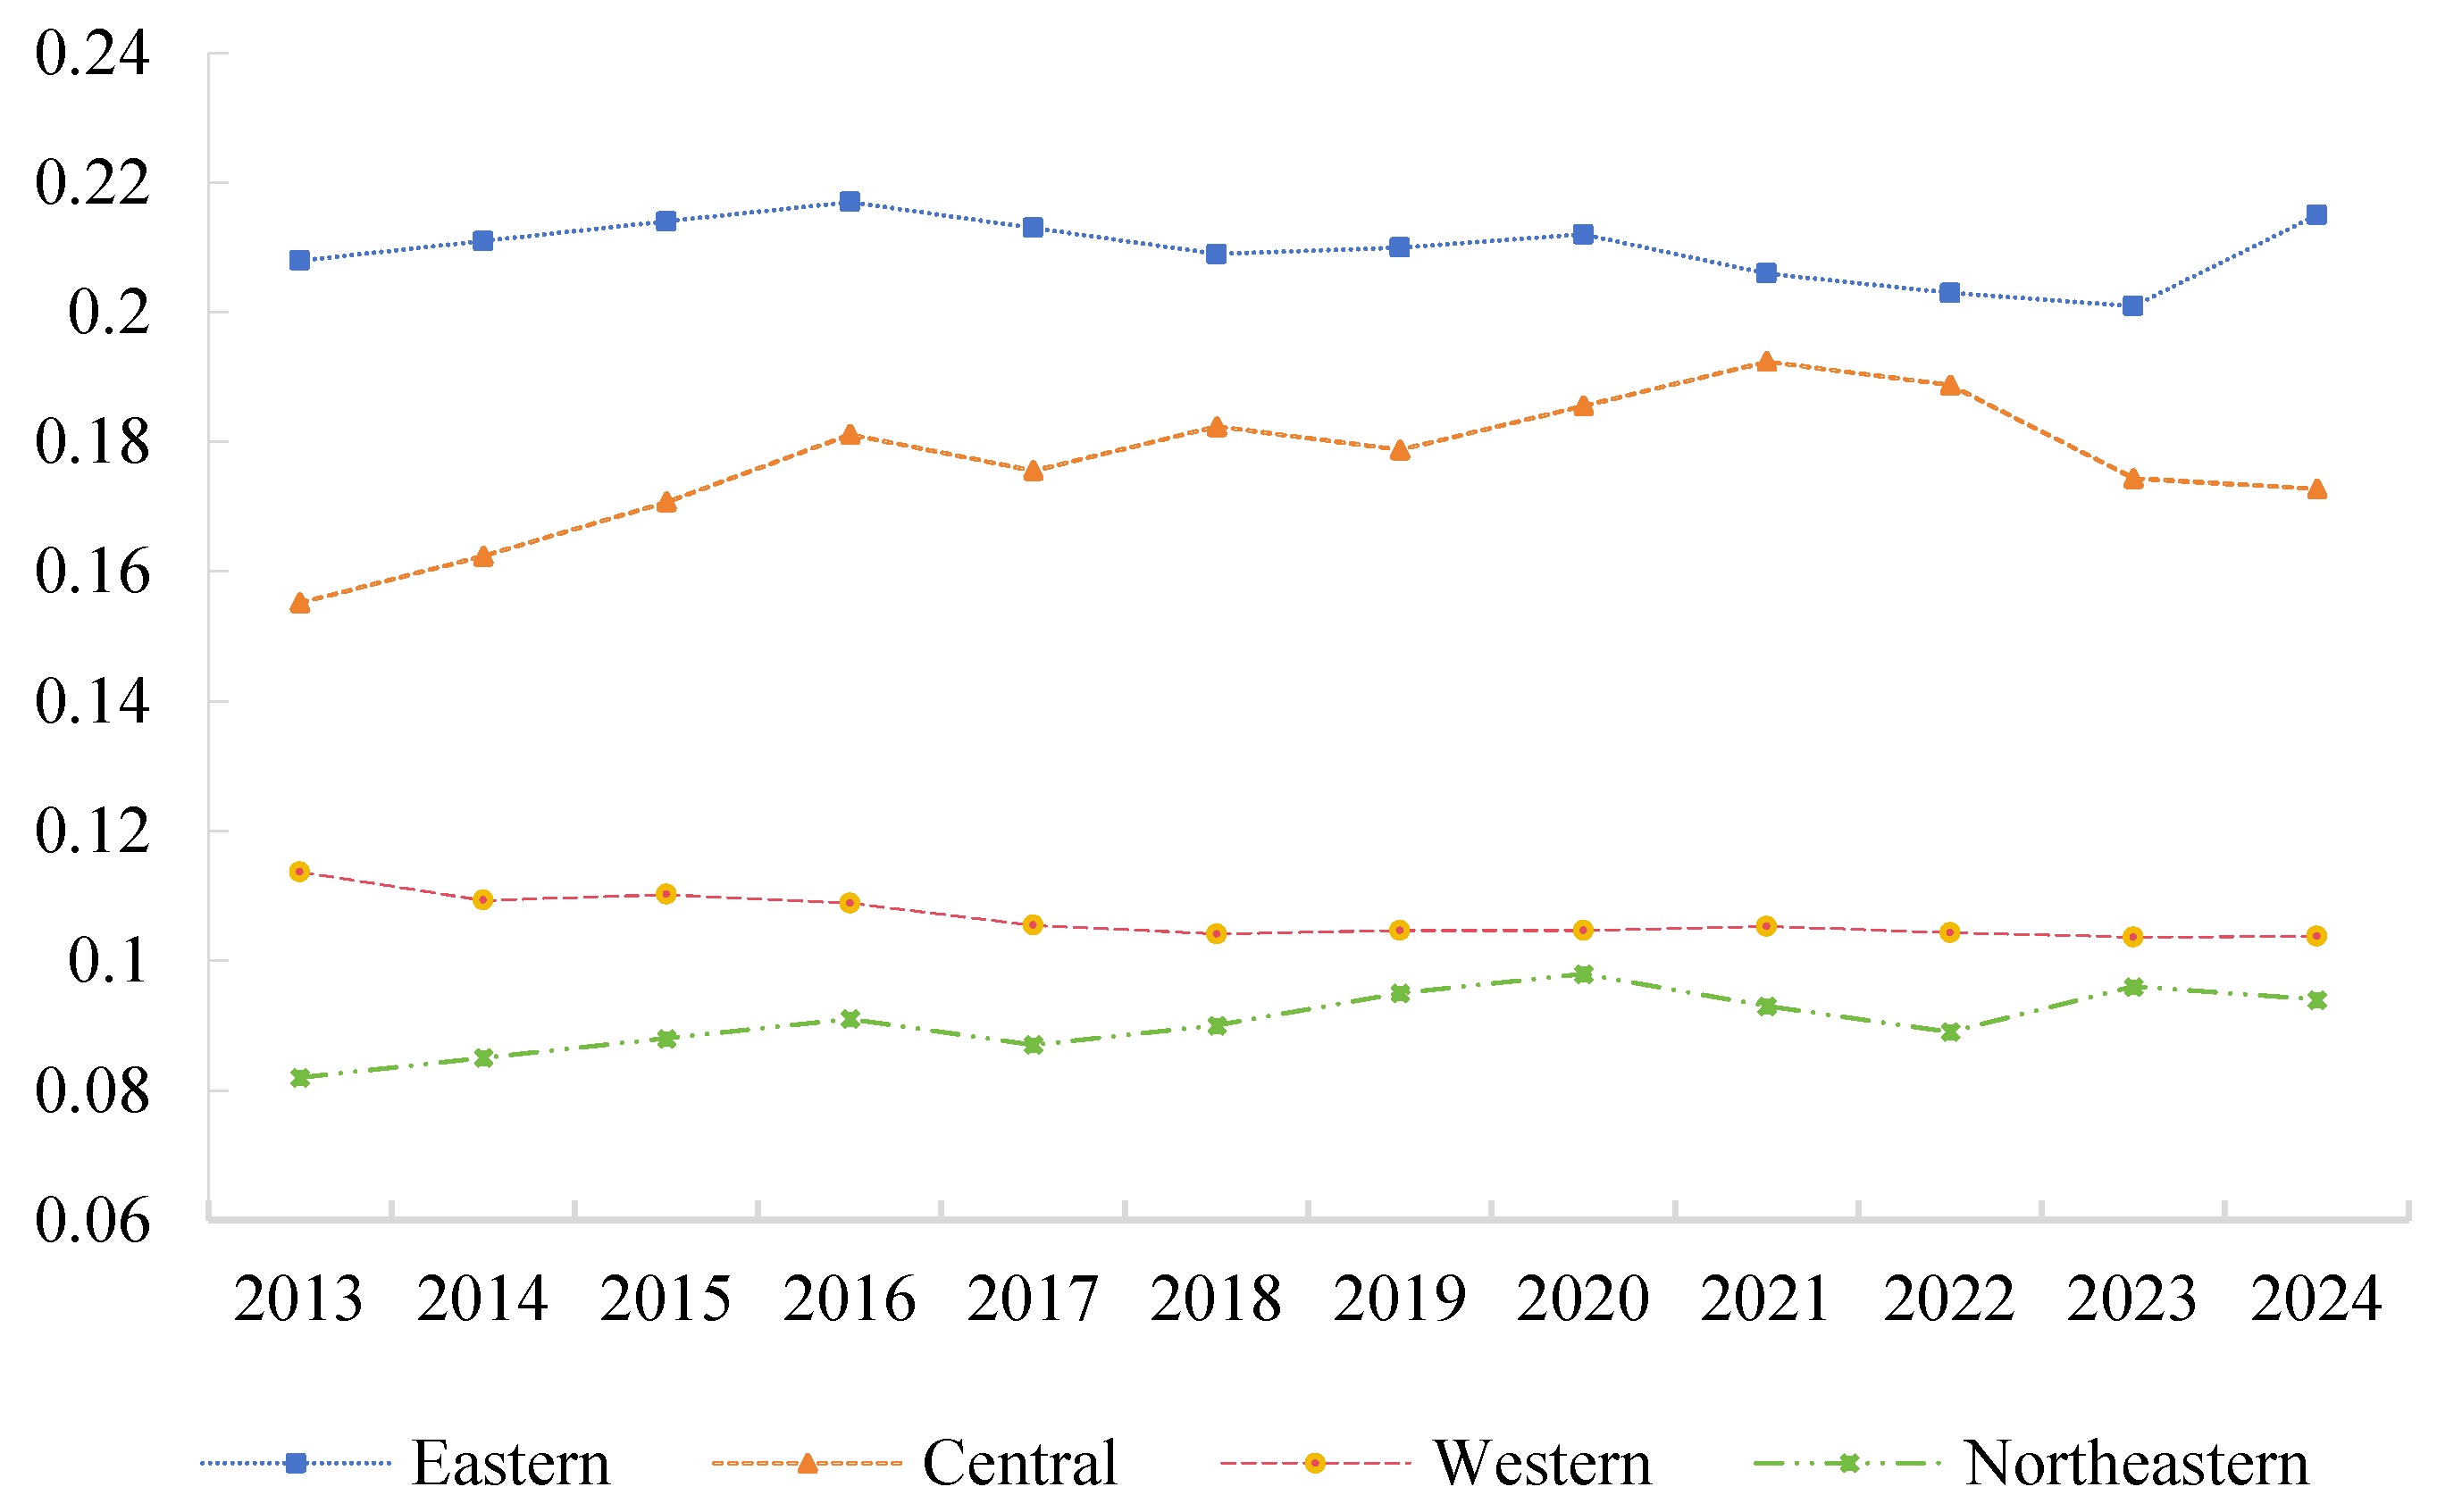
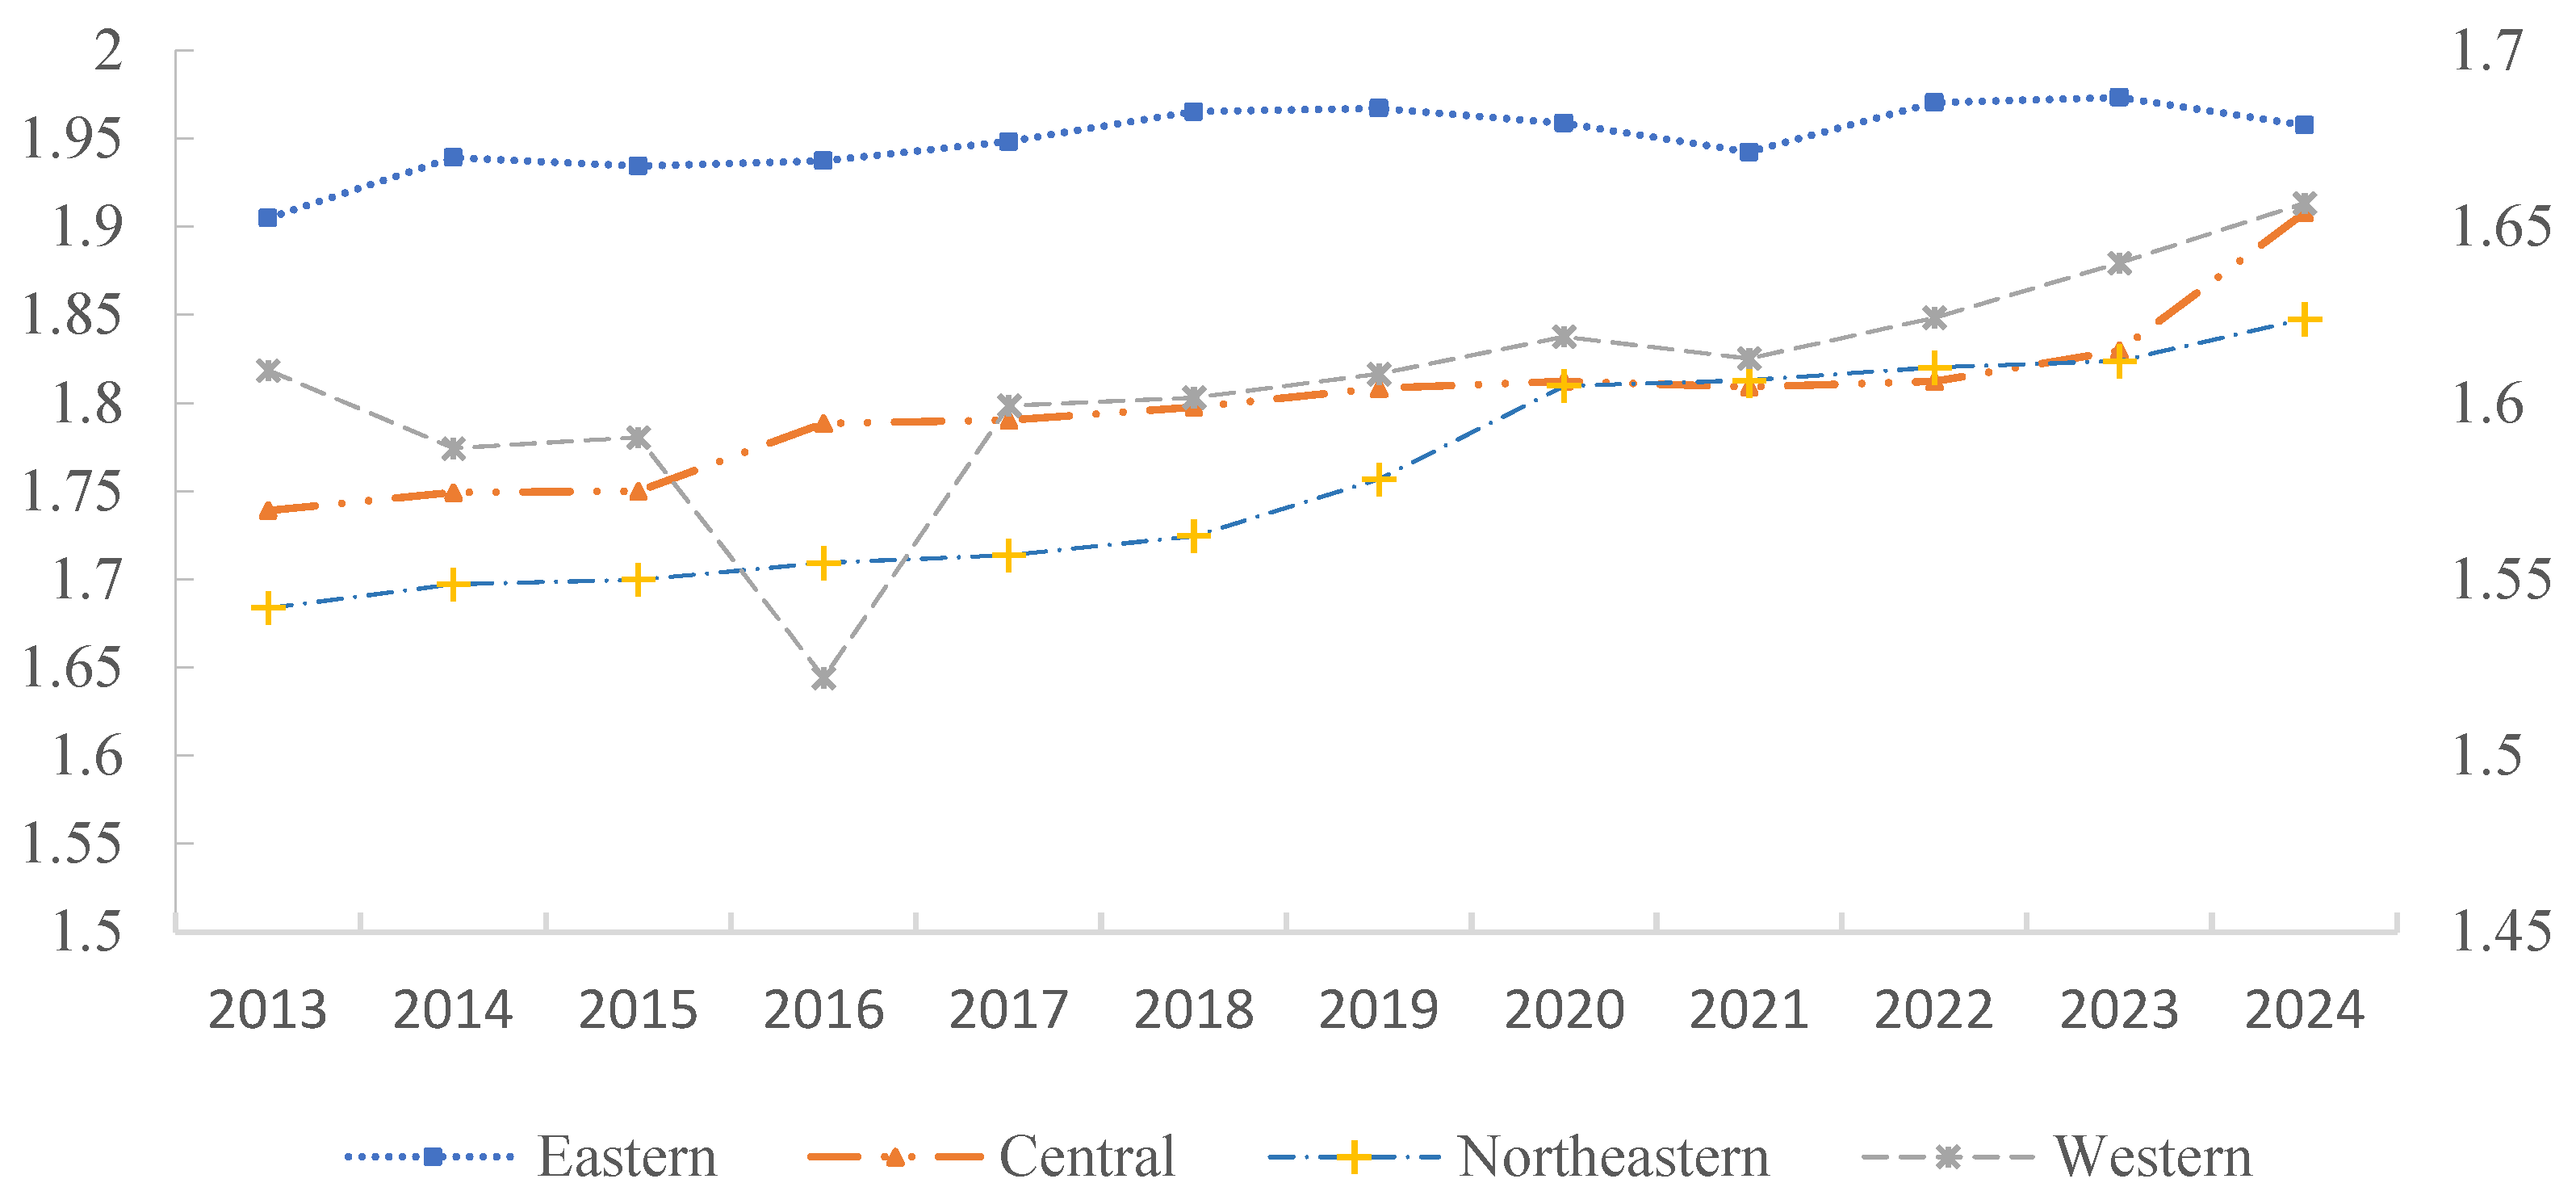
From
Figure 2, it can be seen that the eastern region has the highest overall level of sustainable development in the energy industry, consistently surpassing other regions. This indicates that the eastern region’s energy sustainability is in a stable state, benefiting from industrial structure optimization, technological investment, and the promotion of clean energy. The central region ranks second overall, slightly higher than the western and northeastern regions. However, the sustainable development in the central region exhibits noticeable fluctuations, suggesting that its energy development is influenced by multiple factors, such as the proportion of traditional industries and policy adjustments. The western region shows a trend similar to the central region but slightly lower, indicating that recent investments in renewable energy sectors like wind power and photovoltaics have yielded positive results. The northeastern region has the lowest overall level, demonstrating that structural adjustment and transformation of the energy industry in this region are still ongoing, with a heavy reliance on traditional heavy industries and difficulties in the transition process. Around 2017, China entered a phase of “new normal” economic development, during which the pace of economic restructuring accelerated, and stricter regulations were imposed on high-energy-consuming and heavily polluting industries. The period from 2016 to 2017 marked a critical transition from traditional energy sources—primarily coal—to clean energy sources such as wind and solar power. However, during this transitional phase, the integration of new and old energy systems faced technological lags and institutional bottlenecks, which led to a temporary decline in energy supply efficiency and consequently hindered sustainable development indicators. In addition, the infrastructure for clean energy was not yet fully developed, resulting in a lag in the overall operational efficiency of the energy system. In terms of overall development levels, 2022 marked a general low point, with the central, western, and northeastern regions all reaching their lowest levels, possibly due to the impact of the pandemic, economic slowdown, or energy policy adjustments [
25]. In 2023, the energy development levels across all regions in China generally rebounded, reflecting the effective implementation of the new development philosophy during the 14th Five-Year Plan period and the advancement of energy transition strategies.
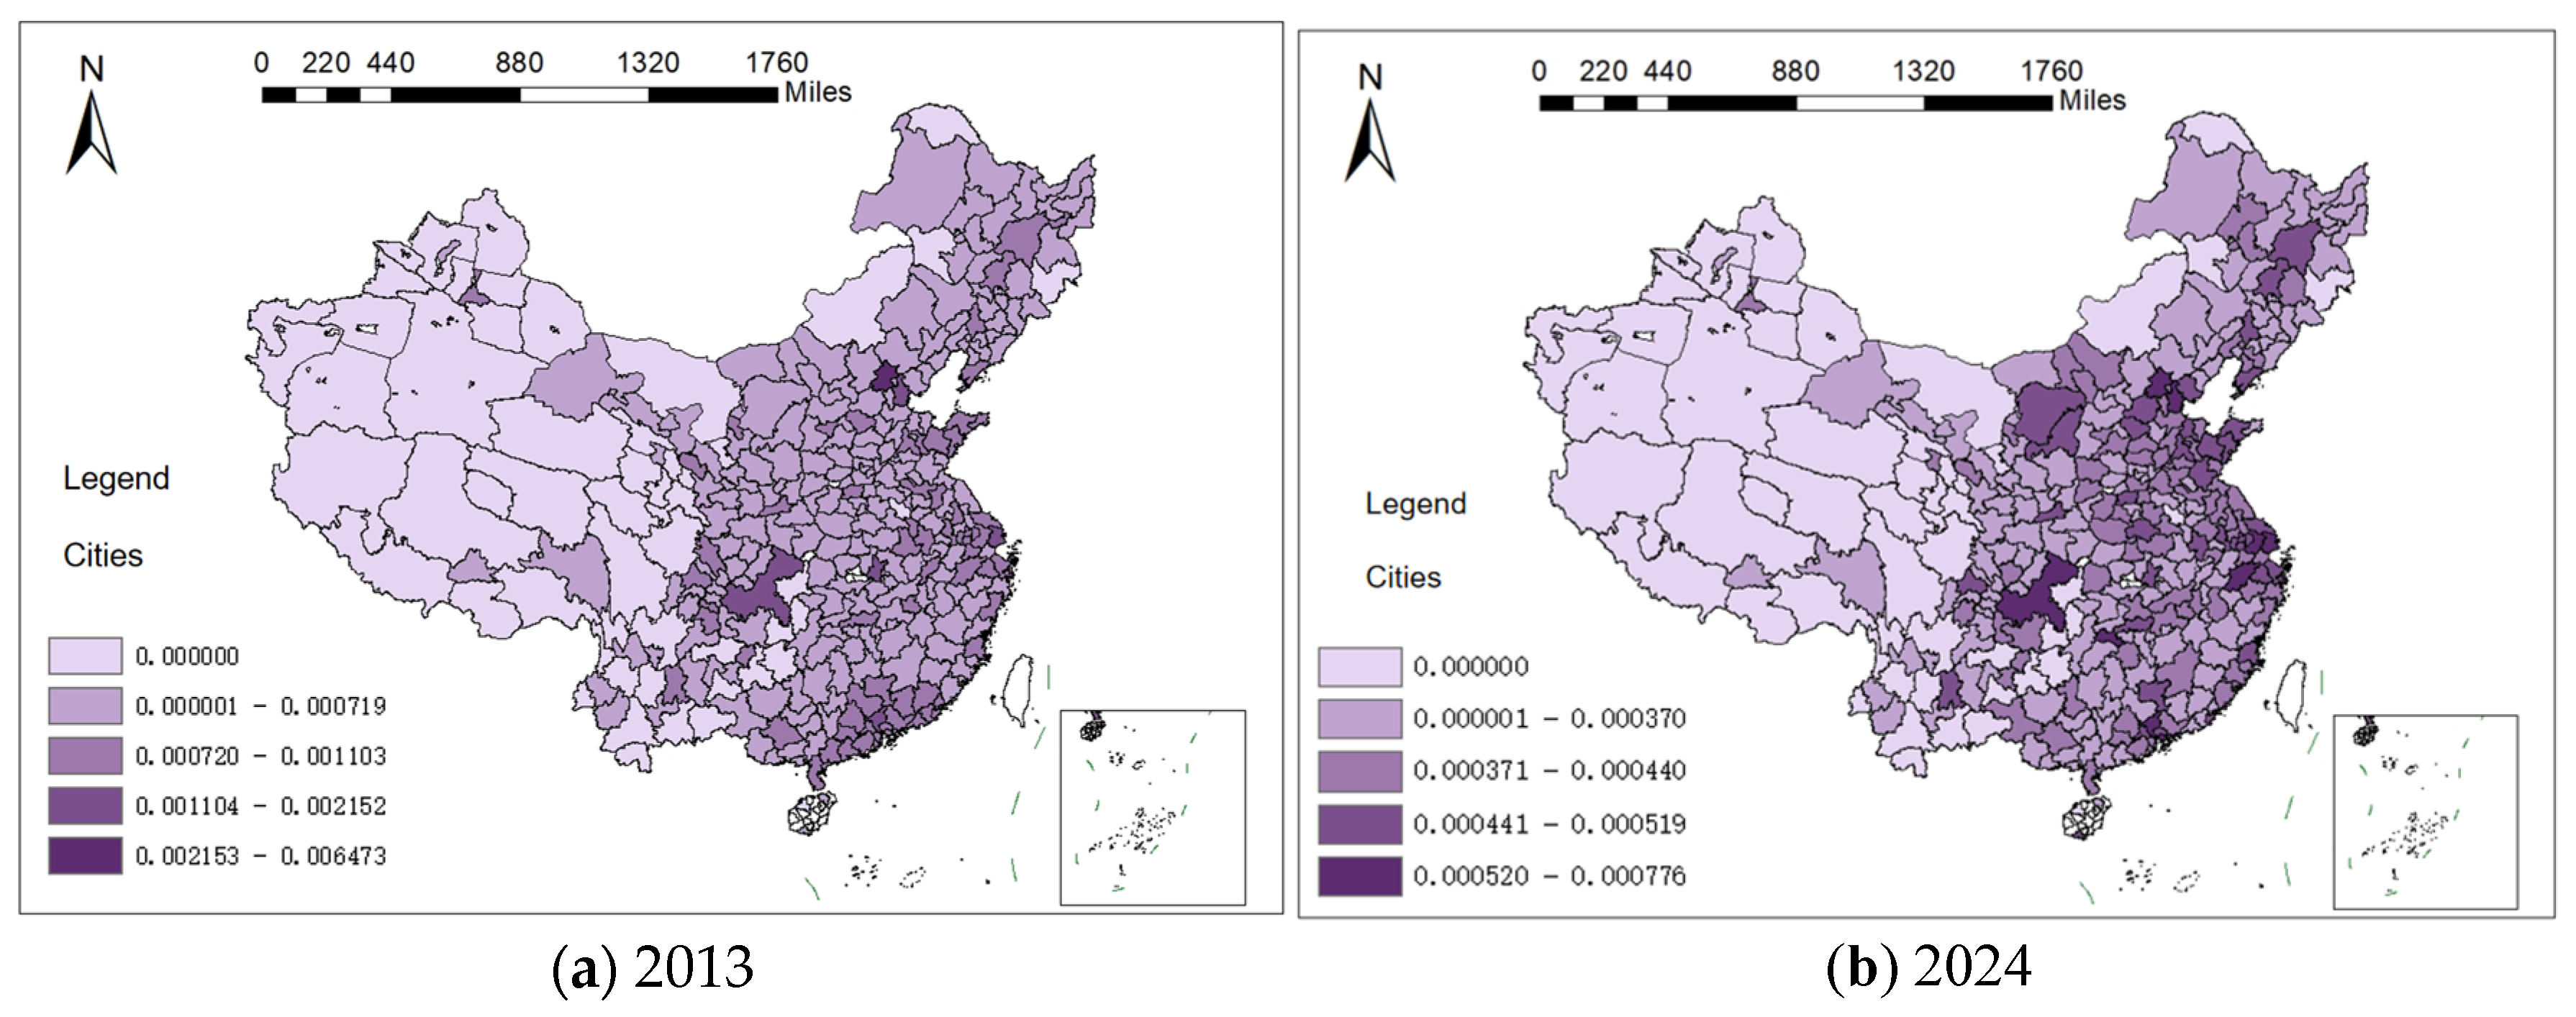
From the above
Figure 3, it can be seen that in 2013, regions with optimized energy efficiency were mainly concentrated in parts of East China, Central China, and South China, such as Jiangsu, Zhejiang, Shandong, and Henan. The data in
Figure 3 represent the level of energy sustainability across different regions in China, with data values ranging from 0.000 to 0.005. Different colors indicate the varying levels of sustainable development in the regional energy industry. Darker colors represent higher levels of energy sustainability. The Northwest and Southwest regions had relatively low levels of energy efficiency optimization and development. By 2024, the areas of sustainable development in the energy industry had significantly expanded, especially in the Yangtze River Delta, the Pearl River Delta, and the Beijing–Tianjin–Hebei regions. Some central and western areas, such as Hunan, Jiangxi, and Shaanxi, show deeper colors, indicating an improvement in the level of sustainable development in the energy industry. The overall deepening of color in the northeastern region also reflects an increase in sustainable development levels there. Over time, the imbalance in energy development among regions may have intensified. In 2024, the eastern coastal areas and economically developed regions, such as Guangdong and Shanghai, exhibited a noticeably deeper degree of sustainable development in the energy industry compared to 2013, further widening the gap with the central and western regions. Some resource-rich areas in the west, such as Inner Mongolia, Xinjiang, and Shaanxi, showed slight increases in sustainable development levels, reflecting adjustments in the national energy strategy that promote the shift of the energy industry toward resource-abundant regions. In some parts of Northeast China, the sustainable development level of the energy industry has declined. In some old industrial-based cities, the equipment of traditional energy industries is aging and the technology is backward, making it difficult to meet market demands. Meanwhile, the emerging energy industries lack financial, technical, and talent support, resulting in insufficient development momentum for the energy industry and a decline in the level of sustainable development.
3.1.2. Gini Coefficient
- (1)
Inter-group Gini Coefficient
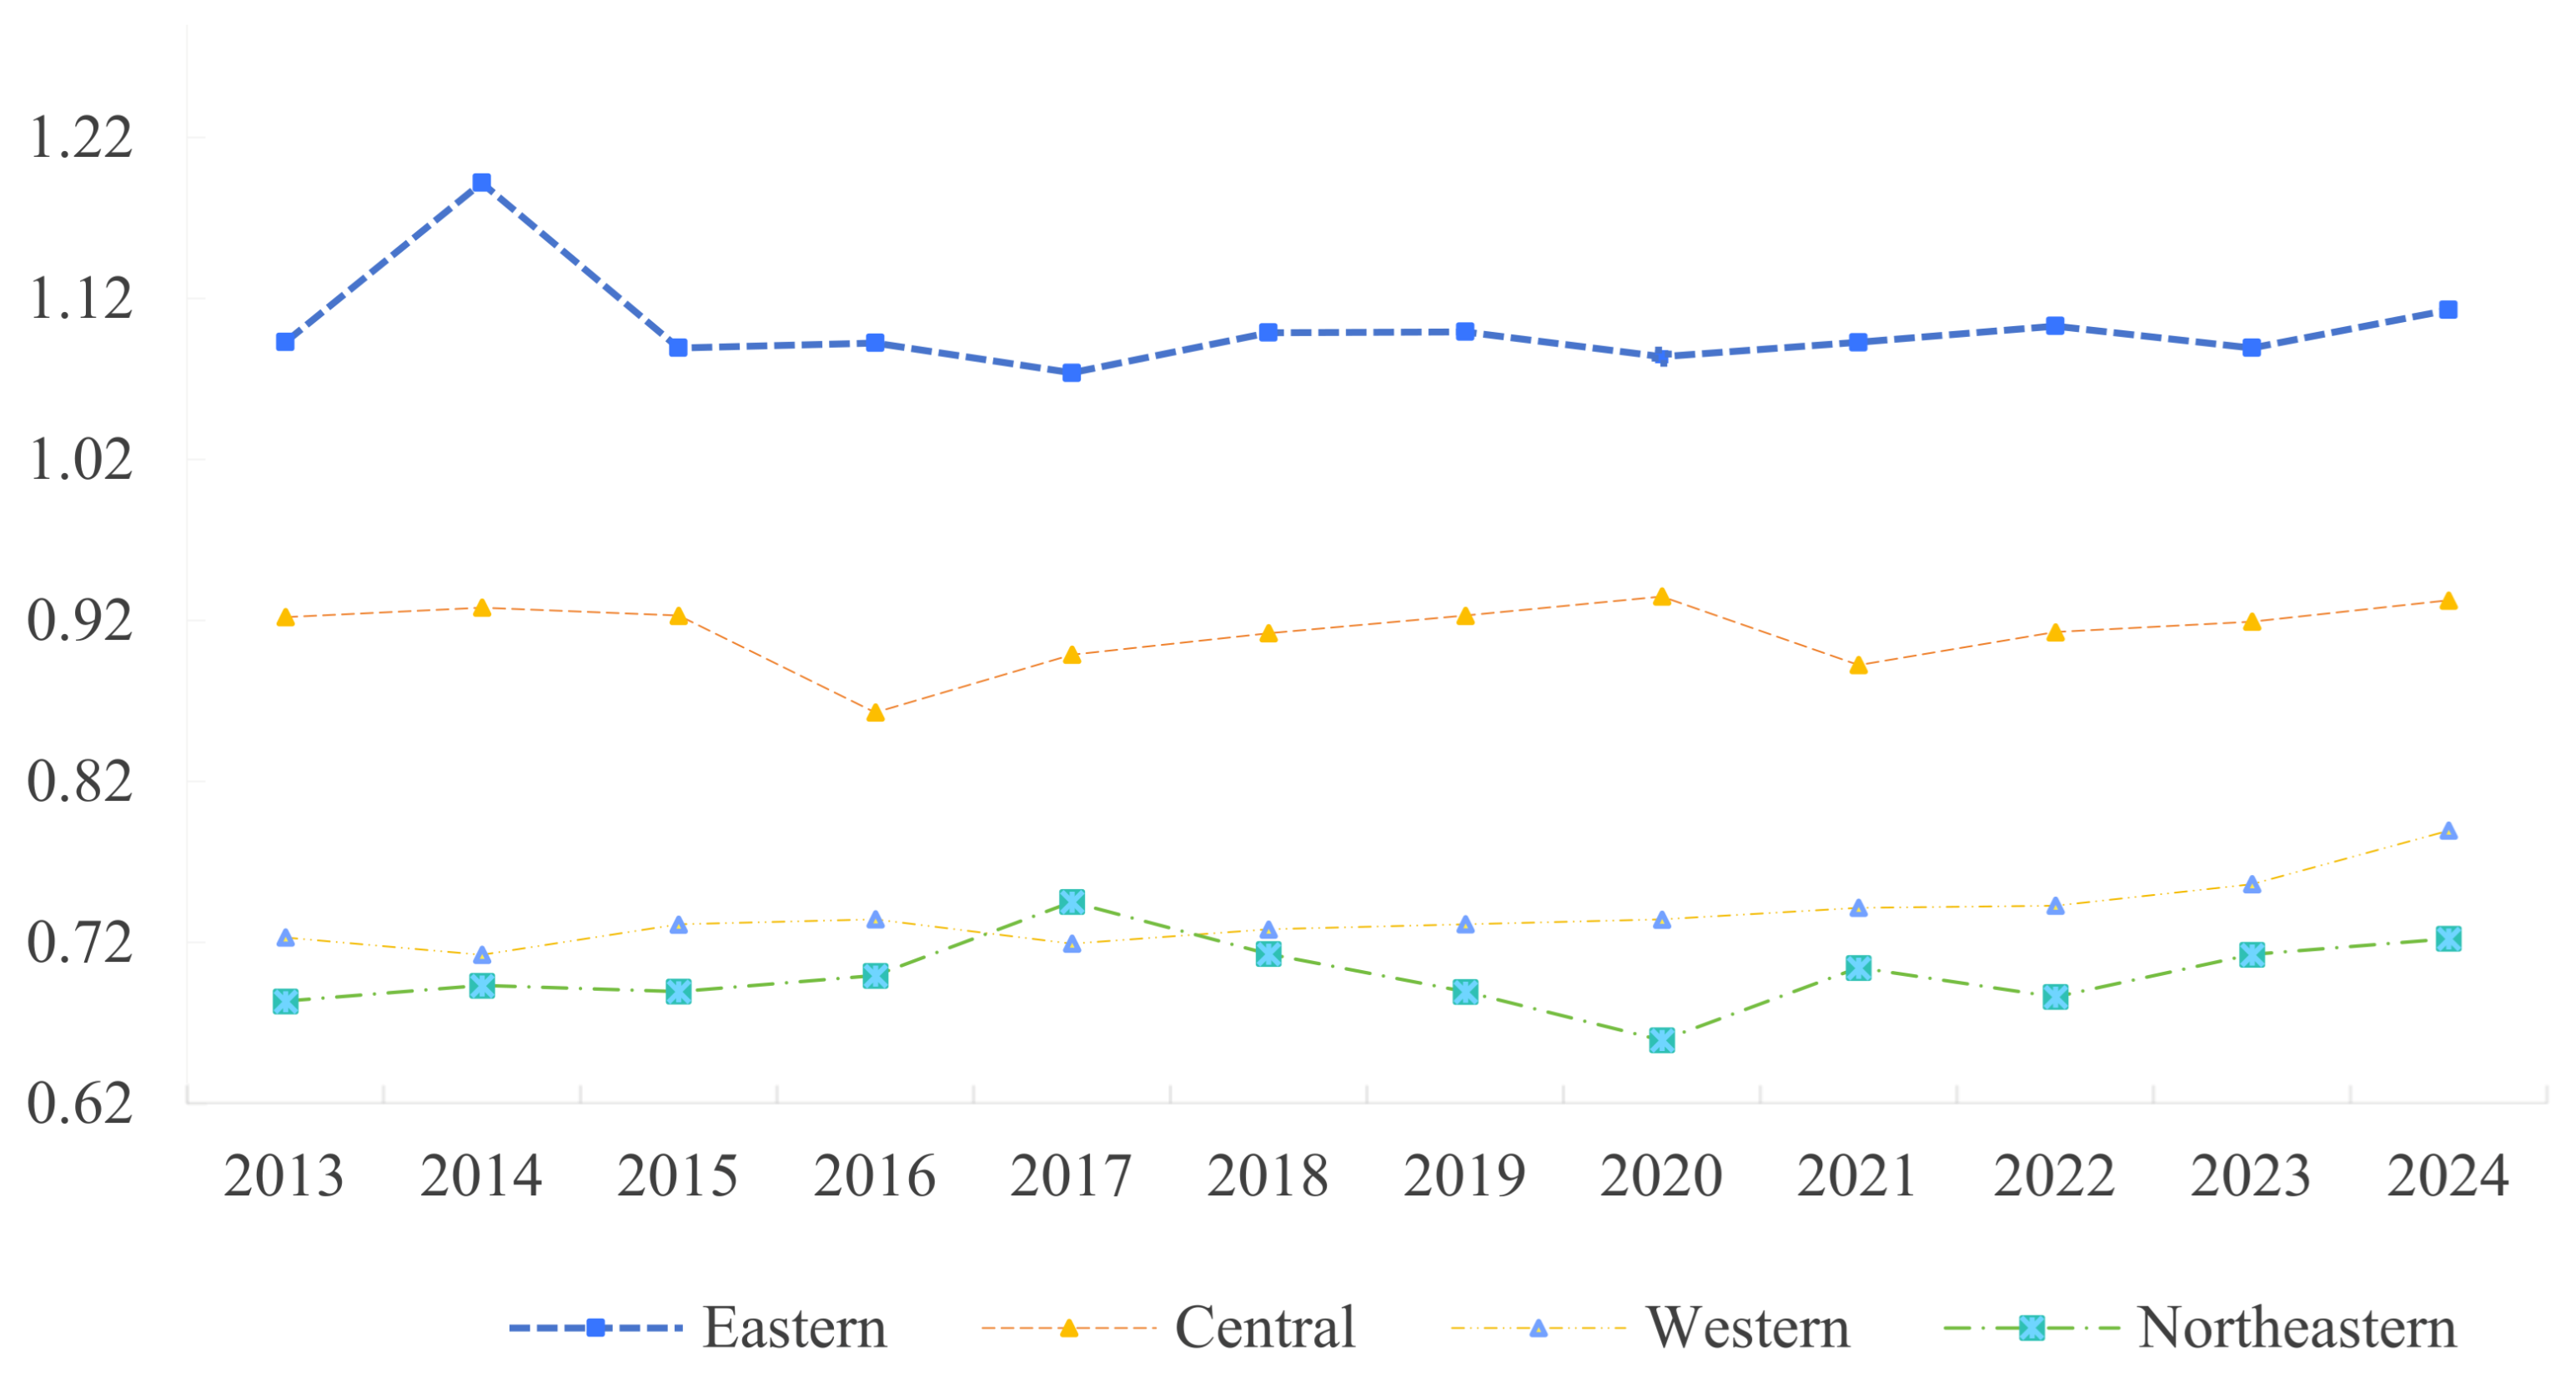
As shown in the
Figure 4, the eastern region, relying on its advanced scientific research capabilities and economic foundation, holds a first-mover advantage in the sustainable development of the energy industry. Its Gini coefficient has remained the highest for a long time, reaching a new peak in 2023. This indicates that although the east was the earliest to develop and has the strongest technology in the application of digital twin technology in energy, there are large internal disparities, possibly concentrated in first-tier cities such as Beijing, Shanghai, and Shenzhen, exhibiting an uneven agglomeration effect. The central region’s Gini coefficient shows an “inverted U-shaped” trend, suggesting that there was imbalance in the early stages of technology diffusion, but with strengthened regional coordination policies, the equity of technology diffusion has improved. The western region has consistently maintained a relatively low Gini coefficient, indicating that the overall digital twin technology level there is low, disparities are small, and there is no strong “head-city monopoly effect”, which decentralizes resources in a few major urban centers. The western region has benefited from multiple national strategies, such as the “Western Development Strategy” and regional digital infrastructure investments, which have promoted more balanced development across many second- and third-tier cities. This homogenization effect has helped narrow inter-city gaps and stabilized the overall distribution. The northeastern region started with a low Gini coefficient and showed little change overall, but experienced significant fluctuations between 2018 and 2021, especially with a slight increase after 2021. This was influenced by limitations in technological foundations and resource distribution, which have exacerbated regional development imbalances.
- (2)
Intra-group Gini Coefficient
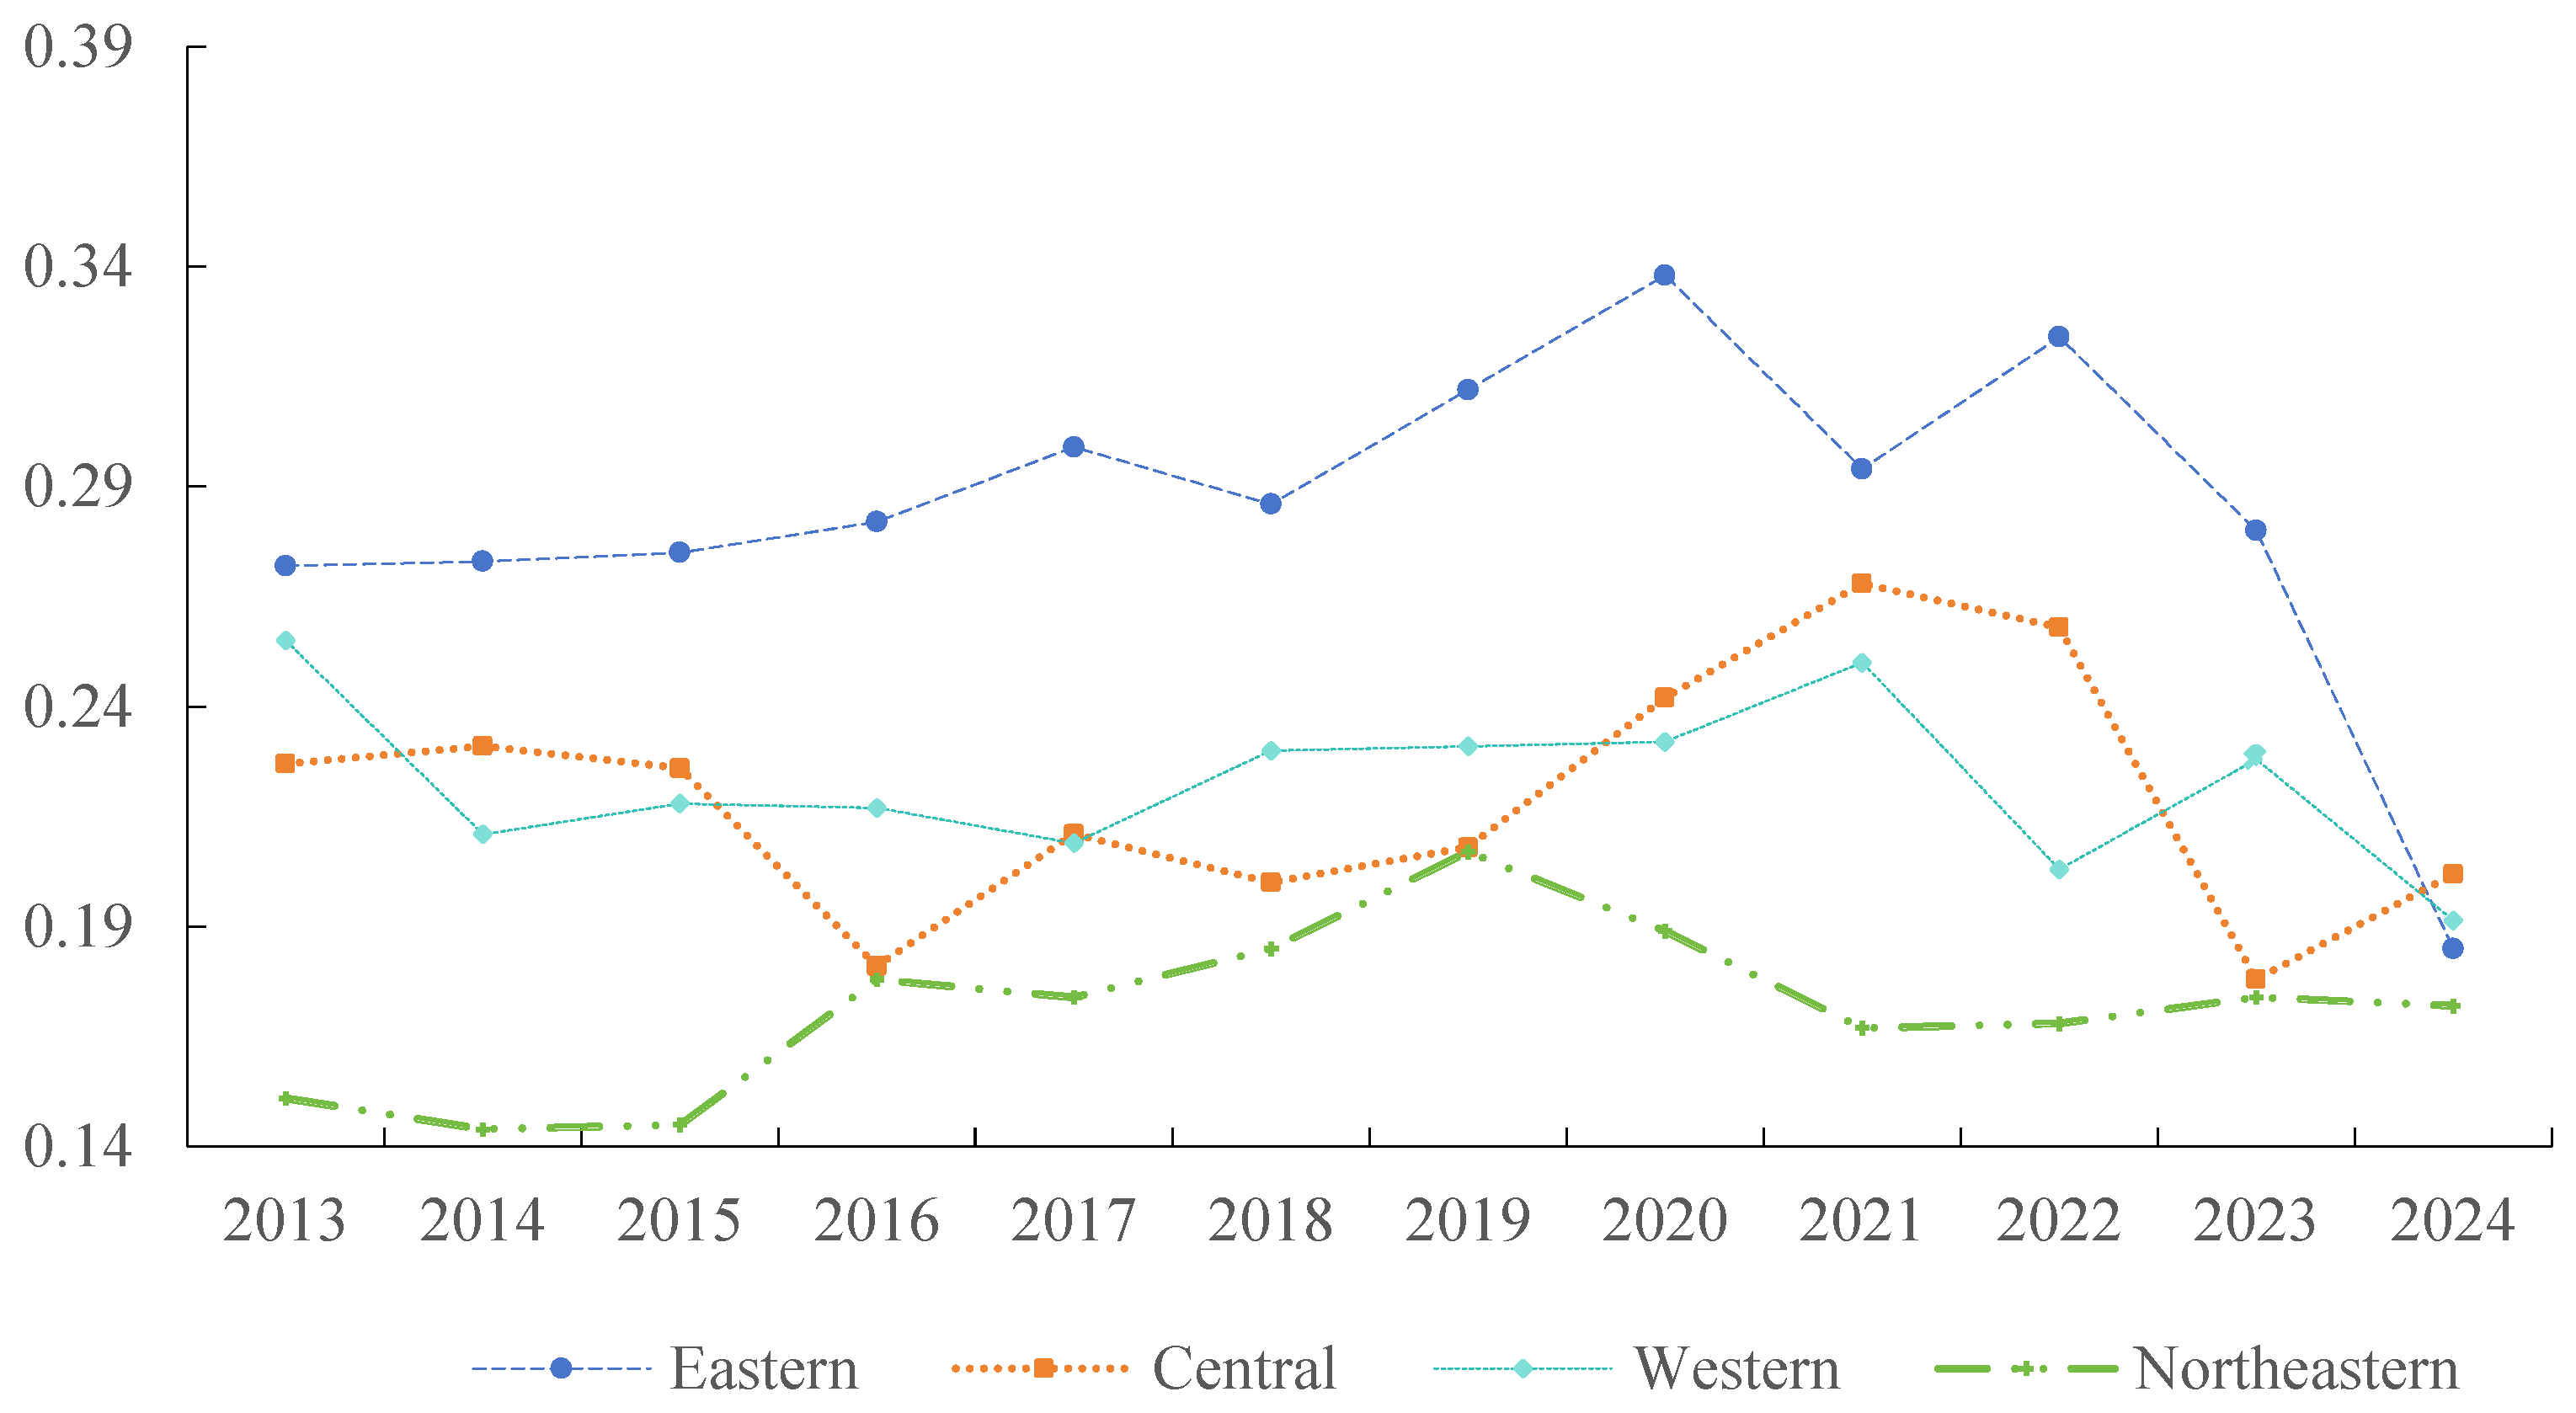
As shown in
Figure 5, in the eastern region, the diffusion of technology has shifted from “concentrated leadership” to “regional penetration”, showing a significant trend toward technological equality. From 2012 to 2019, the intra-group Gini coefficient showed an upward trend, with digital twin technology mainly concentrated in first-tier or provincial capital cities, reflecting a “Matthew effect” of digital twin technology in the sustainable development of the energy industry. From 2020 to 2023, the intra-group Gini coefficient rapidly declined, indicating accelerated diffusion of sustainable development in the energy industry and improved efficiency in resource allocation, likely driven by national policies such as the “dual carbon” goals. In the central region, technology diffusion lagged behind the east but a trend toward balanced development has emerged. From 2013 to 2021, the intra-group Gini coefficient rose slowly, indicating an increasing concentration effect of digital twin technology in the early stages of sustainable energy development. From 2022 to 2024, the intra-group Gini coefficient declined as digital twin technology began to spread to small and medium-sized cities, signaling the start of balanced development. In the western region, digital twin technology diffusion also lagged behind the east but a trend toward balanced development has appeared. The intra-group Gini coefficient remained relatively stable with a slight decline, indicating a low starting point for technology application. The diffusion of technology has been constrained by geographical and infrastructural factors and has not yet fully overcome regional barriers, but is gradually penetrating. The west is expected to become a key area for future support. “The 2023 China Digital Twin Industry Development Report” indicates that the application of digital twin technology in sectors such as energy, electricity, and manufacturing still demonstrates a regional pattern characterized by “pilot projects initiated in the eastern region, with gradual diffusion into the central and western regions”. Regional disparities remain pronounced, as the western region faces practical challenges such as high sunk costs and long return cycles for digital twin technology. “The 14th Five-Year Plan for the Development of the Digital Economy” (NDRC High-Tech [2021], No. 201) explicitly calls for “promoting the integration of digital technologies into key industries in the central and western regions” and encourages the adoption of intelligent technologies—such as digital twins—to support the smart transformation of infrastructure in areas such as energy and transportation. The western region is thus identified as a key area for focused policy support. In the northeastern region, the application of digital twin technology in the sustainable development of the energy industry faces a risk of “equal poverty”. Targeted policies are needed to enable leading cities to drive overall development. The Gini coefficient has remained low, with a slight increase after 2019, indicating low technology adoption in the early stages of sustainable energy development, followed by gradual progress but the emergence of new inequalities.
- (3)
Main Sources of Differences
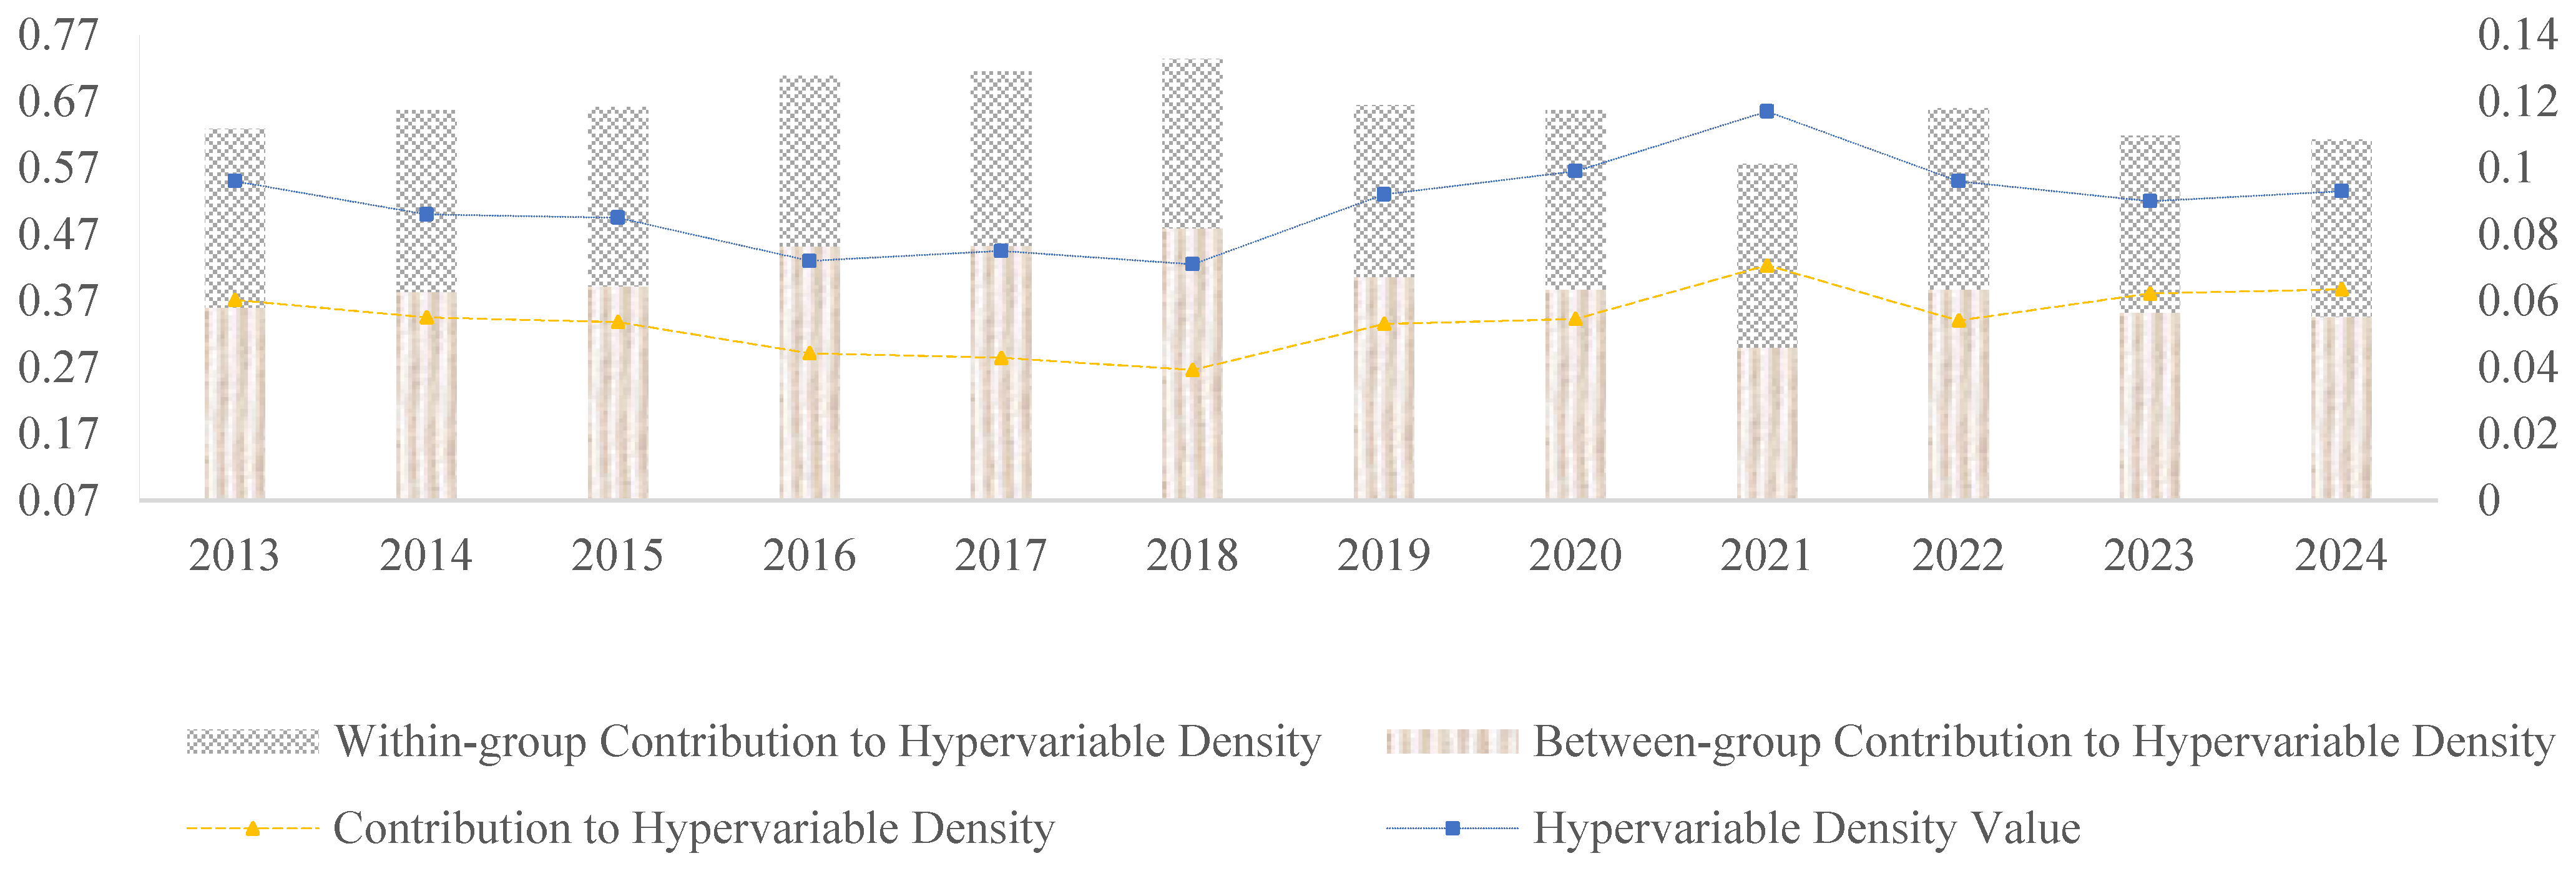
From
Figure 6, it can be seen that the inter-group Gini coefficient differences in the application of digital twin technology in the sustainable development of the energy industry have remained relatively stable with little fluctuation. Between 2017 and 2024, the contribution of inter-group differences consistently stayed around 0.30, indicating that structural regional disparities persisted with little change, which can be attributed to long-standing imbalances in economic development, digital infrastructure, and institutional capacity among the regions. The intra-group Gini coefficient differences for digital twin technology in the energy industry peaked between 2015 and 2017 (exceeding 0.30), reflecting significant disparities within groups, which are driven by uneven policy implementation and urban heterogeneity. There was a decline in 2020, indicating some alleviation of intra-group technological differences; this was because the effects of intensified national-level support and infrastructure investment temporarily narrowed these gaps. However, from 2021 onward, the intra-group Gini coefficient rose again, showing a fluctuating pattern. The contribution ratio of differences decreased year by year from 2013 to 2017, indicating a reduction in disparities. After 2018, it gradually increased, reaching a peak of about 0.07 in 2020, signaling an expansion of disparities again, followed by a period of steady fluctuations. This suggests that uneven usage in the sustainable development of the energy industry remains the norm. Between 2018 and 2020, digital twin technology entered an accelerated concentration phase, where core regions or main actors began to dominate its application, rapidly widening disparities, especially peaking in 2020. The period from 2021 to 2024 marks the phase of differentiation stabilization for digital twin technology. During this period, regional disparities in its application within the energy sector somewhat receded but remained at a relatively high level. The distribution of digital twin technology use in the energy field has not yet achieved full balance and still requires policy guidance or platform-sharing mechanisms to promote equitable diffusion. The lack of full convergence suggests that the diffusion of digital twin technology in the sustainable energy sector remains uneven, hindered by limited platform-sharing mechanisms, data standardization gaps, and varying regional capacities for technological adoption.
3.1.3. Dynamic Evolution
It can be seen form
Figure 7 that, from 2013 to 2024, the kernel density distributions of all regions exhibited dynamic changes, with the overall trend of sustainable development in the energy industry showing steady improvement. The color gradient in
Figure 7 represents the magnitude of energy efficiency optimization density, with warmer colors (e.g., yellow, green) indicating higher density values and cooler colors (e.g., blue) representing lower density areas. Between 2013 and 2016, the kernel density distributions fluctuated significantly but gradually stabilized in the later years. At the national level, the kernel density was initially concentrated in regions with lower levels of sustainable energy development. Over time, the areas with high kernel density gradually shifted toward regions with higher degrees of energy efficiency optimization. This indicates a steady nationwide improvement in energy efficiency, with the distribution increasingly concentrated in higher-efficiency intervals. Compared to other regions, the eastern region achieved a higher level of sustainable energy development earlier, with a relatively high kernel density. This suggests that the east began emphasizing sustainable energy development at an earlier stage. With the advancement of digital twin technology, the kernel density distribution of energy sustainability in the east has further shifted toward the high-efficiency range, with relatively small fluctuations—reflecting steady progress and relatively stable outcomes in sustainable energy development. In the western region, kernel density was concentrated in areas with lower levels of sustainable energy development, and the overall distribution skewed to the left. As digital twin technology matured, the kernel density curve gradually shifted to the right, indicating continual improvement in energy efficiency. However, compared to the east, the western region may face a lag in initial conditions and development speed, though it continues to make active progress. The central region’s kernel density distribution trend in sustainable energy development is similar to the national trend. With the ongoing maturation of digital twin technology, the shape of the energy efficiency kernel density curve changed more moderately, suggesting a relatively steady progression in sustainable energy development, though the extent of improvement may be less significant than in the eastern region. In the northeastern region, early kernel density was concentrated in the low-efficiency range and showed notable fluctuations between 2013 and 2016. After 2016, the kernel density curve gradually shifted to the right, indicating that the level of sustainable energy development in the northeast is also improving. However, the overall optimization process may be relatively slow, with certain challenges during implementation, resulting in a more gradual pace of change.
3.1.4. Spatial Convergence Test
- (1)
Stock Perspective: Convergence Test
There are significant differences in the application of digital twin technology for achieving sustainable development in the energy industry across different cities and regions. Does this disparity exhibit convergence? Can it trend toward equilibrium? This section uses the coefficient of variation to assess convergence characteristics and explores the spatial convergence trend of sustainable energy industry development from a stock perspective.
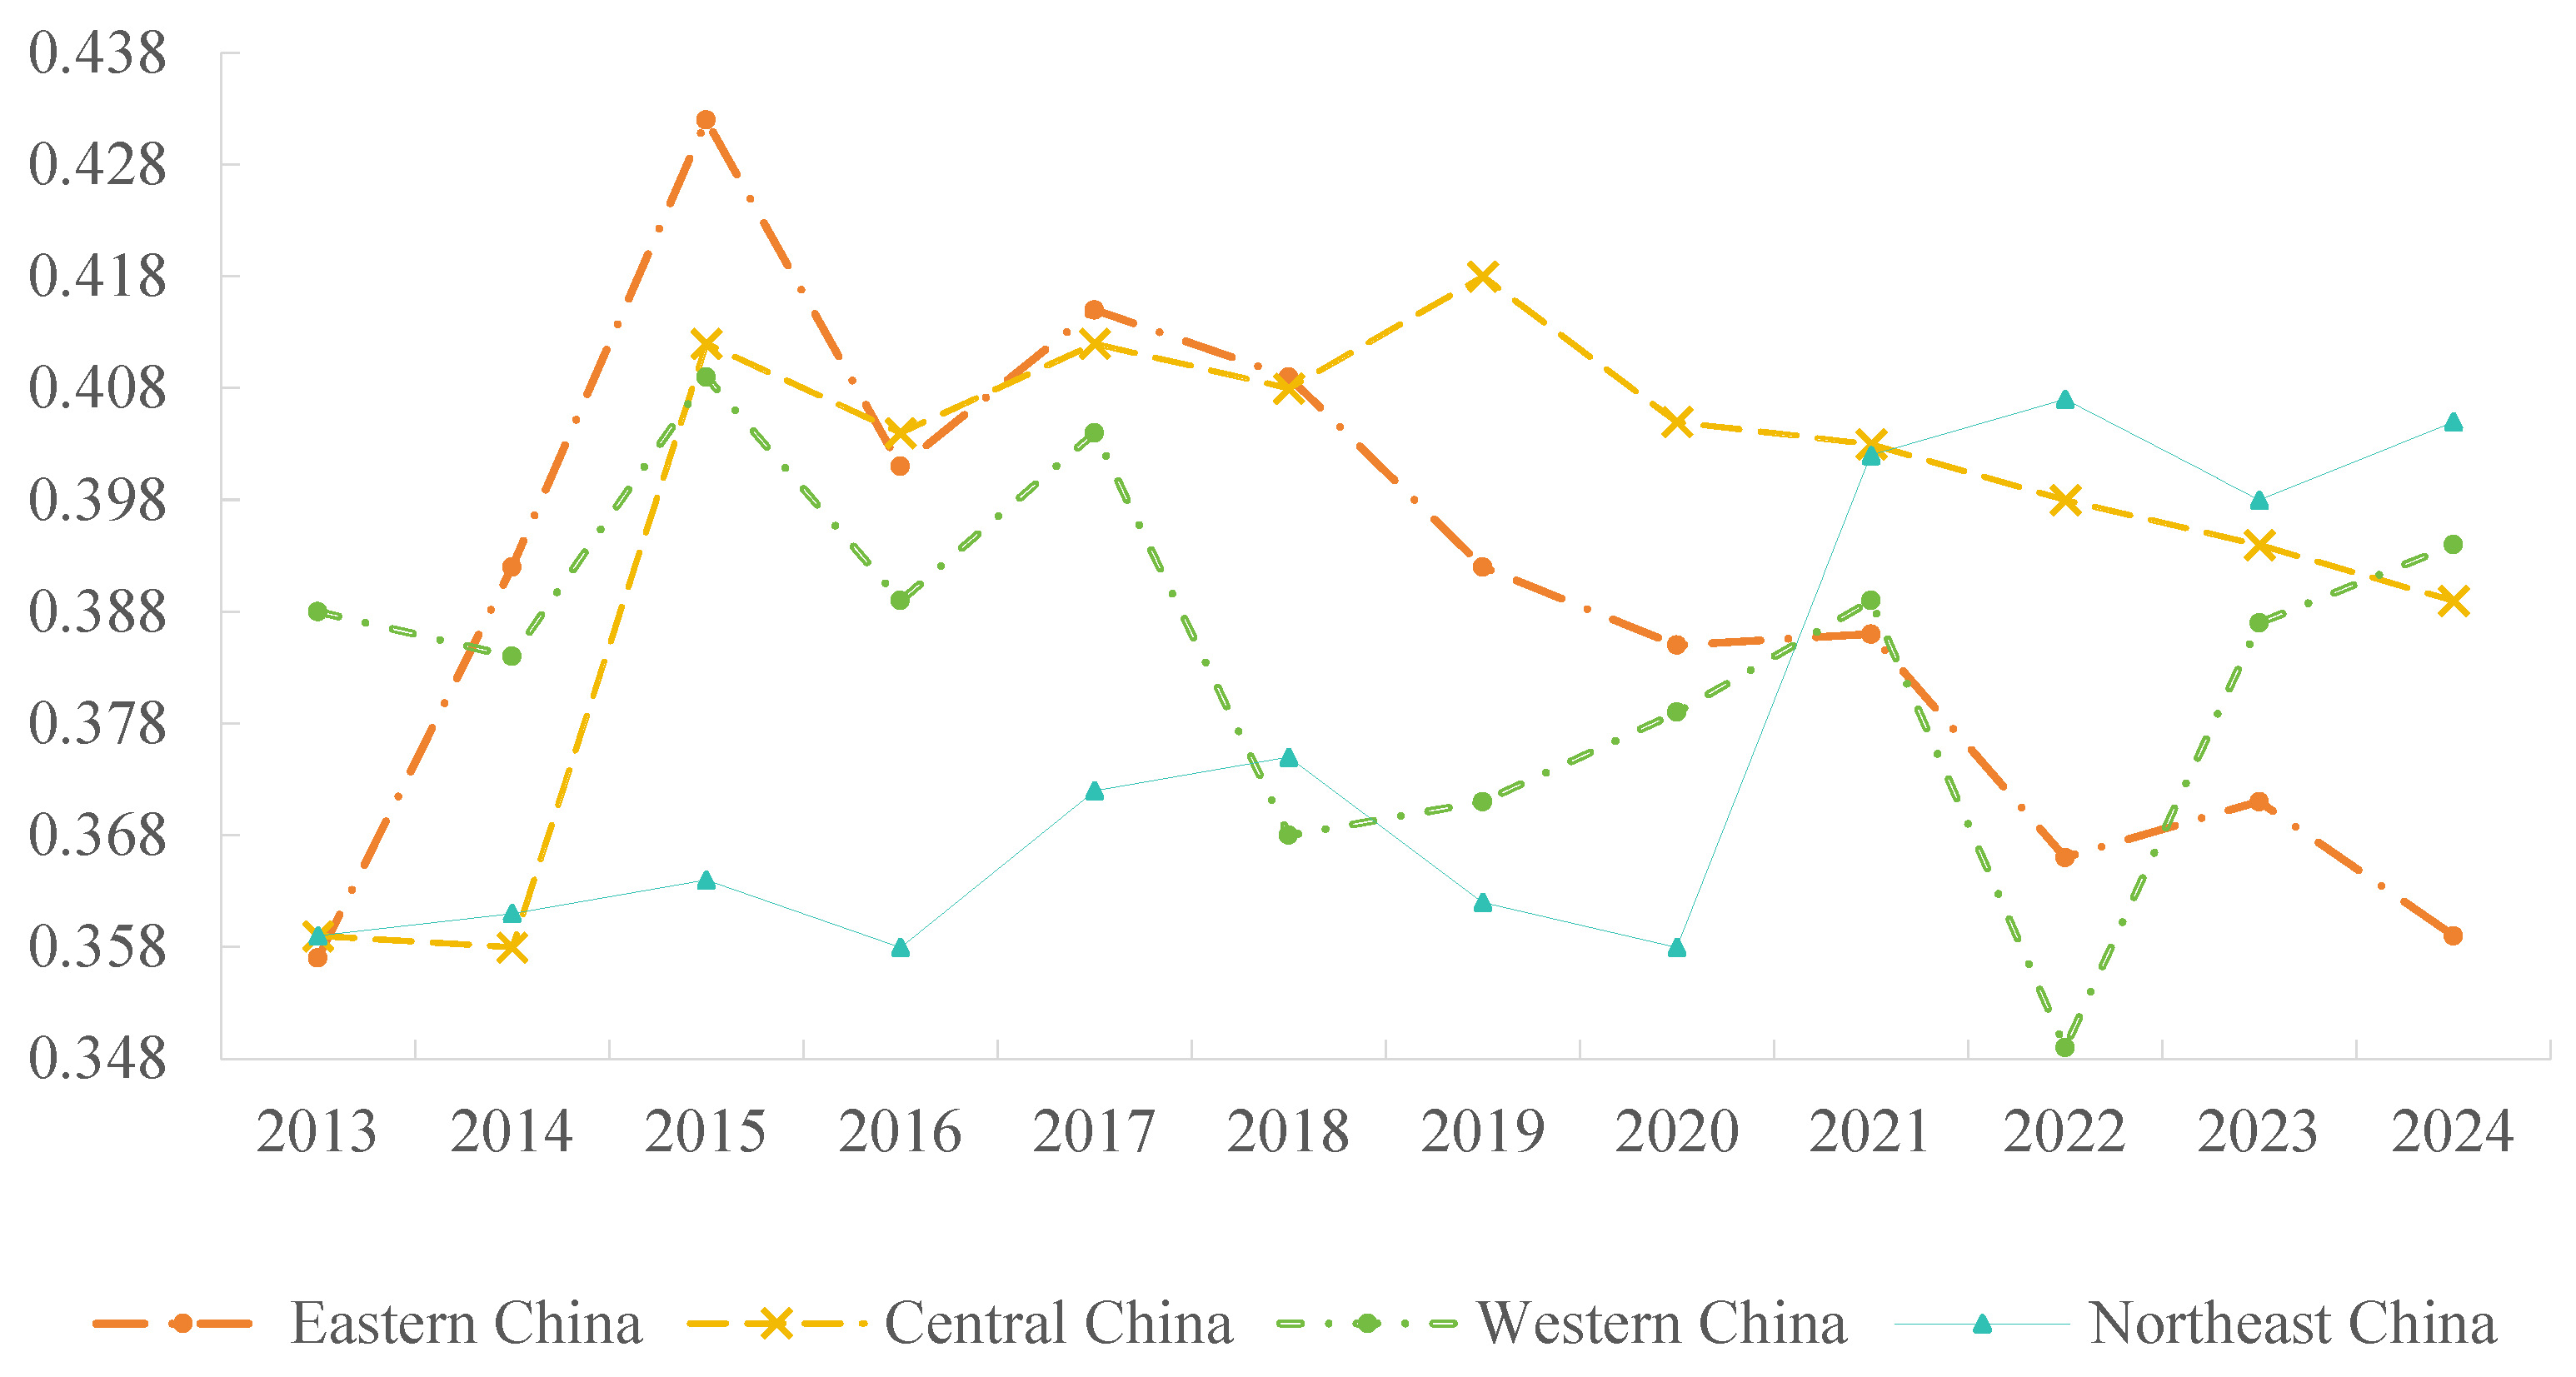
Specifically, as shown in
Figure 8, the index in the eastern region increased from 0.357 to 0.359, with a relatively small growth margin and values consistently below the national average, indicating that the improvement in sustainable energy industry development in the east has been relatively lagging. The central region’s index rose from 0.359 to 0.389, showing a more significant increase and gradually approaching the national average, suggesting faster progress in sustainable energy development. The western region’s index increased from 0.388 to 0.394, remaining below the national average, indicating that further efforts are needed to enhance sustainable development in the energy industry. The northeastern region’s index grew from 0.395 to 0.405, with a noticeable increase, reflecting substantial progress in sustainable energy industry development.
- (2)
Increment Perspective: Convergence Test
To explore the convergence trend of improvements in sustainable energy industry development across the country and the four major regions from an incremental perspective,
Table 5 presents the results of the absolute β-convergence test. To start with, the improvements in sustainable energy development at both the national and regional levels exhibit absolute β-convergence characteristics, with β coefficients significantly negative at the 1% confidence level. This indicates that, over time, the levels of sustainable energy development across the country and the four major regions will eventually converge toward the same steady state. Additionally, although the convergence speeds of sustainable energy development vary across the four regions, all are lower than the national level. What is more, there are spatial differences in the effects across the country and the four major regions. Specifically, at the national level, the explained variable shows a spatial lag effect, which is significantly positive at the 1% confidence level. This suggests that the sustainable energy development and its growth rate in one city are positively influenced by the spatial spillover effects from other cities. In the eastern region, the spatial lag coefficient of sustainable energy development is significantly positive at the 5% confidence level, indicating that the rate of improvement in sustainable energy development in this region tends to increase as the growth rates in surrounding regions rise. In contrast, the spatial lag coefficient in the central region is significantly negative at the 5% confidence level, indicating that the growth rate of sustainable energy development in the central region tends to decline as the growth rates in other regions increase.
Since conditional convergence only considers the initial value as the testing variable, it may deviate from the actual situation and thus affect the accuracy of the estimation results. Therefore, this section introduces multiple heterogeneity factors as control variables to further conduct the test.
Table 6 presents the results of the Conditional Convergence Test for the sustainable development of the energy industry nationwide and in the four major regions.
To begin with, the conditional convergence coefficients for the sustainable development of the energy industry at the national level and across the four major regions are all significantly negative at the 1% confidence level. This indicates that conditional convergence exists nationwide and in all four regions. In other words, even when accounting for regional heterogeneity factors such as economic development, fiscal pressure, industrial structure, openness to trade, fiscal decentralization, and attention to energy efficiency, the level of sustainable development in the energy industry continues to converge toward a steady state.
What is more, compared to the speed of absolute convergence, the convergence speed of sustainable development in the energy industry has accelerated under conditional convergence. Specifically, the national convergence speed increased to 0.0596%, and the order of convergence speeds among the four regions remains: eastern region > central region > northeastern region > western region.
Additionally, there are notable differences in spatial effects between the national level and the four regions. These differences are reflected not only in the magnitude of the coefficients but also in the type of spatial effects, which differ from those under absolute convergence. Specifically, the spatial lag coefficient for the national energy industry’s sustainable development remains significantly positive at the 1% confidence level, indicating that improvements in some provinces’ energy sustainability levels can accelerate the overall convergence process. Moreover, for the eastern and central regions, the spatial lag coefficients are also significantly positive at the 1% level, suggesting that there are positive spatial spillover effects in the sustainable development of the energy industry within these regions.
In addition, after incorporating multiple control variables for the conditional convergence analysis, both the R2 values and log-likelihood statistics for the national and regional models improve significantly compared to the absolute convergence models. This strongly supports the validity and effectiveness of the selected control variables. From a statistical perspective, the influencing factors of energy industry sustainable development vary significantly across the country and regions. Specifically, economic development accelerates the convergence of sustainable development in the energy industry both nationally and regionally; fiscal pressure significantly hinders convergence in the eastern and northeastern regions; and industrial structure has a significantly negative impact on sustainable development in the eastern region.
3.2. Analysis of the Input Effects of Digital Twin Technology on the Sustainable Development of the Energy Industry
Digital twin technology has a significant impact on the sustainable development of the energy industry. A high level of attention to digital twin technology encourages governments to allocate more funding to energy-related projects, providing strong financial support for energy development. As governments place greater emphasis on the development of digital twin technology, they introduce a series of talent-attracting policies aimed at drawing professionals in the digital twin field into the energy industry [
25]. As a complex system integrating physical models, simulation computing, big data, and artificial intelligence, the development trajectory of digital twin technology closely follows the S-shaped diffusion curve typical of technological innovation. Its early-stage accumulation and breakthroughs must rely on scientific and technological investment. Therefore, government funding for science and technology can be used as an indicator to measure the intensity of digital twin-related technological investment. The increased attention from the government also accelerates the formulation and improvement of laws, regulations, and standards related to energy infrastructure, ensuring that the development of urban digital twin technologies operates within a legal framework. This helps safeguard data security, personal privacy, and the safe and stable operation of cities [
26]. Emerging fields such as digital twin technology, intelligent power dispatch, carbon monitoring, and smart energy storage are experiencing a surge in demand for specialized talent. The traditional education system urgently needs to update its curriculum content, faculty configuration, and teaching methods through government investment to meet the requirements of the green digital era. Therefore, government educational investment can be used as an indicator to measure Government Investment in Digital Education Development. By enhancing the focus on digital twin technology, the government can effectively promote data sharing and collaboration across different sectors of the energy industry, break down data silos, and eliminate information barriers. This enables various fields within energy development to make decisions and deliver services based on comprehensive and accurate data, thereby improving the operational efficiency and management capacity of cities [
27]. Government intervention mechanisms are the key leverage for the widespread promotion and application of digital twin technology from isolated cases to broad implementation. The stronger the institutional intervention, the more favorable the political and institutional environment for the operation of digital twin systems, enhancing the technology’s sustainability. A high degree of digital intervention indicates good coupling between technology and institutions, which facilitates the deep integration of digital twin technology in the energy sector. Therefore, the level of government intervention can be used as an indicator to measure the maturity of multi-stakeholder collaborative governance of digital twin systems in sustainable energy development.
From the perspectives of technological innovation theory and industrial upgrading theory, investment in digital twin technology serves as a core driving force for the sustainable development of the energy industry. Continuous innovation and the integrated application of digital twin technologies provide strong technical support for energy sector growth [
28]. Investment by enterprises and research institutions in the research and development of digital twin technologies fosters breakthroughs and innovations in key technologies [
29]. The development of digital twin technology is crucial for energy data collection. By capturing changes in energy indicators in real time and with high precision, it offers robust data support for sustainability efforts in the energy sector [
30]. Digital twin technology relies on the extensive collection, transmission, processing, and feedback of real-time data. Among these, internet infrastructure is a critical supporting condition. A broad base of internet users reflects strong terminal access capabilities, providing the foundation for deploying user-side sensors (such as home electricity meters and energy usage behavior analysis devices). User terminals within digital twin systems—such as smart electricity usage platforms, carbon footprint visualization platforms, and energy consumption apps—require a large number of connected users for operation and feedback. Whether users have basic internet access capabilities determines if they can connect to energy digital service systems, thereby forming a closed loop of “digital twin–user behavior–energy feedback”, where digital twin systems monitor and simulate user behavior, analyze its impact on energy consumption, and provide real-time feedback to optimize energy use. Therefore, the number of internet users per 100 people and the number of mobile phone users per 100 people can be used as key indicators to measure the role of digital twin technology in sustainable energy development. Digital twin technology is a complex system integrating physical modeling, real-time simulation, data fusion, artificial intelligence, and interactive visualization [
31]. It is essentially a highly software-intensive and computation-driven technology platform. For energy sub-sectors such as electricity, coal, and natural gas, customized twin systems need to be developed, which must rely heavily on software engineering talent with interdisciplinary backgrounds. A higher proportion of employees in the computer services and software industry indicates a stronger “human resource foundation” for the technological reserves required by digital twin technology in a region [
32]. Based on this, the proportion of employees in the computer services and software industry can serve as an indicator to measure the level of technical talent support for the development of digital twin technology.
The emergence of digital twin technology has significantly enhanced communication speeds between different devices in the energy industry [
33]. This facilitates the use of big data and artificial intelligence to deeply analyze vast amounts of urban energy operation data, enabling predictive analysis of urban development trends and the proactive formulation of corresponding policies and measures [
34]. In turn, it provides intelligent assistance in urban management and decision-making processes. Based on the above theories, an input indicator system for digital twin technology will be established. The above indicators are sourced from the
China City Statistical Yearbook (2013–2024), government work reports, and other related documents.
From the perspectives of technological innovation theory and industrial upgrading theory, investment in digital twin technology serves as a core driving force for the sustainable development of the energy industry. Continuous innovation and the integrated application of digital twin technologies provide strong technical support for energy sector growth [
35]. Investment by enterprises and research institutions in the research and development of digital twin technologies fosters breakthroughs and innovations in key technologies [
36]. The development of digital twin technology is crucial for energy data collection. By capturing changes in energy indicators in real time and with high precision, it offers robust data support for sustainability efforts in the energy sector [
37]. The emergence of digital twin technology has significantly enhanced communication speeds between different devices in the energy industry. This facilitates the use of big data and artificial intelligence to deeply analyze vast amounts of urban energy operation data, enabling predictive analysis of urban development trends and the proactive formulation of corresponding policies and measures. In turn, it provides intelligent assistance in urban management and decision-making processes [
38]. Based on the above theories, an input indicator system for digital twin technology will be established.
Based on the digital twin technology investment index system established in
Table 7, the global entropy method was used to analyze the investment in digital twin technology across various regions in China from 2013 to 2024. Data sources are shown in
Appendix A. The results for the indicators are shown in
Figure 9.
As shown in
Figure 9, PA exhibits an overall upward trend with fluctuations. From 2014 to 2017, PA in early-stage digital twin technology experienced some volatility but gradually stabilized thereafter. As a result, policy investment shows a slight decline followed by a slow recovery. Between 2013 and 2024, TA fluctuated more dramatically than policy investment, reflecting a certain degree of instability. Overall, PA remained higher than technological innovation, highlighting the critical role of government funding in the development of digital twin technology. The introduction of national policies supporting the development of digital twin technology has promoted its advancement and laid a technological foundation for the development of the energy sector.
3.2.1. Spatial Distribution of Digital Twin Technology: From “Fragmented Upgrading” to “Integrated Synergy”
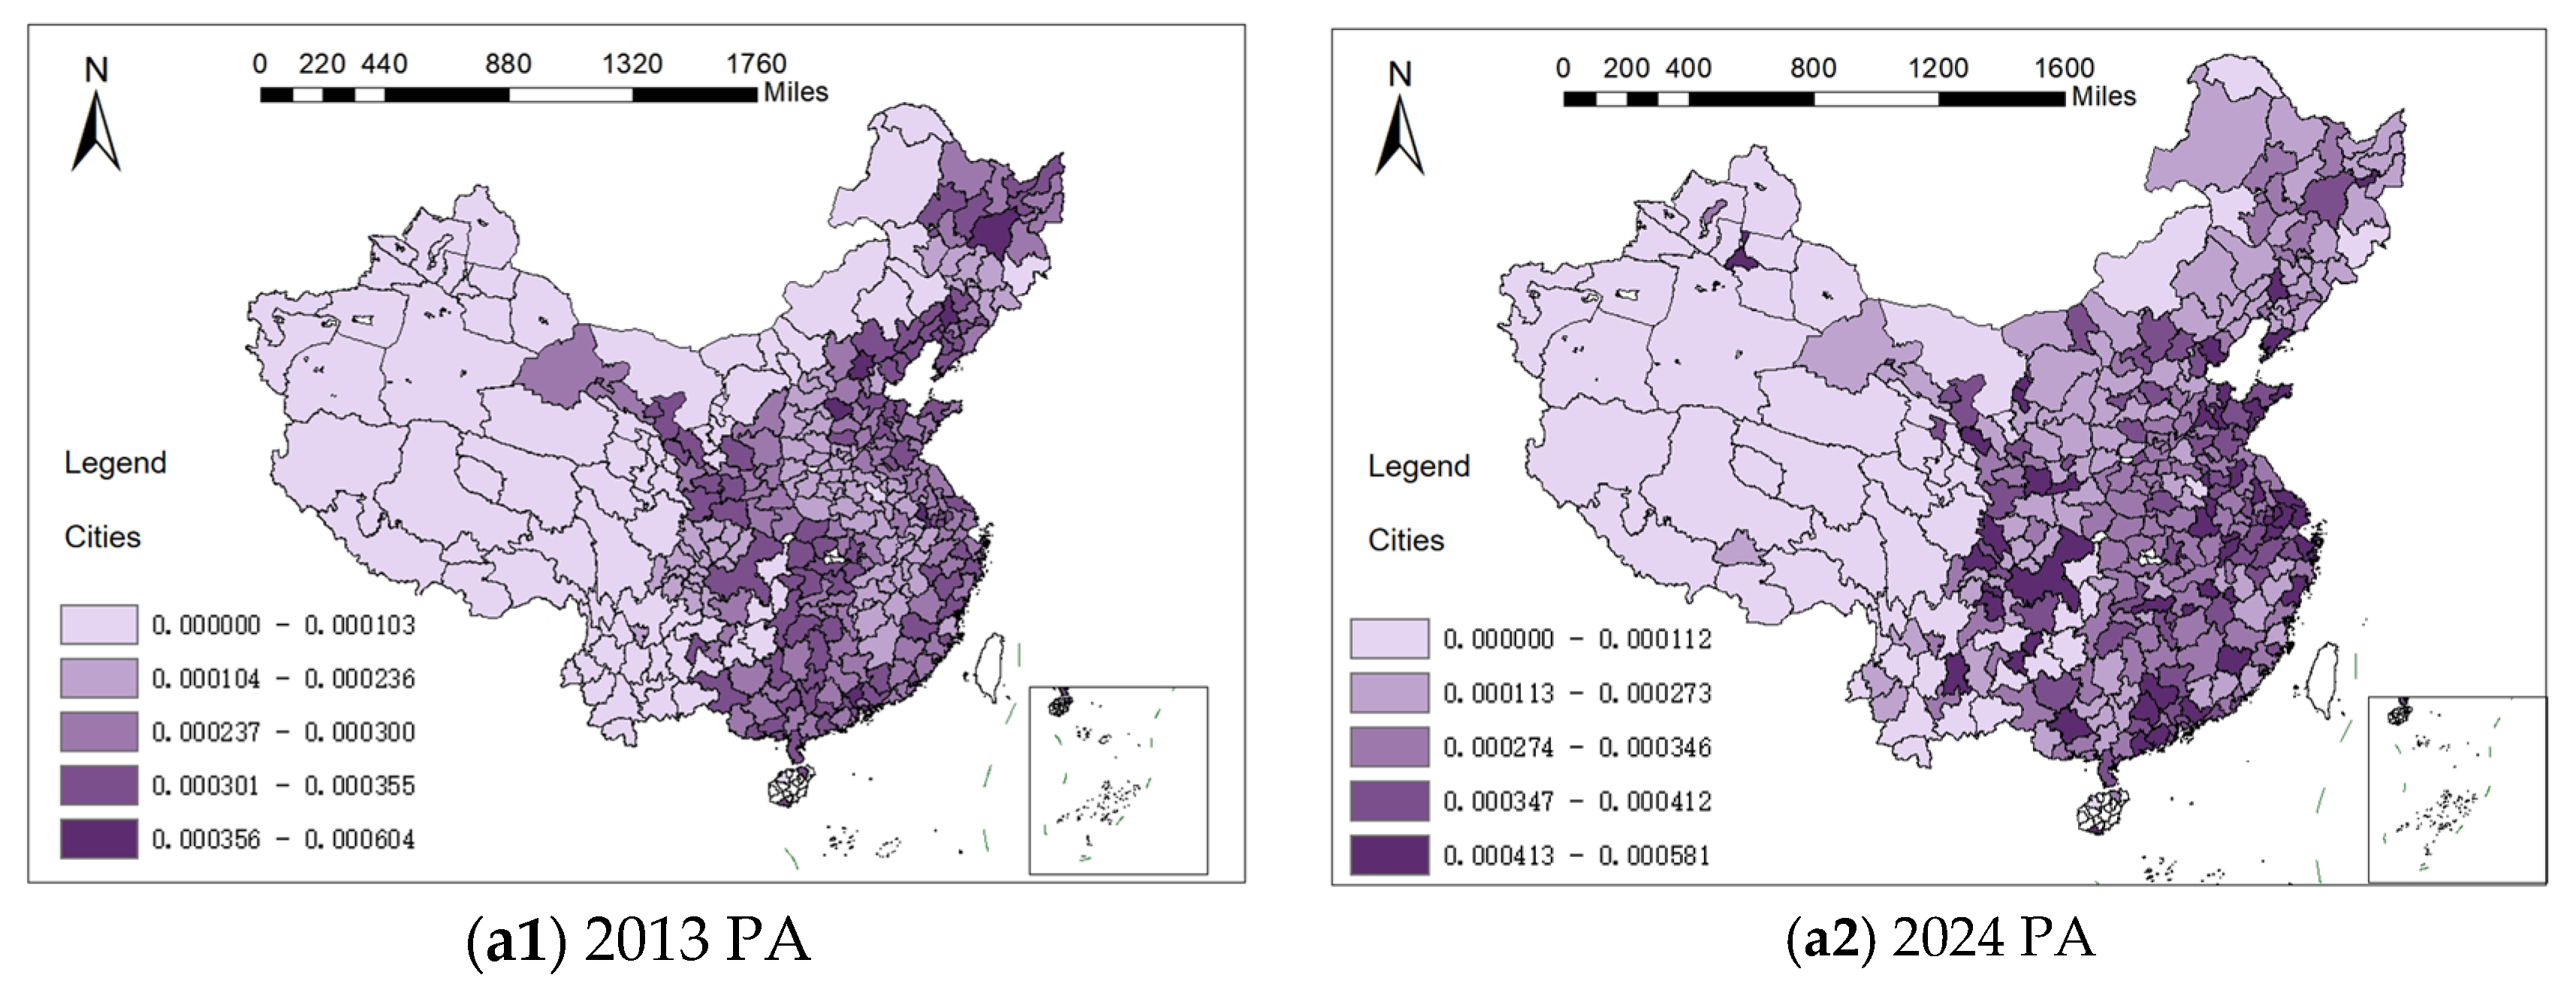
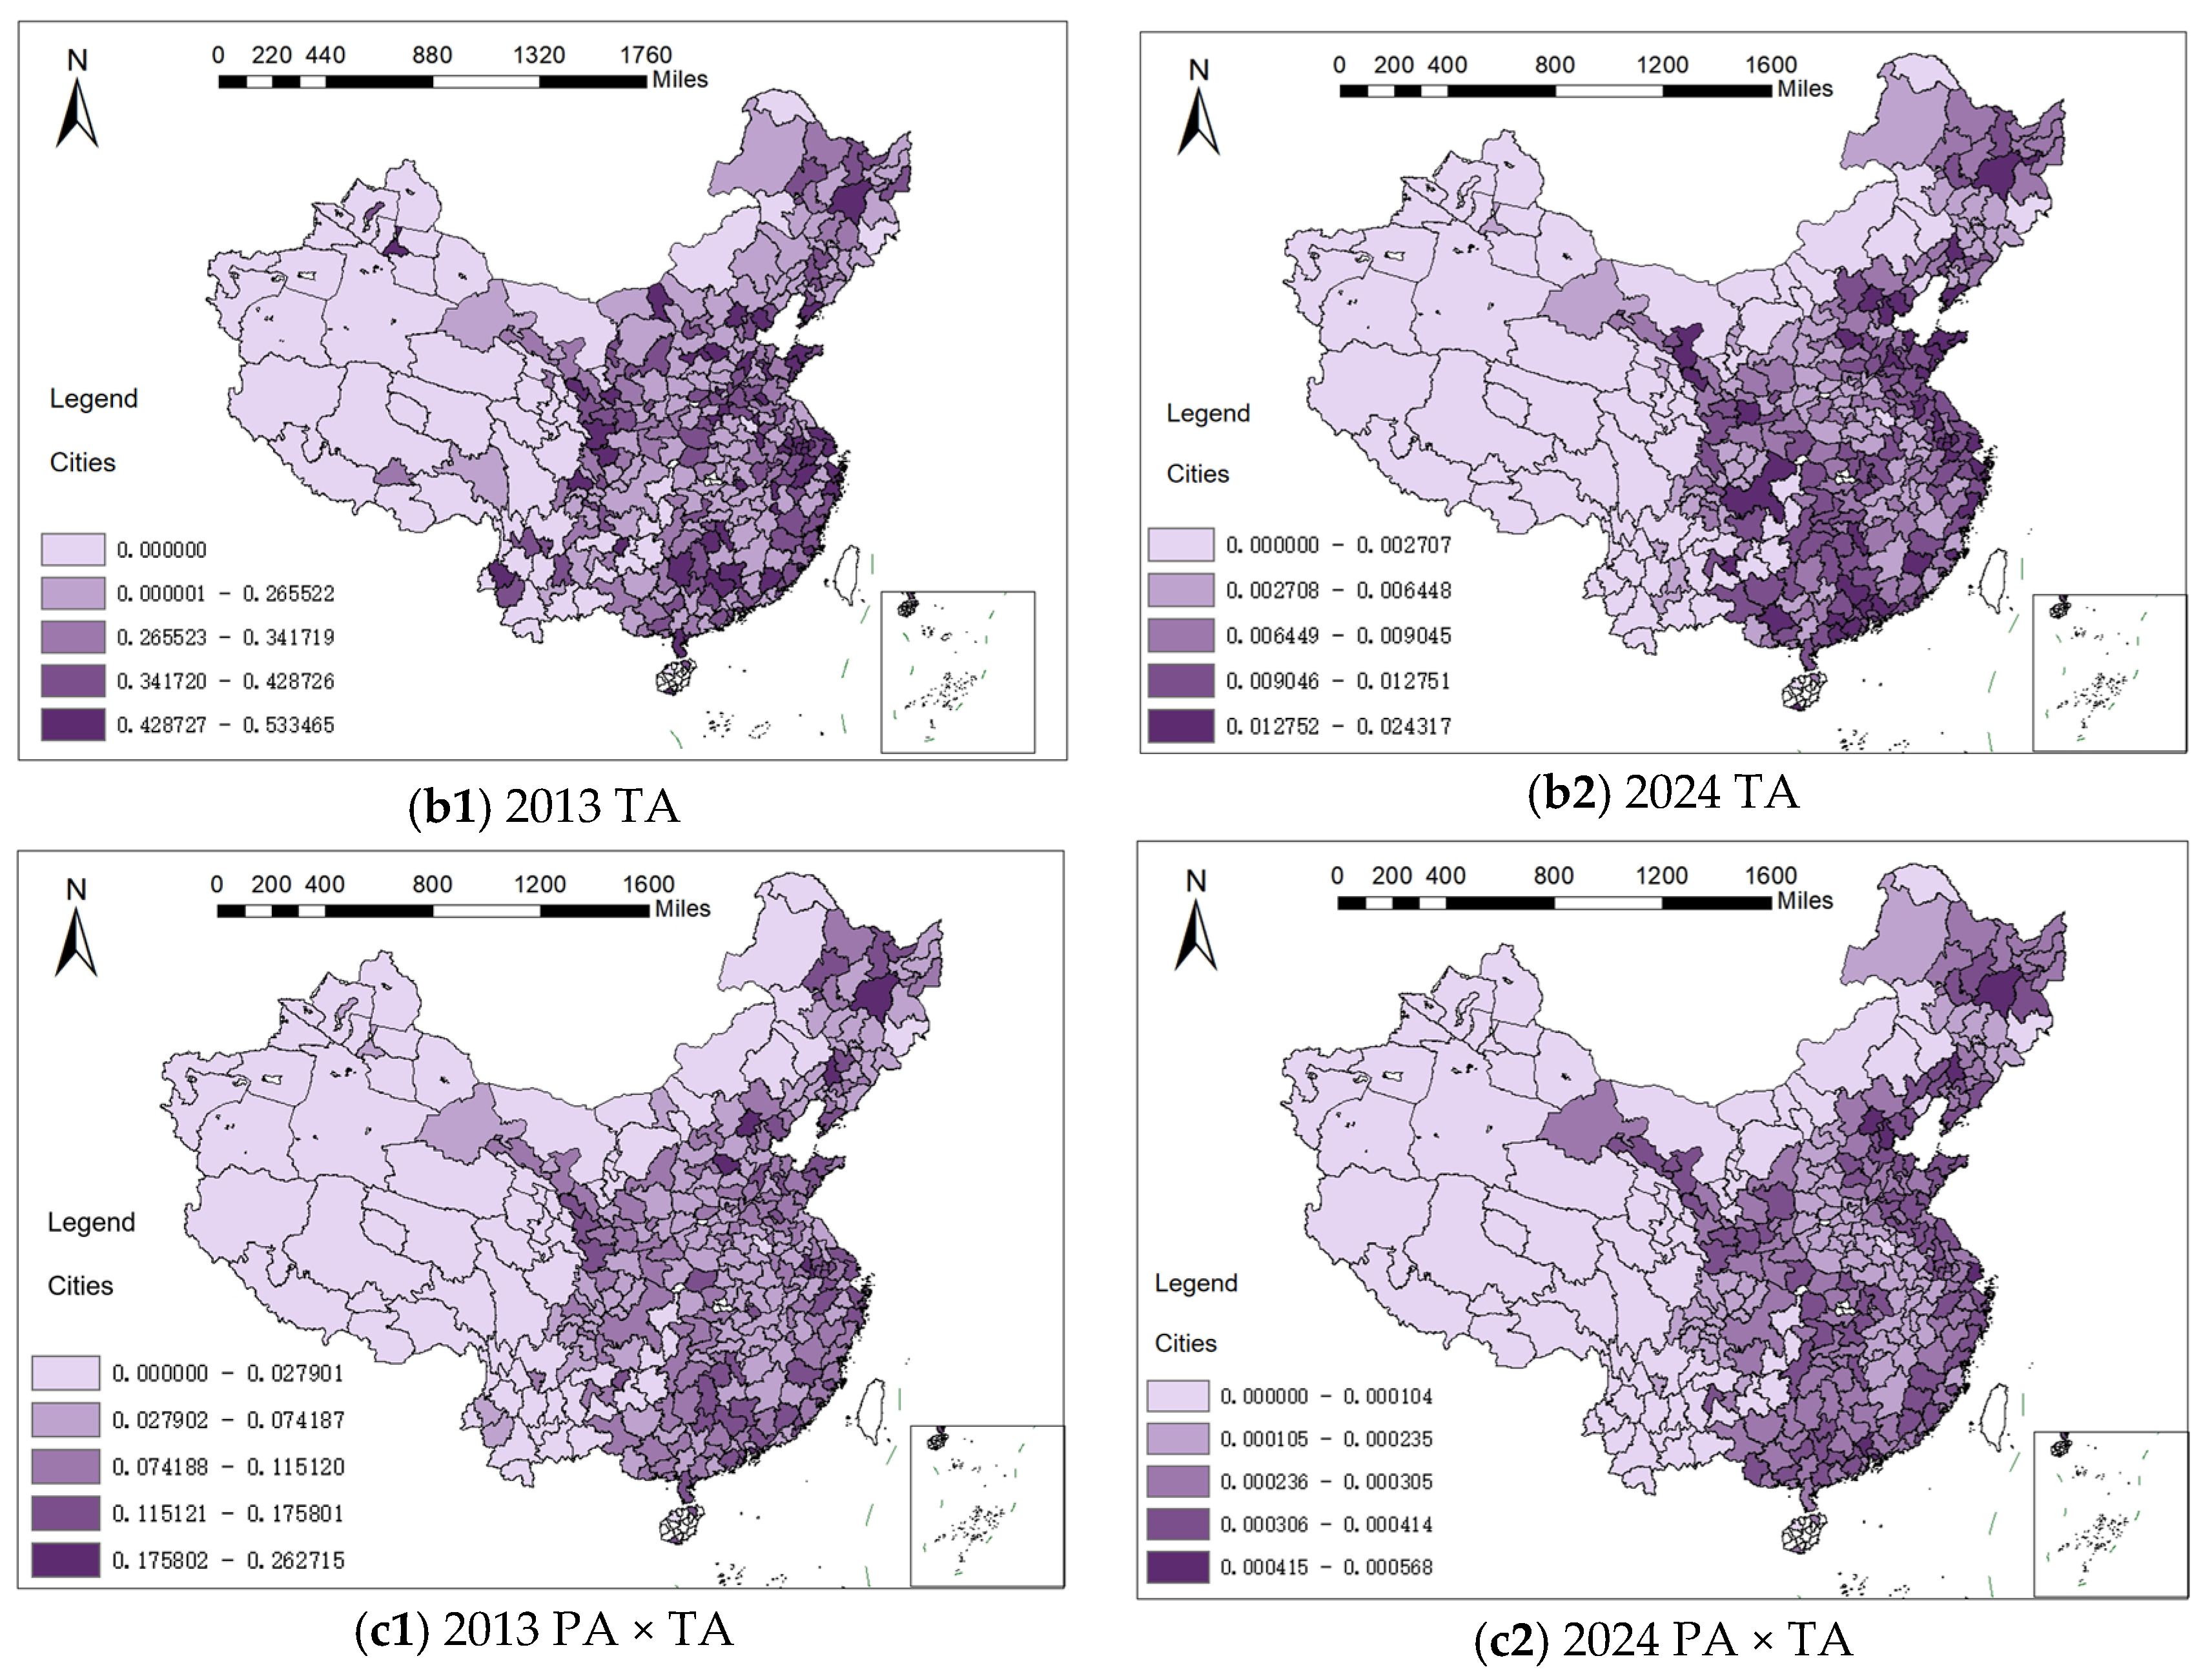
To analyze the spatial differentiation characteristics of digital twin technology and its subsystems in China, this study employed the Natural Breaks (Jenks) Classification and Equal Interval Stratification methods in ArcGIS to classify the composite index of digital twin technology input factors by gradient. A comparison of the spatiotemporal patterns was conducted between the base year (2013) and the end of the study period (2024), as shown in
Figure 10.
Figure 10(a1,a2) illustrates the changing trend of policy support for digital twin technology. It is evident that cities with significant policy investment effects are mainly concentrated in the eastern coastal regions. In economically advanced areas such as the Yangtze River Delta, the Pearl River Delta, and the Beijing–Tianjin–Hebei region, policy support for digital twin technology is more pronounced.
Figure 10(b1,b2) shows the changing trend of technological innovation in digital twin technology. The figure indicates that the investment effects in digital twin technology are relatively limited in central and western regions, especially in remote western areas. Due to lower levels of economic development and weaker technological foundations, these regions exhibit weaker innovation effects. Cities with the highest levels of digital twin innovation include Shanghai, Beijing, Shenzhen, Hangzhou, and Guangzhou—cities that are not only China’s centers of technological innovation but also key hubs for the digital twin industry. Inland provincial capitals such as Wuhan, Chengdu, and Xi’an also demonstrate relatively high levels of digital twin technology development, reflecting efforts in digital transformation in the central and western regions.
Figure 10(c1,c2) presents the evolution of the coupling effect between policy investment and technological innovation in digital twin technology. From 2013 to 2024, the overall level of digital twin development has increased nationwide. In particular, provinces in the central region—Henan, Hubei, and Hunan—show a deepening of color in the figures over time, indicating an enhancement in digital twin technology development efforts. The eastern coastal regions continue to maintain a leading position, with signs of a diffusion effect emerging to surrounding areas.
3.2.2. Distribution of the Dagum Gini Coefficient
When exploring the spatial differentiation structure and sources of variation in digital twin technology investment levels, the Dagum Gini coefficient presents certain limitations in characterizing regional development dynamics. Therefore, this study introduces the kernel density estimation (KDE) method to analyze the evolution patterns of digital twin technology investment from 2013 to 2024 across the country and within the four major regions. The analysis focuses on the spectral shift, primary mode, tail extension, and multimodal characteristics of the density surfaces (see
Figure 11). The color gradient ranging from blue to red reflects the magnitude of kernel density estimates, where warmer colors (e.g., red) denote regions with higher probability density concentrations.
Figure 11a illustrates the spatiotemporal development trajectory of digital twin technology investment levels across 281 sample cities. The kernel density distribution surface exhibits a consistently right-skewed unimodal structure, indicating a relatively concentrated level of investment in digital twin technology and reflecting a general upward trend over time. Although the peak of the curve shows no significant change, its width increases, suggesting a gradual widening of disparities in investment levels. The pronounced tailing on the right side of the curve indicates substantial differences in digital twin investment levels among cities. The progressive extension of the distribution’s right wing demonstrates the growing advantage of high-gradient urban clusters.
Figure 11b–d depict the dynamic trajectories of digital twin technology investment in the eastern, central, western, and northeastern regions, respectively. The central positions of the kernel density curves show little fluctuation, reflecting relatively slow improvement in digital twin investment within each region. At the same time, the trend of uneven investment distribution continues to intensify, highlighting persistent imbalances. This pattern of spectral evolution reveals that significant disparities in digital twin technology investment persist across regions, suggesting that achieving balanced regional development remains a long-term challenge.
- (1)
Intra-Regional Differences
As shown in
Figure 12, due to the significant investment gap between economically developed and less developed areas, the eastern region has the highest Gini coefficient for digital twin technology investment, indicating the greatest imbalance. In the central region, the development of digital twin technology is influenced by industrial development directions and government policies. The Gini coefficient shows a slight increase, reflecting a growing trend of investment concentration. In the western region, affected by policy support and infrastructure investment, the investment level in digital twin technology reached its lowest point in 2015 and gradually recovered thereafter. This indicates that investment balance in the digital twin industry first deteriorated and then improved. The northeastern region has maintained relatively balanced investment in digital twin technology, with a relatively stable Dagum Gini coefficient, suggesting no significant trend of either concentration or dispersion in investment levels.
- (2)
Inter-Regional Differences
According to
Figure 13, there is a significant difference in the average values of the inter-regional Gini coefficients, ranked as follows: eastern region > central region > western region > northeastern region. Regarding the annual changes in inter-regional differences, in 2013, the inter-regional disparities nationwide, as well as between the eastern and northeastern regions, reached their peak. This indicates a lack of coordination in digital twin technology investment levels across regions, further exacerbating regional imbalances. In contrast, the inter-regional differences between the western and central regions remained relatively stable, reflecting a slower and more consistent pace of development in digital twin technology investment in these two regions, with smaller gaps between them.
- (3)
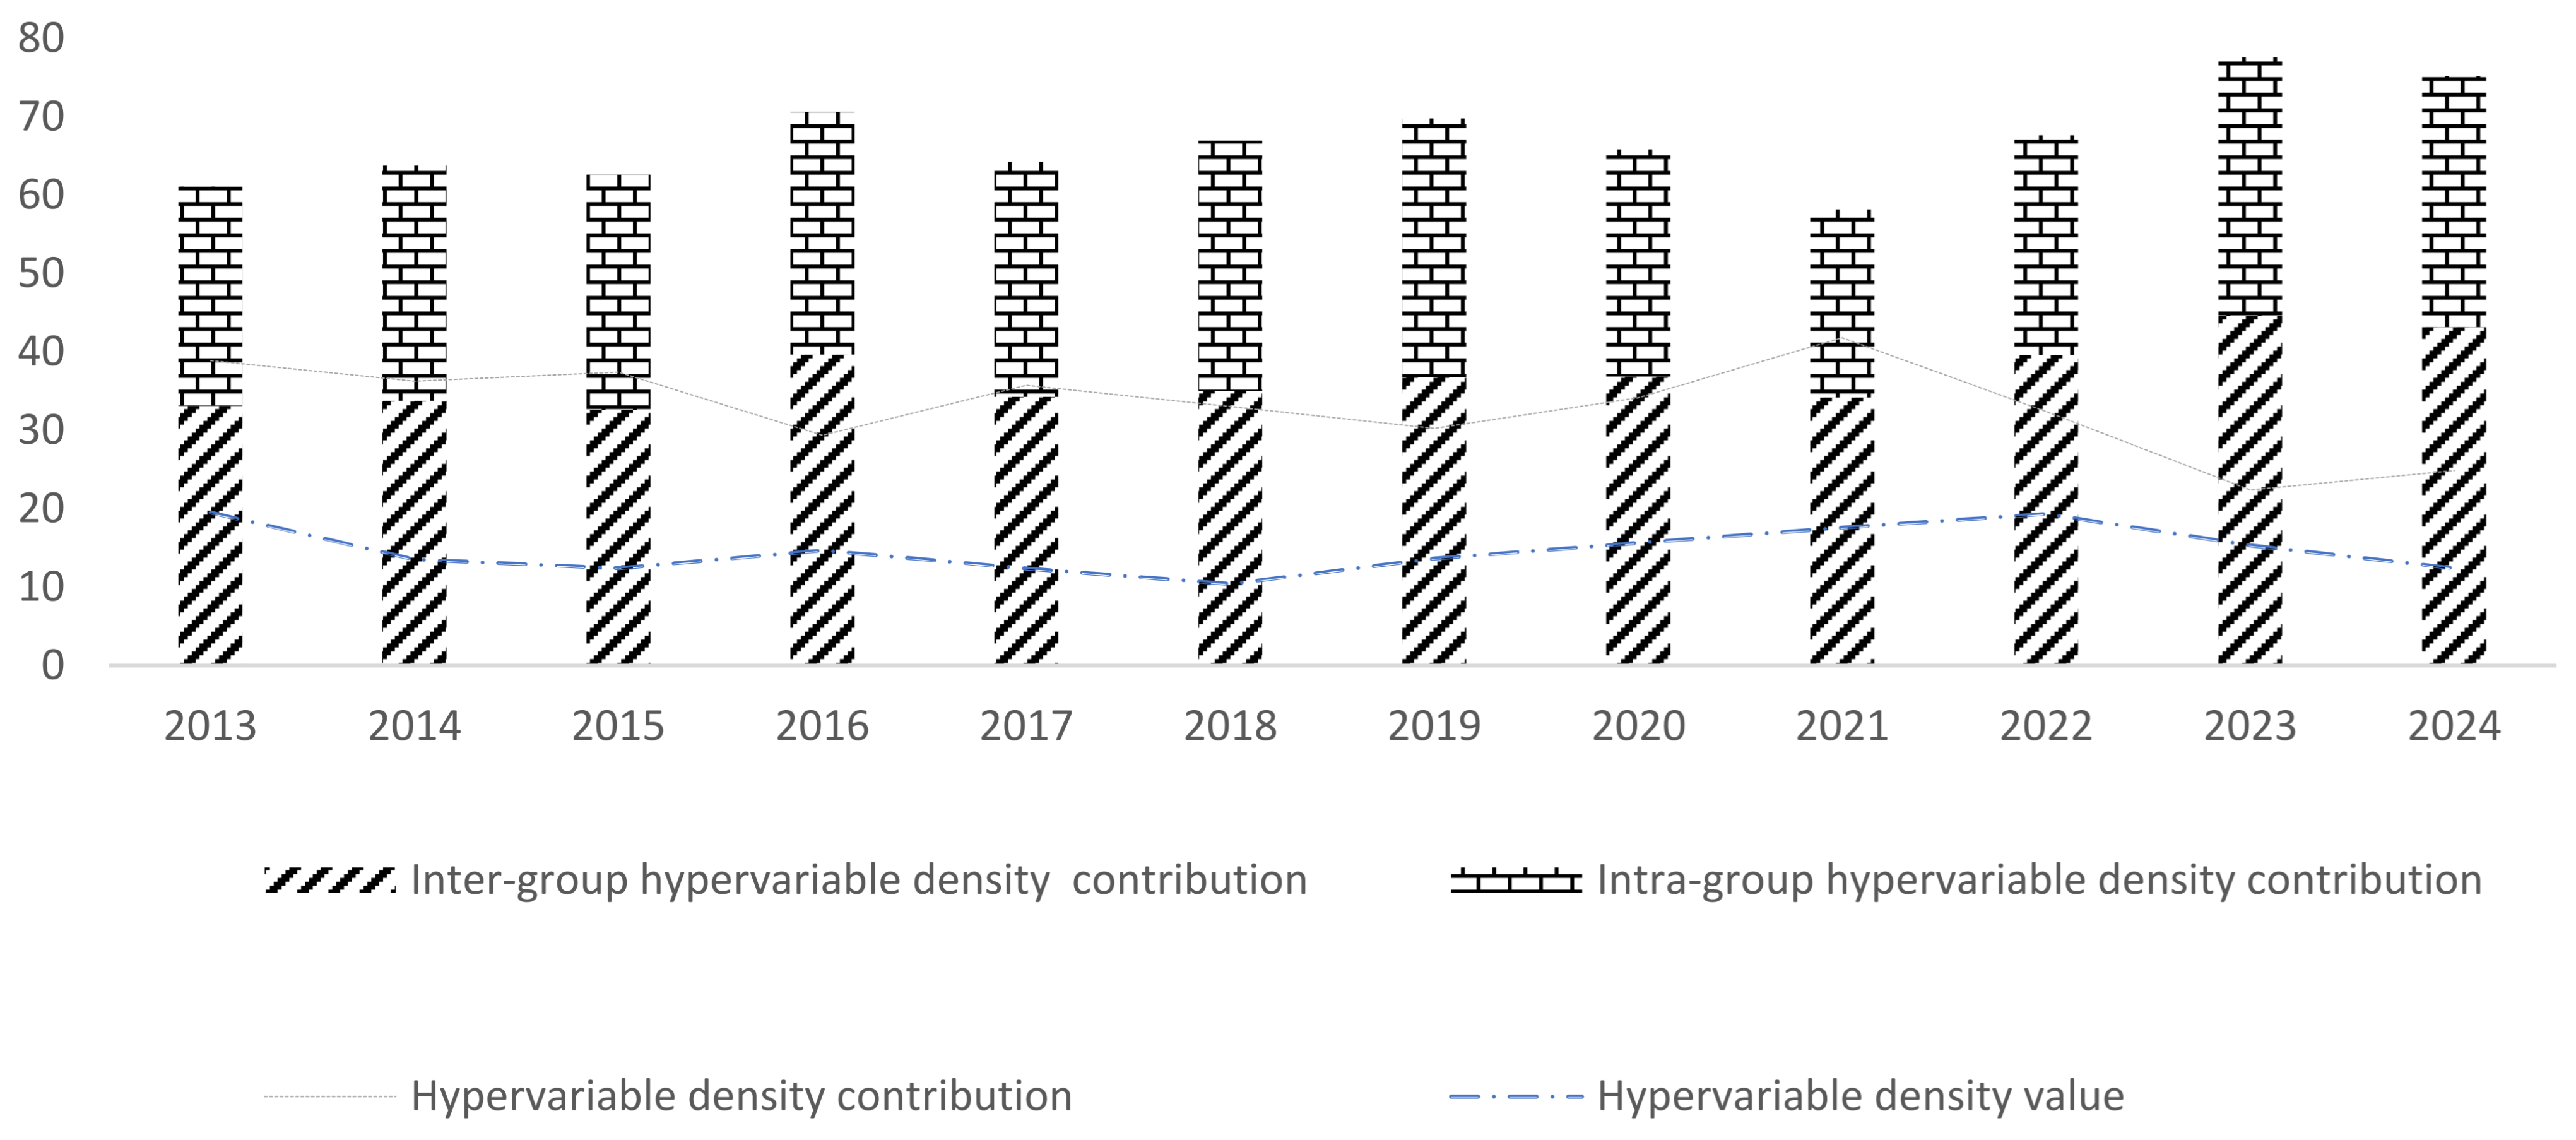
Main Sources of Differences
A further decomposition of the sources of disparity reveals that from 2013 to 2024, the average annual contribution rates of intra-regional differences, inter-regional differences, and transvariation density to overall disparity in the eastern, central, western, and northeastern regions were 37.67%, 33.21%, and 29.12%, respectively (see
Figure 14). The contribution of inter-regional transvariation density was significantly higher than that of intra-regional transvariation, indicating that differences between regions are the primary source of imbalance in the development of digital twin technology investment levels. These disparities are also heavily influenced by the COVID-19 pandemic and policy adjustments. The contribution of inter-regional transvariation density fluctuated significantly between 2011 and 2022, ranging from 33.105% to 44.58%, suggesting that disparities in digital twin technology investment between regions contributed substantially—and inconsistently—to the overall difference. The large variation in inter-regional transvariation during 2021–2023 is closely related to the economic and social imbalances caused by the pandemic. Furthermore, the overall trend of transvariation density from 2013 to 2024 shows considerable changes, indicating significant fluctuations in the overall excess variation in digital twin technology investment. The contribution of intra-regional transvariation density shows an upward trend, suggesting that disparities among cities within the same region have been increasing, thereby widening internal regional differences.
