Article

A Comprehensive Optimization Framework for Techno-Economic Demand Side Management in Integrated Energy Systems

by
Moataz Ayman Shaker
1,
Ibrahim Mohamed Diaaeldin
1,*,
Mahmoud A. Attia
2,
Amr Khaled Khamees
1,
Othman A. M. Omar
1,
Mohammed Alruwaili
3,
Ali Elrashidi
4,* and
Nabil M. Hamed
2
1
Engineering Physics and Mathematics Department, Ain Shams University, Cairo 11517, Egypt
2
Electrical Power and Machines Department, Faculty of Engineering, Ain Shams University, Cairo 11517, Egypt
3
Department of Electrical Engineering, College of Engineering, Northern Border University, Arar 91431, Saudi Arabia
4
Electrical Engineering Department, University of Business and Technology, Jeddah 23435, Saudi Arabia
*
Authors to whom correspondence should be addressed.
Energies 2025, 18(16), 4280; https://doi.org/10.3390/en18164280
Submission received: 27 June 2025 / Revised: 7 August 2025 / Accepted: 8 August 2025 / Published: 11 August 2025

Abstract

This paper proposes a comprehensive mathematical optimization framework for techno-economic demand side management (DSM) in hybrid energy systems (HESs), with a focus on standalone configurations. The framework incorporates load growth projections and the probabilistic uncertainties of renewable energy sources to enhance planning robustness. To identify high-quality near-optimal solutions, several advanced metaheuristic algorithms were employed, including the Exponential Distribution Optimizer (EDO), Teaching-Learning-Based Optimization (TLBO), Circle Search Algorithm (CSA), and Wild Horse Optimizer (WHO). The results highlight substantial economic and environmental improvements, with battery integration yielding a 69.7% reduction in total system cost and an 84.3% decrease in emissions. Additionally, this study evaluated the influence of future load growth on fuel expenditure, offering realistic insights into the techno-economic viability of HES deployment.

1. Introduction

Demand and supply are the two sides of electricity. Having a reliable electrical source has an important role in public health, disease prevention, improving education quality, and industrial and commercial activities. Due to the increase in the demand, as every single element nowadays depends on electricity, the conventional electrical grid is challenged by this increase in demand, so the distributed generation concept has started to appear, which increases the reliability of electricity supply. Later on, the smart grid appeared, which is an electrical network with sensors, smart meters at transmission and distribution levels, in order to communicate and help control centers know everything about the network, from power needed, so it becomes a user-friendly network. DSM helps smart grids in many effective ways, such as reduction in electricity cost, monitoring, control, and management of energy resources. It helps consumers to make informed decisions about their energy consumption and helps energy providers to handle peak load demand and reshape the load curve, leading to a sustainable smart grid. The main target of demand side management is to shift load from peak hours to non-peak hours, decreasing load consumption during peak hours, which increases the efficiency of the grid and decreases the effect of greenhouse gases, leading to a decrease in the electricity bill. DSM can manage to overcome the necessity of upgrading electrical infrastructure, such as distribution and transmission networks. DSM is using technologies like load shifting (demand shifting from on-peak hours to non-peak hours), valley filling (increasing load demand at off-peak hours), peak clipping (reducing the peak demand), and load growth, which is used in cases where extra energy is available as a result of using renewable energy. Smart pricing is a technique used in DSM in which the price of electricity is not constant, as it changes during peak hours and non-peak hours using smart meters, and there will be an incentive for consumers who decrease their consumption during peak hours. The reduction in usage of fossil fuel due to its effect on global warming increase, as it will run out one day, leads to an increase in usage of renewable energy sources, as it is a clean source of energy and it lasts forever, such as solar and wind [1]. RES can be connected to the grid or a standalone system, as in a remote rural area, where it is challenging to construct an electrical system due to the terrain [2,3]. RES has some disadvantages, as it cannot be predicted and it is not available all the time [4]. Sometimes a wind energy system is used with a battery system under different scenarios [5]. Another study on hybrid wind–photovoltaic–fuel cell–electrolyzer–battery systems under different scenarios is presented in [6]. Optimizing the size of a Hybrid Energy System (HES) is crucial for reducing installation and maintenance expenses, where numerous studies have employed analytical, probabilistic, and heuristic methods to attain HES optimization. In [7], probabilistic modeling and analysis of stand-alone hybrid power systems were employed, considering the uncertainty associated with renewable resources. In [8], analytical techniques for renewable distributed generation were conducted, focusing on minimizing energy loss. In [9,10,11,12], heuristic techniques demonstrated significant efficacy in computing the complicated optimum size of HES in sufficient time. The Harmony Search (HS) method was employed for the sizing of PV/diesel energy sources in [9]. In [10], a hybrid genetic algorithm combined with Particle Swarm Optimization was employed for the optimal size of an off-grid residence featuring solar panels, wind turbines, and a battery. An analysis of a hybrid renewable energy system using an improved version of Particle Swarm Optimization is conducted in [11]. In [12], hybrid renewable energy systems (HRESs) are analyzed using an enhanced version of Particle Swarm Optimization and the Dwarf Mongoose Optimization Algorithm to reduce costs and improve system reliability. Similarly, the authors in [13] conducted a techno-economic optimization of a hybrid geothermal–wind–solar–hydrogen system for sustainable energy supply, demonstrating robust exergy efficiency across varying operational conditions. In [14], the feasibility and effectiveness of an HRES incorporating photovoltaic (PV), wind turbines (WT), pumped hydro energy storage (PHES), and battery energy storage (BES) in Somalia were optimized. The study in [15] proposed a stochastic techno-economic optimization framework for PV–wind–hydrokinetic systems.
In [16], improvements in the techno-economic optimal sizing of a hybrid off-grid microgrid system were made with the goal of minimizing the cost of energy. In [17], the authors optimized a grid-connected PV–wind–battery system integrated with vehicle-to-grid (V2G) technology for electric vehicle (EV) charging, using a multi-objective improved arithmetic optimization algorithm. Similarly, ref. [18] presented a multi-scenario-oriented, multi-objective HRES design targeting cost minimization and reliability maximization.
A stand-alone hybrid system comprising photovoltaic sources, wind turbines, energy storage, and a diesel generator was proposed for Algeria in [19]. In [20], the optimal design and energy management of a PV/WT/fuel cell hybrid system was addressed, focusing on minimizing life-cycle costs while considering the loss of load probability, utilizing an improved sine–cosine metaheuristic algorithm. The study in [21] employed converged Elephant Herding Optimization for a practical Hybrid PV/Diesel/Battery system deployed in the Gobi Desert, China.
Further, ref. [22] optimized the operation of a PV/Diesel/Pumped Hydro Storage hybrid system using a modified Crow Search Algorithm. In [23], an optimal off-grid PV/hydrogen fuel cell system was proposed to meet energy demand in northeastern India. Beyond heuristic and metaheuristic approaches, mathematical optimization techniques have also been widely applied in the economic dispatch and operation of hybrid microgrids. Convex optimization, in particular, offers guaranteed global optimality under specific conditions and is computationally efficient for well-structured problems. For instance, ref. [24] developed a steady-state convex bi-directional converter model to facilitate efficient economic dispatch in hybrid AC/DC networked microgrids.
Although substantial research has focused on the techno-economic optimization of HRES to ensure sustainable and cost-effective energy supply, a key challenge remains: addressing the natural uncertainties in renewable resource availability and fluctuating demand. These uncertainties compromise the reliability and practical viability of optimized configurations. To tackle this issue, ref. [25] introduced a novel optimal scheduling approach using chance-constrained programming to reduce operating costs in isolated microgrids, incorporating the probabilistic nature of spinning reserves from energy storage. Likewise, ref. [26] proposed a storage system sizing method for isolated grids that minimizes total costs through co-optimization of storage capacity, thermal generation, wind curtailment, and demand-side response, while accounting for the correlation in forecast errors across wind farms and loads.
Additionally, a significant research gap exists in the integration of Demand-Side Management (DSM) into the sizing process, despite its potential to reduce peak loads and enhance system efficiency. DSM is increasingly critical as power systems expand, requiring more generation and transmission infrastructure. As highlighted in [27], DSM can effectively mitigate these challenges. Moreover, ref. [28] demonstrated the impact of load shifting on optimal system sizing. However, many existing studies still overlook the effects of expected annual load growth on long-term system performance, indicating a need for more comprehensive planning approaches.
To fill these research gaps, this work contributes the following:
  • The optimal sizing of a hybrid system configuration using multiple metaheuristic algorithms, the main one being the Exponential Distribution Optimizer (EDO) [29], to determine the optimal size for a hybrid energy system to achieve the minimum cost of energy (COE), then the results obtained from EDO were compared with that of alternative algorithms to demonstrate its effectiveness, and these algorithms include Teaching-Learning-Based Optimization (TLBO) [30], Circle Search Algorithm (CSA) [31], Wild Horse Optimizer (WHO) [32], and Particle Swarm Optimizer (PSO).
  • A comprehensive Monte Carlo simulation is performed to rigorously assess the robustness of the proposed configuration under stochastic variations in solar, wind, and load demand, verifying that the system remains technically and economically viable under significant real-world uncertainty.
  • Five scenarios were simulated for the optimal-sized systems, starting with a diesel-only generator and progressing to advanced hybrid systems integrating solar, wind, batteries, and Demand-Side Management (DSM) to demonstrate comparison between different configurations, and demonstrate DSM effectiveness in utilizing surplus renewable energy, reducing carbon dioxide (CO2) emissions, and stabilizing costs.
  • Incorporate projected load growth over the years into the planning framework. By accounting for annual increases in energy demand, the analysis ensures that the hybrid system’s sizing and techno-economic performance remain reliable and cost-effective as consumption patterns evolve.

2. Meteorological Data

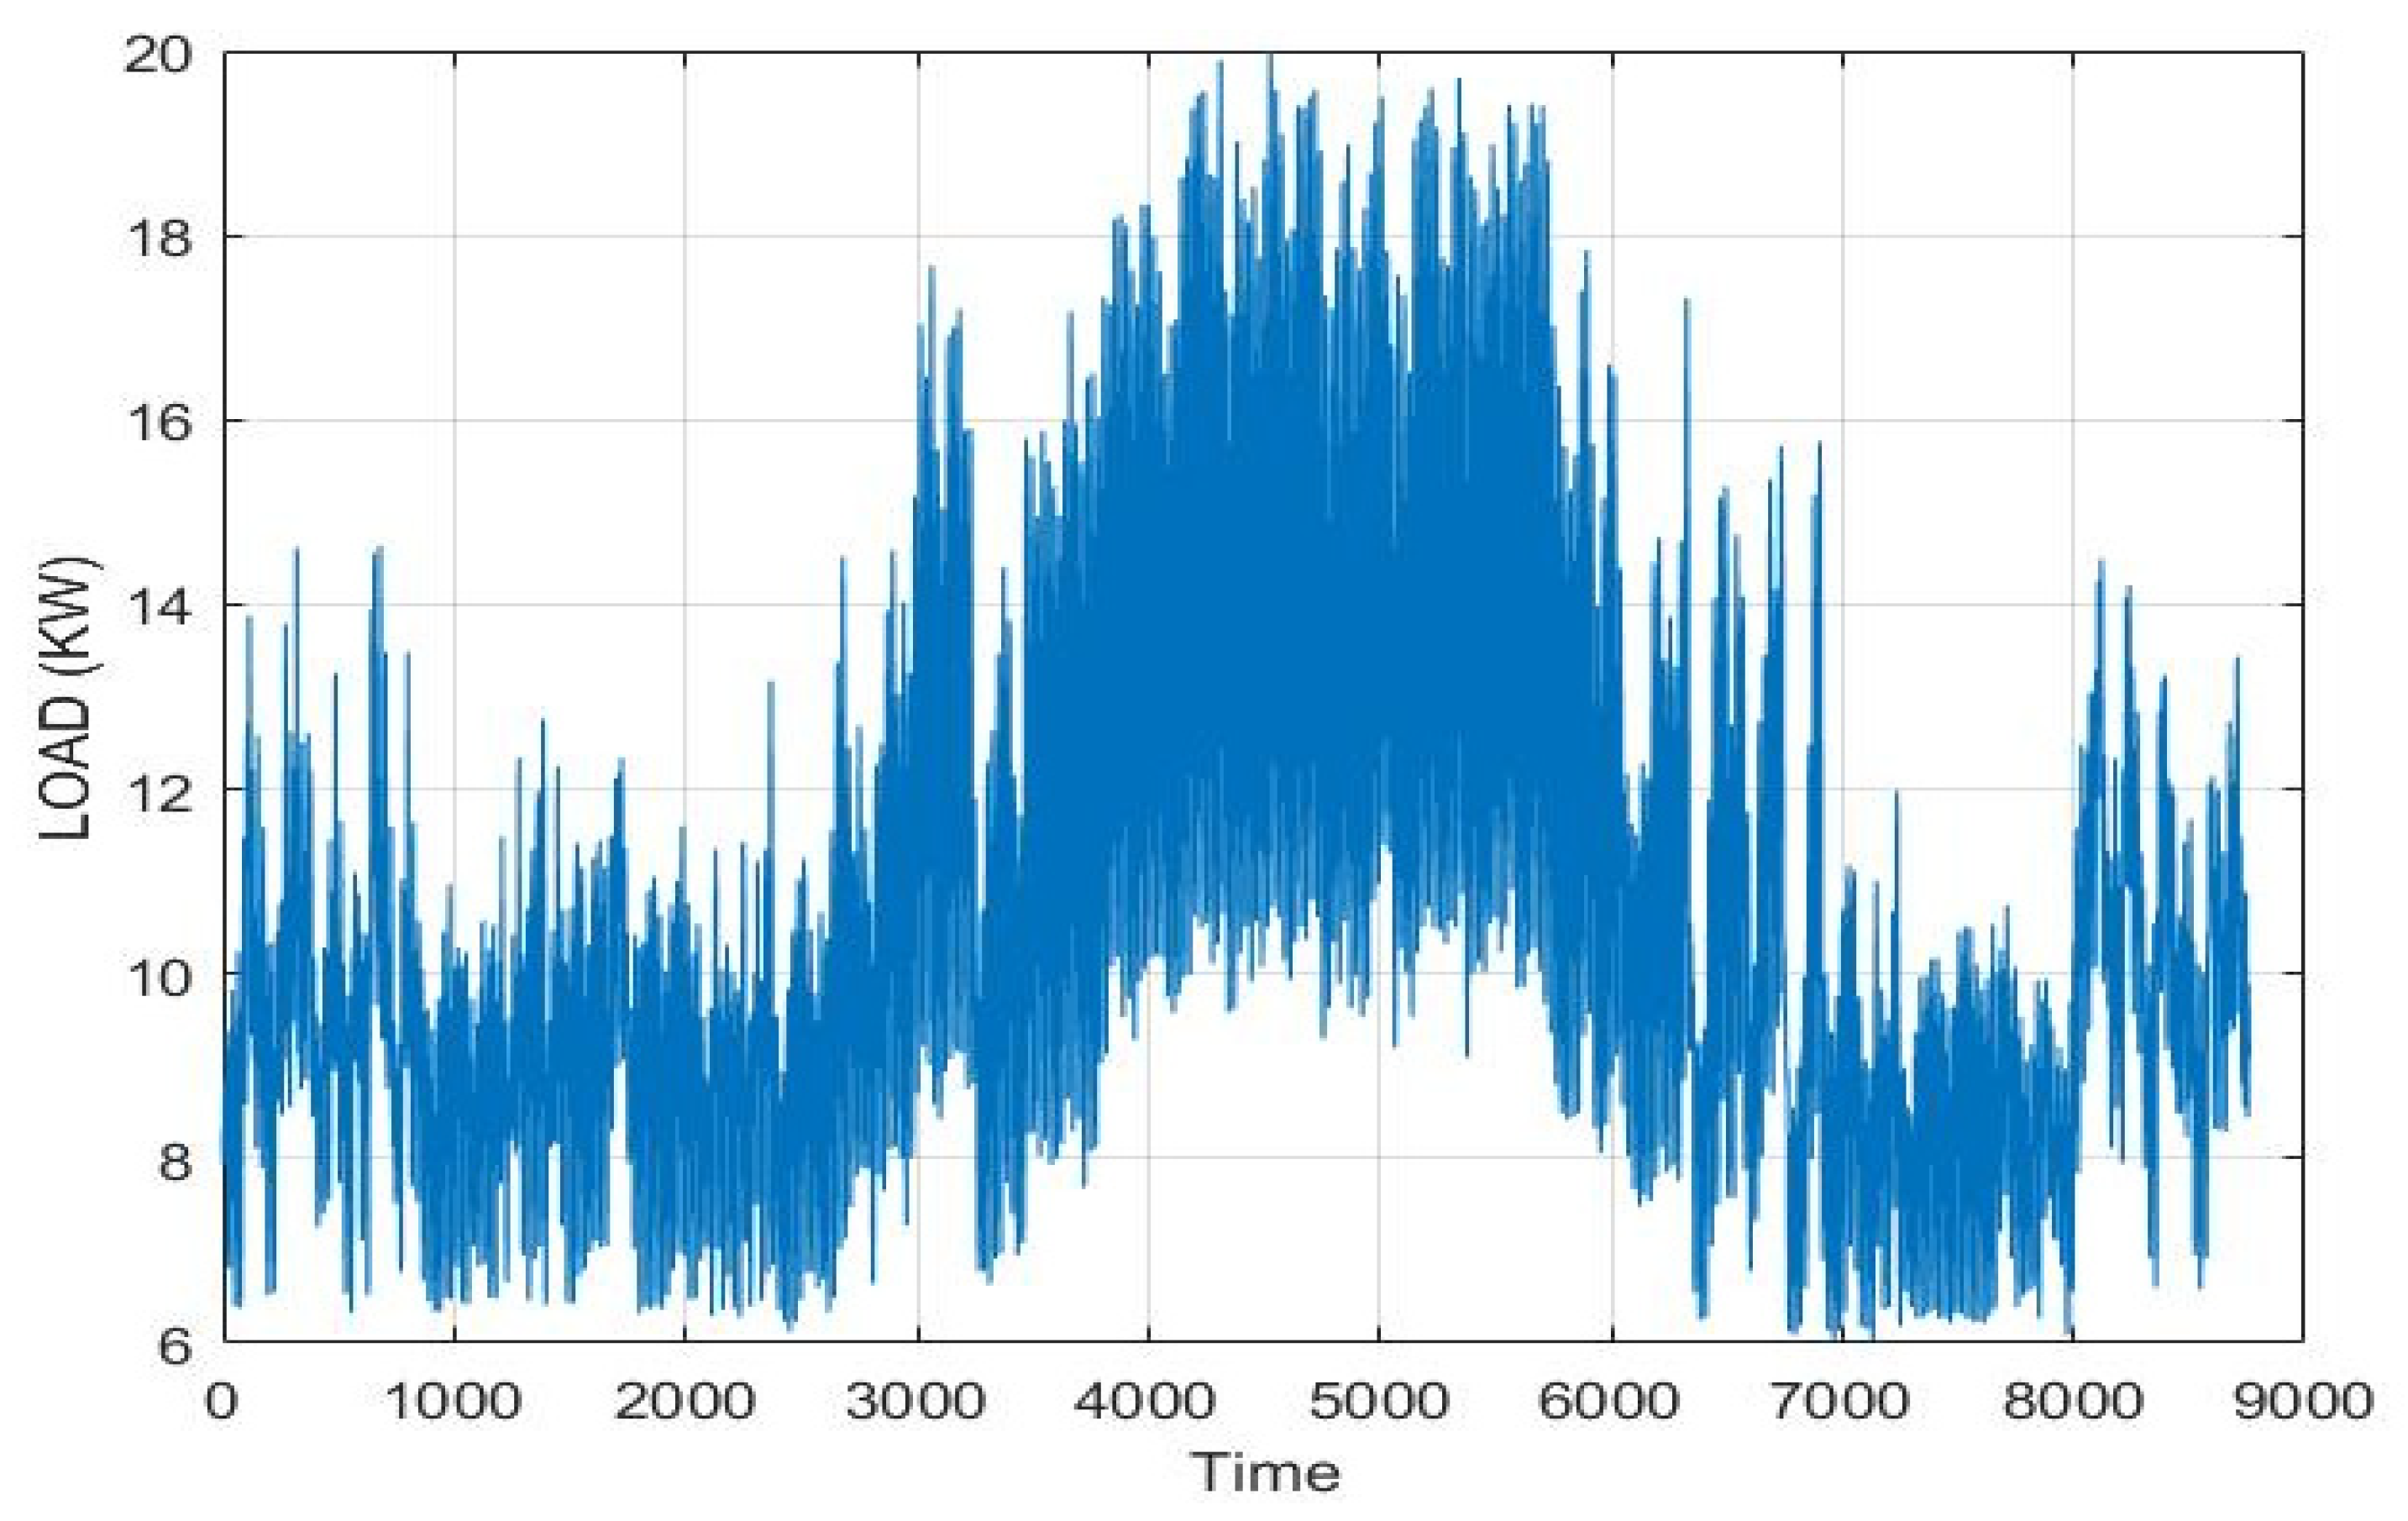
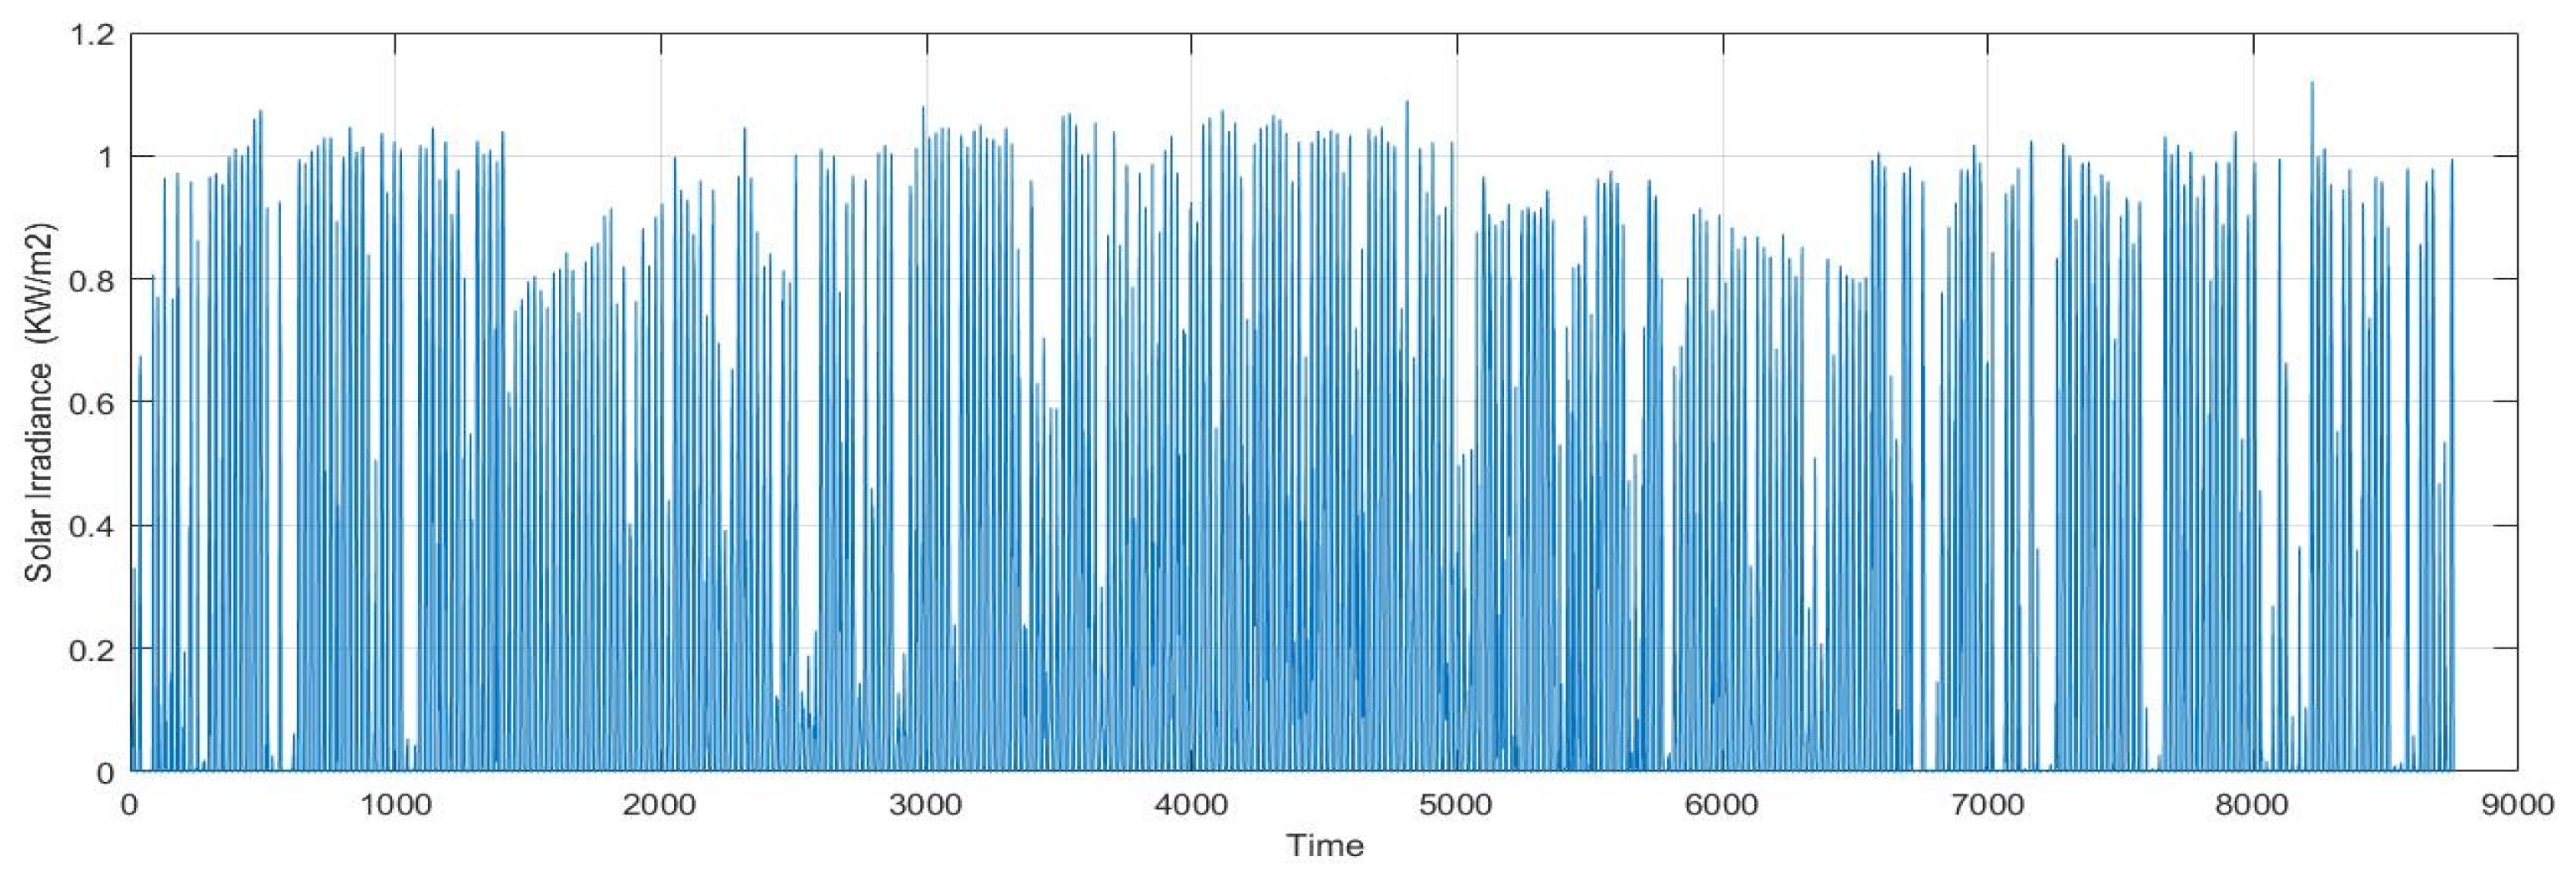
Wind and solar energy are freely available resources that can be harnessed and converted into electrical energy using wind turbines and photovoltaic (PV) systems. The evaluation of optimal sites for the deployment of these renewable energy technologies depends heavily on the availability and reliability of the respective resources. Detailed analysis of wind speed and solar radiation data is critical before finalizing a site for project implementation, especially considering the high capital investment involved, which demands efficient resource utilization. The wind speed profile presented in Figure 1 shows annual variations in wind speed throughout one year. Likewise, the load profile shown in Figure 2 and the solar irradiance data illustrated in Figure 3 were all recorded over the same one-year period (8760 h) to ensure consistency in simulation inputs. A summary of the average and maximum values for both solar irradiance and wind speed is provided in Table 1.

3. Configuration of the Hybrid Energy System

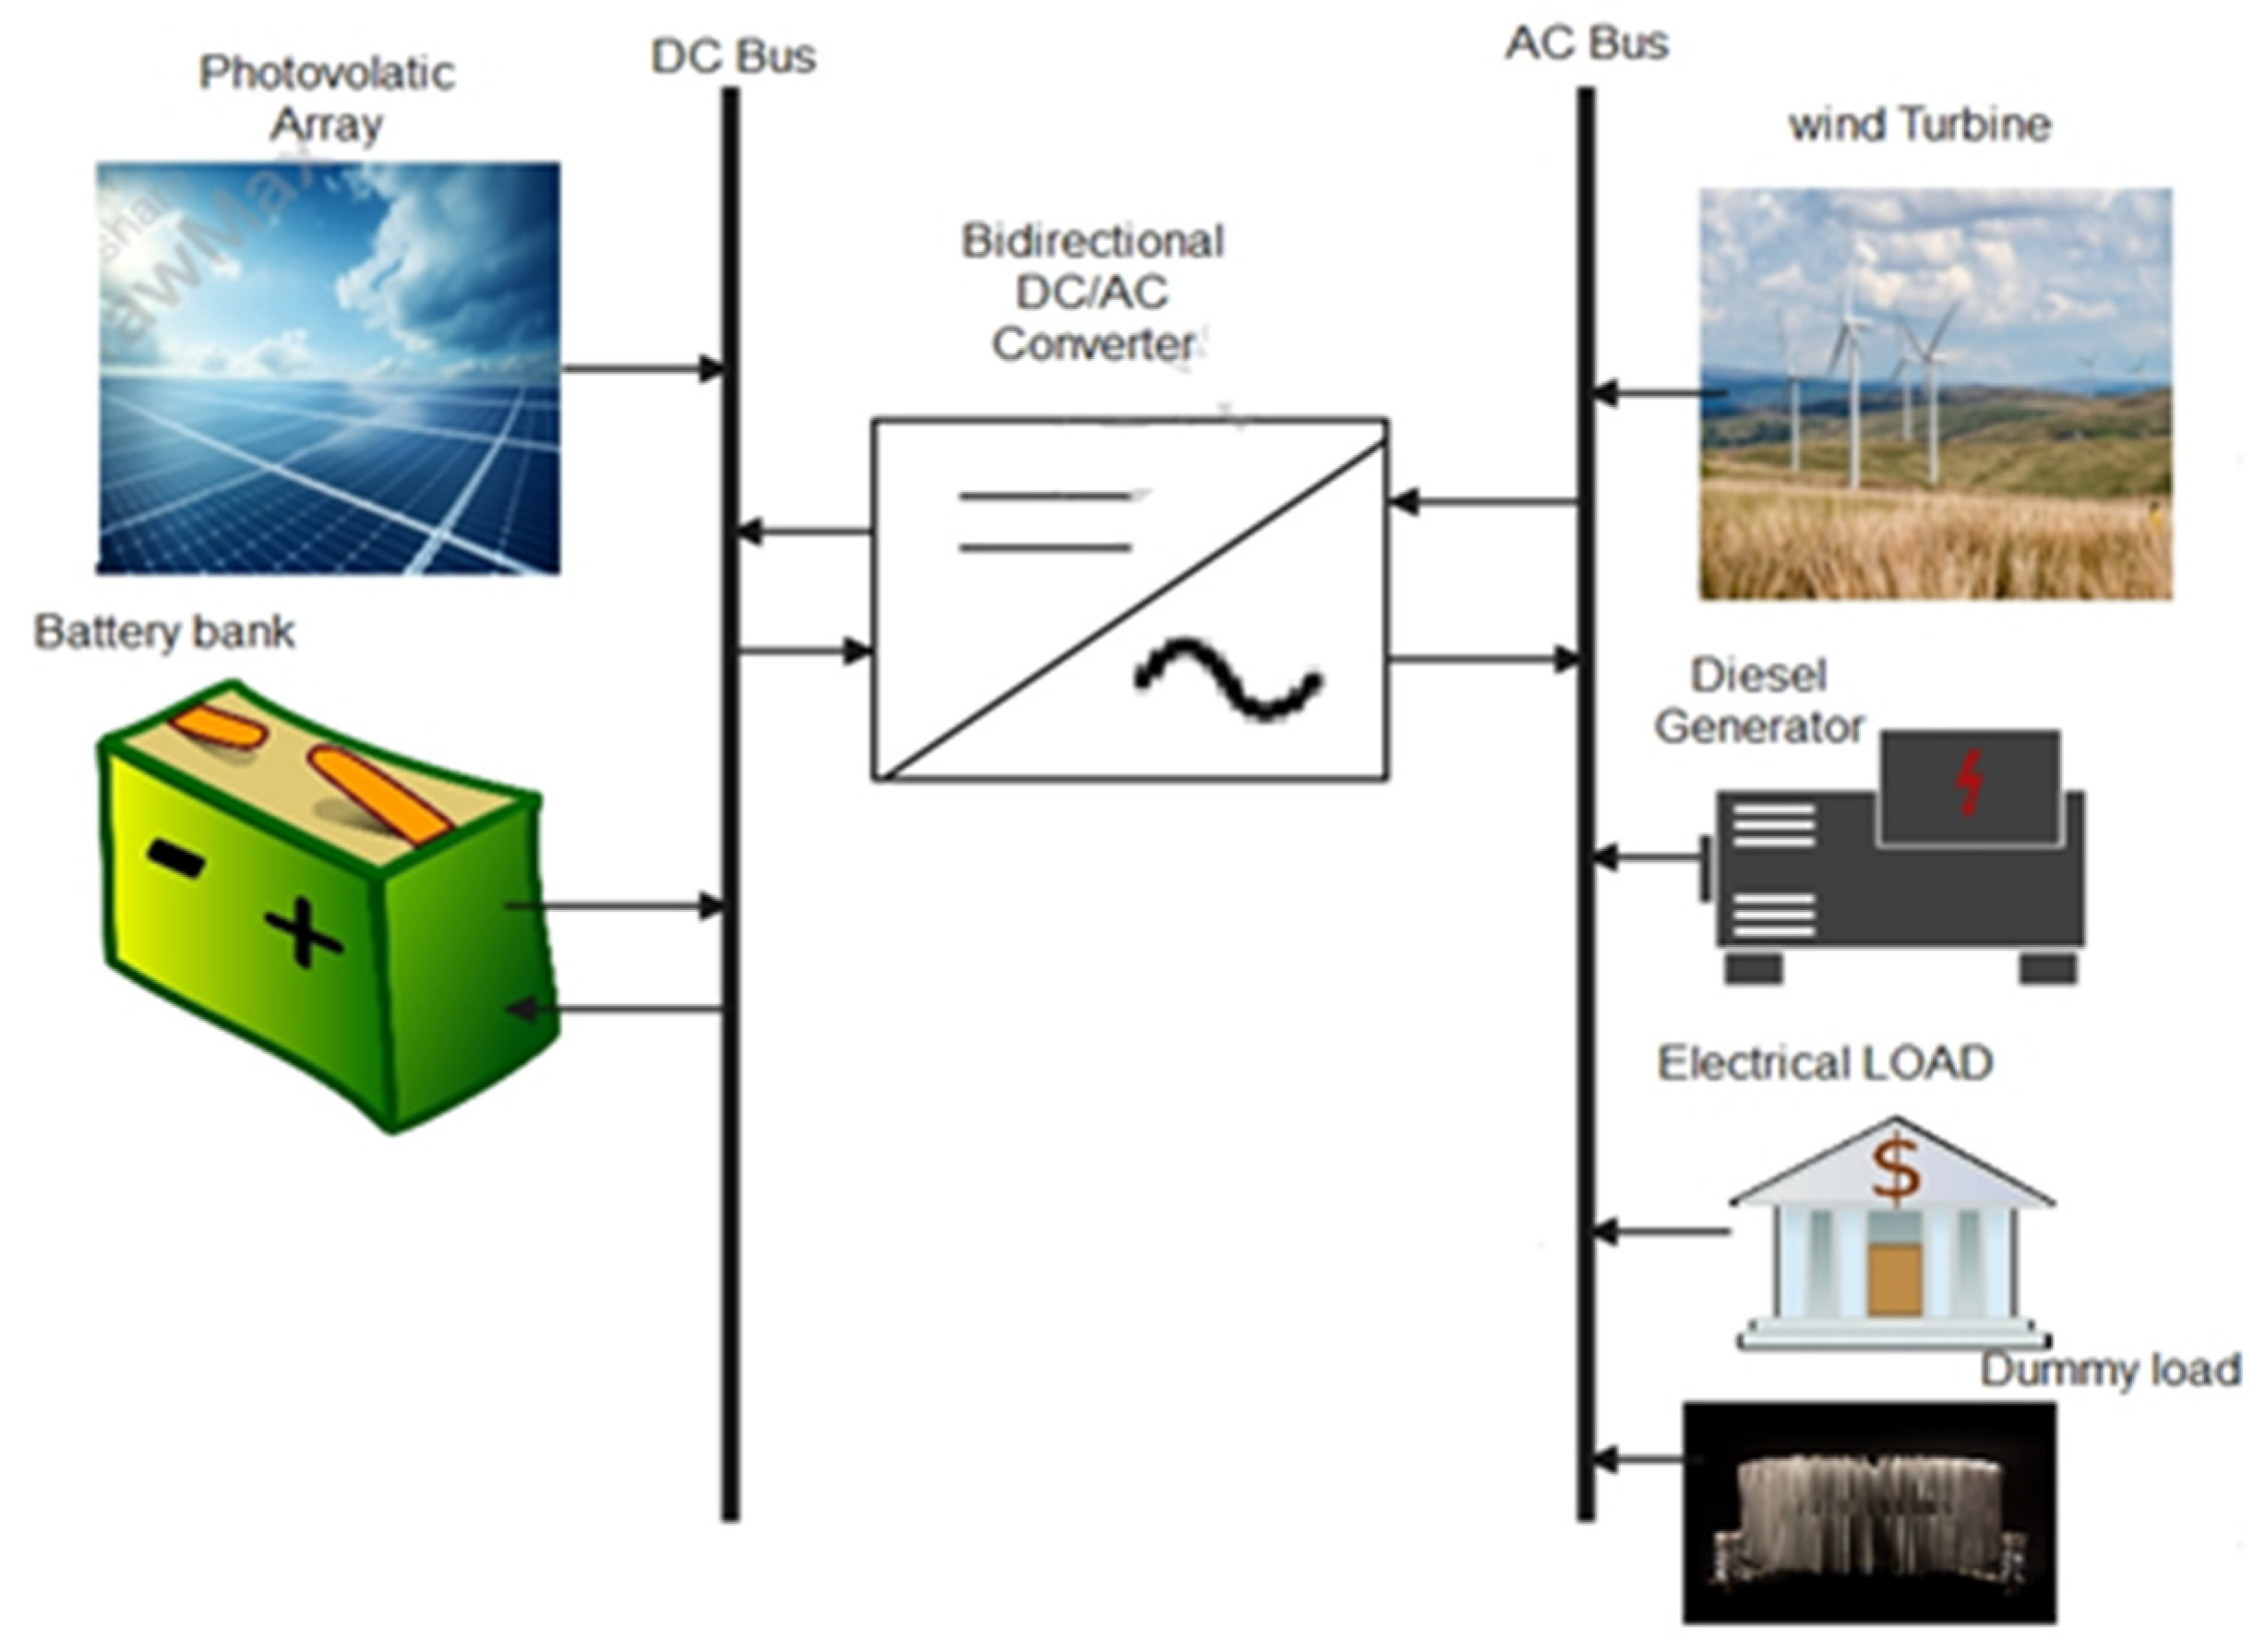
The configuration of the Hybrid Energy System (HES) is illustrated in Figure 4. It comprises two main buses: an alternating current (AC) bus and a direct current (DC) bus. The AC bus is connected to wind turbine generators, a dummy load, the system’s electrical load, and diesel generators, which serve as a backup energy source when renewable energy resources are insufficient. The DC bus is connected to photovoltaic (PV) arrays and a battery bank. These two buses are linked via a bidirectional AC/DC converter, which functions as an inverter (converting DC to AC to supply power from the battery bank to the load) and as a rectifier (converting AC to DC to charge the battery bank). The PV arrays and wind turbine generators serve as the primary sources of power, while the diesel generator operates only when the battery storage lacks sufficient energy to meet the load demand.

3.1. Photovoltaic System Mathematical Modelling

The sun is the primary source of energy on Earth. Solar irradiance can be converted into electrical energy using photovoltaic (PV) arrays. PV systems are relatively easy to install, have no moving parts, and require minimal maintenance. They generate electrical energy in the form of direct current (DC). The power produced by PV systems at any given time is expressed as follows [33]:
P ( t ) p v o u t = P r G ( t ) G r e f 1 + k t T a m b + 0.0256 G ( t ) T r e f
where P p v o u t ( t ) , P r , G ( t ) , G r e f , k t , T a m b , a n d   T r e f are the output power from PV arrays at time t, the rated output power at reference conditions, the solar irradiance at time t in W / m 2 , the reference solar irradiance, which is 1000   W / m 2 , a constant equal to 3.7  ×  10 3 ( 1 / ° C ) , ambient temperature in degrees Celsius, and temperature at reference conditions, which are 25   ° C , respectively.
It is evident that the output power of a photovoltaic (PV) system primarily depends on its rated output at the reference temperature, the level of solar irradiance, and the ambient temperature of the environment where the PV arrays are installed. A key limitation of PV systems is their inability to generate electricity during nighttime hours.

3.2. Wind Turbine Generator Mathematical Modelling

Wind is a free and renewable energy source that can be harnessed to generate electricity using wind turbines. Wind turbines operate by converting kinetic energy from the wind into electrical energy through blades that rotate around an axis. Monitoring towers are used to assess wind speed and direction, as well as to track turbine performance. Control systems are employed to adjust the blade rotation speed, thereby optimizing energy generation efficiency. The global significance of wind energy continues to grow, prompting researchers to focus on the development of wind energy projects that are both economically viable and technologically advanced. The output power from wind turbines at any given time can be approximated as follows [34]:
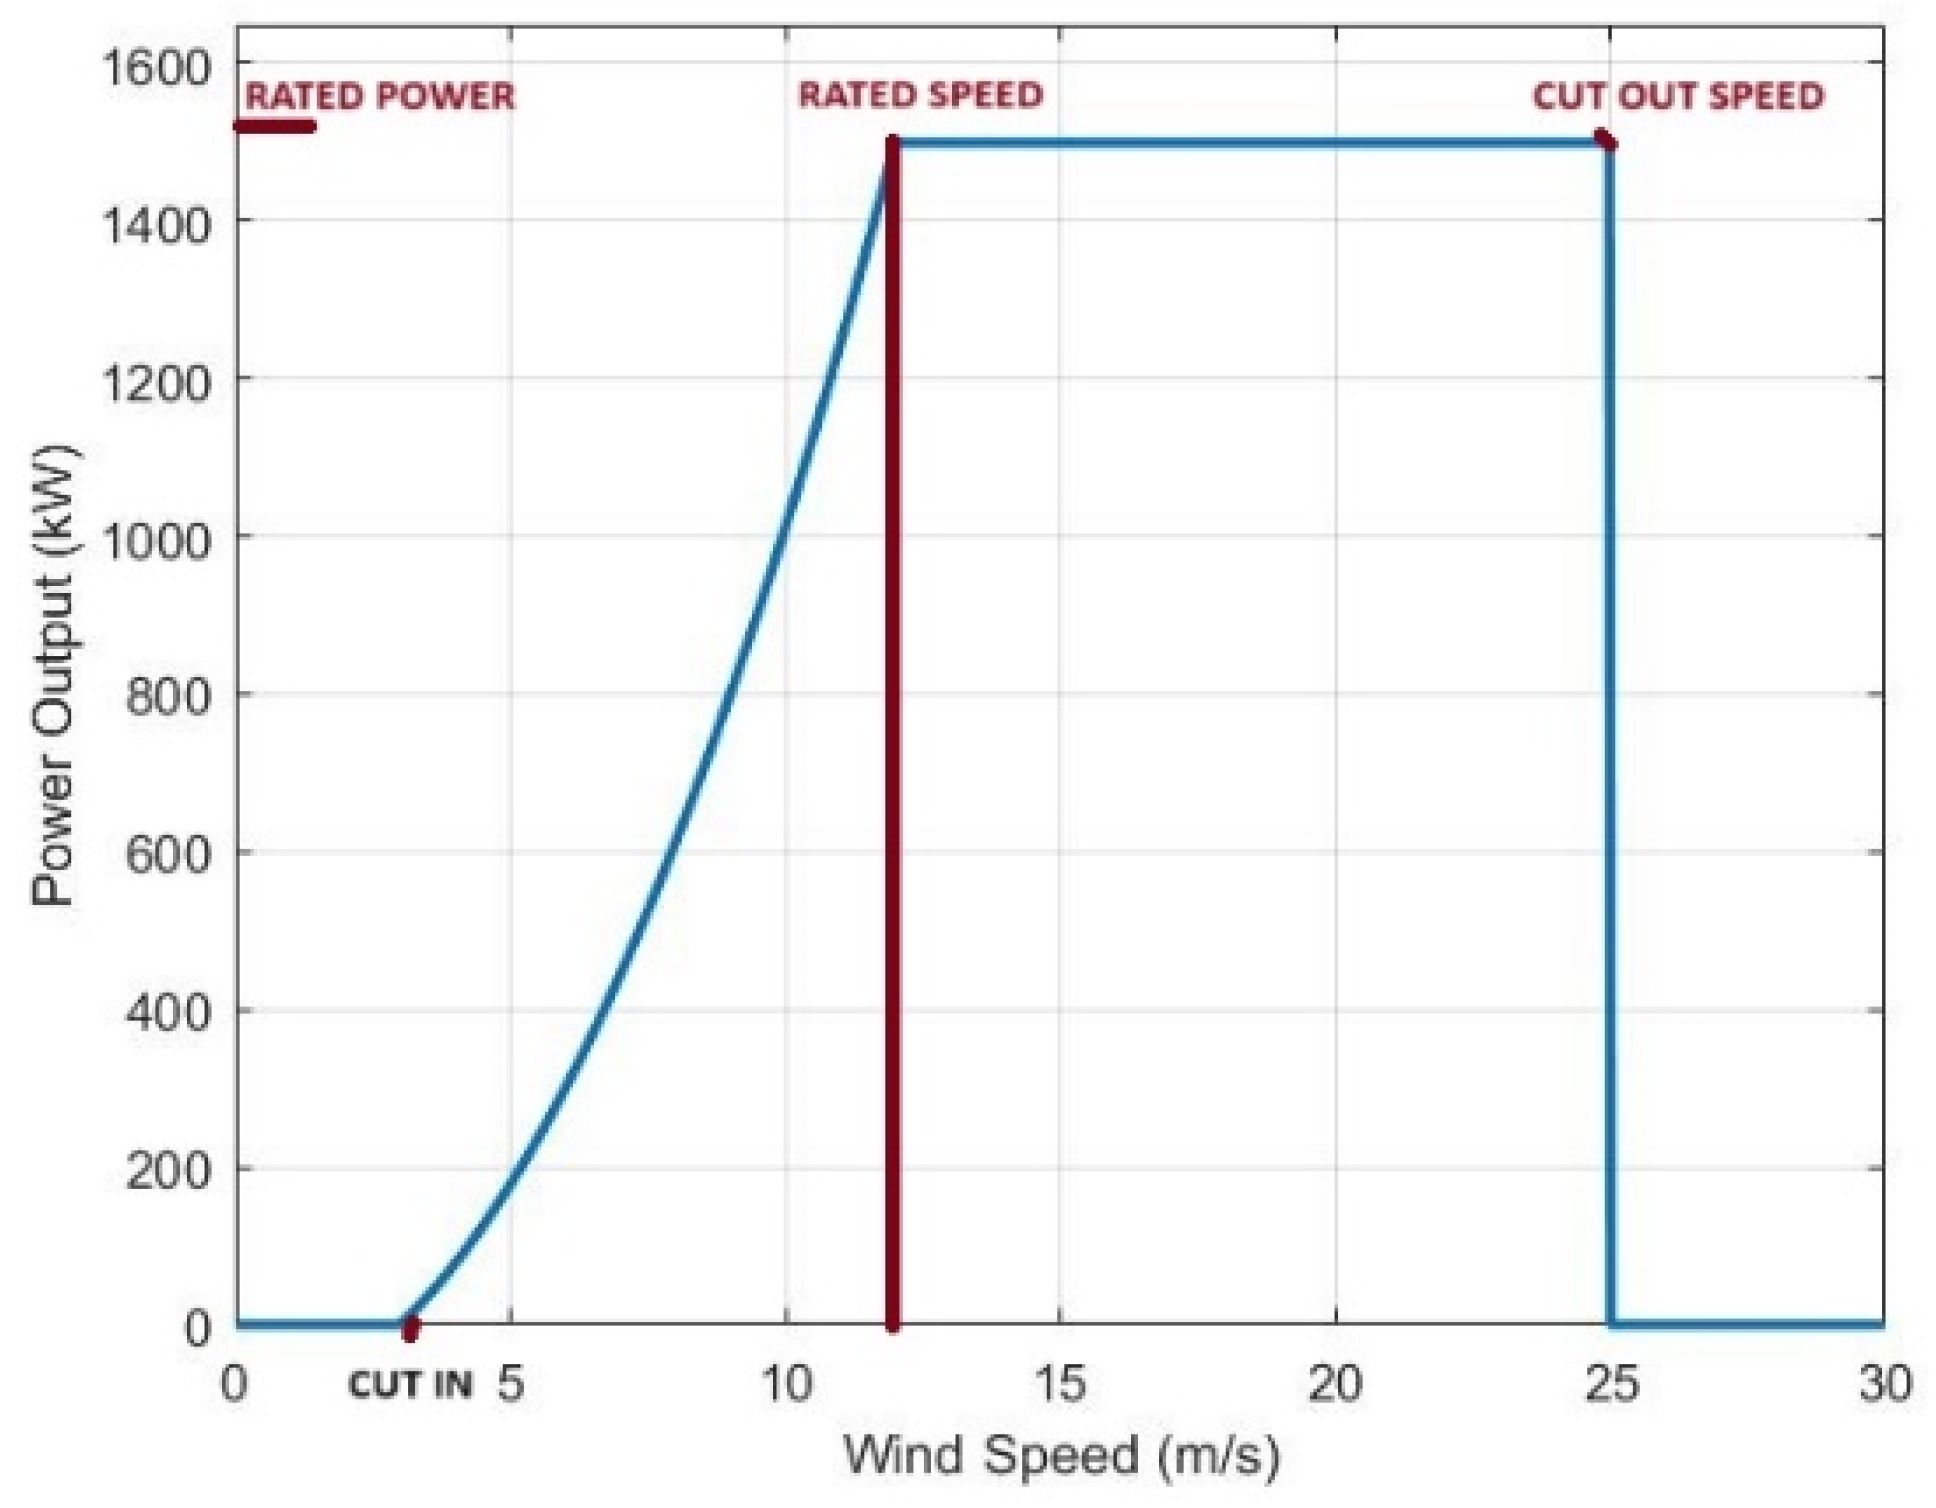
P w t t = P r             0                                                                                 v ( t ) v c   o r   v ( t ) > v f v ( t ) 2 v c 2 v r 2 v c 2                                                                     v c < v ( t ) < v r 1                                                                                 v c v ( t ) v f
where v t , v c , v r , v f , P r are the wind speed at time t, the cut-in speed of wind turbine, the rated speed of wind turbine, the cut-out speed of wind turbine and the rated power of wind turbine, respectively. From this equation, the power generated by the wind turbine is influenced by five factors, one of which is the wind speed at the site where the turbine is installed, while the remaining four factors include the cut-in speed, cut-out speed, rated speed, and rated power, all of which vary depending on the specific type of wind turbine and can differ from one turbine model to another. The wind turbine output power characteristics are shown in Figure 5.

3.3. Diesel Generator Mathematical Modelling

A diesel generator is often used in remote areas where access to the electrical grid is unavailable. However, its primary disadvantage is the environmental pollution it causes, as it generates greenhouse gases during the fuel combustion process. In hybrid electrical energy systems, diesel generators serve as a backup energy source when renewable energy sources and energy storage systems are insufficient to meet the required load demands. The performance of the diesel generator can be described in terms of its annual costs and fuel consumption as follows [34]:
C D S L = C F t = 1 8760 0.246 P D S L t + 0.08415 P r
where C D S L , C F , P D S L t , P r are the annual cost of diesel, cost of fuel per liter, generated power from diesel at time t and the rated nominal power of diesel, respectively. It is clear from the equation that output power and rated power are the main two factors affecting diesel generator annual cost, where the output power of diesel generator is set between the minimum and maximum values recommended by the manufacturer.

3.4. Energy Storage System Modelling

Energy storage systems play a vital role in renewable energy systems, as the energy generated from renewable sources is not always available when it is needed. To address this intermittency, storage systems are essential for storing excess energy generated during periods of low demand and supplying it during periods of high demand or when renewable sources are not producing power. Among the various types of energy storage technologies, battery storage systems are the simplest and most widely used. The capacity of a battery storage system is typically determined as follows [33]:
C B = E L A D D O D η b η i n v
where C B ,   E L , A D , D O D , η b , and η i n v are the battery capacity, average power of load, days of autonomy, which is the number of days during which the battery can meet the system’s energy needs without any supporting source, depth of discharge, battery efficiency and inverter efficiency, respectively.

4. Energy Management and Performance Evaluation in Hybrid Energy Systems

This section outlines energy management strategies, key performance indicators, and the optimization problem formulation for the hybrid system.

4.1. Power Management Strategies

Renewable energy sources are inherently intermittent, meaning they cannot consistently produce energy due to fluctuating environmental conditions. As a result, a backup energy source becomes necessary. Energy storage systems are employed to store excess energy generated during periods of surplus, which can then be utilized when renewable sources are unable to meet power demands. Additionally, a dump load is used to dissipate surplus power, preventing overcharging of the batteries. The power management strategy implemented involves supplying the load primarily through RES such as wind turbine generators and PV arrays. When these renewable sources are insufficient to meet the load demand, diesel generators are activated to provide the required power. If an energy storage system is available and contains sufficient stored energy, it is prioritized over diesel generators to supply the load. When the energy storage system does not have sufficient energy, the diesel generators take over, and any surplus energy from renewable sources is used to charge the storage system.
The simulation parameters for the power management scenarios used in the hybrid energy system are presented in Table 2 [34,35].

4.2. Demand Side Management

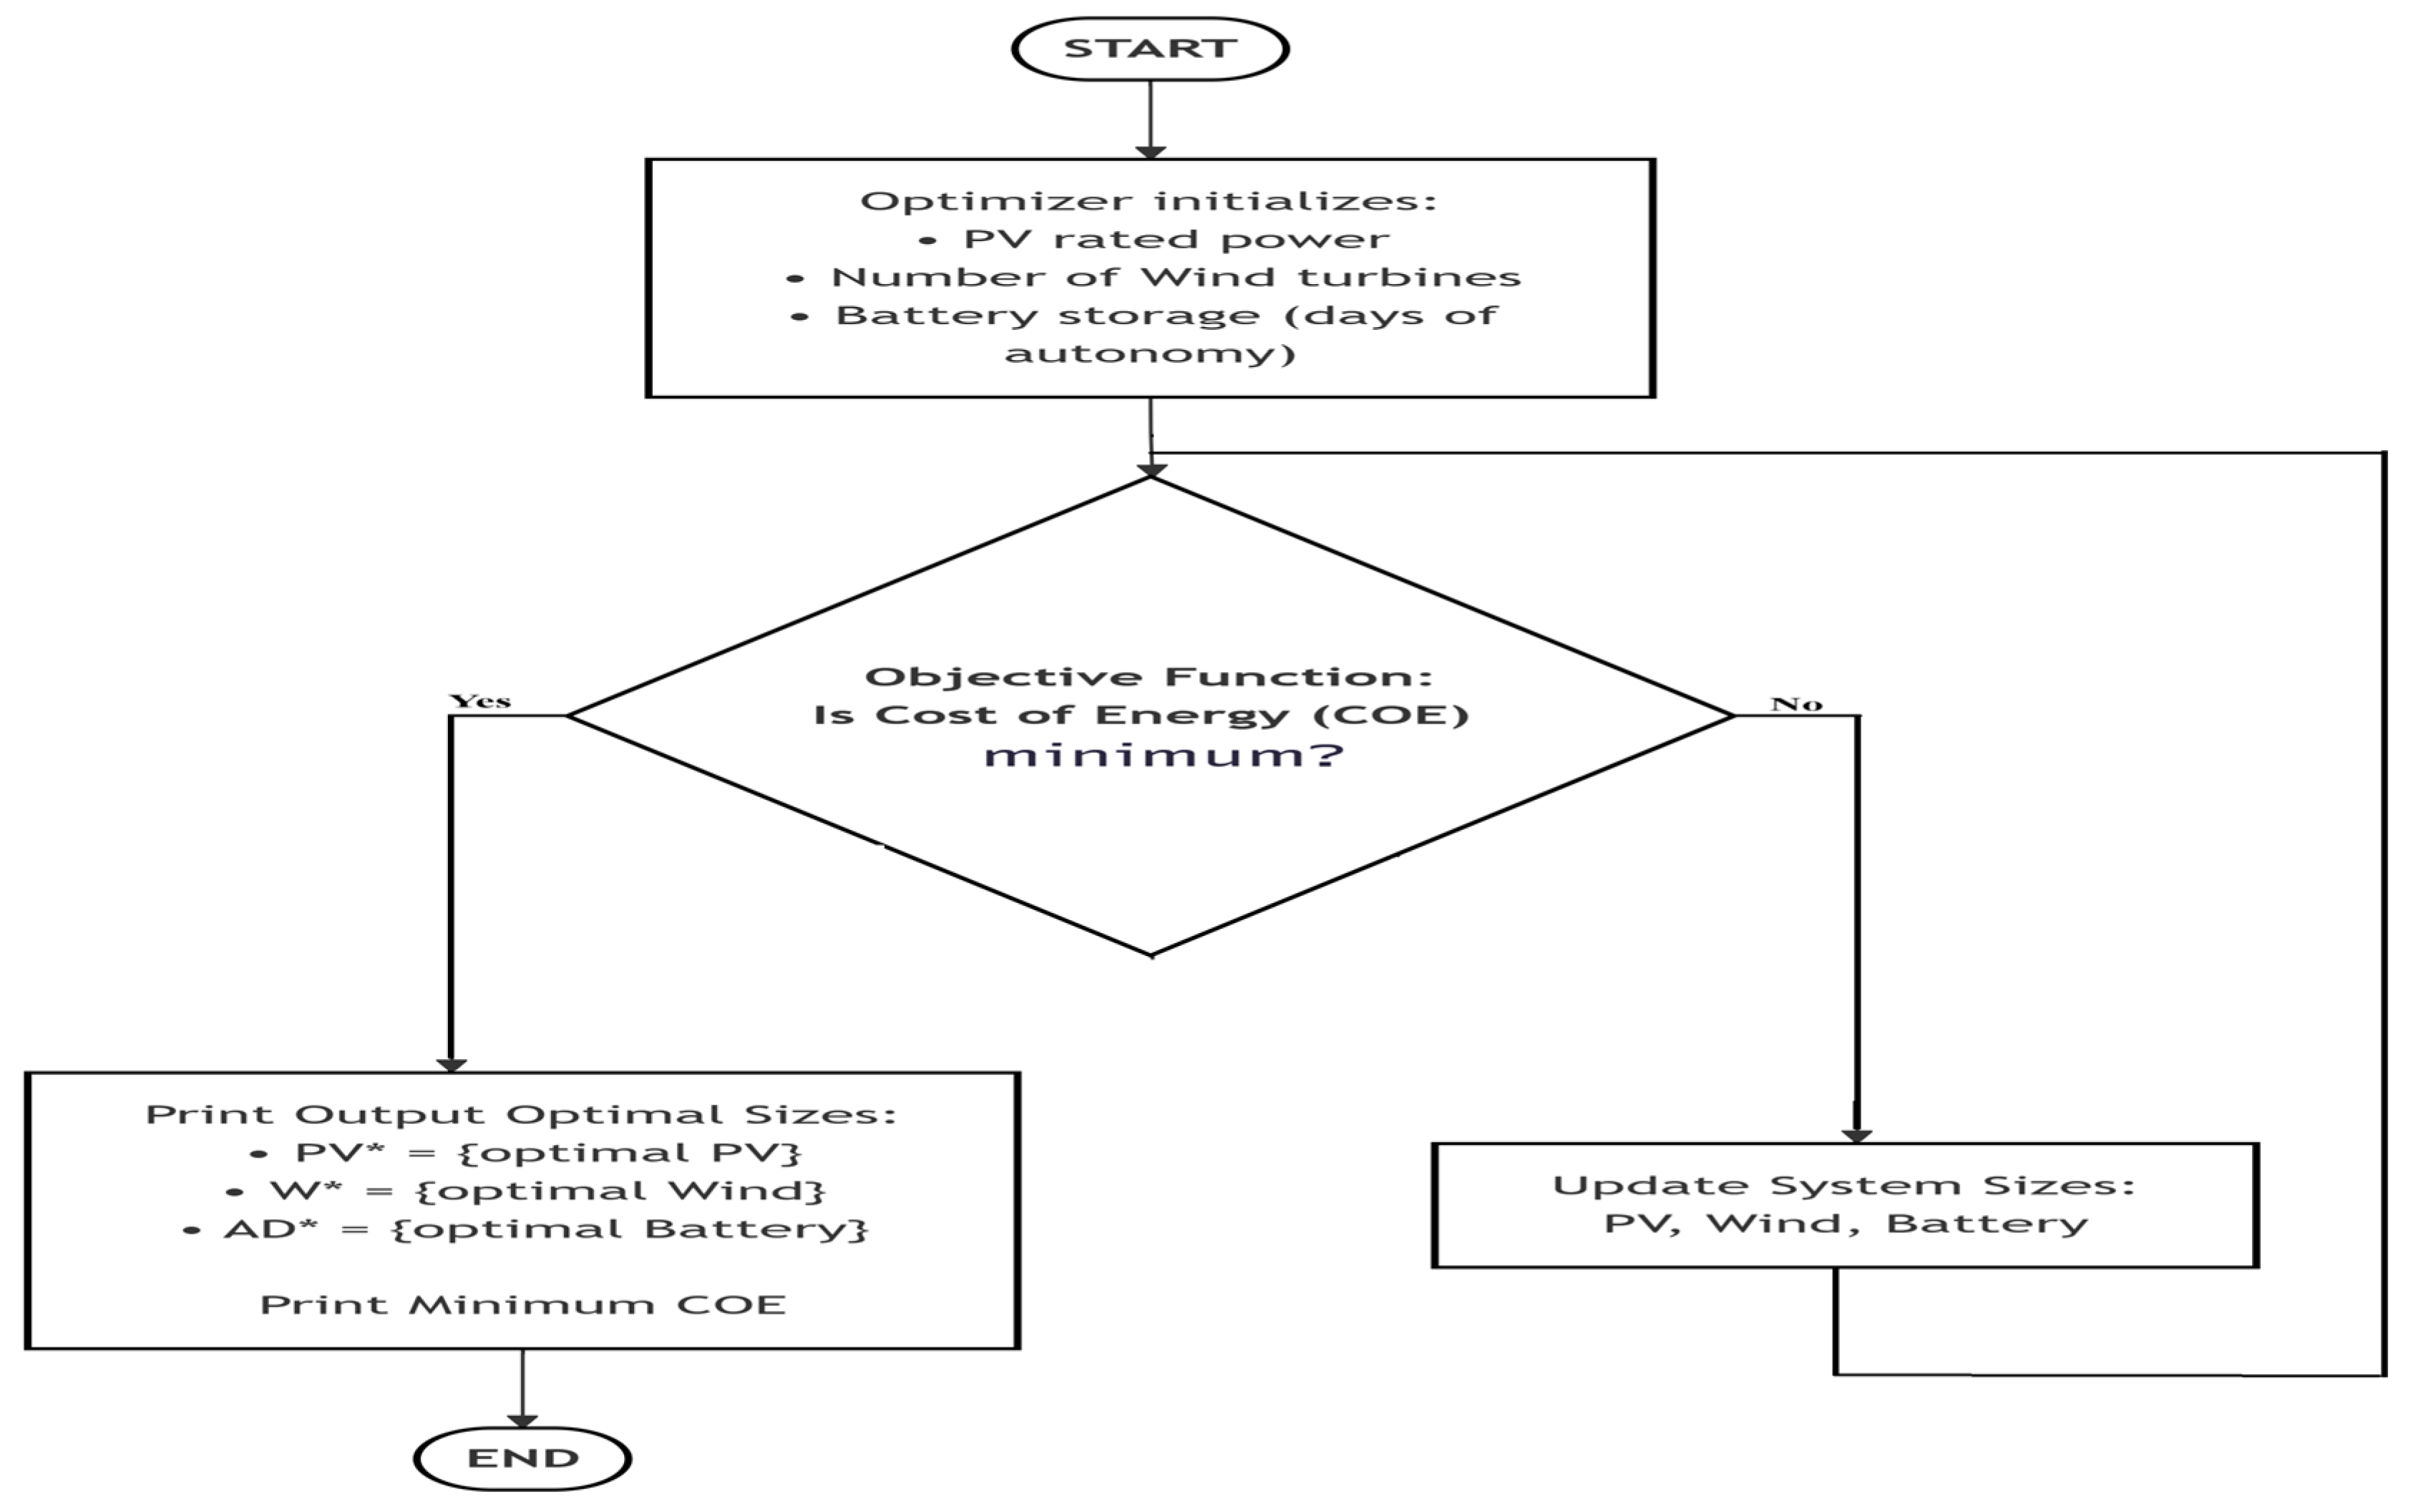
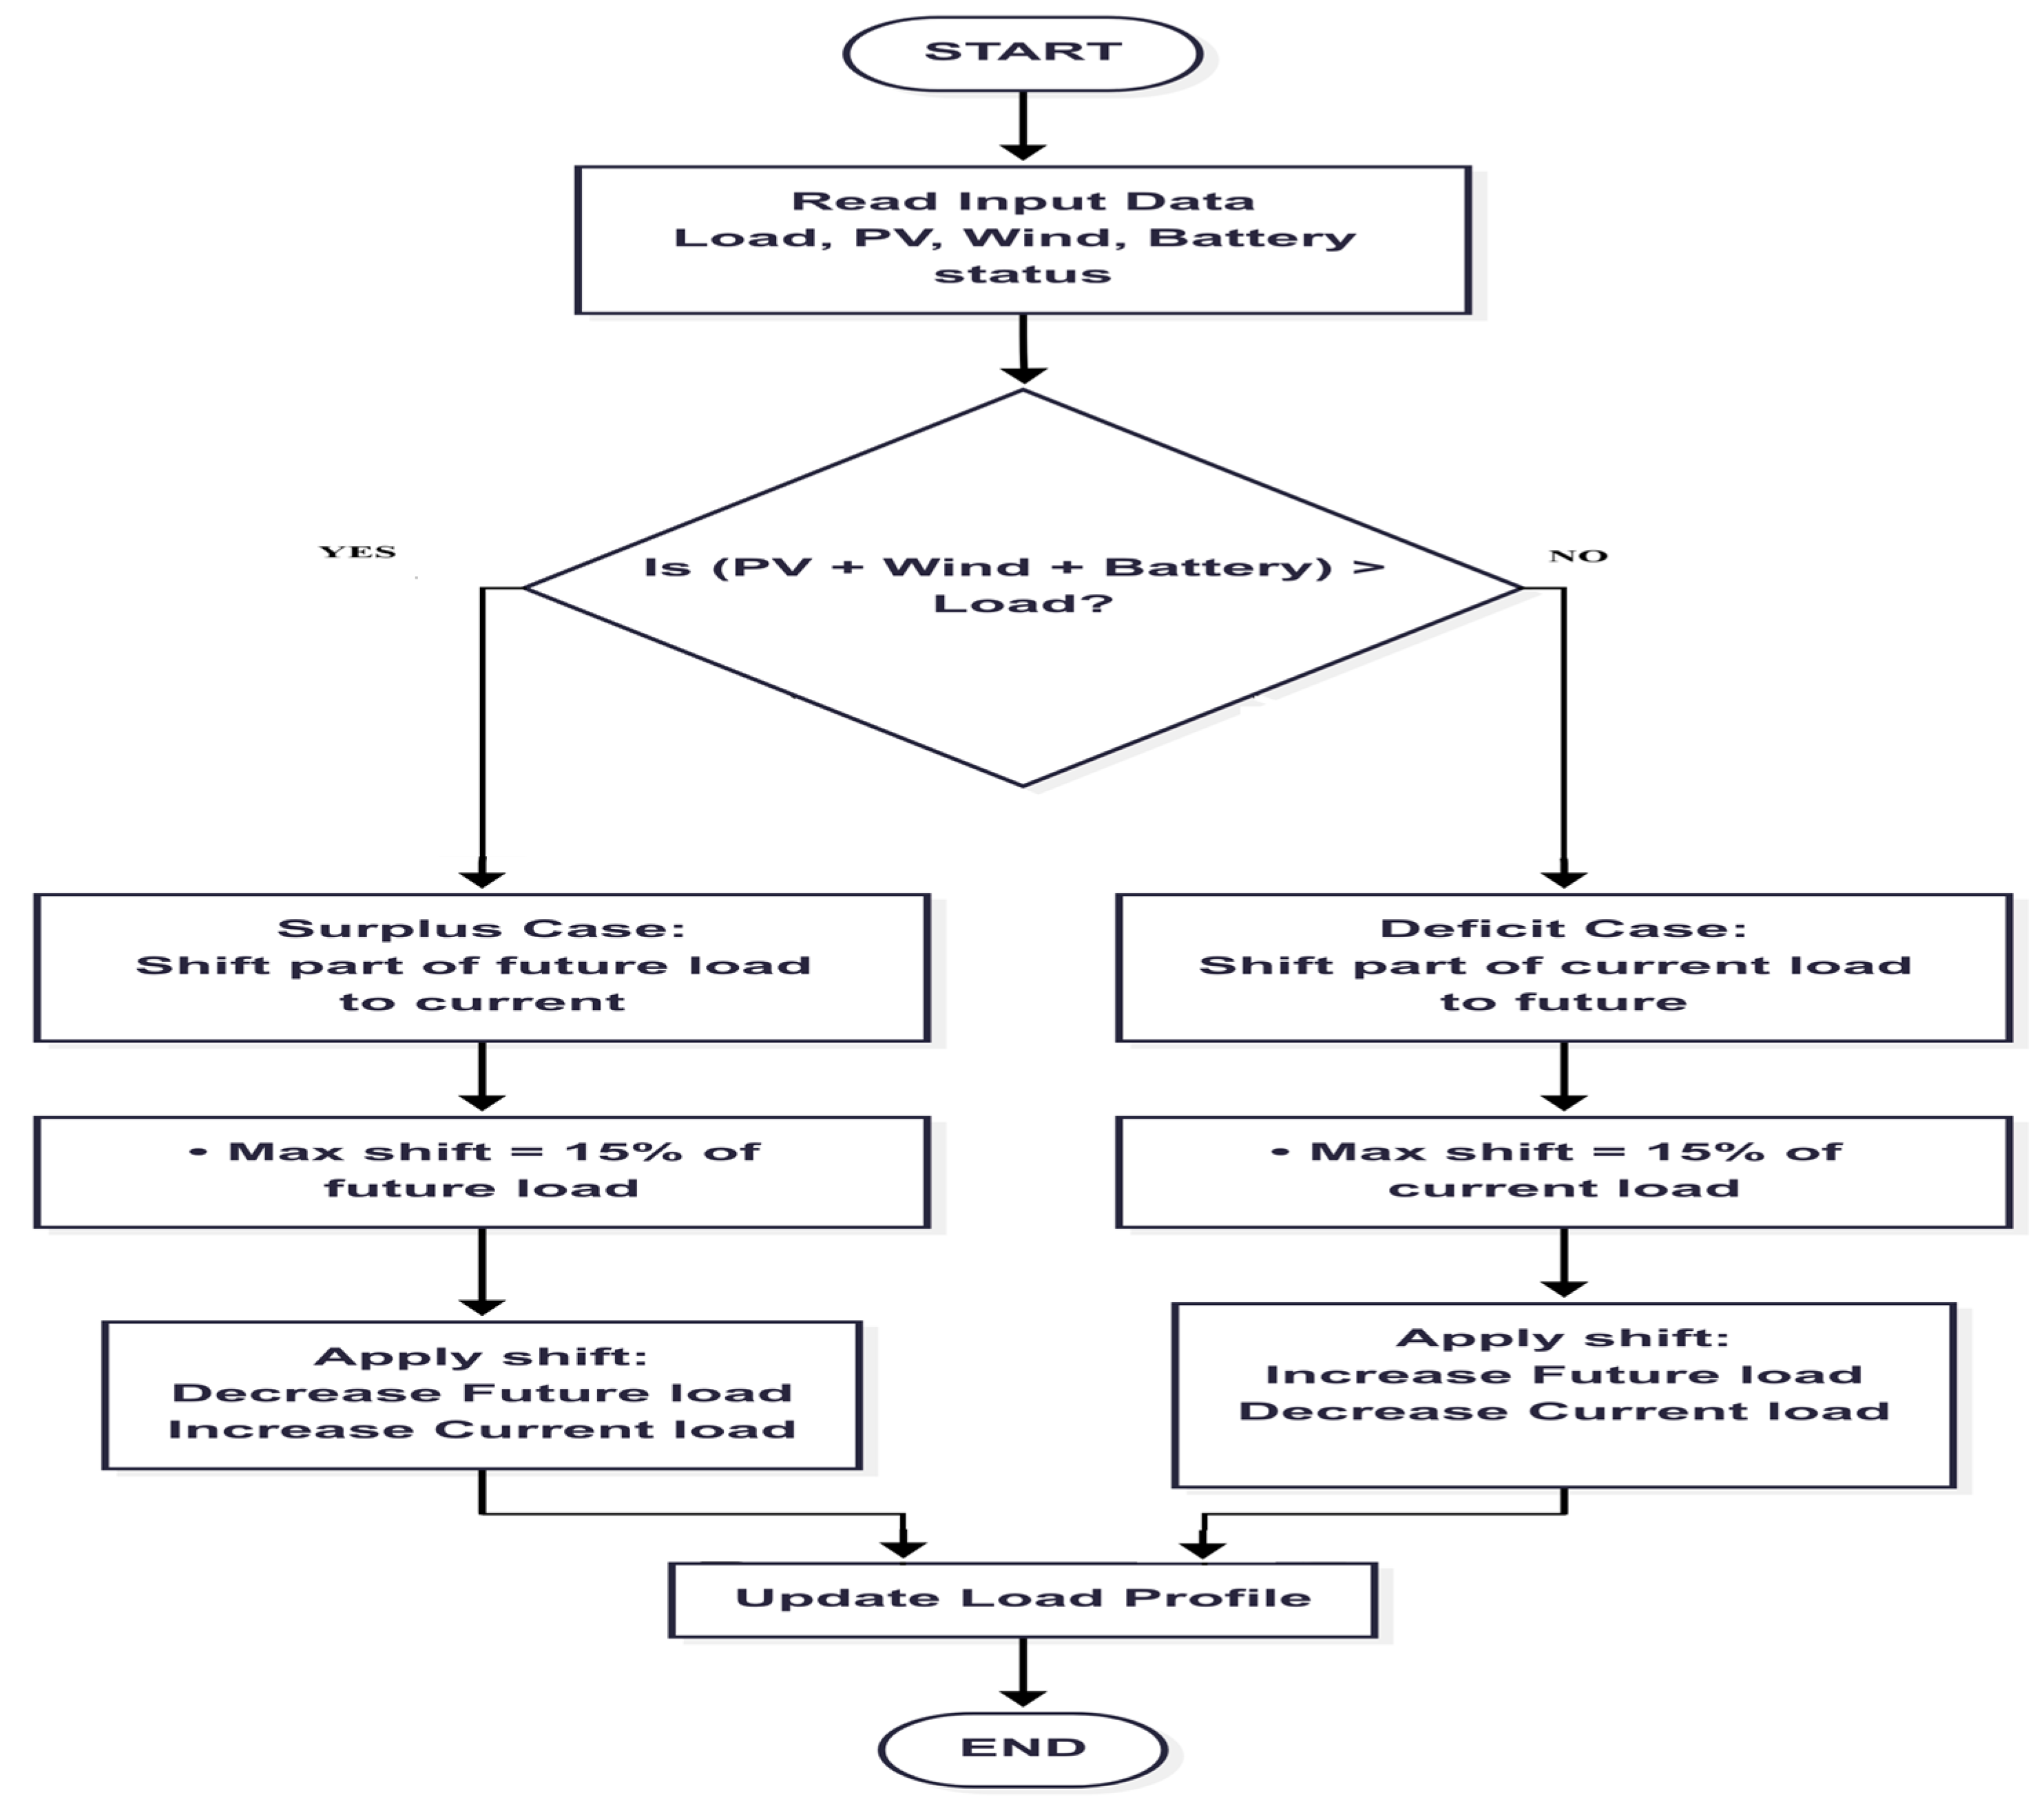
One of the most commonly used demand-side management (DSM) technologies is load shifting, which involves shifting energy consumption from peak hours to non-peak hours. This adjustment modifies the consumer’s load curve. Research has shown that load shifting technology maximizes the utilization of available renewable energy sources while reducing reliance on diesel generators. During periods of insufficient renewable energy, the load is reduced, and during times of excess renewable energy, it is increased. This strategy aims to schedule load adjustments within the same day. In this approach, load shifting is set to 15% of the required load. If the amount of energy to be shifted exceeds the available renewable energy, the load shift is limited to the amount of renewable energy available. The same limitation applies when there is excess renewable energy available [34]. The flowchart in Figure 6 represents the optimization iterative process used to determine the optimal sizes of PV, wind turbines, and battery storage to minimize the cost of energy, where the asterisk (*) denotes optimal design parameters, while Figure 7 represents the logic for DSM load shifting for a hybrid renewable energy system. The optimization rule within the DSM framework is to determine the optimal sizes of PV, wind turbines, and battery storage to minimize the cost of energy. Based on the selected system size, the diesel generator operates as a backup source when renewable generation and battery storage are insufficient.

4.3. Loss of Power Supply Probability

Several important reliability indices are used to describe the reliability of a hybrid energy system, including the Loss of Power Supply Probability (LPSP). This probability of power supply failure, defined as the likelihood that the system will be unable to provide adequate power, can be measured using the LPSP. Loss of power may occur due to technical failures or insufficient energy supplied by the generating sources. The LPSP can be calculated as follows [36]:
L P S P = t = 0 T P o w e r   f a i l u r e   t i m e T
where power failure time refers to periods when load power is greater than the power of renewable resources, diesel generator and a minimum of battery storage together. An LPSP value of 0 indicates that the load will always be supplied, while an LPSP value of 1 will indicate that the load will never be supplied.

4.4. Carbon Dioxide Saving

One of the key advantages of using renewable energy resources is their environmental friendliness. In contrast, diesel generators produce a significant amount of greenhouse gases, making it essential to reduce these emissions to mitigate global warming and other harmful environmental effects. The amount of CO2 produced during electricity generation from a diesel generator can be calculated as follows:
C a r b o n   e m i s s i o n = F d i e s e l e D i e s e l t
where F d i e s e l , e D i e s e l , a n d   t are the amount of fuel consumed by diesel generators in L, the C O 2 emission factor of fuel (where e is 2.641 kg/L for diesel fuel) and the operation time of the diesel generator, respectively.

4.5. Problem Formulation

Sizing a hybrid electrical system is a complex task due to its impact on energy costs and power management within the system. The cost of energy is a critical factor for a hybrid energy system and is defined in Equation (7). To develop an efficient and economically viable microgrid system, it is essential to formulate an objective function for optimization purposes. The primary goal is to maximize power supply while simultaneously minimizing energy costs within the hybrid microgrid framework. This optimization problem focuses on minimizing the cost of energy (COE) and involves adjusting three continuous decision variables: the rated power of the PV array, the number of wind turbines, and the number of autonomy days [19,34]:
C O E $ k W h = N P C ( $ ) t = 1 8760 P l o a d C R F
C R F = i 1 + i n 1 + i n 1
C o n s t r a i n s 0 P W i n d P W i n d , m a x 0 P P V P P V , m a x 0 P B a t t e r y P B a t t e r y , m a x 0 P D i e s e l P D i e s e l , m a x
where NPC is the net present cost, CRF is the capital recovery factor, which depends on the real interest rate i and the project’s lifetime n, P l o a d represents the total demand for the loads, P W i n d represents the power of wind, P P V represents the solar power, P B a t t e r y represents the power of the battery and P D i e s e l represents diesel power. NPC is calculated as shown in Equation (10):
N P C = T A C C R F
T A C = N P V P V C o s t + N W i n d W i n d C o s t + N D i e s e l D i e s e l C o s t                                                                   + N B a t t e r y B a t t e r y C o s t + N I n v I n v C o s t
where N P V , N W i n d , N D i e s e l , N B a t t e r y , and N I n v represent the number of each component in the hybrid system, while P V C o s t , W i n d C o s t ,   B a t t e r y C o s t , I n v C o s t , and D i e s e l C o s t represent the costs of photovoltaic energy system, wind turbines, battery, inverter, and diesel generator, respectively. The cost of any component is calculated as the sum of capital cost, operating and maintenance cost and replacement cost, as in Equation (12):
C o s t   o f   e q u i p m e n t = C a p i t a l   C o s t + O p e r a t i n g   &   M a i n t e n a n c e   C o s t                                         + R e p l a c e m e n t   C o s t

5. Exponential Distribution Optimizer

Five metaheuristic optimization algorithms are employed for the optimal sizing of the hybrid energy system (HES). The newly developed algorithm, EDO, serves as the primary method, while the others, TLBO, WHO, CSA, and PSO, are utilized to validate the performance of EDO. Each algorithm was implemented independently, using the same system data, technical constraints, and objective functions, with the objective of minimizing the Cost of Energy. The first one is Teaching-Learning-Based Optimization (TLBO), which is a population-based metaheuristic inspired by classroom dynamics. It has two main phases: the Teacher Phase, where the best solution (teacher) improves the population average, and the Learner Phase, where solutions interact to share and gain knowledge. TLBO is characterized by its simplicity and does not necessitate the tuning of algorithm-specific parameters. As a result, TLBO has gained significant attention and has been extensively applied to problems including renewable energy system sizing and scheduling [37]. The second one is the Wild Horse Optimizer (WHO), which is a recent swarm-based metaheuristic inspired by the social hierarchy and foraging behavior of wild horse herds. The algorithm divides the population into subgroups that follow leaders, share information, and coordinate movements to find optimal solutions. It has shown competitive results for complex design and power system applications [38]. The third one, Circle Search Algorithm (CSA), is a metaheuristic that simulates the natural circling or spiral motion found in many species’ search behavior. CSA uses circular or spiral trajectories to explore the search space more effectively and balance exploitation and exploration. It is suitable for solving nonlinear, multi-modal problems like Optimal Power Flow incorporating renewable energy uncertainty [39]. The last one is the well-known Particle Swarm Optimization (PSO), which is a well-known population-based metaheuristic inspired by the collective social behavior of bird flocks and fish schools. In PSO, candidate solutions, called particles, move through the search space by adjusting their positions and velocities based on their own best-known position and the best-known positions of their neighbors. This mechanism allows the swarm to balance exploration and exploitation efficiently. PSO has been widely used for hybrid renewable energy system sizing, economic dispatch, and demand side management due to its simplicity, fast convergence, and robust performance on nonlinear optimization problems, such as optimal sizing and cost analysis of hybrid energy storage system for EVs [40]. Exponential Distribution Optimizer (EDO), which is a primary method, is a newly developed Meta-heuristic Algorithm developed in 2023 by Abdel Basset. Its primary objective is optimization problems, both constrained and global ones; its idea comes from exponential probability distribution it has three main parts, which are initialization, exploitation and exploration.
In this study, the algorithms were employed to solve the same optimization problem independently. To evaluate their performance, each algorithm was run for multiple independent trials under identical parameter settings.
The comparison was based on three key metrics which are the computational run time, the best and average objective values obtained across runs, and the standard deviation of the results, which indicates the stability and reliability of each algorithm. This benchmarking approach provides a clear assessment of the efficiency and robustness of each metaheuristic technique.

5.1. Initialization Phase

In this phase, the search process is initialized by a set of randomly distributed n search agents. Using Equation (13),
X W i n n e r s , i , j = L B + r a n d ( U B L B )
where U B , L B , and r a n d are the upper and lower bounds of the search space and a random number between 0 and 1, respectively. As described in Equations (14) and (15), i and j are counters as shown:
i = 1,2 . . n
j = 1,2 . . d
where n is the number of agents, and d is the dimension of the search space.
Additionally, a memoryless matrix, which is an additional matrix, is created to store newly generated solutions. It records both successful and unsuccessful solutions (“winners” and “losers”). Here, information from past solutions is discarded, as it is assumed to have no impact on future iterations. The matrix update is given by Equation (16):
m e m o r y l e s s i t = X w i n n e r s , i t + 1
The next step is to start the optimization process depending on the algorithm’s exploration and exploitation phases.

5.2. Exploitation Phase

The solutions obtained in the initialization are assessed using the objective function and ranked from best to worst. They are then arranged in decreasing order of the objective function for the maximization problems or in ascending order of the objective function for the minimization problems. For finding the global optimum, it is recommended to search in the region around a good solution. So, the guiding solution (Xguide), which is defined as the mean of the first three best solutions of a sorted population and calculated as in Equation (17), helps focus the search in a promising region.
X g u i d e t i m e = X w i n n e r s b e s t 1 t i m e + X w i n n e r s b e s t 2 t i m e + X w i n n e r s b e s t 3 t i m e 3
In the exploitation phase, solutions are categorized into “winners” and “losers.” The winners are updated towards a reference solution, and losers are attracted to the winning solution. The new solution update is based on Equation (18):
X i ( t + 1 ) = a m e m o r y l e s s i t σ 2 + b X g u i d e ( t ) if   X w i n n e r s , i , t = m e m o r y l e s s i t b m e m o r y l e s s i t σ 2 + log φ X w i n n e r s , i , t O t h e r w i s e
where m e m o r y l e s s i t represents the i-th solution derived from the memoryless matrix. The parameter ϕ is a randomly generated number following a uniform distribution within the range of [0, 1]. Furthermore, the adaptive parameters a and b are utilized, along with the random number f generated from the interval [−1, 1]. The precise definitions of these parameters are as follows, using Equations (19)–(24):
a = f 10
b = f 5
f = 2 r a n d 1
σ 2 = 1 λ 2
λ = 1 μ
μ = m e m o r y l e s s i t + X g u i d e ( t ) 2
where σ 2 is the exponential variance that depends on the square of the inverse of the exponential rate ( λ ), and λ itself is the inverse of the mean or expected value of an exponentially distributed random variable (μ).

5.3. Exploration Phase

During the exploration phase, new solutions are generated by two randomly chosen “winners” and the mean solution. The new solution is updated as shown in Equation (25):
X i ( t + 1 ) = X w i n n e r s , i , ( t ) M ( t ) + ( c Z 1 + 1 c Z 2 )
where M(t) is the mean solution of all the agents at time t, and Z 1 and Z 2 are randomly generated vectors (promising solutions) calculated as Equations (26) and (27):
M ( t ) = 1 N i = 1 N X w i n n e r s , i , ( t )
Z 1 = M D 1 + D 2   &   Z 2 = M D 2 + D 1
D 1   a n d   D 2 represent the distances from the mean to two randomly selected winners from the population, and C is a coefficient controlling the proportion of information exchanged between the vectors Z 1 and Z 2 , and is defined as:
c = d f   w i t h   d = 1 1 T t   a n d   f = 2 r a n d 1
where t is the current time, T is the total optimization time, and f is a random number in the range of [−1, 1]. At the end of the optimization process, all the solutions are around the global optimum solution. In the optimal solution, the mean and variance values are expected to be small, whereas the value of the scale parameter λ is large.
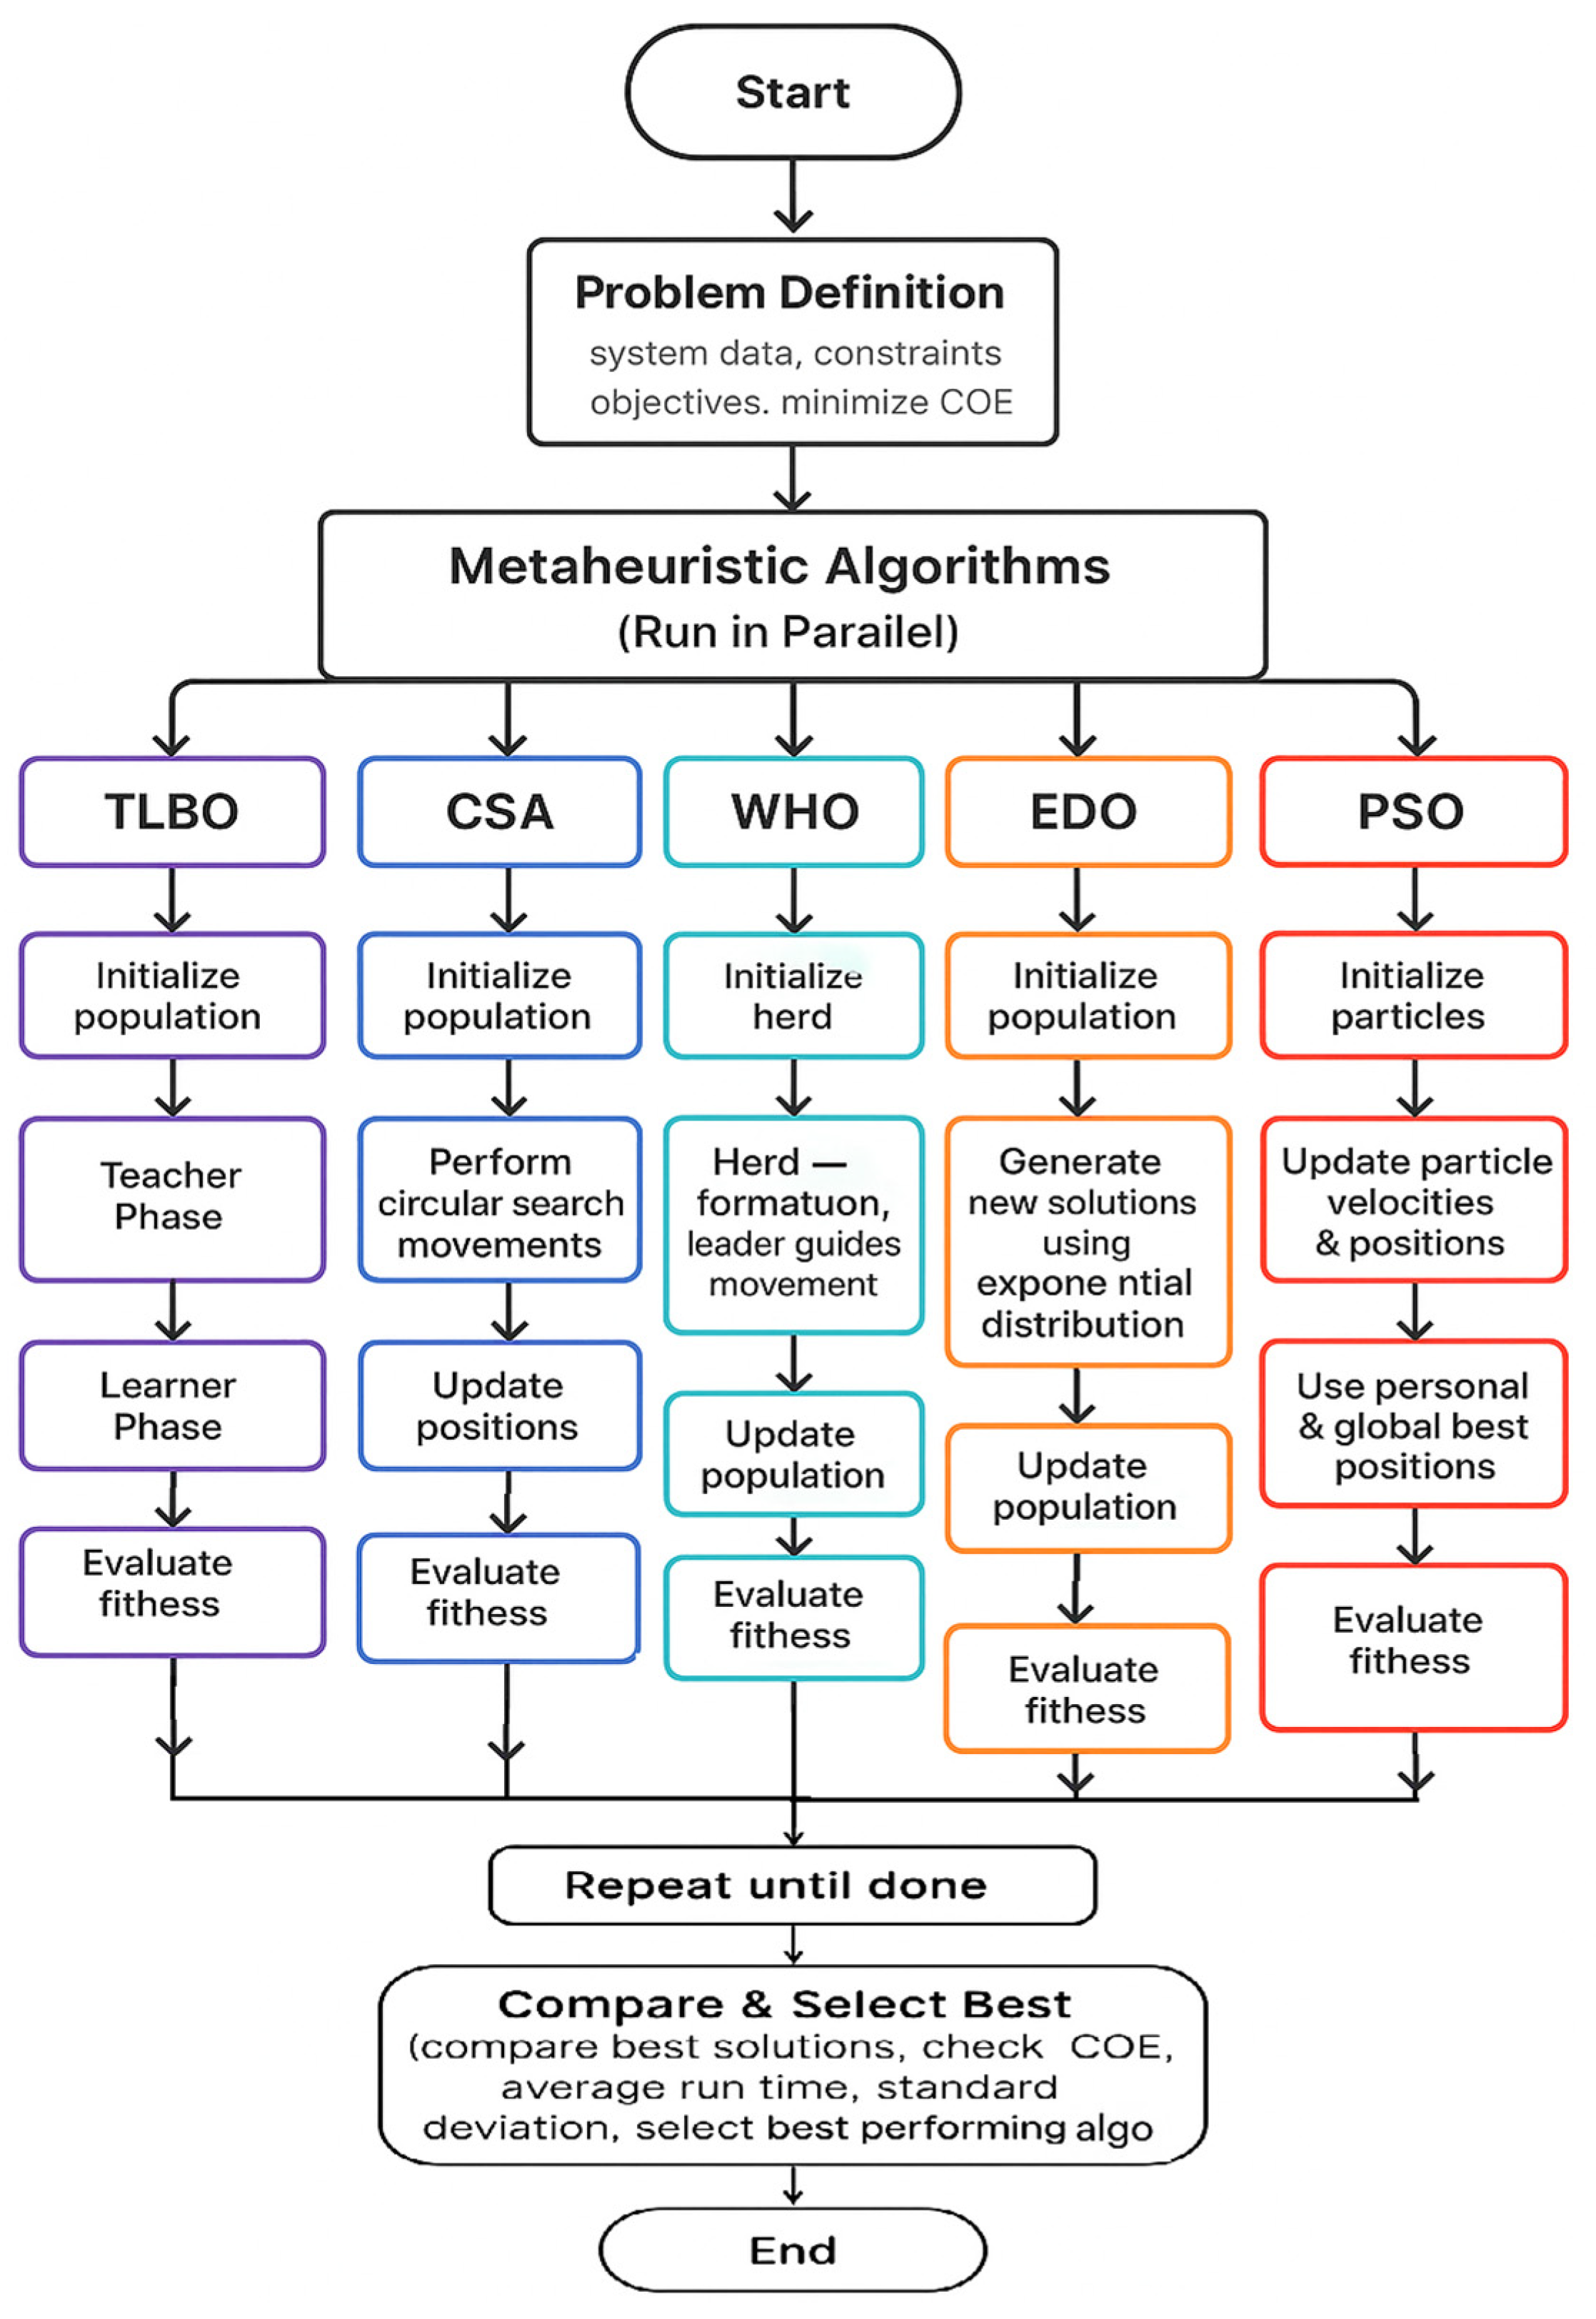
Figure 8 illustrates the step-by-step flow of the metaheuristic optimization process employed in this study, detailing the initialization, evaluation, and iterative improvement stages applied by each algorithm (TLBO, CSA, EDO, WHO, and PSO) to determine the optimal configuration of the hybrid energy system. This systematic procedure ensures robust exploration and exploitation of the solution space to achieve the lowest possible cost of energy while satisfying system constraints. Each algorithm follows its own search mechanism.

6. Results

In this study, the design and optimization processes were carried out using MATLAB R2016a. All simulations were performed on a computer equipped with an Intel Core™ i7-1065G7 CPU @ 1.30 GHz (1.50 GHz, 2 cores) and 16.0 GB of RAM. The results for the system under investigation are presented in this section for the following distinct cases:
  • Case 1: The electrical load is supplied solely by a diesel generator.
  • Case 2: The load is met by renewable energy sources (RESs) without an energy storage system; the diesel generator serves as a backup when RES cannot meet the demand.
  • Case 3: Identical to Case 2 but incorporates demand-side management (DSM) technology.
  • Case 4: The load is primarily supplied by RES supported by an energy storage system, which is charged during periods of surplus renewable generation. The storage system has priority over the diesel generator when RES is insufficient.
  • Case 5: Identical to Case 4, but with the addition of DSM technology.
An optimization technique is applied to determine the optimal sizing of the hybrid energy system (HES) for Case 2 and Case 4. Once optimal sizing is obtained, the cost of energy for each case is calculated to facilitate a comparative analysis. Additionally, total fuel consumption and carbon dioxide (CO2) emissions are assessed to identify the most environmentally sustainable configuration.

6.1. Results of Optimization Techniques

The proposed optimization techniques are utilized to determine the optimal sizing of the hybrid energy system (HES). Specifically, the rated capacity of the photovoltaic (PV) arrays varies between 15 kW and 45 kW, while the number of wind turbine generators ranges from 1 to 10 in Case 2. In Case 4, the number of days of autonomy—ranging from 1 to 3 days—is also included as an additional decision variable to determine the required battery storage capacity. The primary objective in both cases is to minimize the cost of energy (COE) while ensuring system reliability. A 25 kW diesel generator is employed as a backup source in all scenarios to cover potential shortfalls in renewable generation and storage.

6.1.1. Results of Optimization Techniques Used in Case 2

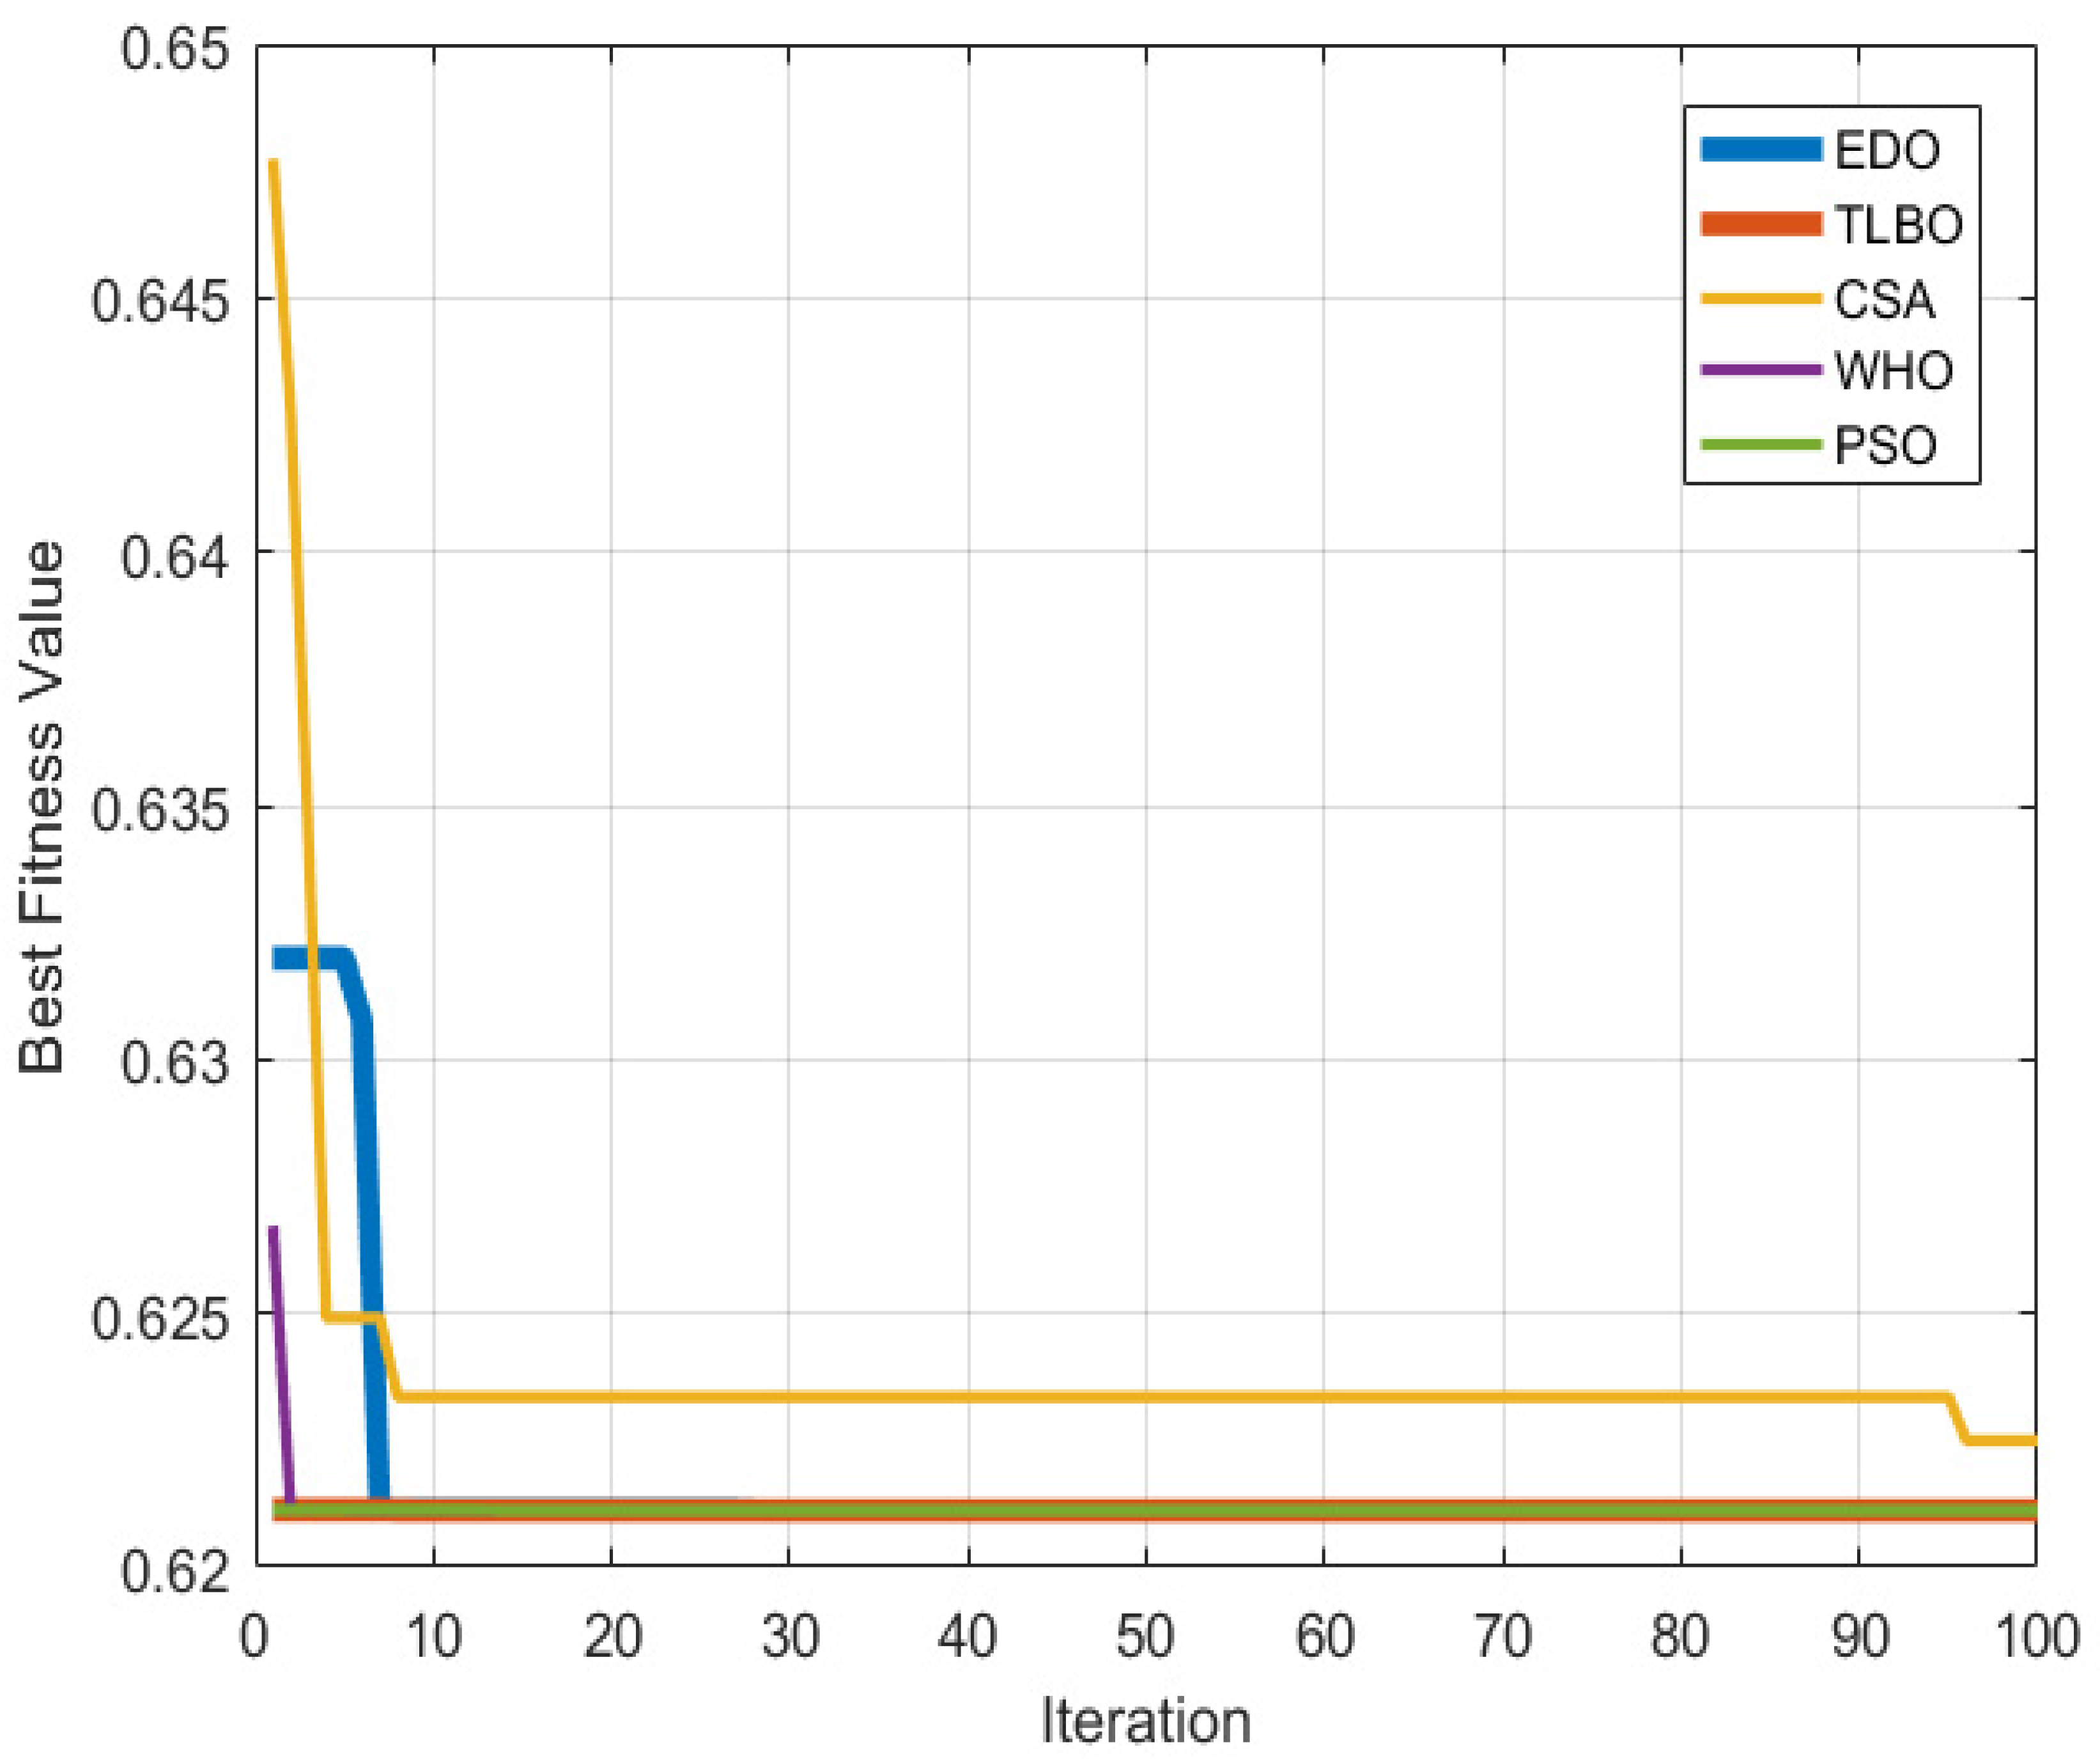
The optimization results were evaluated over 10 runs, each consisting of 100 iterations, with a population size of 50 and a problem dimension of 2, as summarized in Table 3, while Figure 9 shows the convergence behavior of the applied metaheuristic algorithms during the optimization process. The plot demonstrates how each algorithm iteratively improves the solution quality by minimizing the cost of energy (COE) over successive generations, ultimately reaching a stable optimal value.
A comparative analysis of five metaheuristic optimization techniques—Teaching-Learning-Based Optimization (TLBO), Circle Search Algorithm (CSA), Exponential Distribution Optimization (EDO), Wild Horse Optimization Algorithm (WHO), and Particle Swarm Optimization (PSO)—was conducted to determine the optimal Cost of Energy (COE) for the hybrid energy system. As summarized in Table 3, TLBO, EDO, WHO, and PSO each achieved the lowest COE of USD 0.6211/kWh, demonstrating consistent convergence to the same optimal solution. Among these, the WHO algorithm delivered the shortest average computation time of 680.49 s, highlighting its computational efficiency. In contrast, while the TLBO algorithm delivered the highest average computation time of 1604.84 s, CSA produced a slightly higher COE of USD 0.6288/kWh, with an average run time of 905.18 s. Notably, CSA also showed a relatively larger standard deviation (3.041 × 10⁻³) in its results, indicating greater variability and less consistent convergence than the other methods. By contrast, TLBO, EDO, WHO, and PSO exhibited extremely stable performance, with standard deviations effectively negligible (on the order of 10−16). These findings confirm the robustness and reliability of the selected metaheuristic approaches—particularly WHO and EDO for solving the hybrid system sizing problem efficiently and accurately.

6.1.2. Robustness Analysis for Case 2

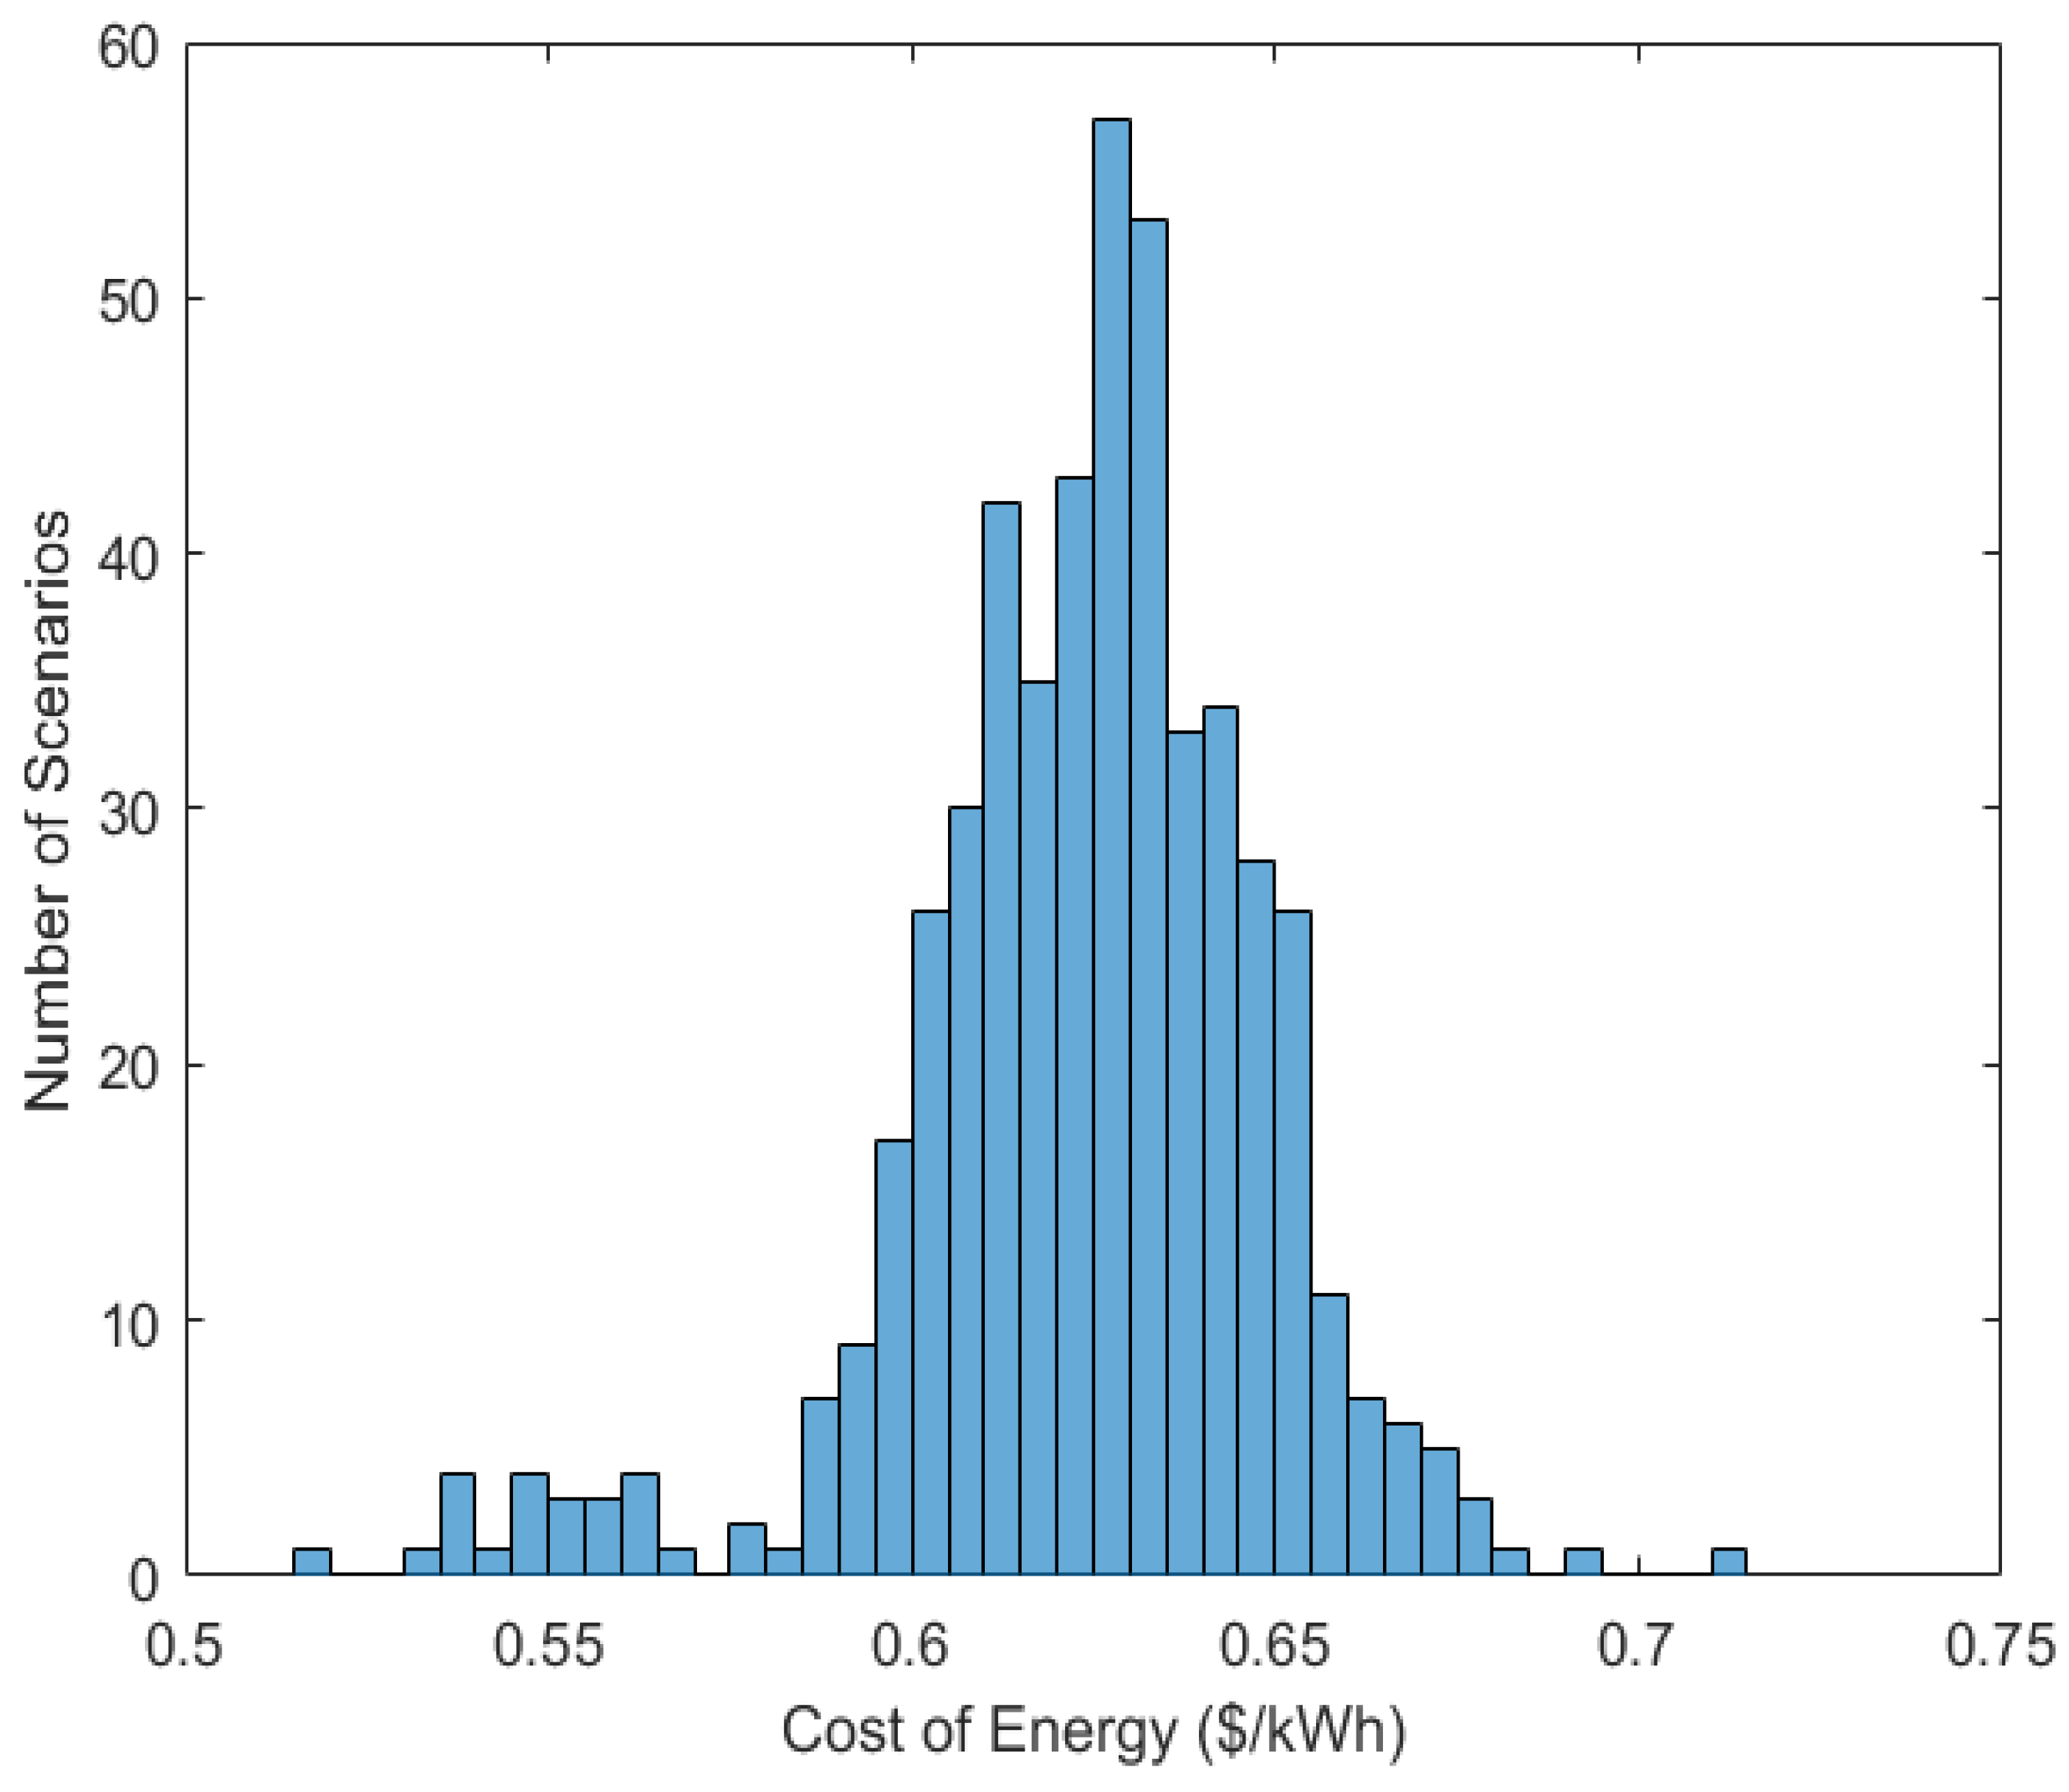
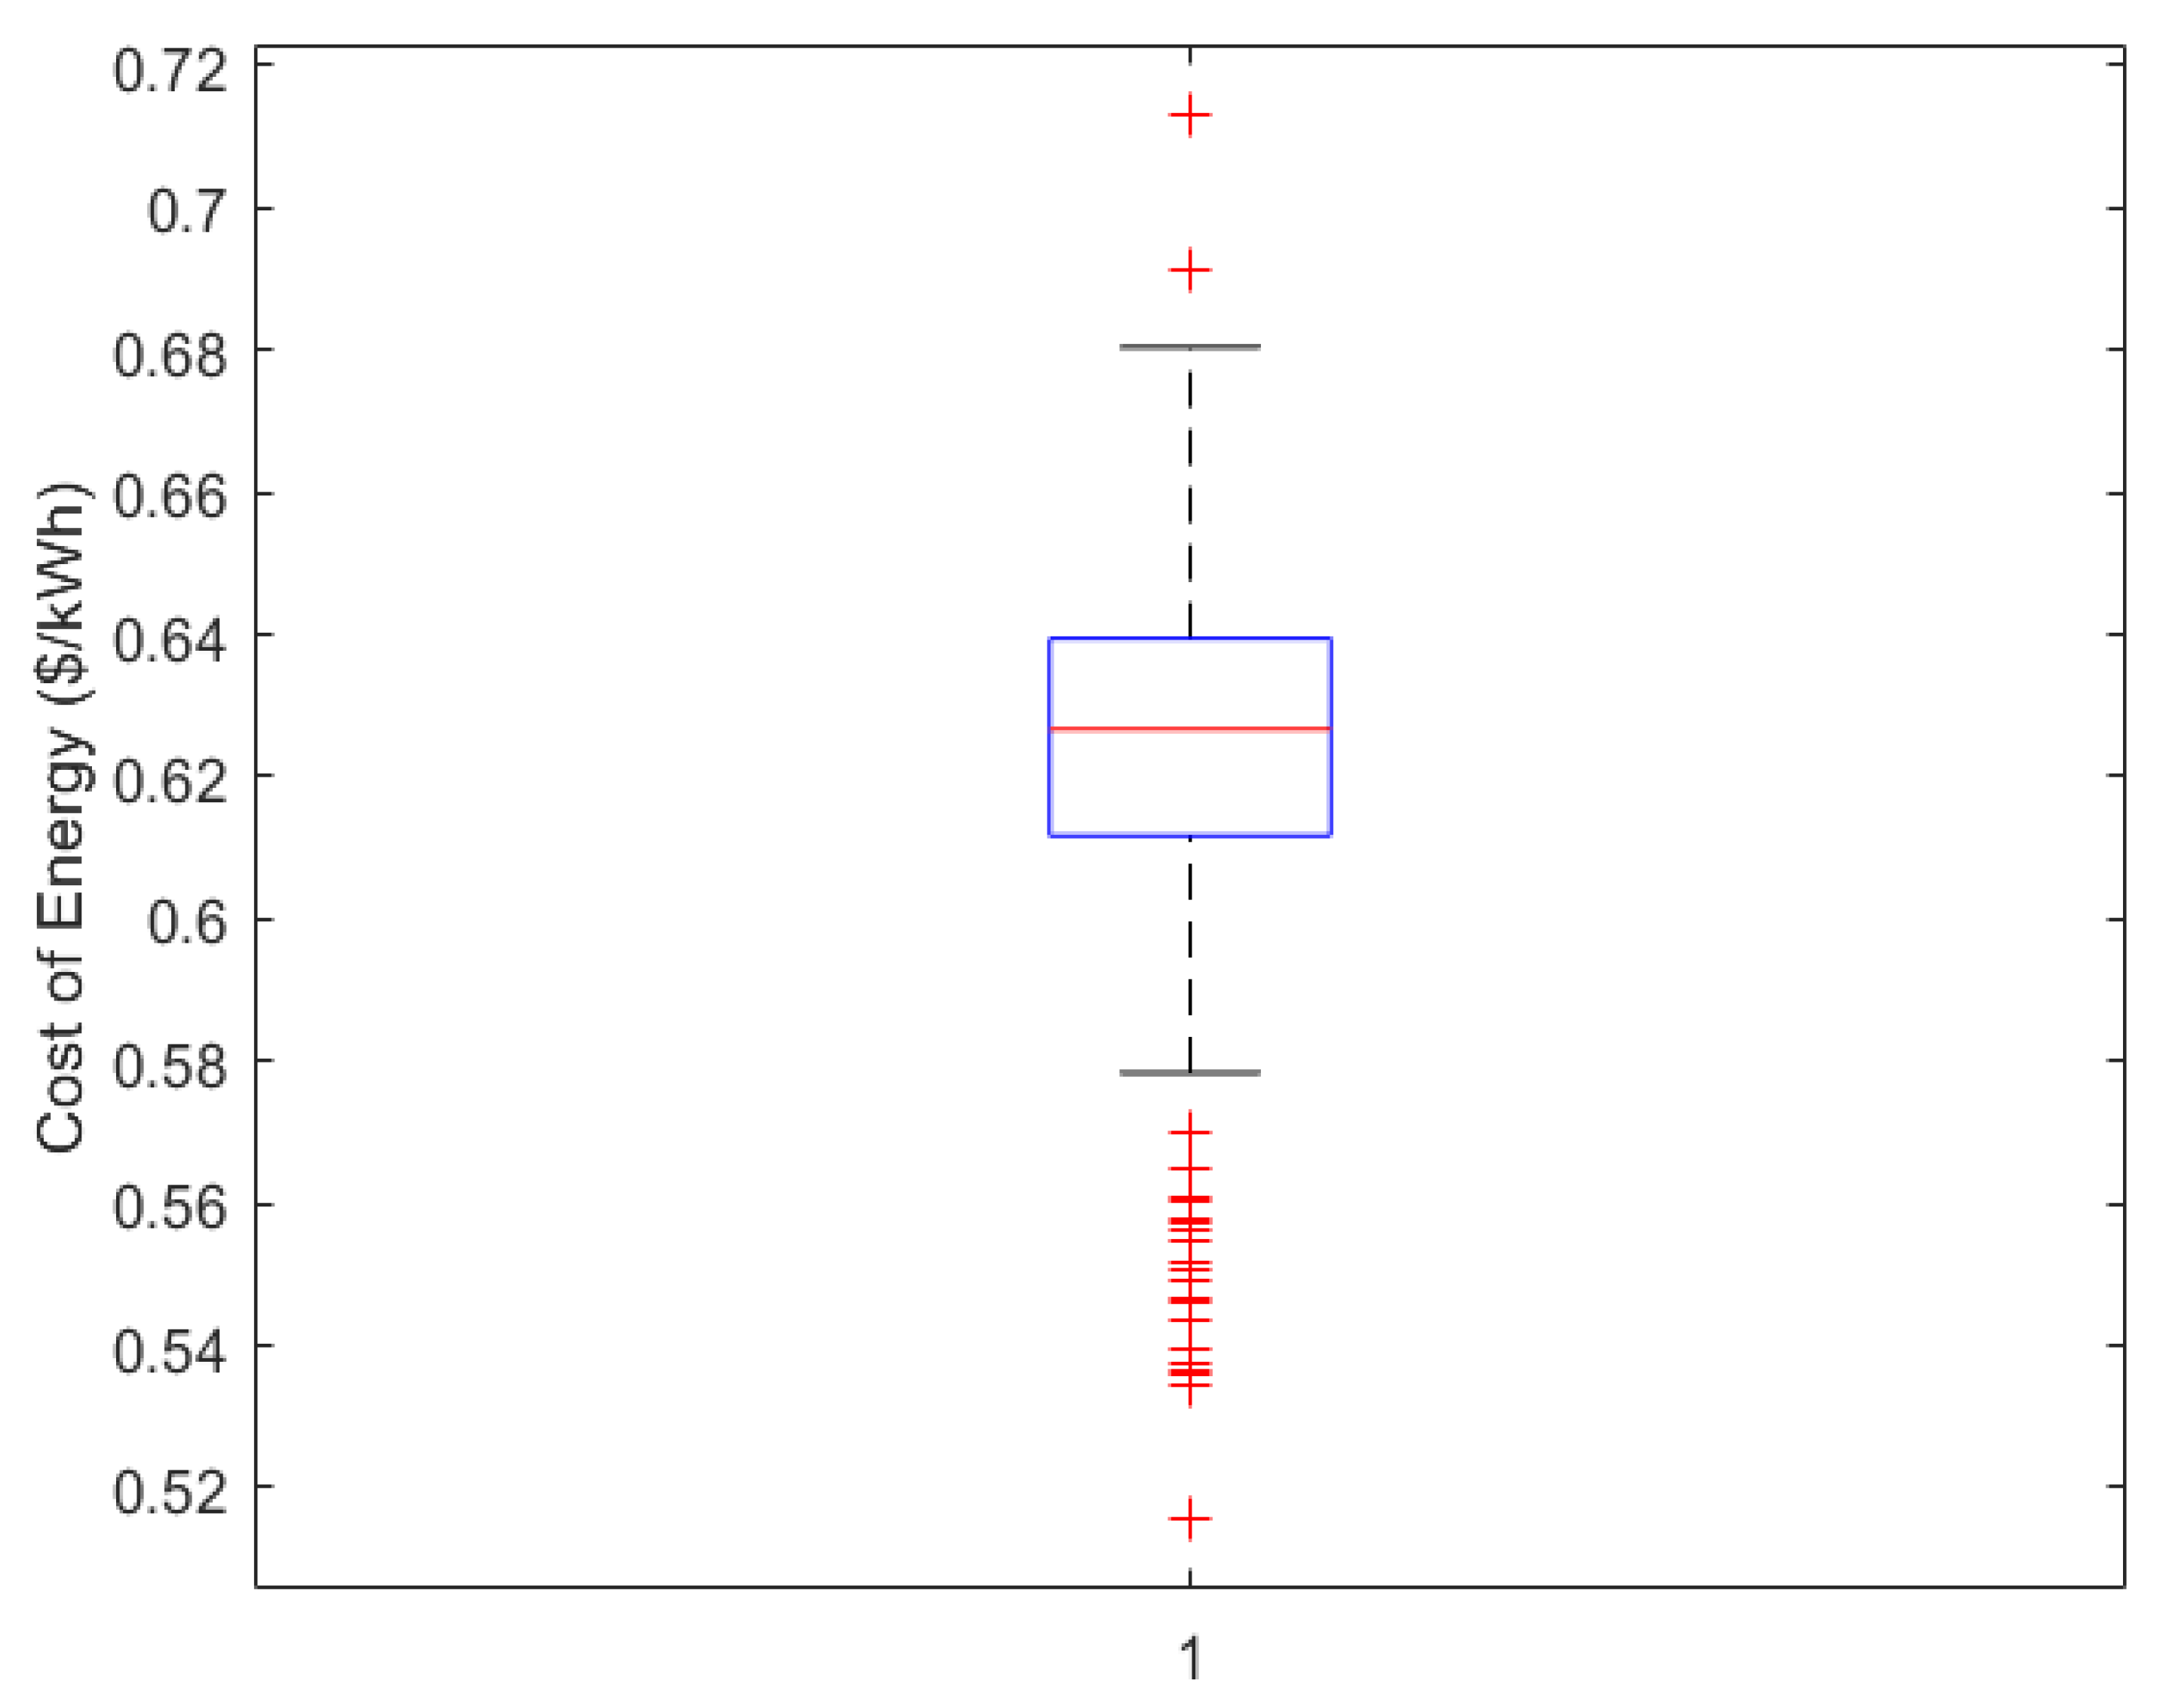
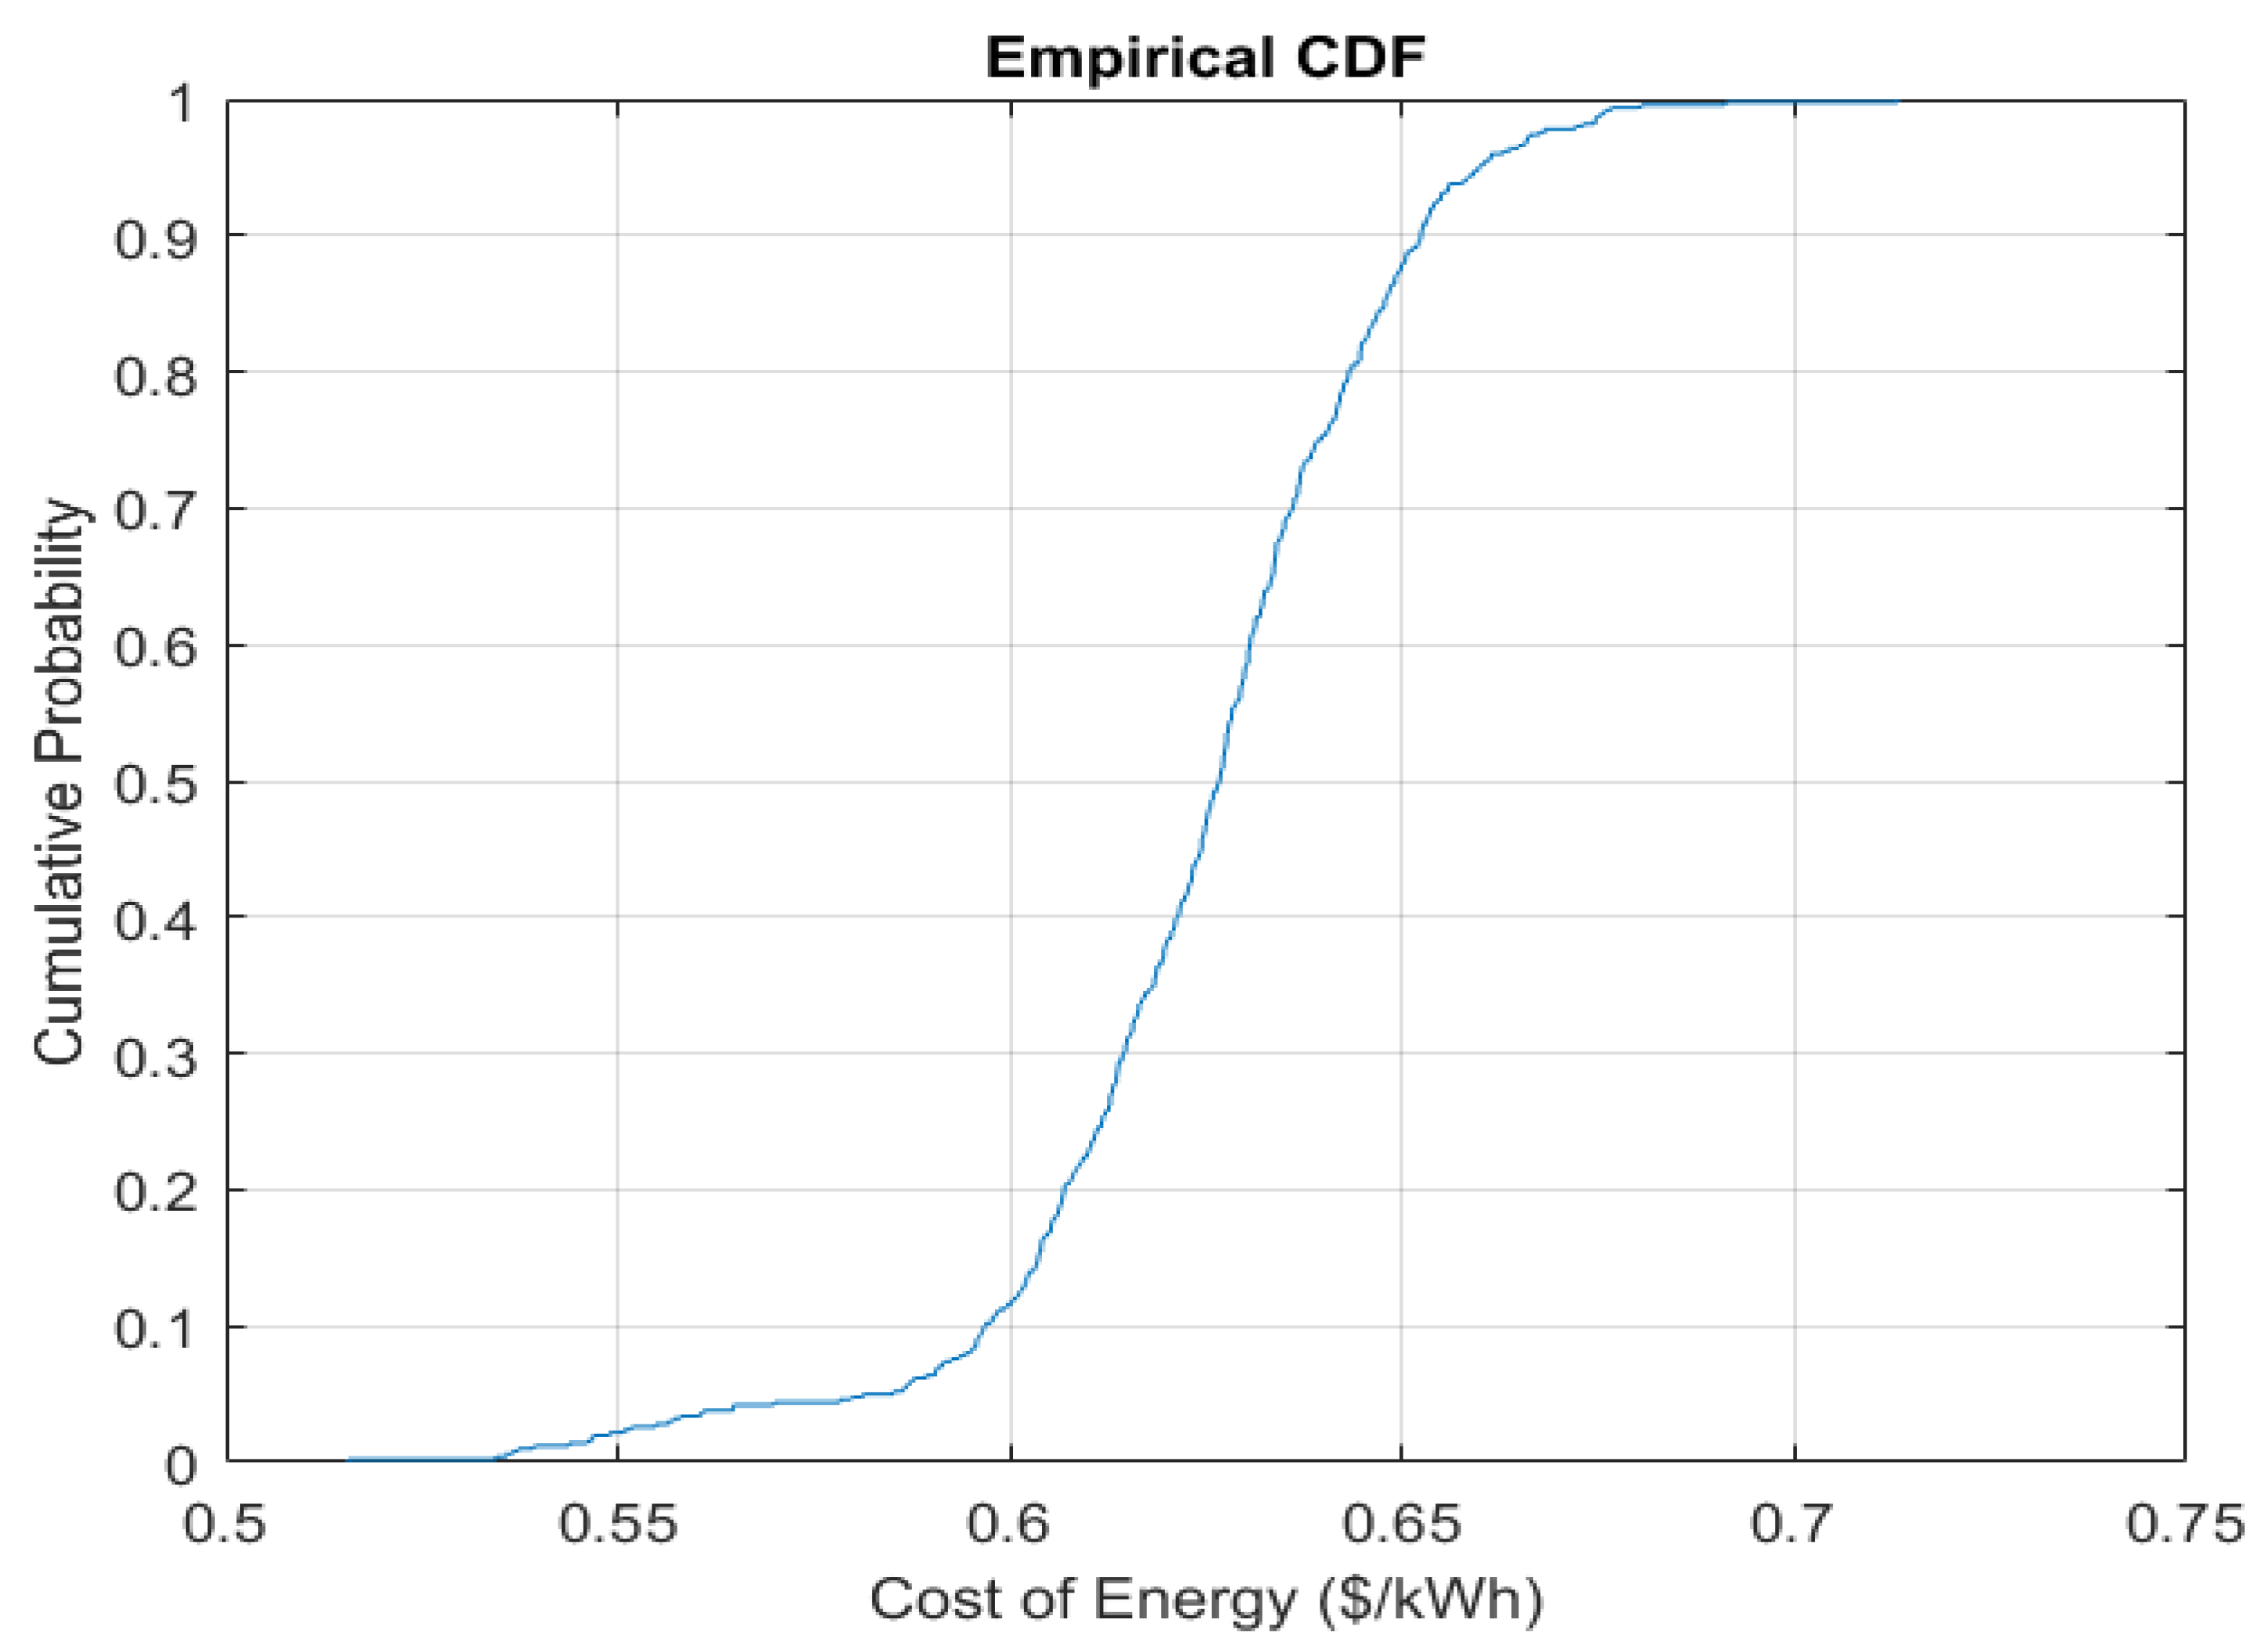
To verify the reliability and practicality of the optimal configuration identified for Case 2, a detailed robustness analysis was conducted using a Monte Carlo simulation framework. This method takes into account the inherent uncertainties in renewable resource availability, such as wind speed, solar irradiance, and load demand, all of which can significantly impact the techno-economic performance of hybrid energy systems in real-world scenarios. In this analysis, 500 independent scenarios were generated by introducing stochastic variations of ±10% to the hourly wind, solar, and ±5% to load profiles throughout the entire annual cycle. For each scenario, the cost of energy (COE) was recalculated to evaluate the variability and sensitivity of the system’s performance in response to these realistic fluctuations; statistical measures including the mean, standard deviation, and relative standard deviation are presented. Additionally, a histogram, box plot, and cumulative distribution function (CDF) are presented to visualize the dispersion and confidence levels of the optimized solution; the results of robustness analysis for Case 2 are shown in Table 4.
For the results obtained in Table 4, the Monte Carlo analysis confirmed that the optimal system design for Case 2 maintains robust performance under uncertainty. Across the 500 generated scenarios, the cost of energy (COE) demonstrated a mean value of USD 0.6236/kWh, with a standard deviation of ±0.0260, yielding a relative standard deviation (RSD) of 4.16%, which indicates low variability relative to the mean. The COE values ranged from a minimum of USD 0.5275/kWh to a maximum of USD 0.7044/kWh. Notably, in all scenarios, the system ensured supply reliability due to the presence of the diesel generator, which acts as a backup to cover any shortfall during adverse renewable conditions or unexpected load spikes. Figure 10 shows the histogram that illustrates the probability distribution of the cost of energy (COE) across 500 Monte Carlo scenarios, highlighting how the system’s economic performance varies under uncertainties in renewable resource availability and load demand, Figure 11 shows box plot of the COE distribution, which shows the spread, median, and interquartile range of the COE values, while Figure 12 presents the cumulative distribution function (CDF), offering a clear understanding of the confidence level associated with the optimized system’s performance under stochastic conditions. This demonstrates that the optimized configuration can deliver stable and predictable economic performance, even in the presence of realistic variations in input parameters.

6.1.3. Results of Optimization Techniques Used in Case 4

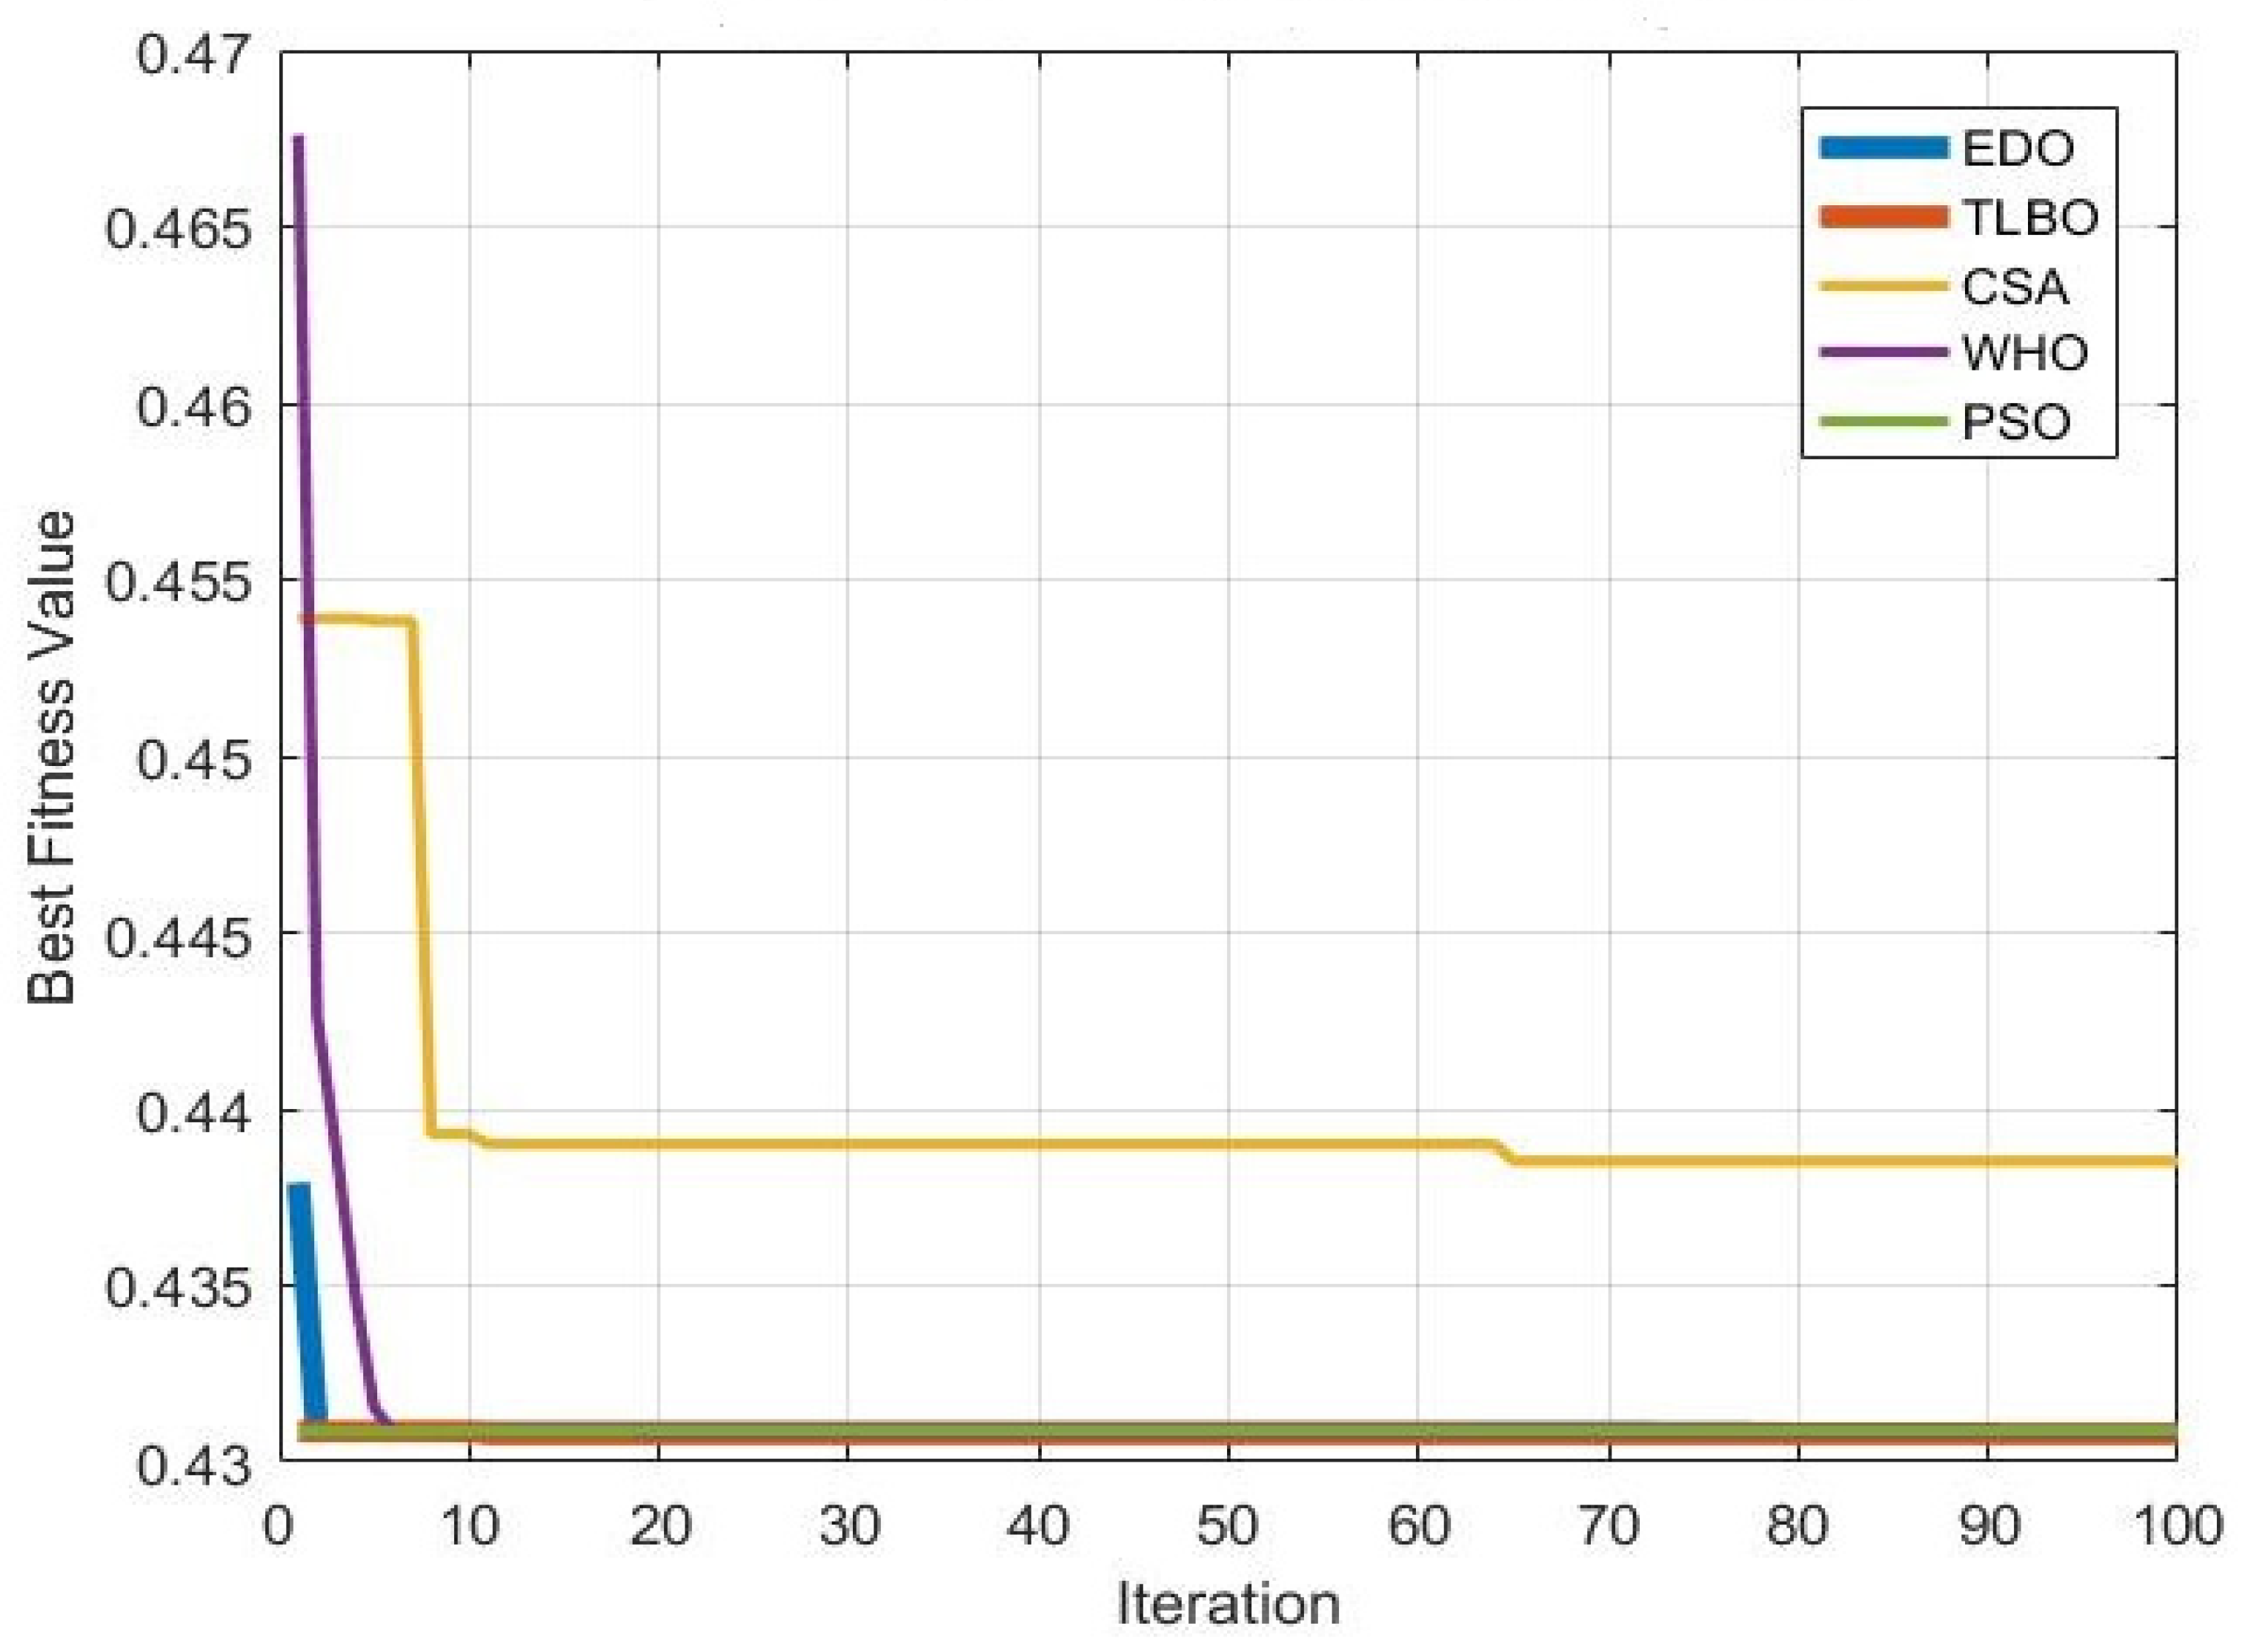
These results were obtained over 10 independent runs, each consisting of 100 iterations, with a population size of 50 and a problem dimensionality of 3, as presented in Table 5. Figure 13 illustrates the variation in the optimal cost of energy with respect to the number of iterations for Case 4 using different optimization techniques.
The results summarized in Table 5 show that the Teaching-Learning-Based Optimization (TLBO) algorithm achieved the lowest Cost of Energy (COE) at USD 0.43084/kWh, with an average computation time of 1843.28 s and a standard deviation of 5.16 × 10⁻⁵, indicating a highly consistent outcome. The Exponential Distribution Optimization (EDO) algorithm produced a nearly identical COE of USD 0.43092/kWh, with a shorter average computation time of 898.97 s and a similarly low standard deviation of 6.32 × 10⁻⁵, demonstrating robust repeatability. The Wild Horse Optimizer (WHO) achieved a COE of USD 0.43088/kWh, ranking among the best solutions while delivering the fastest execution time of 757.33 s and a standard deviation of 4.22 × 10⁻⁵, confirming its reliability and computational efficiency. The Particle Swarm Optimization (PSO) technique also found a comparably low COE of USD 0.43089/kWh, with an average time of 962.83 s and a standard deviation of 4.83 × 10⁻⁵, showing stable and efficient performance. In contrast, the Circle Search Algorithm (CSA) produced a slightly higher COE of USD 0.44469/kWh, with an average computation time of 903.71 s but a noticeably higher standard deviation of 4.066 × 10⁻³, indicating greater variability in its solutions compared to the other methods. Overall, the results demonstrate that TLBO, EDO, WHO, and PSO all delivered highly competitive COE values with minimal variability, while WHO stood out for achieving the fastest computational time. These findings confirm that the hybrid energy system’s most cost-effective configuration for Case 4 comprises ten wind turbine generators, 15 kW of PV capacity, and a battery storage system sized for three days of autonomy, with a 23 kW diesel generator employed as a backup source in all scenarios to cover potential shortfalls in renewable generation and storage.

6.1.4. Robustness Analysis for Case 4

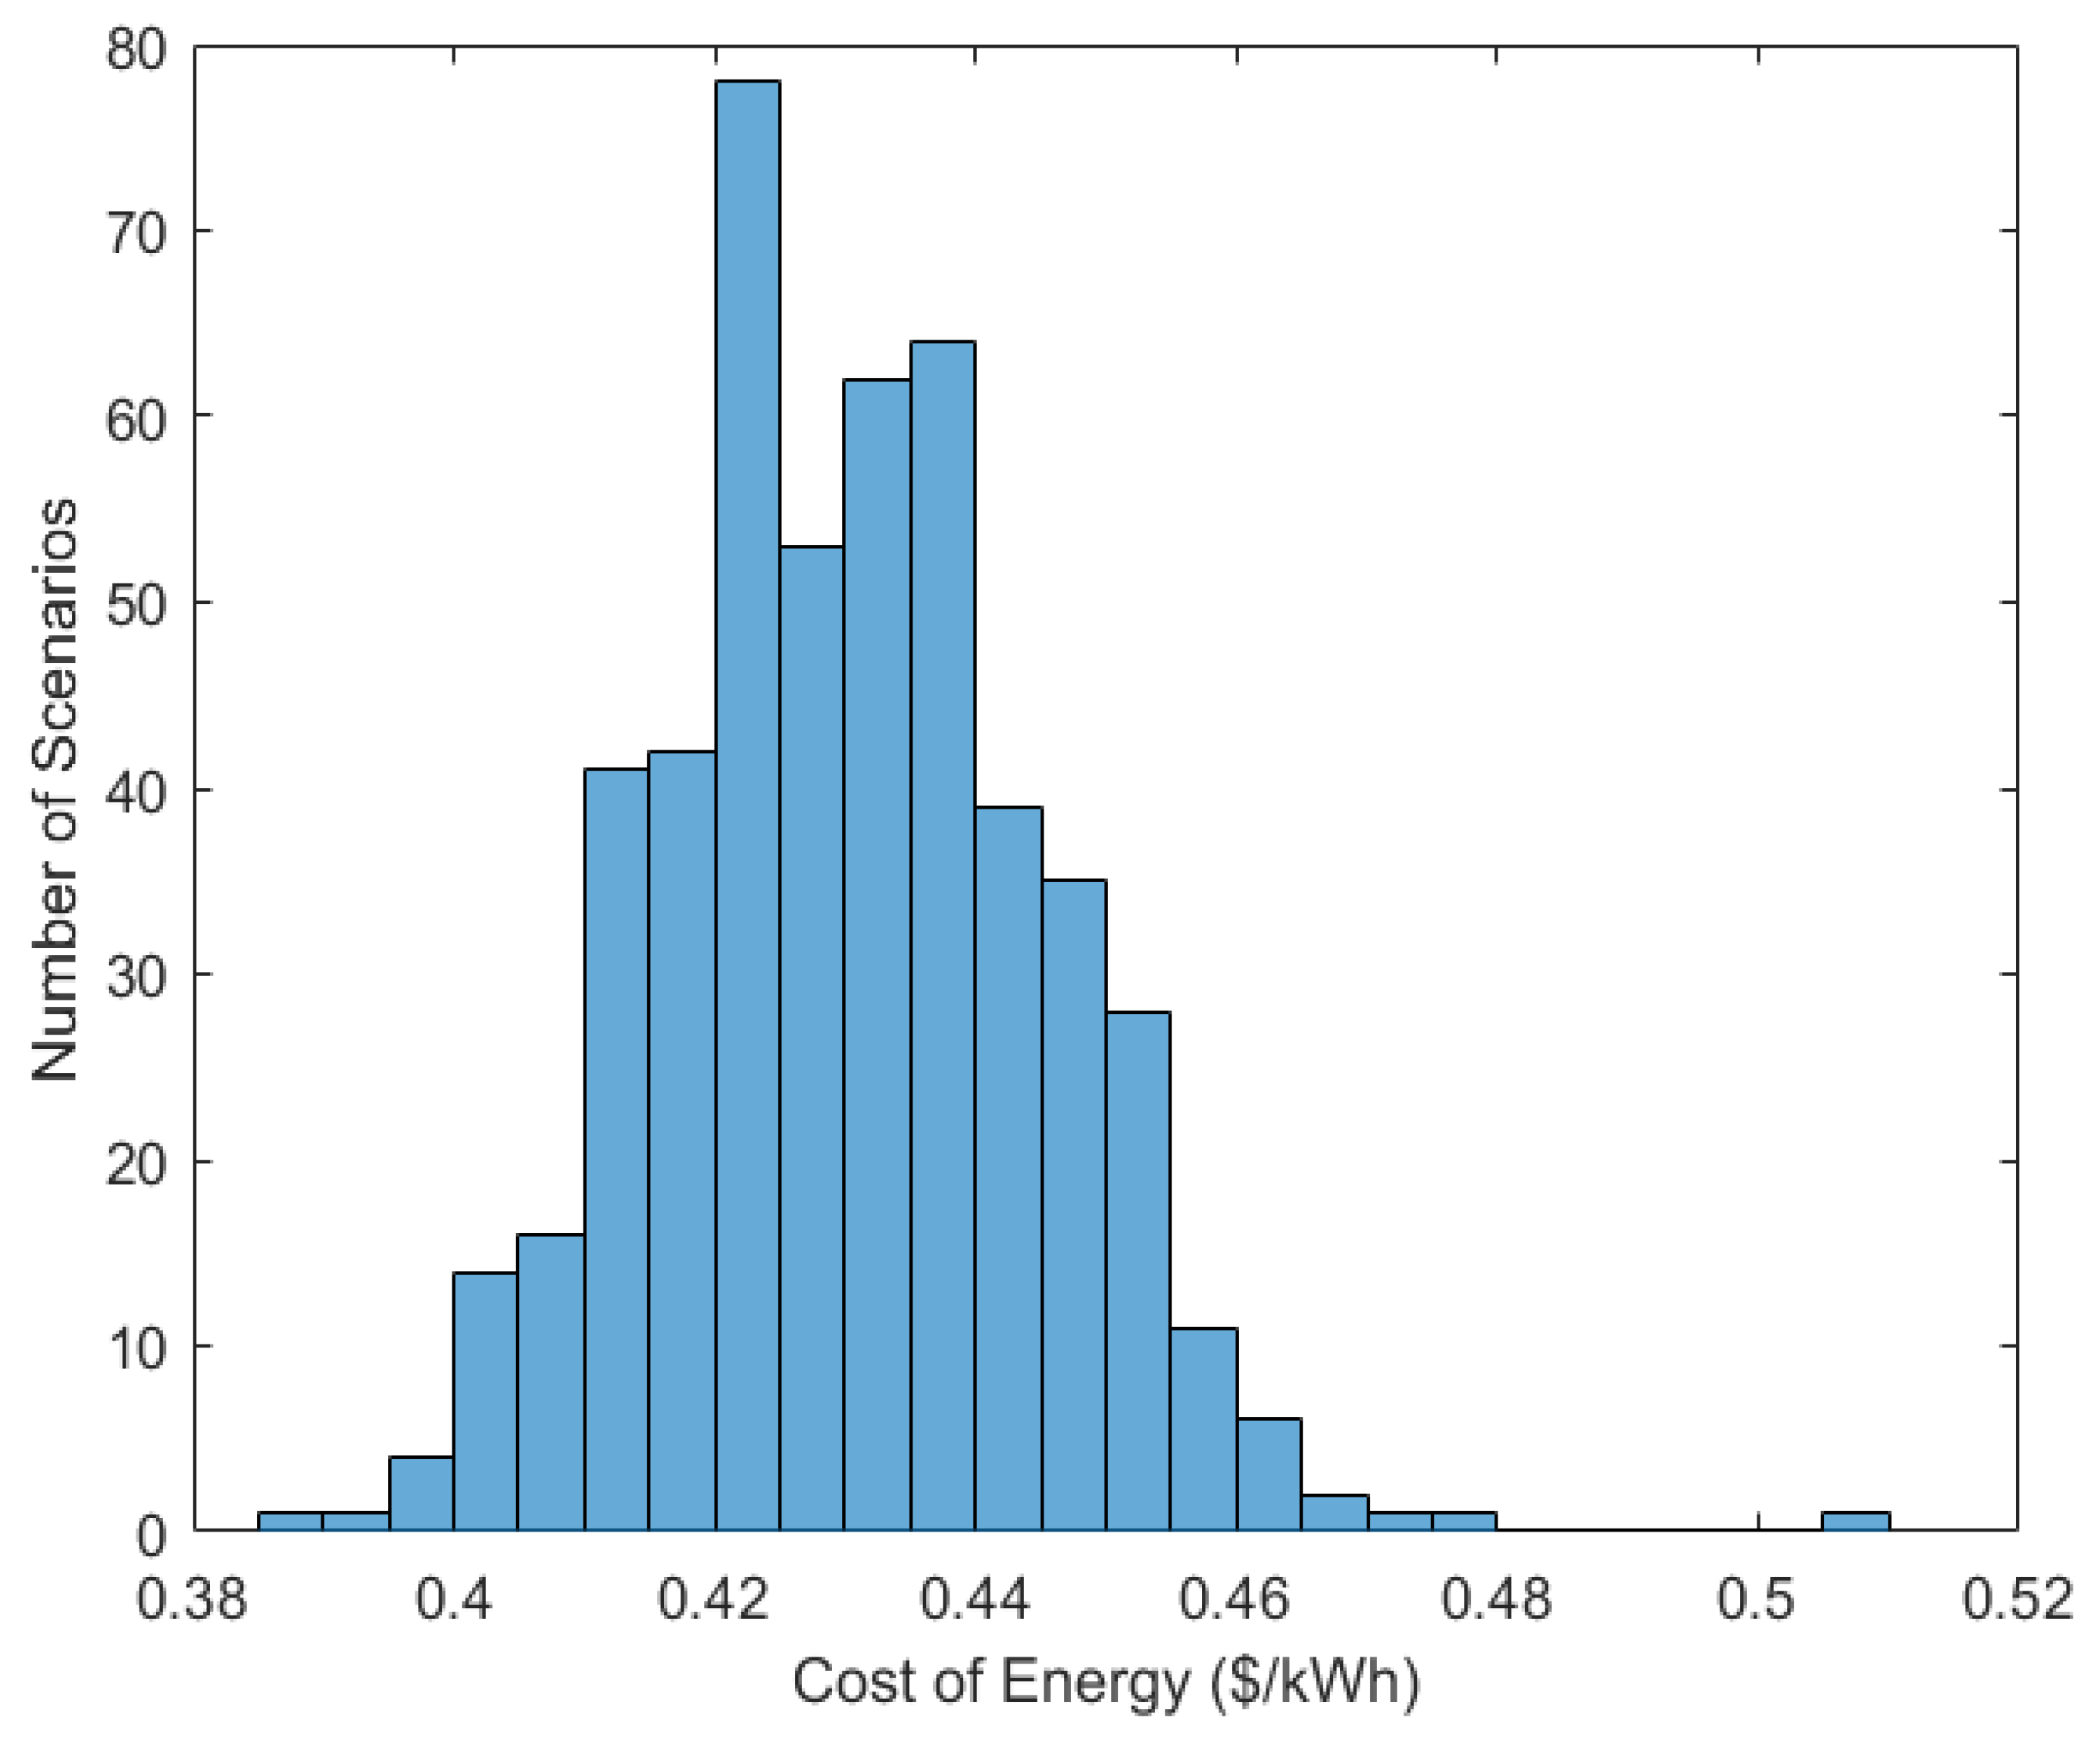
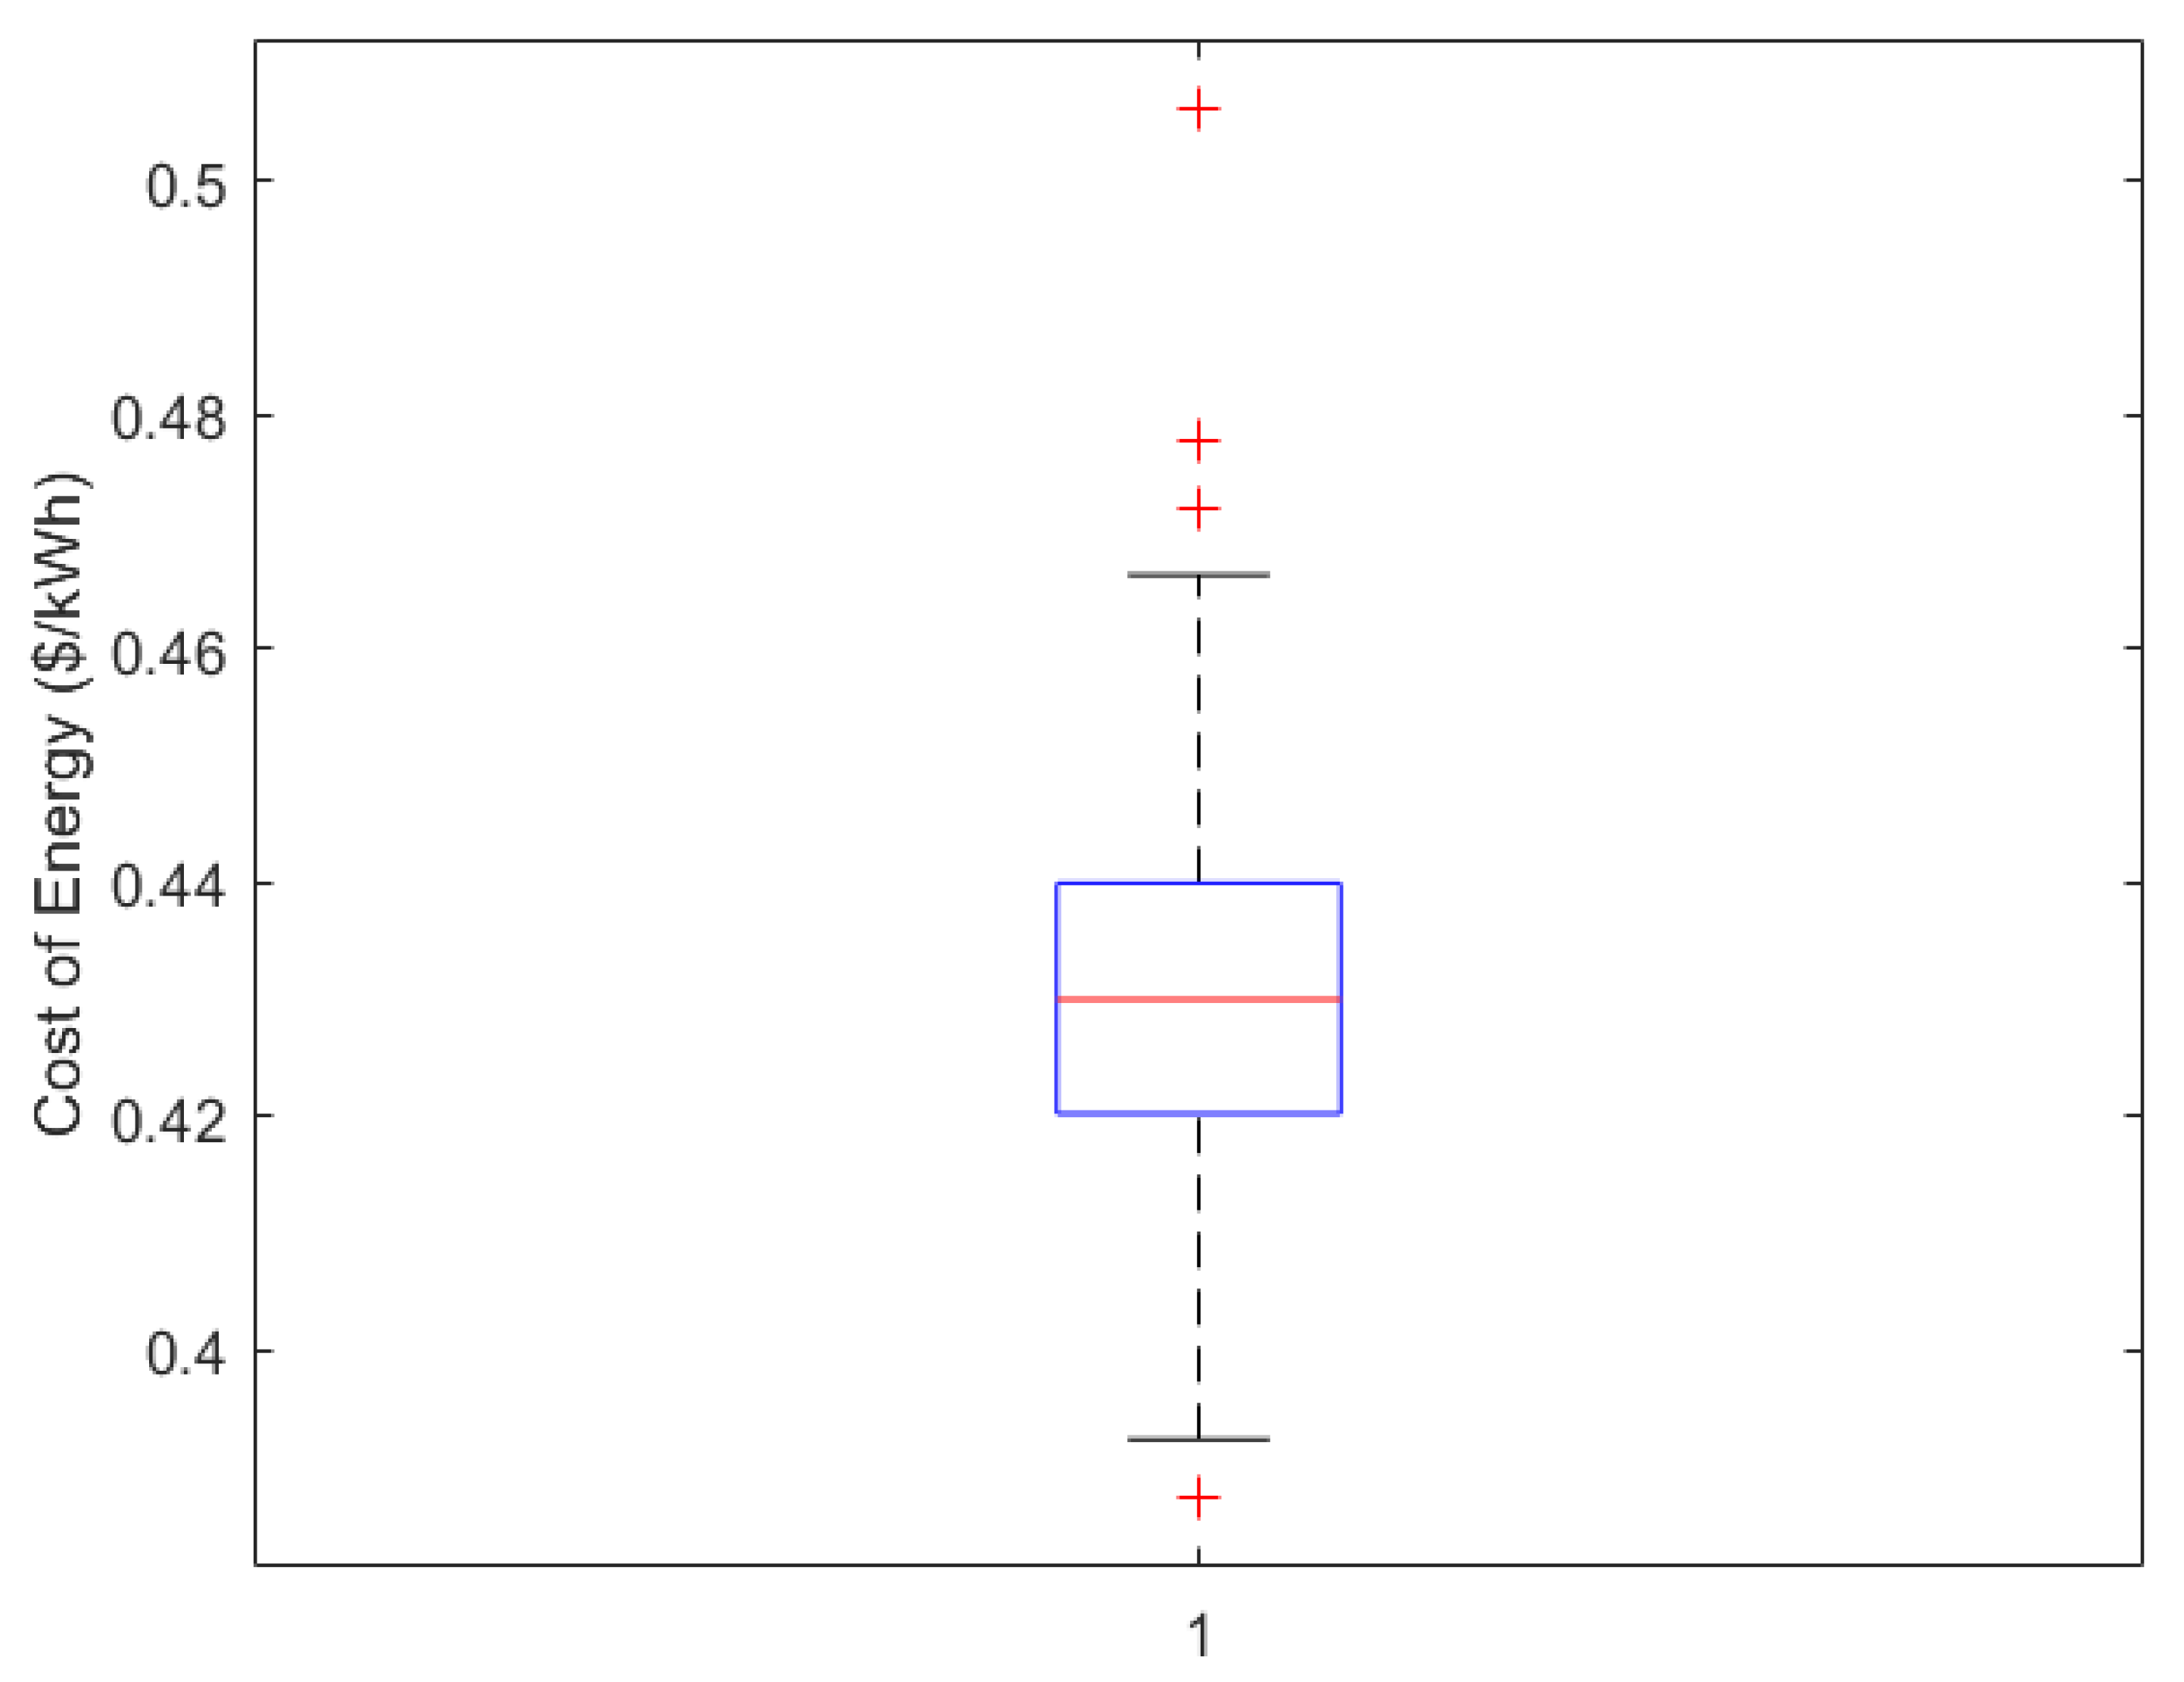
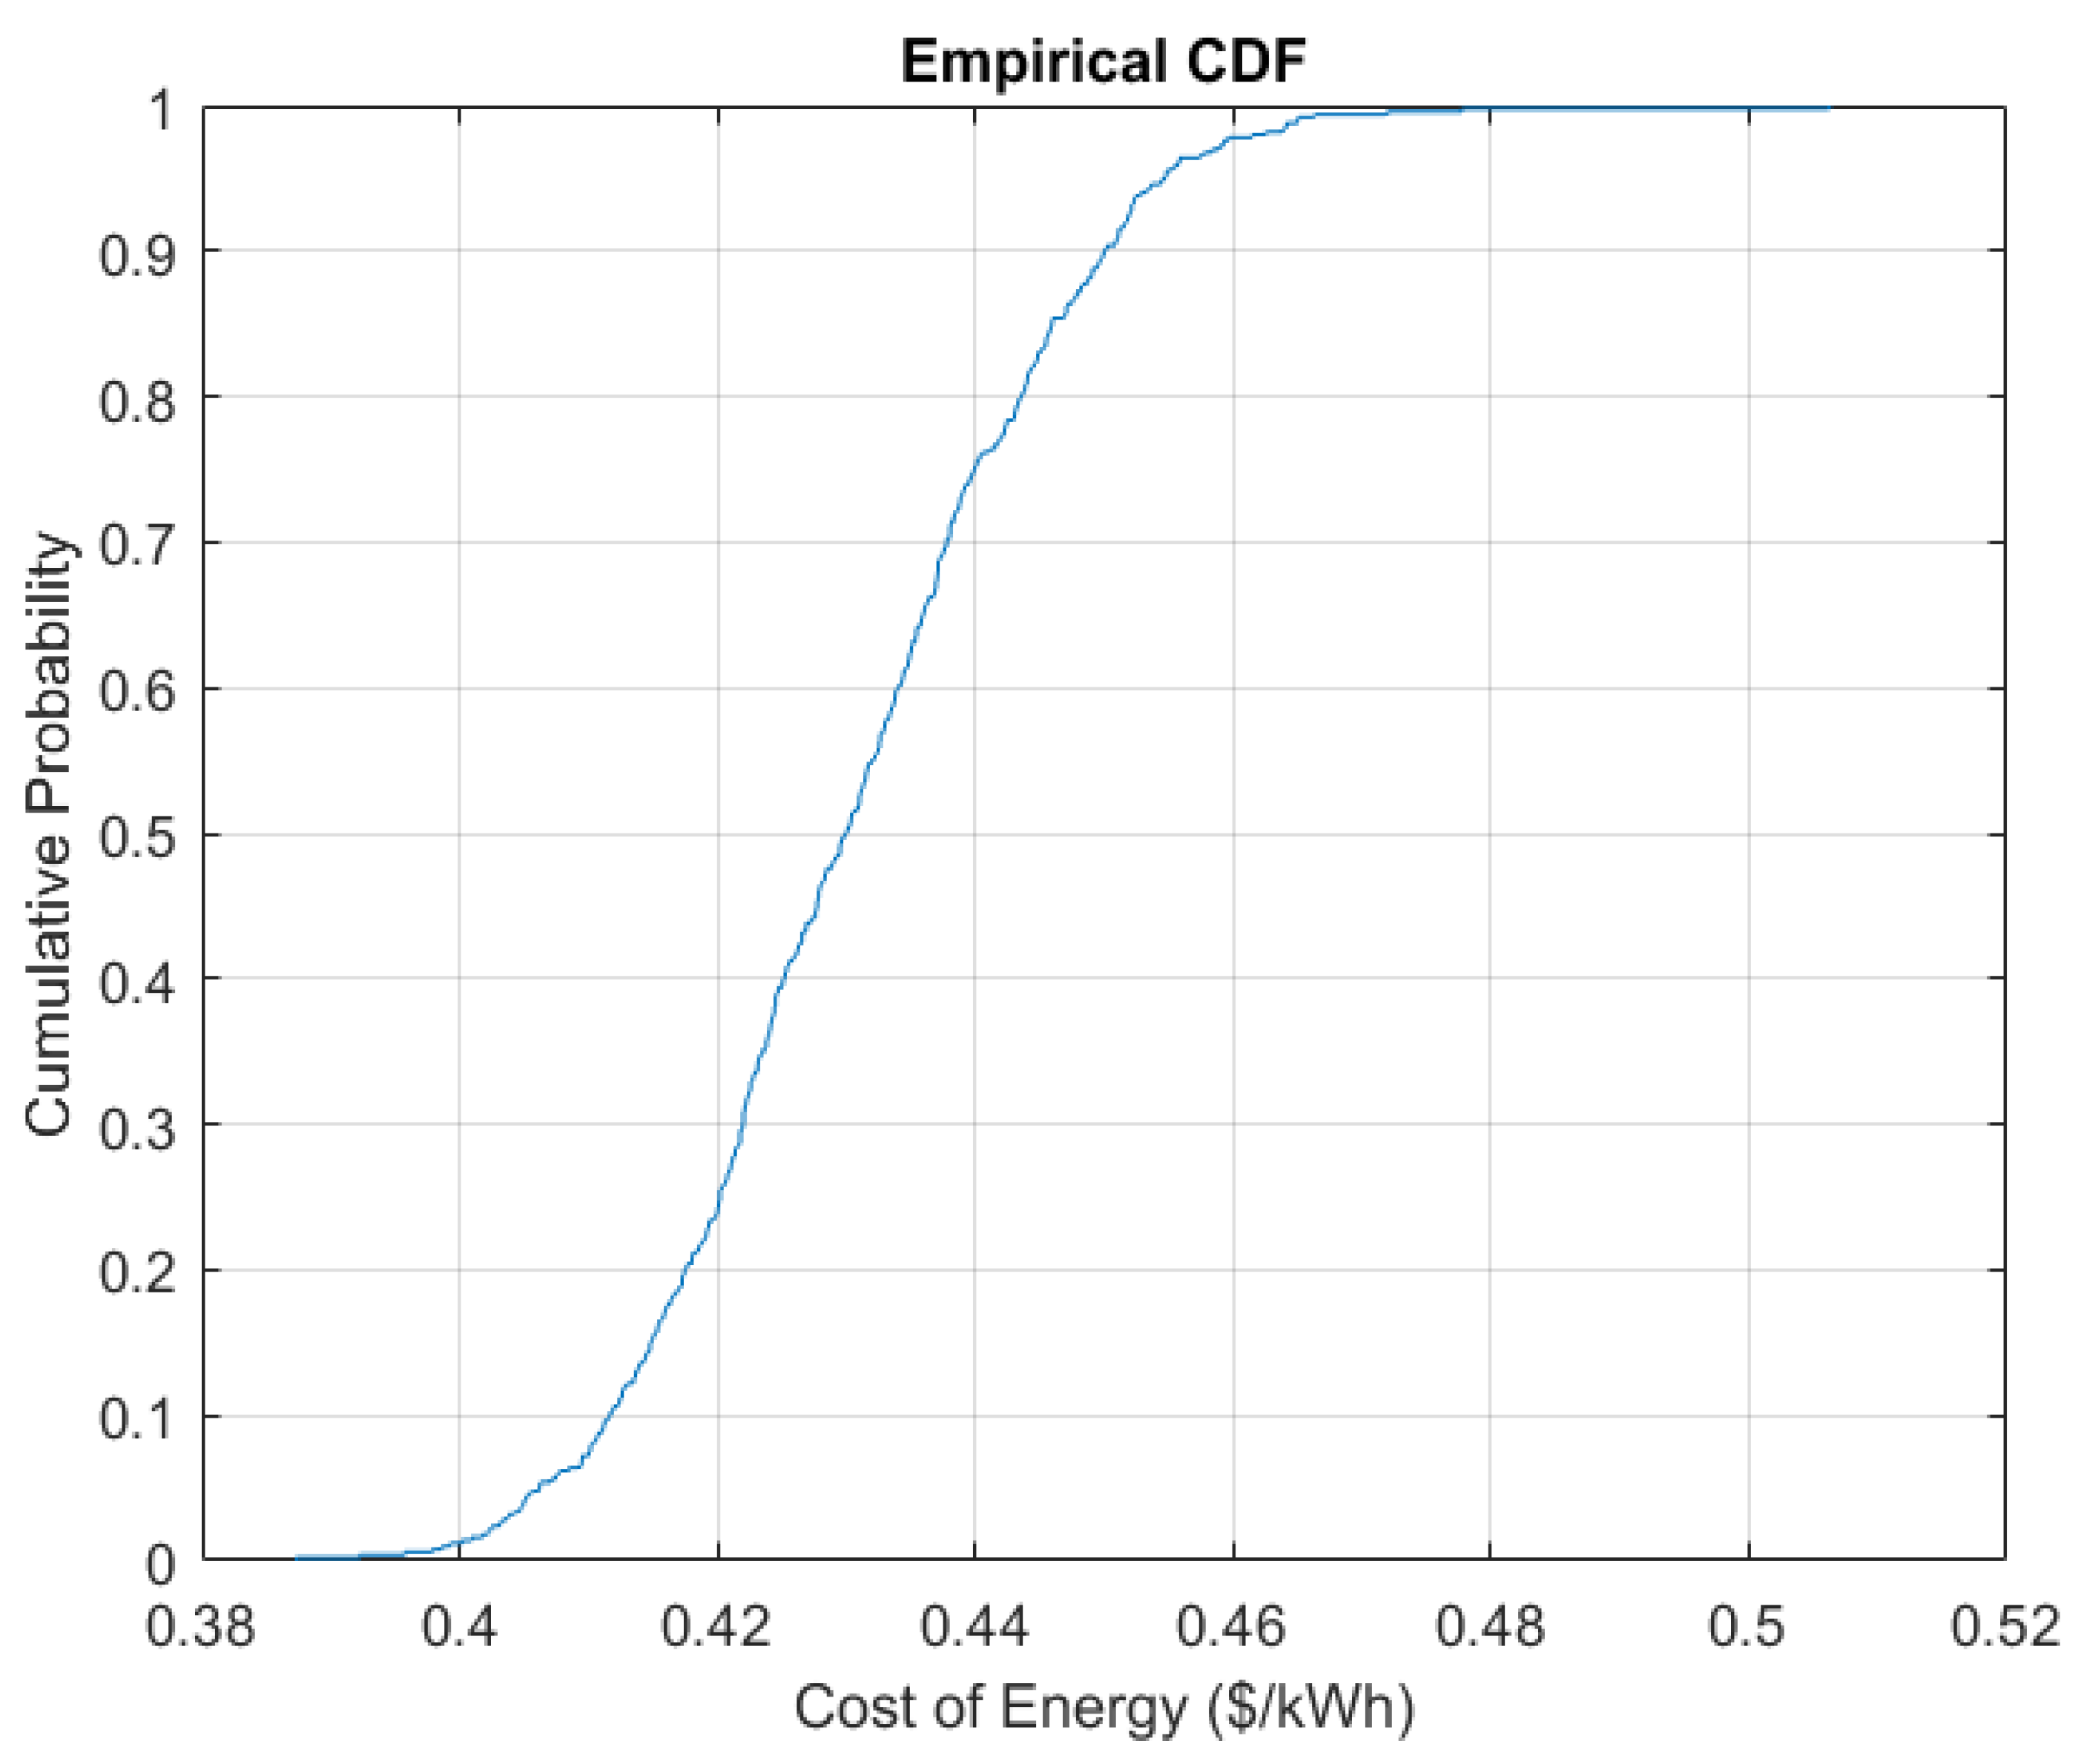
To further validate the reliability and practical feasibility of the optimal configuration determined for Case 4, a comprehensive robustness assessment was carried out using a Monte Carlo simulation approach. This analysis explicitly addresses the inherent uncertainties in renewable resource availability, such as wind speed and solar irradiance as well as fluctuations in load demand, which are critical factors affecting the long-term performance of hybrid energy systems. A total of 500 independent scenarios were simulated by applying stochastic perturbations of ±10% to the hourly wind and solar data and ±5% to the load demand profiles across the full annual period. For each scenario, the cost of energy (COE) was recalculated to examine how the system’s economic viability responds to real-world variability. The resulting distribution of COE values was analyzed using key statistical indicators such as the mean, standard deviation, and relative standard deviation. Additionally, a histogram, box plot, and cumulative distribution function (CDF) were generated to illustrate the spread and confidence intervals of the optimized design under uncertain operating conditions. These results demonstrate that the proposed configuration maintains robust performance when exposed to practical variations; the results of robustness analysis for Case 4 are shown in Table 6.
The results obtained in Table 6 demonstrate that the Cost of Energy (COE) maintained a mean value of USD 0.4304/kWh, with a standard deviation of ±0.0151 and a relative standard deviation of 3.51%, indicating strong consistency under fluctuating input conditions. The COE values ranged from a minimum of USD 0.3873/kWh to a maximum of USD 0.5063/kWh, confirming that the system can sustain stable economic performance despite significant renewable and load uncertainties. These findings reinforce the reliability of the proposed system design for Case 4, highlighting its resilience and suitability for real-world deployment. Notably, in all scenarios, the system ensured supply reliability due to the presence of the diesel generator, which acts as a backup to cover any shortfall during adverse renewable conditions or unexpected load spikes.
The histogram in Figure 14 shows that the COE values are tightly clustered around the mean of USD 0.4304/kWh, with a low standard deviation (0.0151) and relative deviation (3.51%), indicating stable performance under uncertainty. The box plot in Figure 15 confirms minimal dispersion and few outliers, while the CDF in Figure 16 illustrates that most scenarios remain below USD 0.45/kWh. Overall, these figures demonstrate that the system remains economically robust despite variations in wind, solar, and load conditions.

6.2. Results of Simulation of Optimal-Sized System

After determining the optimal sizing of the hybrid energy system (HES) for Case 2 and Case 4, the corresponding economic performance, electrical output characteristics, and associated carbon dioxide (CO2) emissions are analyzed and presented. This includes key indicators such as the cost of energy (COE), diesel generator contribution, and total fuel consumption. These results provide a comprehensive assessment of the techno-economic and environmental viability of each case under the defined design.

6.2.1. Case 1

When the diesel generator serves as the primary power supply for meeting the demand, the results obtained are presented in Table 7.
The results presented (in Table 7) indicate that when a diesel generator is the primary power source, the system incurs a net present cost (NPC) of USD 0.983 million, with an initial capital cost of USD 0.184 million. The cost of energy (COE) over 24 years is USD 1.4260 per kWh, reflecting the high operational costs associated with the diesel generator. The system produces 94,646 kWh of electricity per year, consuming 40,000 L of fuel annually, which costs USD 32,000 per year. Furthermore, the system’s environmental impact is substantial, emitting 104,790 kg of CO2 per year. These results highlight the economic and environmental drawbacks of relying solely on diesel generators, particularly in terms of high fuel consumption and significant CO2 emissions.

6.2.2. Case 2

When photovoltaic (PV) solar panels and wind turbine generators are used to supply the load, with diesel generators serving as a backup source in case of insufficient renewable energy availability, the results obtained are presented in Table 8.
When comparing the system with only renewable energy resources and a diesel generator as backup (as shown in Table 8) to the results in Table 7, which presents the diesel-only system, it shows clear economic and environmental benefits. The net present cost (NPC) of the hybrid system is USD 0.428 million, significantly lower than the USD 0.983 million for the diesel-only system, indicating reduced overall costs. Additionally, the cost of energy for the hybrid system is USD 0.6211 per kWh, much lower than USD 1.4260 per kWh for the diesel-only system. Fuel consumption costs are also reduced in the hybrid system, with a cost of USD 9600 per year compared to USD 32,000 per year for the diesel-only system.
The hybrid system’s total fuel consumption is 12,000 L per year, a substantial decrease from the 40,000 L per year required by the diesel generator alone. Furthermore, the hybrid system’s CO2 emissions of 31,692 kg per year are significantly lower than the 104,790 kg per year emitted by the diesel-only system. These comparisons highlight the clear advantages of integrating renewable energy sources in terms of both cost-effectiveness and environmental impact.

6.2.3. Case 3

Similar to Case 2, but with the addition of Demand Side Management (DSM) load shifting technology to maximize the utilization of available renewable energy and reduce the reliance on diesel generators, the results obtained are presented in Table 9.
When comparing the system with DSM technology (as shown in Table 9) to the previous hybrid system without DSM (from Table 8), the results show notable improvements in both economic and environmental performance. The Net Present Cost (NPC) for the DSM-integrated system is reduced to USD 0.36 million, lower than the USD 0.428 million in the previous case, indicating a more cost-effective system. Similarly, the initial capital cost of USD 0.142 million is also lower than the USD 0.165 million observed in Table 6, reflecting the efficiency gains achieved through DSM. The cost of energy (COE) decreases to USD 0.5214 per kWh from USD 0.6211 per kWh, showing that DSM technology helps to maximize renewable energy usage, reducing reliance on diesel power and thereby lowering the cost of electricity. Additionally, the total fuel consumption cost decreases to USD 7800 per year from USD 9600 per year, which is a direct result of reduced diesel consumption due to DSM’s ability to shift demand to periods when renewable energy is available. In terms of electrical performance, the total electricity produced by the diesel generator drops to 17.3 kWh per year from 23.36 kWh per year, and the total fuel consumed is reduced to 9800 L per year. This reduction demonstrates the effectiveness of DSM in decreasing the need for diesel-powered electricity generation. Environmentally, the CO2 emissions from the system with DSM are reduced to 25,882 kg per year, compared to 31,692 kg per year in the non-DSM case, highlighting the positive impact of DSM technology on lowering the carbon footprint of the system. Overall, the integration of DSM load shifting technology results in significant economic savings and environmental benefits, with lower COE, reduced fuel consumption, and lower CO2 emissions when compared to the previous hybrid system without DSM.

6.2.4. Case 4

When photovoltaic (PV) solar panels and wind turbine generators are used to supply the load, and a battery storage system is employed to store excess energy from renewable sources for use when renewable energy is insufficient, with the battery having priority over diesel generators as a backup source, the results obtained are presented in Table 10.
When comparing the battery storage system presented (in Table 10) with the hybrid system without storage (from Table 8), several improvements in economic and environmental performance are evident. The Net Present Cost (NPC) for the system with battery storage is USD 0.297 million, significantly lower than the USD 0.428 million in the non-storage case. This reduction in NPC highlights the economic advantage of integrating a battery storage system, which optimizes the use of renewable energy, leading to reduced operational costs. The initial capital cost for the storage system is USD 0.148 million, slightly lower than the USD 0.165 million for the hybrid system without storage, suggesting that the addition of battery storage is economically viable without significantly increasing upfront investment. The cost of energy (COE) in the storage system is USD 0.4309 per kWh, which is notably lower than the USD 0.6211 per kWh for the non-storage case, reflecting the efficiency of using stored renewable energy when available, thereby reducing reliance on more expensive diesel power. In terms of fuel consumption, the system with battery storage has a fuel consumption cost of USD 4970 per year, which is significantly lower than the USD 9600 per year in the non-storage system. Additionally, the total electricity production by the diesel generator is reduced to 13,300 kWh per year, compared to 23,360 kWh per year in the non-storage case, showing that the battery system reduces the need for diesel power generation. The total fuel consumed by the system with storage is 6200 L per year, a substantial reduction from 12,000 L per year in the non-storage case, emphasizing the role of battery storage in lowering fuel dependency. Finally, the CO2 emissions from the battery storage system are reduced to 16,374 kg per year, compared to 31,692 kg per year in the non-storage system, reflecting the environmental benefits of maximizing renewable energy use and minimizing diesel consumption.

6.2.5. Case 5

Similar to Case 4, but with the addition of DSM load shifting technology to maximize the utilization of available renewable energy and reduce the reliance on diesel generators for power supply, the results obtained are presented in Table 11.
When comparing the case with DSM load shifting technology (from Table 11) to the previous case without DSM (in Table 10), we observe several improvements in both economic and environmental performance due to the addition of DSM technology. The Net Present Cost (NPC) in the DSM case is USD 0.28 million, which is lower than the USD 0.297 million in the system without DSM, indicating a more cost-effective system due to the optimization of energy use. The initial capital cost remains the same at USD 0.148 million, reflecting that the integration of DSM technology does not increase the initial investment compared to previous results in case 4, while offering additional savings in operation. The cost of energy (COE) in the DSM system is USD 0.4069 per kWh, which is lower than the USD 0.4309 per kWh for the system without DSM. This further demonstrates the economic benefit of DSM technology in reducing the cost of energy by optimizing renewable energy usage and decreasing reliance on diesel generators. In terms of fuel consumption, the fuel consumption cost for the DSM case is USD 4280 per year, significantly lower than the USD 4970 per year for the system without DSM, showing that DSM load shifting further reduces fuel costs by minimizing diesel usage. The total electricity production by the diesel generator drops to 10,500 kWh per year in the DSM case, compared to 13,300 kWh per year in the system without DSM, demonstrating that DSM technology optimizes renewable energy consumption even further.
Similarly, the total fuel consumed is reduced to 5350 L per year, compared to 6200 L per year in the case without DSM. Finally, the CO2 emissions in the DSM case are 14,130 kg per year, which is significantly lower than the 16,374 kg per year in the system without DSM case, highlighting the environmental benefits of maximizing renewable energy use and reducing reliance on diesel generation.
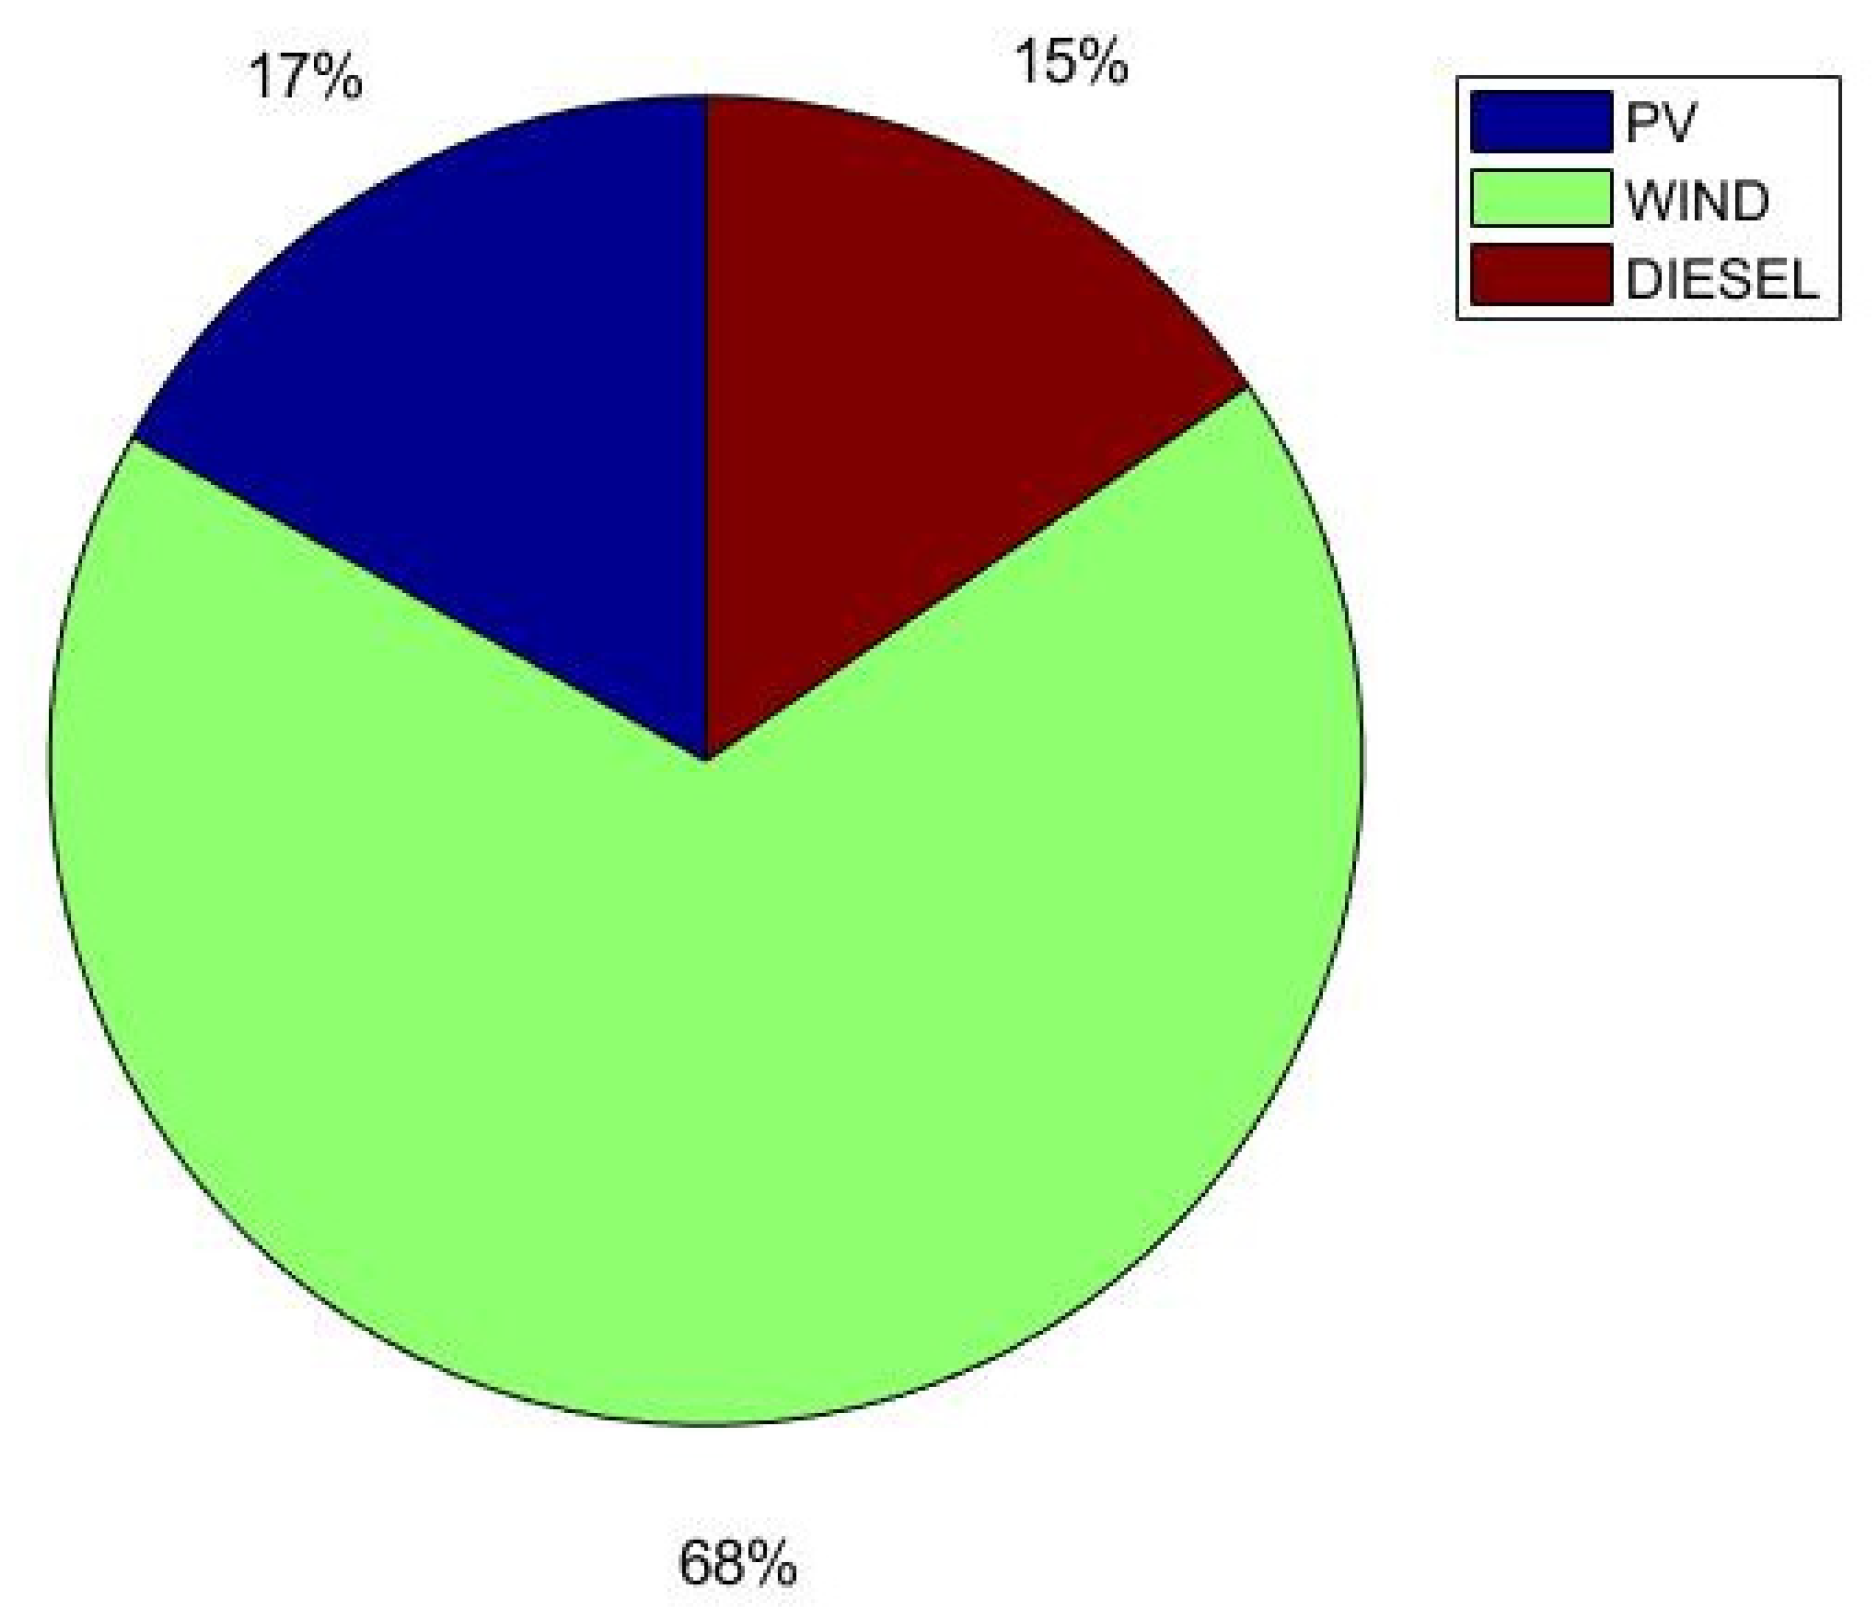
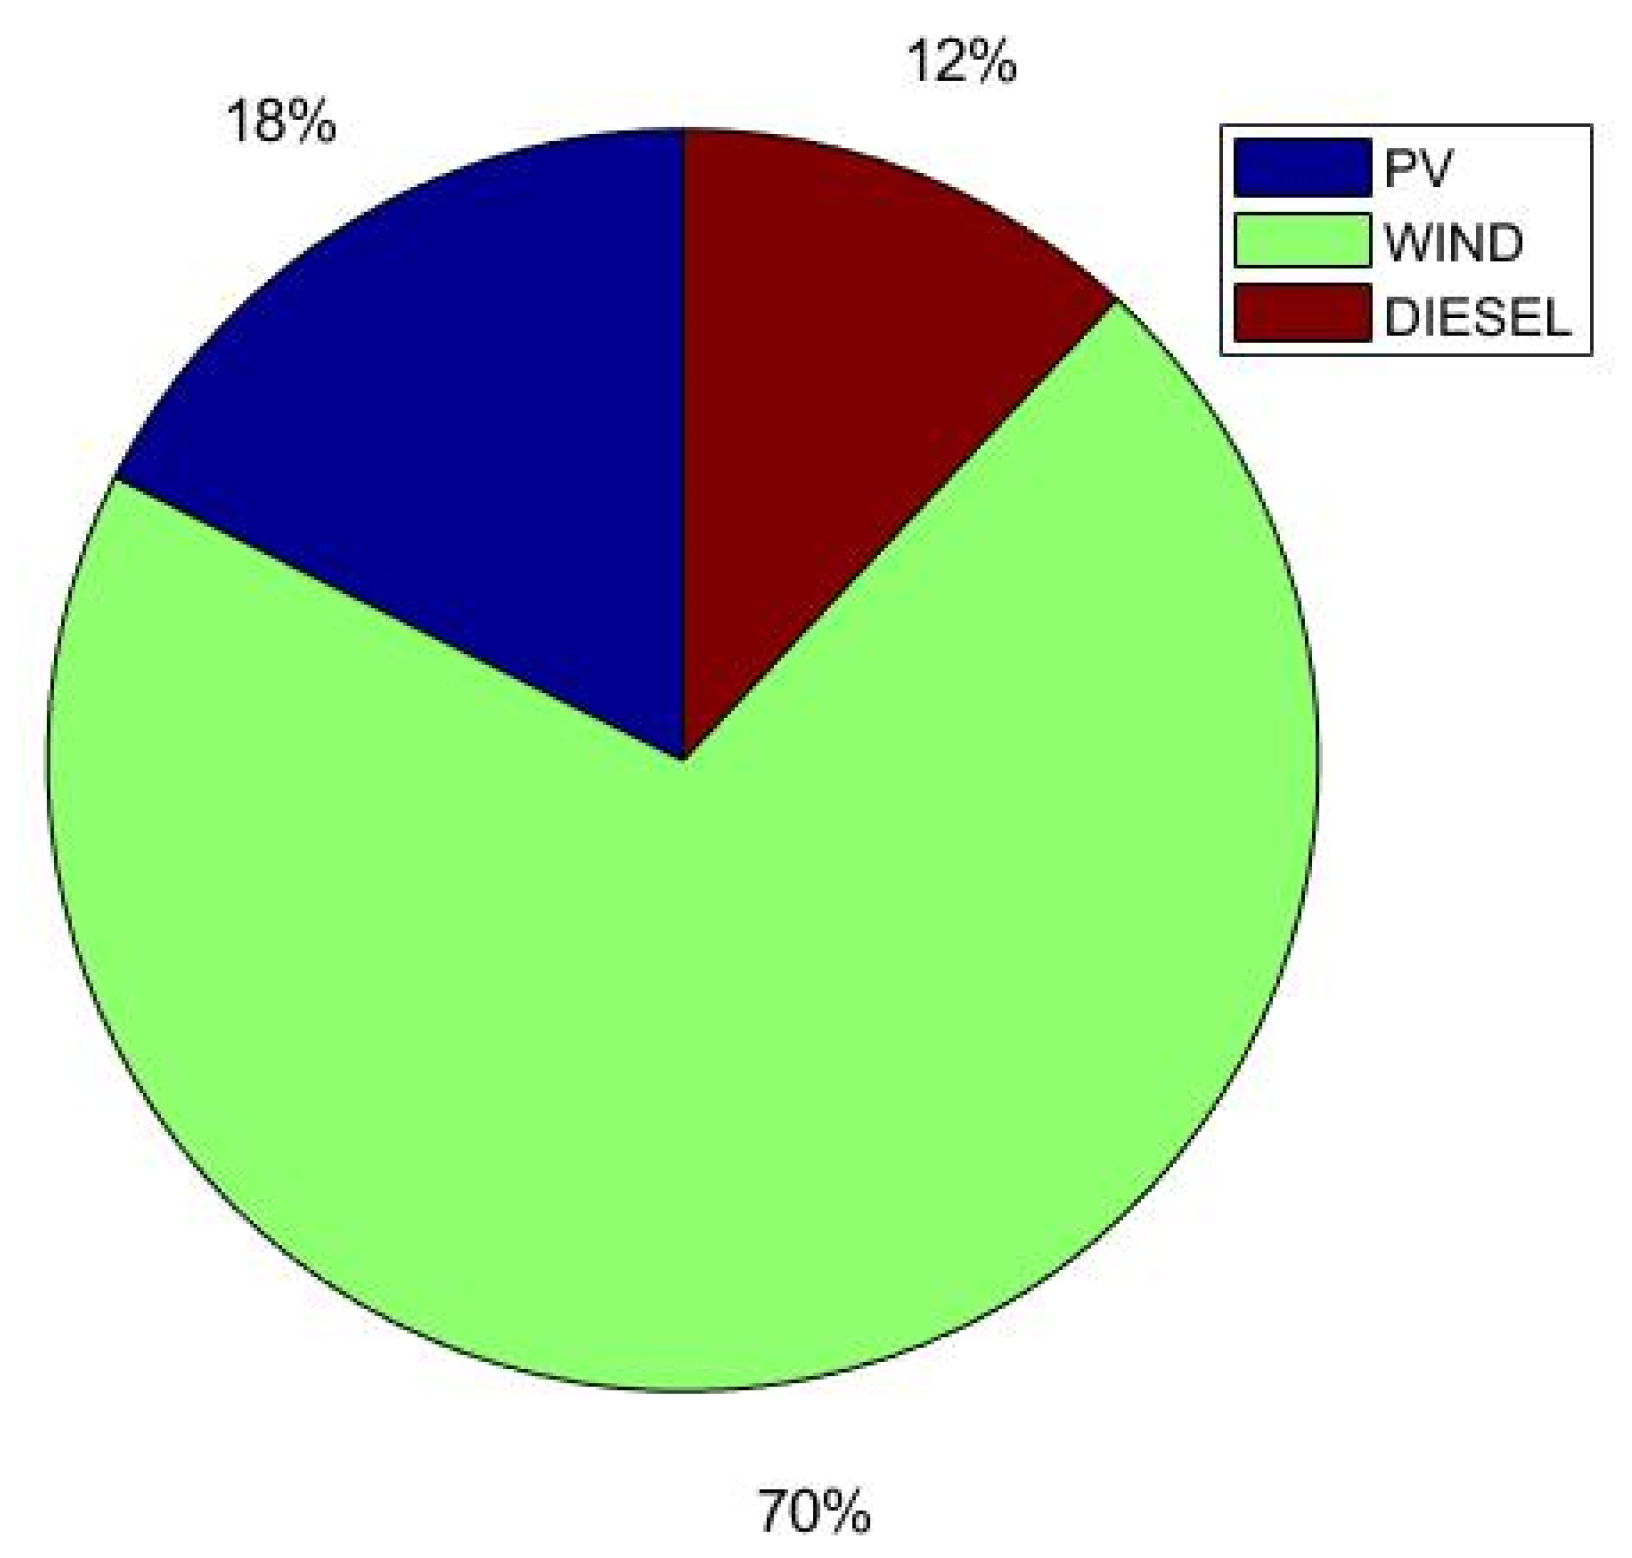
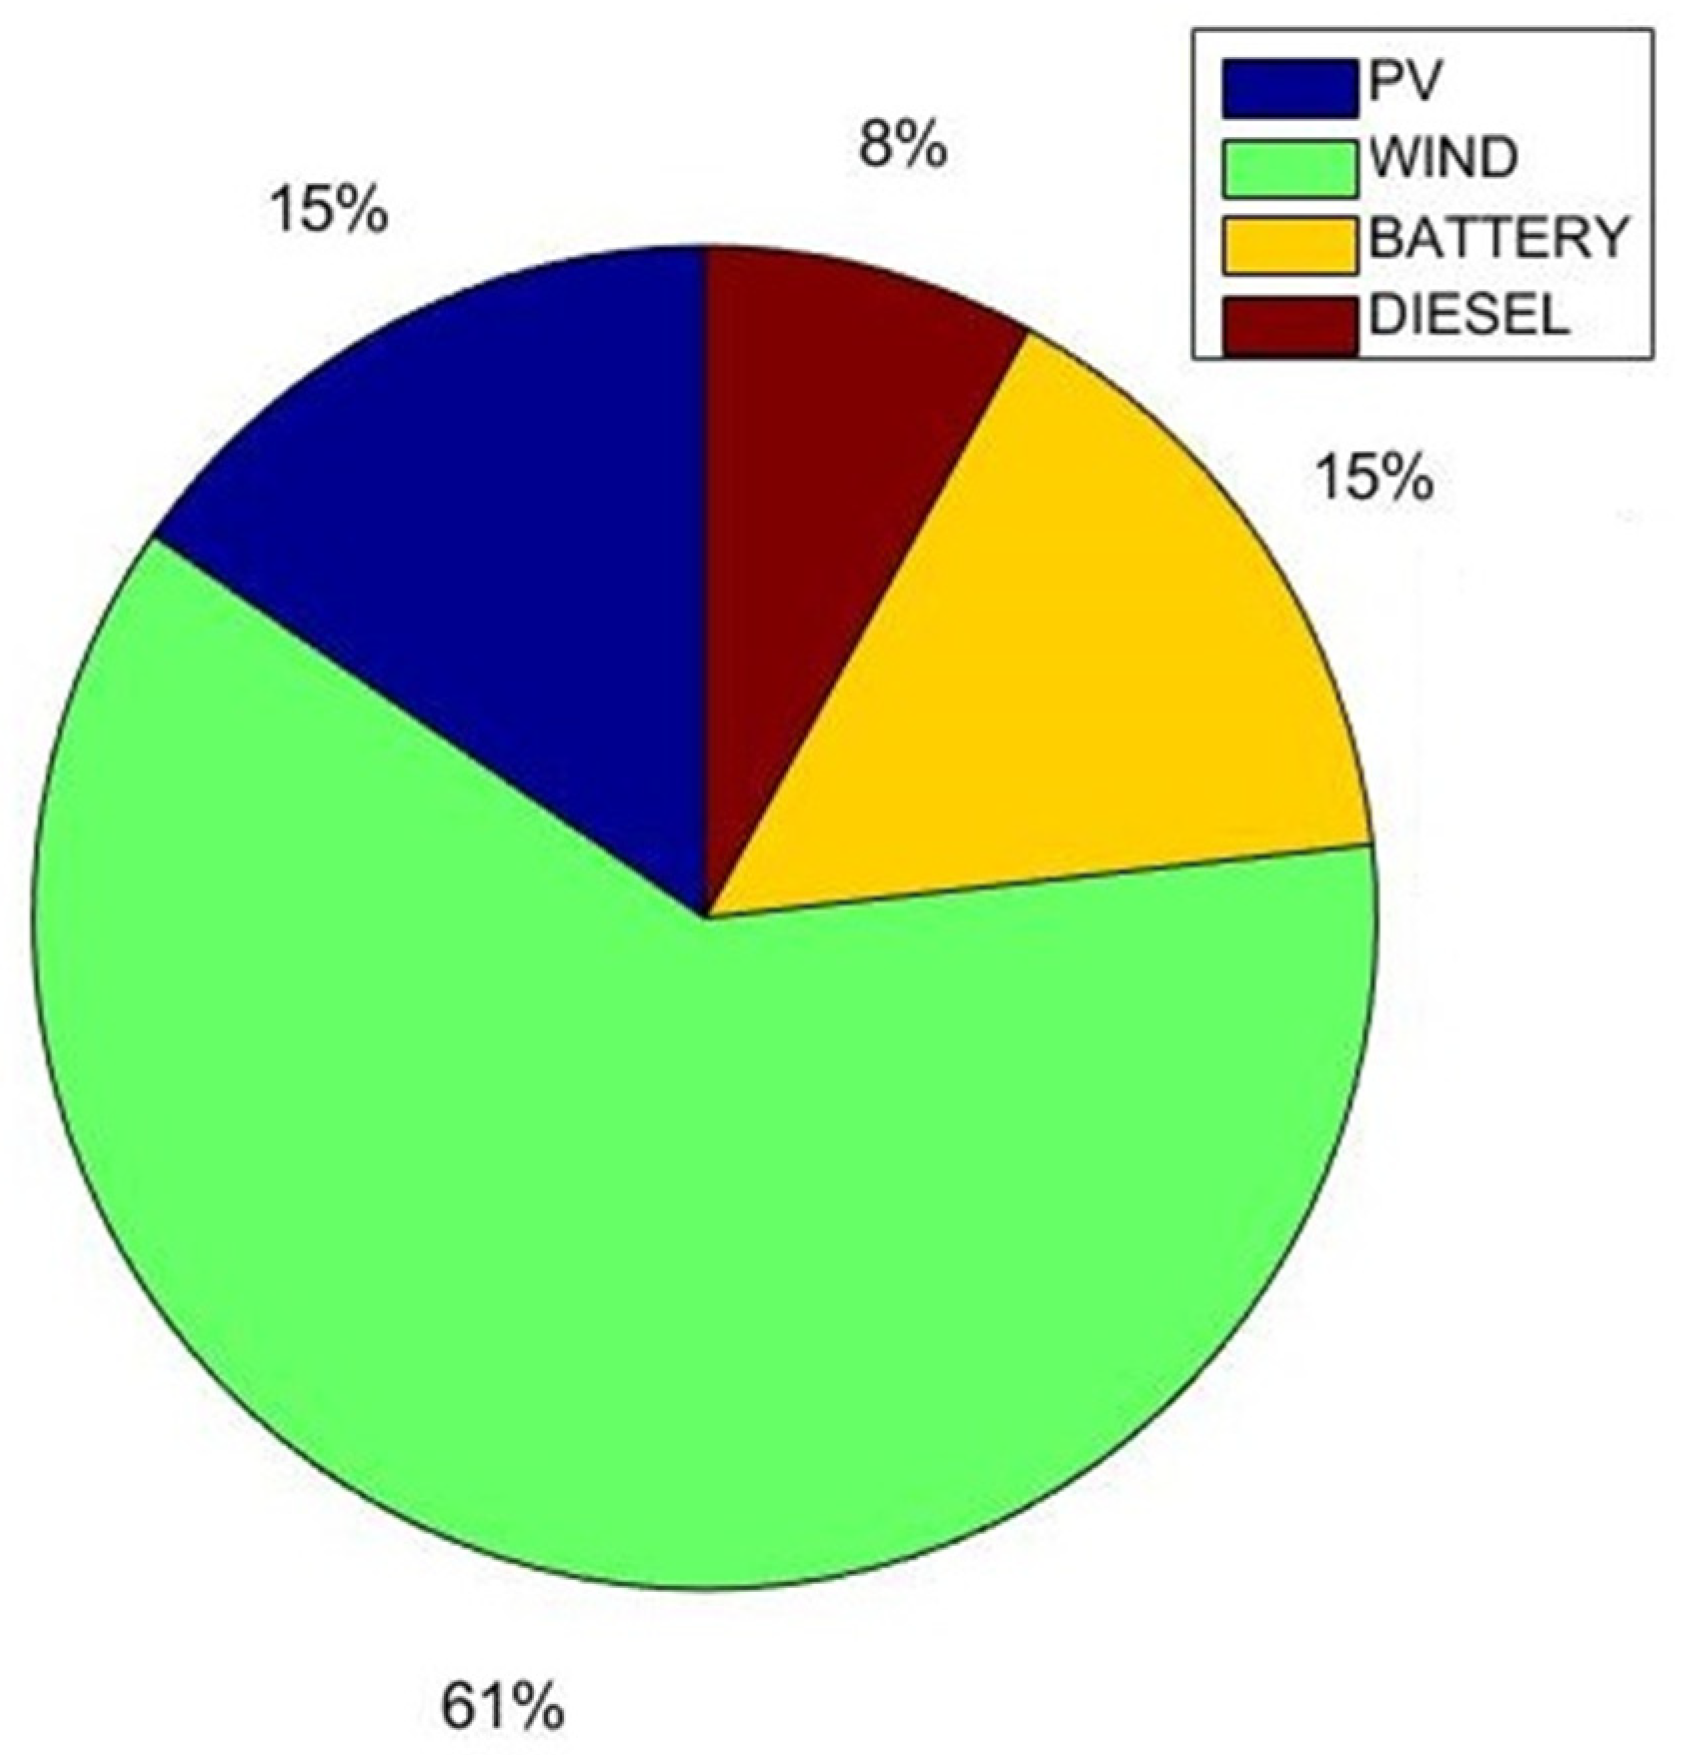
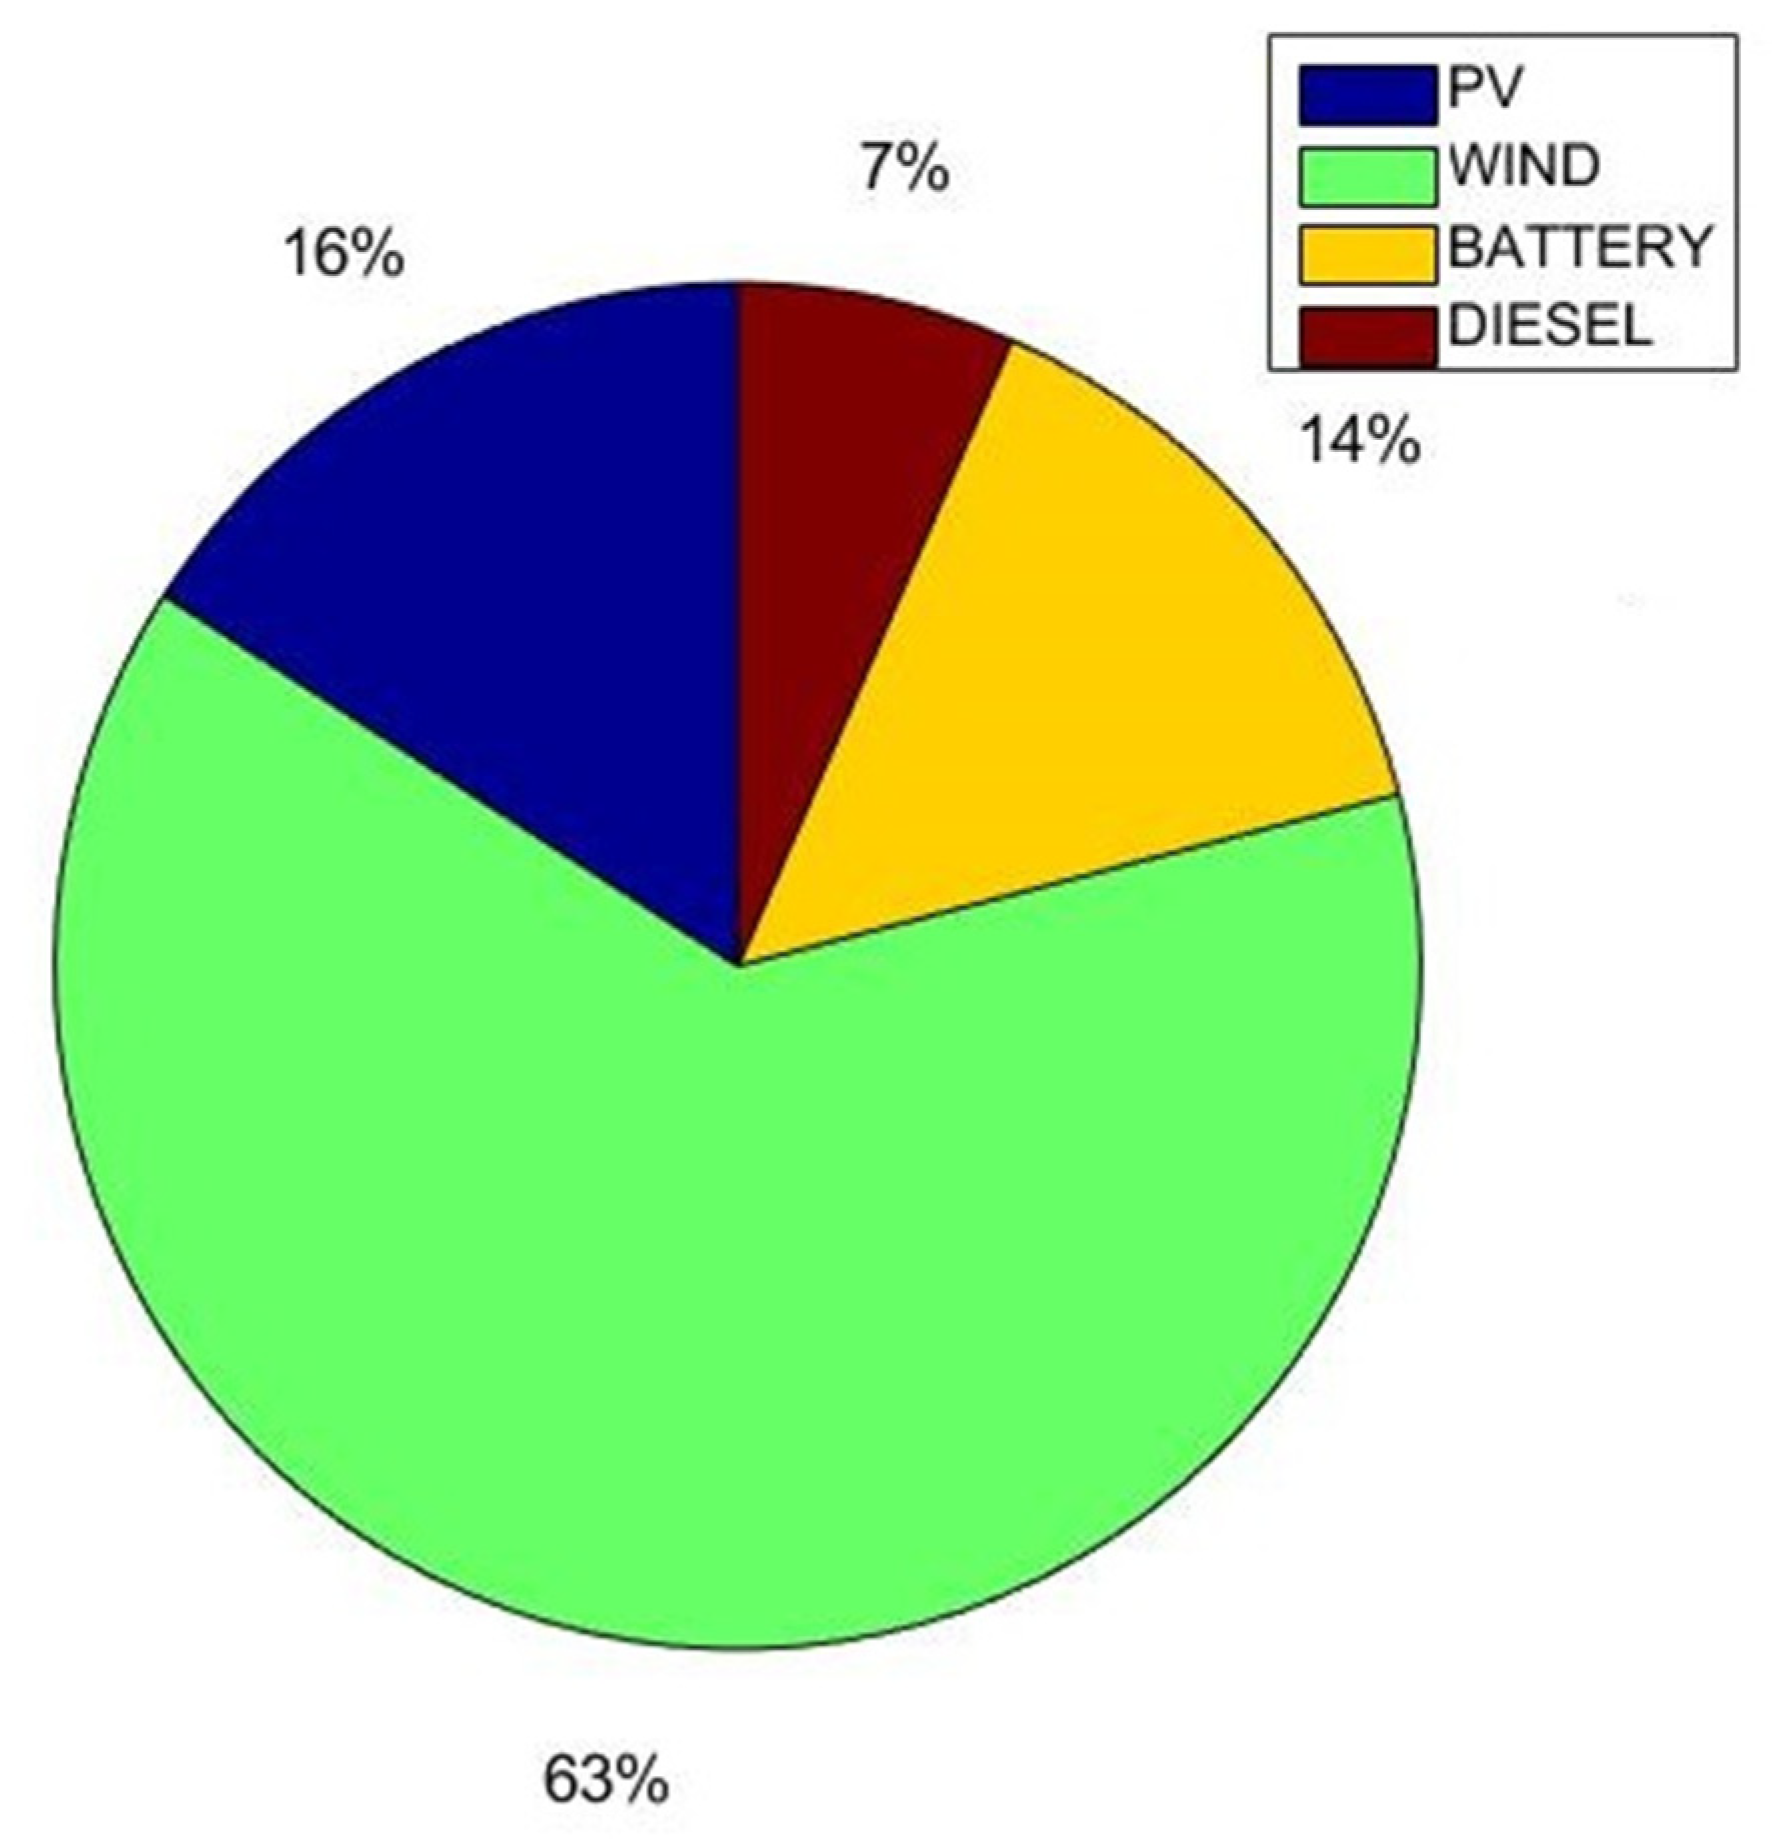
The percentages of sharing of each of PV, wind, diesel and battery for each of the previous cases are shown in Figure 17, Figure 18, Figure 19 and Figure 20.
Overall, the comparative results across all five cases clearly show that combining optimal hybrid system sizing with demand-side management leads to notable economic and environmental benefits. From Case 1 to Case 5, both the net present cost and cost of energy decline significantly, while reliance on diesel generation, fuel consumption, and CO2 emissions are substantially reduced. These trends confirm that the proposed approach effectively improves system sustainability and operational efficiency under real-world conditions. Moreover, the results highlight the importance of integrating DSM strategies even after initial sizing to maximize renewable resource utilization. This demonstrates the value of flexible system operation in addressing load variations and resource uncertainty.

6.3. Load Growth

Load growth refers to the increase in electrical demand over time, which is crucial for the planning and expansion of distribution systems. It is defined as the gradual rise in electrical demand over a specified period, a phenomenon that plays a key role in the strategic planning and enhancement of distribution infrastructure. Understanding load growth is vital for utility providers, as it informs decision-making processes related to infrastructure development and resource allocation to meet future energy needs effectively. In the previous section of this work, we assumed that the load remains constant throughout the project’s lifetime. However, this assumption does not reflect real-world scenarios, where the increasing reliance on electricity leads to growing demand over time.
Therefore, it is essential to consider the impact of load growth when comparing different systems. By incorporating this factor, we can gain a more accurate understanding of how various distribution systems will perform in response to changing demand, ensuring that our planning and infrastructure development align with future energy requirements. To ensure realistic and robust planning, the study quantifies how increasing electrical demand impacts fuel consumption and the probability of unmet load (LPSP) for each system configuration. The load growth equation is described as follows [41]:
P = P o 1 + l w
where P , P o , l , w are the load at the end of the required year, initial load, load growth rate and the maximum number of years, respectively. A probabilistic Monte Carlo simulation is employed to capture 100 annual demand variations based on a stochastic load growth model as follows:
P y = P o k = 1 y 1 + l k ,                             l k ~ N ( μ , σ 2 ) ,
where P y is the load at year y, l k is the annual load growth rate in year k, which is treated as a random variable drawn from a normal distribution with mean μ and standard deviation σ , reflecting uncertainty in annual load demand.

Results of Load Growth

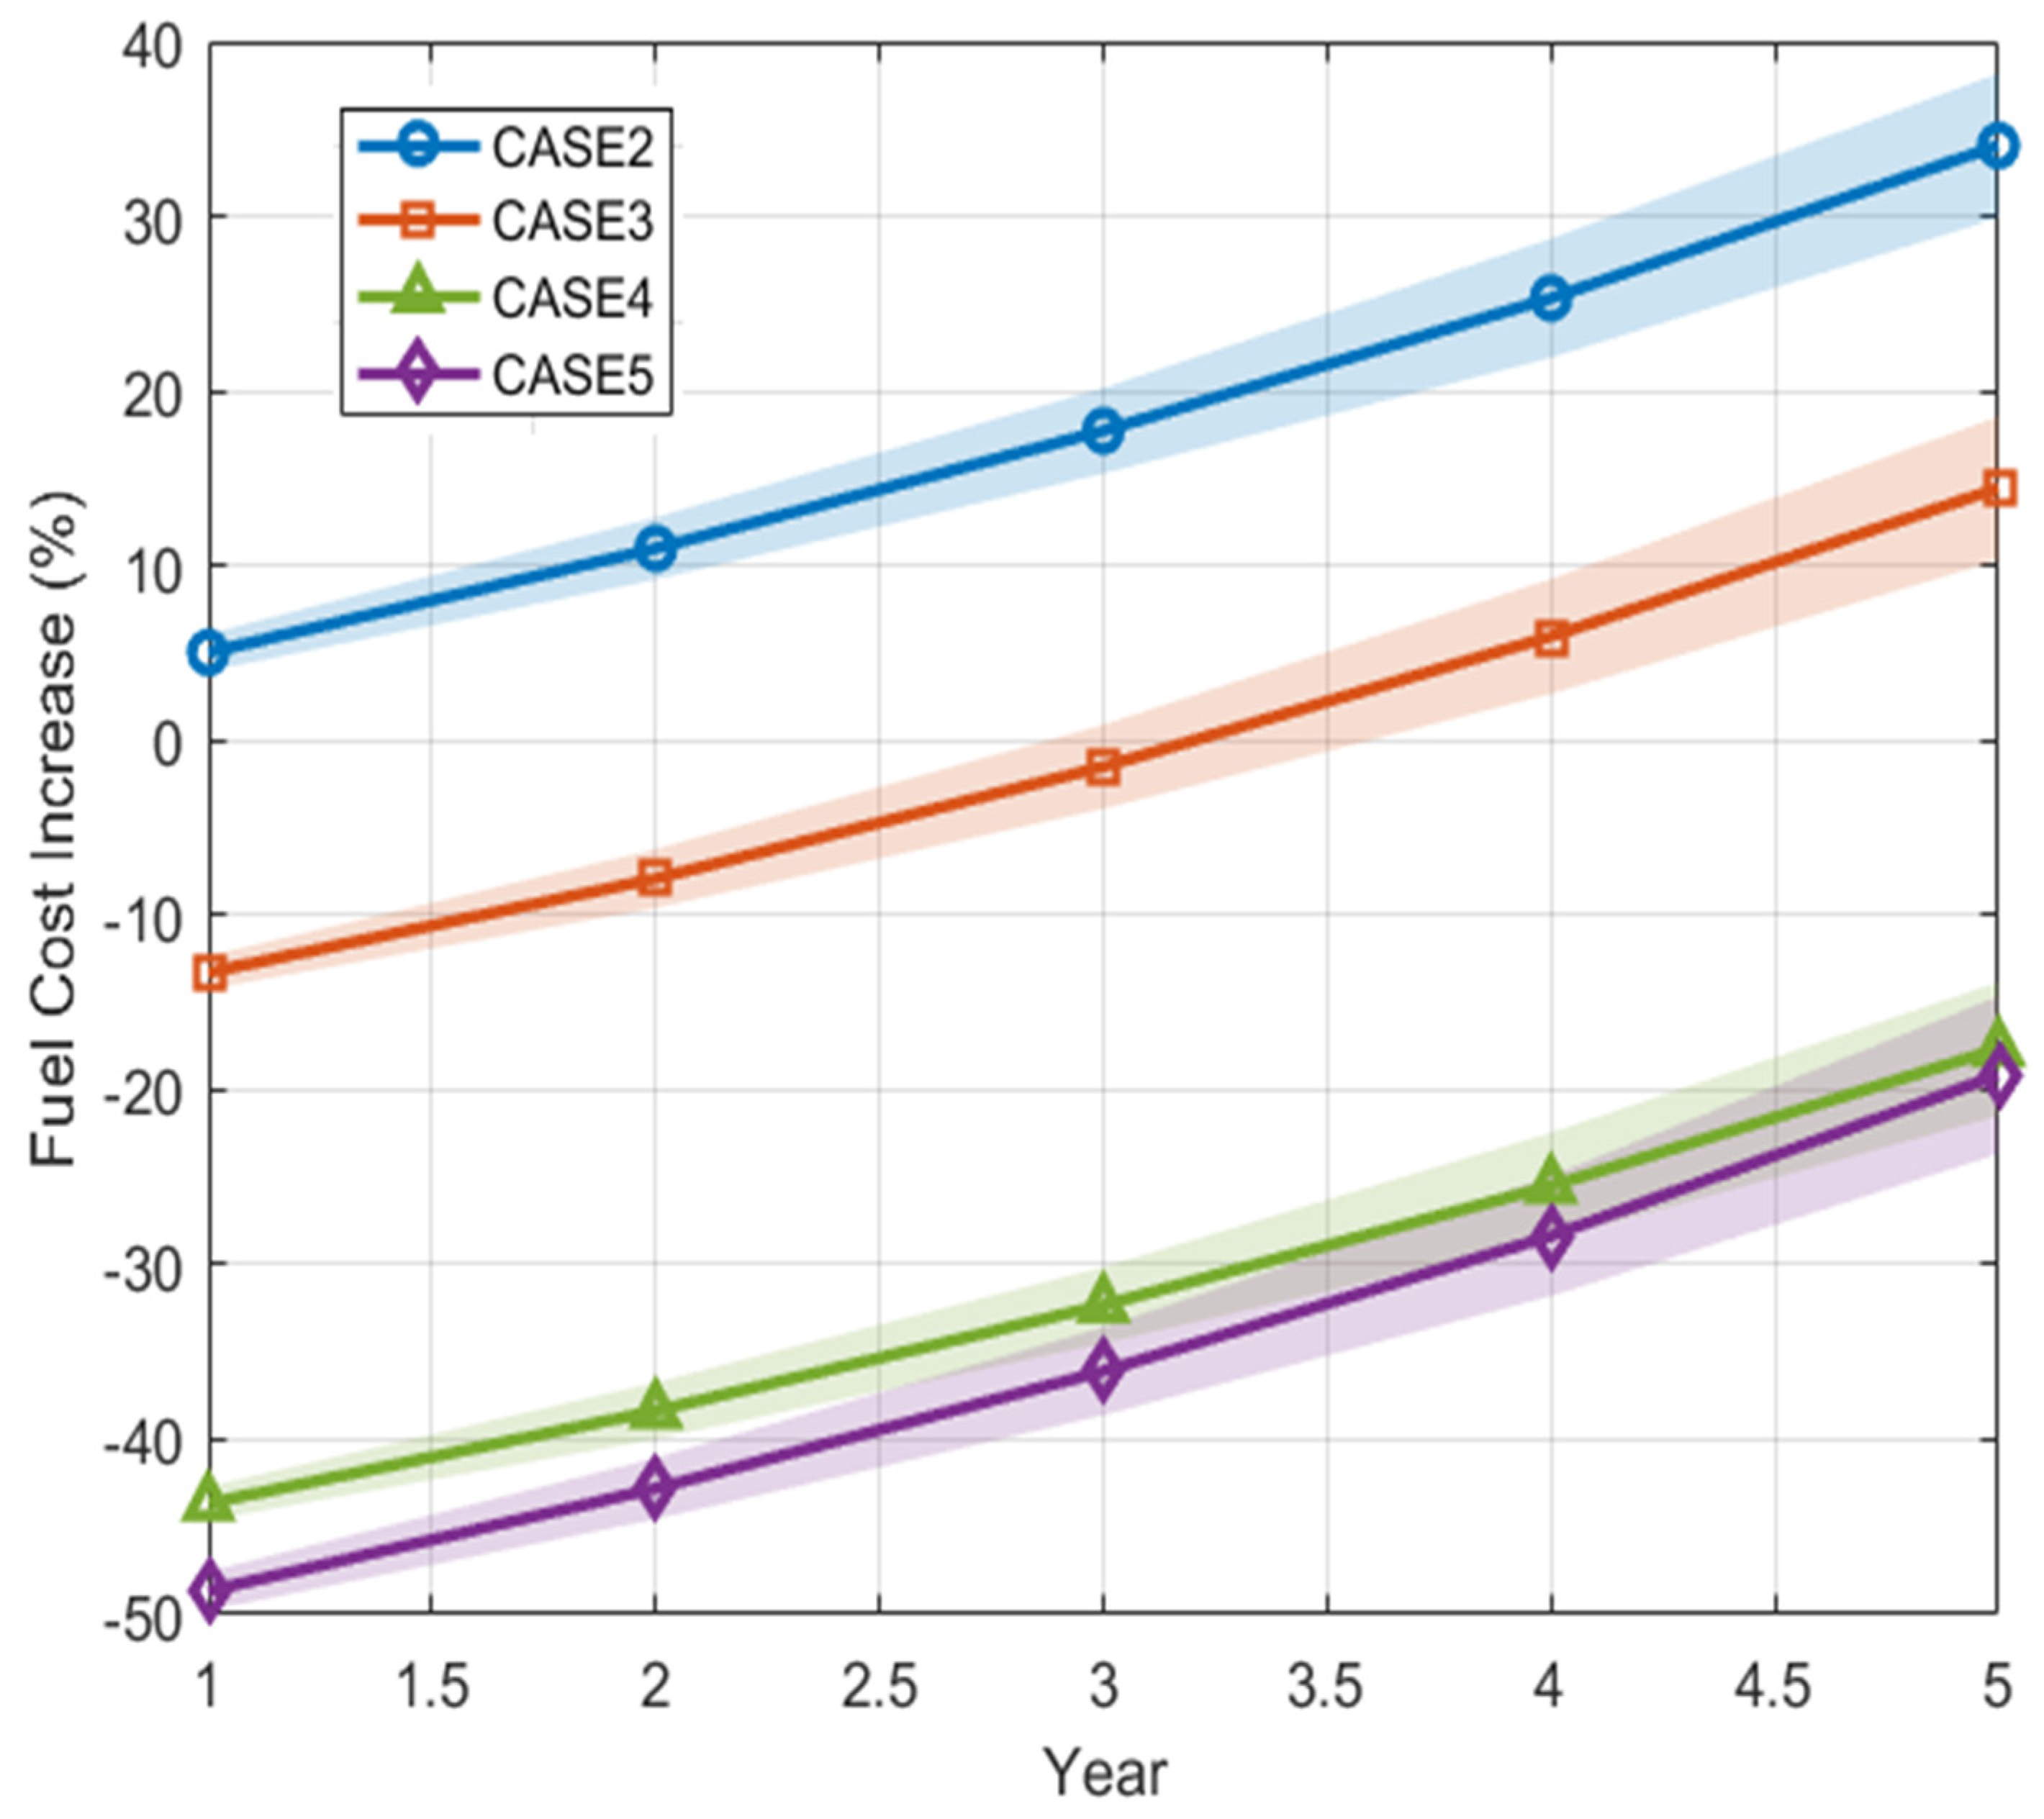
In this analysis, the base annual fuel cost is defined as the fuel consumption cost of the PV–Wind–Diesel system (Case 2) in its first year of operation. All subsequent fuel cost increases for the other configurations are presented relative to this common baseline, enabling consistent comparison. It is also assumed that wind speed and solar irradiance profiles remain constant over the study period without introducing additional uncertainty, so the only source of variation in fuel cost projections is the probabilistic modeling of load growth through Monte Carlo simulation. Table 12 presents the impact of probabilistic load growth on fuel cost and system reliability for Case 2 and Case 3, while Table 13 presents the impact of probabilistic load growth on fuel cost and system reliability for Case 4 and Case 5.
The results show that the base PV–Wind–Diesel system (Case 2) experiences a steady increase in fuel cost, rising by about 34% over five years due to growing demand, while the probability of unmet load (LPSP) remains low but increases slightly over time. Incorporating DSM alone (Case 3) initially reduces fuel cost below the base case by shifting demand to match renewable availability, but as the load grows, the benefits diminish, and fuel cost rises above the base level after Year 3. Adding battery storage (Case 4) significantly reduces fuel cost compared to the base system, with savings of around 44% in Year 1 and 18% by Year 5, demonstrating the benefit of storing surplus renewable energy to displace diesel generation. The combined use of battery storage and DSM (Case 5) achieves the greatest fuel cost reduction, reaching nearly 50% lower fuel use than the base case in Year 1 and sustaining around 19% savings by Year 5. In all cases, the LPSP remains negligible, confirming that the proposed configurations can maintain a reliable supply under realistic load growth uncertainty. Overall, these results highlight the importance of combining storage and demand-side measures to minimize diesel dependency and enhance the flexibility and sustainability of off-grid hybrid renewable systems.
Figure 21 illustrates the projected mean annual percentage increase in fuel cost over a five-year period for the four hybrid configurations, incorporating the effects of probabilistic load growth.
The base reference is the first-year fuel cost of the PV–Wind–Diesel system without any storage or demand side management. As shown in Figure 21 the base system (Case 2) experiences a steady increase in fuel cost due to growing reliance on the diesel generator to meet rising demand. Incorporating DSM alone (Case 3) initially reduces diesel usage below the base level through strategic load shifting, but its effectiveness diminishes over time as overall demand grows. Adding battery storage (Case 4) significantly reduces fuel cost throughout the project lifetime by storing excess renewable generation and displacing diesel consumption. Combining storage with DSM (Case 5) yields the greatest benefit, achieving the lowest fuel cost increase and maximum diesel fuel savings. The shaded regions around each line represent the standard deviation derived from a Monte Carlo simulation, demonstrating the range of possible outcomes under uncertainty in annual demand growth.

7. Conclusions and Future Work

This research provides a comprehensive techno-economic assessment of hybrid renewable energy systems (HRESs) with a particular focus on uncertainty modelling and demand-side management (DSM). In this study, two cases were optimized using advanced metaheuristic algorithms (EDO, TLBO, WHO, CSA, and PSO) to achieve the minimum cost of energy under realistic operating conditions. The results showed that TLBO, WHO, EDO, and PSO all achieved similarly low COE values with stable convergence and reasonable computation times, confirming their reliability for complex HES optimization. In contrast, CSA exhibited a slightly higher COE and greater performance variability. This comparison underlines the benefit of employing robust, diverse metaheuristics to ensure high-quality solutions for hybrid renewable energy. The ideal system configuration includes ten wind turbines and fifteen-kilowatt photovoltaic modules, with three-day battery autonomy for energy storage along with twenty-five-kilowatt diesel generator as backup to ensure reliability. By integrating a robust Monte Carlo framework, the study accounted for the inherent uncertainties in wind, solar, and load profiles. A detailed Monte Carlo simulation with 500 scenarios was performed for Cases 2 and 4 to verify robustness under ±10% renewable and ±5% load uncertainty, and the analysis showed that the cost of energy for Case 2 had a mean of USD 0.6211/kWh, a standard deviation of 0.0260, while Case 4 achieved a lower mean COE of USD 0.4304/kWh, with a standard deviation of 0.0151. This confirms that the optimized configurations maintain robust techno-economic performance under realistic renewable and load variability.
Five scenarios were simulated for the optimally sized systems, starting with a diesel-only generator and progressing to advanced hybrid systems integrating solar, wind, batteries, and DSM. Compared to the base diesel system, adding renewables alone reduced the cost of energy by up to 56.4%, while the inclusion of batteries pushed this saving to 71%, with corresponding CO2 emission reductions of 70% and 86%, respectively. Applying a 15% load-shifting DSM strategy further lowered the energy cost by 16% for systems without storage, and by 5% for systems with storage, while cutting CO2 emissions by an additional 18% and 13.7%, respectively. The load growth analysis conducted over a projected five-year horizon demonstrates that increasing demand significantly influences system fuel consumption, where Case 2 shows a mean fuel cost increase, rising from 5.03% in year 1 to 34.05% in year 5, while Case 3 shifts from a slight reduction of –13.29% in year 1 to a 14.43% increase by year 5. Meanwhile, Cases 4 and 5, which integrate Demand-Side Management and storage, consistently maintain significantly lower fuel cost increases than the base case, highlighting their superior economic resilience under growing loads. Importantly, the load growth impact was evaluated across 100 Monte Carlo scenarios, capturing a broad range of possible annual growth rates and reinforcing the robustness of the findings.
This comprehensive approach confirms that careful planning, DSM, and storage integration are essential to mitigate rising fuel costs and ensure stable, reliable system operation under future demand uncertainty
Building upon the results of this study, future research should extend towards multi-objective optimization frameworks that jointly address cost, emissions, and system reliability for hybrid renewable energy systems. Integrating emerging technologies such as hydrogen storage, electric vehicles, or flexible loads can further enhance system flexibility and resilience. Moreover, alongside advanced stochastic or machine learning methods for uncertainty modelling, this framework focuses on standalone hybrid systems but can be adapted for grid-connected or larger microgrids by adding grid interaction, dynamic pricing, and real-time control features. Addressing these aspects is also suggested to be in future work.

Author Contributions

M.A.S.: Methodology, Conceptualization, Writing—original draft.; M.A.A.: Supervision, Conceptualization, review & editing; I.M.D.: Data curation, Conceptualization, Writing—review & editing; A.K.K.: Supervision, Writing—review &editing, Formal analysis; O.A.M.O.: review & editing, Formal analysis; M.A.: Funding acquisition, review & editing, Formal analysis; A.E.: review & editing, Formal analysis; N.M.H.: review & editing, Conceptualization, validation. All authors have read and agreed to the published version of the manuscript.

Funding

This research was funded by the Deanship of Scientific Research at Northern Border University, Arar, KSA, through the project number NBU-FFR-2025-2124-06.

Data Availability Statement

The data presented in this study is available on request from the corresponding author. The data is not publicly available due to the large size.

Acknowledgments

The authors extend their appreciation to the Deanship of Scientific Research at Northern Border University, Arar, KSA, for funding this research (through the project number NBU-FFR-2025-2124-06).

Conflicts of Interest

The authors declare no conflicts of interest.

References

  1. Khan, A.R.; Mahmood, A.; Safdar, A.; Khan, Z.A.; Bilal, S.; Javaid, N.A.K. Load forecasting and dynamic pricing based energy management in smart grid-a review. In Proceedings of the International Multi-topic Conference, Jamshoro, Pakistan, 11–13 February 2015. [Google Scholar]
  2. Clausen, L.T.; Rudolph, D. Renewable energy for sustainable rural development: Synergies and mismatches. Energy Policy 2020, 138, 111289. [Google Scholar] [CrossRef]
  3. Alturki, F.A.; Omotoso, H.O.; Al-Shamma’a, A.A.; Farh, H.M.; Alsharabi, K. Novel manta rays foraging optimization algorithm based optimal control for grid-connected PV energy system. IEEE Access 2020, 8, 187276–187290. [Google Scholar] [CrossRef]
  4. Ramesh, M.; Saini, R.P. Dispatch strategies based performance analysis of a hybrid renewable energy system for a remote rural area in India. J. Clean. Prod. 2020, 259, 120697. [Google Scholar] [CrossRef]
  5. Roy, A.; Kedare, S.B.; Bandyopadhyay, S. Application of design space methodology for optimum sizing of wind–battery systems. Appl. Energy 2009, 86, 2690–2703. [Google Scholar] [CrossRef]
  6. Wang, C.; Nehrir, M.H. Power management of a stand-alone wind/photovoltaic/fuel cell energy system. IEEE Trans. Energy Convers. 2008, 23, 957–967. [Google Scholar] [CrossRef]
  7. Das, M.; Singh, M.A.K.; Biswas, A. Techno-economic optimization of an off-grid hybrid renewable energy system using metaheuristic optimization approaches–case of a radio transmitter station in India. Energy Convers. Manag. 2019, 185, 339–352. [Google Scholar] [CrossRef]
  8. Hung, D.Q.; Mithulananthan, N.; Bansal, R. Analytical strategies for renewable distributed generation integration considering energy loss minimization. Appl. Energy 2013, 105, 75–85. [Google Scholar] [CrossRef]
  9. Askarzadeh, A. Distribution generation by photovoltaic and diesel generator systems: Energy management and size optimization by a new approach for a stand-alone application. Energy 2017, 122, 542–551. [Google Scholar] [CrossRef]
  10. Ghorbani, N.; Kasaeian, A.; Toopshekan, A.; Bahrami, L.; Maghami, A. Optimizing a hybrid wind-PV-battery system using GA-PSO and MOPSO for reducing cost and increasing reliability. Energy 2018, 154, 581–591. [Google Scholar] [CrossRef]
  11. Tudu, B.; Roy, P.; Kumar, S.; Pal, D.; Mandal, K.K.; Chakraborty, N. Techno-economic feasibility analysis of hybrid renewable energy system using improved version of particle swarm optimization. In Proceedings of the Swarm, Evolutionary, and Memetic Computing: Third International Conference, SEMCCO 2012, Bhubaneswar, India, 20–22 December 2012; Proceedings 3. Springer: Berlin/Heidelberg, Germany, 2012; pp. 116–123. [Google Scholar]
  12. Al Dawsari, S.; Anayi, F.; Packianather, M. Techno-economic analysis of hybrid renewable energy systems for cost reduction and reliability improvement using dwarf mongoose optimization algorithm. Energy 2024, 313, 133653. [Google Scholar] [CrossRef]
  13. Agajie, T.F.; Fopah-Lele, A.; Amoussou, I.; Ali, A.; Khan, B.; Mahela, O.P.; Nuvvula, R.S.S.; Ngwashi, D.K.; Soriano Flores, E.; Tanyi, E. Techno-Economic Analysis and Optimization of Hybrid Renewable Energy System with Energy Storage under Two Operational Modes. Sustainability 2023, 15, 11735. [Google Scholar] [CrossRef]
  14. Samatar, A.M.; Lekbir, A.; Mekhilef, S.; Mokhlis, H.; Tey, K.S.; Alassaf, A. Techno-economic and environmental analysis of a fully renewable hybrid energy system for sustainable power infrastructure advancement. Sci. Rep. 2025, 15, 12140. [Google Scholar] [CrossRef]
  15. Liao, N.; Hu, Z.; Mrzljak, V.; Nowdeh, S.A. Stochastic Techno-Economic Optimization of Hybrid Energy System with Photovoltaic, Wind, and Hydrokinetic Resources Integrated with Electric and Thermal Storage Using Improved Fire Hawk Optimization. Sustainability 2024, 16, 6723. [Google Scholar] [CrossRef]
  16. Amara, S.; Toumi, S.; Salah, C.B.; Saidi, A.S. Improvement of techno-economic optimal sizing of a hybrid off-grid micro-grid system. Energy 2021, 233, 121166. [Google Scholar] [CrossRef]
  17. Al-Sahlawi, A.A.K.; Ayob, S.M.; Tan, C.W.; Ridha, H.M.; Hachim, D.M. Optimal Design of Grid-Connected Hybrid Renewable Energy System Considering Electric Vehicle Station Using Improved Multi-Objective Optimization: Techno-Economic Perspectives. Sustainability 2024, 16, 2491. [Google Scholar] [CrossRef]
  18. Wang, R.; Xiong, J.; He, M.-F.; Gao, L.; Wang, L. Multi-objective optimal design of hybrid renewable energy system under multiple scenarios. Renew. Energy 2020, 151, 226–237. [Google Scholar] [CrossRef]
  19. Bacha, B.; Ghodbane, H.; Dahmani, H.; Betka, A.; Toumi, A.; Chouder, A. Optimal sizing of a hybrid microgrid system using solar, wind, diesel, and battery energy storage to alleviate energy poverty in a rural area of Biskra, Algeria. J. Energy Storage 2024, 84, 110651. [Google Scholar] [CrossRef]
  20. Jahannoush, M.; Nowdeh, S.A. Optimal designing and management of a stand-alone hybrid energy system using meta-heuristic improved sine–cosine algorithm for Recreational Center, case study for Iran country. Appl. Soft Comput. 2020, 96, 106611. [Google Scholar] [CrossRef]
  21. Ashraf, M.A.; Liu, Z.; Alizadeh, A.A.; Nojavan, S.; Jermsittiparsert, K.; Zhang, D. Designing an optimized configuration for a hybrid PV/Diesel/Battery Energy System based on metaheuristics: A case study on Gobi Desert. J. Clean. Prod. 2020, 270, 122467. [Google Scholar] [CrossRef]
  22. Makhdoomi, S.; Askarzadeh, A. Optimizing operation of a photovoltaic/diesel generator hybrid energy system with pumped hydro storage by a modified crow search algorithm. J. Energy Storage 2020, 27, 101040. [Google Scholar] [CrossRef]
  23. Pal, P.; Mukherjee, V. Off-grid solar photovoltaic/hydrogen fuel cell system for renewable energy generation: An investigation based on techno-economic feasibility assessment for the application of end-user load demand in North-East India. Renew. Sustain. Energy Rev. 2021, 149, 111421. [Google Scholar] [CrossRef]
  24. Liang, Z.; Chung, C.Y.; Zhang, W.; Wang, Q.; Lin, W.; Wang, C. Enabling High-Efficiency Economic Dispatch of Hybrid AC/DC Networked Microgrids: Steady-State Convex Bi-Directional Converter Models. IEEE Trans. Smart Grid 2025, 16, 45–61. [Google Scholar] [CrossRef]
  25. Li, Y.; Yang, Z.; Li, G.; Zhao, D.; Tian, W. Optimal Scheduling of an Isolated Microgrid With Battery Storage Considering Load and Renewable Generation Uncertainties. IEEE Trans. Ind. Electron. 2019, 66, 1565–1575. [Google Scholar] [CrossRef]
  26. Cao, M.; Xu, Q.; Cai, J.; Yang, B. Optimal sizing strategy for energy storage system considering correlated forecast uncertainties of dispatchable resources. Int. J. Electr. Power Energy Syst. 2019, 108, 336–346. [Google Scholar] [CrossRef]
  27. Logenthiran, T.; Srinivasan, D.; Shun, T.Z. Demand side management in smart grid using heuristic optimization. IEEE Trans. Smart Grid 2012, 3, 1244–1252. [Google Scholar] [CrossRef]
  28. Kumar, S.; Kaur, T.; Upadhyay, S.; Sharma, V.; Vatsal, D. Optimal sizing of stand alone hybrid renewable energy system with load shifting, Energy Sources, Part A: Recovery. Util. Environ. Eff. 2025, 47, 1490–1509. [Google Scholar]
  29. Abdel-Basset, M.; El-Shahat, D.; Jameel, M.; Abouhawwash, M. Exponential distribution optimizer (EDO): A novel math-inspired algorithm for global optimization and engineering problems. Artif. Intell. Rev. 2023, 56, 9329–9400. [Google Scholar] [CrossRef]
  30. Črepinšek, M.; Liu, S.-H.; Mernik, L. A note on teaching–learning-based optimization algorithm. Inf. Sci. 2012, 212, 79–93. [Google Scholar] [CrossRef]
  31. Qais, M.H.; Hasanien, H.M.; Turky, R.A.; Alghuwainem, S.; Tostado-Véliz, M.; Jurado, F. Circle search algorithm: A geometry-based metaheuristic optimization algorithm. Mathematics 2022, 10, 1626. [Google Scholar] [CrossRef]
  32. Naruei, I.; Keynia, F. Wild horse optimizer: A new meta-heuristic algorithm for solving engineering optimization problems. Eng. Comput. 2022, 38 (Suppl. S4), 3025–3056. [Google Scholar] [CrossRef]
  33. Borhanazad, H.; Mekhilef, S.; Ganapathy, V.G.; Modiri-Delshad, M.; Mirtaheri, A. Optimization of micro-grid system using MOPSO. Renew. Energy 2014, 71, 295–306. [Google Scholar] [CrossRef]
  34. Omotoso, H.O.; Al-Shaalan, A.M.; Farh, H.M.H.; Al-Shamma’a, A.A. Techno-Economic Evaluation of Hybrid Energy Systems Using Artificial Ecosystem-Based Optimization with Demand Side Management. Electronics 2022, 11, 204. [Google Scholar] [CrossRef]
  35. Alturki, F.A.; Farh, H.M.H.; Al-Shamma’a, A.A.; AlSharabi, K. Techno-Economic Optimization of Small-Scale Hybrid Energy Systems Using Manta Ray Foraging Optimizer. Electronics 2020, 9, 2045. [Google Scholar] [CrossRef]
  36. Tiwari, A.N.; Dubey, N. A Methodology of Optimal Sizing for Wind Solar Hybrid System. Asian Rev. Mech. Eng. 2015, 4, 11–16. [Google Scholar] [CrossRef]
  37. Tiwari, V.; Dubey, H.M.; Pandit, M. Optimal Sizing and Allocation of DG in Distribution System Using TLBO. In Artificial Intelligence and Sustainable Computing; Dubey, H.M., Pandit, M., Srivastava, L., Panigrahi, B.K., Eds.; Springer: Singapore, 2022; pp. 409–421. [Google Scholar]
  38. Milovanović, M.; Klimenta, D.; Panić, M.; Klimenta, J.; Perović, B. An application of Wild Horse Optimizer to multi-objective energy management in a micro-grid. Electr. Eng. 2022, 104, 4521–4541. [Google Scholar] [CrossRef]
  39. Shaheen, M.A.M.; Ullah, Z.; Qais, M.H.; Hasanien, H.M.; Chua, K.J.; Tostado-Véliz, M.; Turky, R.A.; Jurado, F.; Elkadeem, M.R. Solution of Probabilistic Optimal Power Flow Incorporating Renewable Energy Uncertainty Using a Novel Circle Search Algorithm. Energies 2022, 15, 8303. [Google Scholar] [CrossRef]
  40. Ahsan, M.B.F.; Mekhilef, S.; Soon, T.K.; Usama, M.; Mubin, M.B.; Seyedmahmoudian, M.; Stojcevski, A.; Mokhlis, H.; Shrivastava, P.; Alshammari, O. Optimal sizing and cost analysis of hybrid energy storage system for EVs using metaheuristic PSO and firefly algorithms. Results Eng. 2024, 23, 102358. [Google Scholar] [CrossRef]
  41. Ali, Z.M.; Diaaeldin, I.M.; El-Rafei, A.; Hasanien, H.M.; Aleem, S.H.E.A.; Abdelaziz, A.Y. A novel distributed generation planning algorithm via graphically-based network reconfiguration and soft open points placement using Archimedes optimization algorithm. Ain Shams Eng. J. 2021, 12, 1923–1941. [Google Scholar] [CrossRef]
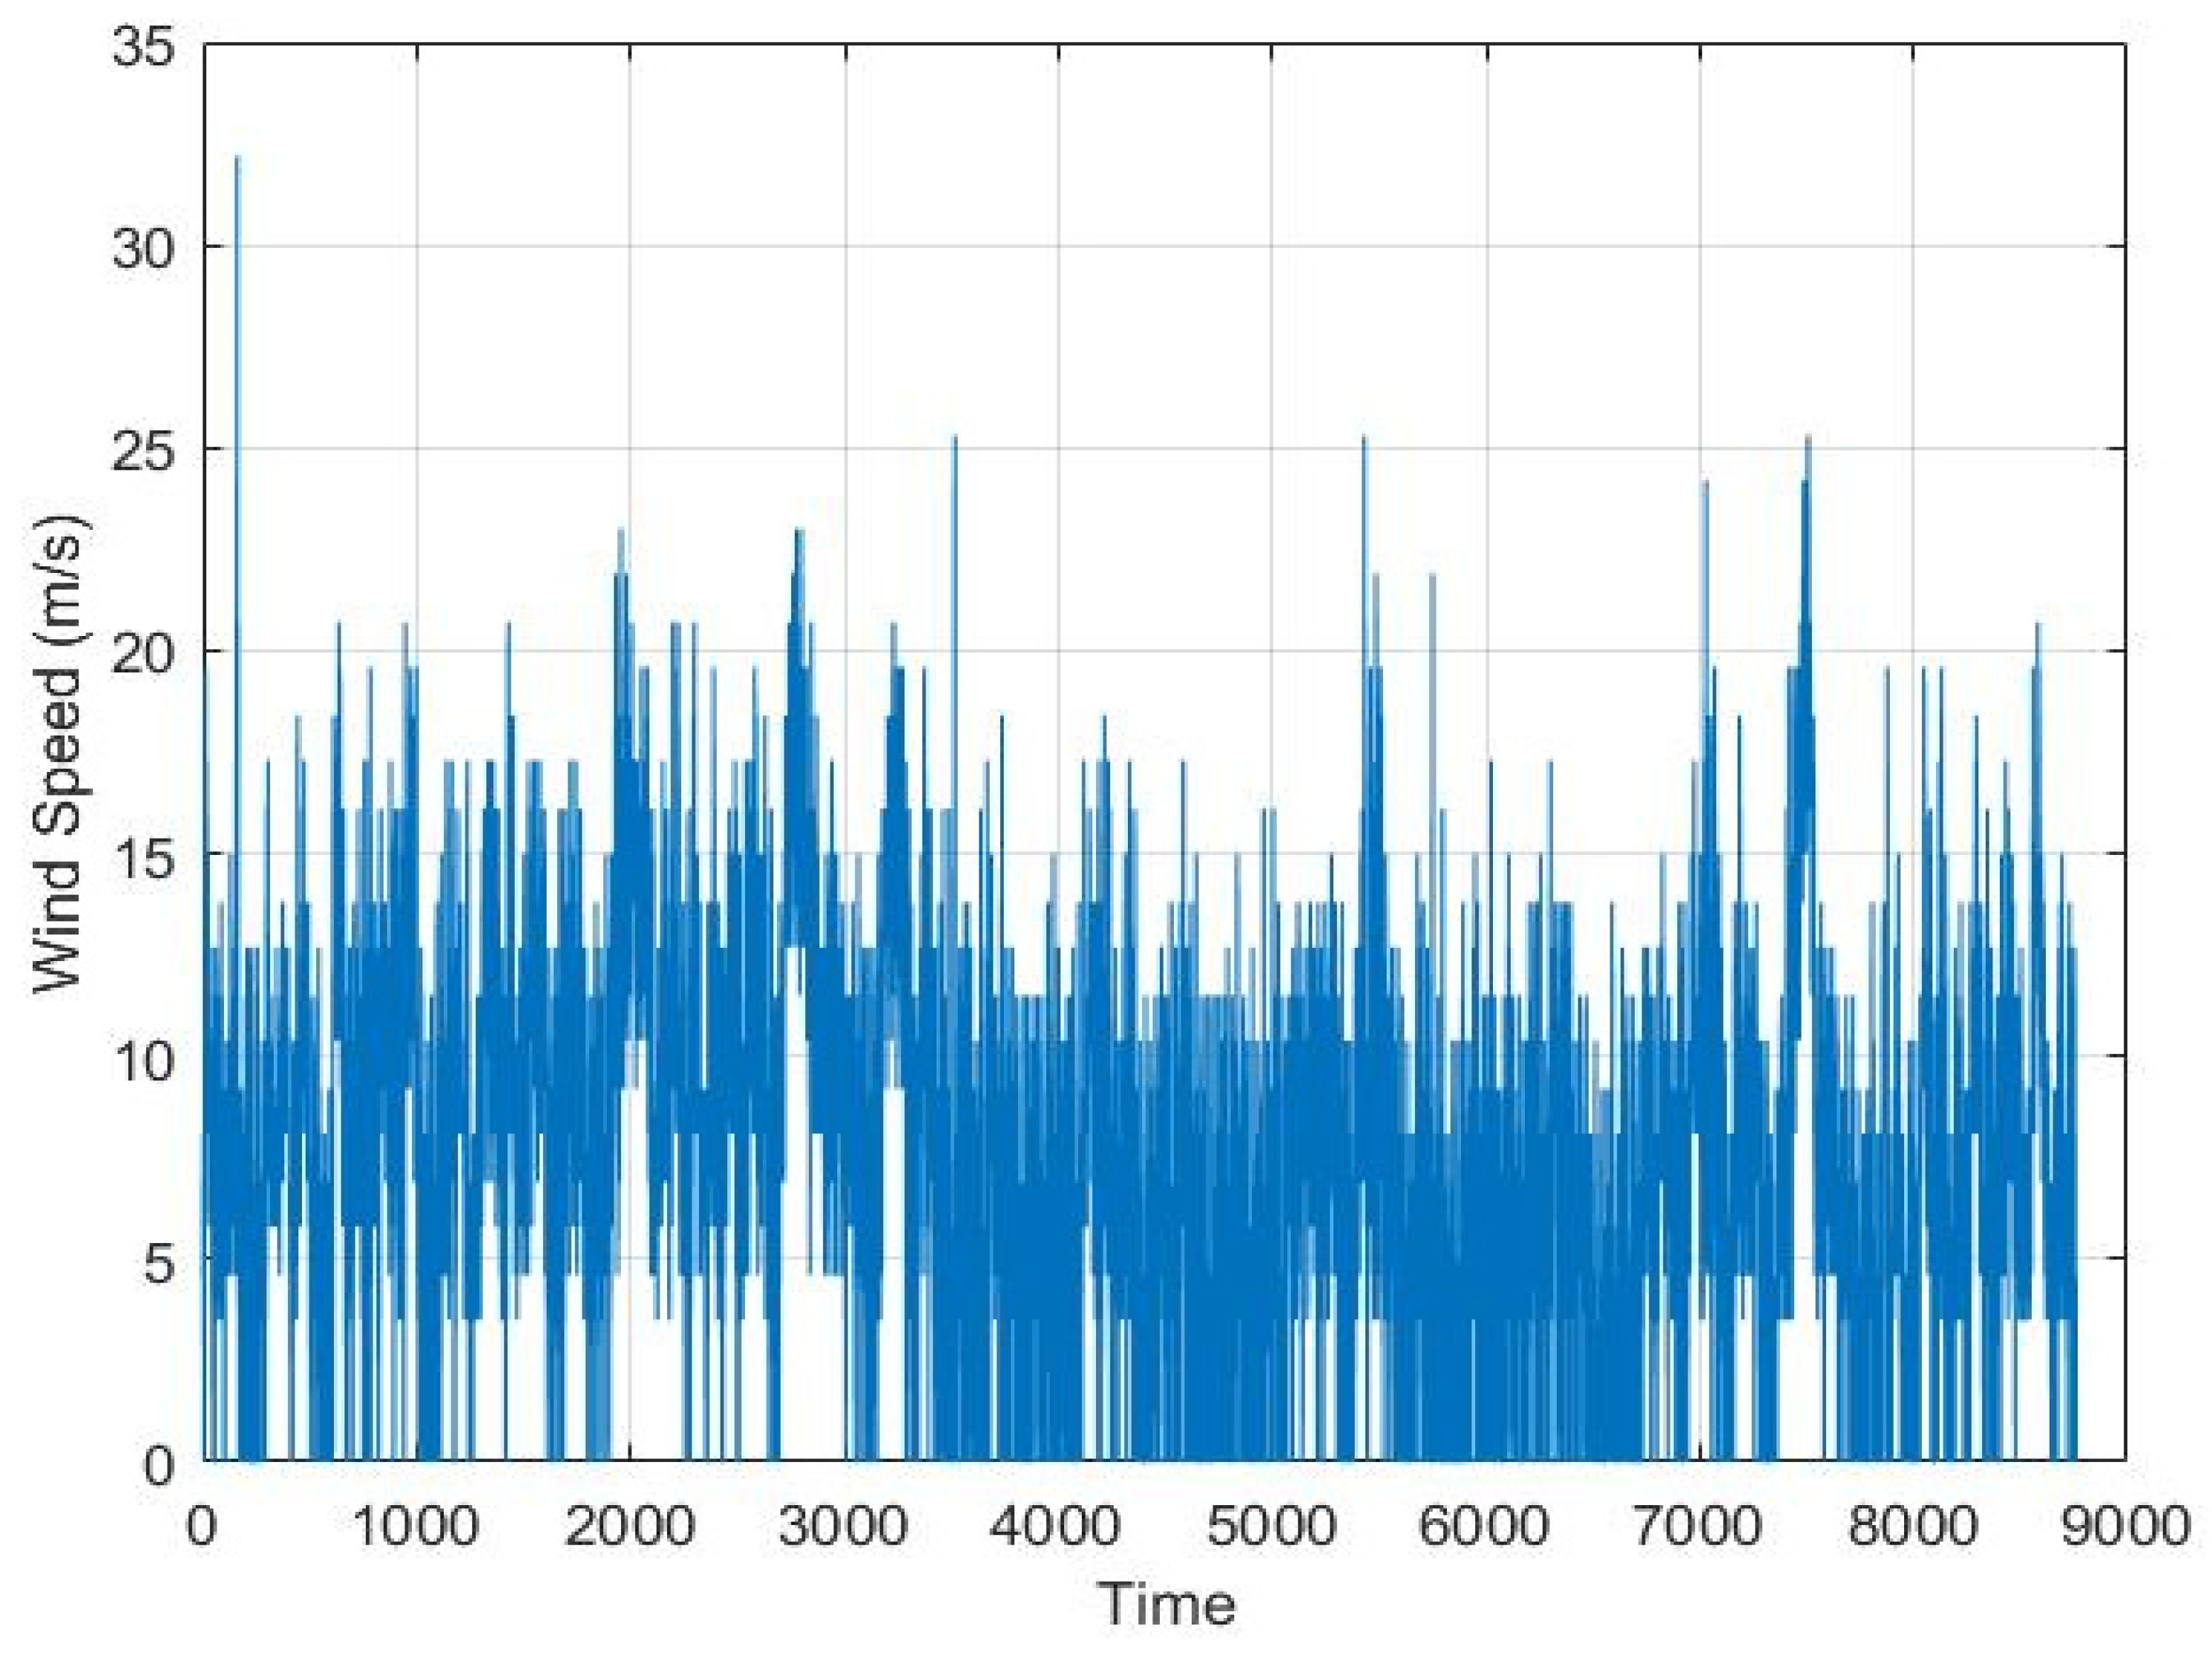
Figure 1. Wind speed throughout the year.
Energies 18 04280 g001
Figure 2. Load profile throughout the year.
Energies 18 04280 g002
Figure 3. Solar irradiance throughout the year.
Energies 18 04280 g003
Figure 4. Configuration of HES.
Energies 18 04280 g004
Figure 5. Wind turbine power output curve.
Energies 18 04280 g005
Figure 6. Optimization flowchart for hybrid renewable energy system sizing. The asterisk (*) denotes optimal design parameters.
Energies 18 04280 g006
Figure 7. Demand side management (DSM) load shifting logic flowchart.
Energies 18 04280 g007
Figure 8. Optimization algorithm flowchart.
Energies 18 04280 g008
Figure 9. Convergence behavior of the applied metaheuristic algorithms for Case 2.
Energies 18 04280 g009
Figure 10. Histogram illustrating the probability distribution of the cost of energy (COE) across 500 Monte Carlo scenarios for Case 2.
Energies 18 04280 g010
Figure 11. Box plot showing the spread and quartiles of COE values obtained from the Monte Carlo robustness analysis for Case 2.
Energies 18 04280 g011
Figure 12. Cumulative distribution function (CDF) of the COE under input uncertainties for Case 2.
Energies 18 04280 g012
Figure 13. Convergence behavior of the applied metaheuristic algorithms for Case 4.
Energies 18 04280 g013
Figure 14. Histogram illustrating the probability distribution of the cost of energy (COE) across 500 Monte Carlo scenarios for Case 4.
Energies 18 04280 g014
Figure 15. Box plot showing the spread and quartiles of COE values obtained from the Monte Carlo robustness analysis for Case 4.
Energies 18 04280 g015
Figure 16. Cumulative distribution function (CDF) of the COE under input uncertainties for Case 4.
Energies 18 04280 g016
Figure 17. Contribution of PV, wind and diesel for Case 2.
Energies 18 04280 g017
Figure 18. Contribution of PV, wind and diesel for Case 3.
Energies 18 04280 g018
Figure 19. Contribution of PV, wind, diesel and battery for Case 4.
Energies 18 04280 g019
Figure 20. Contribution of PV, wind, diesel and battery for Case 5.
Energies 18 04280 g020
Figure 21. Impact of five-year load growth on mean percentage fuel cost increase for different system configurations.
Energies 18 04280 g021
Table 1. Wind speed and solar irradiance average and maximum values.
AverageMaximum
Wind speed (m/s)7.5232
Solar irradiance ( k W / m 2 )0.22861.12
Table 2. Input parameters for hybrid energy system (HES).
ParameterValueUnit
Wind turbine generator
cut-in speed3m/s
cut-out speed25m/s
rated speed8m/s
rated Power2kW
efficiency 95%
initial cost 2000USD/kW
lifetime 24year
Photovoltaic Module
initial cost 3400USD/kW
lifetime24year
Inverter
efficiency90%
lifetime24 year
initial cost 2500USD/kW
Battery
efficiency85%
lifetime12year
initial cost 280USD/kW
depth of discharge80%
state of charge20%
Diesel generator
lifetime 24,000hours
initial cost 1000USD/kW
fuel cost 0.8USD/L
Economic parameters
operating, maintenance, and running cost20%
real interest rate 13 %
project lifetime24 year
Table 3. Optimization results for TLBO, CSA, WHO, EDO, and PSO for optimal COE for Case 2.
Optimization
Technique
Optimal (COE)Average TimeStandard Deviation
TLBOUSD 0.6211/kWh 1604.84 s 1.17  ×  10 16
CSAUSD 0.6288/kWh905.18 s 3.041  ×  10 3
EDOUSD 0.6211/kWh829.83 s 1.17  ×  10 16
WHOUSD 0.6211/kWh680.49 s 1.17  ×  10 16
PSOUSD 0.6211/kWh818.39 s 3.04  ×  10 7
Table 4. Monte Carlo simulation results for Case 2.
Metric Value
Mean COE (USD/kWh)0.6236
Standard Deviation ±0.0260
Relative Standard Deviation (%)4.16%
Minimum COE (USD/kWh)0.5275
Maximum COE (USD/kWh)0.7044
Table 5. Optimization results for TLBO, CSA, WHO, EDO, and PSO for optimal COE for Case 4.
Optimization
Technique
Optimal (COE)Average TimeStandard Deviation
TLBOUSD 0.43084 kWh1843.28 s 5.16  ×  10 5
CSAUSD 0.44469 kWh903.71 s 4.066  ×  10 3
EDOUSD 0.43092 kWh898.97 s 6.32  ×  10 5
WHOUSD 0.43088/kWh757.33 s 4.22  ×  10 5
PSOUSD 0.43089/kWh962.83 s 4.83  ×  10 5
Table 6. Monte Carlo simulation results for Case 4.
Metric Value
Mean COE (USD/kWh)0.4304
Standard Deviation ±0.0151
Relative Standard Deviation (%)3.51%
Minimum COE (USD/kWh)0.3873
Maximum COE (USD/kWh)0.5063
Table 7. Case 1 simulation results.
CategoryMetricValue
economicnet present cost (million USD) 0.983
initial capital cost (million USD) 0.184
cost of energy (24 years) (USD/kWh) 1.4260
total fuel consumed cost (USD/yr) 32  ×  1 0 3
electricaltotal electricity from diesel
generator (kWh/yr)
94.646  ×  1 0 3
total fuel consumed (L/yr) 40  ×  1 0 3
emissionCarbon dioxide (kg/yr) 104,790
Table 8. Case 2 simulation results.
CategoryMetricValue
economicnet present cost (million USD) 0.428
initial capital cost (million USD) 0.165
cost of energy (24 years) (USD/kWh)0.6211
total fuel consumed cost (USD/yr) 9.6  ×  1 0 3
electricaltotal electricity production by diesel
generator (kWh/yr)
23.36  ×  1 0 3
total fuel consumed (L/yr) 12  ×  1 0 3
emissionCarbon dioxide (kg/yr)31,692
Table 9. Case 3 simulation results.
CategoryMetricValue
economicnet present cost (million USD)0.36
initial capital cost (million USD)0.142
cost of energy (24 years) (USD/kWh)0.5214
total fuel consumed cost (USD/yr) 7.8  ×  1 0 3
electricaltotal electricity production by diesel generator (kWh/yr) 17.3  ×  1 0 3
total fuel consumed (L/yr) 9.8  ×  1 0 3
emissionCarbon dioxide (kg/yr)25,882
Table 10. Case 4 simulation results.
CategoryMetricValue
economicnet present cost (million USD)0.297
initial capital cost (million USD)0.148
cost of energy (24 years) (USD/kWh)0.4309
total fuel consumed cost (USD/yr) 4.97  ×  1 0 3
electricaltotal electricity production by diesel
generator (kWh/yr)
13.3  ×  1 0 3
total fuel consumed(L/yr) 6.2  ×  1 0 3
emissionCarbon dioxide (kg/yr)16,374
Table 11. Case 5 simulation results.
CategoryMetricValue
economicnet present cost (million USD)0.28
initial capital cost (million USD)0.148
cost of energy (24 years) (USD/kWh)0.4069
total fuel consumed cost (USD/yr) 4.28  ×  1 0 3
electricaltotal electricity production by diesel
generator (kWh/yr)
10.5  ×  1 0 3
total fuel consumed(L/yr) 5.35  ×  1 0 3
emissionCarbon dioxide (kg/yr)14,130
Table 12. Comparative summary of mean fuel cost increase (%), standard deviation, and Loss of Power Supply Probability (LPSP) for Case 2 and Case 3, considering projected load growth over a 5-year period.
CaseCase 2Case 3
Year Mean Fuel Cost Increase (%) ±StdLPSPMean Fuel Cost Increase (%)±StdLPSP
15.031.07330−13.290.95080
210.991.78760−7.911.68620
317.722.44880−1.512.40630
425.313.40683.43 × 10 6 5.953.29063.42 × 10 6
534.054.14651.69 × 10 4 14.434.13491.29 × 10 4
Table 13. Comparative summary of mean fuel cost increase (%), standard deviation, and Loss of Power Supply Probability (LPSP) for Case 4 and Case 5, considering projected load growth over a 5-year period.
CaseCase 4Case 5
Year Mean Fuel Cost Increase (%) ±StdLPSPMean Fuel Cost Increase (%)±StdLPSP
1−43.640.97040−48.651.12290
2−38.351.63110−42.791.76250
3−32.312.18480−36.092.52470
4−25.513.05503.43 × 10 6 −28.363.44003.42 × 10 6
5−17.663.82591.69 × 10 4 −19.164.52491.69 × 10 4
Disclaimer/Publisher’s Note: The statements, opinions and data contained in all publications are solely those of the individual author(s) and contributor(s) and not of MDPI and/or the editor(s). MDPI and/or the editor(s) disclaim responsibility for any injury to people or property resulting from any ideas, methods, instructions or products referred to in the content.