Article

Optimal Synchronous Condenser Placement in Renewable Energy Bases to Meet Renewable Energy Transfer Capacity Requirements

1
Key Laboratory of Smart Grid of Ministry of Education, Tianjin University, Tianjin 300072, China
2
Electric Power Research Institute, State Grid Jibei Electric Power Company Limited, Beijing 100045, China
*
Author to whom correspondence should be addressed.
Energies 2025, 18(16), 4267; https://doi.org/10.3390/en18164267
Submission received: 8 June 2025 / Revised: 18 July 2025 / Accepted: 31 July 2025 / Published: 11 August 2025
(This article belongs to the Special Issue Analysis and Control of Power System Stability)

Abstract

The large-scale integration of renewable energy and the high penetration of power electronic devices have led to a significant reduction in system inertia and short-circuit capacity. This is particularly manifested in the form of insufficient multiple renewable energy stations short-circuit ratio (MRSCR) and transient overvoltage issues following severe disturbances such as AC and DC faults, which greatly limit the power transfer capability of large renewable energy bases. To effectively mitigate these challenges, this paper proposes an optimal synchronous condenser deployment method tailored for large-scale renewable energy bases. The proposed mathematical model supports a hybrid centralized and distributed configuration of synchronous condensers with various capacities and manufacturers while considering practical engineering constraints such as short-circuit ratio, transient overvoltage, and available bays in renewable energy stations. A practical decomposition and iterative computation strategy is introduced to reduce the computational burden of transient stability simulations. Case studies based on a real-world system verify the effectiveness of the proposed method in determining the optimal configuration of synchronous condensers. The results demonstrate significant improvements in grid strength (MRSCR) and suppression of transient overvoltages, thereby enhancing the stability and transfer capability of renewable energy bases in weak-grid environments.

1. Introduction

The rapid growth of large-scale integration of renewable energy, together with the increasing penetration of power electronic devices, has markedly reduced the short-circuit capacity and the overall inertia of the system. These reductions have been widely reported to trigger excessive reactive power and transient overvoltage during fault clearance in regions with high penetration of renewables [1]. Such issues impose stringent limits on the export capability of renewable energy bases [2], often resulting in significant curtailment and energy waste. At the same time, grid codes around the world are evolving to include explicit requirements, such as minimum short-circuit ratio (SCR), transient overvoltage limits, or other system strength criteria, at points of interconnection, compelling planners and developers to adopt technical measures that ensure compliance under a wide range of operating conditions.
Synchronous condensers (SCs), as rotating machines, inherently provide multiple support functions of the grid, including the contribution of the fault current, the reactive dynamic power supply, and the inertia support. With their strong short-term reactive overload capability and voltage-independent operation, SCs can significantly improve SCR and voltage stability at critical connection points during disturbances. As a result, SCs are increasingly recognized as a key technology to reinforce weak grids and improve the export capability of large-scale renewable energy systems [3]. However, their high capital cost, siting constraints, and long construction lead times demand a careful balance between technical effectiveness and economic feasibility.
These considerations give rise to a pressing research question: How can the placement and sizing of SCs be optimally determined to cost-effectively enhance system strength, ensure compliance with evolving grid code requirements, and fully unlock the transmission capacity of renewable energy bases? Addressing this question lies at the intersection of advanced power system modeling, optimization under nonlinear stability constraints, and practical grid reinforcement strategies, making it a topic of significant academic interest and urgent engineering importance.
Extensive studies have addressed the optimal placement and sizing of SCs, encompassing siting strategies, sizing methods, and deployment modes (centralized vs. distributed). To systematically review the research progress, this paper classifies the existing literature into four key dimensions: formulation of objective functions, constraint modeling, definition of decision variables, and solution strategies.
Regarding objective functions, most studies aim to minimize overall costs, commonly represented by total SC capacity or capital investment, while satisfying the system stability requirements. For example, [4] proposed the use of the Multiple Renewable Energy Stations Short-circuit Ratio (MRSCR) index [5] to quantify the voltage support capability and minimize the installed SC capacity to enhance the stability of the post-renewable voltage. In [6], a two-stage optimization strategy is proposed: the first stage minimizes the SC capacity for initial planning, and the second stage refines the capacity under transient overvoltage constraints to balance technical performance and economic efficiency. Some works extend this to life-cycle cost optimization by including operating and maintenance (O&M) costs. Reference [7] incorporates annual O&M and energy loss costs into the objective, while [8] applies convex optimization to balance investment cost and operational performance under stability constraints. Other studies, such as [9,10], consider control cost or reactive support enhancement to formulate more engineering-oriented economic functions, while [11] maximize the net present value (NPV) of installing synchronous condensers. In general, there is a shift from single-objective formulations (e.g., capacity minimization) to comprehensive economic metrics that account for O&M and energy costs, although some works still overlook O&M impacts in scheme selection.
In terms of constraint modeling, physically and operationally sound constraints are essential to ensure feasibility and engineering applicability. In addition to traditional constraints on power balance, bus voltage, current limits, and device capacities, recent studies emphasize the integration of dynamic stability constraints specific to renewable-dominated systems, especially SCR and transient overvoltage (TOV) limits. For example, [6] requires that the SCR in each renewable plant, after SC reinforcement, not fall below 1.5 to ensure adequate fault traversal. Reference [7] evaluates TOV performance through multiscenario time-domain simulations, limiting the voltage peak to 1.3 p.u., thereby improving transient voltage stability. Some studies also introduce constraints on frequency stability [12] and small-signal stability [13]. However, SCR support and TOV limits remain the primary focus in renewable base scenarios. In general, recent developments increasingly incorporate dynamic stability constraints into optimization models, improving the robustness and completeness of the configuration outcomes.
In terms of decision variables, the SC configuration involves both placement and size. Placement variables determine where to install SCs, distinguishing centralized options (e.g., at collector stations or converter terminals) from distributed deployment (e.g., at renewable plant buses). Reference [4] proposes a hybrid ’centralized + distributed’ strategy to enhance overall grid support. The capacity variables define the amount of SC capacity installed at each node. Some works treat this as a continuous variable, while others adopt standard engineering sizes (e.g., 50 Mvar, 100 Mvar) with discrete combinatorial configurations [6]. Most studies formulate decision variables as a mix of binary and continuous values, enabling flexibility while maintaining modeling simplicity. As research evolves, decision variable structures are becoming more diverse, enabling multinode, multivoltage-level, and multitype device configurations aligned with practical engineering demands.
Due to the non-linearity, mixed integer nature, and embedded dynamic constraints of SC configuration problems, intelligent and heuristic algorithms are widely used. AI-driven methods such as particle swarm optimization (PSO), genetic algorithms (GA), and hybrid metaheuristics are prevalent [14]. Reference [7] uses PSO to explore cost-optimal solutions within feasible space, while [15] proposes a bilevel optimization model to jointly improve grid strength and renewable accommodation, solved using GA. The two-stage model in [6] is solved using a quantum GA. Reference [8] applies convex optimization to improve global convergence, and [16] builds a hybrid SC–grid-forming storage configuration model considering SCR constraints across multiple plants, solved via the interior point method. Reference [17] proposes a Rayleigh cut method to equivalently transform eigenvalue inequality constraints into a set of linear constraints for the SCR-constrained SC placement problem. In practice, hierarchical hybrid strategies that combine sensitivity analysis and intelligent algorithms are increasingly favored. These involve narrowing the search space using engineering insights and then applying optimization algorithms to efficiently derive globally optimal configurations. In addition, several novel AI-driven frameworks have been proposed for solving complex optimization problems [18].
In summary, existing studies have established a relatively mature theoretical framework for SC configuration, covering objective functions, constraints, decision variables, and solution approaches, thus advancing practical deployments. However, gaps remain, including insufficient modeling of O&M costs, limited expression of engineering constraints, and suboptimal algorithm efficiency. To address these challenges, this paper proposes a novel SC configuration method tailored to large-scale renewable energy bases. The model incorporates investment costs (including land acquisition), O&M expenses, and engineering constraints such as available space and land resources. It supports both centralized and distributed hybrid configurations with various device types and sizes and explicitly considers SCR and TOV constraints. A decomposition-based iterative strategy is proposed to enhance computational efficiency and practical feasibility, making the method well-suited for engineering deployment under complex physical constraints [19].
The major contributions of this paper are summarized as follows.
  • A novel optimization model is proposed that supports both centralized and distributed deployment of SCs with multiple capacities and vendor types. This model enables flexible multi-site and multi-vendor selection, thereby enhancing the engineering applicability and economic feasibility of SC deployment schemes in practical grid scenarios.
  • A comprehensive objective function and constraint system is developed by jointly considering investment cost, operation and maintenance expenses, and engineering constraints such as short-circuit ratio (SCR), transient overvoltage, and available installation space. By introducing SCR sensitivity indicators, the original non-linear optimization problem is reformulated as a mixed integer linear programming model (MILP). A decomposition-based iterative solution strategy is further employed to significantly reduce the computational burden associated with transient stability simulations, making the method suitable for large-scale renewable energy transmission applications.
  • Simulation results demonstrate that the proposed method can generate multiple feasible SC deployment schemes under delivery capacity and security constraints. In addition, cost–benefit comparisons among solutions are provided, highlighting the capability of the method to support decision-making in real-world engineering projects. These results confirm the strong potential of the proposed approach for practical implementation in future power systems with high penetration of renewables.
The remainder of this paper is organized as follows. Section 2 introduces the mathematical formulation for the optimal configuration of synchronous condensers in renewable energy bases. Section 3 presents a practical decomposition-based iterative solution strategy designed to alleviate the computational burden associated with transient stability simulations. Section 4 establishes a set of investment–benefit evaluation metrics for SC deployment. Section 5 demonstrates the effectiveness and applicability of the proposed approach through a real-world case study. Section 6 concludes the paper by summarizing the key findings and outlining potential directions for future research.

2. Mathematical Model for the Optimal Configuration of Synchronous Condensers in Renewable Energy Bases

Large-scale renewable energy bases typically comprise multiple wind and solar generation plants. These are interconnected via collector substations and connected to the transmission network through ultra-high-voltage (UHV) AC or DC lines for long-distance delivery. Due to the lack of local conventional generation for support, such systems are often constrained by low short-circuit ratios (SCR) and transient overvoltage (TOV) risks, which significantly limit renewable energy delivery capacity and result in considerable curtailment. In practical planning, a target simultaneous output ratio for renewable generation is usually specified. Based on this target, the optimal coordinated configuration of synchronous condensers (SCs) is investigated across multiple renewable energy stations and collector substations to ensure sufficient delivery capability.

2.1. Objective Function

The proposed optimization model aims to minimize the total cost of newly installed synchronous condensers, including capital investment, operating, and maintenance costs, across both renewable energy stations and collector substations.
min   f ( x , y )   =   C i ( x , y )   +   C o ( x , y )   +   C m ( x , y )
where x and y are the decision variables that represent the number of SC installed on the candidate buses at renewable energy stations and collector substations, respectively. Specifically, x i , p denotes the number of SCs of type p installed at the ith renewable station bus, while y j , q denotes the number of SCs of type q installed at the jth collector substation bus. These are integer variables.
Investment Cost: The investment cost consists of the capital cost, installation cost, and land acquisition cost, expressed as:
C i ( x , y )   =   η i   =   1 N wf p   =   1 M wf ( a p   +   b p   +   l p ) x i , p +   η   j   =   1 N gs q   =   1 M gs ( a q   +   b q   +   l q ) y j , q
where N wf and N g s are the number of candidate buses at renewable stations and collector substations, respectively; M w f and M g s are the number of candidate SC types at renewable stations and collector substations, respectively; a p , b p , and l p are the capital cost, installation cost, and land cost of SC type p at renewable stations; a q , b q , and l q are the capital cost, installation cost, and land cost of SC type q at collector substations; η is the capital recovery factor used to annualize investment costs, defined as
η   =   τ ( 1   +   τ ) μ ( 1   +   τ ) μ 1
where μ is the lifetime of the SC (years), and τ is the annual interest rate.
Typical SC capacities are 10 Mvar, 20 Mvar, and 50 Mvar at renewable stations, and 100 Mvar, 150 Mvar, and 300 Mvar at collector substations. SCs at renewable plants are commonly connected via transformers to 10.5/35/110/230 kV buses, and those at collector substations connect to 110/220 kV buses.
Operating Cost: The operating cost includes annual energy loss costs, calculated as
C o ( x , y )   =   i   =   1 N wf p = 1 M wf S N , p c p d p x i , p   +   j   =   1 N gs q   =   1 M gs S N , q c q d q y j , q
where S N , p is the capacity rate (Mvar) of SC type p at renewable stations; c p is the energy loss rate (typically 2%); d p is the local electricity price at the renewable station; S N , q , c q , and d q are the corresponding terms for collector substations.
Maintenance Cost: The maintenance cost accounts for annual repair and routine maintenance:
C m ( x , y )   =   i   =   1 N wf p   =   1 M wf ( u p   +   w p ) x i , p   +   j   =   1 N gs q   =   1 M gs ( u q   +   w q ) y j , q
where u p and w p are annual major and minor maintenance costs (in $1 M) for SC type p at renewable stations; u q and w q are the corresponding costs for SC type q in collector substations.

2.2. Constraints

Power Flow and Operating Limits: The power flow equations and the operating constraints on the bus i are expressed as [9]:
P g , i     P d , i =   V i j   =   1 N V j ( G i j cos θ i j   +   B i j sin θ i j )
Q g , i     Q d , i =   V i j   =   1 N V j ( G i j sin θ i j     B i j cos θ i j )
P g , i min     P g , i     P g , i max
Q g , i min     Q g , i     Q g , i max
V i min     V i     V i max
where P g , i and Q g , i are active and reactive power generation at bus i, respectively; P d , i and Q d , i are active and reactive power demands at bus i, respectively; V i and V j are voltage magnitudes at buses i and j; θ i j is voltage angle difference between buses i and j; G i j and B i j are real and imaginary parts of the bus admittance matrix element; P g , i min and P g , i max are lower and upper bounds on active generation; Q g , i min and Q g , i max are lower and upper bounds on reactive generation; V i min and V i max are lower and upper bounds on voltage magnitude.
Minimum SCR: Several indices have been proposed in the literature to characterize grid strength and assess the stability of renewable-dominated systems, such as the multi-infeed short-circuit ratio (MISCR) [20], the effective short-circuit ratio (ESCR) [21], and the generalized short-circuit ratio (gSCR) [22]. These indices provide valuable insights in specific application scenarios. In this study, the multi-station renewable short-circuit ratio (MRSCR) is adopted [5]. The MRSCR not only quantifies the strength of a system with multiple renewable injection points but also captures the interactive impact among different renewable stations. This property makes it highly relevant for assessing how the deployment of the synchronous condenser (SC) alters the system’s short-circuit capacity and overall voltage support. According to the national standard Technical Guidelines for Power System Security and Stability Calculation [23], the MRSCR at the low-voltage side of the step-up transformer for renewable units should not fall below 1.5, and at the point of common coupling (PCC), it should not be less than 2.0, and preferably above 3.0. The minimum SCR constraint for renewable bus i is defined as [5]:
ξ scr , i   =   S ac , i P R E , i   +   j     i Z e q , i j Z e q , i i P R E , j     ξ min , i
where S ac , i is the short-circuit capacity (MVA) on the low voltage side of the step-up transformer or common connection point (PCC); P R E , i and P R E , j are active power output (MW) of renewable unit i and j; Z e q , i j / Z e q , i i is the power equivalence coefficient reflecting the impedance-based influence of unit j on i; ξ min , i is the minimum SCR threshold at bus i, typically set to 1.5.
Transient Overvoltage Limit: According to national standards such as [24,25], wind or solar units must remain connected for 500 ms when voltage rises to 125–130% of nominal value at the PCC. Accordingly, the transient overvoltage constraint for renewable bus i is given by:
V peak , i   <   V max
where V peak , i is peak transient voltage at bus i after the fault, obtained via transient stability simulation involving differential-algebraic equations (DAEs); V max is maximum allowable transient voltage, typically 1.3 p.u.
SC Count Limit: In practice, the number of SCs that can be installed at a candidate bus is limited by available physical space or owner preference. The following constraints apply:
p   =   1 M wf x i , p     B wf , i max
q   =   1 M gs y j , q     B gs , j max
where B w f , i max and B g s , j max are the maximum number of SCs that can be installed at candidate bus i in a renewable station and at candidate bus j in a collector substation, respectively.
Equations (1)–(14) jointly define a complete optimization model for distributed and centralized configuration of synchronous condensers at renewable energy stations and collector substations. This constitutes a typical mixed-integer nonlinear programming (MINLP) problem. Due to the presence of nonlinear constraints such as (11) and (12), direct solution of the model is computationally challenging. Although traditional trajectory-sensitivity-based methods can handle transient overvoltage constraints, they require repeated execution of time-domain simulations, which becomes prohibitively expensive for large-scale systems with many candidate locations. Therefore, alternative decomposition or surrogate-based strategies are often needed to improve tractability in practical applications.

3. Solution Strategy Based on Short-Circuit Ratio Sensitivity

To improve computational efficiency, a sensitivity-based solution strategy is proposed by leveraging the inverse correlation between the short-circuit ratio (SCR) of renewable buses and transient voltage peaks. Specifically, the transient voltage constraint is initially ignored, and the optimization problem is solved based on the SCR sensitivity with respect to synchronous condenser (SC) deployment. Once a feasible configuration is obtained, the transient voltage peak constraint is subsequently verified. If violations occur, the minimum SCR threshold ξ min , i is adjusted accordingly, and the problem is re-optimized.
Using the analytical sensitivity formula of the multi-renewable short-circuit ratio (MRSCR) derived in [4], the SCR improvement Δ ξ scr , i at each bus can be estimated under different SC deployment schemes. This allows reformulating the nonlinear integer problem defined by (1)–(11), (13), and (14) into the following Mixed Integer Linear Programming (MILP) problem:
min f ( x , y )   =   min C i ( x , y )   +   C o ( x , y )   +   C m ( x , y )
P g , i min     P g , i 0   +   k   =   1 N wf p   =   1 M wf P g , i x k , p x k , p   +   j   =   1 N gs q   =   1 M gs P g , i y j , q y j , q     P g , i max
Q g , i min     Q g , i 0   +   k   =   1 N wf p   =   1 M wf Q g , i x k , p x k , p   +   j   =   1 N gs q   =   1 M gs Q g , i y j , q y j , q     Q g , i max
V i min     V i 0   +   k   =   1 N wf p   =   1 M wf V i x k , p x k , p   +   j   =   1 N gs q   =   1 M gs V i y j , q y j , q     V i max
P i j , 0   +   k   =   1 N wf p   =   1 M wf P i j x k , p x k , p   +   j   =   1 N gs q   =   1 M gs P i j y j , q y j , q     P max , i j
ξ scr , i 0   +   k   =   1 N wf p   =   1 M wf ξ scr , i x k , p x k , p   +   j   =   1 N gs q   =   1 M gs ξ scr , i y j , q y j , q     ξ min , i
Together with installation limit constraints (13) and (14), the MILP model defined in (15)–(20) can be efficiently solved using commercial solvers such as Gurobi or SCIP.
Once a feasible configuration ( x , y ) is obtained, if the SCR at any node i does not satisfy the minimum threshold, the lower bound ξ min , i is incrementally adjusted as:
ξ min , i ( v   +   1 )   =   ξ min , i ( v )   +   ξ min , i ( v )     ξ scr , i ( v )
The problem is then re-solved using the updated threshold.
After all SCR constraints are satisfied, the PSD-SWNT platform is used to perform transient overvoltage validation. If any node V peak , i violates the constraint, a similar relaxation strategy is applied by monotonically increasing ξ min , i until all constraints are met.
This strategy avoids the high computational cost of trajectory sensitivity analysis for transient voltage peaks by decoupling transient simulation from the main optimization loop. Moreover, by converting the original nonlinear, nonconvex problem into a tractable MILP framework, the method supports flexible combinations of SC types and capacities, thus improving both computational efficiency and engineering feasibility.

4. Investment–Benefit Metrics for SC Deployment

To comprehensively evaluate both the technical and economic impacts of deploying synchronous condensers (SCs) in a large-scale renewable energy base, six investment–benefit metrics are formulated. Let ( x , y ) denote the SC deployment scheme in the subsequent economic analysis; N g denotes the set of renewable units under study; P R E , i N denotes the installed capacity (MW) of the ith renewable unit; T denotes the set of time periods in a year; P R E , i pred ( t ) denote the predicted active power output (MW) of renewable unit i in time period t; and P R E , i ( t ) denotes the actual active power output (MW) of unit i in time period t considering security-constrained dispatch and curtailment.
Annual Generation (GWh): The annual generation denotes the total electric energy delivered by the renewable energy base within a calendar year, considering the actual dispatch and curtailment:
Annual   Generation   =   E t o t a l   =   t   =   1 T i   =   1 N g P R E , i ( t )
where E t o t a l is expressed in gigawatt hours (GWh).
Annual Utilization Hours (h): The annual utilization hours indicate the equivalent full-load operation hours of the renewable energy base over one year, considering actual dispatch and curtailment:
Annual   Utilization   Hours   =   E t o t a l   ×   1000 P N , t o t a l   =   E t o t a l   ×   1000 i   =   1 N g P R E , i N
where P N , t o t a l is the total installed capacity (MW). The factor 1000 converts GWh to MWh, and the result is expressed in hours (h).
Increased Generation (GWh): The increased generation quantifies the additional electric energy that can be delivered due to the improved system strength and reduced curtailment after SC installation:
Increased   Generation   =   E t o t a l a f t e r     E t o t a l b e f o r e
where E t o t a l a f t e r and E t o t a l b e f o r e are the annual generation (GWh) after and before SC deployment, respectively.
Increased Annual Revenue ($1 M): The increased annual revenue measures the extra income from the additional electricity sold after SC configuration:
Increased   Annual   Revenue   =   Increased   Generation   ×   π tariff / 1000
where π tariff is the average price of electricity ($/MWh). The result is expressed in million US dollars ($1 M).
Curtailment Rate (%): The curtailment rate reflects the percentage of available renewable energy that could not be delivered to the grid due to technical constraints:
Curtailment   Rate   =   1     E t o t a l E a v a i l   ×   100 %
where E avail   =   t   =   1 T i   =   1 N g P R E , i p r e d ( t ) is the available annual generation (GWh) and E total is the actual annual generation (GWh).
Payback Period Considering O&M Costs (y): To assess the economic feasibility of the deployment of synchronous condenser (SC) on the renewable energy base, the payback period is adopted as one of the key investment–benefit metrics. Unlike the simplified payback analysis that only accounts for the initial investment cost, this study incorporates both annual operation and maintenance (O&M) costs and discounts the future cash flows to reflect the time value of money.
The discounted net cash flow in year t is expressed as
R ncf ( t )   =   Increased   Annual   Revenue   ×   φ s c     C o ( x , y )     C m ( x , y ) ( 1   +   τ ) t
where φ s c denotes the fraction of the increased annual revenue assigned to the SCs from the additional energy export (in $1 M/year); C o ( x , y ) and C m ( x , y ) are the annual operation and maintenance costs (in $1 M/year); and τ is the annual interest rate.
The cumulative discounted net cash flow by the end of year n is
A ncf ( n )   =   t   =   1 n R ncf ( t )
Let n be the first year such that
A ncf ( n )     C i ( x , y )   and   A ncf ( n     1 )   <   C i ( x , y ) ,
where C i ( x , y ) is the total initial investment cost (in $1 M). The payback period is then obtained through linear interpolation as
Payback   Period   =   ( n     1 )   +   C i ( x , y )     A ncf ( n     1 ) R ncf ( n )
The interpolation in (29) assumes that the cash flow in year n is evenly distributed throughout the year. If A ncf ( μ )   <   C i ( x , y ) within the project lifetime μ , the payback is not achieved.
These metrics jointly provide a comprehensive evaluation framework, which balances grid stability improvements with economic performance for different SC configuration scenarios in high-penetration renewable systems.

5. Case Study

To verify the effectiveness and engineering applicability of the proposed hybrid configuration method for synchronous condensers (SCs), a representative large-scale renewable energy base delivery system is selected for case analysis. As shown in Figure 1, the system comprises 15 renewable power stations connected at 220 kV and 2 collector substations connected at 500 kV, with a total installed renewable capacity of 2.988 GW. The base case for the SC configuration adopts a typical off-peak winter operating scenario, with unit commitment following the standard winter pattern.

5.1. System Structure and Parameter Settings

Before SC installation, the maximum deliverable power from the renewable base, while satisfying the SCR and transient overvoltage constraints, corresponds to a renewable simultaneity factor of 0.368. The target simultaneity factor is set to 0.700. Candidate buses for SC deployment include 500 kV, 220 kV, 110 kV, 35 kV, and 10 kV buses. Each bus is assumed to allow for the installation of at most one SC unit. To reduce computational burden, for multiple identical renewable units connected in parallel to the same 35 kV or 10 kV bus, only one representative bus is selected for SCR and transient overvoltage monitoring.
Four types of SC capacities are considered (10 Mvar, 20 Mvar, 50 Mvar, and 100 Mvar), provided by two vendors with differing technical characteristics. The cost structure for each SC capacity is listed in Table 1, which includes expenses for housing or civil foundation, main equipment, auxiliaries, commissioning, and type testing. The unit cost (per Mvar) decreases as the SC capacity increases.

5.2. Configuration Schemes and Cost Estimation

To ensure that the SCR at each monitoring bus is no less than 1.5 and the transient voltage peak does not exceed 1.3 p.u., three configuration schemes are proposed for comparative analysis:
  • Scheme 1: Candidate buses include only high-voltage buses (110 kV, 220 kV, and 500 kV) at renewable stations and collector substations.
  • Scheme 2: Candidate buses include only low-voltage buses (10 kV and 35 kV).
  • Scheme 3: The 500 kV, 220 kV, 110 kV, 35 kV, and 10 kV buses are considered candidates.
The estimated costs for each scheme are summarized in Table 2. Operation and maintenance (O&M) costs include both minor and major maintenance activities, with a major overhaul assumed to occur every five years. The service life of each synchronous condenser (SC) is taken as 30 years, with an interest rate of 0.07 and a cost factor φ s c of 0.2. Energy loss costs are assumed to be 2% of the rated SC capacity. For the base calculation, renewable electricity tariffs are applied using the lowest tariff among all sites, while site-specific tariffs are used for the remaining calculations. Scheme 3 yields the lowest total investment, maintenance, and energy loss costs and is therefore recommended.

5.3. SCR and Transient Overvoltage Validation

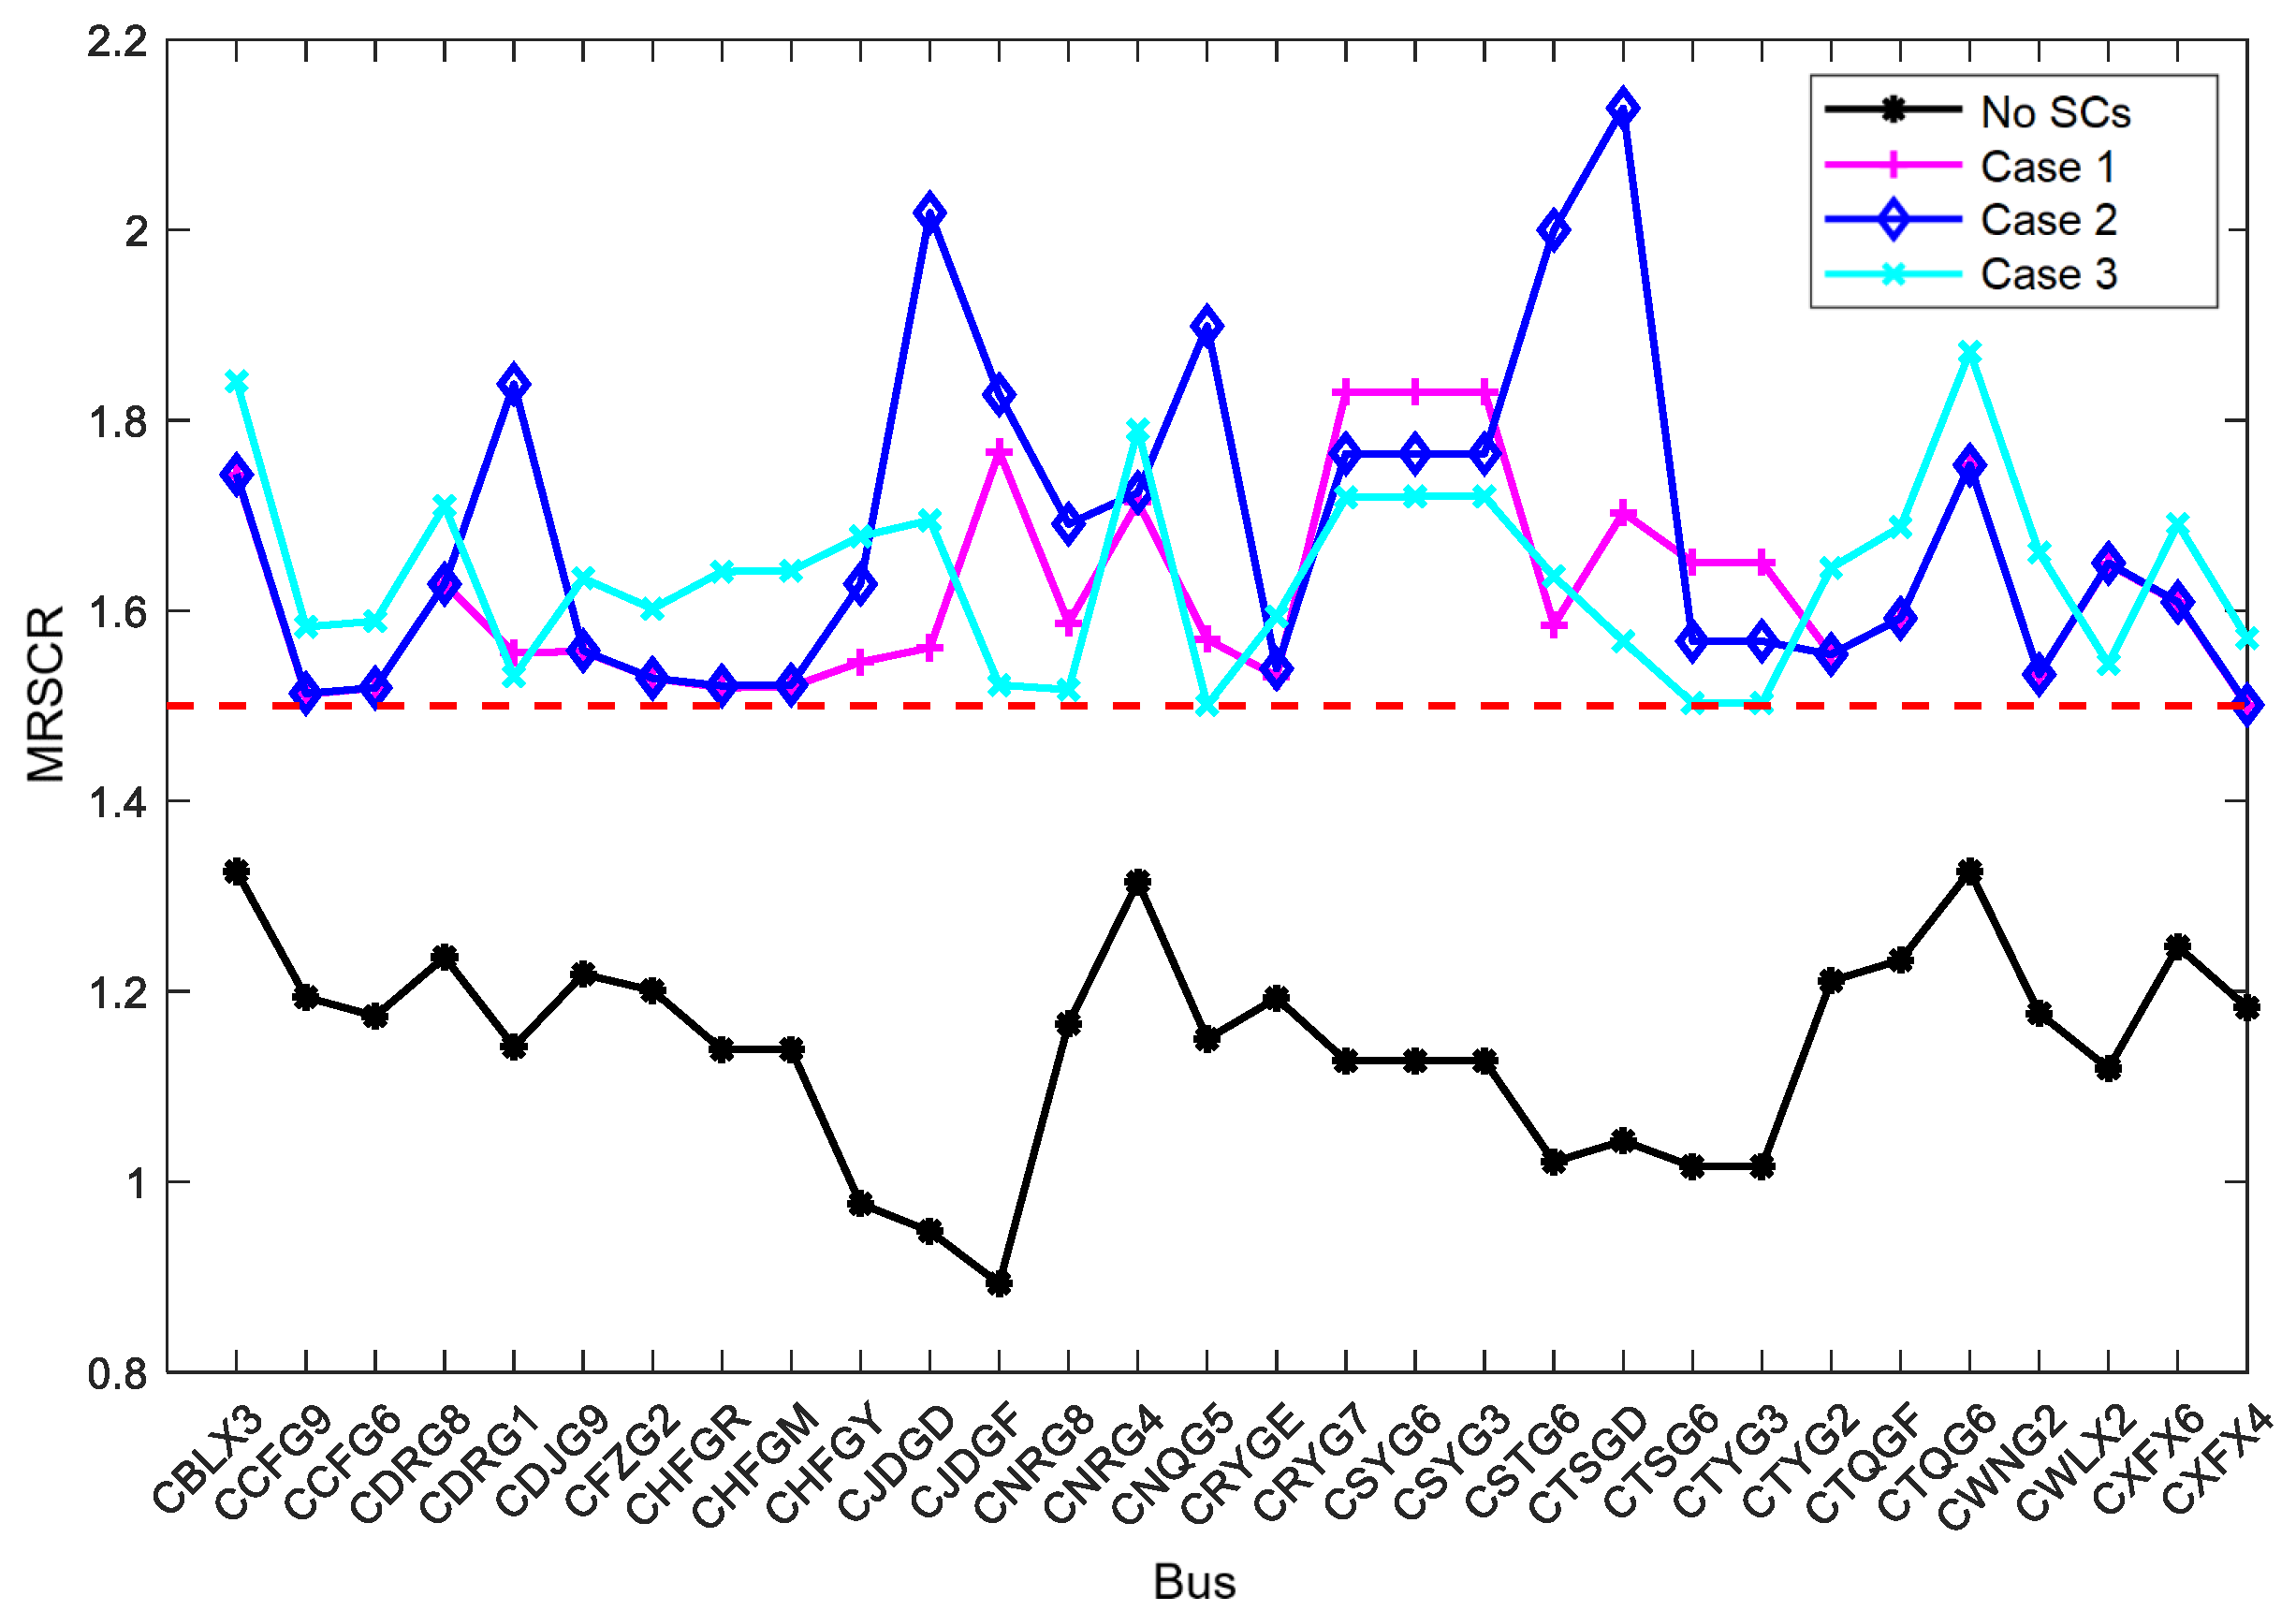
SCR validation is conducted using the PSD-BPA SCCP module. Since the decision variables are integers, the SCR at all monitoring nodes improves beyond the 1.5 threshold after SC deployment in all three schemes. To facilitate economic comparison, the maximum deliverable power for each scheme is also calculated. Figure 2 illustrates the SCR curves for all monitoring nodes before and after the installation of SC in the three schemes. The power transfer limit corresponds to the point where the minimum SCR equals 1.5.
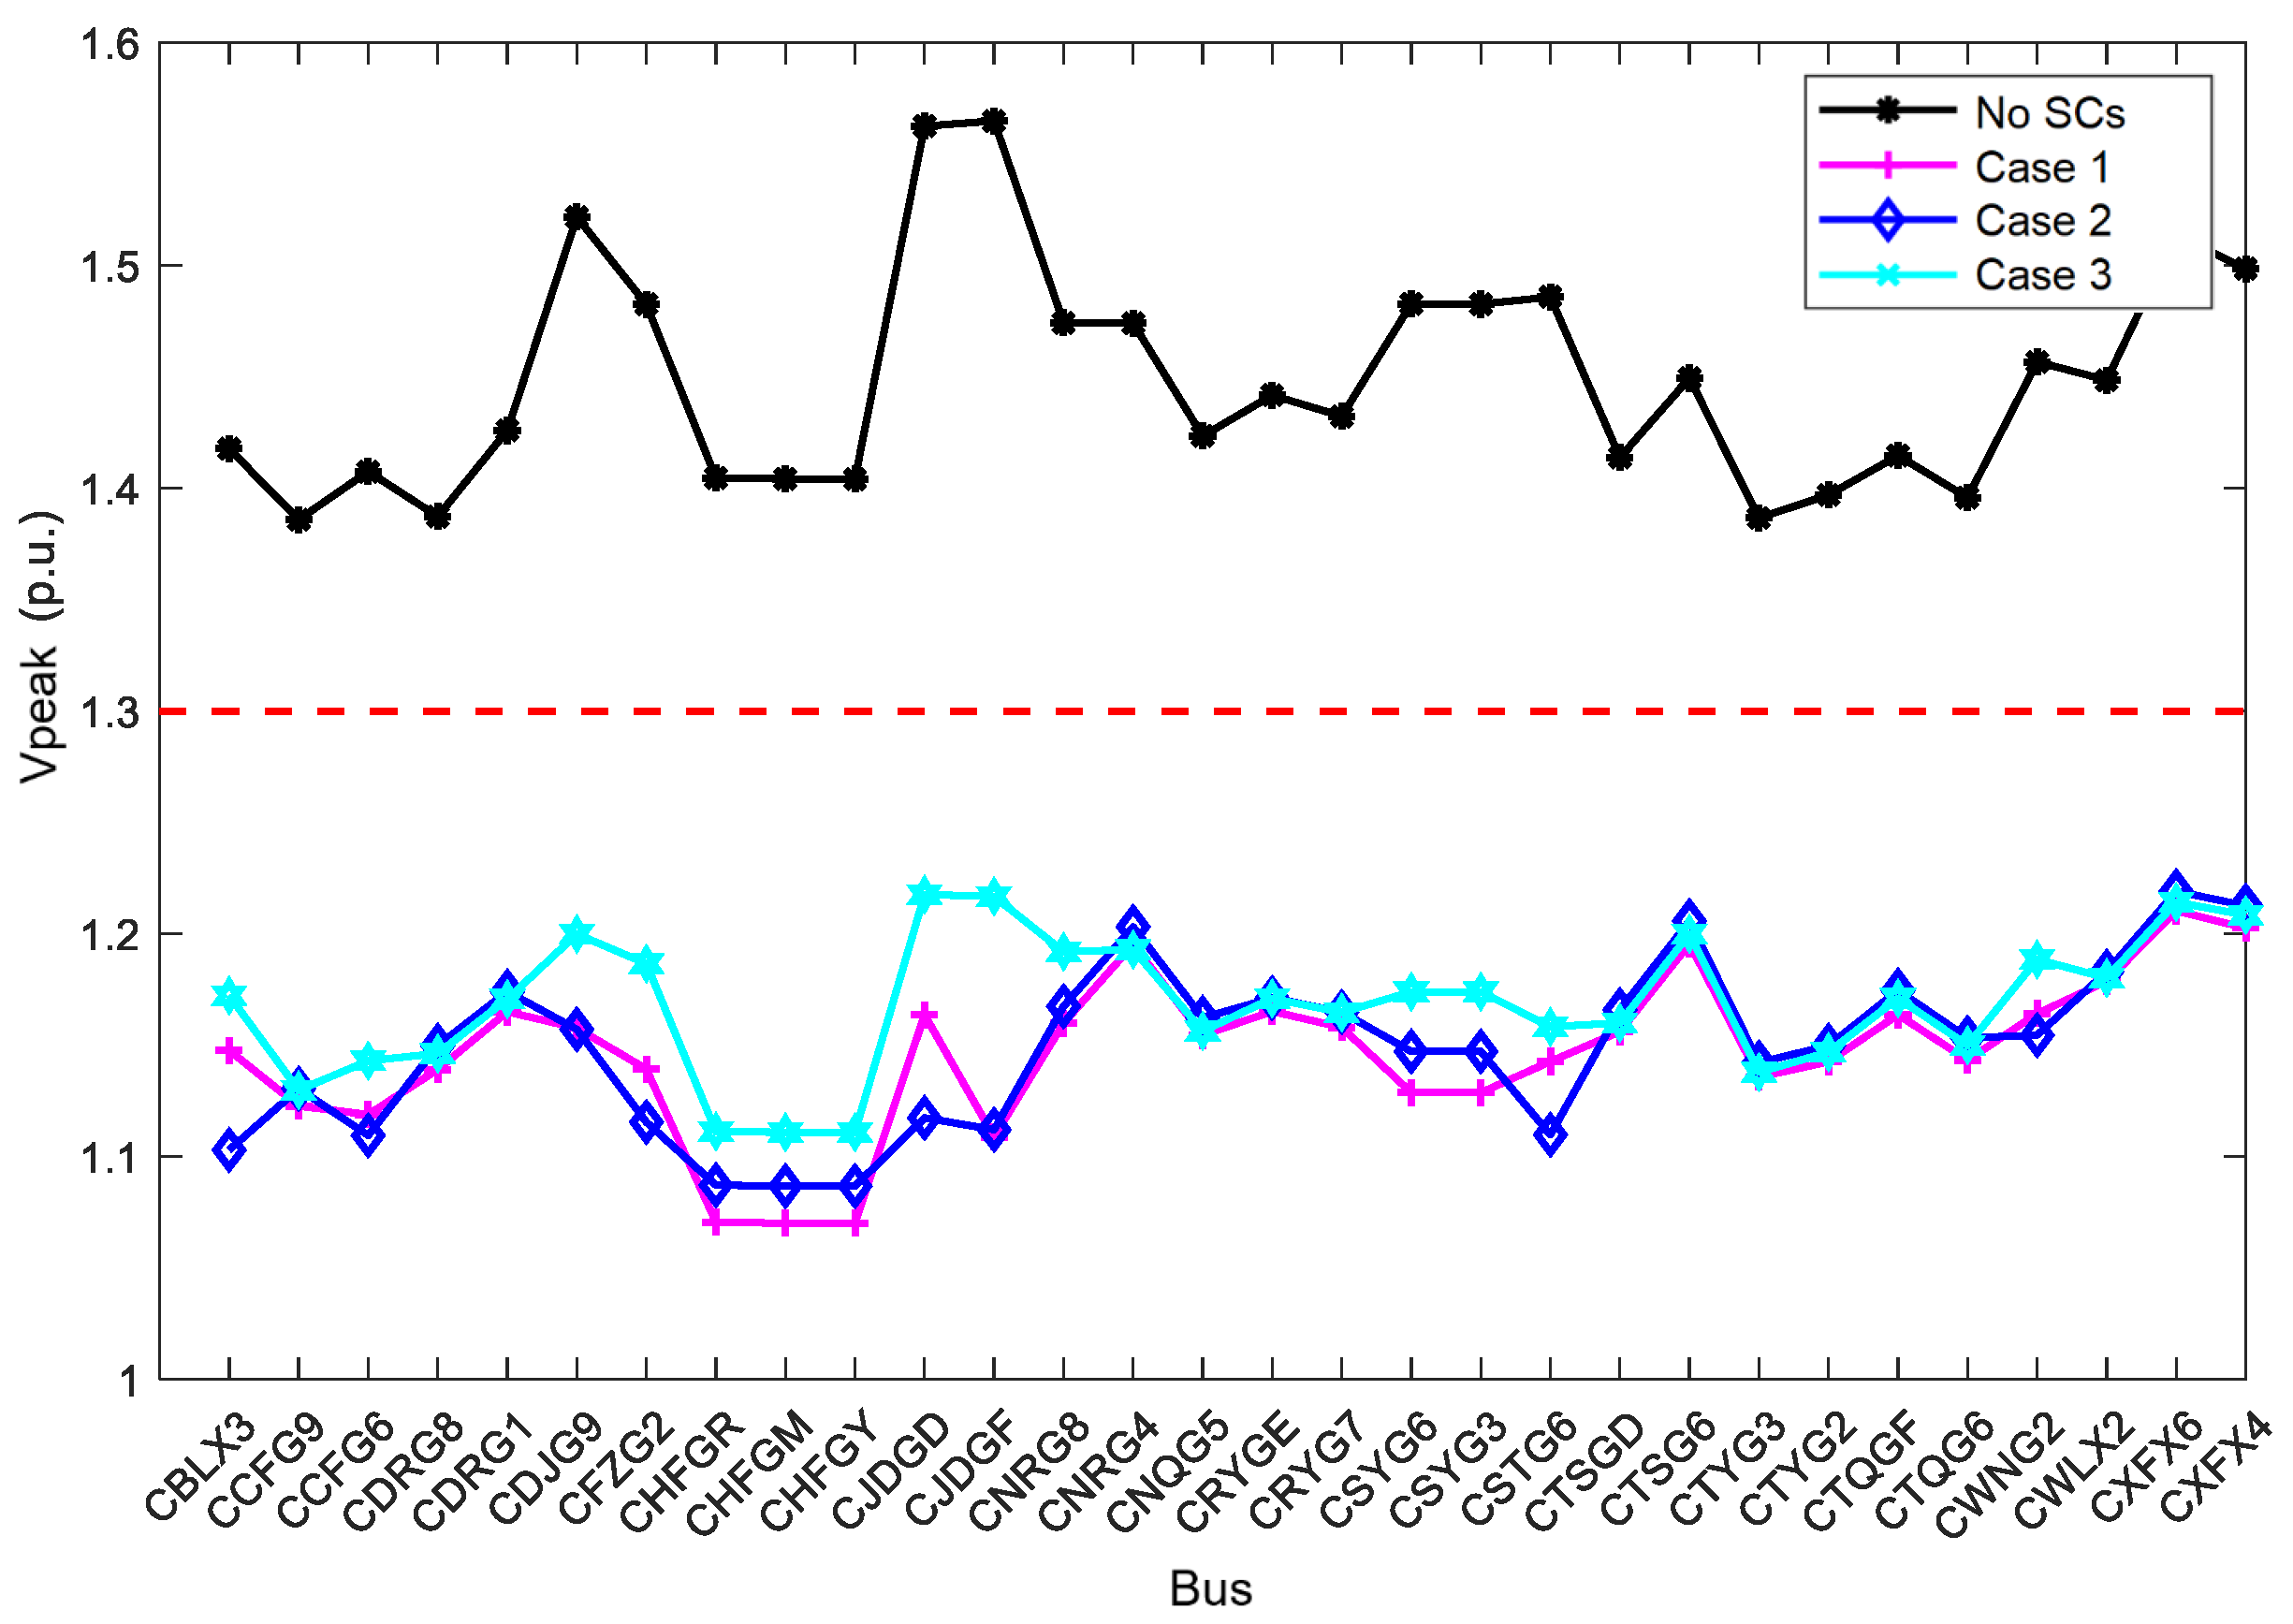
Transient overvoltage validation is performed using the PSD-BPA SWNT module. A three-phase fault is simulated at time 0 on a 500 kV line, with circuit breakers tripping at the sending and receiving ends at 0.09 s and 0.10 s, respectively. The results of the SWNT simulation indicate that the proposed configuration effectively suppresses transient overvoltage. As shown in Figure 3, all the monitored nodes exhibit transient voltage peaks well below the 1.3 p.u. threshold. Although Scheme 3 exhibits slightly higher peak voltages than Schemes 1 and 2, a safe margin is still maintained.

5.4. Benefit Analysis

With SCs installed and the minimum SCR constraint satisfied, the renewable simultaneity factor increases from 0.368 (regional average) to 0.720. The annual utilization hours increase from 1649.73 to 2046.58 h, yielding an estimated annual energy gain of 1107.40 GWh. The curtailment rate is expected to drop from 21.08% to 2.10%. The overall economic benefit of the renewable base is presented in Table 3.
Table 4 lists the estimated annual increase in revenue per renewable station, calculated based on the increase in generation and the price of electricity per site. A revenue correction factor of 0.90 is applied to account for equipment availability and scheduled maintenance. It should be noted that the benefit calculation here reflects the total revenue from the additional energy output across the entire renewable base.

6. Conclusions

To address the challenges of low short-circuit ratio (SCR) and heightened transient overvoltage risks in sending-end grids under high renewable penetration and power-electronic-dominated conditions, this paper proposes a hybrid optimization method for the deployment of synchronous condensers (SCs) that meets the power delivery capability requirements of large-scale renewable energy bases.
The proposed model supports the centralized and distributed deployment of SCs with multiple capacities and vendor types. It comprehensively incorporates engineering constraints such as SCR, transient overvoltage, and available installation space. By introducing SCR sensitivity indicators, the original non-linear optimization problem is transformed into a mixed-integer linear programming (MILP) formulation. A decomposition-based iterative solution strategy is adopted to significantly reduce the computational burden associated with transient stability simulations. The key conclusions are as follows.
  • A flexible hybrid configuration model is developed that supports the selection of multi-site and multi-vendor equipment for centralized and distributed deployment. This enhances the engineering applicability and economic viability of SC configuration schemes.
  • An objective function and constraint system is constructed that jointly considers investment cost, operational and maintenance expenses, and engineering feasibility. By combining decomposition iteration strategies with SCR sensitivity analysis, the original nonlinear problem is linearized and solved efficiently. This approach is well-suited to large-scale renewable energy transmission scenarios.
  • Simulation results demonstrate that the proposed method can generate multiple feasible deployment schemes under delivery capacity and security constraints, along with corresponding cost–benefit comparisons. The methodology exhibits great potential for practical implementation.
In summary, the proposed approach provides a systematic modeling framework and an efficient algorithmic solution to improve the strength of sending-end systems and to optimize SC deployment in renewable energy bases. It offers significant value for engineering applications and future research.
Future research directions include the following.
  • Further exploration of the temporal variability of system operating conditions and multiscenario adaptability, to improve the robustness of deployment strategies under uncertainty.
  • Integration of SCs with other dynamic reactive power support devices (e.g., STATCOMs, grid-forming energy storage systems) to develop a complementary joint optimization model.
  • Investigation of the interaction between SC configuration and ancillary service market clearing mechanisms, to provide technical support for market-oriented deployment strategies.
  • Development of an AI-based configuration recommendation system. By introducing machine learning models to identify sensitivity distributions and the importance of buses, the computational efficiency and scalability of the method can be further enhanced in large-scale systems.

7. Patents

The following patents are resulting from the work reported in this manuscript:
  • Sheng, H.; Ma, J.; Zhang, Z.; Zeng, Y. Optimal configuration method, system, device, and medium for synchronous condensers in renewable energy bases. CN117913844A. China National Intellectual Property Administration, Filed 2024-03-15, Published 2024-04-129

Author Contributions

Conceptualization, H.S.; Methodology, S.Z. and T.Z.; Software, J.H.; Validation, Q.L.; Formal analysis, G.X.; Investigation, R.C.; Resources, X.W.; Data curation, X.R.; Writing—original draft, S.Z., T.Z. and H.S.; Writing—review & editing, H.S., J.H., Q.L., R.C., X.W. and X.R.; Project administration, G.X. All authors have read and agreed to the published version of the manuscript.

Funding

This research was funded by the Electric Power Research Institute State Grid Jibei Electric Power Company Limited grant number 52018K22001U.

Data Availability Statement

The datasets presented in this article are not readily available because access requires authorization from the relevant power company. Requests to access the datasets should be directed to Siqi Zhang, maggiecuo@126.com.

Acknowledgments

The authors thank the Electric Power Research Institute State Grid Jibei Electric Power Company Limited for funding this research.

Conflicts of Interest

Authors Siqi Zhang, Tianqi Zhao, Jing Hao, Qi Li, Guangming Xin, Rui Chen, Xiaofei Wang and Xiang Ren were employed by the State Grid Jibei Electric Power Company Limited. The remaining authors declare that the research was conducted in the absence of any commercial or financial relationships that could be construed as a potential conflict of interest.

Abbreviations

The following abbreviations are used in this manuscript:
MRSCRMultiple renewable energy stations short-circuit ratio
SCSynchronous condenser
SCRShort-circuit ratio
TOVTransient overvoltage
O&MOperating and maintenance
PSOParticle swarm optimization
GAGenetic algorithms
UHVUltra-high-voltage
PCCPoint of common coupling
MILP    Mixed integer linear programming
MvarMegavolt-ampere reactive, a unit of reactive power

References

  1. Du, W.; Luo, Y.; Li, Y.; Wu, L.; Zhao, F.; Sun, D. Reviews of transient overvoltage problem cause by extra reactive power in large scale wind power systems. Proc. CSEE 2022, 42, 3224–3238. (In Chinese) [Google Scholar] [CrossRef]
  2. Yunfeng, W.; Youhang, Y.; Pengxiang, X.; Xintong, Y.; Linlin, Y.; Xiaoliang, J. Review on the new energy accommodation capability evaluation methods considering multi-dimensional factors. Proc. CSEE 2024, 44, 127–147. (In Chinese) [Google Scholar] [CrossRef]
  3. Wang, Y.; Zhang, Y.; Zhou, Q.; Li, Z.; Jiang, Y.; Tang, Y.; Wu, J.L.; Gao, C.; Tu, J.Z.; Shen, C. Study on application of new generation large capacity synchronous condenser in power grid. Power Syst. Technol. 2017, 41, 22–28. (In Chinese) [Google Scholar] [CrossRef]
  4. Zhou, Y.; Sun, H.; Xu, S.; Wang, X.; Zhao, B.; Zhu, Y. Synchronous condenser optimized configuration scheme for power grid voltage strength improvement. Power Syst. Technol. 2022, 46, 3848–3856. (In Chinese) [Google Scholar] [CrossRef]
  5. Sun, H.; Xu, S.; Xu, T.; Guo, Q.; He, J.; Zhao, B.; Yu, L.; Zhang, Y.; Li, W.; Zhou, Y.; et al. Definition and index of short circuit ratio for multiple renewable energy stations. Proc. CSEE 2021, 41, 497–505. (In Chinese) [Google Scholar] [CrossRef]
  6. Yang, H.; Liu, H.; Ding, Z.H.; Sun, Z.L.; Liu, C.; Cai, G.W.; Zhang, G.L. Two-stage optimal configuration of condenser for high-proportion wind power sending-end power grid considering short circuit ratio increase and transient overvoltage suppression. Power Syst. Technol. 2024, 48, 540–551. (In Chinese) [Google Scholar] [CrossRef]
  7. Suo, Z.; Li, H.; Zhang, F.; Jiang, W.; Wang, F.; Hu, A.P. Optimal configuration of a distributed synchronous condenser for an HVDC sending-end system with a high-proportion of renewable energy. Power Syst. Prot. Control 2022, 50, 133–141. (In Chinese) [Google Scholar] [CrossRef]
  8. Hadavi, S.; Saunderson, J.; Mehrizi-Sani, A.; Bahrani, B. A Planning Method for Synchronous Condensers in Weak Grids Using Semi-Definite Optimization. IEEE Trans. Power Syst. 2023, 38, 1632–1641. [Google Scholar] [CrossRef]
  9. Haijun, C.; Chao, H.; Fusuo, L.; Xianbo, K.; Yuqinag, H. Research on optimal allocation method of synchronous condensers for improving transient voltage stability level of weak sending-end power grid. Power Syst. Prot. Control 2019, 47, 90–95. (In Chinese) [Google Scholar] [CrossRef]
  10. Li, Q.; Chen, P.; Xu, Z.; Sheng, H. Optimal configuration for new large capacity synchronous condenser considering transient voltage stability in multi-fed DC. Proc. CSU-EPSA 2025, 37, 91–101. (In Chinese) [Google Scholar] [CrossRef]
  11. Richard, L.; Nahid-Al-Masood; Saha, T.K.; Tushar, W.; Gu, H. Optimal allocation of synchronous condensers in wind dominated power grids. IEEE Access 2020, 8, 45400–45410. [Google Scholar] [CrossRef]
  12. Nguyen, H.T.; Yang, G.; Nielsen, A.H.; Jensen, P.H. Combination of synchronous condenser and synthetic inertia for frequency stability enhancement in low-inertia systems. IEEE Trans. Sustain. Energy 2019, 10, 997–1005. [Google Scholar] [CrossRef]
  13. Wang, K.; Li, Z.; Yang, C.; Li, Q.; Liu, C.; Xin, H. Siting method of synchronous condenser for small-signal stability improvement of large-scale renewable energy base. Autom. Electr. Power Syst. 2022, 46, 64–74. (In Chinese) [Google Scholar] [CrossRef]
  14. Hadavi, S.; Mansour, M.Z.; Bahrani, B. Optimal allocation and sizing of synchronous condensers in weak grids with increased penetration of wind and solar farms. IEEE J. Emerg. Sel. Top. Circuits Syst. 2021, 11, 199–209. [Google Scholar] [CrossRef]
  15. Wang, Z.; Liu, M.; Li, H.; Qin, J.; Guo, J.; Bai, K. Optimal configuration method of synchronous condenser to improve delivery capacity of new energy cluster in weak grid. Electr. Power Autom. Equip. 2024, 44, 30–36+44. (In Chinese) [Google Scholar] [CrossRef]
  16. Ma, X.; Xue, F.; Gu, W.; Li, H.; Lv, S. Optimal configuration method of grid-forming energy storage and distributed synchronous condenser considering constraints of MRSCR. Electr. Power Autom. Equip. 2025, 45, 40–46+64. (In Chinese) [Google Scholar] [CrossRef]
  17. Wang, J.; Hou, Q.; Zhang, N. Synchronous Condenser Placement for Multiple HVDC Power Systems Considering Short-Circuit Ratio Requirements. IEEE Trans. Power Syst. 2025, 40, 765–779. [Google Scholar] [CrossRef]
  18. Arun, M.; Barik, D.; Chandran, S.R.; Praveenkumar, S.; Tudu, K. Economic, policy, social, and regulatory aspects of AI-driven smart buildings. J. Build. Eng. 2025, 99, 111666. [Google Scholar] [CrossRef]
  19. CN117913844A; Optimal Configuration Method, System, Device, and Medium for Synchronous Condensers in Renewable Energy Bases. CNIPA: Beijing, China, 2024.
  20. CIGRE. Systems with Multiple DC Infeed; CIGRE Working Group B4.41; CIGRE: Paris, France, 2008. [Google Scholar]
  21. CIGRE. Connection of Wind Farms to Weak AC Networks; CIGRE Working Group B4.41; IGRE: Paris, France, 2016. [Google Scholar]
  22. Zhang, F.; Xin, H.; Wu, D.; Wang, Z.; Gan, D. Assessing strength of multi-infeed LCC-HVDC systems using generalized short-circuit ratio. IEEE Trans. Power Syst. 2019, 34, 467–480. [Google Scholar] [CrossRef]
  23. GB/T 40581-2021; Technical Guidelines for Power System Security and Stability Calculations. The National Technical Committee for Standardization of Power System Operation and Control: Beijing, China, 2021. (In Chinese)
  24. GB/T 19963.1-2021; Technical Specification for Connecting Wind Farm to Power System—Part 1: On Shore Wind Power. China Electricity Council: Beijing, China, 2021. (In Chinese)
  25. GB/T 19964-2024; Technical Requirements for Connecting Photovoltaic Power Station to Power System. China Electricity Council: Beijing, China, 2024. (In Chinese)
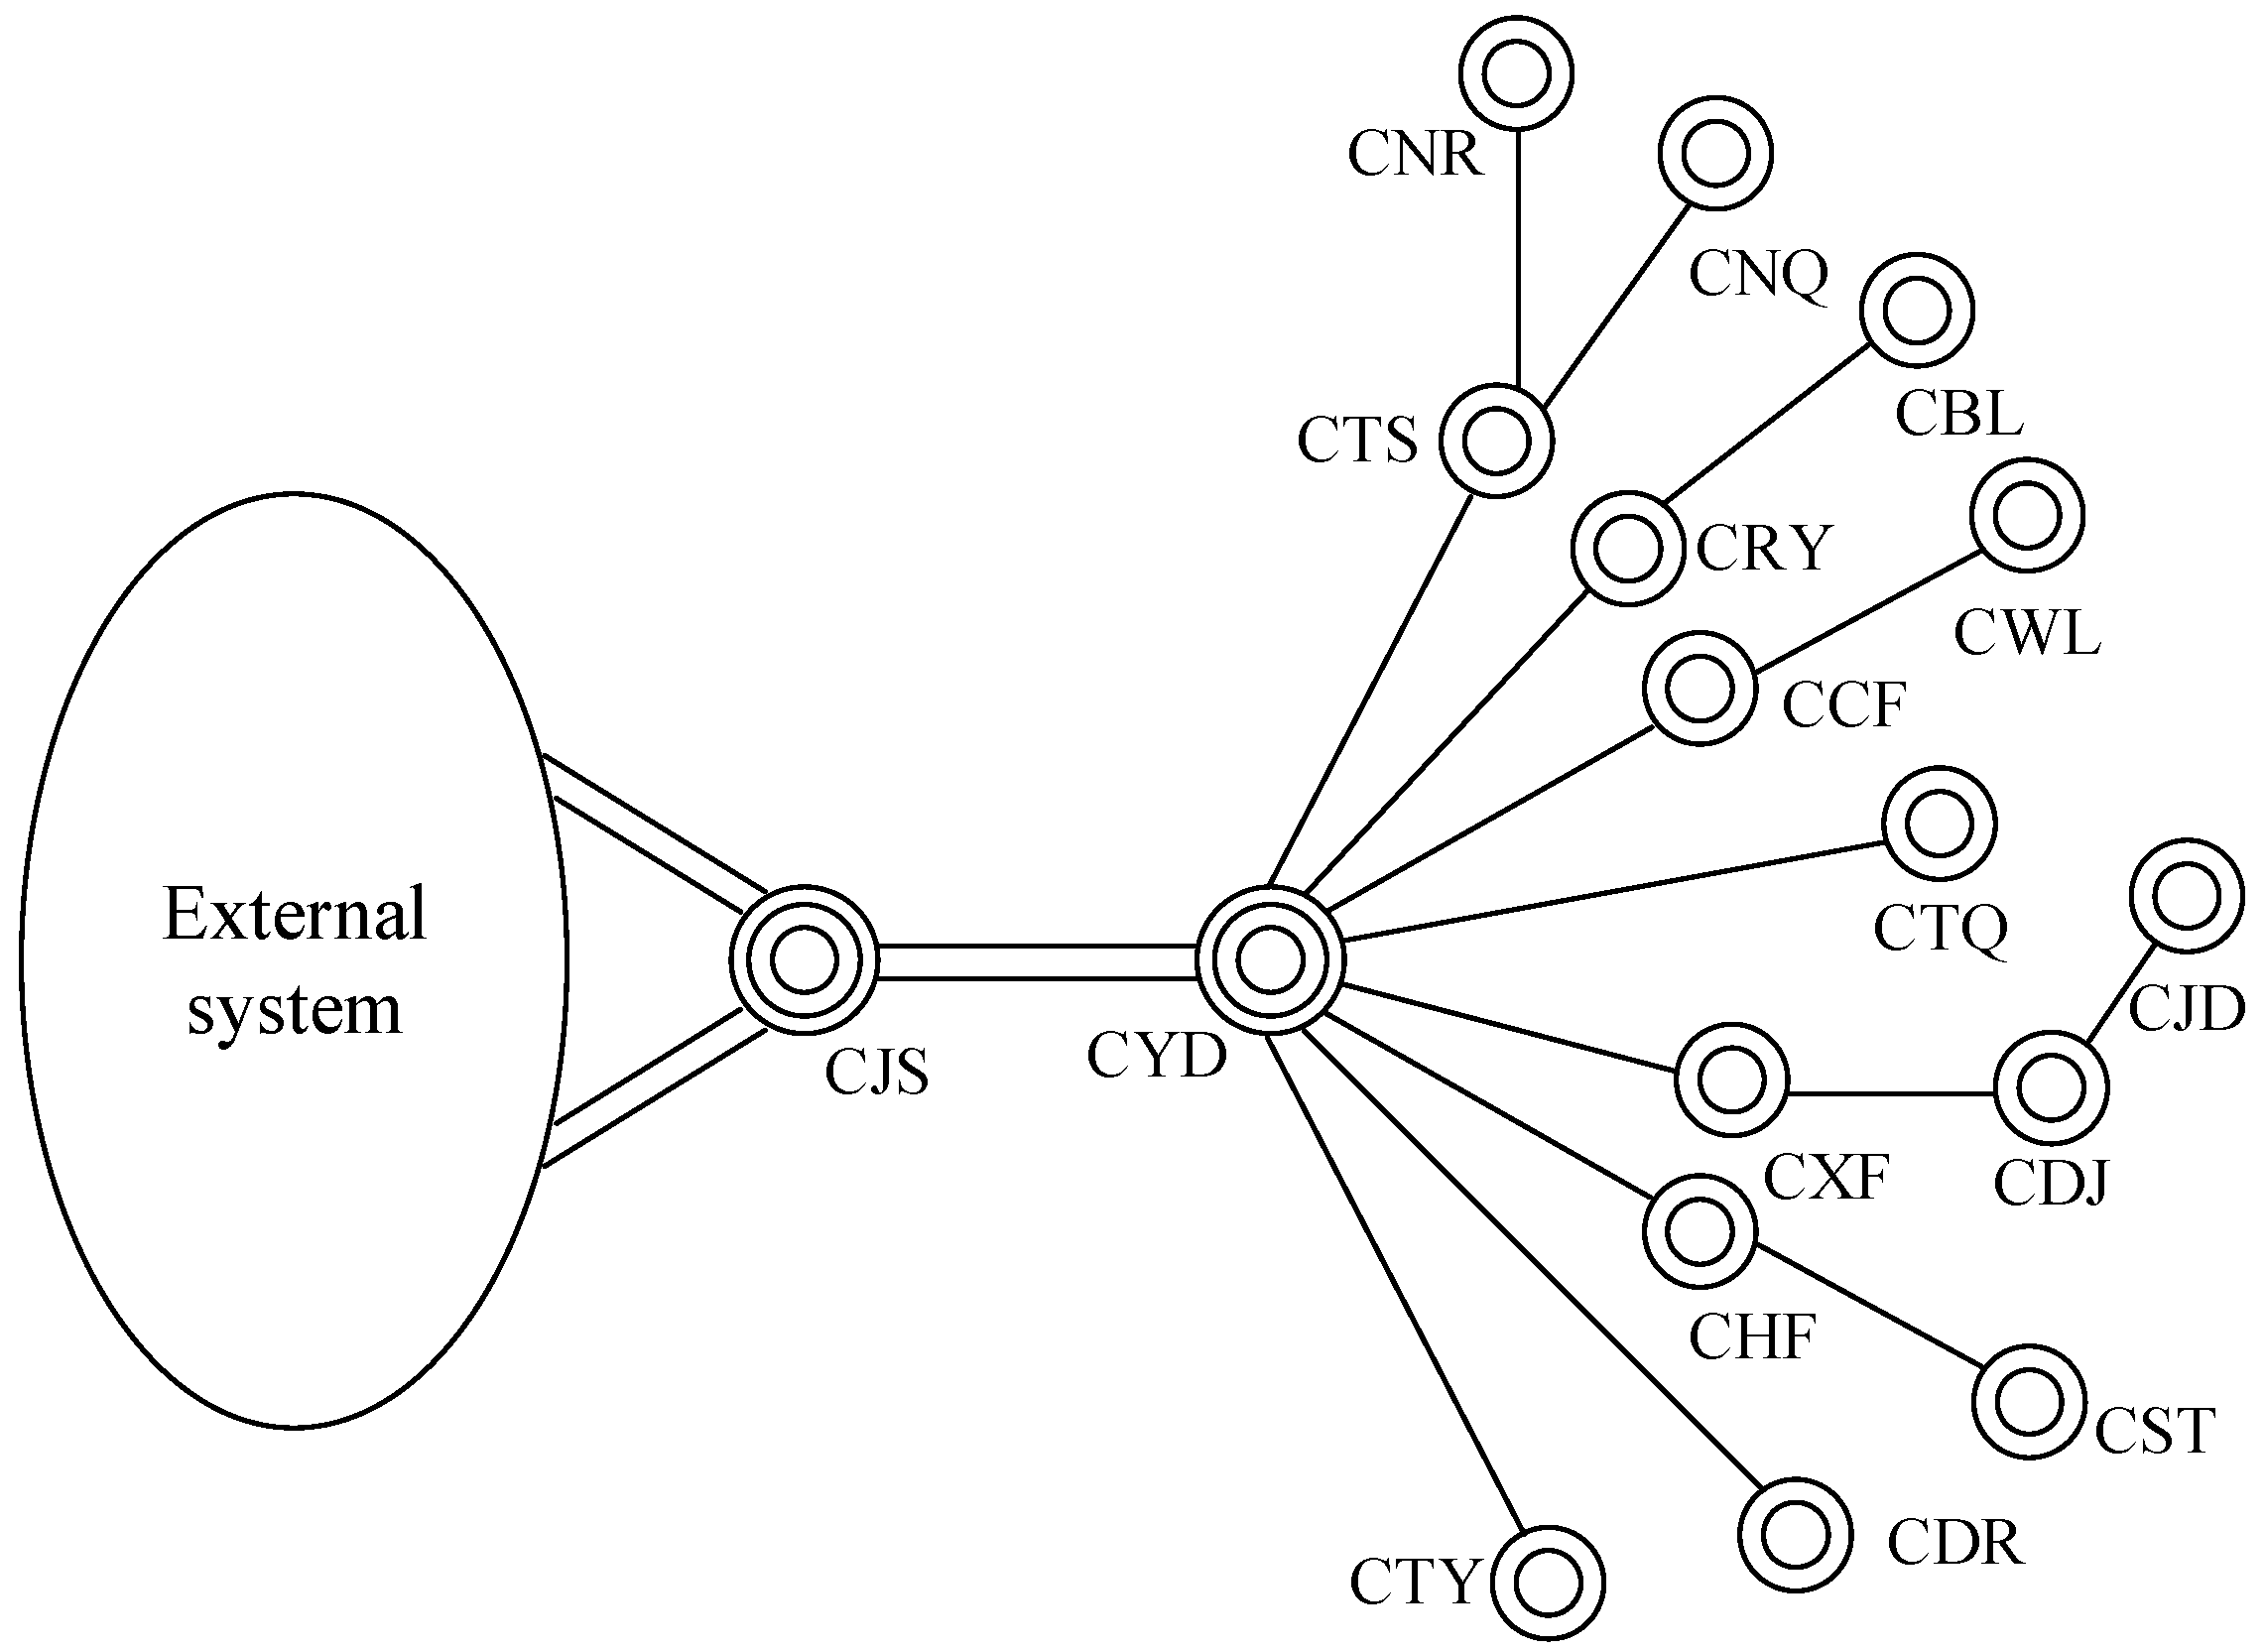
Figure 1. Topology of a typical renewable energy base, where CJS and CYD are 500 kV collector substations, and the others are renewable power stations.
Energies 18 04267 g001
Figure 2. Comparison of short-circuit ratios at monitored buses before and after scheme implementation.
Energies 18 04267 g002
Figure 3. Comparison of transient voltage peaks at monitored buses before and after scheme implementation.
Energies 18 04267 g003
Table 1. Technical and cost parameters for synchronous condensers with different capacities.
Parameters10 Mvar20 Mvar50 Mvar100 Mvar
Plant Footprint Area (m × m)17 × 1020 × 1027 × 1437 × 23
Total Construction Cost ($1 M)2.5353.5215.6349.859
Retrofit Cost ($1 M)0.0000.0000.0000.000
Annual Major Maintenance Cost ($1 M)0.0950.1320.2110.370
Annual Minor Maintenance Cost ($1 M)0.0380.0530.0850.148
Annual Energy Loss Cost ($1 M)0.1330.2670.5731.333
Table 2. Comparison of installed SCs and cost indicators for three cases.
Indicator ItemsCase 1Case 2Case 3
Location/
Capacity (Mvar) of Installed SCs
CDJ21/100CBL34/50CBL21/50
CHF11/50CDJ34/10CCF34/10
CJD21/50CFZ34/50CDJ21/50
CNR21/50CJD35/50CJD34/50
CRY21/50CJD34/50CNR35/20
CST21/50CNR35/20CSY21/50
CXF11/50CST34/50CST21/50
CWN34/20
Investment Cost ($1 M)43.66237.74634.225
Retrofit Cost ($1 M)0.0000.0000.000
Major Repair Cost ($1 M/y)1.6371.4151.283
Minor Repair Cost ($1 M/y)0.6550.5660.513
Energy Loss Cost ($1 M/y)5.1813.8733.607
Annualized Cost ($1 M/y)10.9928.8978.162
Note: “CDJ21/100” denotes the location and capacity of an installed synchronous compensator (SC), where “CDJ21” is the location (bus name) and “100” is the capacity in Mvar.
Table 3. Overall benefit assessment before and after synchronous condenser installation.
Indicator ItemsNo SCsCase 1Case 2Case 3
Max. simultaneity factor (%)0.370.730.720.72
Annual Utilization Hours (h)1649.732049.602046.732046.58
Est. Annual Generation (GWh)4603.565719.415711.395710.97
Increased Generation (GWh)/1115.841107.821107.40
Increased Annual Revenue ($1 M)/76.3775.8375.80
Curtailment Rate (%)21.081.952.092.10
Payback Period (year)/7.504.944.17
Table 4. Estimated generation, increased generation, and revenue per station.
StationEst. Annual Gen. (GWh)Inc. Gen. (GWh)Inc. Revenue ($1 M/y)
CBL366.1889.356.12
CCF274.5066.984.58
CDR266.2664.974.45
CDJ274.5066.984.58
CFZ34.318.370.57
CHF194.8947.563.26
CJD548.99133.969.17
CRY450.17109.857.52
CSY181.1744.213.03
CST271.7566.314.54
CTS382.4077.645.31
CTY266.2664.974.45
CTQ456.58111.417.63
CWL183.9144.883.07
CXF450.45109.927.52
Subtotal4603.571107.4175.80
Disclaimer/Publisher’s Note: The statements, opinions and data contained in all publications are solely those of the individual author(s) and contributor(s) and not of MDPI and/or the editor(s). MDPI and/or the editor(s) disclaim responsibility for any injury to people or property resulting from any ideas, methods, instructions or products referred to in the content.