Abstract
Insulator pollution flashover is a serious fault in power transmission systems, with surface wetting being a key prerequisite for its occurrence. The unique electrostatic properties of HVDC transmission networks promote pollution accumulation and alter wetting behavior. In southwest China’s warm, humid mountainous regions, algae adhesion on DC insulators significantly affects surface wetting, increasing the risk of flashover under extreme weather conditions. This study proposes a surface-conductivity–based method to measure the water absorption of pollution layers on insulators. It quantitatively assesses the impact of algae on wetting characteristics, including saturated water absorption and salt loss rate. Experimental results show that in fog, saturated water absorption decreases as the tilt angle increases, while soluble salt content decreases over wetting time. NSDD has a minimal effect on saturated absorption. Moreover, the presence of algae significantly alters wetting behavior, increasing saturated water absorption by 27–47% and reducing salt loss. These findings provide an insight into the role of biological contamination in pollution flashover processes in high-humidity regions.
1. Introduction
The distribution of energy resources in China shows a significant regional imbalance, with the western region having abundant energy but limited demand, while the eastern region has huge energy demand but relatively scarce resources. The use of a high-voltage direct current (HVDC) system, with its high efficiency and low loss transmission characteristics, has successfully transported the abundant energy in the west to the areas with strong demand in the east at a large scale, effectively alleviating the mismatch between energy distribution and demand. Now, China has established a “system of UHV transmission projects straights”, which not only greatly facilitates the widespread consumption of clean energy, but also strongly guarantees China’s energy security for crosses 19 and 20.
However, with the expansion of power system construction, the environment in which transmission lines are located is becoming more complex and diversified, and transmission lines are facing the notable contamination challenge of pollution (e.g., industrial dust, bird droppings, algae) [1]. In addition, currently, extreme climate events are intensifying globally, and ultra-rapid wetting of the pollution layer, caused by complex meteorological conditions such as large temperature differences, heavy rainfall, and short-term dense fog, frequently occurs. In mountainous areas with high humidity and micrometeorological environments, transmission lines are facing new challenges. Algae attached to the surface of a large number of insulators are becoming a new source of external insulation contamination. Field tests conducted using ultraviolet corona imaging on three towers of the ±800 kV Qishaoo HVDC transmission line demonstrated that compared to insulator strings with mild algae contamination exhibiting a discharge frequency of 1.3 times/min, heavily and severely contaminated insulator strings showed significantly increased discharge frequencies of 2.8 times/min and 4.5 times/min, respectively. Since the current insulation configurations in mountainous areas are generally designed according to the light contamination zone, these algae attachment phenomena pose a serious threat to the safe operation and maintenance of transmission lines. On the one hand, algae attachment accelerates pollution accumulation and increases its degree of attachment by enhancing hydrophilicity and surface roughness, coupled with water absorption and water retention of algae, resulting in partial discharges of insulators under low-ambient humidity conditions [2,3,4,5]. On the other hand, the current lack of countermeasures for algae management on the surface of transmission lines also leads to an increase in the number of outages for cleaning, while algae on the surface of insulators break easily under external forces, leading to an increased risk of accidents caused by hand-slip or foot-slip accidents by O&M personnel, which greatly affects the safety and efficiency of maintenance work [6,7,8,9,10].
The process of pollution flashover is generally divided into four stages as follows: surface accumulation of pollution, surface wetting, local discharge, and local arc development until flashover [11,12]. Among these, wetting is a necessary condition for insulator flashover, and algae attached to the insulator surface greatly affect the insulator wetting characteristics, thus increasing the probability of pollution flashover accidents. In addition, according to the Obennaus pollution flashover model, whether the surface arc can continue to develop and eventually penetrate the leakage distance of the insulator (i.e., cause a complete flashover) depends on the energy balance during the arc development process; that is, whether the sum of the arc partial voltage drop and the residual pollution layer voltage drop is less than the total voltage, and the conductivity of the pollution layer is the key factor affecting this process [11,12,13]. The surface conductivity of the insulator surface is, in turn, affected by the dissolution of soluble salts in the contamination layer [14,15]. Before the contaminated layer on the insulator surface reaches saturation wetting, the higher the degree of wetting of the contaminated layer, the lower the pollution flashover voltage of the insulator with the same level of contamination. However, when the insulator surface is saturated with wetting, the pollution flashover voltage of the insulator string does not increase significantly, and even decreases, due to the loss of the dissolved contaminated layer. Therefore, it is of great significance to study the contamination wetting characteristics of algae-covered insulators and the saturated water absorption of the contamination layer on the insulator surface after wetting, in order to reveal the influence of algae on the contamination layer wetting characteristics and the flashover characteristics of the insulator surface [16,17,18,19,20,21,22].
To this end, this paper first proposes a method for measuring insulator surface water absorption based on surface conductivity, and then takes porcelain insulators for station lines in an Enshi 500 kV substation as the test material to study the influence of algae attachment on the saturated water absorption of insulators, as well as the influence on the loss of pollution soluble salts. The test results provide a reference for studying the flashover process of insulators in foggy environments, bridging the gap between biological contamination and electrical insulation failure, thus addressing an emerging issue driven by climate change and ecological shifts in grid environments [23,24].
2. Test Methods
This study aims to investigate the influence of green algae growth and adhesion on the surface wetting characteristics and soluble salt loss properties of porcelain insulators by measuring the following two key indicators: saturated water absorption and the residual rate of soluble salts in the contamination layer. The surface conditions of the porcelain insulators were categorized as clean or algae-covered, leading to four experimental series, measuring the following: (1) the effect of green algae adhesion on saturated water absorption under varying parameters, and (2) the influence of green algae adhesion on the loss characteristics of soluble salts.
The test samples were selected from the porcelain insulators used in the Enshi 500 kV substation. To eliminate interference from the inherent contamination components (both soluble and insoluble) in the algae contamination layer and algal cells, all samples underwent a decontamination pretreatment with deionized water. The specific procedure was as follows: first, the insulator surfaces were rinsed with deionized water at a rate of 5 mL/cm2, and the rinsing solution was collected. Then, the algae-covered insulators were immersed in deionized water for 12 h and subsequently air-dried. Finally, the rinsing process was repeated, and the rinsing solution was collected again. The major elemental contents in the rinsing solution before and after treatment were analyzed via ICP spectroscopy (Table 1). The results confirmed that the concentrations of major soluble salt cation elements (e.g., Na+, K+, Ca2+, Mg2+) were below 0.005 mg/L, indicating negligible contamination interference from the algae layer itself. The treated algae-covered samples were labeled as “algae-coated samples,” while the thoroughly cleaned insulators of the same model were labeled as “blank samples.” On both algae-coated and blank samples, approximately 120° fan-shaped test areas were demarcated using insulating tape, with copper-conductive tape applied radially at 10 cm intervals as electrodes (Figure 1).

Table 1.
Content of main elements before and after treatment.
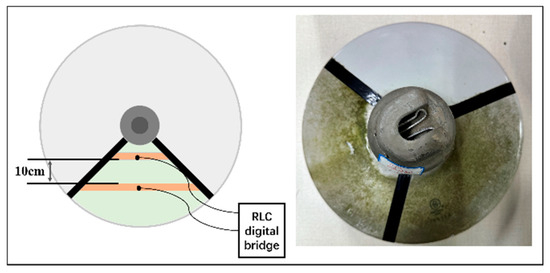
Figure 1.
Schematic diagram of insulator processing sample.
Because the saturated moisture after the contamination of the layer of water absorption by the insulator is very low, it is difficult to use the weighing method to directly measure the surface contaminated layer of water absorption. For this reason, this study proposes a method to measure the water absorption of the insulator surface based on surface conductivity.
First, a NaCl solution with a specific conductivity is configured, and then, after the NaCl solution is converted into salt mist with the same conductivity using an ultrasonic atomizer, it is introduced into an artificial fog chamber to provide a wetting condition for the contamination layer. Then, an insulating specimen coated only with an insoluble substance (kaolin) is placed into the artificial fog chamber to be wetted. Tests conducted via the two-electrode method using an RLC bridge demonstrated that an increase in moisture exposure time caused the salt spray particles to adhere, and the conductivity of the contamination layer surface increased with the formation of a water film. A high-precision digital bridge was utilized to measure the change in surface conductivity during the wetting process. Since the volume conductivity of the contaminated layer solution is the same as that of the salt spray solution, the amount of water attached to the contaminated layer on the insulating surface can be calculated according to the relationship between the surface conductivity of the contaminated layer and its volume conductivity. A schematic diagram of the insulator contamination layer wetting process is shown in Figure 2.
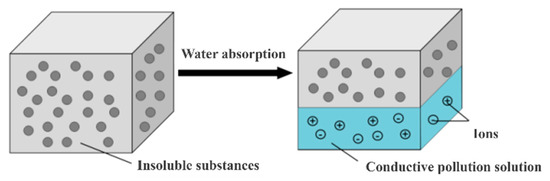
Figure 2.
The wetting process of the contamination layers on the insulators.
During the humidification process, the surface resistance of the contamination layer is measured and recorded using an RLC bridge.
where R is the measured surface resistance and f is the shape factor of the insulator surface. As shown in Equation (2), the measured conductivity can be corrected for temperature.
where K20 is the corrected surface conductivity below 20 °C; Kt is the surface conductivity measured at a temperature of t °C; and kt denotes the temperature coefficient [18]. The relationship between the surface conductivity and the salt spray conductivity is
where K denotes the surface conductivity; h denotes the thickness of the water film after wetting; and σ denotes the conductivity of the salt spray. On the other hand, water absorption mwater is calculated as
where ρwater is water density and S is the surface area (1 cm2). Figure 3 shows the relationship between surface conductivity and water absorption.
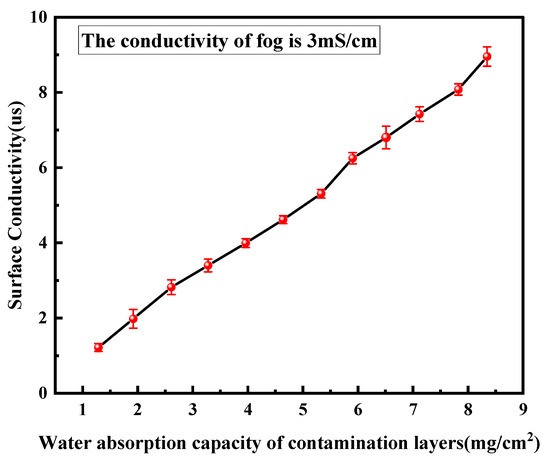
Figure 3.
The relationship between surface conductivity and water absorption of contamination layer.
The test platform is mainly composed of a small fog chamber, an ultrasonic nebulizer, and an RLC bridge, in which an air heating line, an exhaust fan, and a temperature and humidity meter are mainly used for control and detection of environmental parameters, such as temperature and fog concentration, inside the artificial fog chamber, as shown in Figure 4. A test tilt-adjustable bracket was placed inside the fog chamber. Before the test, we controlled the humidity of the artificial fog chamber to 93%RH, and the average fog water settling rate in the fog chamber was measured by gravimetric sampling using a fog cup, which measured 0.245 mg/cm2·min (±0.02 mg/cm2), and the uniformity was verified by measuring the conductivity at four locations in the artificial fog chamber (deviation < 5%). In addition, the spray distance (40 cm) was optimized to ensure that droplet sizes (10–20 μm) adhered to IEC 60,507 for artificial pollution tests.
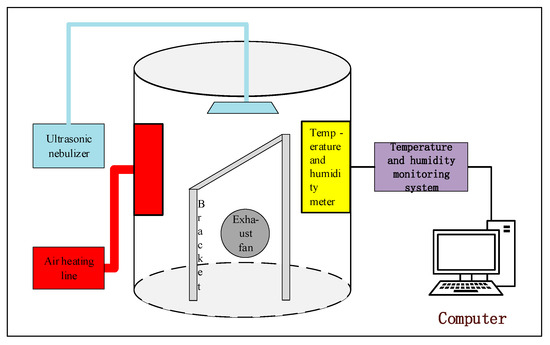
Figure 4.
Test platform.
The specific experimental procedure was as follows: first, an artificial contamination layer containing only kaolin was applied to the sample surfaces using the solid-layer method. The samples were then placed in a drying oven and dried at 40 °C for 3 h to completely dry the contamination layer [25,26]. For testing, the test specimen was moved into an artificial fog chamber, and the spray position and angle were adjusted so that the vertical distance from the surface of the test specimen to the sprayer was 40 cm. A NaCl solution with a specific conductivity was prepared at 20 °C and then added to the ultrasonic nebulizer, and the salt mist was sprayed into the fog chamber. During the wetting process, the surface conductivity trend was measured and recorded by an RLC bridge.
In the experiment investigating the influence of green algae adhesion on soluble salt loss characteristics, artificial contamination with NaCl and kaolin was first applied to both algae-coated samples and blank samples using the solid-layer method. The contamination was proportionally prepared according to the test area dimensions to achieve an equivalent salt deposit density (ESDD) of 0.5 mg/cm2 and a non-soluble deposit density (NSDD) of 1 mg/cm2 in the test areas. In addition, due to insulator contamination in the wet conditions of the loss of a slow process, in order to avoid insulators being in the artificial fog chamber in the wet time for too long, before the test, an equal amount of deionized water was sprayed on to the surface of the blank samples and the samples that were algae-coated with a spray can in order to accelerate the wetting. After the insulator was wetted, it was placed horizontally into the artificial fog chamber, and then the clean fog generated only by deionized water was passed into the artificial fog chamber. Due to the existence of the insulator umbrella, itself at an angle of inclination, the soluble salts were constantly dissolved and lost through the edge. During the test, a cotton swab was dipped into the edge of the insulator test area and dissolved into 10 mL of deionized water to determine the conductivity, which was recorded every 60 s.
Conductivity–time curves were fitted to the conductivity recorded at each discrete time.
The integration of the curve yields a total loss soluble salt conductivity–time curve as follows:
where F(t) is the conductivity corresponding to the total amount of soluble salts lost from the insulator surface dissolved into 10 mL of water up to the moment t, and F(∞) is the conductivity corresponding to the dissolution of all the soluble salts on the insulator surface dissolved into 10 mL of water. Since the amount of pollution solution sampled each time is very small, dissolving it into 10 mL of deionized water does not lead to the phenomenon in which the dissolution of soluble salts reaches saturation, and the conductivity of the test solution is proportional to the number of soluble salts in the pollution solution.
In order to eliminate the interference of intracellular salt release after algae cell rupture, the soluble salt residual rate G(t) of artificial pollution and algae pollution was compared and analyzed.
For algae-coated samples,
For blank samples,
In order to ensure the accuracy of the test, in the above tests, five test samples were selected to repeat the test, fit the data after the test, remove the curve with the largest dispersion, and then take the average of the valid data at each sampling point to fit the final curve.
3. Test Results and Analysis
3.1. Trends in the Conductivity of the Contamination Layer
The surface conductivity of the blank samples during the wetting process was measured using a high-precision bridge. The surface conductivity trend of the test samples placed at a tilt angle of 45° during the wetting process is shown in Figure 5.
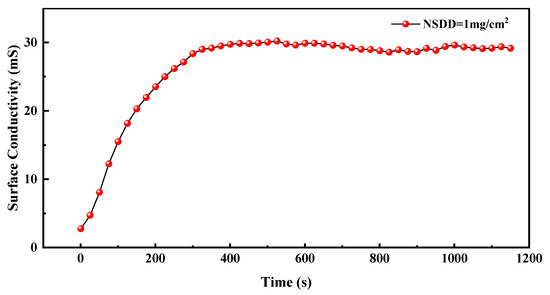
Figure 5.
Surface conductivity of the test specimen with 45° inclination degree during the wetting time.
As shown in Figure 5, the surface conductivity of the test sample increases gradually as the wetting time increases, and finally reaches the maximum value gradually. The change in surface conductivity can be divided into two stages.
In the first stage, as the wetting time increases, salt spray particles are gradually deposited on the contamination layer, the amount of water attached to the contamination layer and the number of conductive particles in the contamination layer are synchronized to increase in a certain ratio, and the surface conductivity of the samples gradually increases. Since the accumulation rate of salt spray on the surface of the sample is greater than the rate of salt spray loss, the water absorption of the contamination layers increases. In the second stage, as the degree of wetting increases, the adhesion rate of salt spray particles and the loss of salt spray under gravity reach equilibrium. At this time, the sample surface conductivity reaches a stable value because the water absorption of the contamination layer no longer increases.
3.2. Influence of NSDD on the Amount of Water Absorbed by the Contamination Layer
According to the above relationship between surface conductivity and water absorption in the contamination layer, the saturated water absorption can be converted by the maximum surface conductivity during wetting, and the relationship between saturated water absorption and NSDD is shown in Figure 6.
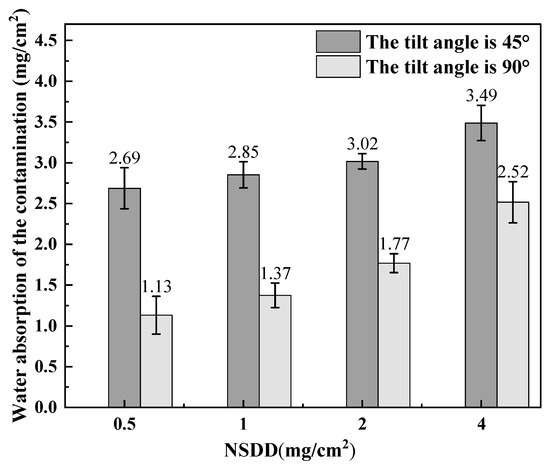
Figure 6.
Saturated water absorption of the contamination layers with different NSDDs.
When the insulator surface attaches to a layer of insoluble material in the insulating surface to form many loose porous structures, these loose structures can be adsorbed and stored in a certain amount of water, making the saturated layer of contamination increase with the amount of water and with the increase in the contaminated layer gray density.
As shown in Figure 6, for the vertically arranged test samples, the saturated water absorption of the contamination layer was in the range of 1.68–2.7 mg/cm2 when the NSDD was in the range of 0.5–4.0 mg/cm2. However, for the specimen with an inclination of 45°, the saturated water absorption of the soiled layer was in the range of 3.04–3.42 mg/cm2. The data show that the saturated water absorption of the 45°-inclined blank sample (3.04–3.42 mg/cm2) is significantly higher than that of the vertical sample (1.68–2.7 mg/cm2). At the same inclination angle, an increase in NSDD leads to an increase in the water absorption of the contaminated layer on the insulator surface.
3.3. Influence of Tilt Angle on the Amount of Water Absorbed by the Soiled Layer
Changing the angle of the blank samples, the test was carried out at different inclination angles and at the same NSDD; the test results are shown in Figure 7. Through this, it can be seen that the water absorption on the contamination layer decreases as the tilt angle increases. When the test piece is ideally placed horizontally, it is obvious that the salt spray gradually accumulates on the insulator surface in the fog chamber, the thickness of the water film keeps increasing with time, and the saturation water absorption is infinite.
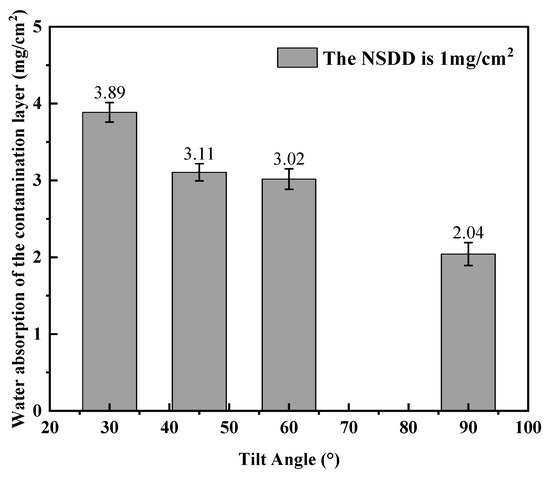
Figure 7.
Saturated water absorption of the contamination layers with different inclination angles.
4. Effect of Algae on the Wetting Characteristics of Insulators
4.1. Loss of Soluble Salts from the Contamination Layer
The loss characteristics of the soluble salts were compared with the insulator surface with and without algae overgrowth on the surface. As shown in Figure 8, the soluble salt’s residual amount of algae-coated sample is larger than that of the blank sample during the whole process of wetting; from the loss rate, the soluble salt residual rate of insulator surface contamination ranges from 100% to 60%, and the time required for blank sample and algae-coated sample is not significantly different, while the soluble salt residual rate is reduced to 20%, and the area of the blank sample reaches about 500 s, while the algae-coated sample reaches about 2000 s; from the final contamination soluble salt residual rate, under the condition of a sufficiently long wetting time, the soluble salt residual rate of the blank sample can be reduced to 20%, and the algae-coated sample can reach about 2000 s. At 2000 s, from the final contamination soluble salt residual rate, when the moisture time is long enough, the blank sample soluble salt residual rate is finally around 0.5%, while the algae-coated sample soluble salt residual rate is finally around 2%.
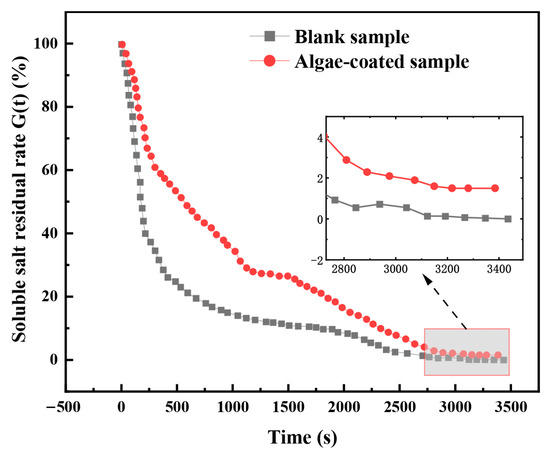
Figure 8.
Soluble salt residual rate curve of the contamination layer.
According to the change in loss rate, the soluble salt loss process can be divided into a rapid loss period (0–200 s), a slow loss period (200–1000 s), and a stable loss period (>1000 s). During the rapid loss period, the blank sample and algae-coated sample in the more easily soluble salt show a faster rate of loss; during the slow loss period, due to the attachment of algae, the algae-coated sample region show a change in the roughness of the insulator surface, resulting in the algae filtration region of the soluble salt showing a slower rate of loss. Meanwhile, at this stage, the blank sample region of the soluble salt remains at a faster rate of loss; during the stable loss period, the artificial filtration region and algae filtration region of the soluble salt are nearly all lost, but the algae filtration soluble salt notably shows a loss in the third stage of the stable loss period. During the stable loss period, the soluble salts in both the artificial and algae-coated sample areas were almost completely lost, but the soluble salt residual rate of the algae-coated sample was stabilized at a relatively high value, which may be due to the fact that the intracellular constituents of the algae cells could only be solubilized after the rupture of the cells during the final scrubbing.
4.2. Influence of Algae on the Saturated Water Absorption of the Contamination Layer
To study the influence of algae on the saturated water absorption of the insulator’s contaminated layer, the water absorption measurement method for the contaminated layer based on surface conductivity described in Section 1 was used.
From Figure 9, it can be seen that the saturated water absorption of the algae-coated samples layer is larger than that of the blank samples layer at different inclination angles. The saturated water absorption of both types of contamination in the salt spray environment decreases as the tilt angle increases, but there are differences in their decreasing trend. With an increase in tilt angle from 30° to 90°, the saturated water absorption of blank samples decreased by 1.80 mg/cm2, down by 47.37%; while the saturated water absorption of algae-coated samples decreased by 1.595 mg/cm2, down by 27.88%. The saturated water absorption of the blank samples was more highly affected by the tilt angle.
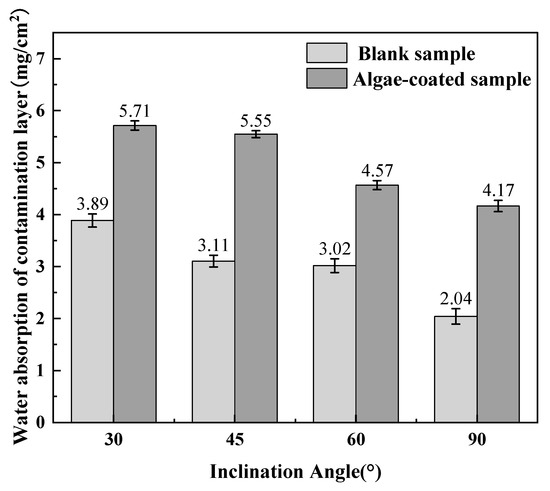
Figure 9.
Comparison of water absorption of the contamination layer at different inclination angles.
The reason for the above phenomenon is that algae-coated samples usually grow by forming a tighter structure through aggregation between cells, and this structure forms a large number of small pores and voids that can trap and hold water. In contrast, the insoluble matter in general contamination forms many loose porous structures mainly on the insulating surface, and these loose structures can trap and store a certain amount of water [27]. Compared with the large number of voids that exist between algae cells, the water absorption capacity of the loose small pores in the ash is weaker, so the water absorption capacity of the algae-coated samples is stronger. In addition, after the algae attaches to the surface of porcelain insulators, it changes the original smooth surface structure and greatly enhances the roughness of the surface, and under a certain tilt angle, the rough surface does not easily facilitate the flow and loss of the water film; therefore, the saturated water absorption of the algae-coated sample layer is affected by the tilt angle to a small extent.
5. Conclusions
This study presents a method for analyzing the water absorption of contamination layers on insulator surfaces based on surface conductivity. Using this method, the wetting characteristics of artificial and algae-induced pollution were compared, and the algae’s roles in inhibiting salt dissolution and enhancing water retention were quantitatively assessed.
The test results show that for samples without algae, both NSDD and tilt angle influence saturated water absorption. For vertically aligned specimens, the saturated water absorption ranges from 1.68 to 2.7 mg/cm2, and is strongly affected by NSDD. However, when tilted (e.g., at 45°), the absorption becomes largely independent of NSDD, ranging narrowly between 3.04 and 3.42 mg/cm2.
Algae contamination was found to reduce the soluble salt loss rate by 40% by increasing surface roughness. Artificially polluted surfaces reached a 20% residual salt rate in 500 s, whereas algae-contaminated surfaces required 2000 s. Across all tilt angles, algae-coated samples exhibited consistently higher saturated water absorption than clean samples. As the tilt angle increased from 30° to 90°, the saturated water absorption in blank samples decreased by 47.37%, compared to 27.88% in algae-coated samples, indicating greater sensitivity to tilt in non-algae-contaminated surfaces.
This study highlights the significant impact of algae on the wetting behavior of porcelain insulators under rapid-wetting conditions. However, our results are limited to UHVDC-grade porcelain insulators in artificial fog environments. Future work will examine behavior under medium- and low-humidity conditions and extend the analysis to composite insulator materials with hydrophobicity.
Author Contributions
Conceptualization, X.L., X.W., L.L. and B.C.; Methodology, X.L., X.W., S.Y. and B.G.; Validation, S.Y. and B.C.; Investigation, B.G., L.L. and B.C.; Resources, X.L.; Data curation, X.L. and S.Y.; Writing—original draft, L.L.; Writing—review & editing, B.G. and B.C. All authors have read and agreed to the published version of the manuscript.
Funding
This work was supported by the Ultra-High Voltage Company, State Grid Hubei Electric Power Co., Ltd. Science and Technology Project “Treatment of algae on insulator surfaces in 2024” (30 June 2024).
Data Availability Statement
The data that support the findings of this study are available from the corresponding author upon reasonable request.
Conflicts of Interest
Authors Xiaolai Li, Xiangdong Wu, Shiqiang Yang and Beichen Gao were employed by the Ultra-High Voltage Company, State Grid Hubei Electric Power Co., Ltd. The remaining authors declare that the research was conducted in the absence of any commercial or financial relationships that could be construed as a potential conflict of interest. The authors declare that this study received funding from Ultra-High Voltage Company, State Grid Hubei Electric Power Co., Ltd. The funder was not involved in the study design, collection, analysis, interpretation of data, the writing of this article or the decision to submit it for publication.
References
- Zhang, D.D.; Liu, X.N.; Huang, X.N.; Zhan, Z.J. Pollution constitutes and flashover characteristics of composite insulators in typical industrial dust areas. Electr. Power Eng. Technol. 2022, 41, 162–168. [Google Scholar]
- Ouyang, X.G. Study on the Growth Characteristics of Algae on Silicone Rubber Surface and its Influence on Electrical Properties. Ph.D. Thesis, Tsinghua University, Beijing, China, 2019. [Google Scholar]
- Yang, S.F. Study on the Hydrophobicity of Algae Contaminated Silicone Rubber and its Prevention and Control Measures. Ph.D. Thesis, Tsinghua University, Beijing, China, 2020. [Google Scholar]
- Tan, J.Y. Research on the Growth Characteristics of Algae on Silicone Rubber Surface. Master’s Thesis, Tsinghua University, Beijing, China, 2022. [Google Scholar]
- Jia, Z.D.; Wang, Y.; Ouyang, X.G.; Zhang, X.H.; Bai, H.; Chen, H.B. Influence of Green Algae on Hydrophobic Property of HTV Silicon Rubber. High Volt. Eng. 2017, 43, 885–890. [Google Scholar] [CrossRef]
- Jia, Z.D.; Zeng, Z.; Chen, C.; Yang, C.X.; Wang, X.L.; Yan, Z.H. Properties of composite insulating materials under special contamination. High Volt. Eng. 2016, 42, 885–892. [Google Scholar] [CrossRef]
- Zhu, L.W.; Cao, B.; Fu, X.Y.; Li, H.; He, L.; Mei, H.W. Study on the influence of uneven distribution of hydrophobicity along insulator string on pollution flashover characteristics. High Volt. Appar. 2019, 55, 193–197. [Google Scholar] [CrossRef]
- Zhang, Z.J.; Liu, H.Z.; Wang, X.G.; Li, X.G.; Li, J.; Fu, M. Research status of external insulation flashover of EHV and UHV transmission lines. Shandong Electr. Power 2015, 42, 1–6+11. [Google Scholar]
- Hu, Y.C.; Gao, T.H.; An, Y.Z.; Liu, X.H.; Yin, B.; Xian, R.C. Study on the influence of algae epiphyte on the electric field distribution of 35kV insulator type voltage limiter. Insul. Surge Arrester 2020, 6, 102–108. [Google Scholar] [CrossRef]
- Gao, T.H.; Hu, Y.C.; An, Y.Z.; Xian, R.C.; Hou, F. Study on the influence of algae on the electric field distribution of 110 kV composite insulators. Insul. Mater. 2019, 52, 59–64. [Google Scholar] [CrossRef]
- Liang, X.D.; Chang, C.Y.; Zhou, Y.X. High Voltage Engineering; Tsinghua University Press: Beijing, China, 2003; pp. 75–76. [Google Scholar]
- Su, Z.Y. The fundamental way out to prevent large area pollution is to improve the basic external insulation level of the power grid reflection on the large-scale dirty accident in my country’s power grid. China Electricity. China Power 2003, 12, 60–64. [Google Scholar]
- Rizk, A.M. A criterion for AC Flashover of Polluted Insulators. In Proceedings of the IEEE Power Engineering Soc. Winter Power Meeting, New York, NY, USA, 31 January–5 February 1971. [Google Scholar]
- Ye, L.A.; Zhou, W.J.; Yang, S.; Li, L.N.; Yu, J.H. Influence of dirt on insulator string on voltage distribution. High Volt. Electr. Appl. 2015, 51, 103–108. [Google Scholar] [CrossRef]
- Mei, H.W. Wetting Characteristics and Surface Discharge Suppression Measures of Contaminated Insulator. Ph.D. Thesis, Tsinghua University, Beijing, China, 2011. [Google Scholar]
- Li, C.H. Research on the Influence of Green Algae on the External Insulation of Composite Insulators. Master’s Thesis, South China University of Technology, Guangzhou, China, 2018. [Google Scholar]
- Liang, X.D.; Wu, C.; Yao, X.M.; Liu, Y.Y.; Liu, Y.F.; Wang, J.F. Effective Equivalent Salt Deposit Density of Polluted Silicone Rubber Insulators in Wetting Process. In Proceedings of the 2014 IEEE Conference on Electrical Insulation and Dielectric Phenomena (CEIDP), Des Moines, IA, USA, 19–22 October 2014; pp. 271–274. [Google Scholar] [CrossRef]
- Wang, L.; Cao, B.; Mei, H.; Zhao, C.; Guan, Z. Effects of natural contamination components on the surface conductivity under saturated moisture. IEEE Trans. Dielectr. Electr. Insul. 2017, 24, 2945–2951. [Google Scholar] [CrossRef]
- Mei, H.W.; Zhao, C.L.; Dai, H.Q.; Wang, L.M.; Guan, Z.C.; Zhang, F.Z. Study on wetting characteristics of polluted porcelain and glass insulators. Proc. CSEE 2014, 34, 1471–1480. [Google Scholar] [CrossRef]
- Zhang, X.; Dai, D.B. Research on factors affecting saturation and wetness of insulator contamination layer. High Volt. Appar. 2013, 49, 123–128. [Google Scholar] [CrossRef]
- Yu, H.Y.; Kong, Z.Z. Investigation of External Insulation Selection for Power Delivery & Transmission Equipment in Foggy Area. Smart Power 2000, 5, 13–16+2. [Google Scholar]
- Jiang, X.L.; Shu, L.C.; Sun, C.X. Power System Pollution and Ice Insulation; China Electric Power Press: Beijing, China, 2009. [Google Scholar]
- Lin, F.Y. Discussion on the measurement method of equivalent salt of polluted insulators. Insul. Surge Arresters 1979, 3, 24–31. [Google Scholar] [CrossRef]
- Huang, D.C.; Liu, X.B.; Xu, T.; Ruan, J.J.; Wan, X.D. Study on saturated water content of pollution layer on the surface of steam mist suspension insulator. High Volt. Eng. 2014, 40, 3349–3356. [Google Scholar] [CrossRef]
- IEC 60507-2013; Artificial Pollution Tests on High Voltage Insulators to be Used on AC Systems. IEC: Geneva, Switzerland, 2013.
- IEEE Std. 4-2013; IEEE Standard Techniques for High-Voltage Testing. IEEE: New York, NJ, USA, 2013.
- Wei, X.; Zhou, Z.C.; Zhao, C.L.; Gao, S.; Mei, H.W.; Wang, L.M. Influence of soluble salt components on the evaluation of insulator surface contamination. High Volt. Eng. 2013, 39, 3109–3115. [Google Scholar]
Disclaimer/Publisher’s Note: The statements, opinions and data contained in all publications are solely those of the individual author(s) and contributor(s) and not of MDPI and/or the editor(s). MDPI and/or the editor(s) disclaim responsibility for any injury to people or property resulting from any ideas, methods, instructions or products referred to in the content. |
© 2025 by the authors. Licensee MDPI, Basel, Switzerland. This article is an open access article distributed under the terms and conditions of the Creative Commons Attribution (CC BY) license (https://creativecommons.org/licenses/by/4.0/).