Abstract
Green hydrogen is a clean, versatile, and future-oriented fuel that can play a key role in the energy transition, decarbonization of the economy, and climate protection. It offers an alternative to fossil fuels and can be used in various applications, including power generation, industry, and transportation. However, due to its wide flammability range, small molecular size, and high diffusivity, special attention must be paid to ensuring safety during its use, particularly in leakage control. This paper provides a review and analysis of equipment leakage testing methods used for natural gas, with a view to applying these methods to the leakage testing of gas meters intended for hydrogen-containing gas mixtures and pure hydrogen. Tests of simulated leaks were carried out using two common methods: the bubble method and the pressure decay method, for three different gases: nitrogen (most commonly used for leak testing), helium, and hydrogen. The results obtained from the tests and analyses made it possible to verify and select optimum leak-testing methods for gas meters designed for measuring fuels containing hydrogen.
1. Introduction
Current directions in the energy transition of EU countries to reduce greenhouse gas emissions require an increased role for alternative fuels from renewable energy sources (RES). One possible direction for these changes is the use of green hydrogen in currently existing distribution networks. This involves new lines of research to demonstrate the suitability of current infrastructure for increasing the hydrogen content of natural gas or replacing it with pure hydrogen. Research is also being conducted into new materials adapted to the new gas fuel composition. Dedicated distribution networks to transport natural gas with high hydrogen content and pure hydrogen are also planned for the future. The ongoing energy transition resulting from the need to combat climate change, as well as the current political situation, calls for intensified research related to the distribution and measurement of hydrogen and its mixtures with natural gas. With hydrogen storage, wind or solar energy resources can be harnessed as and when needed, thus ensuring a continuous energy supply regardless of weather conditions [1,2].
From the perspective of gaseous fuel consumers, one of the most important aspects is its safe use. The flammability limits for natural gas range from 4.3% to 15% by volume in a gas–air mixture. For hydrogen, these limits range from 4% to 77% by volume. In comparison, the explosion limits for natural gas range from 5% to 15% by volume, and for hydrogen, from 4% to 77% by volume in air [3,4,5]. The wide flammability and explosibility ranges of hydrogen, combined with its high diffusivity due to the small size of its molecules, make it especially important to ensure the integrity of the gas network infrastructure. This requires both gas meter manufacturers and certification bodies to verify the suitability of gas meter testing methods that account for the specific properties of hydrogen and hydrogen–natural gas mixtures. This is particularly important for leak-testing methods, which have a direct impact on the safe use of gaseous fuels. For years, the safe operation of natural gas equipment, facilities, and networks has been the top priority in the gas sector. To ensure this safety, the industry has undergone significant technical advancements. A comprehensive set of regulations and standards has been developed and applied to maintain safety. With the introduction of hydrogen into natural gas systems—or the use of pure hydrogen—these regulations and standards must be reviewed and, if necessary, updated. Another very important reason for ensuring the integrity of infrastructure when transporting various gases through pipelines is to prevent the loss of the transported medium and its harmful impact on the environment, particularly in the case of greenhouse gases. For this reason, more advanced leakage testing methods are commonly used in the refrigeration industry. Gas leaks in transmission or distribution networks not only pose an explosion hazard but also disrupt the balance of the network by causing gas losses, known as unaccounted-for gas (UAF) [6]. The tightness of network infrastructure and installations, including gas meters, must be ensured throughout their entire life cycle. Results of leakage tests on gas meters subjected to durability testing with natural gas and mixtures of natural gas containing 10% and 15% hydrogen are presented in [1,7].
The addition of hydrogen-to-gas networks necessitates a review of the methods used to test gas meter tightness, taking into account its impact on meter operation. Due to the specific properties of hydrogen, the methods currently used for gas meter leak testing may be insufficient for meters operating in natural gas networks with hydrogen admixture or with pure hydrogen.
1.1. Leak-Testing Methods
Depending on the field in which leakage testing is applied, the literature sources provide different classification schemes and modifications of these test methods. Leak-testing methods are often a combination of two or more techniques, each of which can also be used independently. These methods frequently include different variants and employ various testing techniques. The level of leak detection sensitivity depends not only on the method and technique used but also on the accuracy of the measuring instruments and sensors employed to detect leakage of the test medium. As a result, the reported sensitivity levels of different leak-testing methods vary significantly across the literature. Based on the data available in the literature [8,9,10,11,12,13,14,15,16,17,18,19], Table 1 presents a summary of selected, commonly used leak-testing methods along with their respective sensitivity levels.

Table 1.
Summary of the most common leak-testing methods.
Below is a short description of selected leak-testing methods and techniques:
- Hydrostatic method—the object (sample) is filled with water. All air must be removed from the system because air is compressible and may distort test results. Pressure is applied using a water pump and maintained for a specified period. Joints, welds, valves, etc., are checked for leaks. A drop in pressure is measured—if there is no pressure loss, the system is considered leak-tight;
- Bubble method—the object (sample) is filled with gas under pressure (e.g., air). In the classic version, the surface is covered with a liquid (e.g., water with detergent). A leak produces visible bubbles. In the immersion version, the object is submerged in a liquid (usually water). Leaks are also revealed by bubble formation;
- Pressure drop method—the object is filled with gas (usually air or nitrogen) to a specified pressure. During the test, the pressure drop over time is monitored. A larger pressure drop indicates a greater leak rate;
- Pressure rise method—the object is filled with gas and placed in a vacuum environment. In the event of a leak, gas escapes and causes a pressure increase outside the object (in the vacuum chamber);
- Vacuum method—a vacuum is created inside the test object (sample). During the test, the internal pressure is monitored. A rise in pressure indicates a leak (gas entering from the outside);
- Tracer gas method—a tracer gas—typically helium or hydrogen (in a mixture with nitrogen)—is introduced inside the test object (or applied outside, if the system is under vacuum), and a detector on the opposite side of the wall registers the presence of the gas that passed through a leak. The sensor detects the tracer gas escaping from the system;
- Mass spectrometry method—the test object is filled with a tracer gas (or placed in a chamber with helium), and a mass spectrometer detects its presence on the opposite side of the wall. Helium is most commonly used due to its inertness, low molecular weight, and low natural concentration in air;
- Thermal conductivity method—This method relies on the fact that different gases have different thermal conductivities. The thermal conductivity of the surrounding gas is monitored—the presence of another gas (from a leak) causes a change. The system is typically filled with a gas of high thermal conductivity (e.g., hydrogen or helium). A sensor measures the thermal conductivity of the gas around it (e.g., using a heated wire Wheatstone bridge). A leak causes a temperature change due to the altered thermal conductivity of the gas mixture;
- Radioisotope method—a radioactive tracer gas or a liquid containing a radioisotope is introduced into or around the object. The presence of the radioactive substance outside the object is detected using ionizing radiation detectors (e.g., Geiger counters, scintillation detectors, or proportional counters);
- Fluorescent dye method—a liquid containing a UV-reactive dye is introduced into the object. Leaking fluid can be visually identified under UV light;
- Ultrasonic method—gas leaking through a small opening produces high-frequency sounds (ultrasound), which are detected by specialized ultrasonic sensors.
1.2. Gas Leakage
The greatest risk of a gas explosion is inside buildings, where explosive mixtures can form. An explosion can only occur if the migrating gas forms an air–gas mixture within the explosion limits for the gas in question (between 5% and 15% by volume of natural gas in air and 4% and 44% by volume of hydrogen in air). A gas leak through a leaking installation is a situation that directly threatens our lives and health.
The rate of gas leakage from a tank under differential pressure can be determined using equation [20] with the result expressed in units of [mol/s]:
Alternatively, the leakage rate can be expressed in [Pa·m3/s] using the following relationship:
where
- V—internal volume of the gas meter available for the test medium, [m3];
- R—universal gas constant 8.3144 [J/mol·K] (8.3144 [Pa·m3/(mol·K)];
- T—temperature in the gas meter, [K];
- TS—reference temperature, usually 273.15 [K];
- ΔP—pressure drop in the gas meter during Δt, [Pa];
- Δt—time interval between successive registrations of test parameters, [s].
Taking into account the effect of temperature, the leakage rate in units [Pa·m3/s] can be calculated using the following formula [21]:
where:
- Pg0—absolute pressure in the gas meter at the start of the test, [Pa],
- Pg1—absolute pressure in the gas meter at the end (after Δt), [Pa],
- Tg0—temperature in the gas meter at the start of the, [K],
- Tg1—temperature in the gas meter at the end (after Δt), [K].
1.3. Available Tests and Calculations Results
Most available scientific articles addressing leak testing using various test gases do not provide quantitative leak results for individual gases. The available leak test results mainly concern gasket testing.
In publication [22], the results of leak tests on flange connection gaskets using helium, hydrogen, and methane were presented. The tests were performed using a leak detector (mass spectrometer). Leak rates for the mentioned gases were obtained at an internal sample pressure of 40 bar, as a function of gasket compression pressure (MPa). At a gasket compression pressure of 40 MPa, the hydrogen leak rate was 4.61 × 10⁻⁵ Pa·m3/s, and for helium it was 1.80 × 10⁻⁵ Pa·m3/s. The referenced study did not include tests using nitrogen. Similar results for helium and hydrogen were also obtained in study [23], in which soft gasket materials were tested. At a test pressure of 0.5 MPa, the leak rate for hydrogen converted to Pa·m3/s was 9.00 × 10⁻⁷ Pa·m3/s, and for helium it was 8.33 × 10⁻⁷ Pa·m3/s. In both studies, the helium leak rate was lower than that of hydrogen under the same conditions. The relative hydrogen-to-helium leak ratio showed similar values.
In turn, publication [24], which serves as a practical guide to leak detection methods for industrial and laboratory applications, presents theoretical, calculated leak values for air, hydrogen, and helium as a function of capillary diameter on a graphical chart. In this case as well, the highest leak rate was observed for hydrogen, and the lowest for air. For small capillary diameters (0.1 µm), the leak rate for helium was close to that of hydrogen, but as the capillary diameter increased (from around 10 µm), the helium leak curve aligned with the air leak curve. Likewise, for capillaries with a diameter above 10 µm, the relative hydrogen-to-helium leak ratio was similar to the values mentioned in the previous studies.
In the range of typical leak sizes, for a capillary diameter of 10 µm, the leak rates were as follows (values read directly from the graph):
- for air: 7.50 × 10⁻⁶ Pa·m3/s;
- for helium: 8.50 × 10⁻⁶ Pa·m3/s;
- for hydrogen: 2.00 × 10⁻⁵ Pa·m3/s.
For a capillary diameter of 100 µm, the leak rates were as follows:
- for air: 7.50 × 10⁻² Pa·m3/s;
- for helium: 7.60 × 10⁻² Pa·m3/s;
- for hydrogen: 1.00 × 10⁻¹ Pa·m3/s.
For a capillary diameter of 1000 µm, the leak rates were as follows:
- for air and helium: 1.00 × 100 Pa·m3/s,
- for hydrogen: 1.25 × 100 Pa·m3/s.
The above test results and calculations allow for preliminary conclusions; however, it should be noted that these results were obtained using different test methods. Moreover, the tests were conducted under conditions that differ significantly from those used in gas meter testing. Additionally, in the cases mentioned above, the geometry of the leakage paths varies. In conventional testing, the geometry of the orifice (leak) is unknown. To confirm the applicability of modified methods, they must be validated experimentally. Table 2 shows a summary of available research results and calculations in relation to the leakage ratio to helium.

Table 2.
Summary of available research results and calculations in relation to of leakage ratio to helium.
2. Materials and Methods
2.1. General Requirements
Hydrogen is one of the gases with the smallest molecules (diameter ~0.289 nm), very high mobility, and the ability to diffuse through microleaks and even through solid materials. It is the lightest gas, with a molar mass of only 2 g/mol, and as a result, it has a very high diffusion coefficient. Due to these physicochemical properties, hydrogen tends to leak through even the smallest imperfections. Therefore, the leak-testing methods used for gas meters intended for natural gas may not be sufficiently sensitive for meters intended for natural gas–hydrogen mixtures or pure hydrogen.
The aim of this research is to assess the feasibility of applying existing test methods used for gas meters intended for natural gas or of modifying these methods (e.g., by using different test gases) for meters designed to measure natural gas–hydrogen mixtures and pure hydrogen.
The smallest value of the maximum working pressure declared by manufacturers of domestic gas meters is 10 kPa, and the highest is 50 kPa. For industrial gas meters, the maximum working pressure can even reach up to 11 MPa for transmission networks.
The test methods for gas meters are described in the technical standards. For diaphragm gas meters, the standard is EN 1359:2017 [25]; for ultrasonic domestic gas meters, it is EN 14236:2018 [26]; for thermal-mass flow-meter based gas meters, it is EN 17526:2021 [27]; for industrial ultrasonic gas meters, it is ISO 17089-1:2019 [28]; for turbine gas meters, it is EN 12261:2024 [29]; and for rotary gas meters, it is EN 12480:2018 [30]. The first three standards specify test methods for domestic gas meters, while the subsequent ones apply to industrial gas meters. These documents also contain design and metrology requirements. A universal specification for all types of gas meters is the OIML specification R 137 1&2:2012 [31], which primarily defines metrological requirements.
The standards for diaphragm, ultrasonic domestic, and thermal gas meters describe leak tests using the bubble method at a pressure of 1.5 times the maximum working pressure pmax, but not less than 35 kPa (the 35 kPa condition does not apply to ultrasonic domestic gas meters), using air as a test medium. The test is conducted in a water bath with visual observation of leakage or by using an equivalent procedure. The standards for turbine and rotary gas meters require pneumatic testing and specify the sensitivity level of the leak test method. Due to the high pressures involved, they define acceptable rates of pressure rise and fall without explicitly describing how leaks should be observed. The test should be carried out at a pressure of 1.1 pmax, but not less than 50 kPa, using air, nitrogen, or another inert gas.
In contrast, the standards for industrial ultrasonic gas meters and the OIML specification only state the requirement that the gas meter must be leak-tight, without specifying the test method. Most standards specifying test methods for gas meters require a leakage test using the bubble method in a water bath with visual observation of leakage, or they permit the use of an equivalent method. While the bubble method is sufficient for determining the presence of leakage, visual inspection alone is not an objective method for comparing the leakage rate of different gases through the same leak. Therefore, the visual method was supplemented with a procedure that monitors the pressure drop across the test samples (gas meters).
The use of hydrogen in distribution networks requires a review of the existing standards, both in terms of the accuracy of measurements for new gas mixtures and the safety of their use. Table 3 summarizes the physicochemical parameters of the gases used for leakage testing (air and nitrogen) and those most commonly used in pipeline transport [32,33,34].

Table 3.
Summary of basic gas parameters.
Of the gases analysed, nitrogen has the largest effective particle diameter (3.64 × 10⁻¹⁰ m) and helium the smallest (2.60 × 10⁻¹⁰ m). Therefore, at micro-leaks, helium will migrate first. Hydrogen has a slightly larger effective particle diameter than helium (2.89 × 10⁻¹⁰ m).
According to Graham’s law, the rate of diffusion of gases at a constant temperature and pressure difference depends on the rate of movement of the molecules, and, therefore, on the density of the gases and is inversely proportional to the square root of their molar mass [35]:
where
- v—diffusion rate, [m/s];
- M—molar mass of the gas, [kg/kmol];
- ρ—gas density, [kg/m3].
Therefore, the greatest outflow of a given gas (under the same or similar conditions of temperature and pressure difference) is expected to occur for hydrogen, slightly less for helium, and significantly less for nitrogen. There are concerns that, in the case of gaseous fuels containing hydrogen or pure hydrogen, standard tightness testing methods developed for natural gas and using air or nitrogen may prove insufficient (not sensitive enough), due to the much higher diffusivity of hydrogen and its smaller effective particle diameter. This paper aims to compare these methods using different test gases. Three gases were selected for comparison: nitrogen, as it is the most commonly used in research; hydrogen, as the target gas; and helium, which has a similar effective molecular diameter and molar mass to hydrogen and is also an inert gas.
Due to the conditions inside the object (temperature and gas pressure in the gas meter), the type of gas, the pressure difference between the object and the surroundings, as well as the size and shape of the leak, the gas outflow through the leak can occur in different flow regimes. The main regimes are the following:
- Molecular flow occurs when the mean free path of the gas molecules is greater than or comparable to the size of the leak (e.g., the diameter of the hole). This flow regime is typical at very low pressures or in the presence of very small gaps;
- Subsonic flow (incompressible or compressible) occurs when the pressure difference between the inside of the object and the surroundings is small. The velocity of the leaking gas does not exceed the speed of sound. Depending on the size of the leak and the Reynolds number, the flow can be either laminar or turbulent;
- Choked (critical) flow occurs when the pressure inside the vessel is sufficiently higher than the ambient pressure. The gas velocity at the narrowest point of the leak reaches the speed of sound. The flow rate does not increase with further increases in pressure difference—it is limited by the so-called critical flow. Critical flow will occur if the pressure ratio between the inside and outside of the object (Pg0/Pg1) exceeds 1.9 for air, nitrogen, and hydrogen, and 2.0 for helium.
2.2. Samples for Testing
In the case of domestic gas meters—whether diaphragm, ultrasonic, or thermal—the casing is typically made of sheet metal using similar manufacturing technologies. Therefore, the specific type of gas meter being tested is of little relevance. What matters most in this context are the size and shape of the leak, as well as the pressure ratio between the inside and outside of the gas meter. The domestic gas meters used in the tests were designed for gases from the first, second, and third families according to EN 437 [36].
In the case of industrial gas meters, i.e., turbine, rotary, and ultrasonic gas meters, there can be differences in the material used for the gas meter housing. Turbine and ultrasonic gas meter bodies are mainly made from machined steel forgings, ductile iron castings, welded steel, cast steel, or aluminum alloy castings [37,38,39,40]. In contrast, the bodies of rotary gas meters are made from aluminum (either profile or casting), ductile iron, or cast steel [41,42,43]. As with domestic gas meters, in this case as well, gas leakage depends on the size and shape of the leak, as well as the pressure differential between the inside and outside of the gas meter. The turbine gas meter used in this study was designed for first and second family gases in accordance with EN 437 [36].
The samples required appropriate preparation for testing. To observe gas leakage, the size of the leak had to be small, and suitable micro-leaks were created for this purpose. These small leaks allowed, on the one hand, for the observation of gas flow dynamics through the visualization of gas bubbles in water, and on the other hand, the analysis of micro-leaks that might go undetected during standard leak testing using the pressure drop method. The holes were artificially created specifically for the tests.
2.3. Test Stand
The schematic diagram of the tightness test stand is shown in Figure 1. The test stand consists of a water tank where the samples are placed, gas cylinders with test gases equipped with pressure regulators, a pressure installation, valves, regulators, a precision pressure controller, a digital barometer, pressure gauges, and thermometers. The laboratory room where the tests were conducted was equipped with mechanical ventilation and a safety system to prevent the formation of an explosive atmosphere.
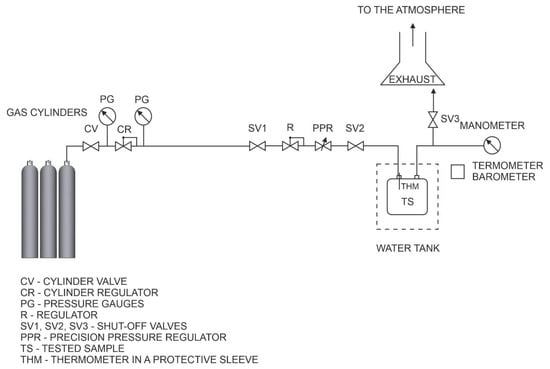
Figure 1.
Schematic diagram of the test bench.
2.4. Test Method
Leak tests were conducted simultaneously using two methods: the bubble immersion method (immersing the gas meter in a water bath and visually detecting leaks) and the pressure drop method (monitoring pressure and temperature changes in the gas meter). These tests were performed on artificially created leaks (micro-holes) according to the following procedure:
- All valves in the system were closed, and the gas leakage test meter was installed;
- The CV valve on the gas cylinder containing the test gas was opened, and the pressure on regulator CR was set to approximately 200 kPa (or 500 kPa for industrial gas meters);
- Valves SV1, SV2, and SV3 were opened sequentially to flush the test sample with the test gas (displacing any remaining residues from other media);
- The vent valve SV3 was then closed, and the test gas meter was filled to the required test pressure, allowing the system to stabilize;
- The gas supply was cut off by closing valve SV2. Simultaneously, gas leakage was recorded and monitored along with pressure and temperature inside the gas meter, ambient temperature, and atmospheric pressure over a defined time interval. To enable later reconstruction of the gas outflow, the leak was recorded during the first minute for comparative purposes and to assess the size of the leak.
During the tests, the parameters of the gas test medium were measured, i.e., the gas temperature of the meters tested. The extended uncertainty of temperature measurement (k = 2, p = 95%) was 0.1 °C. The atmospheric pressure was measured with a digital barometer, and the overpressure was measured with the Wallace & Tiernan FA-234; the extended uncertainty (k = 2, p = 95%) of pressure measurement was 0.3 kPa.
This procedure was repeated for each leak and all tested media: nitrogen, helium, and hydrogen. During the test of the industrial gas meter, it was not possible to achieve the required pressure using the standard setup, so it was necessary to remove the R regulator. Coarse pressure adjustments were instead made using the CR cylinder regulator. Based on the observed leakage, as well as the temperature and pressure drops in the tested sample for each gas, the intensity of the leakage was determined for each medium.
3. Results
This study was conducted on 14 samples prepared according to Section 2.2, 11 of which were household gas meters and 3 were industrial gas meters. Due to space limitations of this article, the results of three samples will be discussed in detail, followed by a summary of all tested samples. Sample 1 represents household gas meters with a minimum operating pressure of 10 kPa, while sample 7 represents household gas meters with a minimum operating pressure of 50 kPa. An additional reason for a detailed discussion of the leak test for sample 7 is the lack of a noticeable pressure drop at the beginning of the test with nitrogen and helium, despite the leakage of these gases through the defect (very small leak size). On the other hand, sample 13 represents an industrial gas meter designed for higher operating pressures.
Depending on the maximum pressure pmax of the domestic gas meters, tests were conducted at sample pressures of either 35 kPa or 75 kPa. In contrast, due to equipment limitations, industrial gas meters were tested at a pressure of 400 kPa. The leakage rate was calculated according to Equation (3).
3.1. Selected Results for Domestic Gas Meters
3.1.1. Results for Sample No. 1
Since the maximum operating pressure pmax of the gas meter was 10 kPa, the test was conducted at a pressure of 35 kPa. After setting the test pressure to the desired value and allowing the test conditions to stabilise, leakage of the test gas was observed. Figure 2, Figure 3 and Figure 4 depict the gas meter during testing, highlighting the visible outflow of gases. A visual assessment of the recorded videos indicated that the nitrogen and helium outflows were at similar levels (with helium showing a slightly higher outflow), while the hydrogen outflow was the most intense.
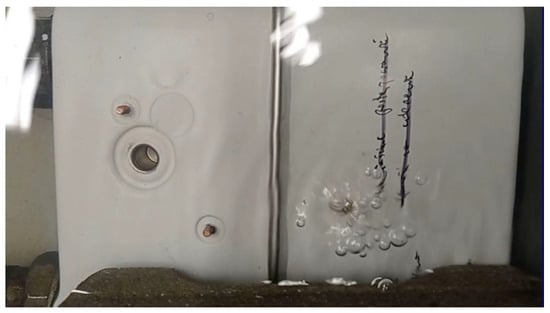
Figure 2.
Sample No. 1, nitrogen leakage.
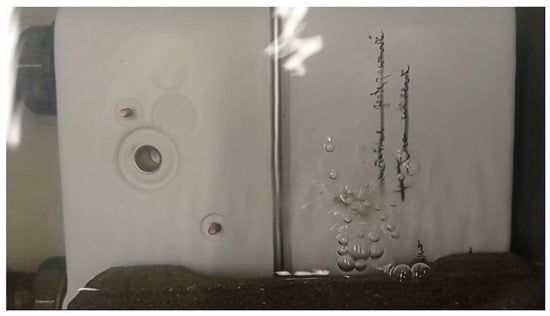
Figure 3.
Sample 1, helium leakage.
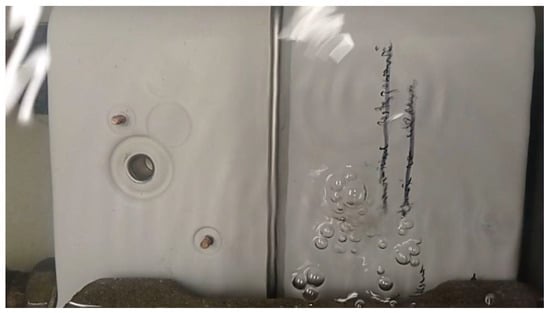
Figure 4.
Sample No. 1, hydrogen leakage.
The visual observations were fully confirmed by the pressure drop data presented in Table 4 and graphically illustrated in Figure 5. Table 4 also shows the leakage measured during the first five minutes after the start of the test. The leakage values confirm previous findings: the highest leakage occurred for hydrogen, while nitrogen and helium showed similar leakage levels, with helium exhibiting a slightly higher outflow.

Table 4.
Pressure and temperature over time and leakage rate for sample No. 1—all tested gases.
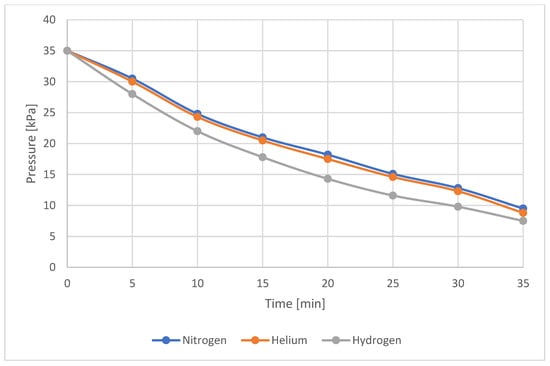
Figure 5.
Pressure drop over time for sample No. 1—all tested gases.
Observation of the rate of pressure drop also confirms that hydrogen is the fastest-leaking gas, while nitrogen and helium leak at similar rates, with helium exhibiting a slightly higher leakage rate. The pressure drop is gentle and almost linear for all gases, which indicates laminar flow.
3.1.2. Results for Sample No. 7
The test was conducted at a pressure of 75 kPa. After setting the leak test pressure to the desired value and stabilizing the test conditions, leakage of the tested medium was observed.
Figure 6, Figure 7 and Figure 8 depict the gas meter with visible gas outflow. A visual assessment of the gas outflow, based on the recorded videos, indicated, as in previous cases, that the nitrogen and helium outflows were at similar levels (with helium showing a slightly higher outflow), while hydrogen exhibited the most intense leakage. However, these visual observations were not confirmed by the pressure drop data shown in Table 5 and Figure 9 in the first five minutes of the test. For nitrogen and helium, no pressure drop or temperature change was detected during this period. Therefore, in accordance with Equation (3), the calculated leakage was zero. In reality, a small leakage occurred, as observed visually. The absence of a measurable pressure drop in the initial five-minute interval was due to the extremely low leak rate, the short observation time, and the limited resolution of the pressure gauge. Additionally, the hysteresis effect of the pressure gauge measuring the pressure in the gas meter may have contributed to this outcome. Over a longer duration, however, the pressure drop became apparent.
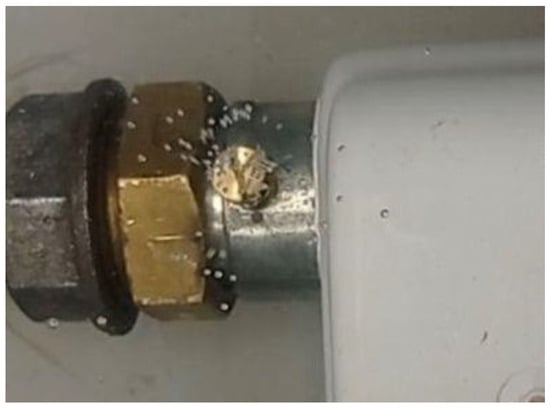
Figure 6.
Sample No. 7, nitrogen leakage.
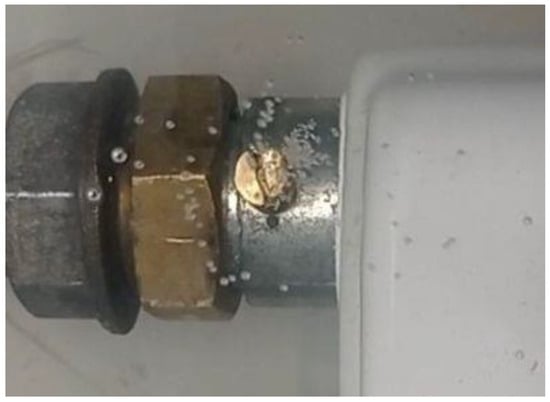
Figure 7.
Sample 7, helium leakage.
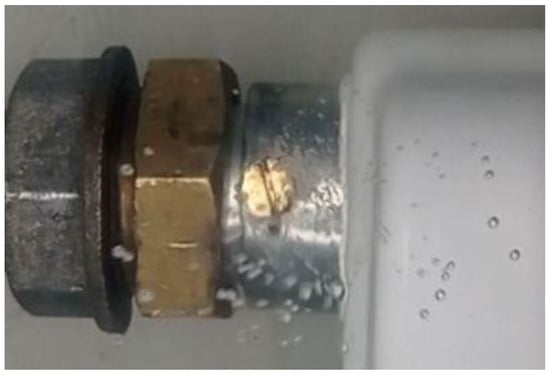
Figure 8.
Sample No. 7, hydrogen leakage.

Table 5.
Pressure and temperature over time and leakage rate for sample No. 7—all tested gases.
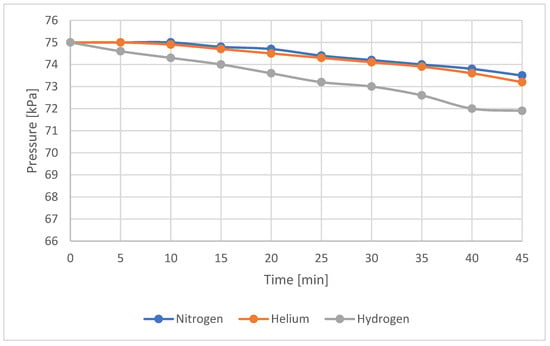
Figure 9.
Pressure drop over time for sample No. 7—all tested gases.
Observation of the pressure drop rate confirms that hydrogen is the fastest-leaking gas, while nitrogen and helium leak at similar rates, with helium exhibiting a slightly higher outflow. The pressure drop is gentle and almost linear for all gases, which indicates laminar flow. Since the pressure drop differences between nitrogen and helium at lower outflow rates were minimal (with data points overlapping and reducing the graph’s readability), the Y-axis scale was adjusted to a higher resolution. This case highlights the importance of the leak observation time. If the observation period is too short, a leak may remain undetected.
3.2. Selected Results for Industrial Gas Meters
Results for Sample No. 13
The test was conducted at a pressure of 400 kPa. After setting the leak test pressure to the desired value and stabilizing the test conditions, leakage of the medium was observed. Figure 10, Figure 11 and Figure 12 depict the gas meter with visible gas outflow. A visual assessment of the gas outflow, based on the recorded videos, indicated, similar to previous cases, that the nitrogen and helium outflows were at comparable levels (with helium showing a slightly higher outflow), while hydrogen exhibited the most intense leakage.
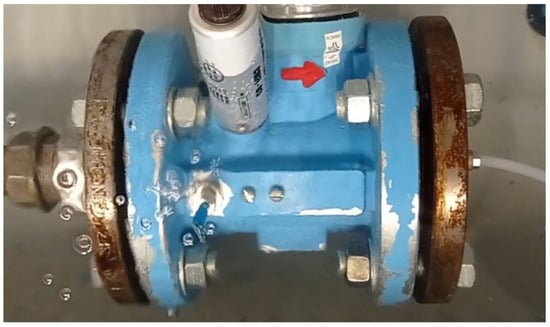
Figure 10.
Sample No. 13, nitrogen leakage.
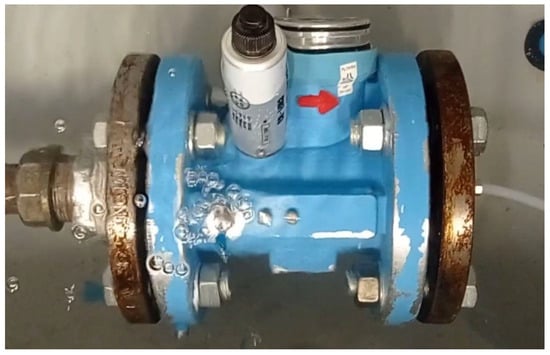
Figure 11.
Sample 13, helium leakage.
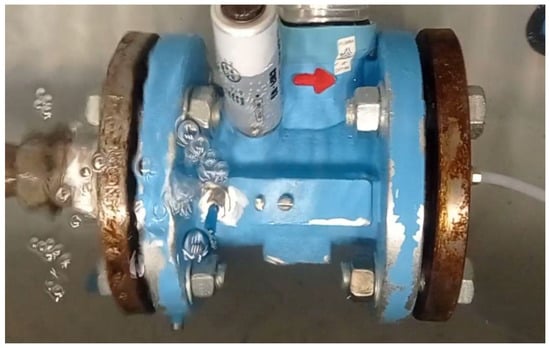
Figure 12.
Sample 13, hydrogen leakage.
The visual observations were fully confirmed by the pressure drop data presented in Table 6 and illustrated graphically in Figure 13. Table 6 also includes the leakage values recorded during the first five minutes after the start of the test. These results confirm previous findings: the highest leakage was observed for hydrogen, while nitrogen and helium showed similar leakage levels, with helium exhibiting a slightly higher rate. There is a large, nonlinear pressure drop for all gases, which indicates choked flow that subsequently transitions into turbulent flow.

Table 6.
Pressure and temperature over time and leakage rate for sample No. 13—all tested gases.
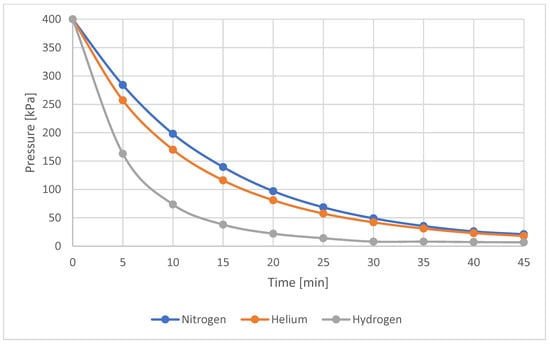
Figure 13.
Pressure drop over time for sample No. 13—all tested gases.
Observation of pressure drop rate confirms that hydrogen is the fastest-leaking gas, while nitrogen and helium leak at similar rates, with helium leaking slightly faster.
3.3. Collected Results for All Samples
The collected leakage results for all tested samples during the initial observation period (the first 5 min after the start of the test) are summarised in Table 7. This table also presents the leakage values of nitrogen and hydrogen relative to helium (i.e., the leakage ratios of nitrogen to helium and hydrogen to helium). Figure 14 and Figure 15 present a graphical summary of leakage data for domestic and industrial gas meters. Figure 16 presents a graphical comparison of the relative leakage rates of various gases with respect to helium. The leakage observations for nitrogen and helium across all tests indicate that both gases leak at similar levels, with helium exhibiting slightly higher leakage than nitrogen (with one exception), while hydrogen consistently shows significantly higher leakage.

Table 7.
Summary of collected leakage rates results for all tested samples.
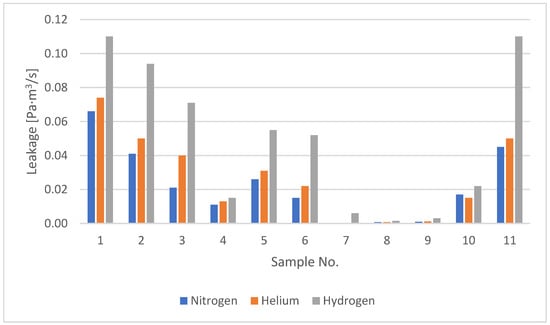
Figure 14.
Leakage rates of domestic gas meters.
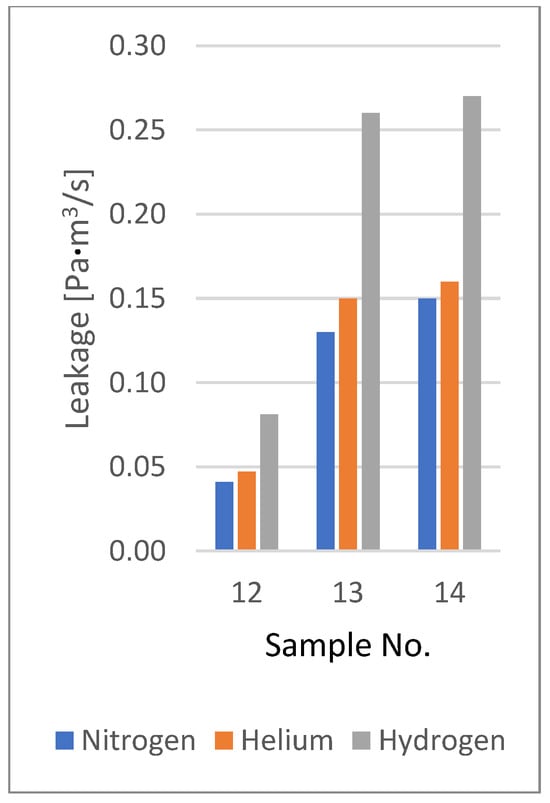
Figure 15.
Leakage rates of industrial gas meters.
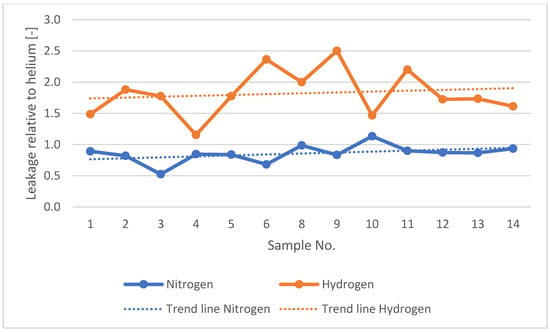
Figure 16.
Leakage rates of nitrogen and hydrogen relative to helium for all tested samples.
The minimum nitrogen-to-helium leakage ratio was 0.53, and the maximum was 1.13. For hydrogen, the corresponding values were 1.15 and 2.50, respectively. The average nitrogen-to-helium leakage ratio was 0.86, and the average hydrogen-to-helium ratio was 1.83. The leakage ratios of the tested gases relative to helium, as presented in Table 7 and Figure 16 across different samples (leaks), test pressures, remain within comparable ranges.
4. Discussion
Tests conducted using nitrogen, helium, and hydrogen demonstrated that leakage detection is strongly influenced by the physical properties of the gas and the test method. Hydrogen’s small effective particle diameter and high diffusivity through materials result in elevated leakage rates, which may go undetected when less sensitive test media, such as nitrogen, are used. Helium—commonly regarded as a reference gas due to its small molecular size—produced leak test results similar to those of nitrogen, suggesting limited suitability as a substitute for hydrogen in standard leak tests for products intended for hydrogen use.
The obtained test results were compared with available research and calculation data found in the literature. Since gas leakage depends on the size and geometry of the leak, as well as the pressure difference, direct comparison of results across different leak configurations is not possible. However, comparisons under identical test conditions are valid. Therefore, relative gas leakages were compared with respect to helium. In ref. [24], leakage values were reported for air, while the tests in this study used nitrogen. Given that the leakage behavior of nitrogen and air is similar and considered comparable in most engineering contexts, a valid comparison was made. The average relative leakage value (with respect to helium) obtained from the tests (Table 7) for nitrogen was 0.86, while the corresponding literature value (for air) was 0.96 (Table 2). For hydrogen, the average relative leakage was 1.83, compared to 1.71 in the literature. The maximum relative leakage value for nitrogen from the tests was 1.13, while the literature value for air was 1.00. For hydrogen, the maximum leakage observed was 2.50, compared to 2.56 from the literature. The minimum relative leakage for nitrogen in the tests was 0.53, whereas the literature reported 0.88. For hydrogen, the minimum value from the tests was 1.15, compared to 1.08 in the literature.
The test results obtained in this study are consistent with those from gasket leakage testing using mass spectrometry [22,23], as well as with the theoretical calculations published in [24] in terms of relative leaks. The largest discrepancy was found in the minimum relative leakage values, both for air (calculated) and for the experimental data, with a difference of 0.35 relative to helium. All other differences did not exceed 0.13. It is also important to note that the literature values refer to different test objects and were obtained using different test methods. Moreover, theoretical models are based on simplifications that may affect the accuracy of the results.
Standardized methods currently used for leak testing of gas meters intended for natural gas have proven sufficient for meters designed to handle natural gas–hydrogen mixtures and pure hydrogen. Even in the case of a small leak (see sample no. 7), where no visible pressure drop was observed during the first five minutes, distinct gas leakage (bubbles) was evident. This study also found that hydrogen exhibited the fastest leakage, while nitrogen and helium had similar leakage rates, with helium slightly higher. This suggests that helium is not suitable for pressure drop leak testing and bubble-based immersion leak testing. However, in the case of small leaks (micro-leaks), immersion testing with hydrogen is recommended.
Helium’s low molecular weight and small atomic size contribute to its high diffusivity and ability to penetrate microleaks. While other gases may be unable to pass through such openings—or may be able to pass with difficulty due to their larger effective particle diameters (helium: 2.60 × 10⁻¹⁰ m, hydrogen: 2.89 × 10⁻¹⁰ m, nitrogen: 3.64 × 10⁻¹⁰ m)—helium can migrate through them. However, its relatively high viscosity leads to a lower flow rate when leaking through larger defects. The results of this study confirm that using helium as a working gas does not significantly improve the sensitivity of outflow-based methods such as bubble or pressure drop tests. Its most effective use is in tracer gas methods with mass spectrometry, which enable precise detection of trace helium concentrations.
Hydrogen’s low molecular weight and small molecular size also result in high diffusivity and a strong tendency to penetrate microleaks. Additionally, its low viscosity and small particle size explain the high flow rates observed during leakage. These properties make hydrogen a suitable test gas for outflow-based leak detection methods. However, its use is complicated by the safety risks associated with explosive atmospheres.
Leak detection using helium is particularly effective in tracer gas methods [8,9]. Due to its small molecular size, helium can diffuse through even the tiniest leaks. When combined with the high sensitivity of modern helium detectors and helium’s very low natural abundance in the atmosphere, this makes the helium tracer gas method exceptionally precise. It allows for the detection of leakage rates as low as 10−6 to 10−13 Pa·m3/s, depending on the equipment used. It is one of the most sensitive and accurate leak detection methods available. Its main advantage is rapid testing speed; however, this comes at the cost of expensive equipment. Furthermore, helium is chemically inert, non-toxic, and non-flammable, making it safe for use in sensitive or hazardous environments where other gases might pose safety risks.
The experiments confirmed the achievable accuracy of the leak detection methods analyzed. Although not the primary objective of this study, a sensitivity of 10−4 Pa·m3/s was achieved. The use of helium as the working gas in conventional methods—such as bubble tests or pressure drop methods—does not significantly improve the sensitivity of these techniques.
The optimal choice of a leak detection method for gas meters intended for hydrogen or hydrogen-containing mixtures depends on the intended application. When testing speed is a key consideration, the helium tracer gas method offers high sensitivity and accuracy. Helium’s inert and non-flammable nature ensures full operational safety, making it particularly suitable for use by gas meter manufacturers. However, its main disadvantage is the high cost of acquiring and maintaining a mass spectrometer. Hydrogen can be used as an alternative tracer gas, but only with strict safety protocols to reduce the risk of explosion.
For standard laboratory applications, where serial testing is not required and leak tests are infrequent, existing methods can still be applied with minor adjustments. Research indicates that current standardized leak-testing procedures for gas meters can be adapted for use with hydrogen instead of air or nitrogen. However, using helium in bubble or pressure drop tests does not significantly enhance their sensitivity. If hydrogen is used as the test gas, it is essential to thoroughly evaluate explosion risks and apply suitable safety measures.
This study highlights the critical importance of selecting appropriate leak detection methods for devices intended for use with hydrogen or hydrogen-containing gas mixtures. Hydrogen’s unique characteristics—such as its small molecular size, high diffusivity, and wide flammability range—pose particular challenges in ensuring gas system tightness and operational safety. When hydrogen is used as the test gas, explosion risks must be carefully assessed, and appropriate safety measures must be implemented to mitigate potential hazards.
5. Conclusions
Based on the tests performed, the following conclusions can be drawn:
- The rate of gas leakage through a defect is influenced by several factors, including the size and shape of the leak (the length and cross-sectional area of the gas flow path), pressure differential and temperature conditions, gas properties (such as molecular weight, effective particle diameter, and viscosity), as well as the type of flow through the leak and the resulting flow resistance;
- The test results obtained in this study are consistent with leakage test results available in the literature (using mass spectrometry), as well as with theoretical calculations published in scientific sources;
- The standardized methods currently used for leak testing of gas meters intended for natural gas have proven to be sufficient for meters designed to measure natural gas–hydrogen mixtures and pure hydrogen. However, in the case of small leaks (microleaks), it is recommended to modify these test methods by replacing air/nitrogen with hydrogen as the test gas;
- This study also found that nitrogen and helium had similar leakage rates (helium had slightly higher). This suggests that helium is not suitable for pressure drop leak testing and bubble-based immersion leak testing;
- When hydrogen is used as the test gas, explosion risks must be carefully assessed, and appropriate safety measures must be implemented to mitigate potential hazards.
Funding
This research was carried out as part of the statutory work commissioned by the Ministry of Science and Higher Education of Poland, order no. 0079/GM/23, archival number DK-4100-0062/23.
Data Availability Statement
The original contributions presented in the study are included in the article, further inquiries can be directed to the author.
Conflicts of Interest
The author declares no conflicts of interest.
Nomenclature
The following abbreviations are used in this manuscript:
| ΔP | pressure drop in the gas meter during Δt, [Pa] |
| Δt | time interval between successive registrations of test parameters, [s] |
| Pg0 | absolute pressure in the gas meter at the start of the test, [Pa] |
| Pg1 | absolute pressure in the gas meter at the end (after Δt), [Pa] |
| pmax | maximum working pressure, [Pa] |
| v | diffusion rate, [m/s] |
| ρ | gas density, [kg/m3] |
| T | temperature, [K] |
| Tg0 | temperature in the gas meter at the start, [K] |
| Tg1 | temperature in the gas meter at the end (after Δt), [K] |
| TS | reference temperature, usually 273.15 [K] |
| UAG | unaccounted for gas, [GJ] or [m3] |
| V | internal volume of the gas meter available for the test medium, [m3] |
| W | rate of gas leakage from a tank, [mol/s] or [Pa·m3/s] |
| MDPI | Multidisciplinary Digital Publishing Institute |
| RES | Renewable Energy Sources |
References
- Jaworski, J.; Kułaga, P.; Blacharski, T. Study of the Eect of Addition of Hydrogen to Natural Gas on Diaphragm Gas Meters. Energies 2020, 13, 3006. [Google Scholar] [CrossRef]
- Król, A.; Kukulska-Zając, E.; Holewa-Rataj, J.; Gajec, M. Hydrogen as an element of the energy transition. Nafta-Gaz 2022, 7, 524–534. [Google Scholar] [CrossRef]
- Gaz Ziemny. Karta Charakterystyki. PGNiG Wersja 2.1/PL. Update Date 3 July 2023. Available online: https://pgnig.pl/documents/10184/2346596/PGNiG+GAZ+ZIEMNY+2.1+PL.pdf/00c80c28-69a8-4533-bd35-ca9342368e92 (accessed on 1 March 2025).
- Wodór. Karta Charakterystyki. Air Products. Wersja 1.12. Update Date 21 March 2022. Available online: https://www.scribd.com/document/702879042/wodor-karta-charakterystyki (accessed on 1 March 2024).
- Jaworski, J.; Kukulska-Zając, E.; Kułaga, P. Selected issues concerning the impact of hydrogen addition to natural gas on the gas network components. Nafta-Gaz 2019, 10, 625–632. [Google Scholar] [CrossRef]
- Gacek, Z.; Jaworski, J. Optimisation of measuring system construction in the context of high flow variability. J. Nat. Gas Sci. Eng. 2020, 81, 103447. [Google Scholar] [CrossRef]
- Jaworski, J.; Kulaga, P.; Ficco, G.; Dell’Isola, M. Domestic Gas Meter Durability in Hydrogen and Natural Gas Mixtures. Energies 2021, 14, 7555. [Google Scholar] [CrossRef]
- Rottländer, H. Fundamentals of Leak Detection; BICOM 13619.13810.19979_VA.01; Leybold GmbH: Köln, Germany, 2016. [Google Scholar]
- Nondestructive Testing Handbook, 3rd ed.; Volume 1. Leak Testing; American Society for Nondestructive Testing: Columbus, OH, USA, 1998.
- Nondestructive Testing Handbook, 2nd ed.; Volume 10 Nondestructive Testing Overview; American Society for Nondestructive Testing: Columbus, OH, USA, 1996.
- Rosen, B.; Dayan, V.H.; Proffit, R.L. Hydrogen Leak and Fire Detection: A Survey; NASA SP-5092; NASA: Washington, DC, USA, 1970.
- NASA-STD-7012A; Leak Test Requirements. NASA: Washington, DC, USA, 2023.
- Leak Detection Methods: A Comparative Study of Technologies and Techniques; VTech e-news, Spring 2005; VTech: Blacksburg, VA, USA, 2005.
- Training Guidelines in Non-Destructive Testing Techniques: Leak Testing at Level 2, Training Course Series 52; International Atomic Energy Agency: Vienna, Austria, 2012.
- Leak Testing: Moving Beyond the Most Popular Methods. Available online: https://www.csemag.com/leak-testing-moving-beyond-the-most-popular-methods/ (accessed on 11 September 2023).
- Nobis, C.; Kraś, J. Isotopic Leakage Diagnostics of Pipelines and Industrial Installations; No. 2, April–June 2015; Institute of Chemistry and Nuclear Technology: Warsaw, Poland, 2015. [Google Scholar]
- EN 1593:1999+A1:2003; Non-Destructive Testing, Leak Testing, Bubble Emission Techniques. European Committee for Standardization: Brussels, Belgium, 2003.
- EN 1779:1999+A1:2003; Non-Destructive Testing, Leak Testing, Criteria for Method and Technique Selection. European Committee for Standardization: Brussels, Belgium, 2003.
- Schroder, G. New European standard for the selection of a suitable method for leak detection and leak tightness testing. Insight—Non-Destr. Test. Cond. Monit. 2001, 43, 797–800. [Google Scholar]
- ASTM E2930-13; Standard Practice for Pressure Decay Leak Test Method. ASTM: West Conshohocken, PA, USA, 2021.
- EN 13184:2001; Non-Destructive Testing—Leak Testing—Pressure Change Method. European Committee for Standardization: Brussels, Belgium, 2001.
- Zajączek, J. Comparison of Leak Test Results for Hydrogen, Methane, and Helium on Static Sealing Systems. SPETECH Sealing Technology. 2020. Available online: https://www.spetech.com.pl (accessed on 1 March 2025).
- Permeability Tests with Helium and Hydrogen on Soft Gasket Materials, DONIT—Gasket Seals. 12 January 2023. Available online: https://donit.eu/blog/permeability-tests-with-helium-and-hydrogen-on-soft-gasket-materials/ (accessed on 1 March 2025).
- Leak Detection Compendium; Pfeiffer Vacuum GmbH: Asslar, Germany, 2013.
- EN 1359:2017; Gas Meters. Diaphragm Meters. European Committee for Standardization: Brussels, Belgium, 2017.
- EN 14236:2018; Ultrasonic Domestic Gas Meters. European Committee for Standardization: Brussels, Belgium, 2018.
- EN 17526:2021; Gas Meters—Thermal-Mass Flow-Meter Based Gas Meter. European Committee for Standardization: Brussels, Belgium, 2021.
- ISO 17089-1:2019; Measurement of Fluid Flow in Closed Conduits Ultrasonic Meters for Gas Part 1: Meters for Custody Transfer and Allocation Measurement. International Organization for Standardization: Geneva, Switzerland, 2019.
- EN 12261:2024; Gas Meters. Turbine Gas Meters. European Committee for Standardization: Brussels, Belgium, 2024.
- EN 12480:2018; Gas Meters. Rotary Displacement Gas Meters. European Committee for Standardization: Brussels, Belgium, 2019.
- OIML R137 1&2:2012; International Organization of Legal Metrology, Gas Meters Part 1: Metrological and Technical Requirements, Part 2: Metrological Controls and Performance Tests. International Organization of Legal Metrology: Paris, France, 2012.
- Mizerski, W. Tablice Fizyczno-Astronomiczne; Wydawnictwo Adamantan: Warsaw, Poland, 2005. [Google Scholar]
- Szymczyk, T.; Rabiej, S.; Pielesz, A.; Desselberger, J. Tablice Matematyczne, Fizyczne, Chemiczne, Astronomiczne; Świat Książki: Warsaw, Poland, 2003. [Google Scholar]
- Baker, R. Membrane Technology and Applications; John Wiley & Sons, Ltd.: Hoboken, NJ, USA, 2012. [Google Scholar]
- Barrow, G. Chemia Fizyczna; Państwowe Wydawnictwo Naukowe: Warsaw, Poland, 1994. [Google Scholar]
- EN 437:2021; Test Gases—Test Pressures—Appliance Categories. European Committee for Standardization: Brussels, Belgium, 2021.
- CGT-HT/IO15-11; Gazomierze Turbinowe CGT-02 HT. Instrukcja Obsługi; Common: Lodz, Poland, 2017.
- Turbine Meter TME400-VC (-VCF). Operating Manual. Version 11 8th November 2024. Available online: https://static.rmg.com/31541/TME400VCF-manual-en-V11.2-11.2024.pdf (accessed on 1 September 2024).
- Q.Sonic®plus. Gazomierze Ultradźwiękowe. Karta Produktu. Elster. Wyd.03.2013. Available online: https://www.intergaz.eu/wp-content/uploads/qsonicplus.pdf (accessed on 1 September 2024).
- Gazomierz Turbinowy. Karta Produktu. Elektrometal S.A. Wersja z Dnia: 2025-01-22. Available online: https://elektrometal.eu/catalogs/Gas/products/pl/180.pdf?v=32 (accessed on 1 March 2025).
- CGR-04 M. Gazomierze Rotorowe Niskopulsacyjne. Karta Informacyjna KI:CGR-04/PL/2023.04.17. Available online: https://www.common.pl/uploads/media/KI_CGR_04M_PL_2023_04_17.pdf (accessed on 1 March 2025).
- IM-RM Gazomierz Rotorowy. Instrukcja Obsługi, Konserwacji z Ostrzeżeniami. Zmiana 00—Wydanie 01/2023. Available online: https://www.fiorentini-iberia.com/wp-content/uploads/2021/03/IM-RM_technicalmanual_POL_revA.pdf (accessed on 1 March 2025).
- Karta Katalogowa Gazomierzy Rotorowych DELTA. DELTA_3_0_2013© Copyright 2013. Available online: https://gaztechnika.pl/application/files/3415/3856/0181/Gazomierze_rotorowe_DELTA_GT.pdf (accessed on 1 March 2025).
Disclaimer/Publisher’s Note: The statements, opinions and data contained in all publications are solely those of the individual author(s) and contributor(s) and not of MDPI and/or the editor(s). MDPI and/or the editor(s) disclaim responsibility for any injury to people or property resulting from any ideas, methods, instructions or products referred to in the content. |
© 2025 by the author. Licensee MDPI, Basel, Switzerland. This article is an open access article distributed under the terms and conditions of the Creative Commons Attribution (CC BY) license (https://creativecommons.org/licenses/by/4.0/).