Article

EU Energy Markets and Renewable Energy Sources—Are We Waiting for a Crisis?

Faculty of Electrical and Computer Engineering, Cracow University of Technology, ul. Warszawska 24, 31-155 Kraków, Poland
*
Authors to whom correspondence should be addressed.
Energies 2025, 18(15), 4201; https://doi.org/10.3390/en18154201
Submission received: 5 June 2025 / Revised: 14 July 2025 / Accepted: 16 July 2025 / Published: 7 August 2025
(This article belongs to the Special Issue Economic Analysis and Policies in the Energy Sector—2nd Edition)

Abstract

Interactions between the increased penetration of the power system by renewable energy sources (RESs) and the energy pricing mechanism in the EU (day-ahead market) can lead to many unexpected and paradoxical consequences. This article analyses the case of the long-term maintenance of prices around zero on the day-ahead market in south-western Europe at a certain time of a day. This is an important case since, at the same time, this area generates electricity from a similar source mix as it is in the target for the EU. Zero or very low energy prices are becoming increasingly common across the EU. This can pose a problem for the stability of the electricity supply, as it translates into a lower power of used disposable power sources, which can be used as a reserve when the majority of the energy supply comes from renewable energy sources. Furthermore, this work refutes the most frequently proposed solution to the problem of excessively low prices based on energy storage systems. This work attempts to analyze the long-term low-price situation in Spain and extrapolate the expected consequences based on it; however, it is difficult to find all the factors that occur in the power system and influence the price market and vice versa. The issue is multidimensional and complex, and the analyzed situation revealed a number of trends. Therefore, a multifaceted problem remains. A constant electricity supply must be ensured at a reasonable price, thus avoiding the exposure of individual consumers to energy shortages or significant price increases, while, at the same time, the EU must reduce dependence on fossil fuels, and its legislation must push for reduced CO2 emissions. On the other hand, the EU must provide some type of market mechanism to support the achievement of these goals because the current pricing mechanism based on the day-ahead market does not seem to be effective. This article aims to spark a discussion about this problem; it does not provide any simple solutions to it.

1. Introduction

In recent times, two basic changes can be observed in the European power industry: the first one is the departure from “conventional” sources, or, more precisely, sources emitting CO2, in favour of renewable energy sources, and the second one is related to the pursuit of the liberalization of access to infrastructure and the liberalization of the energy market and prices [1,2,3,4,5,6,7]. This leads to the emergence of surprising “incidents” (very high or close to zero or even negative energy prices during a single day period) on the energy market. These incidents, therefore, may have a serious and dangerous impact on the functioning of power systems (PSs) in many European countries.
In the discussion on the liberalization of energy prices, the argument of a possible rapid increase in energy prices is very often cited. Indeed, such situations are observed, and a good example is illustrated by the situation in Germany on 11–12 December 2024. This kind of situation is called “dark flout”.
In the analysis of Figure 1, two situations can be deduced: the energy market is very unstable, i.e., a relatively small imbalance between power supply and demand leads to a sudden change in price, and an alternative to high energy prices at a given moment may be practically only a partial blackout (e.g., the so-called spinning blackout) that can rapidly reduce electricity consumption. What is also worth analyzing are the reasons for the major limitations in the availability of electricity, i.e., the situation in Texas in the winter of 2021 [8,9,10,11,12,13,14,15,16,17,18,19,20,21].
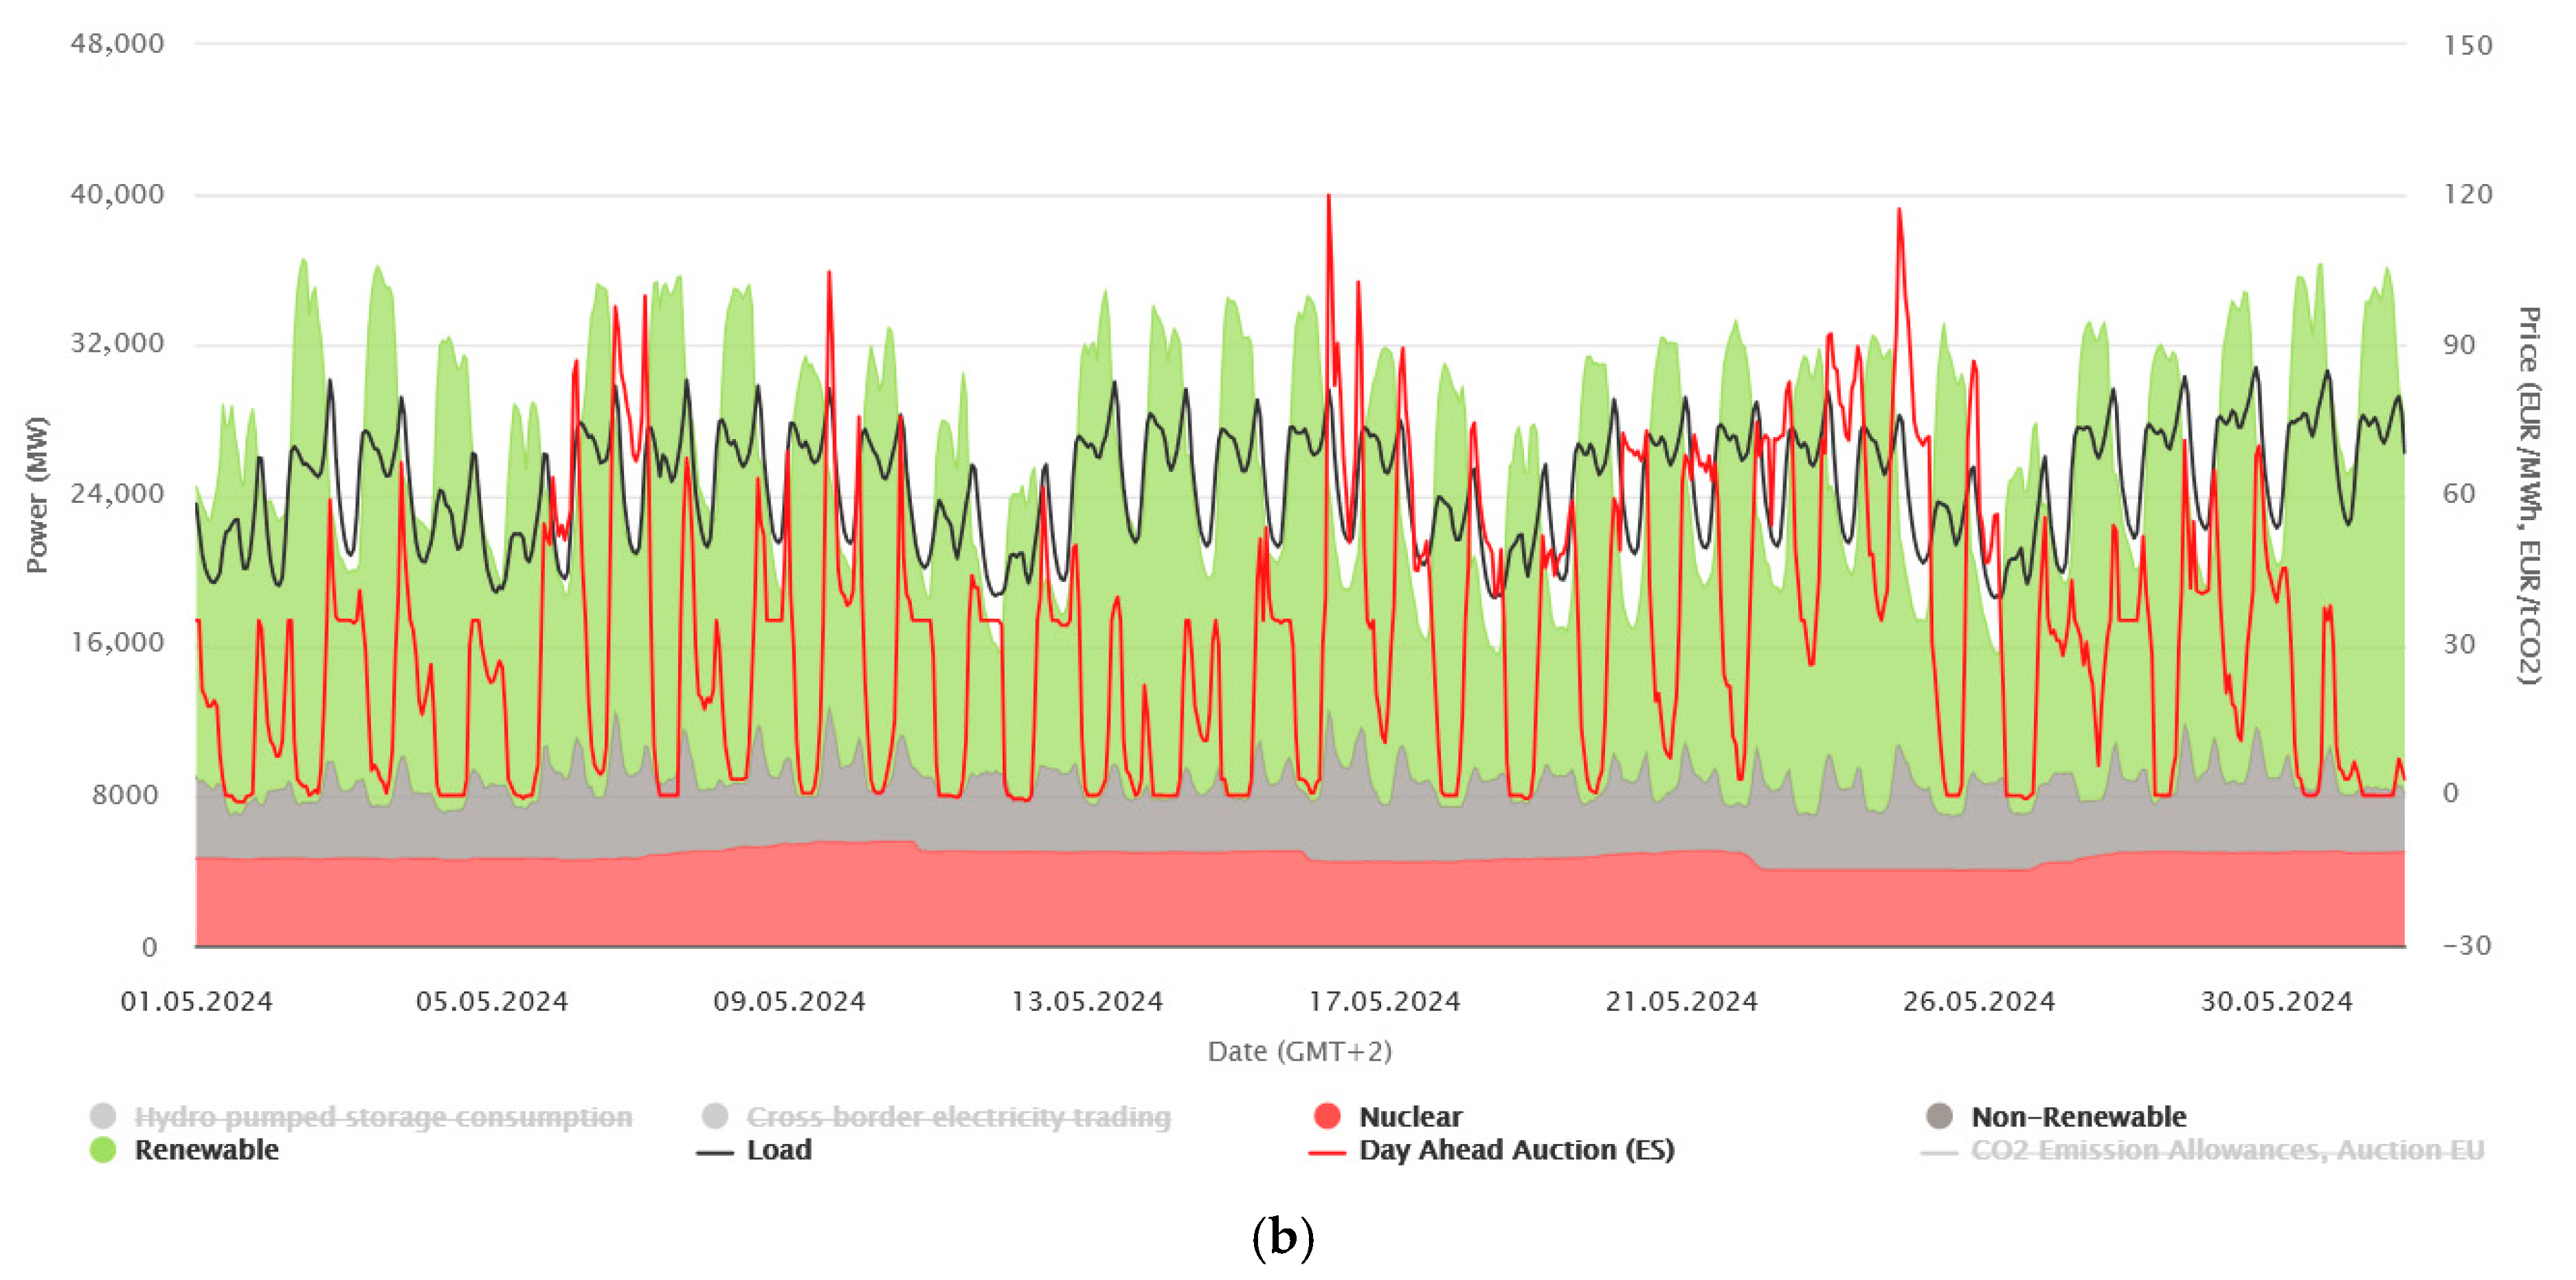
However, this work will not be devoted to the analysis of this quite commonly predictable and described situation. The condition on the energy market in Spain in 2024, shown in Figure 2a,b, is much more interesting and disturbing.
In this article, we present an analysis that is devoted to an attempt to explain the EU energy market situation. It should be noted that while in 2024, a prolonged period of near-zero energy prices affected three EU countries, at the beginning of 2025, this could be observed in six countries (in addition to the Baltic states and parts of Sweden). The share of short periods (around noon) when energy prices are near-zero increased in every EU country. This phenomenon is alarming because it can cause long-term consequences of an overall investment in power plant development, while the short-term consequences will be serious financial problems, especially for solar power plants. This will also cause difficulties in financing power plants working without a market-based mechanism, which ensures optimal resource allocation (EU subsidies).
Because of the complexity of the problem, this work cannot analyze all issues and ensure that all of them are considered. Rather, this work is full of observations based on limited data and is more of an attempt to initiate a discussion than a complete analysis. This work intentionally uses raw data (processed data can hide some relations) obtained directly from the Energy Chart. The authors apologize in advance for all these facts.

2. Energy Markets

Any considerations on energy markets should begin with the basically philosophical observation that the mechanism of operation of any market, i.e., establishing the balance between demand and supply by means of price, has a hidden set of elements that generate oscillations. Contrary to common, graphic illustrations of this mechanism, the reaction of sellers and buyers is burdened with a certain inertia, which is caused by many factors (e.g., psychological reasons). This is the reason for the emergence of price oscillations. Positive feedback loops occurring in the price formation mechanism can additionally affect market stability. This phenomenon can be, for example, mitigated by the use of energy storage facilities. Moreover, it is precisely in order to limit the amplitude of these oscillations (crisis—boom swings) to use central banks will be established in the markets. It is worth noting that in the model situation for economics, we are dealing with an infinite and continuous population on both sides of the game (market) and continuous supply and demand functions. In reality, the population of market participants may be small and the supply and demand functions discrete, which further increases the tendency for price oscillations to occur and increases the risk of market instability [22].
In general, the energy market is subject to supply variability, and the causes are daily oscillation (e.g., clearly visible in the production of energy from photovoltaic cells); annual oscillation (also particularly visible in their production); indeterminate and limited in terms of forecasting fluctuations that are particularly important for photovoltaics; and wind energy (weather variability). On the demand side, certain oscillations may also occur, such as daily, weekly, and annual oscillations, plus demand variability dependent on weather fluctuations.
Electricity should be considered as a basic good that is very difficult or even impossible to substitute. All the above-mentioned factors influencing the energy market suggest that there is a situation in which market mechanisms may be “inefficient” or at least poorly recognized based on theory [23,24,25,26,27,28,29,30,31,32,33,34,35]. For these reasons, the mechanisms for setting prices on electricity markets should be constantly monitored and adjusted to the current technological situation.
When discussing subsequent energy markets and their impact on the operation of the power system (PS), it is necessary to start with the factors used to balance markets. Thus, the used market is not really a market, and it would be better to call it a mechanism for pricing errors made in forecasting (as well as purchases on other energy markets). Each participant in this market can make a mistake either with the “+” sign, i.e., overestimate their demand and underestimate the expected production and consequently, cause an excess of the amount of energy produced in the PS, or with the “-” sign, i.e., underestimate their demand, overestimate the production capacity and, therefore, cause an excess of the amount of available energy. Theoretically, at a given moment (or rather a schedule unit—a 15 min interval), the sign of the price depends on the sign of the sum of errors, and the price value on the module of the aforementioned sum.
In practice, the mechanism of operation for this market is complicated and is not entirely related to the subject of this paper, and the price-setting mechanism is subject to several administrative procedures. Prices on the balancing market are extremely important for the profitability of generation by turbulent sources (PV and wind), not because these entities play a game on it, but because of the mechanisms of penalties for weather forecast errors included in it [36]. The existence of these mechanisms is related to the specificity of the operation of most power systems. Their correct operation requires balancing the power of demand and supply, and an imbalance leads to serious disturbances, including a possible blackout.
The intraday market is basically a small market in terms of value. For technical reasons, an increase in turnover should not be expected on it. All transactions concluded on it leave very little time for the operators of European power systems to react and assess whether the power flow system proposed by the market poses a threat to the security of the power system. The mechanism seems to be used to avoid costs on the balancing market, and, looking at the PS structure and requirements and this most often means purchasing electricity outside the national system [37].
The day-ahead market is the main and preferred by the EU place of energy trading. Theoretically, this market aims to optimize the use of resources. Buyers and sellers of energy submit offers on it at prices they are able to buy or sell a specific amount of energy at a given moment (schedule unit). Then, the same energy price is set for everyone, resulting from the price given by the most expensive necessary supplier needed to meet the demand. The price setting mechanism assumes the following pairing: cheapest suppliers—most expensive recipients, then more expensive suppliers and recipients declaring lower prices until the supplier price balances with the prices.
In this mechanism of price setting, as already noted, the most expensive supplier needed to balance the market determines the actual price of energy [38]. In practice, due to the technical limitations for most of the participants in this market, a relatively small number of suppliers and recipients can participate in the market. A larger group of energy suppliers can only choose whether to submit an offer to this market at a price of “0”, or refrain from selling energy and instead “hope” that the average prices over a given time period will be satisfactory for them. Their failure to submit an offer to the market will indeed result in an increase in price, but the benefits will be received in the short term by other suppliers, which is not considered an optimal strategy. In the case of electricity recipients, a significant part of the demand is inflexible (independent of the proposed price) or not fully controllable. The mechanism of operation of this market was criticized for this reason already at its design stage. Various financial instruments are also available on the day-ahead market, in theory serving to increase price stability, but in practice obscuring its operation [39,40,41,42,43,44,45,46,47,48,49,50,51,52,53,54,55,56,57,58].
Other forms of contracts—in theory, we have the freedom to conclude individual contracts for the supply of energy, but in practice, administrative tools (exchange obligations) are used to discourage these forms of transactions.
The power capacity market (a form of market occurring only in Poland)—its purpose is not to set energy prices but only to value reserves needed to maintain the security of the power system.
In addition to the described markets, a number of services necessary for the functioning of the power system are provided at the same time, e.g., reactive power balancing and ensuring the necessary reserve to meet various required forms of stability (e.g., N-1) [59,60,61,62].

3. Energy Market Participants

This chapter presents the energy market participants and lists some of their properties that may affect the operation of the energy supply systems and energy pricing.
A power system is a set of devices used to convert another form of energy into electrical energy and then deliver it to energy recipients. Recipients use this energy in the production of desired goods or transfer it into other forms of energy. Power System contains all sources of electrical energy, transformers, transmission lines, increasingly common FACTS devices, and receivers currently connected to it.
In Poland, the PSE PS operator acts as a party to the balancing market and takes care of the reliability of the transmission system. Information obtained from the next day market is transformed into a work schedule of individual sources in the system, considering their technological limitations, including such factors as the permissible state space and dynamic limitations. It must also provide the necessary reserves and stability “reserve”.
Energy producers are characterized by technical limitations in terms of the speed of generation changes and its permissible range (e.g., thermal units have an absolute limitation—they cannot go below approximately 30% of nominal power because they risk damage, and it is uneconomical to operate these units below 60% of nominal power—below this power; the variable costs of energy production increase above the profitability limit). The properties of a specific producer are well as those correlated with the type of “fuel” are used in its classification.
It is difficult to attribute any characteristics to energy recipients, apart from the fact that they complain that electrical energy is too expensive (data from the next day market indicate that, at least in the short term, they can accept much higher prices—Figure 1) and that an interruption in the supply of electricity can be a major difficulty for them. The size of this interruption for them is correlated with the length of it and the territory covered by this phenomenon (from minor inconvenience to blackouts). For some of them, energy costs are marginal, for others, it is a significant component of all costs. Their demand can also be very flexible or rigid and characterized by different time constants of the applied load. However, an important observation nowadays is that the pursuit of reducing capital intensity in industry has resulted in a decrease in the elasticity of energy demand.
It should also be noted that the increase in the penetration of PS by PV changes and differentiates the situations of recipients and divides them into two basic groups: industrial and institutional ones form one group, and municipal ones (population and meeting its needs) form another group. The demand of the first group is well correlated in time with the production capabilities of solar power plants—the energy price for this group is systematically reduced. The second group of recipients reaches the peak of its consumption in a situation where PV production drops rapidly and tends to the value of “0” (evening). At the same time, in PS, the PV displaces the production of other power plants during the day. As a result of both phenomena, the price of energy for the “population” increases rapidly. This situation may have very disturbing implications in the social and political sphere. Importantly, the elasticity of demand of the group of municipal recipients has also not been thoroughly examined, and the value of this elasticity assumed in some solutions is significantly overestimated [63,64,65,66,67,68,69,70,71,72].
Energy storage ability is worth paying more attention to. The storage units are theoretically supposed to introduce a solution to the problems with turbulent RES generation. In the market model, the revenue of this unit is proportional to the amount of energy sold, and they earn on the difference in energy prices. Let us try to estimate what the output price of energy from the storage will be. The revenue from a single act of storage (purchase, holding, and sale) of an energy storage can be written as follows:
R i = p s i E i p b i 1 η E i
For calculation, it is convenient to assume that we are considering one schedule unit (15 min interval), where
Ri—revenue from a single act; psi—energy sales price; pbi—energy purchase price; η—overall storage efficiency (includes efficiency of all devices in energy storage facility and for whole load and discharge cycle); and Ei—amount of energy sold in the transaction.
Therefore, the revenue in each time interval (R) consisting of N intervals can be written as
R = i = 1 N R i
That is,
R = i = 1 N p s i E i p b i 1 η E i
where N is the number of storage acts (purchase, holding, and sale of energy).
For the sake of accuracy, if part of the energy sold in a given “schedule” unit (in the 15 min interval used for settlements on the electricity market) was purchased in one “schedule unit” and other part of the energy in the other unit, we treat this as two acts of storage (different purchase prices may have occurred) and similarly, if the energy purchased in one “schedule unit” is sold in two units, we have two acts of storage (different sales prices).
At this stage, you can try to average the purchase and sale prices, but either the precision is lost or the formulas become very complex.
It should also be noted that the number N has a technical meaning, i.e., that, for example, in the case of battery storage, a single act of storage is one work cycle of individual cells (the storage is built from a set of cells and one of the purposes of controlling it is to equalize the number of cycles between cells). There is also a guaranteed number of work cycles of a single cell (currently up to 6000–8000 cycles).
Energy storage costs (C) in each period:
C = C i n v + C m a i n + C l i q
where Cinv—construction costs (part proportional to the ratio of N to the maximum number of cycles if we do not consider the entire “life” cycle of the device); Cmain—maintenance costs (maintenance, repairs, taxes…); Cliq—liquidation costs (disposal of used storage facility).
Hence, we obtain storage unit income I:
I = R C
That is,
I = i = 1 N p s i E i p b i 1 η E i C i n v C m a i n C l i q
It is easy to see that the income and rate of return depend on the amount of energy sold in a single act and the frequency of these acts in a unit of time.
However, we propose to conduct another experiment to estimate (from formulas below) the price of energy sold from the storage. For this purpose, let us assume that the storage cooperates with photovoltaics, i.e., it works in a daily rhythm of 365 storage acts during the year; it charges fully during the day and discharges completely at night (we ignore the issues of “deep” and normal charging and discharging and their relationship with durability). Ei assumes the maximum value of stored energy for the considered storage. For simplicity, energy is always purchased at the price ps and sold for pb price. We assume that energy is purchased during the day at a price that is “satisfactory” for the photovoltaic source (ps), and the purchase cost (Cinv) is estimated based on any price list; other costs are assumed to be zero (Cmain = 0 and Cliq = 0). In this case, the relationship describing income from the energy storage device will be simplified to the following form:
I = N p s E i p b 1 η E i C i n v
And further
p s = p b 1 η + I E i + C i n v E i N
As can be observed, the required price for a selling energy by its storage system is a function of storage effectiveness, investment costs, and expected profit. The investment costs of the energy storage systems are high, but according to media announcements, they tend to fall. Nowadays, even if zero profit of energy storage is assumed, the price of energy sold from it to the system is much higher than the price of energy bought previously from PS. The difference between those prices has to cover power losses and investment costs. The result is a reluctance to invest in storage facilities; however, a “new super technology” of energy storage is just around the corner, and there is still an expectation of quick profits [73,74,75,76,77,78].
At this point, it is necessary to consider what unit profit or rate of return we consider “satisfactory”, find information on what energy sales price the PV sources consider “satisfactory” (or at least not causing bankruptcy), and estimate the unit price of the energy storage based on price lists and the number of storage cycles N from technical data.
Analyzing these relationships, the absurdity of inter-seasonal energy storage can be seen—it would require either an absurdly large price difference between seasons or absurdly low investment costs in an energy storage (when trading in goods that are easy to store, the second relationship occurs and this has accustomed society to ignore the costs of the storage and storage activities).
It is estimated that 160–210 GWh of battery storage will be installed in 2024 in PS worldwide (from small “prosumer” to large-scale installations). This is a measure of their current production, and it is not expected to increase radically, i.e., right now they can cover about 8–10 h of Poland’s energy demand [79,80,81].

4. Price Level Situation in Spain: A Short Description

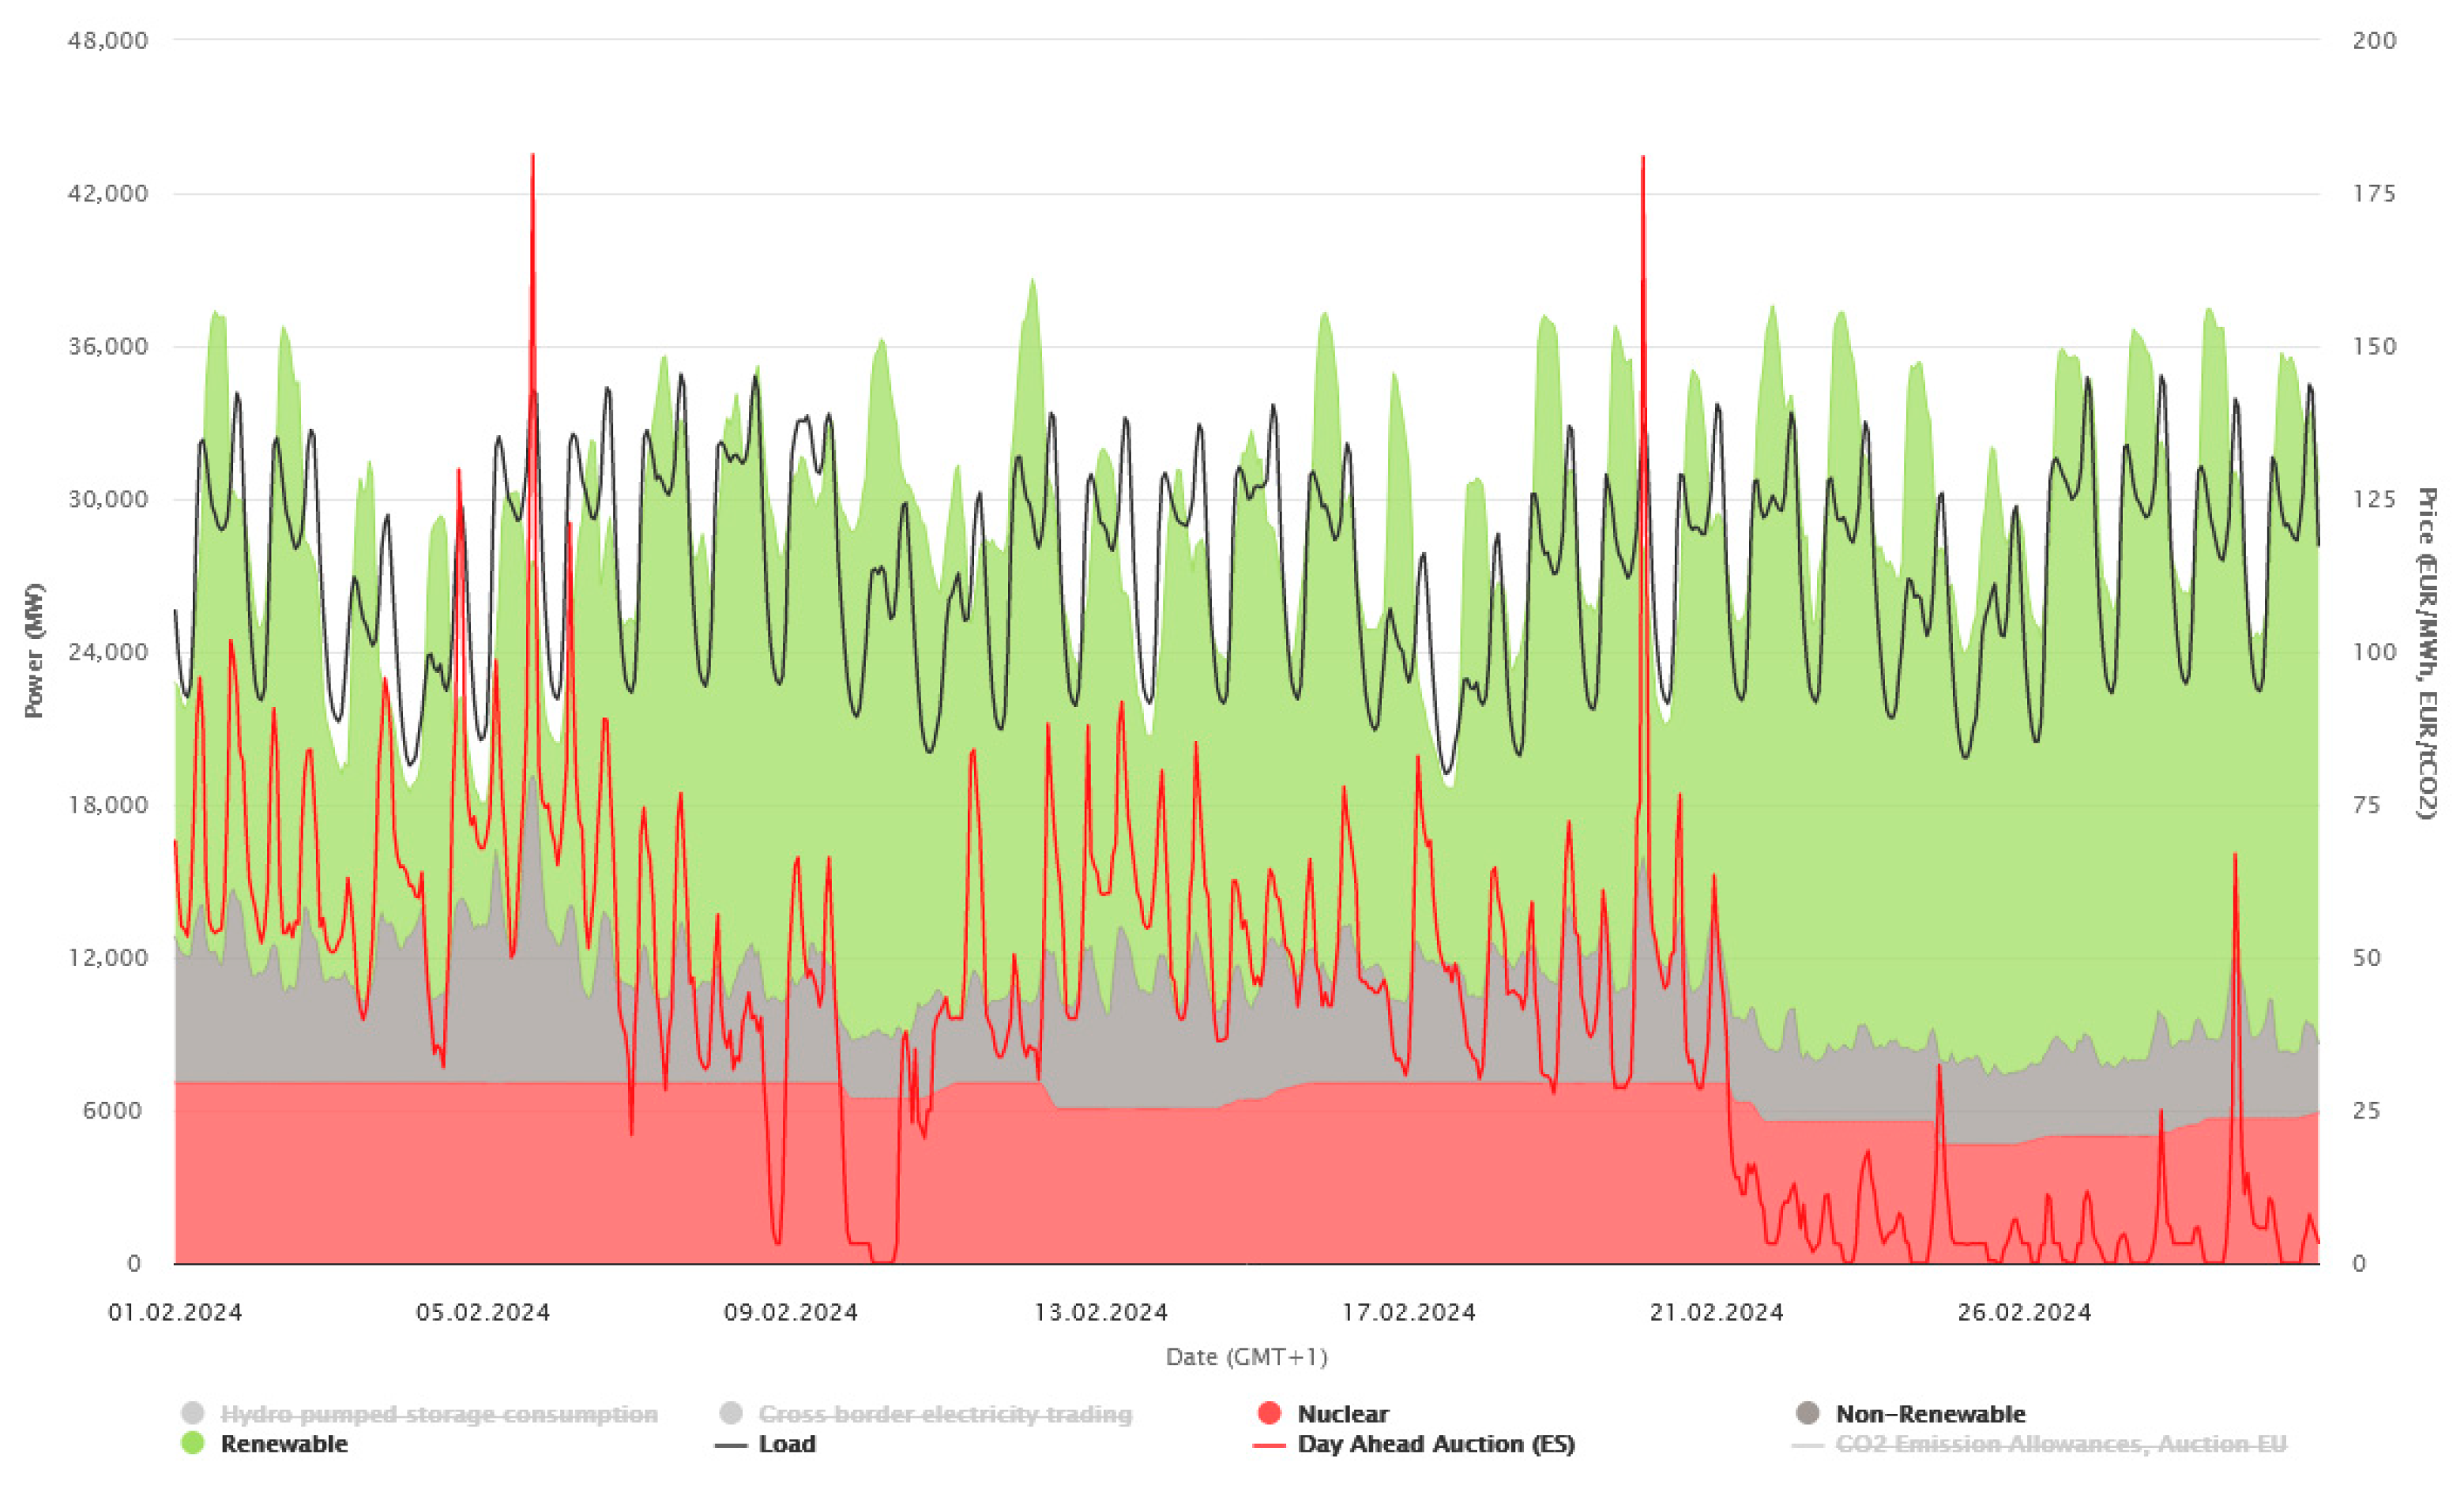
The analyzed price “incident” in Spain (where the energy prices dropped to zero at certain times of the day) began on 21 February 2024 and concluded during the period covered by the analysis presented in this work. The impact of this development remains uncertain, as the situation has been evolving since 7 May 2024. It has now extended to several other EU countries and has reoccurred in Spain. From the demand side, before and during the “anomaly”, there have been significant changes. Demand for electricity changes in a normal daily rhythm. We observed established patterns in energy demand: a morning peak driven by industrial activity, an evening peak associated with residential use, and a significant reduction in demand during the night. Weekly rhythms also followed expected trends, with noticeably lower energy consumption over the weekend. Analyzing the price of energy: before the incident, it oscillated, including a drop to around zero and a rise to high values related to the evening peak. In previous years, Spain’s energy market was characterized by high price volatility, comparable to the Polish market. During periods when all renewable energy sources (RES) were operational, the average electricity price tended to be lower, with prices around zero occurring more frequently—particularly during times of energy overproduction. This overproduction comes from the supply side of energy production. However, due to the lack of comprehensive and accessible historical meteorological data, it is difficult to estimate the potential output of renewable sources during the analyzed periods. Nevertheless, bearing in mind EU legislation, it can be assumed that it reflects something close to the maximum possible production from these sources at any given time market data. Figure 3 shows this market behaviour in Spain.
The high price volatility in Spain would explain at least one of the features of this “price incident”—silence in the media (including industry media).
The approach seems to be burdened with certain errors:
(1)
The duration of the incident is ignored.
(2)
A low price benefits buyers but could pose a risk to the financial stability of electricity producers.
This paper will try to propose a different explanation of this incident and show that the adopted price-setting mechanism on the day-ahead market is at least partially responsible for depriving most of the suppliers of this market of revenue. Consequently, either this mechanism should be modernized, or the high instability of the day-ahead energy market should be expected, which could already lead to an energy production crisis. If the price-setting mechanism in the day-ahead market is not modernized, the market may experience long-term price oscillations. These could take the form of sharp, square-wave-like fluctuations with steep slopes, pronounced intra-day volatility, or a combination of both patterns.
Market data indicates a tendency for both situations to arise—the analyzed “incident” did not cancel daily variability. The question is whether the system (PS + market) will remain stable. The consequences of instability will be painful for everyone, and especially for the “population”.

5. The Situation in Spain—Towards an Analysis

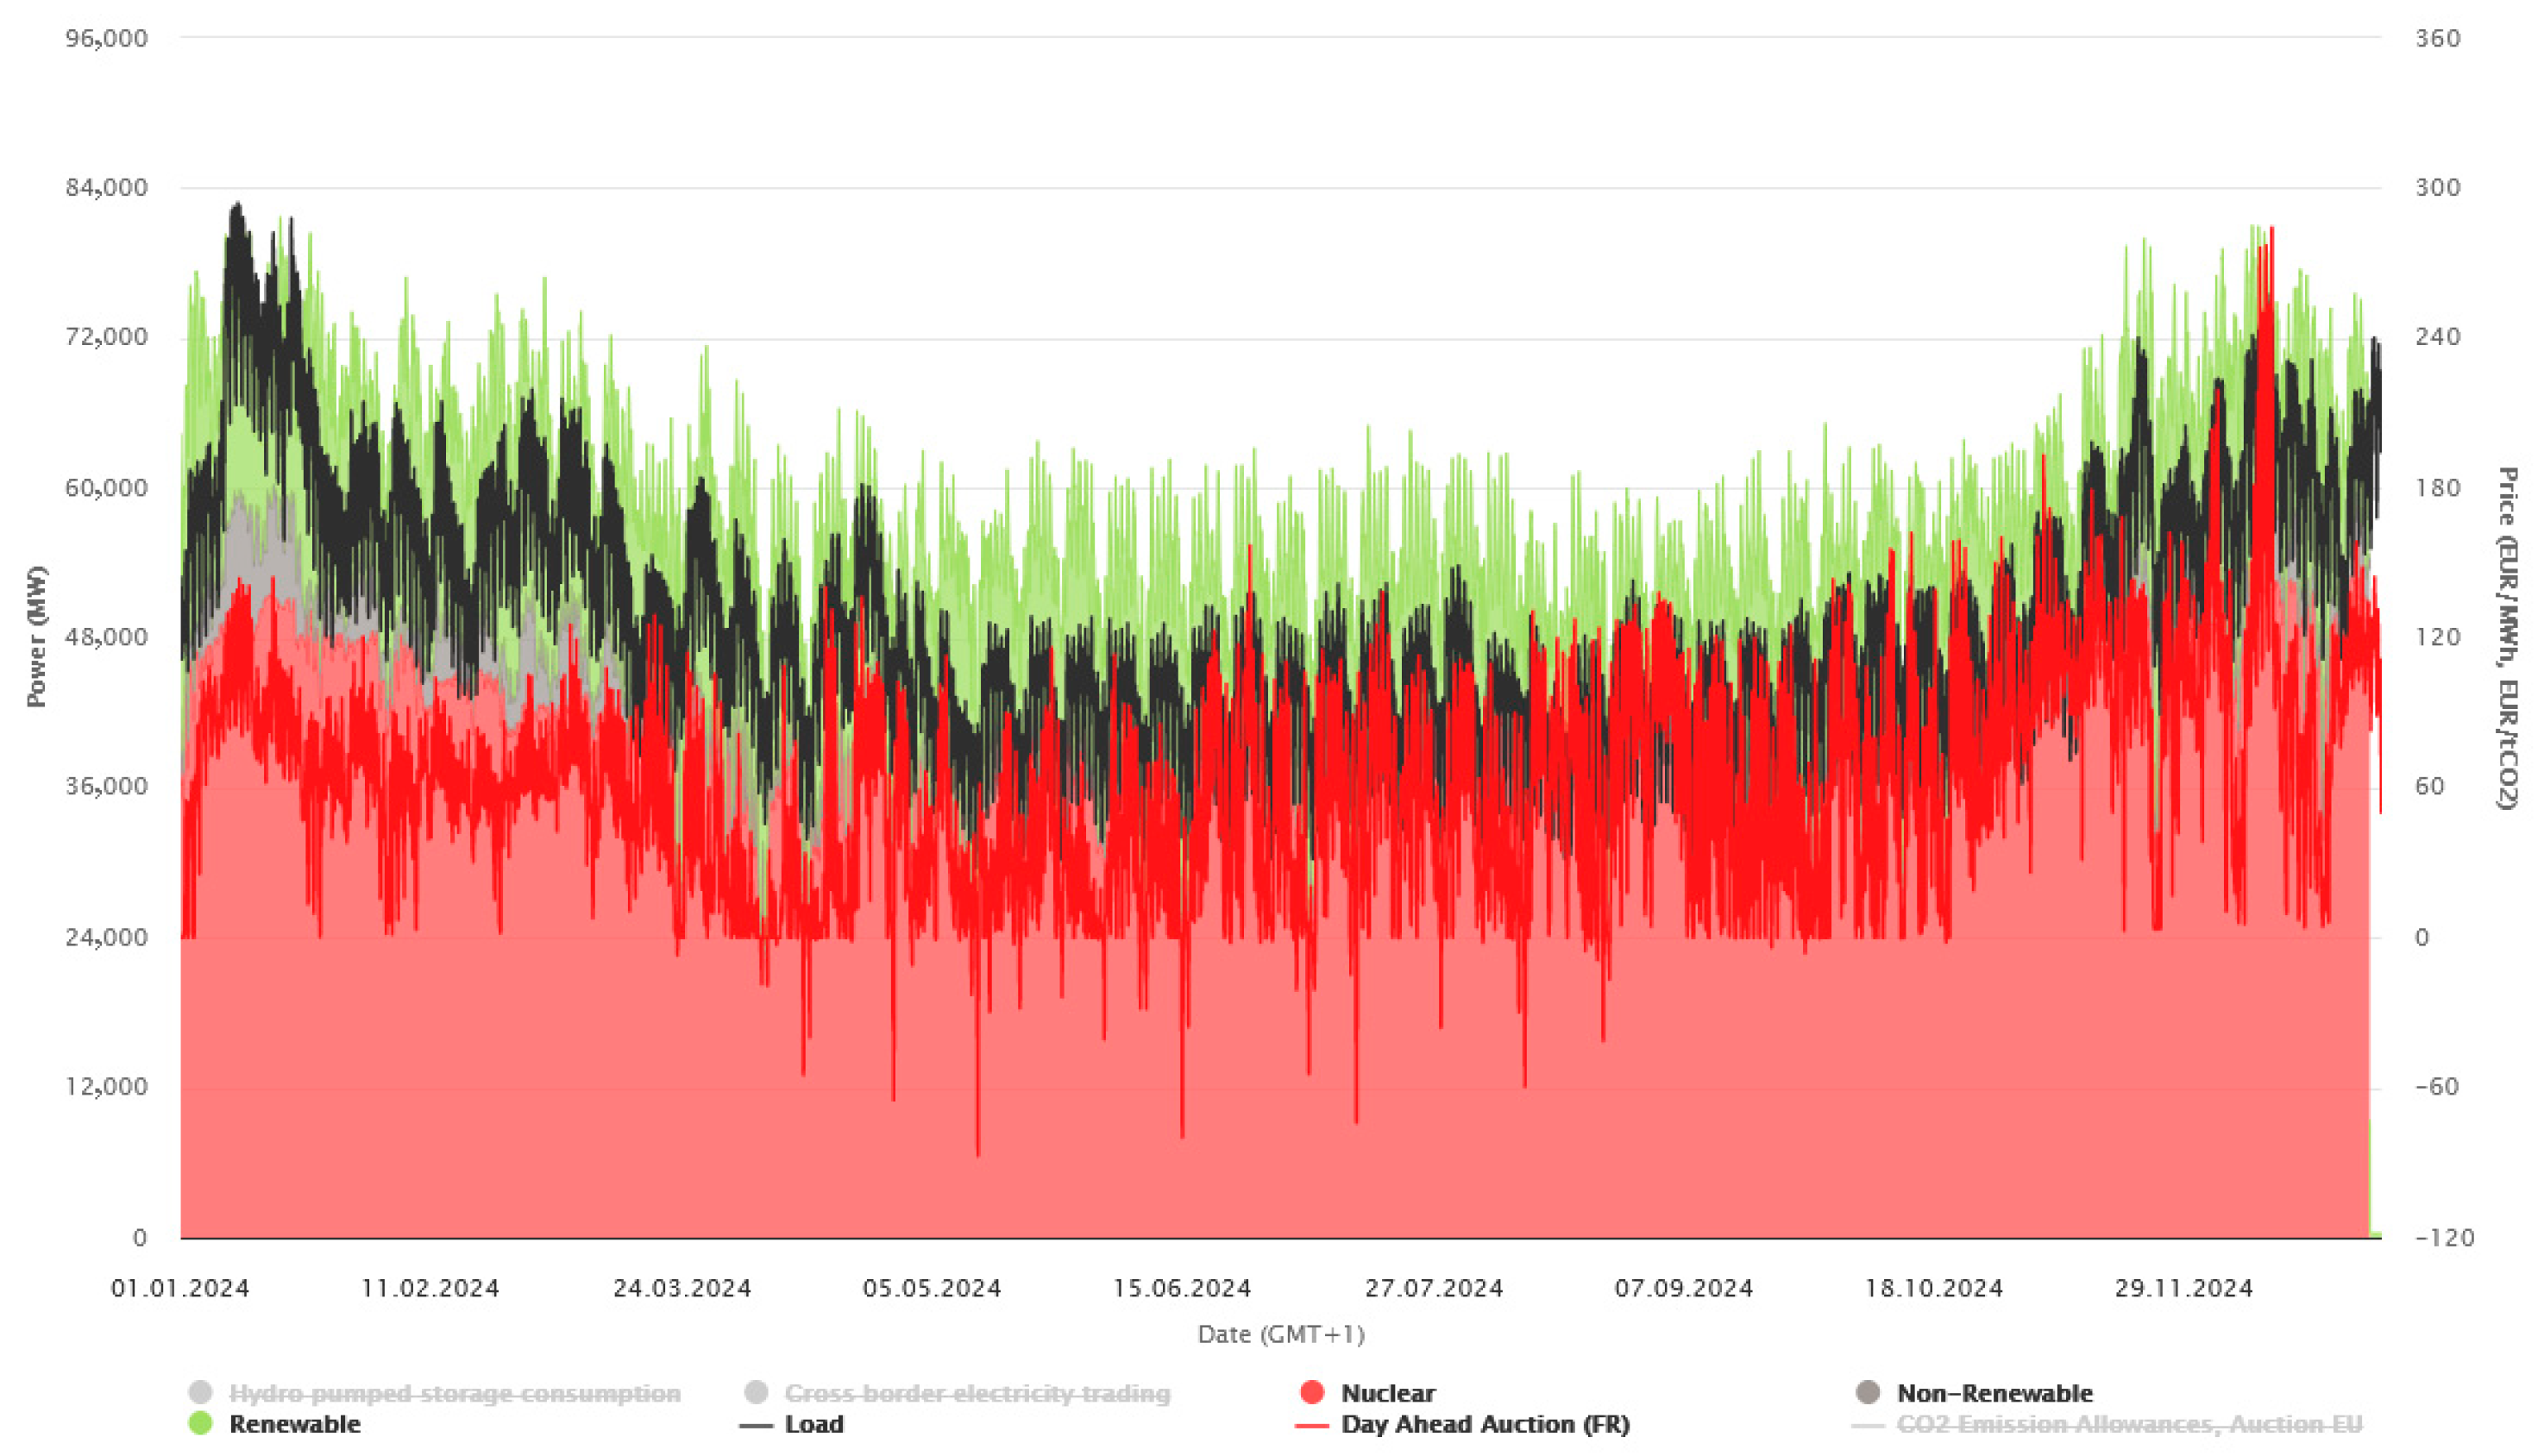
Putting the “price incident” in Spain in the right context requires providing information from neighbouring markets. In Portugal, we observe almost the same behaviour for energy prices as in Spain, and the situation in France is shown in Figure 4. Analyzing the French situation, it should be assumed that the markets of these two neighbouring countries (Spain and France) are weakly connected, or the size of the connection is limited. In France, we observe significant energy price oscillations, but these occur around a much higher average price level. Notably, despite the majority of electricity being generated by nuclear power plants, periods of zero energy prices still occur. This is illustrated in Figure 5. It is worth noting that energy prices in France in the period shown are higher, so the intersystem exchange is more likely to affect the price increase in Spain. The possibilities of energy transmission between France and Spain are small and do not affect the market situation on the Iberian Peninsula.
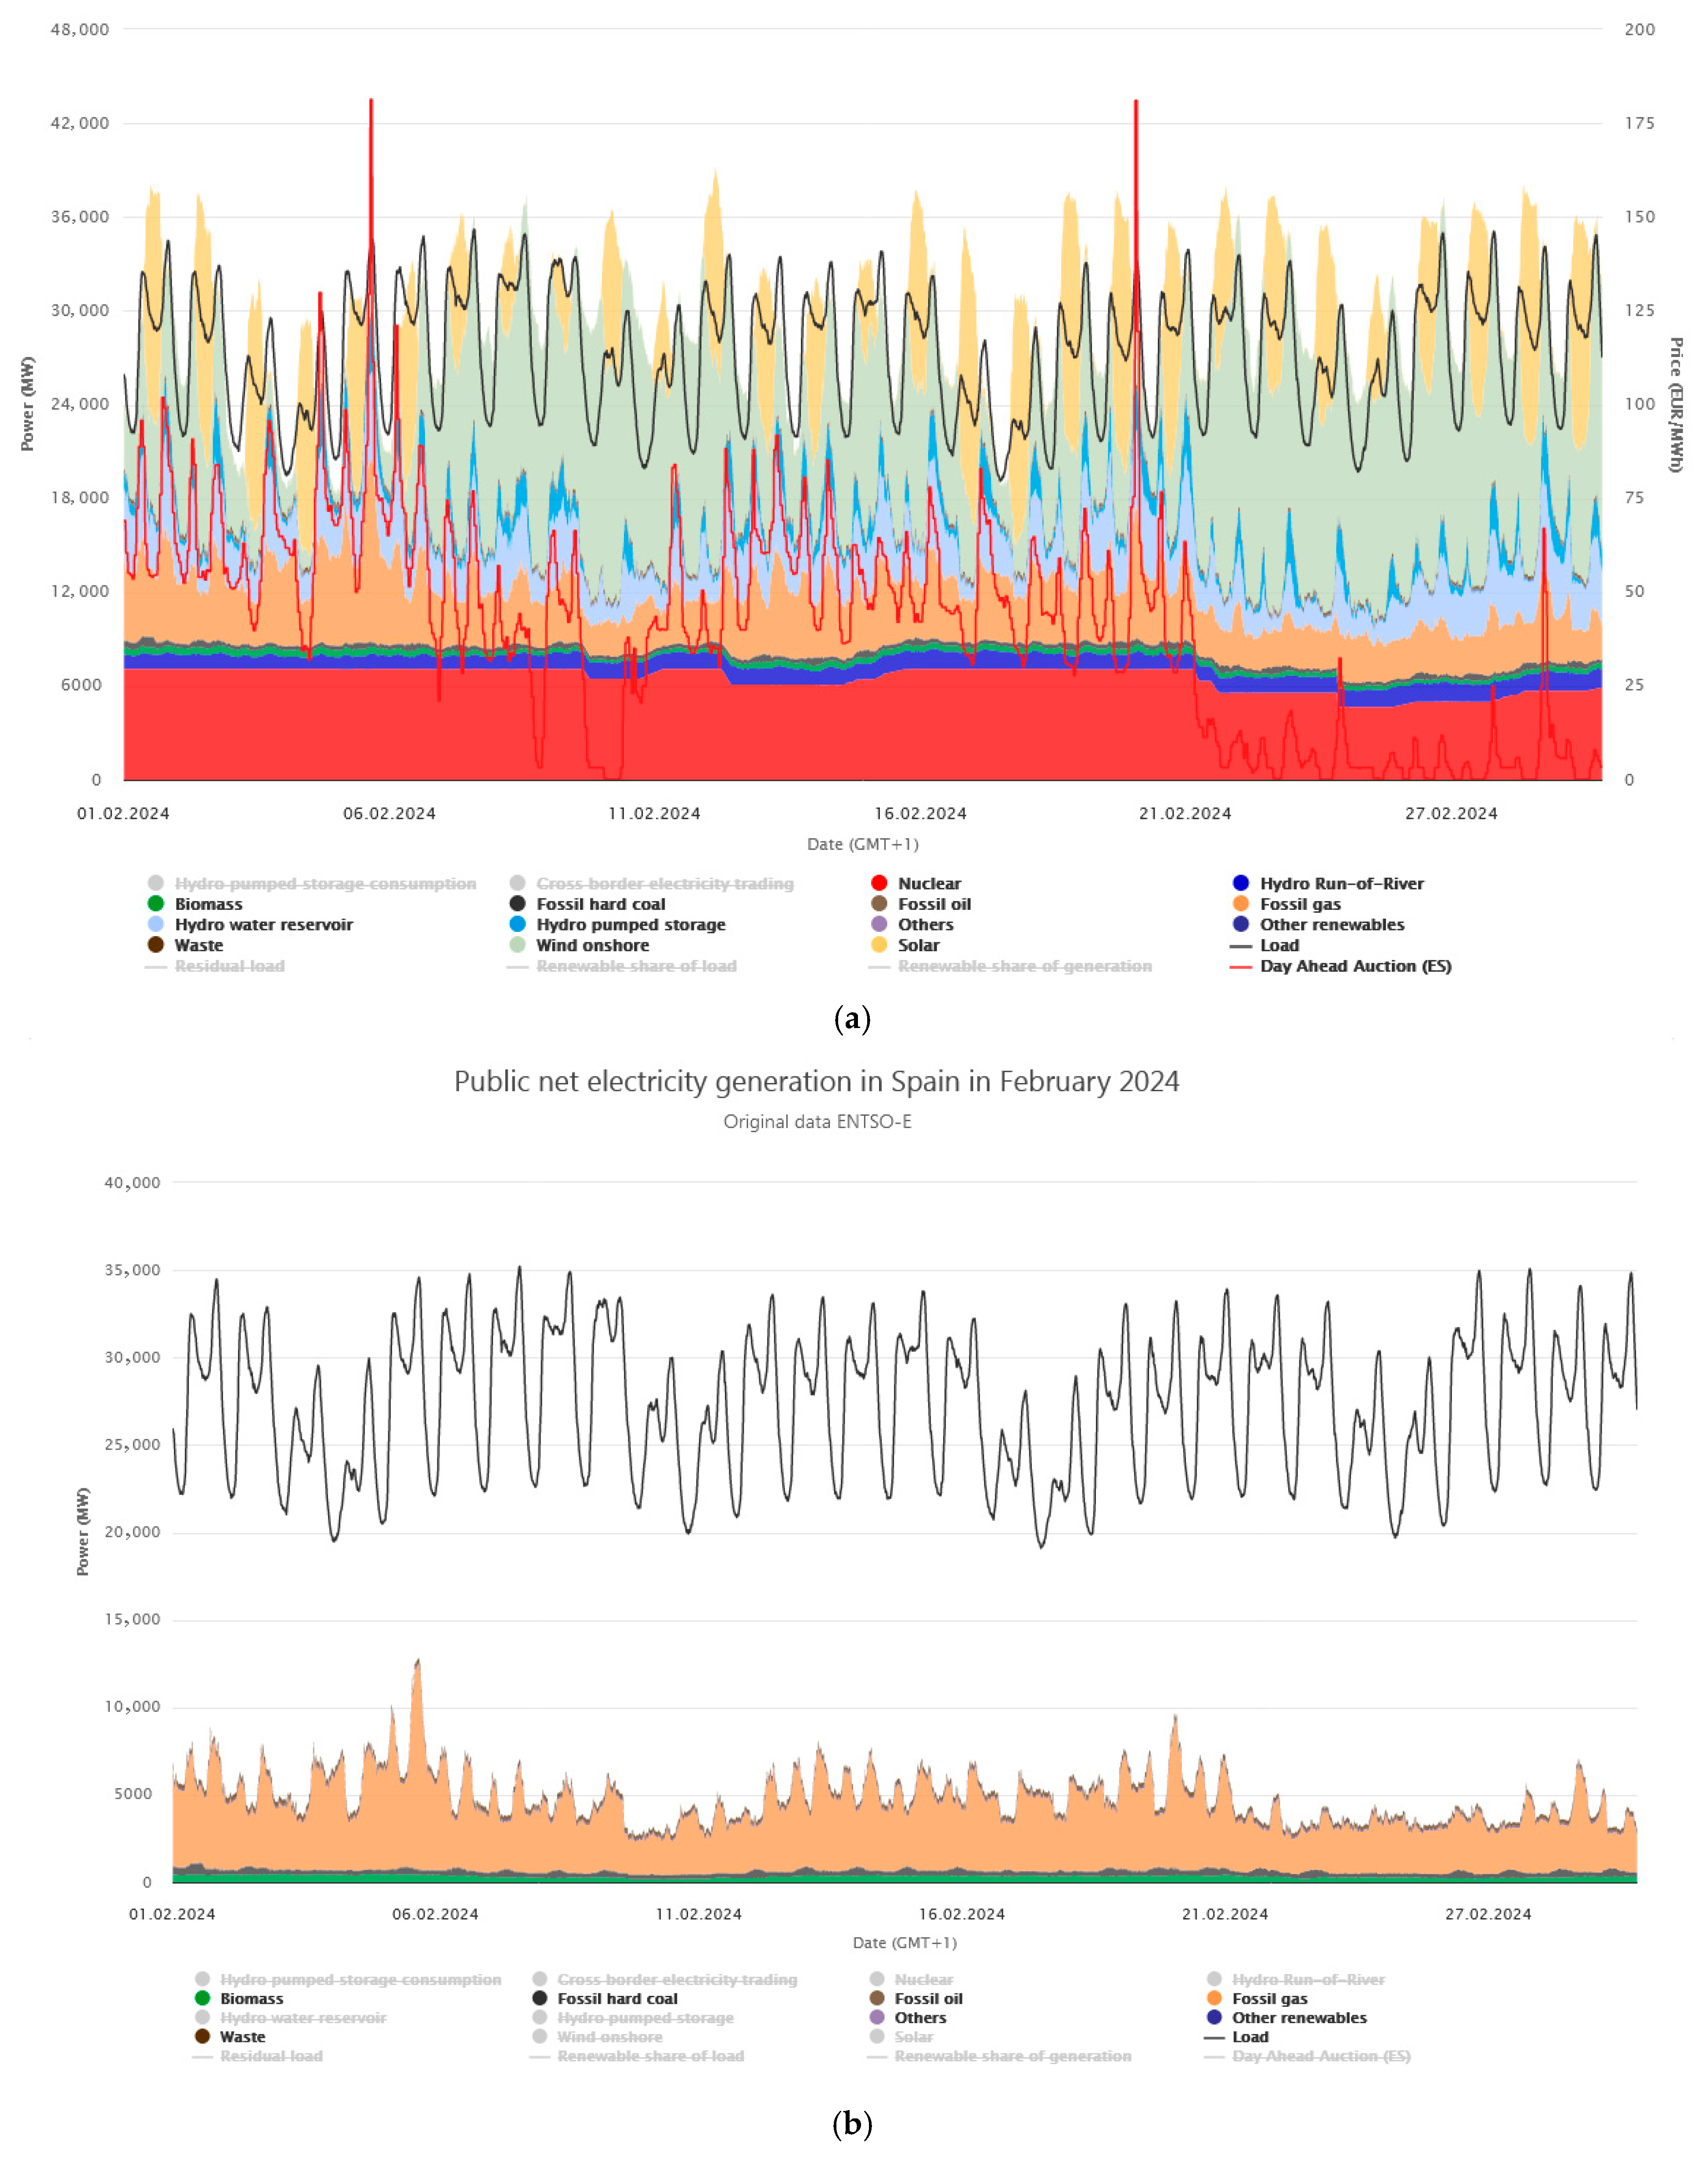
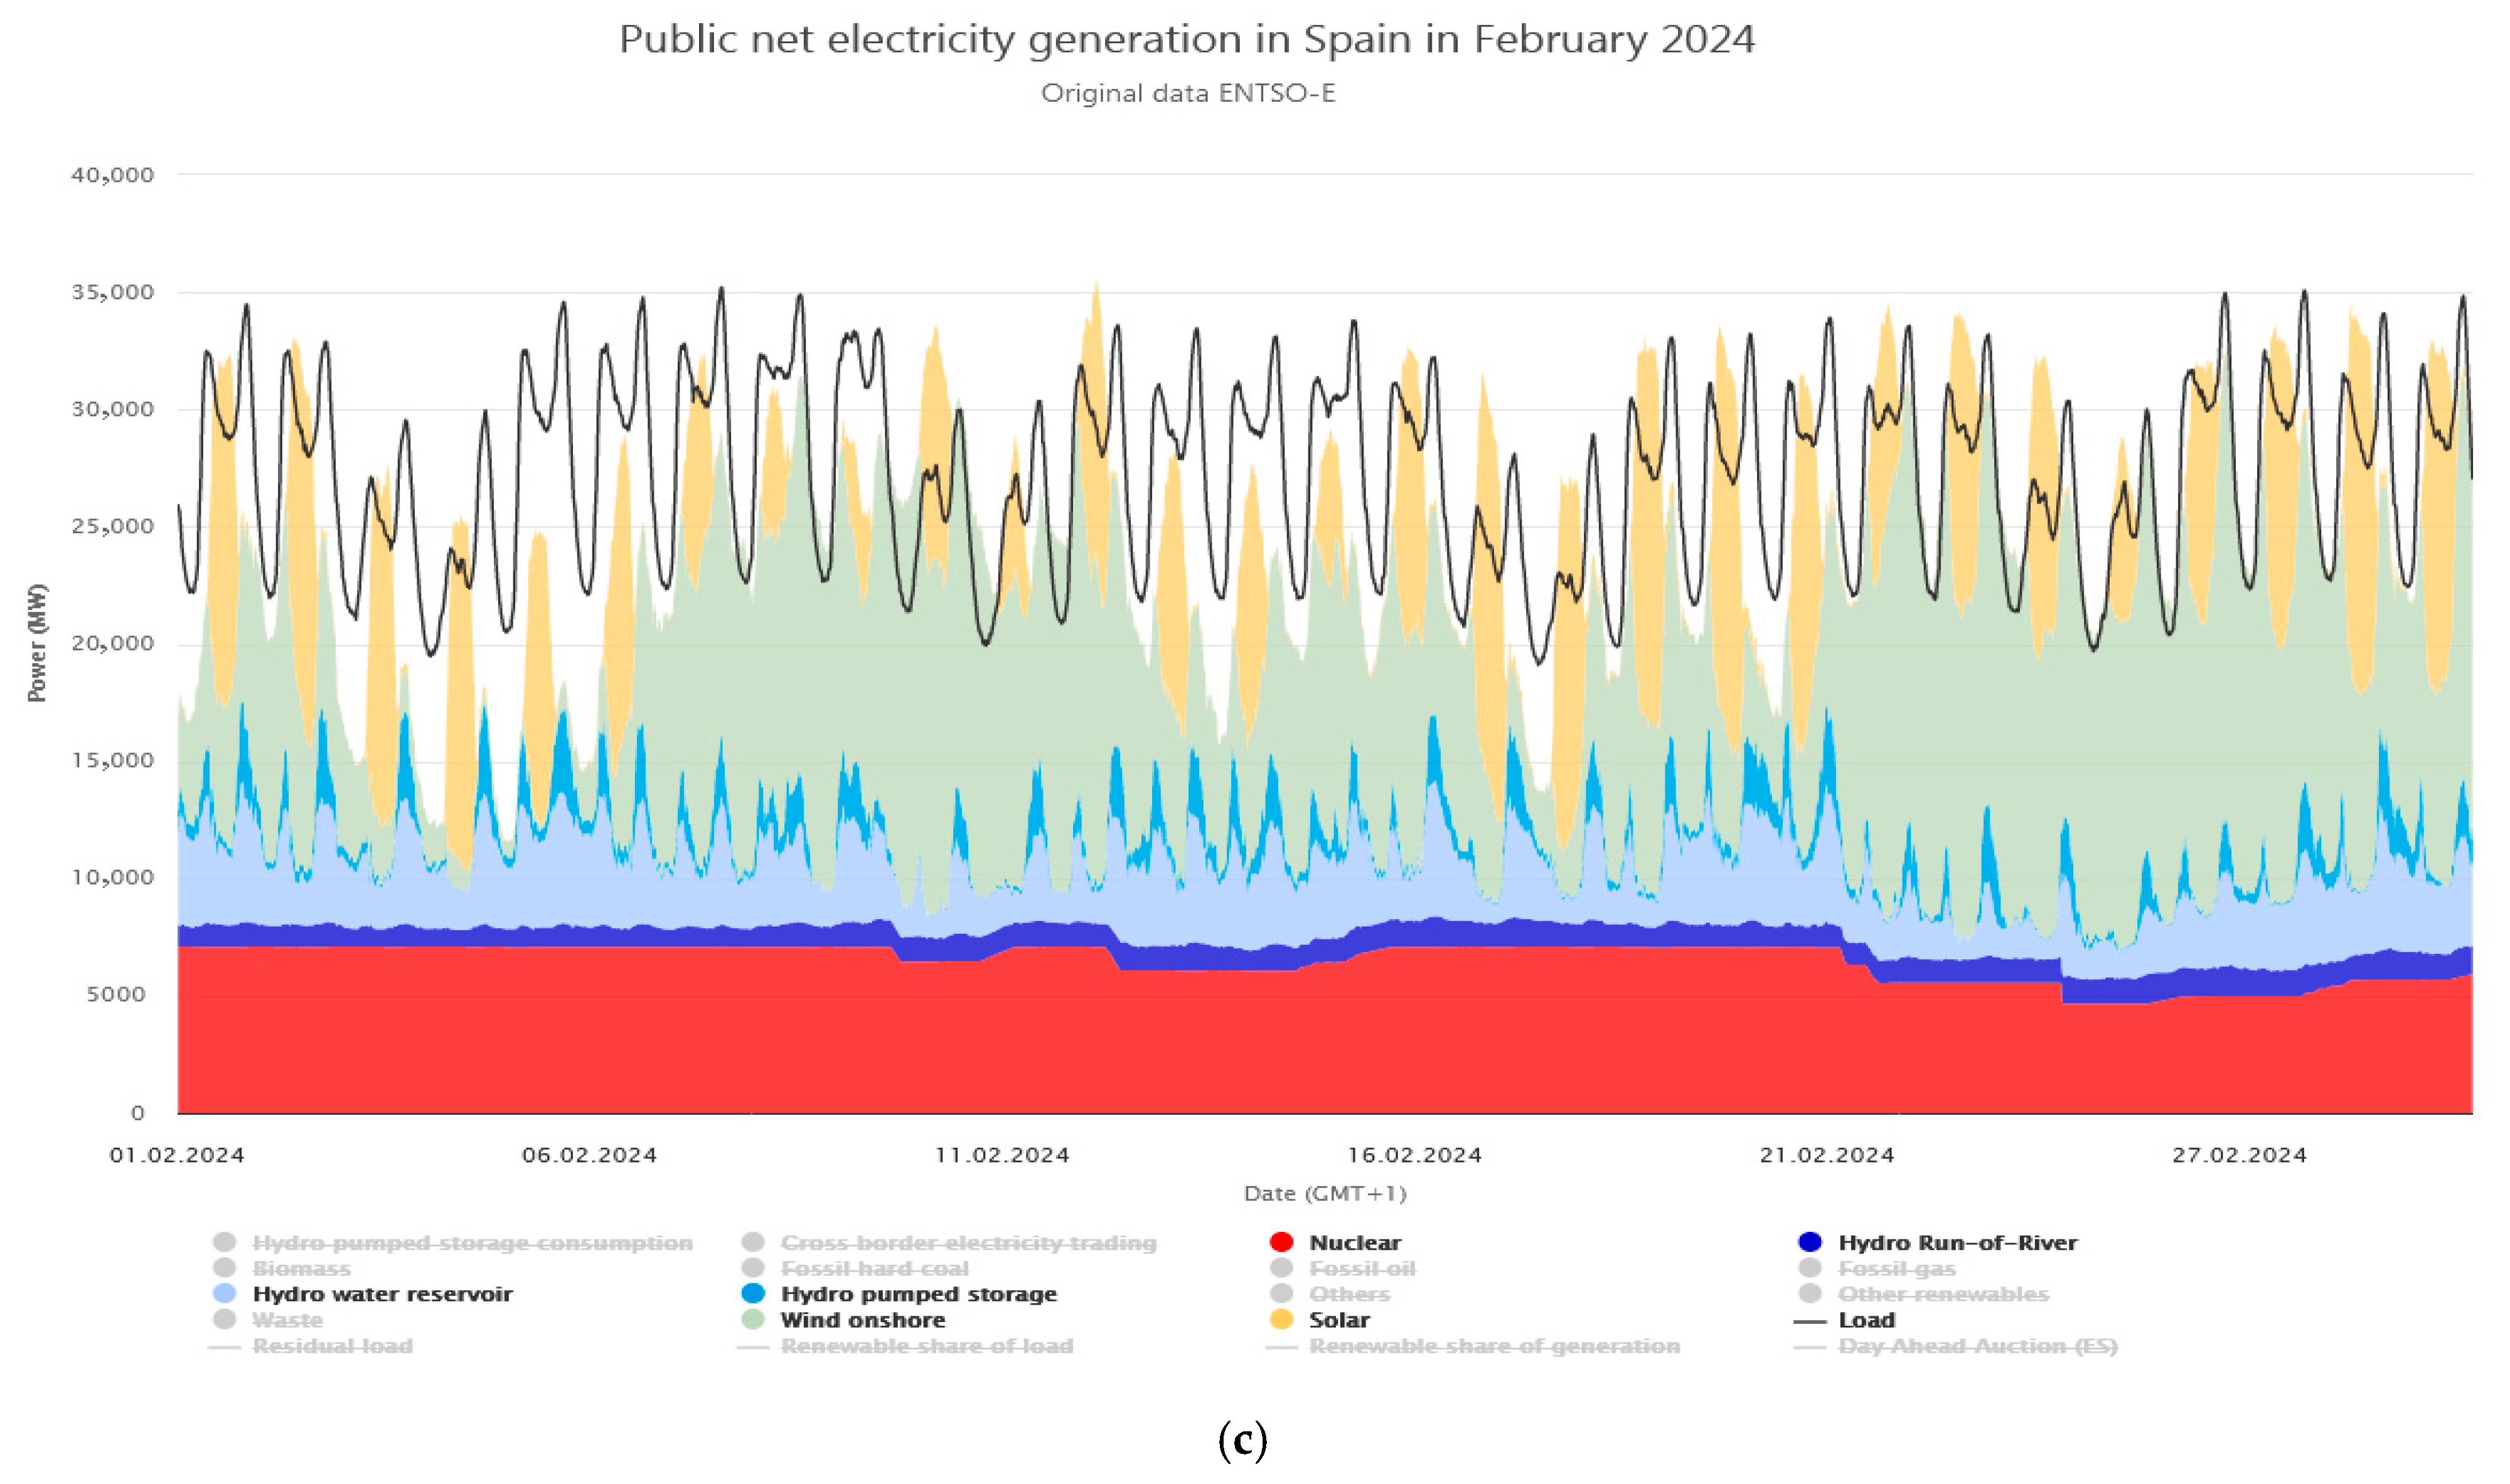
For further analysis, the information should be supplemented with more detailed information on the structure of the Spanish energy system, as shown in Figure 6a–c.
We will start the analysis of the above figures again with an observed abnormality. In the group of “secondary actors”, attention is drawn to the low dynamic behaviour of units using natural gas as fuel. Possible explanations include the following:
  • Electricity is produced in combination with another process, and this is what determines the dynamics.
  • Gas power plants operate using the Rankine cycle (gas–steam units or even fired with gas instead of coal), and the limitations of the steam element determine the dynamics of the source.
  • Current gas prices are so low that their cost situation becomes comparable to nuclear power plants, PV, or wind farms.
The remaining sources in this group are of marginal importance.
The main actors in system reserves—such as pumped-storage power plants and other energy storage facilities—help ‘buy time’ for other energy sources to respond to the evening drop in photovoltaic (PV) generation. In theory, they should influence electricity prices during evening peaks. However, in practice, these facilities either do not actively participate in the market or are involved through separate mechanisms, providing essential system services rather than engaging in standard market operations.
Hydroelectric power plants with impoundments try to operate like pumped-storage power plants but have lower dynamics. If this type of power plant is controlled too dynamically, several unfavourable phenomena occur. In Poland, these phenomena are clearly visible in the areas of Kraków and Oświęcim [82,83,84]. Furthermore, generating electricity is usually not the main task of dam reservoirs, although it is possible to settle them for the provision of system services.
Regarding nuclear power plants, the literature sources are contradictory in terms of their dynamics. Some sources suggest they offer significant regulatory capabilities, while others claim they have practically none. However, these features are highly dependent on the specific reactor design and the stage of the fuel cycle [85]. Taking them out of operation can cause longer operation breaks of up to about a month. Analyzing the behaviour in various SPs in Europe, one can observe a reluctance to change the production of this source in any way. It is hardly surprising, as testing safety procedures was probably the cause of the Chernobyl accident.
In solar and wind power plants, as well as run-of-river hydroelectric power plants, the amount of power produced can only really be regulated downwards, but with high dynamics. This kind of regulation requires the inclusion of these sources in balancing PS and market procedures. However, we cannot regulate the production of renewable sources upwards—they will provide as much energy as is currently available under given weather conditions.

6. Structure of the Costs

Nuclear, wind, and solar power plants share a similar cost structure: the bulk of their costs are concentrated in the initial investment and eventual decommissioning. In contrast, their ongoing operational costs are relatively low.
In operating costs, the bulk are fixed costs (independent of the production volume). Variable costs (proportional to the current production volume), consisting mainly of “fuel,” are either free or at a ridiculously low price per unit of energy. There is also nothing to suggest that the rate of consumption and the probability of failures depend on the size of the current production or volume of energy.
It should be noted that the “main” actors mentioned in the analyses are the target energy mix in the EU (some doubts apply only to nuclear sources), and the analyzed case can be treated as predictive.
Let us consider variants of the market game for an electricity source with low variable costs and high fixed and investment costs:
  • The source declares a price of 0 for energy and sells the entire production; makes money if the price of the most expensive selected supplier is higher than its costs, and records losses when it is lower.
  • The source declares a “satisfactory” price for energy, this price is higher than the most expensive selected supplier; it does not sell anything and is forced to stop generating, so it may incur additional costs of regulation and shutdown.
  • The source declares a “satisfactory” price and sells all production (the most expensive supplier was more expensive); it makes money, but competitors also make money.
  • The source declares a “satisfactory” price and sells part of the production; either it makes money or not (not only the price but also the sales volume counts); competitors make more money (they sell all production).
To sum up, the source does not sell enough energy, which means it creates losses. It can therefore be seen that the energy market for each of these suppliers (sources), with the current price setting mechanism, can be described as a game of chicken [86,87]. Let us define a crash as selling energy below cost (price 0), being a chicken as offering a product at a price that guarantees profit (or at least a refund) and no sale. It is also worth noting that the crash situation (selling energy for (0)) and the situation of being a chicken (the player backed out—he gave a “satisfactory” price and the market price turned out to be lower) are equally costly, or even the situation of being a chicken may mean higher costs! What is the optimal strategy for a rational or super-rational player in this situation?
If, in a purely hypothetical situation, only players for whom this game is a game of chicken enter the game, and the cost of being a chicken is equal to the cost of a crash (i.e., only NPP, PV and wind turbines will be sold on the market), then theoretically the game changes into a “prisoner’s dilemma”. In this case, it is a game for n players simultaneously, not two. In the case of a large number of players, cooperation strategies seem much less stable because there is a low probability that the tit-for-tat strategy will lead to an evolutionarily stable situation and cooperation; moreover, there are no additional benefits resulting from the adoption of the cooperation strategy (reputation) on the energy market and any attempts at agreement between market participants (parties to the game, suppliers) are combated by law [88,89]. In this situation, the “Spanish incident” should be considered an example of the operation of an evolutionarily stable strategy.
Analyzing this incident further, we observe a significant impact on the prices of unpredictable wind generation; a decrease in its value temporarily knocks the market situation off the attractor (price oscillation very close to 0). Increasing wind generation causes a return to the attractor. All players have equal access to weather forecasts (information). Incidents of leaving the attractor occur mainly around the energy peak of the “population”, so they benefit less in the short term from this situation.
In principle, we can expect a war of attrition (buyers are happy), until a sufficient number of energy supply players go bankrupt, and then a sharp increase in prices is expected (buyers are no longer happy), and then everything depends on whether new players enter the game; so the rollercoaster starts all over again. When new players do not enter the market and the price of energy will reflect production costs plus a large risk premium related to the instability of this particular price-setting mechanism in the long term, and prices increase.
Taking into account the annual variability of energy production and consumption, we can predict leaving the attractor in the autumn months, but it is problematic to predict the winter price level, and the longevity of the incident weakens all suppliers. This situation seems to be particularly damaging for PV, with price rebounds occurring when it is not producing (evenings and expected price increases in winter).

7. Conclusions

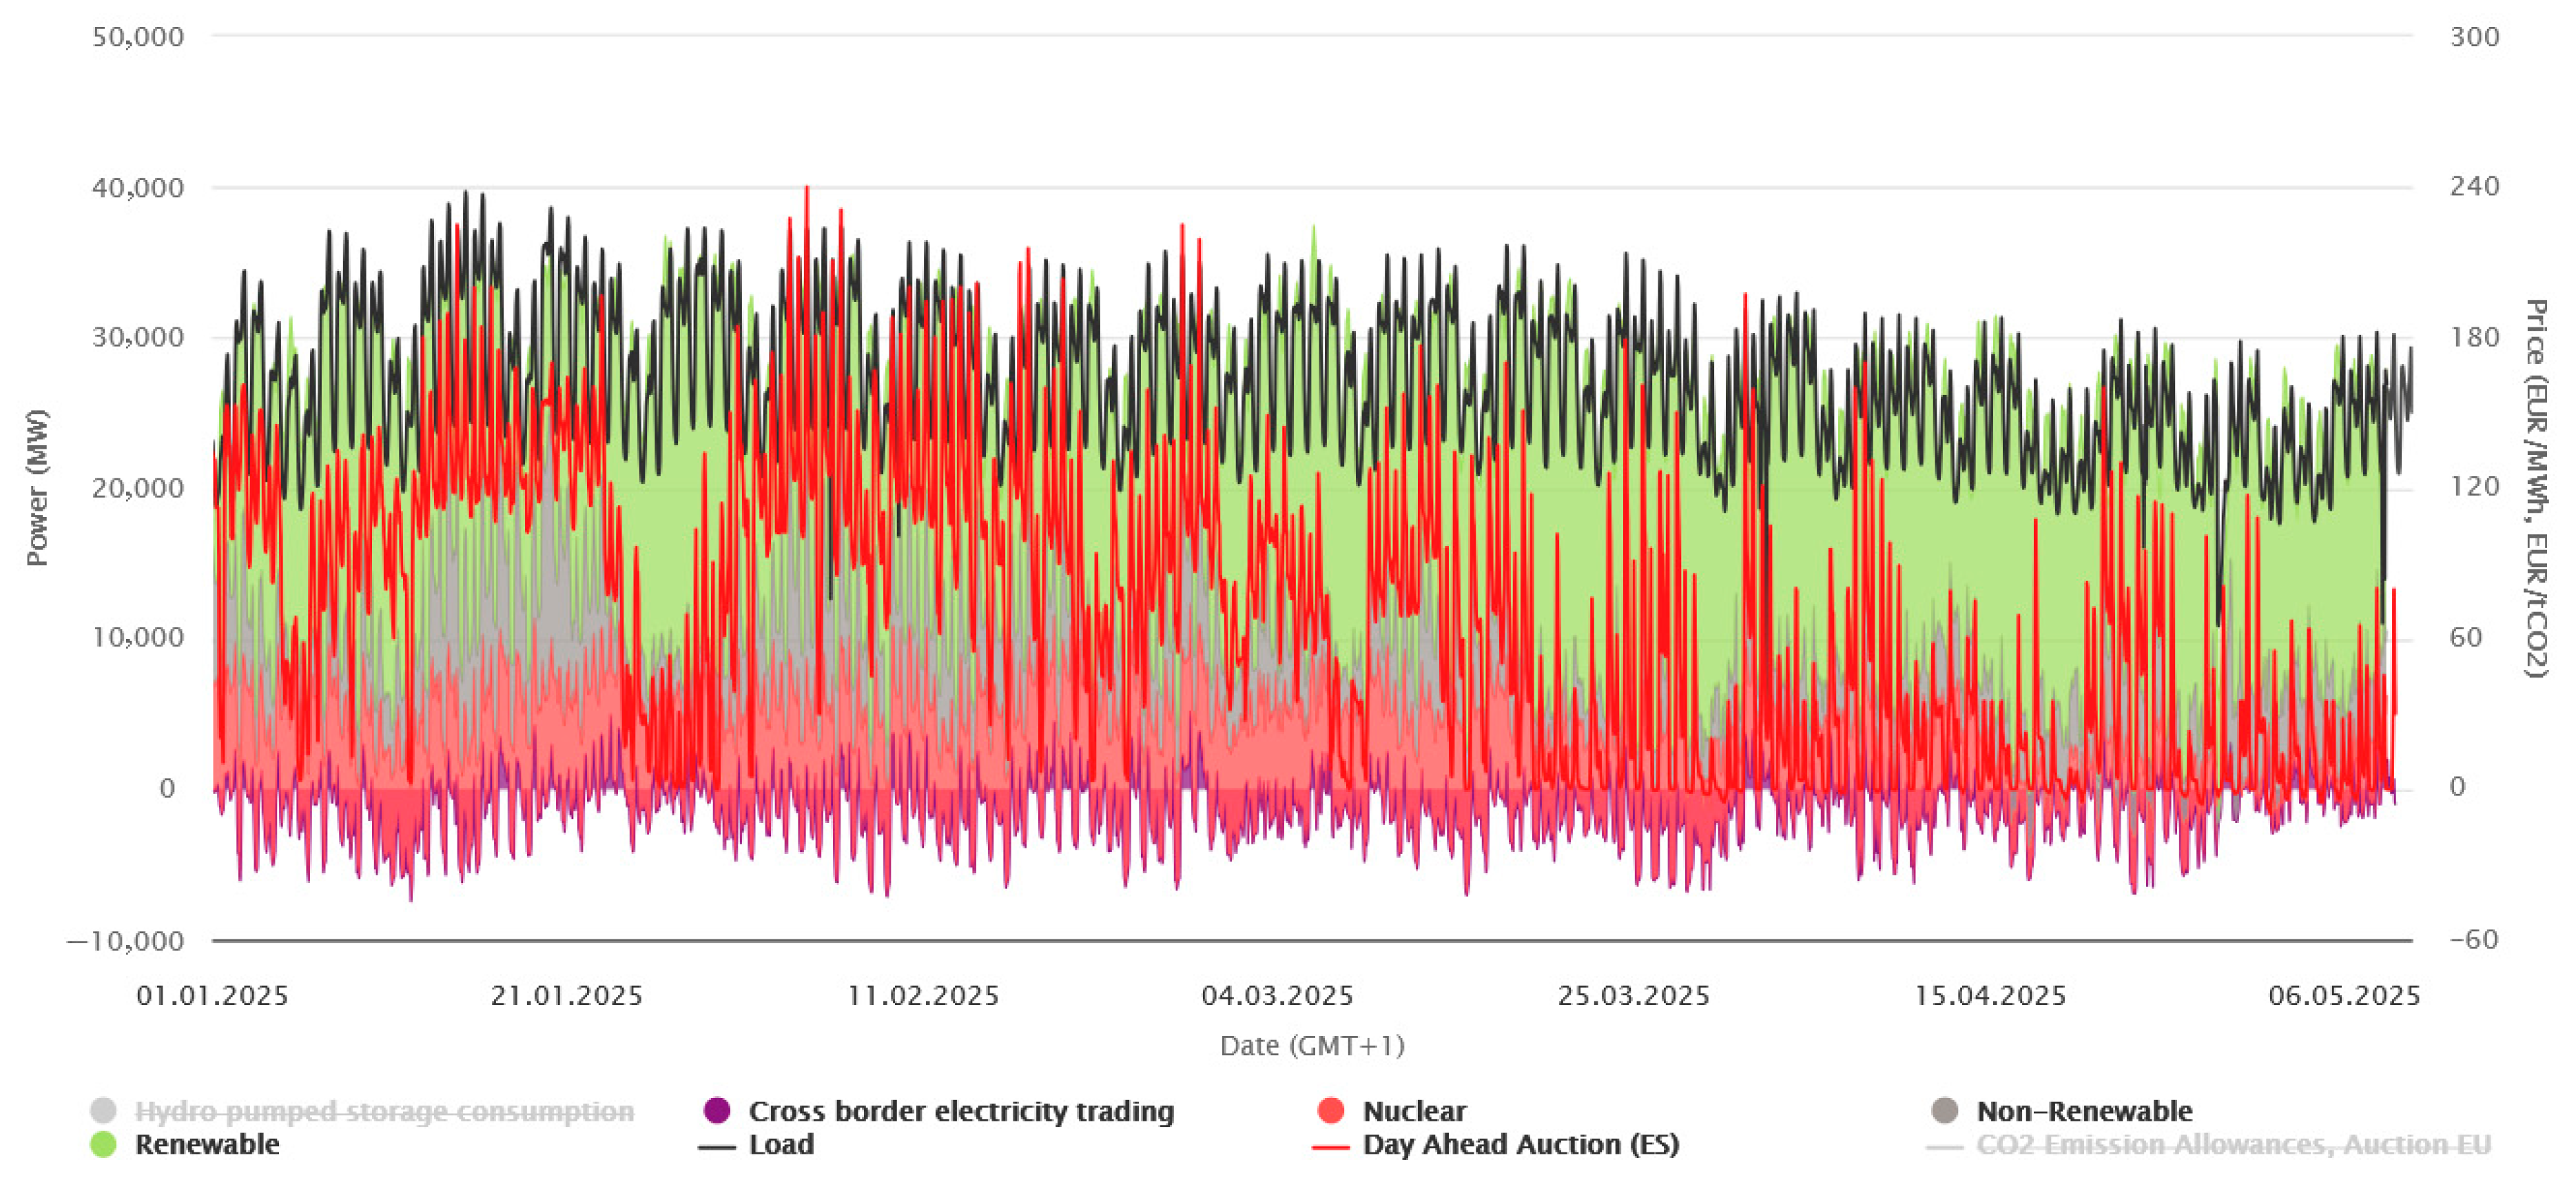
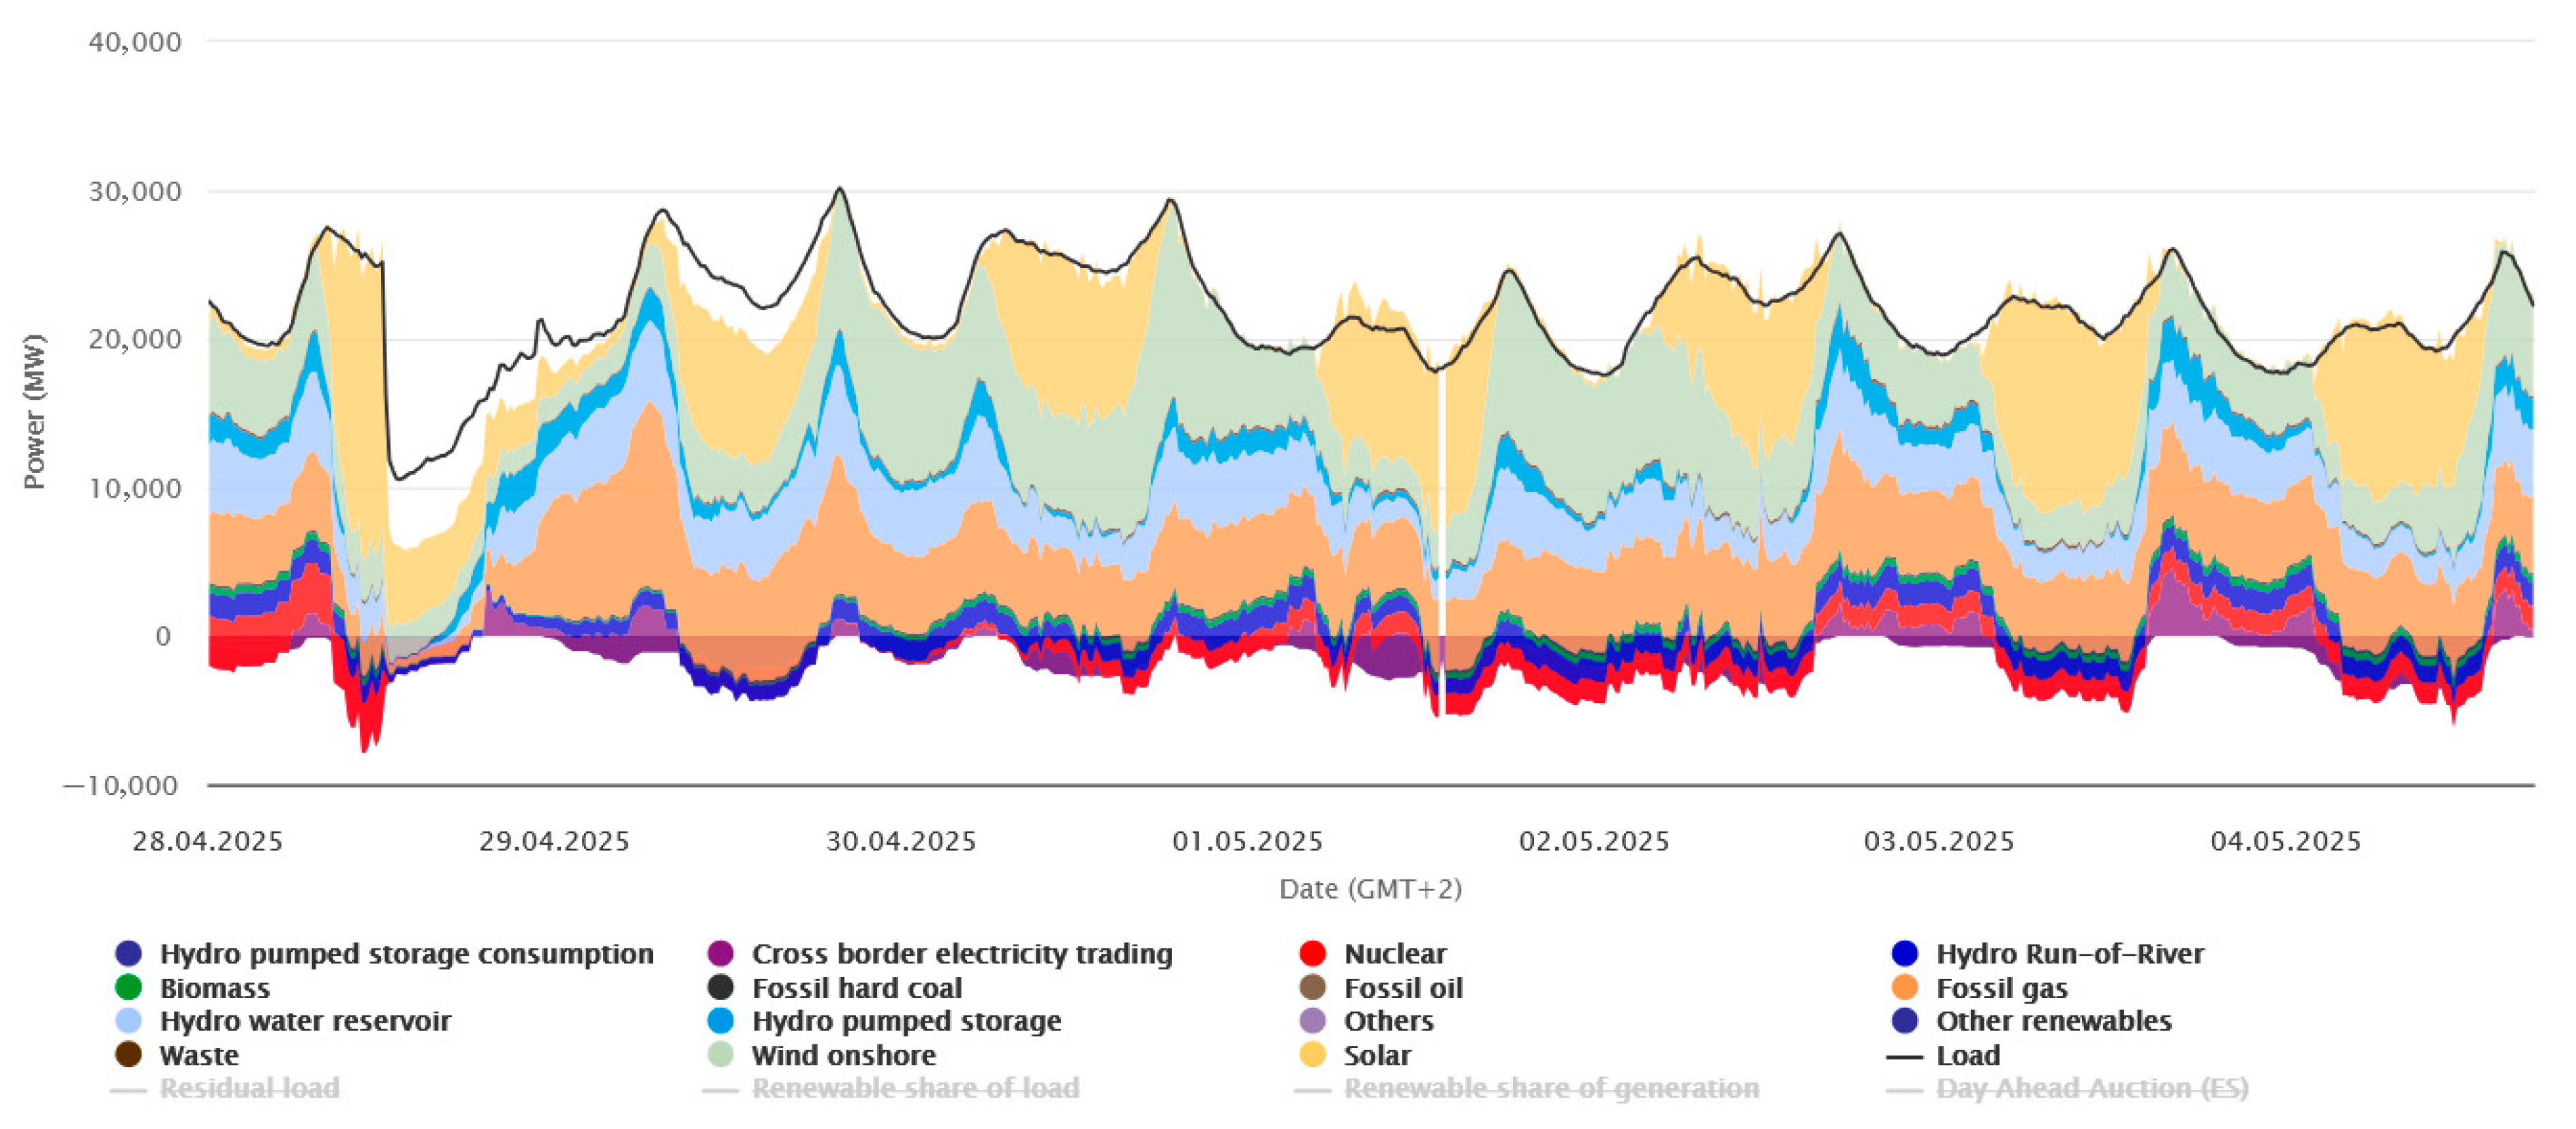
The price structure in Spain in 2025 repeats those from 2024 (Figure 7), plus there was a blackout on 28 April 2025 for unknown reasons while the system worked with a large share of RES. Figure 8 shows what types of energy sources were utilized in Spain during “blackout week” and what sources were used to reconstruct the power system to stable working conditions.
As already noted, NPP, PV, and wind have “negligible” CO2 production, and are supported by EU legislation and finances. When analyzing the means of energy production in a given system, it should also be recognized that these sources should also provide system services (ensuring power reserves, dynamic changes in production volume, or maintaining P-f balance)—the expected share of other sources is already or will soon be too low to provide such services. On the other hand, the current price-setting mechanism on the day-ahead market effectively discourages the expected future major producers of electricity from doing so.
As already mentioned, industrial demand is correlated with the hours of availability of energy from PV, so an additional fact to consider is that it is the population that will be forced to pay higher prices (evening phenomena). The question also remains as to the degree of storage utilization in a system containing wind and solar power plants. This, in connection with the required energy availability, will affect the required capacity of energy storage in the PS, which in turn will affect how many of them will be able to operate in a 24 h rhythm. Fragmentary information that energy storage is a very good technology and has a very short rate of return should be placed in the appropriate context. The question also arises whether the use of this new technology prevents paying penalties for exceeding the connection of installed power and energy capacity at this point.
It should be recognized that the occurrence of the Spanish “price incident” has already exposed the imperfections of the current price-setting mechanism and will also cause major turbulence on the energy market and, consequently, the financial market.
Additionally, it should be noted that when discussing the costs of electricity, its lack or reduction in supply can be much more costly for recipients than any energy price fluctuations observed on the market. In a situation where the EU promotes renewable sources, i.e., turbulent PV and wind farms, and the costs and possibilities of energy storage are what they are, it seems reasonable to build a power system with large overproduction in favourable weather conditions and with oversized network infrastructure in relation to the currently existing one. Such an approach will reduce the probability and duration of incidents of limited energy availability, but on the other hand, it will significantly increase costs, and higher infrastructure expenditure will be necessary. In such a system, the probability of events of the type currently observed in Spain (energy overproduction from RES) will also increase.
A further effect of the lack of modification of the price setting mechanisms on the day-ahead market may be a repetition of the situation that led to the energy crisis that affected California in the 1990s and was caused by political and economic factors [90,91,92,93,94,95]. By leaving only the current price setting mechanism, we risk perpetuating the unstable situation and moving very dynamically from the overproduction crisis to limitations in the availability of electricity. And this situation is not profitable for anyone.
It should be recognized that in the current legal and technological situation, the possibilities of increasing the penetration of the power system by PV are ending. At least the price-setting mechanism on the day-ahead market should be quickly changed, or the increase in the share of PV in the PS should be abandoned. The third option is to abandon market mechanisms in the power industry. However, it should be taken into account that errors made in legal solutions will increase the risk of blackout.
When building a new price-setting mechanism, experience from other fields should be used. It is suggested to use simulation techniques and perform something like war games. It should start with defining the goal and then what target situation we expect in terms of the resulting energy production structure, frequency of energy availability limitation and infrastructure costs, and social costs. Due to the broadness of the issue, the work did not consider at all the costs generated by the expansion of power grids. However, the phenomena occurring currently seem to suggest that the existing network is sufficient if the sources are fully controllable (and reliable). However, for the purposes of effective use of RES, the current supply network seems to be insufficient.
The other problems associated with energy price settings and energy manufacturers’ choice by energy system distributors (EU indications) can have an influence on power system stability and reliability, as could be seen during the later Spain blackout.
In summary, the speed of new PV construction has changed the rules of the game in the power industry. The construction of a PS with a large penetration of RES requires analysis and adjustment of its entire functioning, including the extremely important issue of energy supply stability (this work analyzed the omitted topic of “economic stability”) and adjustment of legal and organizational solutions, which should be limited by technical possibilities. Unfortunately, imposing only a few taxes and para-taxes, providing certain subsidies, and blocking discussions on “inconvenient” issues does not improve the market energy price setting system and behaviour of the PS. It is still not known how market issues influence phenomena in the power system, especially in short time periods during and after disturbances. In long-term periods, markets can change the structure of energy generation and PS itself, and our knowledge and the ways of organizing PS work, laws, and rules can be left behind requirements.
When we are getting used to the idea that production of RES is unstable, an increasing part of the PS operating costs will be fees for readiness to operate reserves and there will be a large “waste” of energy from RES since the attempts to manage the RES maximum possible production at a given moment will be economically unjustified (e.g., due to the low “frequency” of such an event).
The work was financed from the own funds of the Faculty of Electrical and Computer Engineering of the Krakow University of Technology.

Author Contributions

Conceptualization, T.S. and J.S.; methodology, T.S.; validation, T.S. and J.S.; formal analysis, J.S.; investigation, T.S. and J.S.; data curation, T.S.; writing—original draft preparation, T.S.; writing—review and editing, J.S.; supervision, J.S. All authors have read and agreed to the published version of the manuscript.

Funding

This research received no external funding.

Data Availability Statement

Data and figures are available from https://energy-charts.info/?l=de&c=DE accessed on 8 March 2025.

Conflicts of Interest

The authors declare no conflicts of interest.

References

  1. Directive (EU) 2019/944. Available online: http://data.europa.eu/eli/dir/2019/944/oj (accessed on 8 May 2024).
  2. Regulation (EU) 2019/943 of the European Parliament and of the Council of 5 June 2019 on the internal market for electricity. Available online: http://data.europa.eu/eli/reg/2019/943/oj (accessed on 8 May 2024).
  3. Regulation (EU) 2019/941 of the European Parliament and of the Council of 5 June 2019 on risk-preparedness in the electricity sector and repealing Directive 2005/89/EC. Available online: http://data.europa.eu/eli/reg/2019/941/oj (accessed on 8 May 2024).
  4. Regulation (EU) 2019/942 of the European Parliament and of the Council of 5 June 2019 establishing a European Union Agency for the Cooperation of Energy Regulators. Available online: http://data.europa.eu/eli/reg/2019/942/oj (accessed on 8 May 2024).
  5. Directive (EU) 2018/2001 of the European Parliament and of the Council of 11 December 2018 on the promotion of the use of energy from renewable sources. Available online: http://data.europa.eu/eli/dir/2018/2001/oj (accessed on 8 May 2024).
  6. Szafranski, A. Instrumenty prawne regulacji cen energii elektrycznej. Forum Prawnicze 2023, 2, 3–20. [Google Scholar] [CrossRef]
  7. Hancher, L.; de Hauteclocque, A.; Huhta, K.; Sadowska, M. Capacity Mechanisms in the EU Energy Markets: Law, Policy, and Economics; Oxford University Press: Melbourne, Australia, 2022; p. 512. [Google Scholar]
  8. Zhang, G.; Zhong, H.; Tan, Z.; Cheng, T.; Xia, Q.; Kang, C. Texas electric power crisis of 2021 warns of a new blackout mechanism. CSEE J. Power Energy Syst. 2022, 8, 1–9. [Google Scholar] [CrossRef]
  9. Busby, J.W.; Baker, K.; Bazilian, M.D.; Gilbert, A.Q.; Grubert, E.; Rai, V.; Rhodes, J.D.; Shidore, S.; Smith, C.A.; Webber, M.E. Cascading risks: Understanding the 2021 winter blackout in Texas. Energy Res. Soc. Sci. 2021, 77, 102106. [Google Scholar] [CrossRef]
  10. Littlechild, S.; Kiesling, L. Hayek and the Texas blackout. Electr. J. 2021, 34, 106969. [Google Scholar] [CrossRef]
  11. Popik, T.; Humphreys, R. The 2021 Texas Blackouts: Causes, Consequences, and Cures. J. Crit. Infrastruct. Policy 2021, 2, 47–73. [Google Scholar] [CrossRef]
  12. Clark-Ginsberg, A.; DeSmet, D.; Rueda, I.A.; Hagen, R.; Hayduk, B. Disaster risk creation and cascading disasters within large technological systems: COVID-19 and the 2021 Texas blackouts. J. Contingencies Crisis Manag. 2021, 29, 445–449. [Google Scholar] [CrossRef] [PubMed]
  13. Wu, D.; Zheng, X.; Menati, A.; Smith, L.; Xia, B.; Xu, Y.; Singh, C.; Xie, L. How much demand flexibility could have spared texas from the 2021 outage? Adv. Appl. Energy 2022, 7, 100106. [Google Scholar] [CrossRef]
  14. Leng, A.X. The Analysis of Texas’ Rotating Blackout Incident and Its Enlightenment to the Reform of China Power Grid. Power Gener. Technol. 2021, 42, 151–159. [Google Scholar] [CrossRef]
  15. Oberg, K.; Srinivas, A.; Rahman, F.; Wang, Z.; Ranganathan, P. Strengthening Grid Resilience: Lessons from the Texas Power Blackout and Implications. In 2023 North American Power Symposium (NAPS); NAPS: Asheville, NC, USA, 2023; pp. 1–6. [Google Scholar] [CrossRef]
  16. Prete, C.L.; Rosellon, J. What happened in Texas? Understanding the February 2021 blackouts and learning lessons to prepare the grid for extreme weather events: An introduction. Econ. Energy Environ. Policy 2023, 12, 2. [Google Scholar]
  17. Lee, C.C.; Maron, M.; Mostafavi, A. Community-scale big data reveals disparate impacts of the Texas winter storm of 2021 and its managed power outage. Humanit. Soc. Sci. Commun. 2022, 9, 335. [Google Scholar] [CrossRef]
  18. Flores, N.M.; McBrien, H.; Do, V.; Kiang, M.V.; Schlegelmilch, J.; Casey, J.A. The 2021 Texas Power Crisis: Distribution, duration, and disparities. J. Expo. Sci. Environ. Epidemiol. 2023, 33, 21–31. [Google Scholar] [CrossRef]
  19. Grineski, S.E.; Collins, T.W.; Chakraborty, J. “Cascading disasters and mental health inequities”: Winter Storm Uri, COVID-19 and post-traumatic stress in Texas. Soc. Sci. Med. 2022, 315, 115523. [Google Scholar] [CrossRef]
  20. Bomar, J. Keep Austin Safe: Studying Mutual Aid Organizing Following the 2021 Texas Energy Crisis. Undergraduate Research Scholars Program. 2022. Available online: https://hdl.handle.net/1969.1/196505 (accessed on 8 March 2025).
  21. Stenclik, D.; Bloom, A.; Cole, W.; Stephen, G.; Acevedo, A.F.; Gramlich, R.; Dent, C.; Schlag, N.; Milligan, M. Quantifying Risk in an Uncertain Future: The Evolution of Resource Adequacy. IEEE Power Energy Mag 2021, 19, 29–36. [Google Scholar] [CrossRef]
  22. Kalecki, M. Theory of Economic Dynamics: An Essay on Cyclical and Long Run Changes in Capitalist Economy; Allen and Unwin: London, UK, 1954. [Google Scholar]
  23. Kaldor, N. A classificatory note on the determinateness of equilibrium. Rev. Econ. Stud. 1934, 1, 122–136. [Google Scholar] [CrossRef]
  24. Mickens, R. Difference Equations: Theory and Applications; Chapman and Hall/CRC: Boca Raton, FL, USA, 1990. [Google Scholar]
  25. Pingle, M. Introducing Dynamic Analysis Using Malthus’s Principle of Population. J. Econ. Educ. 2003, 34, 3–20. [Google Scholar] [CrossRef]
  26. Masrur, H.; Khan, K.R.; Abumelha, W.; Senjyu, T. Efficient Energy Delivery System of the CHP-PV Based Microgrids with the Economic Feasibility Study. Int. J. Emerg. Electr. Power Syst. 2020, 21, 20190144. [Google Scholar] [CrossRef]
  27. Acemoglu, D.; Verdier, T. The Choice Between Market Failures and Corruption. Am. Econ. Rev. 2000, 90, 194–211. [Google Scholar] [CrossRef]
  28. Roth, A.E. The Economist as Engineer: Game Theory, Experimentation, and Computation as Tools for Design Economics. Econometrica 2002, 70, 1341–1378. [Google Scholar] [CrossRef]
  29. Cicala, S. Imperfect Markets versus Imperfect Regulation in US Electricity Generation. Am. Econ. Rev. 2022, 112, 409–441. [Google Scholar] [CrossRef]
  30. Valarezo, O.; Gómez, T.; Chaves-Avila, J.P.; Lind, L.; Correa, M.; Ziegler, D.U.; Escobar, R. Analysis of New Flexibility Market Models in Europe. Energies 2021, 14, 3521. [Google Scholar] [CrossRef]
  31. Wesseh, P.K.; Chen, J.; Lin, B. Electricity price modeling from the perspective of start-up costs: Incorporating renewable resources in non-convex markets. Front. Sustain. Energy Policy 2023, 2, 1204650. [Google Scholar] [CrossRef]
  32. Hommes, C.; Li, K.; Wagener, F. Production delays and price dynamics. J. Econ. Behav. Organ. 2022, 194, 341–362. [Google Scholar] [CrossRef]
  33. Sinha, S. Are large complex economic systems unstable? Sci. Cult. 2010, 76, 454–458. [Google Scholar]
  34. Klein, M.; Bar-Yam, Y. Handling Resource Use Oscillation in Multi-agent Markets. In Agent-Mediated Electronic Commerce V. Designing Mechanisms and Systems. AMEC 2003. Lecture Notes in Computer Science; Faratin, P., Parkes, D.C., Rodríguez-Aguilar, J.A., Walsh, W.E., Eds.; Springer: Berlin/Heidelberg, Germany, 2004; Volume 3048. [Google Scholar] [CrossRef]
  35. Zhuang, K.; Jia, G. Sustained oscillation induced by time delay in a commodity market model. Adv. Differ. Equ. 2017, 2017, 56. [Google Scholar] [CrossRef]
  36. Rozporządzenie Ministra Klimatu i Środowiska z Dnia 27 Września 2022 r. Zmieniające Rozporządzenie w Sprawie Szczegółowych Warunków Funkcjonowania Systemu Elektroenergetycznego. Available online: https://dziennikustaw.gov.pl/DU/2022/2007 (accessed on 8 May 2024).
  37. Available online: https://www.pse.pl/obszary-dzialalnosci/wymiana-miedzysystemowa/rynek-dnia-biezacegoon-line (accessed on 8 May 2024).
  38. Available online: https://pap-mediaroom.pl/biznes-i-finanse/wyznaczanie-ceny-energii-na-towarowej-gieldzie-energii-czyli-jak-dziala-mechanizm (accessed on 8 May 2024).
  39. Lam, L.H.; Ilea, V.; Bovo, C. European day-ahead electricity market coupling: Discussion, modeling, and case study. Electr. Power Syst. Res. 2018, 155, 80–92. [Google Scholar] [CrossRef]
  40. Shah, D.; Chatterjee, S. A comprehensive review on day-ahead electricity market and important features of world’s major electric power exchanges. Int. Trans. Electr. Energ. Syst. 2020, 30, e12360. [Google Scholar] [CrossRef]
  41. Dourbois, G.A.; Biskas, P.N.; Chatzigiannis, D.I. Novel Approaches for the Clearing of the European Day-Ahead Electricity Market. IEEE Trans. Power Syst. 2018, 33, 5820–5831. [Google Scholar] [CrossRef]
  42. Tsaousoglou, G.; Giraldo, J.S.; Paterakis, N.G. Market Mechanisms for Local Electricity Markets: A review of models, solution concepts and algorithmic techniques. Renew. Sustain. Energy Rev. 2022, 156, 111890. [Google Scholar] [CrossRef]
  43. Benini, M.; Marracci, M.; Pelacchi, P.; Venturini, A. Day-ahead market price volatility analysis in deregulated electricity markets. In Proceedings of the IEEE Power Engineering Society Summer Meeting, Chicago, IL, USA, 21–25 July 2002; Volume 3, pp. 1354–1359. [Google Scholar] [CrossRef]
  44. De Vos, K. Negative Wholesale Electricity Prices in the German, French and Belgian Day-Ahead, Intra-Day and Real-Time Markets. Electr. J. 2015, 28, 36–50. [Google Scholar] [CrossRef]
  45. Zhao, H.; Zhao, J.; Qiu, J.; Liang, G.; Wen, F.; Xue, Y.; Dong, Z.Y. Data-Driven Risk Preference Analysis in Day-Ahead Electricity Market. IEEE Trans. Smart Grid 2021, 12, 2508–2517. [Google Scholar] [CrossRef]
  46. Andrianesis, P.; Liberopoulos, G.; Kozanidis, G.; Papalexopoulos, A.D. Recovery mechanisms in day-ahead electricity markets with non-convexities—Part I: Design and evaluation methodology. IEEE Trans. Power Syst. 2013, 28, 960–968. [Google Scholar] [CrossRef]
  47. Andrianesis, P.; Liberopoulos, G.; Kozanidis, G.; Papalexopoulos, A.D. Recovery mechanisms in day-ahead electricity markets with non-convexities—Part II: Implementation and numerical evaluation. IEEE Trans. Power Syst. 2013, 28, 969–977. [Google Scholar] [CrossRef]
  48. Philpott, A.; Pettersen, E. Optimizing demand-side bids in day-ahead electricity markets. IEEE Trans. Power Syst. 2006, 21, 488–498. [Google Scholar] [CrossRef]
  49. Cramton, P. Electricity Market Design. In Oxford Review of Economic Policy; Oxford University Press: Melbourne, Australia, 2017; Volume 334, pp. 589–612. Available online: https://www.jstor.org/stable/48539475 (accessed on 10 March 2025).
  50. Viehmann, J. Risk premiums in the German day-ahead Electricity Market. Energy Policy 2011, 39, 386–394. [Google Scholar] [CrossRef]
  51. Caruso, E.; Dicorato, M.; Minoia, A.; Trovato, M. Supplier risk analysis in the day-ahead electricity market. IEE Proc.-Gener. Transm. Distrib. 2006, 153, 335–342. [Google Scholar] [CrossRef]
  52. Giabardo, P.; Zugno, M.; Pinson, P.; Madsen, H. Feedback, competition and stochasticity in a day ahead electricity market. Energy Econ. 2010, 32, 292–301. [Google Scholar] [CrossRef]
  53. Algarvio, H.; Lopes, F.; Couto, A.; Estanqueiro, A. Participation of wind power producers in day-ahead and balancing markets: An overview and a simulation-based study. WIREs Energy Environ. 2019, 8, e343. [Google Scholar] [CrossRef]
  54. Pape, C.; Hagemann, S.; Weber, C. Are fundamentals enough? Explaining price variations in the German day-ahead and intraday power market. Energy Econ. 2016, 54, 376–387. [Google Scholar] [CrossRef]
  55. Jåstad, E.O.; Trotter, I.M.; Bolkesjø, T.F. Long term power prices and renewable energy market values in Norway—A probabilistic approach. Energy Econ. 2022, 112, 106182. [Google Scholar] [CrossRef]
  56. Ishizaki, T.; Koike, M.; Yamaguchi, N.; Ueda, Y.; Imura, J.-I. Day-ahead energy market as adjustable robust optimization: Spatio-temporal pricing of dispatchable generators, storage batteries, and uncertain renewable resources. Energy Econ. 2020, 91, 104912. [Google Scholar] [CrossRef]
  57. Newbery, D.M. High renewable electricity penetration: Marginal curtailment and market failure under “subsidy-free” entry. Energy Econ. 2023, 126, 107011. [Google Scholar] [CrossRef]
  58. Godoy-González, D.; Gil, E.; Gutiérrez-Alcaraz, G. Ramping ancillary service for cost-based electricity markets with high penetration of variable renewable energy. Energy Econ. 2020, 85, 104556. [Google Scholar] [CrossRef]
  59. Hedman, K.W.; Ferris, M.C.; O’NEill, R.P.; Fisher, E.B.; Oren, S.S. Co-Optimization of Generation Unit Commitment and Transmission Switching With N-1 Reliability. IEEE Trans. Power Syst. 2010, 25, 1052–1063. [Google Scholar] [CrossRef]
  60. Hedman, K.W.; O’Neill, R.P.; Fisher, E.B.; Oren, S.S. Optimal Transmission Switching With Contingency Analysis. IEEE Trans. Power Syst. 2009, 24, 1577–1586. [Google Scholar] [CrossRef]
  61. Schiffer, J.; Seel, T.; Raisch, J.; Sezi, T. Voltage Stability and Reactive Power Sharing in Inverter-Based Microgrids With Consensus-Based Distributed Voltage Control. IEEE Trans. Control. Syst. Technol. 2016, 24, 96–109. [Google Scholar] [CrossRef]
  62. Morison, K.; Wang, L.; Kundur, P. Power system security assessment. IEEE Power Energy Mag. 2004, 2, 30–39. [Google Scholar] [CrossRef]
  63. Thomas, A.G.; Tesfatsion, L. Braided Cobwebs: Cautionary Tales for Dynamic Pricing in Retail Electric Power Markets. IEEE Trans. Power Syst. 2018, 33, 6870–6882. [Google Scholar] [CrossRef]
  64. Billewicz, K. Skuteczność DSR—Między bodźcem a reakcją. Prz. Elektrotech. 2012, 9a, 308–314. [Google Scholar]
  65. Jabłońska, M. Aktualne trendy w badaniach nad reakcją strony popytowej oraz możliwości ich implementacji w warunkach krajowych. Rynek Energii 2011, 3, 81–86. [Google Scholar]
  66. Faruqui, A.; Sergici, S. Household response to dynamic pricing of electricity: A survey of 15 experiments. J. Regul. Econ. 2010, 38, 193–225. [Google Scholar] [CrossRef]
  67. Muratori, M.; Rizzoni, G. Residential Demand Response: Dynamic Energy Management and Time-Varying Electricity Pricing. IEEE Trans. Power Syst. 2016, 31, 1108–1117. [Google Scholar] [CrossRef]
  68. Ito, K. Do Consumers Respond to Marginal or Average Price? Evidence from Nonlinear Electricity Pricing. Am. Econ. Rev. 2014, 104, 537–563. [Google Scholar] [CrossRef]
  69. Edelstein, P.; Kilian, L. How sensitive are consumer expenditures to retail energy prices? J. Monet. Econ. 2009, 56, 766–779. [Google Scholar] [CrossRef]
  70. Paterakis, N.G.; Erdinc, O.; Bakirtzis, A.G.; Catalao, J.P.S. Optimal Household Appliances Scheduling Under Day-Ahead Pricing and Load-Shaping Demand Response Strategies. IEEE Trans. Ind. Inform. 2015, 11, 1509–1519. [Google Scholar] [CrossRef]
  71. Missaoui, R.; Joumaa, H.; Ploix, S.; Bacha, S. Managing energy Smart Homes according to energy prices: Analysis of a Building Energy Management System. Energy Build. 2014, 71, 155–167. [Google Scholar] [CrossRef]
  72. Kilian, L. The Economic Effects of Energy Price Shocks. J. Econ. Lit. 2008, 46, 871–909. [Google Scholar] [CrossRef]
  73. He, W.; King, M.; Luo, X.; Dooner, M.; Li, D.; Wang, J. Technologies and economics of electric energy storages in power systems: Review and perspective. Adv. Appl. Energy 2021, 4, 100060. [Google Scholar] [CrossRef]
  74. Albertus, P.; Manser, J.S.; Litzelman, S. Long-Duration Electricity Storage Applications, Economics, and Technologies. Joule 2020, 4, 21–32. [Google Scholar] [CrossRef]
  75. Buczaj, M.; Sumorek, A.; Buczaj, A. Funkcjonowanie magazynów energii jako układów ograniczających koszty zakupu energii elektrycznej. Przegląd Elektrotech. 2024, 1. [Google Scholar] [CrossRef]
  76. Schmidt, O.; Hawkes, A.; Gambhir, A.; Staffell, I. The future cost of electrical energy storage based on experience rates. Nat. Energy 2017, 2, 17110. [Google Scholar] [CrossRef]
  77. Zakeri, B.; Syri, S. Electrical energy storage systems: A comparative life cycle cost analysis. Renew. Sustain. Energy Rev. 2015, 42, 569–596. [Google Scholar] [CrossRef]
  78. Keles, D.; Dehler-Holland, J. Evaluation of photovoltaic storage systems on energy markets under uncertainty using stochastic dynamic programming. Energy Econ. 2022, 106, 105800. [Google Scholar] [CrossRef]
  79. Available online: https://rhomotion.com/news/global-bess-deployments-surpass-expectations-in-2024/ (accessed on 26 May 2025).
  80. Available online: https://www.infolink-group.com/energy-article/energy-storage-topic-global-energy-storage-market-review-outlook (accessed on 26 May 2025).
  81. Available online: https://about.bnef.com/blog/global-energy-storage-market-records-biggest-jump-yet/ (accessed on 26 May 2025).
  82. Available online: https://oko.press/ryby-umieraja-wisla-sola (accessed on 8 May 2025).
  83. Available online: https://lifeinkrakow.pl/w-miescie/7314,w-ciagu-kilku-minut-woda-w-wisle-opadla-o-metr-zginelo-tysiace-ryb-to-sie-powtarza#google_vignette (accessed on 8 May 2025).
  84. Available online: https://dziennikpolski24.pl/krakow-niepokojace-spadki-poziomu-wody-w-rejonie-stopnia-przewoz-w-wisle-gina-ryby/ar/c1-18074177 (accessed on 8 May 2025).
  85. Technical and Economic Aspects of Load Following with Nuclear Power Plants. Available online: https://www.oecd-nea.org/upload/docs/application/pdf/2021-12/technical_and_economic_aspects_of_load_following_with_nuclear_power_plants.pdf (accessed on 8 May 2025).
  86. Barough, A.S.; Shoubi, M.V.; Skardi, M.J.E. Application of Game Theory Approach in Solving the Construction Project Conflicts. Procedia-Soc. Behav. Sci. 2012, 58, 1586–1593. [Google Scholar] [CrossRef]
  87. Cressman, R. Evolutionary stability for two-stage hawk-dove games. Rocky Mt. J. Math. 1995, 25, 1. [Google Scholar] [CrossRef]
  88. Available online: https://eur-lex.europa.eu/legal-content/PL/ALL/?uri=celex:32003R0001 (accessed on 8 May 2025).
  89. Hylton, K.N. Antitrust Law: Economic Theory and Common Law Evolution; Books. 89; Cambridge University Press: Cambridge, UK, 2003; Available online: https://scholarship.law.bu.edu/books/89 (accessed on 7 March 2024).
  90. Borenstein, S. The Trouble With Electricity Markets: Understanding California’s Restructuring Disaster. J. Econ. Perspect. 2002, 16, 191–211. [Google Scholar] [CrossRef]
  91. Joskow, P.L.; Kahn, E. A Quantitative Analysis of Pricing Behavior in California’s Wholesale Electricity Market During Summer 2000. Energy J. 2002, 23, 1–35. [Google Scholar] [CrossRef]
  92. Budhraja, V.S. California’s Electricity Crisis. IEEE Power Eng. Rev. 2002, 22, 6–14. [Google Scholar] [CrossRef]
  93. Trehan, N.K. Lessons learned from California’s experience on electric power deregulation. In Proceedings of the IECEC ‘02. 2002 37th Intersociety Energy Conversion Engineering Conference, Washington, DC, USA, 29–31 July 2002; pp. 784–790. [Google Scholar] [CrossRef]
  94. Son, Y.S.; Baldick, R.; Lee, K.-H.; Siddiqi, S. Short-term electricity market auction game analysis: Uniform and pay-as-bid pricing. IEEE Trans. Power Syst. 2004, 19, 1990–1998. [Google Scholar] [CrossRef]
  95. Energy-Charts. Available online: https://www.energy-charts.info/?l=en&c=EU (accessed on 26 May 2025).
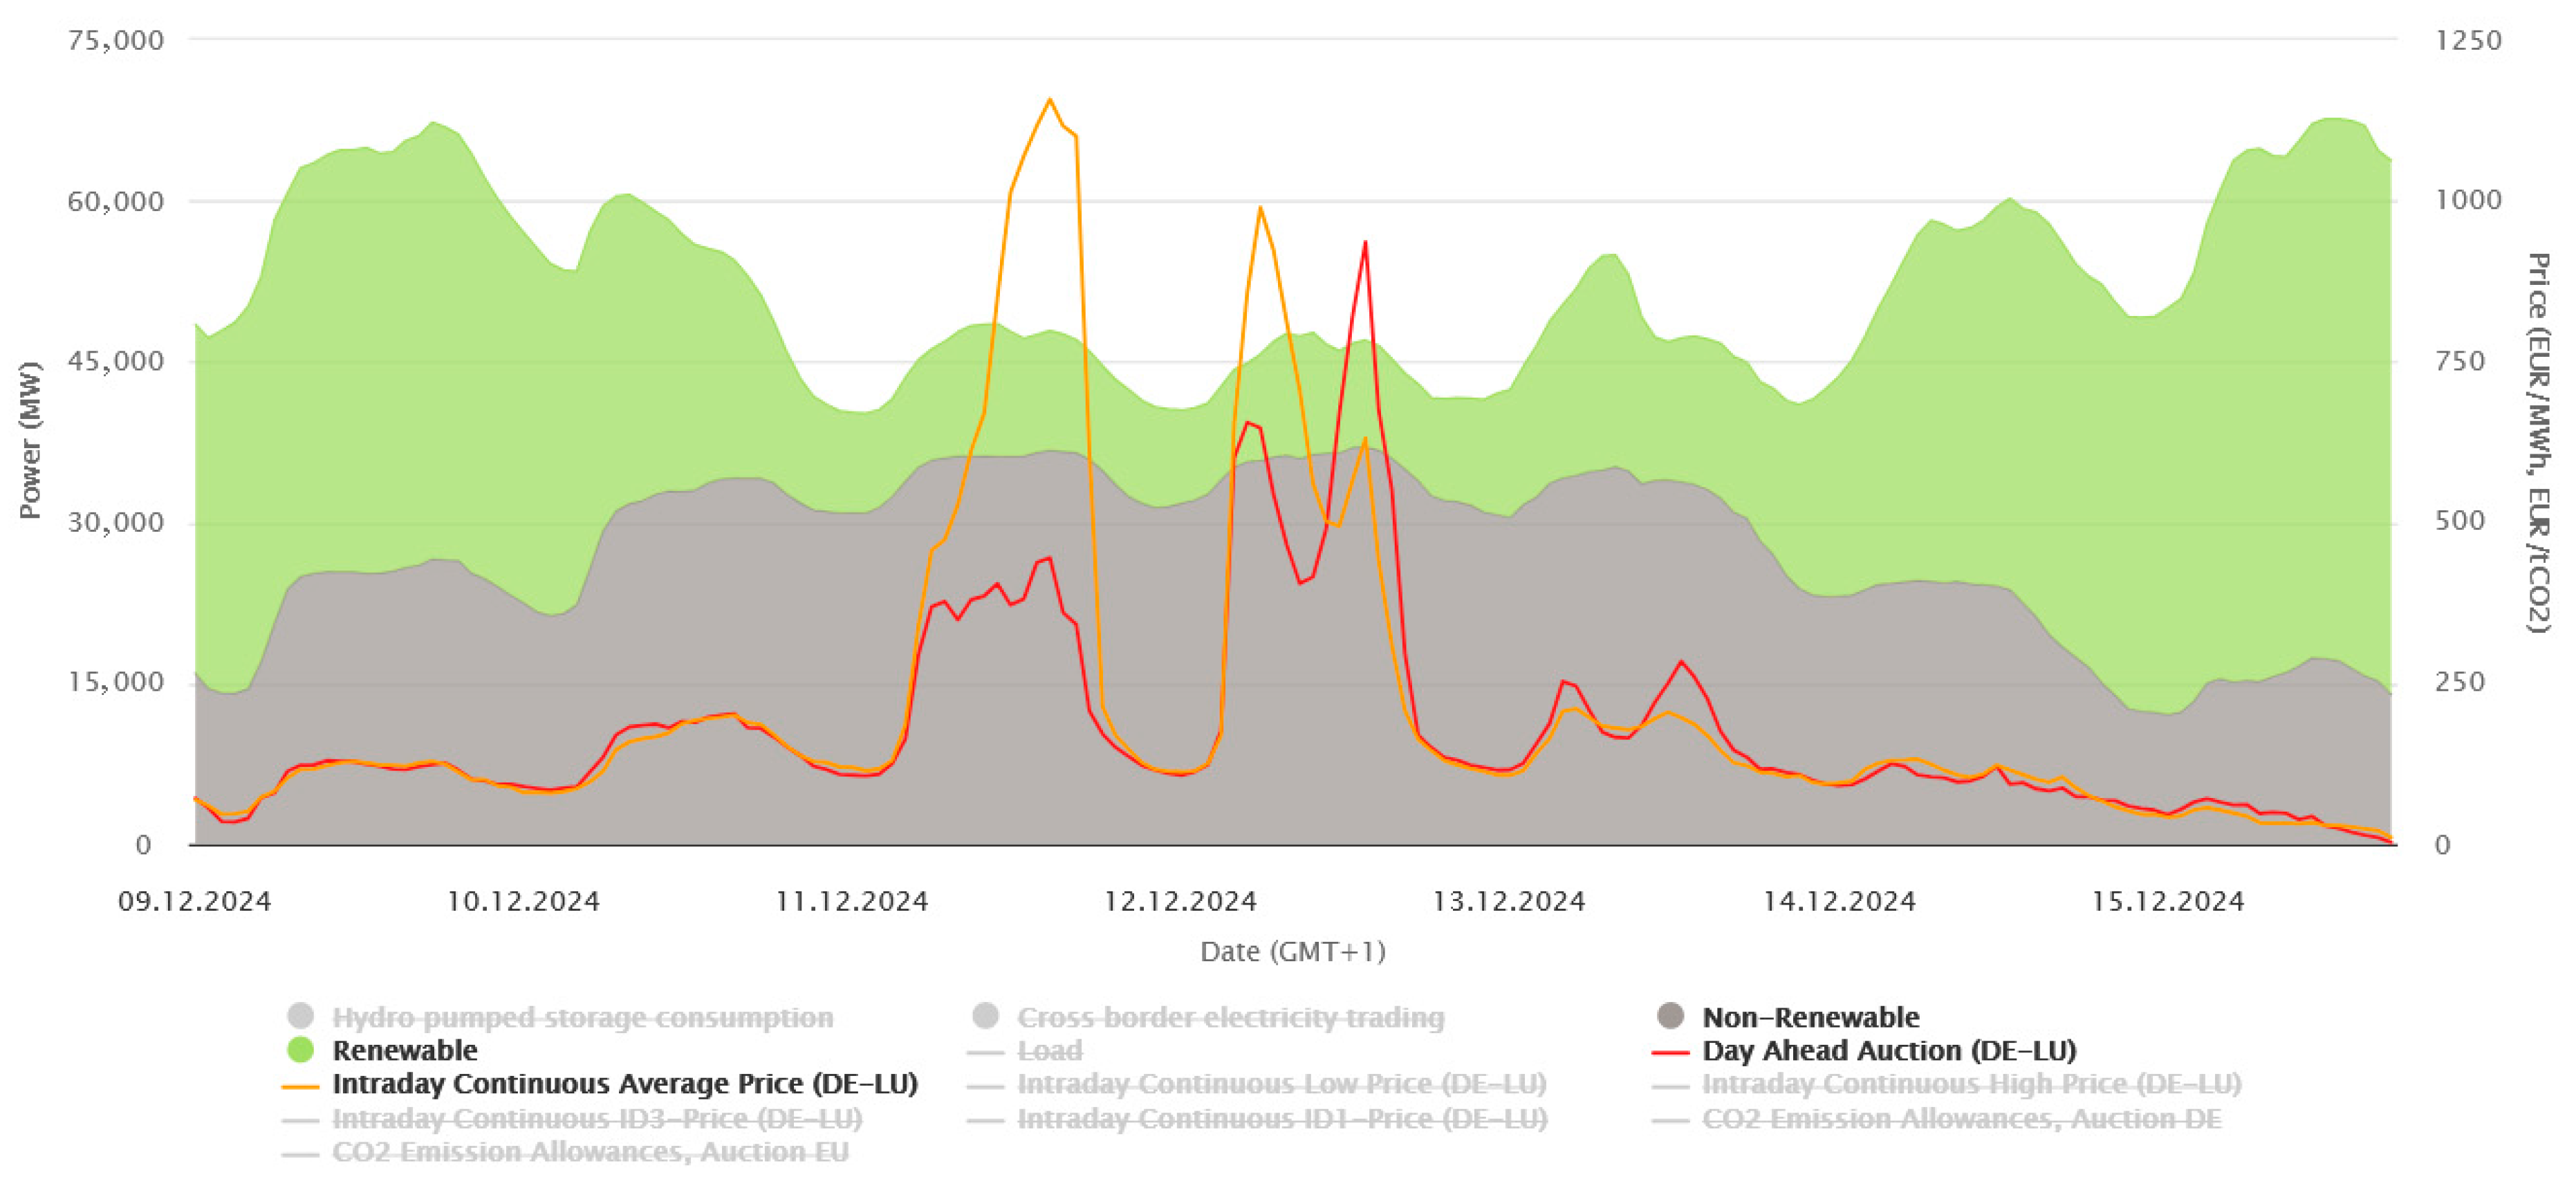
Figure 1. Week of dark flouts in Germany.
Energies 18 04201 g001
Figure 2. (a) Energy prices in Spain in 2024. All graphics in this article were made using Energy Chart. (b) Energy prices in Spain in May: the dependence of price of energy on the actual availability of PV energy. All graphics in this article were made using Energy Chart.
Energies 18 04201 g002aEnergies 18 04201 g002b
Figure 3. Spain: electricity prices, February 2024.
Energies 18 04201 g003
Figure 4. Energy price: France, February 2024.
Energies 18 04201 g004
Figure 5. Energy price: France, 2024. Periods with energy prices close to “0” are visible even if most energy generation comes from nuclear power stations.
Energies 18 04201 g005
Figure 6. (a) Spain’s energy mix in February. (b) Energy mix of Spain showing the participation of “supporting actors”. (c) Energy mix of Spain, “main actors”.
Energies 18 04201 g006aEnergies 18 04201 g006b
Figure 7. Price of energy and its production in Spain, 2025.
Energies 18 04201 g007
Figure 8. Spain—a week with a blackout. Energy production via various sources. Please pay attention to what sources were used to rebuild the system.
Energies 18 04201 g008
Disclaimer/Publisher’s Note: The statements, opinions and data contained in all publications are solely those of the individual author(s) and contributor(s) and not of MDPI and/or the editor(s). MDPI and/or the editor(s) disclaim responsibility for any injury to people or property resulting from any ideas, methods, instructions or products referred to in the content.