Review

Systems Thinking for Climate Change and Clean Energy

by
Hassan Qudrat-Ullah
School of Administrative Studies, York University, Toronto, ON M3J 1P3, Canada
Energies 2025, 18(15), 4200; https://doi.org/10.3390/en18154200
Submission received: 15 June 2025 / Revised: 31 July 2025 / Accepted: 4 August 2025 / Published: 7 August 2025
(This article belongs to the Special Issue Clean and Efficient Use of Energy: 3rd Edition)

Abstract

Addressing climate change and advancing clean energy transitions demand holistic approaches that capture complex, interconnected system behaviors. This review focuses on the application of causal loop diagrams (CLDs) as a core systems-thinking methodology to understand and manage dynamic feedback within environmental, social, and technological domains. CLDs visually map the reinforcing and balancing loops that drive climate risks, clean energy adoption, and sustainable development, offering intuitive insights into system structure and behavior. Through a synthesis of empirical studies and case examples, this paper demonstrates how CLDs help identify leverage points in renewable energy policy, carbon management, and ecosystem resilience. Despite their strengths in simplifying complexity and enhancing stakeholder communication, challenges remain—including data gaps, model validation, and the integration of diverse knowledge systems. The review also examines recent innovations that improve CLD effectiveness, such as hybrid modeling approaches and digital tools that enhance transparency and decision support. By emphasizing CLDs’ unique capacity to reveal feedback mechanisms critical for climate action and energy planning, this study provides actionable recommendations for researchers, policymakers, and practitioners seeking to leverage systems thinking for transformative, sustainable solutions.

1. Introduction

Climate change represents one of the most significant and pressing challenges of the 21st century. Its consequences—rising global temperatures, increasingly frequent and severe extreme weather events, sea-level rise, and resource depletion—are already disrupting ecosystems, economies, and societies worldwide [1] At the core of these impacts lies the continued dependence on fossil fuels, making the global transition to clean energy not only a technological imperative but also a policy and governance challenge of planetary scale. In this context, clean energy transitions—such as the scaling of solar, wind, hydro, and bioenergy systems—are central to reducing greenhouse gas emissions and stabilizing the climate system [2]
However, this transition is far from straightforward. Clean energy adoption is shaped by a complex web of interdependent factors, including infrastructure investment, regulatory frameworks, market feedback, public behavior, and geopolitical dynamics. These interdependencies often generate nonlinear responses and unintended consequences—such as policy rebound effects, grid instability, or delayed emissions reductions—rendering linear models inadequate for robust policy design and evaluation.
To effectively navigate such dynamic complexity, systems thinking offers a powerful analytic lens. Central to this approach are causal loop diagrams (CLDs)—visual tools that map feedback loops, delays, and nonlinearities in complex systems. CLDs help uncover the mechanisms that reinforce or balance system behavior over time [3,4]. In energy transitions, for example, CLDs can capture reinforcing loops—such as how early-stage subsidies lead to technology cost reductions, which, in turn, drive further adoption—and balancing loops that reflect saturation points or policy constraints. They also reveal delays, such as the time lag between policy implementation and behavioral or technological response, which are critical in climate mitigation [5]
This paper presents the first systematic, multi-sectoral review of CLD-based research applied to climate risk and clean energy systems. While previous reviews have examined system dynamics modeling more broadly, this study offers a focused synthesis of empirical and conceptual work utilizing CLDs—across energy policy, climate adaptation, ecosystem dynamics, and socio-technical transitions. By examining peer-reviewed publications from 2004 to 2024, the study identifies major thematic areas, evaluates methodological trends, and synthesizes findings into policy-relevant insights. It is guided by the central question: How have causal loop diagrams (CLDs) been applied to advance understanding and inform policy across climate change and clean energy systems?
The contribution of this article is threefold. First, it categorizes CLD applications into five domains: renewable energy integration, grid stability and demand management, feedback-informed policy design, ecosystem–climate dynamics, and the underexplored area of climate impacts on energy system viability. Second, it identifies methodological gaps—such as the lack of spatial granularity, limited empirical validation, and underuse of CLDs in resource-constrained regions. Third, the study proposes an integrative CLD framework that links energy planning with climate adaptation and resilience—especially in vulnerable regions where such integration is most critical.
By centering the review around CLDs, this paper advances understanding of how system structure shapes outcomes in climate and energy transitions and provides researchers, analysts, and policymakers with a roadmap for applying feedback-oriented thinking to design more adaptive and effective sustainability strategies.

2. Literature Review: Causal Loop Diagrams in Climate and Clean Energy Systems

This section provides a structured review of the scholarly literature on the application of causal loop diagrams (CLDs) to climate change and clean energy challenges. CLDs have emerged as powerful tools to model dynamic complexity, reveal feedback mechanisms, and support policy design. The reviewed studies fall into four thematic categories: (i) renewable energy systems, (ii) policy analysis, (iii) ecosystem and climate dynamics, and (iv) climate adaptation and mitigation. This review also highlights gaps in integration—especially between climate impacts and renewable energy viability—and points to underexplored opportunities for applying CLDs in resource-constrained or climate-vulnerable regions.

2.1. Overview of CLD Construction and Utilization

Causal loop diagrams capture the feedback loops, nonlinear interactions, and time delays that define complex socio-environmental systems. In climate and clean energy contexts, CLDs are built by identifying key system variables, mapping their interdependencies, and indicating the polarity (positive or negative) of each relationship [3,4]. These visual tools help researchers and stakeholders understand system behavior—whether reinforcing growth, achieving stability, or causing oscillations—while promoting shared understanding and communication.

2.2. Mapping Feedback Structures in Climate and Energy Systems

CLDs have been widely used to analyze feedback mechanisms affecting climate dynamics and energy system transitions. Feedback such as the ice-albedo effect, greenhouse gas emissions loops, and technology adoption dynamics are central to climate–energy modeling. Researchers also use CLDs to uncover unintended effects like rebound effects from energy efficiency measures [6,7]
CLDs support the identification of leverage points in renewable energy adoption. For instance, Crielaard et al. [8] showed that aligning subsidies with learning curves for offshore wind led to a 35% increase in adoption. Geels and Ayoub [9] projected a doubling of electric vehicle uptake within a decade, contingent on charging infrastructure and battery cost reductions. Community energy projects studied by Ghorbani et al. [10] revealed a 25–40% increase in renewable penetration through local governance and social capital.Qudrat-Ullah [6,11] demonstrated that feedback-aware diversification strategies can cut fossil fuel dependency by 20–30% in developing countries. These studies show that CLDs can guide adaptive energy policy and stakeholder coordination.
CLDs have also informed strategies for managing variability in renewable-heavy grids. Groundstroem et al. [12] used CLDs to optimize bioenergy supply chains, reducing seasonal volatility by 15%. Zellner et al. [13] analyzed urban–rural energy flows, achieving up to 25% energy stress reductions through a demand response. Storage technologies, modeled by Kapmeier et al. [14], offset 40% of solar and wind intermittency, while Richards et al. [15] demonstrated how time-of-use pricing reduced peak loads by 20%. These studies underscore the role of CLDs in improving system reliability.
Feedback mapping enhances policy design. Bouchet et al. [16] improved groundwater sustainability by 25% by targeting feedback in regulatory behavior.Sterman [17] emphasized the importance of early interventions in climate policy to avoid delays that amplify emissions. Jalali and Beaulieu [18] quantified a 15% rise in policy compliance through transparent CLD-based policymaking. Qudrat-Ullah [6] showed that such methods reduce rebound effects by 30%, enhancing policy resilience. CLD-driven policy modeling enables systemic and long-term thinking, especially in environments prone to dynamic resistance or delayed outcomes.

2.3. Integrating CLDs with Quantitative Climate and Policy Models

Increasingly, CLDs are integrated with simulation models, scenario planning, and empirical data to improve policy evaluation. This hybrid approach bridges qualitative structure and quantitative prediction.
CLDs help reveal policy leverage points. Tidwell et al., 2020 [19] improved groundwater quality by 15% through targeted interventions. Jalali and Beaulieu [18] found that communicating policy feedback boosted stakeholder engagement by 20%. These examples highlight how policy design informed by CLDs can affect systemic resilience. Geels and Ayoub [9] mapped electric vehicle transitions, identifying reinforcing feedback in infrastructure, cost, and consumer acceptance—resulting in a 25% adoption increase over five years. Mercure et al. [20] found that innovation support reduced battery costs by 18%. These studies validate CLDs’ utility in managing complex socio-technical shifts. Ioannou and Laspidou [21] used CLDs to manage energy–water interactions, improving efficiency by 12%. Gudlaugsson et al. [22] showed that cross-sectoral infrastructure planning cut failure risks by 15%. These integrated models support sustainable multi-resource management.
Fiddaman [23] and Sterman (2008) [17] applied CLDs in scenario models to assess emissions trajectories. Fiddaman found a 30% variance in emissions depending on stakeholder engagement, while Sterman showed that stronger enforcement reduced emissions growth by 20%. Olivar-Tost et al. [24] extended these models to evaluate unintended adaptation outcomes, reinforcing the importance of dynamic planning tools.

2.4. CLDs in Ecosystem and Climate Dynamics

CLDs help model interactions across land use, water, biodiversity, and climate systems. Liu et al. [25] found that deforestation reduces carbon sinks via reinforcing feedback, while afforestation introduces balancing loops. Luna-Reyes and Andersen [26] linked policy incentives to land-use shifts. These studies show how CLDs can reveal trade-offs in climate–ecological strategies. Ioannou and Laspidou [21] identified feedback thresholds in wetlands; Zellner et al. [13] explored rural–urban water feedback. Interventions such as recycling and sustainable extraction policies emerged as leverage points. Geels and Ayoub [9] traced extinction feedback from habitat loss. Groundstroem et al. [12] highlighted the roles of education, outreach, and participatory governance in reversing degradation.
Sterman [17] modeled delays in albedo feedback; Valkering et al. [27] showed early mitigation reduces long-term adaptation costs. Richards et al. [15] documented a 30% resilience gain via integrated urban adaptation strategies. CLDs support synchronizing mitigation and adaptation to maximize policy impact. While CLDs are often used to promote clean energy adoption, recent work has begun to model how climate change itself can constrain renewable energy systems. Extreme temperatures alter wind patterns, and hydrological shifts can degrade the performance of photovoltaics, wind turbines, and hydroelectricity. For example, Qudrat-Ullah [28] noted that extreme heat reduces PV efficiency by 10–15% in tropical regions, while [25] mapped feedback from declining wind predictability to grid instability. CLDs in this context help model adaptive strategies, such as cooling infrastructure or storage buffers, which mitigate climate-related degradation of energy reliability. These findings suggest that CLDs can and should be used to model not only energy transitions but also climate resilience within energy systems themselves.

2.5. Summary and Gaps Identified

Table 1 below synthesizes the major thematic areas, representative studies, key insights, and associated policy or practical implications discussed in this review. This summary offers a concise overview to help readers understand how CLDs contribute to managing the dynamic complexity of climate and clean energy systems.
This literature review confirms the growing breadth of CLD applications across renewable energy, policy design, and environmental management. However, notable gaps remain: CLD models often lack spatial and temporal resolution; feedback between climate impacts and energy system viability are still emerging; and cross-sectoral integration (e.g., energy–water–health) is inconsistently addressed. This study helps advance the field by synthesizing recent developments, highlighting underexplored climate–energy feedback, and identifying pathways toward more integrative, adaptive, and stakeholder-informed CLD frameworks—especially in vulnerable contexts where such dynamics are most consequential.

3. Methodology

This study employs a systematic review methodology to investigate the use of causal loop diagrams (CLDs) in modeling climate and clean energy systems. The approach emphasizes systems-thinking principles, including feedback loops, delays, and nonlinear interactions, to provide a comprehensive understanding of CLD applications in addressing critical climate and energy challenges.

3.1. Literature Inclusion and Exclusion Criteria

The inclusion criteria focused on peer-reviewed articles published between 2004 and 2024 that explicitly utilized CLDs to model climate risk or clean energy systems. Studies were assessed for their methodological rigor, emphasis on feedback mechanisms, and relevance to systems thinking. Articles lacking empirical evidence, not directly applying CLDs, or unrelated to climate or energy contexts were excluded [3,4].
Inclusion Criteria:
  • Peer-reviewed journal articles.
  • Publications from 2004 to 2024.
  • Studies explicitly employing CLDs in climate or energy research.
  • Emphasis on feedback loops, delays, or nonlinear dynamics.
Exclusion Criteria:
  • Non-peer-reviewed materials (e.g., commentaries, opinion pieces).
  • Books and book chapters.
  • Studies not focused on climate or energy systems.
  • Articles without explicit CLD applications.

3.2. Literature Search Strategy

A comprehensive search was conducted across academic databases such as Web of Science, SpringerLink, and Google Scholar. Search terms combined keywords including “causal loop diagrams”, “systems thinking”, “climate risk”, “clean energy”, “feedback loops”, and “dynamic systems”. Filters for peer-reviewed studies, publication dates (2004–2024), and English-language content were applied. Additional sources were identified through citation analysis of key references.

3.3. Data Extraction and Thematic Analysis

The data extraction process targeted key aspects such as study objectives, methodologies, identified feedback mechanisms, and practical applications in climate risk assessment or clean energy transitions. Extracted data were organized into thematic categories:
  • Renewable Energy Systems: Studies focusing on CLD applications in the planning, integration, and optimization of renewable energy sources.
  • Policy Analysis: Insights into policy development using CLDs to evaluate sustainable energy strategies and climate risk management.
  • Ecosystem and Climate Dynamics: Applications of CLDs in understanding ecological impacts and climate system feedback.
A thematic analysis employed an iterative coding framework, allowing themes to emerge naturally while aligning with research objectives. The dual inductive–deductive approach facilitated the identification of nuanced patterns and relationships, ensuring a robust understanding of CLD applications.

3.4. Quality Assessment

The quality of included studies was appraised based on their relevance to CLD-based modeling, methodological transparency, clarity in feedback loop structure, and demonstrated or implied impact on policy. As a single author conducted this review, formal inter-rater reliability measures and dual screening procedures were not applied; this is acknowledged as a methodological limitation.

3.5. Methodological Flowchart

Figure 1 presents the methodological flowchart, illustrating the systematic review process, from the initial database search to the final thematic synthesis. This visual representation enhances clarity, displaying the rigorous and structured approach undertaken in this study. See Section 3.1, Section 3.2, Section 3.3 and Section 3.4 for the detailed criteria and analysis steps underlying this flowchart.

4. Thematic Results and Case Applications

This section presents the core findings of the systematic review, organized around four key domains where CLDs have been applied to clean energy and climate system challenges: (i) renewable energy policy and planning, (ii) emission reduction and transition strategies, (iii) ecosystem management and nexus dynamics, and (iv) urban resilience and adaptive capacities. These thematic clusters illustrate how CLDs have informed decision-making, shaped system understanding, and revealed feedback dynamics critical to sustainability transitions.

4.1. Renewable Energy Policy and System Dynamics

CLDs have been instrumental in analyzing renewable energy dynamics. For example, Qudrat-Ullah) [28] explored the interplay between policy incentives, energy supply, and environmental impacts in Africa, revealing how well-designed subsidies and policy interventions can enhance renewable energy adoption while mitigating energy poverty. The study highlighted the reinforcing feedback loops created by technology adoption and cost reductions, as well as balancing loops that ensure equitable energy access. Table 2 summarizes key studies and their impact on policy decisions.

4.2. Emission Reduction and Energy Transitions

CLDs provide robust frameworks for analyzing the systemic dynamics of emission reduction strategies. Sterman [17] used CLDs to reveal reinforcing loops that exacerbate emissions, such as increased fossil fuel reliance, and balancing loops that stabilize emissions through renewable energy adoption and efficiency improvements. Such insights have shaped policies promoting energy transitions and technological innovations to achieve net-zero targets (as illustrated in Figure 2). In this CLD, there are three feedback loops:
  • R1: Reinforcing Loop (Fossil Fuel Use → Carbon Emissions → Fossil Fuel Use)
This loop highlights the self-reinforcing nature of fossil fuel dependency. Increased fossil fuel use leads to higher carbon emissions, which contributes to greater infrastructure and market reliance on fossil fuels. This dependency makes transitioning to alternative energy sources more challenging, perpetuating the cycle of emissions.
2.
B1: Balancing Loop (Carbon Emissions → Climate Impact → Policy Pressure → Renewable Energy Adoption → Carbon Emissions)
In this loop, rising carbon emissions intensify climate impacts, such as extreme weather events, which in turn increase policy pressure for climate action. Policymakers respond by promoting renewable energy adoption, which helps reduce carbon emissions. This stabilizing feedback loop aims to balance the system by counteracting the rise in emissions through effective policy interventions and energy transitions.
3.
R2: Reinforcing Loop (Renewable Energy Adoption → Technological Advancements → Renewable Energy Adoption)
This loop illustrates the virtuous cycle associated with renewable energy development. As renewable energy adoption increases, it drives technological advancements, including cost reductions and efficiency improvements. These advancements, in turn, make renewable energy more attractive and accessible, accelerating its adoption. This reinforcing loop plays a crucial role in the energy transition by continuously improving the feasibility of renewable solutions.
Together, these feedback loops demonstrate the interplay of forces driving and stabilizing the energy transition, emphasizing the need for strategic interventions to strengthen balancing loops (like B1) and harness the momentum of reinforcing loops (like R2) while mitigating the challenges of reinforcing loops like R1.
Table 3 summarizes key studies that applied CLDs to analyze emission reduction and energy transitions. These studies have influenced climate and energy policy by clarifying system feedback, time delays, and leverage points for effective intervention.

4.3. Ecosystem Management and Resource Nexus Challenges

In the domain of ecosystem management, CLDs have proven effective in capturing interconnections within the water–energy–food nexus. Sušnik et al. [31] demonstrated the use of CLDs in urban settings, showing how resource trade-offs and synergies could be managed to enhance sustainability outcomes. Their findings underscored the need for cross-sectoral policy integration to address nexus challenges. Table 4 presents a summary of the CLD-based studies in ecosystem management.

4.4. Urban Resilience and Adaptive Capacities

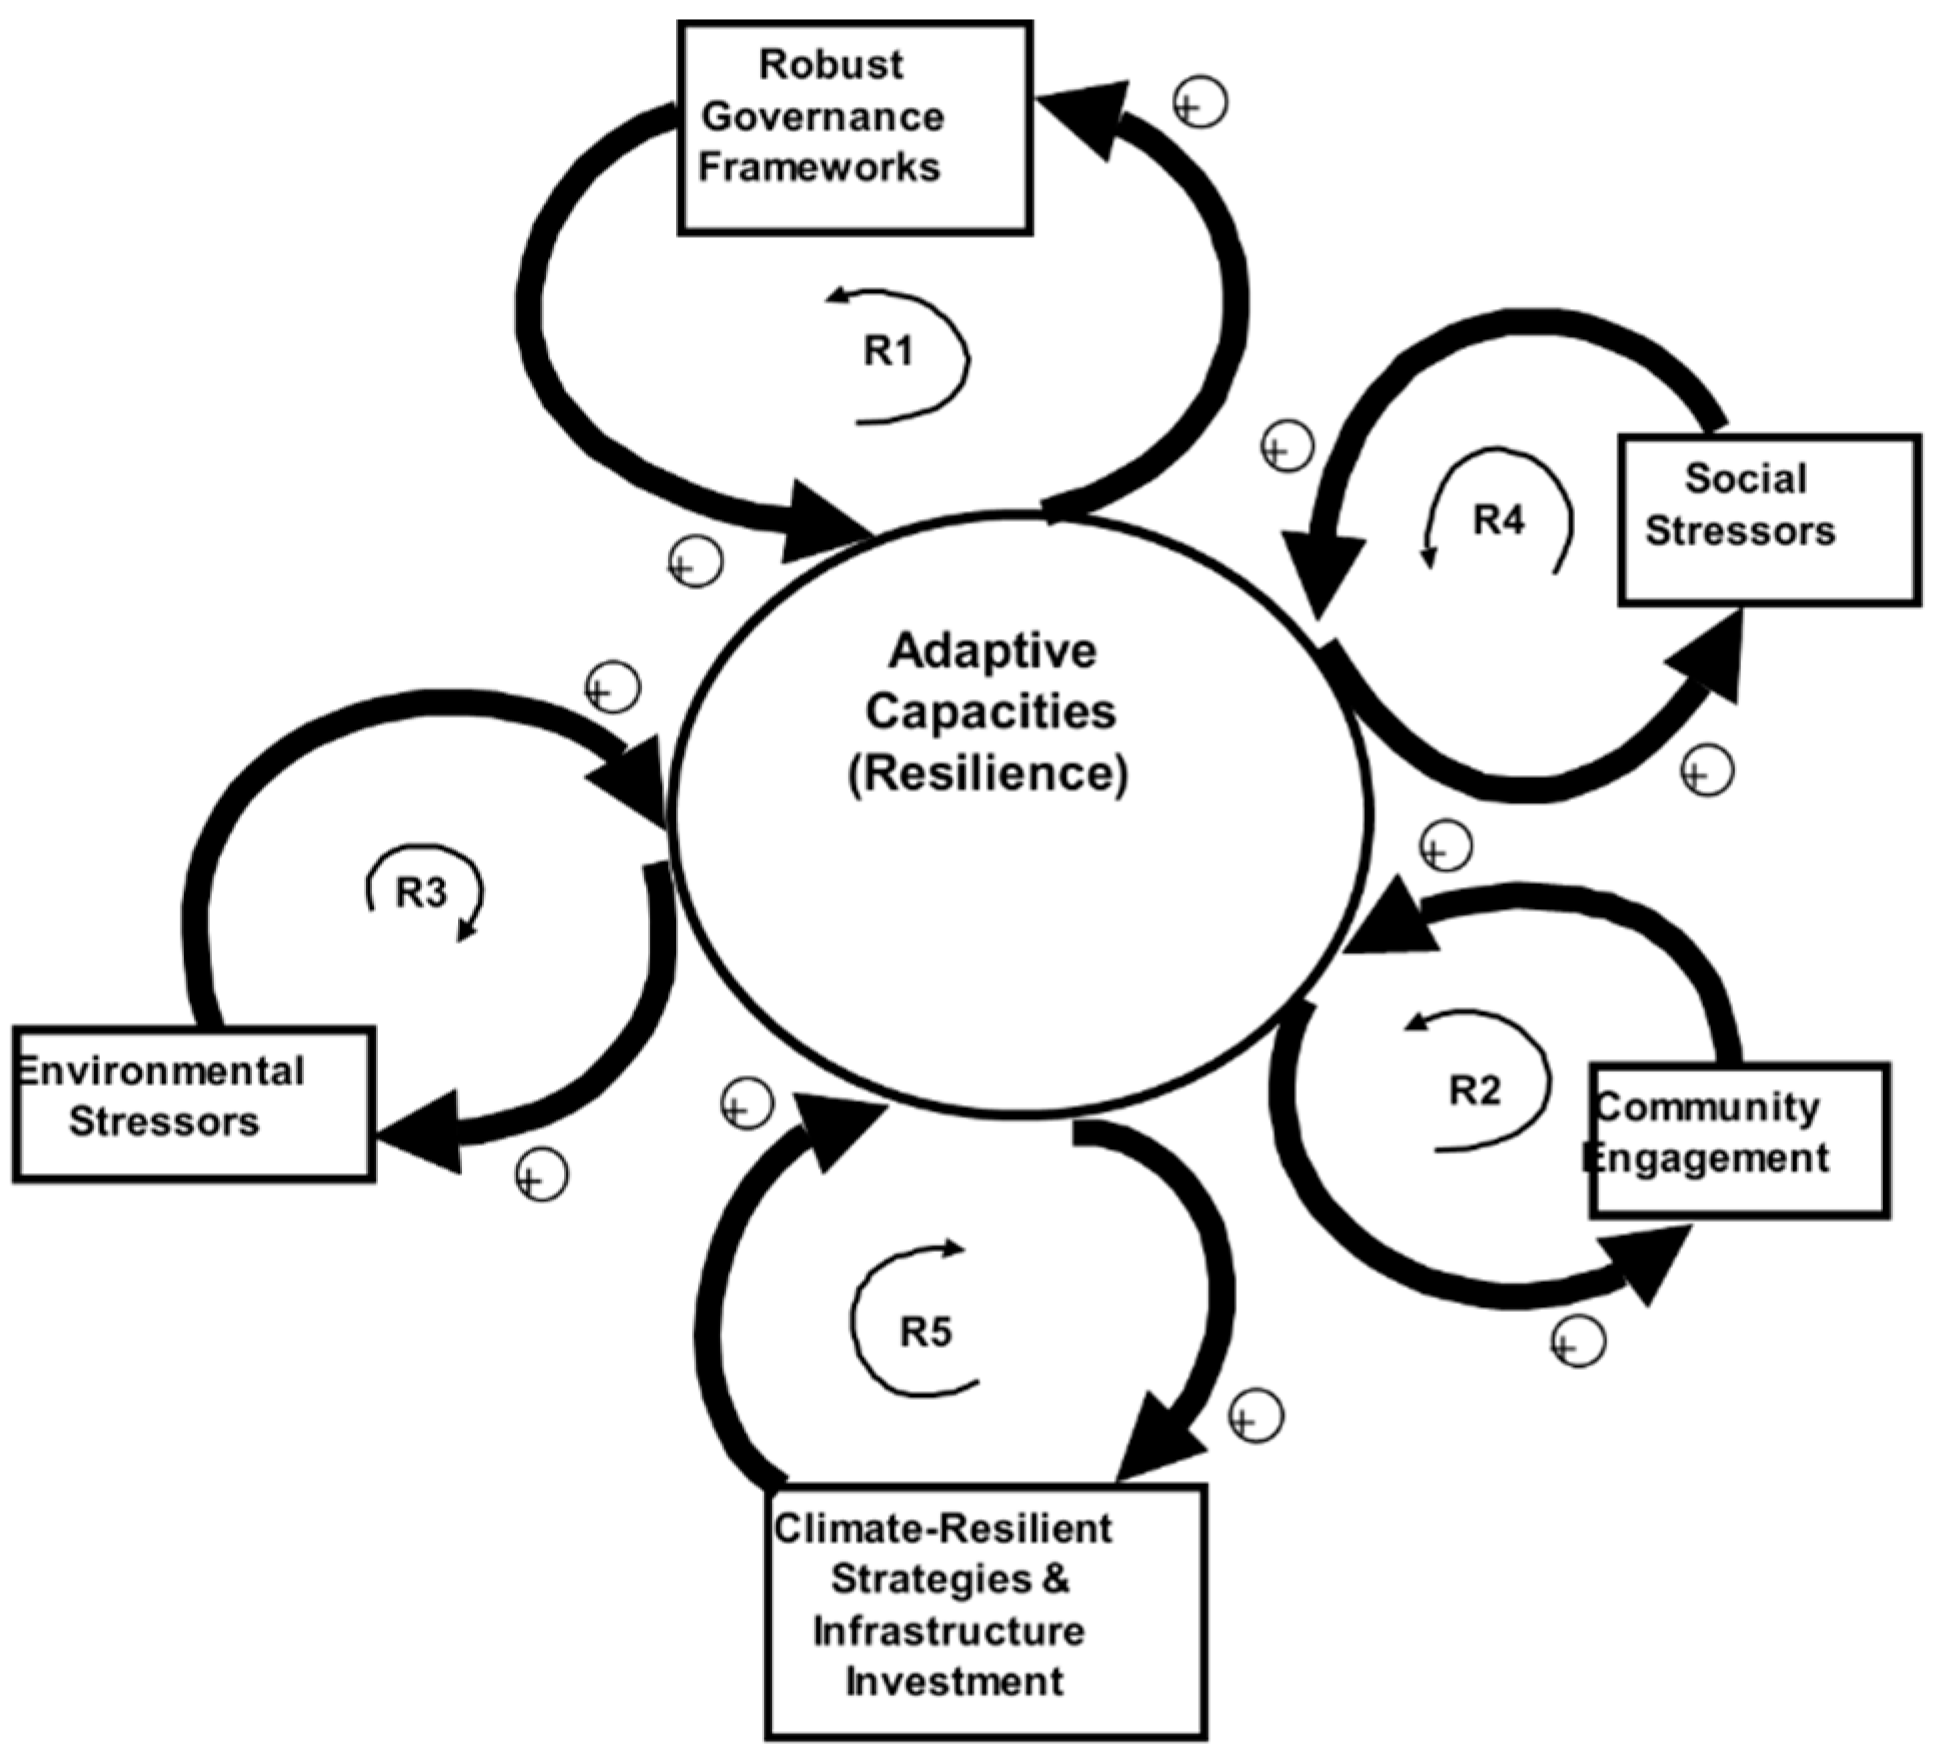
CLDs have been utilized to enhance urban resilience by modeling adaptive capacities in response to environmental and social stressors. For example, Chen et al. (2020) [33] developed CLDs to identify pathways for improving urban adaptive capacities, highlighting the importance of robust governance frameworks and community engagement. These insights have supported cities in crafting climate-resilient strategies and infrastructure investments, fostering long-term resilience as is visually depicted in Figure 3
In this CLD, Figure 3, there are five reinforcing feedback loops responsible for driving and sustaining the adaptive capacities of urban systems in response to environmental and social stressors. Each loop highlights critical dynamics that contribute to long-term resilience:
  • R1: Governance and Adaptive Capacities: Robust governance frameworks—characterized by effective leadership, policies, and accountability—directly enhance the adaptive capacities of urban systems by enabling better resource management. Improved adaptive capacities create stronger urban systems that, in turn, foster further advancements in governance (e.g., through successful implementation of programs that build public trust and political stability). As an example, policies supporting renewable energy deployment leads to stronger energy resilience, which reinforces public support for governance—a vicious cycle.
  • R2: Community Engagement and Adaptive Capacities: Community engagement, including public participation, education, and grassroots initiatives, contributes to enhancing adaptive capacities by fostering local innovation, awareness, and resource mobilization. As adaptive capacities improve, the community becomes more empowered, creating a virtuous cycle of active participation and shared ownership in resilience efforts. One can see as an example that a community involvement in flood preparedness programs leads to more resilient infrastructure, which further encourages public participation in environmental initiatives.
  • R3: Environmental Stressors and Adaptive Capacities: Environmental stressors like extreme weather, resource scarcity, and pollution degrade adaptive capacities, leading to increased vulnerability. However, enhanced adaptive capacities can mitigate these stressors by implementing solutions such as green infrastructure, emissions reductions, and sustainable resource management. This creates a reinforcing loop where reductions in stressors allow for greater focus on strengthening adaptive capacities. For a better understanding of this reinforcing feedback loop, consider the example of a city which invests in green roofs to counter heatwaves, reducing the intensity of the stressor and allowing the city to allocate resources to further improve resilience.
  • R4: Social Stressors and Adaptive Capacities: Social stressors, including inequality, urbanization, and social unrest, strain adaptive capacities by diverting resources and attention. Conversely, strong adaptive capacities can mitigate these stressors through inclusive policies, equitable resource distribution, and improved quality of life. Over time, this positive feedback reduces social tensions and strengthens resilience. As an example, affordable housing programs reduce overcrowding and stress on urban systems, which allows the city to address other social challenges effectively.
  • R5: Infrastructure Investments and Resilience: Adaptive capacities enable targeted investments in climate-resilient infrastructure, such as flood defenses, renewable energy systems, and smart technologies. These investments further enhance the urban system’s resilience by reducing vulnerabilities and increasing efficiency. The cycle of investment and improvement creates a robust reinforcing loop. For example, installing solar-powered microgrids enhances energy resilience, which provides financial savings and reliability, encouraging further investments.
Overall, in this CLD, the five reinforcing feedback loops collectively enable urban systems to respond dynamically and proactively to environmental and social stressors. They highlight the interdependence between robust governance, community engagement, and strategic infrastructure investments, demonstrating how these components work together to build and sustain adaptive capacities. By fostering collaboration among governance structures, engaged communities, and targeted resilience initiatives, these loops create a self-reinforcing cycle of resilience. This continuous process not only mitigates vulnerabilities but also drives sustainable urban development, ensuring that cities are better prepared to face future challenges while supporting long-term well-being and equity.
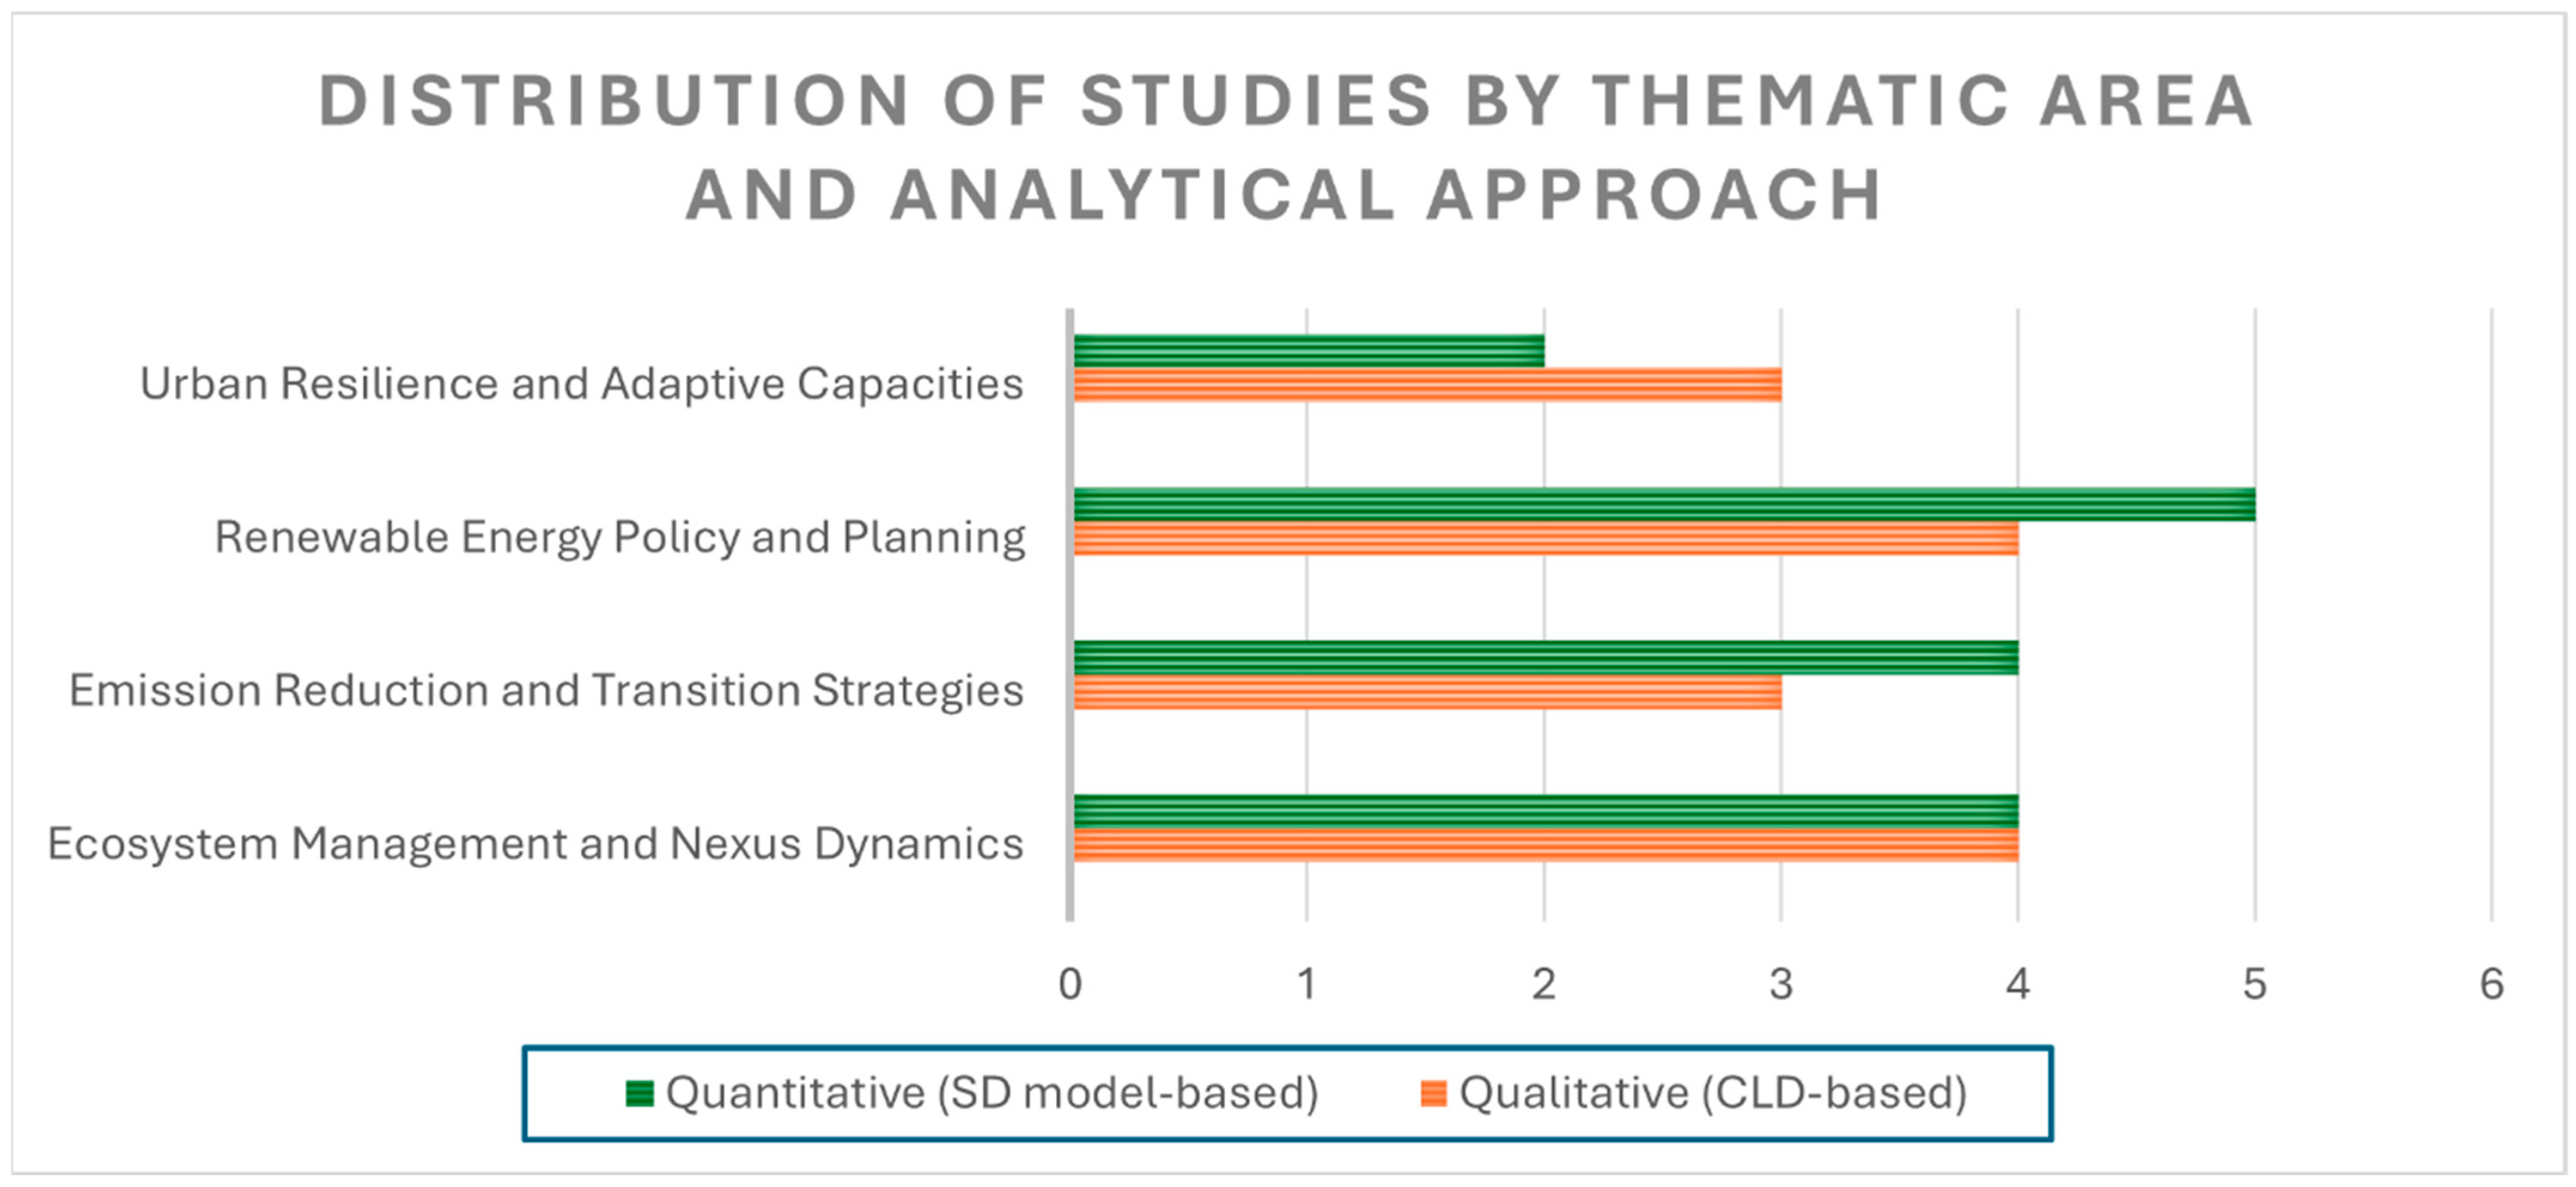
The distribution of the 29 reviewed studies across four major thematic areas and two methodological approaches is summarized in Figure 4. The figure highlights the prevalence of both qualitative (CLD-based) and quantitative (SD model-based) studies in each domain, revealing a balanced methodological mix in most areas, with a notable concentration of quantitative studies in renewable energy policy research.

5. Discussion

5.1. Synthesizing Key Findings

This review reaffirms that causal loop diagrams (CLDs) have become an essential methodological tool for understanding the dynamic complexity of climate and clean energy systems. Across applications in renewable energy planning, emissions reduction, urban adaptation, and ecosystem-based interventions, CLDs consistently uncover key feedback loops—both reinforcing and balancing—that govern system behavior over time. For instance, studies such as those by [12,22] reveal how technological adoption processes generate reinforcing loops that lower costs through learning effects, thereby accelerating diffusion. At the same time, balancing loops are often evident in energy efficiency policies and demand-side interventions, where counteracting mechanisms stabilize outputs like energy consumption or carbon emissions. This dual capacity to expose virtuous and limiting cycles enables CLDs to support the identification of leverage points, anticipate unintended outcomes, and inform more robust clean energy strategies.

5.2. Comparative Insights with Prior Literature

These findings are built upon the foundational insights of system dynamics pioneers have emphasized feedback, time delays, and policy resistance in complex systems [3,7,15]. However, this review expands on prior work by offering a more contemporary and multi-scalar synthesis, capturing developments from 2004 to 2024 that link CLDs to broader sustainability transitions. Unlike earlier CLD applications that focused narrowly on isolated technical systems, recent studies incorporate socio-political, ecological, and institutional feedback. For example, Alvarado et al. [34] demonstrate how CLDs can be applied to co-develop evaluative research propositions in nature-based solutions, while Lawrence et al. [35] integrates policy, resource constraints, and innovation diffusion in modeling wind energy commercialization. Similarly, Qudrat-Ullah [32] introduces climate vulnerability considerations into CLD-based representations of Africa’s renewable energy landscape, showing how environmental disruptions and energy system fragility co-evolve—offering insights not addressed in earlier frameworks such as Ford’s hydrologic models. The trend toward participatory and mixed-method CLD approaches, as emphasized by de Gooyert et al. [36], underscores a growing recognition of the need to bridge technical modeling with stakeholder engagement in sustainability governance.

5.3. Policy Implications and Strategic Leverage Points

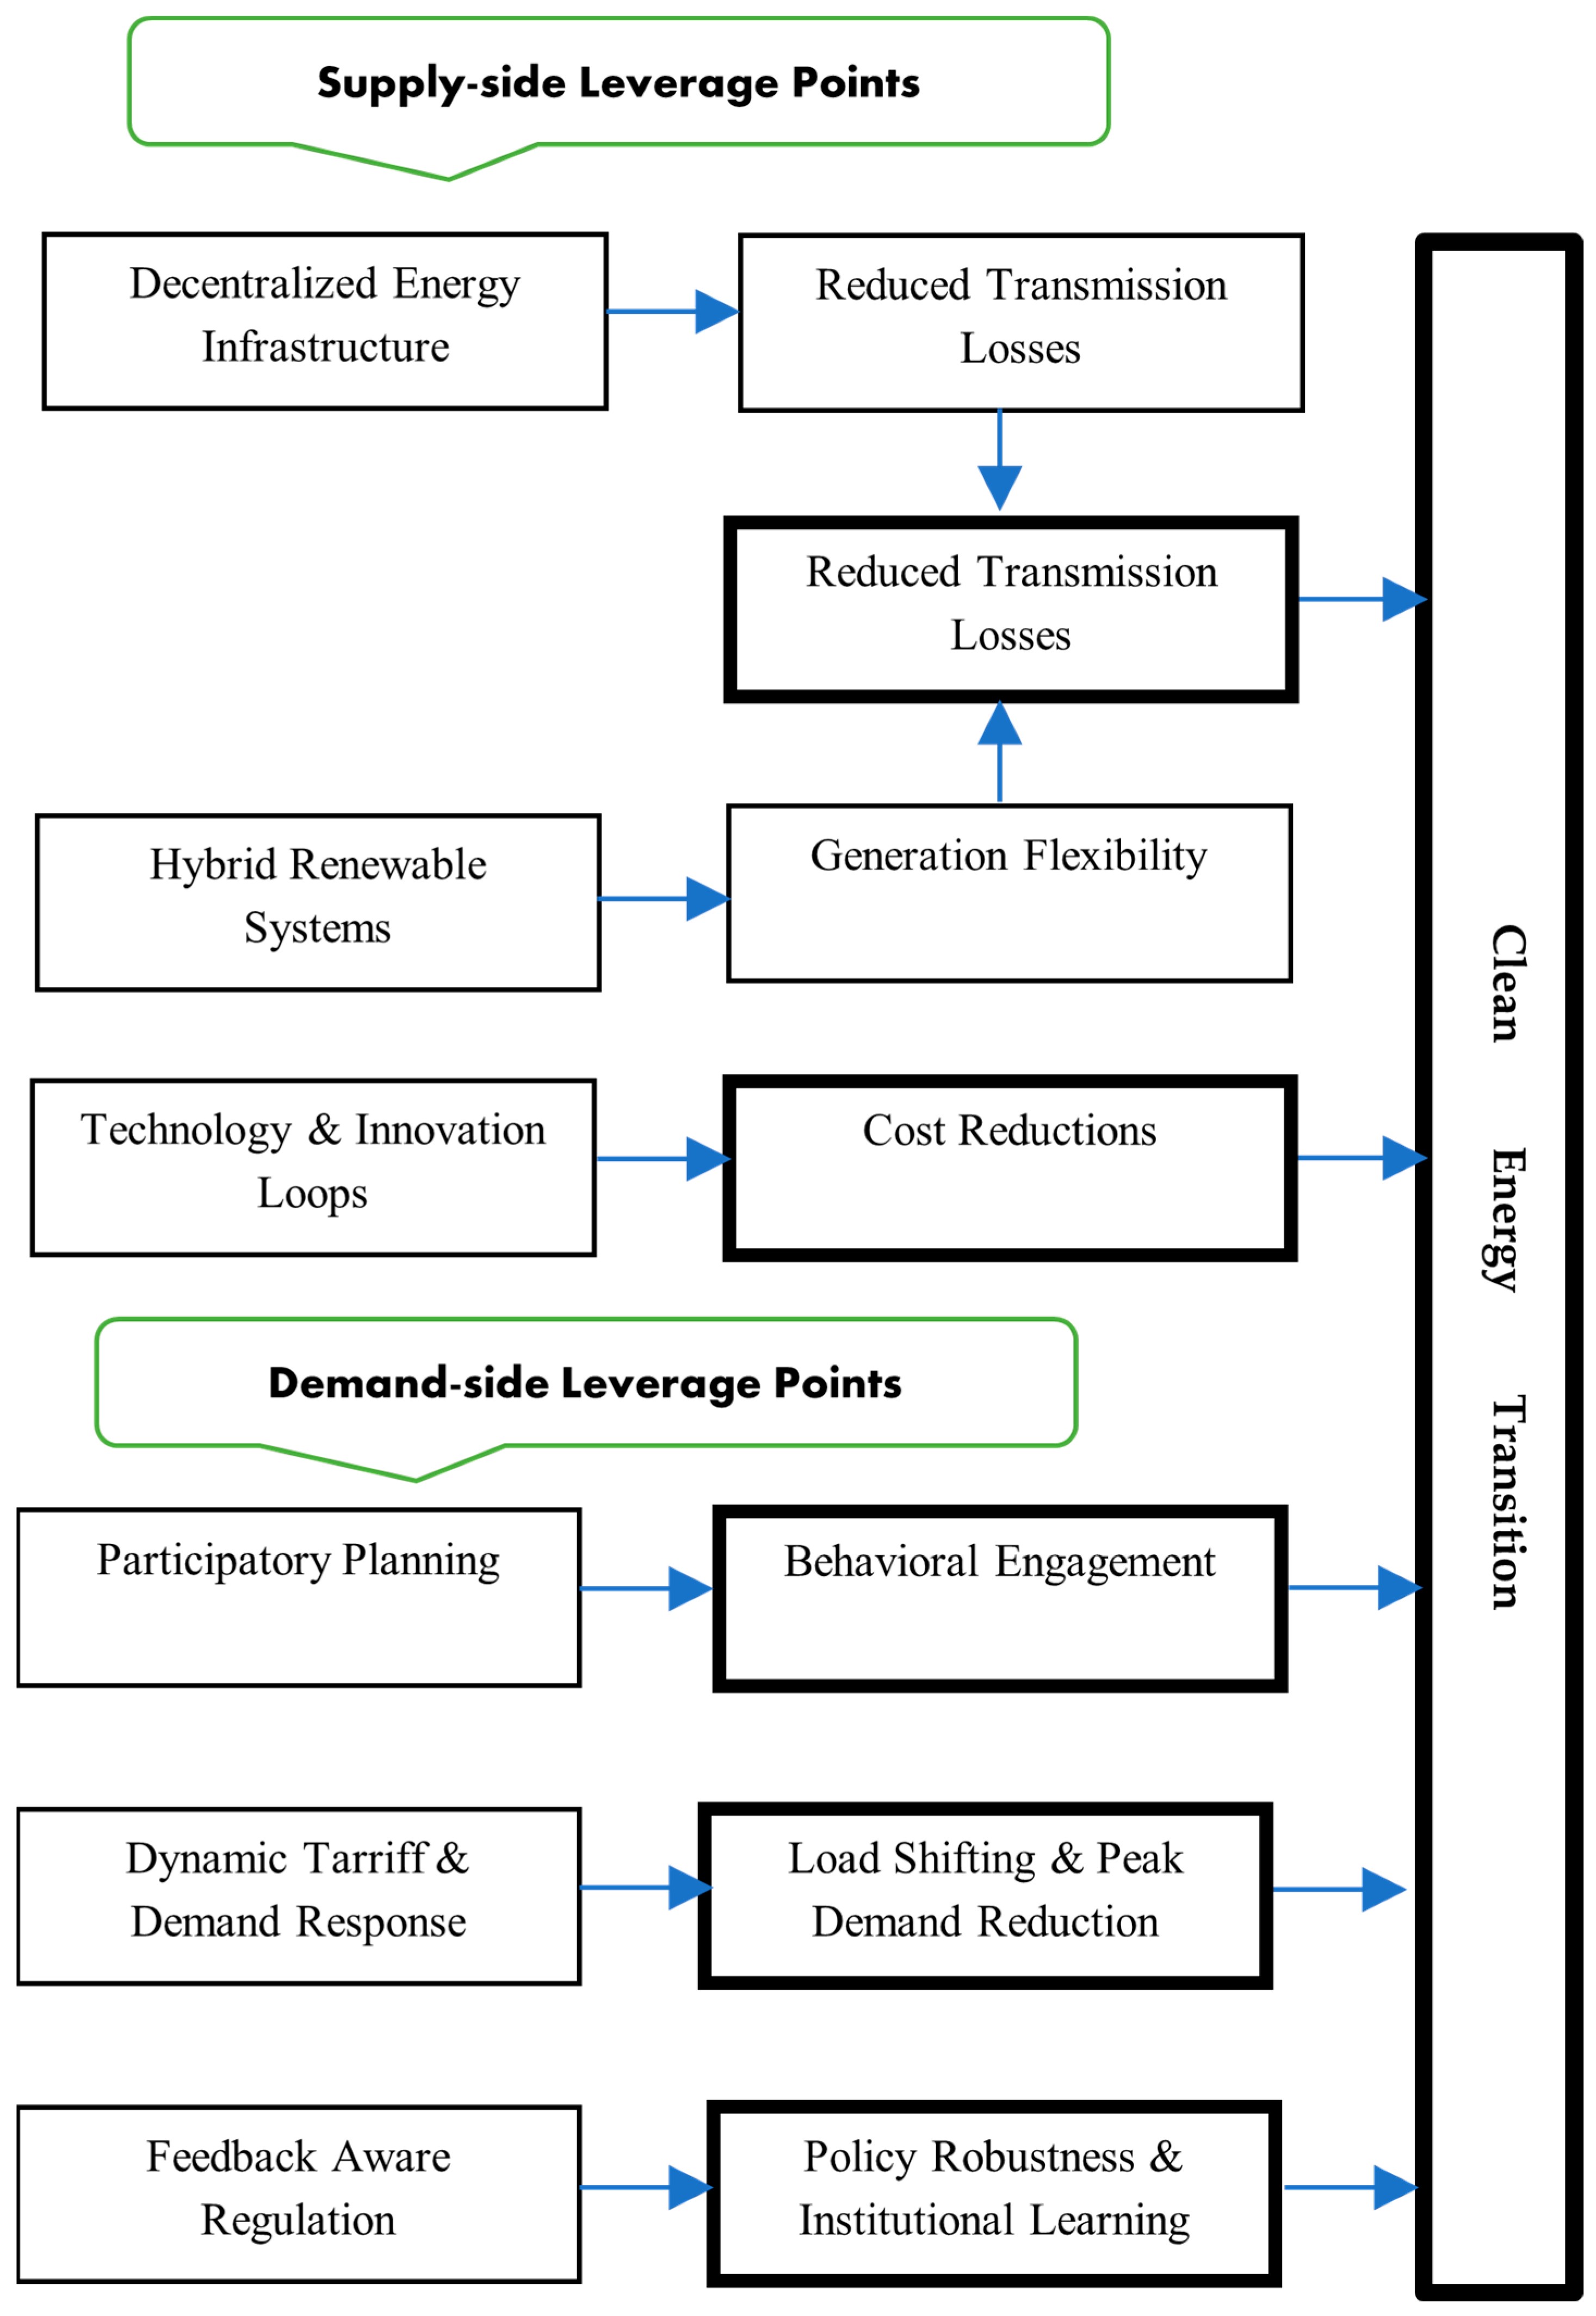
From a policy standpoint, CLD-based studies reveal multiple leverage points for enhancing system resilience and steering clean energy transitions. Figure 5 summarizes these leverage points, mapping key supply- and demand-side interventions onto dynamic feedback structures that influence clean energy outcomes. It illustrates how upstream infrastructure investments and downstream behavioral shifts are interconnected through reinforcing and balancing feedback loops.
On the supply side, the recent literature identifies the critical role of decentralized energy infrastructure, hybrid systems, and technological learning. For instance, Lawrence et al. [35] highlight how targeted policy support for emerging technologies can reinforce innovation loops that reduce costs and accelerate adoption—an effect captured in the cost-reduction loop shown in Figure 5. Similarly, ref. [7] demonstrate how climatic shocks cascade through bioenergy systems, underscoring the need for adaptive infrastructure and resilient supply chains, also reflected in the system flexibility pathways in the figure.
On the demand side, studies emphasize participatory planning, demand-side management, and feedback-aware regulation. Alvarado et al. [34], for example, show how community engagement strengthens behavioral feedback that drives energy efficiency. [22] identify how stakeholder inertia forms balancing loops that must be addressed through inclusive governance. These dynamics are echoed in the lower half of Figure 5, where participatory and regulatory levers converge toward increased policy robustness and cleaner energy transitions.
The reviewed evidence supports a shift toward policies that enhance feedback visibility, reduce systemic blind spots, and enable iterative learning—design principles that align with system dynamics best practices and can improve long-term policy effectiveness [6,37].

5.4. Limitations of CLD-Based Approaches

Despite their strengths, CLDs present several methodological limitations. Their qualitative nature makes it difficult to capture precise magnitudes or spatial heterogeneity in system dynamics. As Vennix [38] and Richardson [15] note, constructing credible CLDs often depends on expert elicitation and group model-building, which can introduce subjectivity and require skilled facilitation. Data scarcity—particularly in low-resource or under-studied regions—can hinder model calibration and validation, as emphasized in [28]. Furthermore, while CLDs are valuable for mapping system structure and feedback logic, their integration with quantitative simulation models is not always straightforward. Translating loops into formalized stock-and-flow representations demands rigorous testing and often iterative refinement, as noted by Richardson [15]. Addressing these challenges requires hybrid approaches that combine qualitative diagramming with empirical data collection, simulation, and participatory engagement to enhance analytical depth and practical utility. This review focused on peer-reviewed, English-language publications indexed in major databases, which may have led to the exclusion of relevant studies in other languages or grey literature sources. While this approach ensures rigor and replicability, it may limit the inclusivity of some regional or practice-based insights.

5.5. Future Research Directions

Emerging technologies and evolving global challenges create new frontiers for CLD-based inquiry. One promising direction involves the convergence of CLDs with digital tools such as AI, real-time monitoring, and IoT platforms, which can enrich feedback detection and enable dynamic simulation. As Qudrat-Ullah and Kayal [37] observe, these integrations could support high-frequency data capture and real-time policy experimentation. Additionally, there is a pressing need to expand the geographical scope of CLD applications. Most existing work focuses on developed, urbanized settings, with limited representation of rural, Indigenous, or fragile contexts where energy and climate systems may behave differently [12,28]. Cross-sectoral modeling also warrants further attention—especially linkages among water, food, health, and energy systems—to capture systemic risks and synergies. Lastly, advancing CLD methodologies through open-source tools and participatory practices can democratize systems thinking, empowering a broader range of actors to visualize, critique, and co-design the feedback structures shaping their futures [22,34]. By pursuing these directions, future research can increase both the accessibility and policy relevance of CLDs in addressing the urgent challenges of climate change and energy transition.

6. Conclusions

Causal loop diagrams (CLDs) offer a powerful framework for understanding the dynamic complexities inherent in climate and clean energy systems. By revealing reinforcing and balancing feedback, CLDs support the design of more adaptive, transparent, and impactful policy interventions. As evidenced across diverse applications, they facilitate systems thinking and help translate interdependence into actionable insights for both researchers and decision-makers.
This review underscores the growing role of CLDs not only as diagnostic tools but also as catalysts for stakeholder engagement and strategic foresight. Their integration with participatory approaches and quantitative models holds particular promises for improving the relevance and robustness of sustainability planning.
To fully realize their potential, future efforts should prioritize methodological integration, broader geographic representation, and the democratization of CLD tools. As energy transitions accelerate and climate risks intensify, the continued evolution and application of CLDs will be vital to shaping resilient and equitable pathways forward.

Funding

This research received no external funding.

Data Availability Statement

All data used in this review are publicly available from cited sources.

Conflicts of Interest

The author declares no conflicts of interest.

References

  1. Intergovernmental Panel on Climate Change (IPCC). Climate Change 2021: The Physical Science Basis; Contribution of Working Group I to the Sixth Assessment Report; Cambridge University Press: Cambridge, UK, 2021. [Google Scholar]
  2. International Energy Agency (IEA). Net Zero by 2050: A Roadmap for the Global Energy Sector; International Energy Agency: Paris, French, 2025. [Google Scholar]
  3. Sterman, J.D. Business Dynamics: Systems Thinking and Modeling for a Complex World; McGraw-Hill: New York, NY, USA, 2000. [Google Scholar]
  4. Meadows, D.H. Thinking in Systems: A Primer; Chelsea Green Publishing: London, UK, 2008. [Google Scholar]
  5. Qudrat-Ullah, H. Understanding the Dynamics of Nuclear Power and the Reduction of CO2 Emissions: A System Dynamics Approach; Springer: Berlin/Heidelberg, Germany, 2022. [Google Scholar] [CrossRef]
  6. Qudrat Ullah, H. A review and analysis of green energy and the environmental policies in South Asia. Energies 2023, 16, 7486. [Google Scholar] [CrossRef]
  7. Ford, A. Modeling the Environment, 2nd ed.; Island Press: Washington, DC, USA, 2010. [Google Scholar]
  8. Crielaard, L.; Uleman, J.F.; Châtel, B.D.L.; Epskamp, S.; Sloot, P.M.A.; Quax, R. Refining the causal loop diagram: A tutorial for maximizing the contribution of domain expertise in computational system dynamics modeling. Psychol. Methods 2024, 29, 169–201. [Google Scholar] [CrossRef]
  9. Geels, F.W.; Ayoub, M. A socio-technical transition perspective on positive tipping points in climate change mitigation: Analysing seven interacting feedback loops in offshore wind and electric vehicles acceleration. Technol. Forecast. Soc. Change 2023, 193, 122639. [Google Scholar] [CrossRef]
  10. Ghorbani, A.; Nascimento, L.; Filatova, T. Growing community energy initiatives from the bottom up: Simulating the role of behavioural attitudes and leadership in The Netherlands. Energy Res. Soc. Sci. 2020, 70, 101782. [Google Scholar] [CrossRef]
  11. Qudrat-Ullah, H. Understanding the dynamics of electricity generation capacity in Canada: A system dynamics approach. Energy 2013, 59, 285–294. [Google Scholar] [CrossRef]
  12. Groundstroem, F.; Juhola, S. Using systems thinking and causal loop diagrams to identify cascading climate change impacts on bioenergy supply systems. Mitig. Adapt. Strateg. Glob. Change 2021, 26, 29. [Google Scholar] [CrossRef]
  13. Zellner, M.; Massey, D.; Rozhkov, A.; Murphy, J.T. Exploring the barriers to and potential for sustainable transitions in urban–rural systems through participatory causal loop diagramming of the food–energy–water nexus. Land 2023, 12, 551. [Google Scholar] [CrossRef]
  14. Kapmeier, F.; Greenspan, A.; Jones, A.; Sterman, J. Science-based analysis for climate action: How HSBC Bank uses the En-ROADS climate policy simulation. Syst. Dyn. Rev. 2021, 37, 333–352. [Google Scholar] [CrossRef]
  15. Richardson, G.P. Problems with causal-loop diagrams. Syst. Dyn. Rev. 1986, 2, 158–170. [Google Scholar] [CrossRef]
  16. Bouchet, L.; Thoms, M.C.; Parsons, M. Using causal loop diagrams to conceptualize groundwater as a social-ecological system. Front. Environ. Sci. 2022, 10, 836206. [Google Scholar] [CrossRef]
  17. Sterman, J.D. Risk communication on climate: Mental models and mass balance. Science 2008, 322, 532–533. [Google Scholar] [CrossRef]
  18. Jalali, M.S.; Beaulieu, E. Strengthening a weak link: Transparency of causal loop diagrams—Current state and recommendations. Syst. Dyn. Rev. 2023, 40, e1753. [Google Scholar] [CrossRef] [PubMed]
  19. Tidwell, V.C.; Moreland, B.D.; Zemlick, K.M. Causal loop diagramming: A critical tool for developing a shared understanding of water systems. J. Water Resour. Plan. Manag. 2020, 146, 04020095. [Google Scholar] [CrossRef]
  20. Mercure, J.-F.; Pollitt, H.; Bassi, A.-M.; Viñuales, J.E.; Edwards, N.R. Modelling complex systems of heterogeneous agents to better design sustainability transitions policy. Glob. Environ. Change 2015, 37, 102–115. [Google Scholar] [CrossRef]
  21. Ioannou, A.E.; Laspidou, C.S. Resilience analysis framework for a water–energy–food nexus system under climate change. Front. Environ. Sci. 2022, 10, 820125. [Google Scholar] [CrossRef]
  22. Gudlaugsson, B.; Abi Ghanem, D.; Dawood, H.; Pillai, G.; Short, M. A qualitative based causal-loop diagram for understanding policy design challenges for a sustainable transition pathway: The case of Tees Valley region, UK. Sustainability 2022, 14, 4462. [Google Scholar] [CrossRef]
  23. Fiddaman, T. Exploring policy options with a behavioral climate-economy model. Syst. Dyn. Rev. 2002, 18, 243–267. [Google Scholar] [CrossRef]
  24. Olivar-Tost, G.; Valencia-Calvo, J.; Castrillón-Gómez, J.A. Towards decision-making for the assessment and prioritization of green projects: Integrating participatory modeling and system dynamics. Sustainability 2020, 12, 10689. [Google Scholar] [CrossRef]
  25. Liu, Y.; Li, Q.; Wang, J. Review of system dynamics in nexus contexts: Quantifying causal loop diagram adoption and methodological rigor. Environ. Model. Softw. 2023, 161, 105504. [Google Scholar] [CrossRef]
  26. Luna-Reyes, L.F.; Andersen, D.F. Collecting and analyzing qualitative data for system dynamics: Methods and models. Syst. Dyn. Rev. 2003, 19, 271–296. [Google Scholar] [CrossRef]
  27. Valkering, P.; Yücel, G.; Gebetsroither-Geringer, E.; Markvica, K.; Meynaerts, E.; Frantzeskaki, N. Accelerating transition dynamics in city regions: A qualitative modeling perspective. Sustainability 2017, 9, 1254. [Google Scholar] [CrossRef]
  28. Qudrat-Ullah, H. Exploring the Dynamics of Renewable Energy and Sustainable Development in Africa; Springer: Berlin/Heidelberg, Germany, 2023. [Google Scholar] [CrossRef]
  29. Naeem, K.; Zghibi, A.; Elomri, A.; Mazzoni, A.; Triki, C. A literature review on system dynamics modeling for sustainable management of water supply and demand. Sustainability 2023, 15, 6826. [Google Scholar] [CrossRef]
  30. Sterman, J.D.; Booth Sweeney, L. Understanding public complacency about climate change: Adults’ mental models of climate change violate conservation of matter. Clim. Change 2007, 80, 213–238. [Google Scholar] [CrossRef]
  31. Sušnik, J.; Vamvakeridou-Lyroudia, L.S.; Savic, D.A.; Kapelan, Z. Integrated system dynamics modelling for water-scarce city planning and water-sensitive urban design. Environ. Model. Softw. 2013, 41, 15–29. [Google Scholar] [CrossRef]
  32. Giordano, R.; Osann, A.; Henao, E.; López, M.L.; Piqueras, J.G.; Nikolaidis, N.P.; Lilli, M.; Coletta, V.R.; Pagano, A. Causal loop diagrams for bridging the gap between Water-Energy-Food-Ecosystem Nexus thinking and Nexus doing: Evidence from two case studies. J. Hydrol. 2025, 650, 132571. [Google Scholar] [CrossRef]
  33. Chen, C.; Wei, Z.; Shi, L.; Wu, G. Exploring the dynamics of urban resilience using system dynamics modeling: A case study of flood management in Shanghai. Environ. Res. 2020, 185, 109318. [Google Scholar] [CrossRef]
  34. Alvarado, M.; Garrett, J.; Fullam, J.; Lovell, R.; Guell, C.; Taylor, T.; Garside, R.; Zandersen, M.; Wheeler, B.W. Using causal loop diagrams to develop evaluative research propositions: Opportunities and challenges in applications to nature-based solutions. Syst. Dyn. Rev. 2023, 39, 411–429. [Google Scholar] [CrossRef]
  35. Lawrence, S.; Herber, D.R.; Shahroudi, K.E. Leveraging system dynamics to predict the commercialization success of emerging energy technologies: Lessons from wind energy. Energies 2025, 18, 2048. [Google Scholar] [CrossRef]
  36. de Gooyert, V.; Rouwette, E.; van Kranenburg, H.; Freeman, E.; van Breen, H. Sustainability transition dynamics: Towards overcoming policy resistance. Technol. Forecast. Soc. Change 2016, 111, 135–145. [Google Scholar] [CrossRef]
  37. Qudrat-Ullah, H.; Kayal, A. (Eds.) Climate Change and Energy Dynamics in the Middle East; Springer: Berlin/Heidelberg, Germany, 2019. [Google Scholar] [CrossRef]
  38. Vennix, J.A.M. Group Model Building: Facilitating Team Learning Using System Dynamics; Wiley: New York, NY, USA, 1996. [Google Scholar]
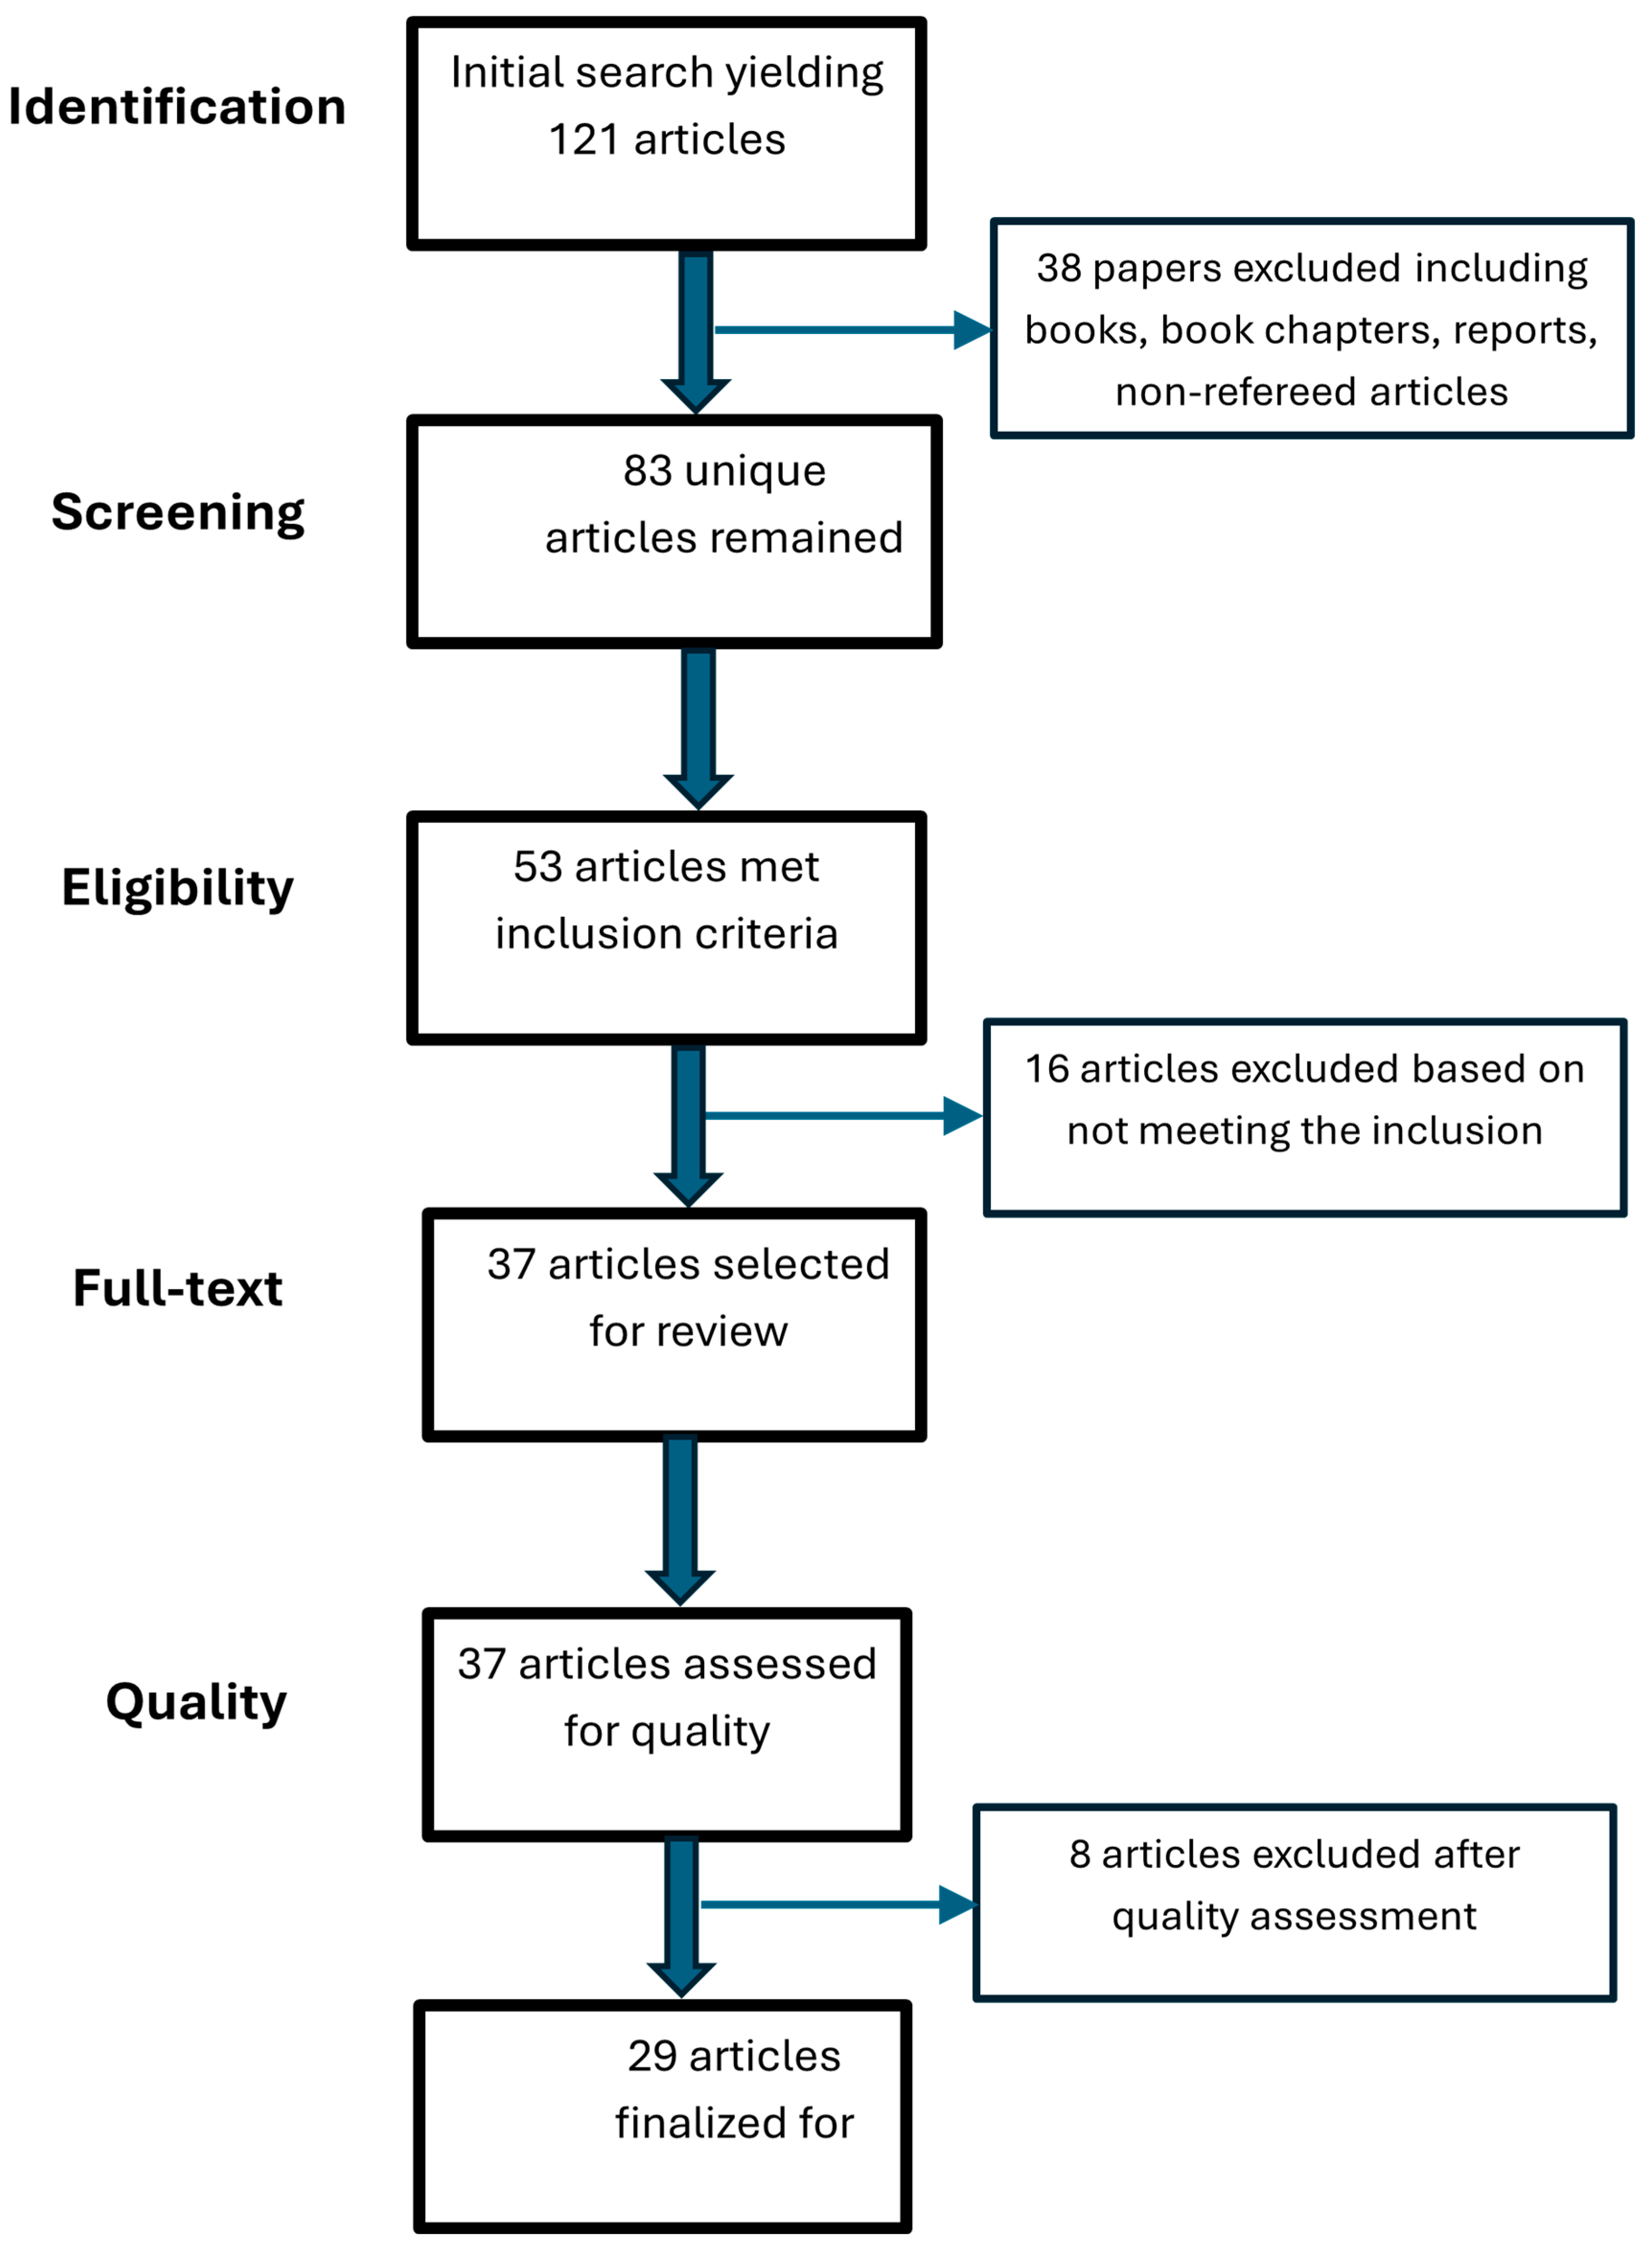
Figure 1. The methodological flowchart.
Energies 18 04200 g001
Figure 2. Balancing and reinforcing loops in emission reduction strategies. [An arrow between any two variables with a positive (+) sign near its head indicates a positive relationship—an increase or decrease in the variable at the tail of the arrow will result in a corre-sponding increase or decrease in the variable at the head of the arrow. Conversely, a negative (–) sign indicates a negative relationship—an increase or decrease in the variable at the tail will result in a decrease or increase, respectively, in the variable at the head].
Energies 18 04200 g002
Figure 3. CLD representation of key feedback loops supporting urban resilience.
Energies 18 04200 g003
Figure 4. Distribution of 29 studies by thematic areas and methodological approaches.
Energies 18 04200 g004
Figure 5. Strategic policy leverage points for clean energy system transformation.
Energies 18 04200 g005
Table 1. A summary of the thematic areas and major insights.
Thematic AreaRepresentative StudiesKey InsightsPolicy/Practical Implications
Renewable Energy Integration[6,8,9,11]CLDs reveal how subsidies, infrastructure, and social capital drive renewable adoption dynamicsTargeted subsidies, infrastructure investment, community engagement crucial for uptake
Grid Stability & Demand Management[12,14,15] CLDs help optimize supply–demand balance, storage, and consumer behavior to enhance grid resiliencePromote energy storage, demand response, and dynamic pricing
Feedback-Driven Policy AnalysisBouchet et al. (2022); Sterman (2008); Jalali & Beaulieu (2023); [11,16,18]Feedback-aware policies improve resource sustainability, reduce rebound effects, and boost stakeholder buy-inAdopt adaptive policies with transparent communication
Ecosystem & Climate Dynamics[9,15,25,27] CLDs illuminate feedback linking land use, water resources, biodiversity, and climate adaptationIntegrate ecological feedback into climate and conservation policy
Climate Impacts on Renewables[6,28]Climate variability affects renewable efficiency and availability, posing challenges for grid stabilityInvest in adaptive infrastructure and diversify energy portfolios
Table 2. Impact of CLD applications on renewable energy policies.
Key StudyFocus AreaInsights GainedImpact on Policy Decisions
[28]Renewable energy in AfricaInterplay between policy, supply, and environmental outcomesIdentified leverage points for sustainability
[14]Energy storage and grid stabilityFeedback effects on energy storage and grid reliabilityAccelerated storage deployment through policy
Geels & Ayoub (2023) [9]Transition pathways in energy systemsSocio-technical feedback loops driving transitions in renewable energy adoptionInformed policies for phased transitions and stakeholder alignment
[12]Community-driven renewable programsAdaptive governance in community-based renewable energy programsPromoted participatory policy frameworks for energy access
[8]Circular economy in energy systemsInteraction of renewable energy and resource efficiency through closed-loop systemsShaped policies encouraging integration of renewable energy and recycling
[18]Energy equity and accessibilityFeedback loops impacting equitable access to renewable energy resourcesEnhanced policies ensuring equitable energy distribution
[15]Net-zero emissions strategiesLong-term system dynamics of decarbonization effortsDeveloped timelines and pathways for achieving carbon neutrality
[13]Urban energy resilienceSystemic feedback between urban planning and energy resilienceStrengthened urban policies integrating renewable energy with climate goals
Table 3. Impact of CLD-based studies on emission reduction and energy transition policies.
Key StudyFocus AreaInsights GainedImpact on Policy Decisions
[17]Fossil fuel emissions and feedback structuresIdentified reinforcing loops (e.g., fossil fuel lock-in) and balancing loops (e.g., climate-policy response)Supported systems-based climate policy modeling and highlighted feedback delays in emission reductions
[29]U.S. energy transition modelingUsed CLDs to simulate energy transition scenarios with policy, technology, and emission feedback loopsInformed scenario-based energy planning with phased fossil fuel decline and renewable uptake
[7]Climate policy and system delaysHighlighted time delays between emissions, climate impacts, and policy feedbackEncouraged long-term planning horizons and proactive policy intervention despite delayed system responses
[7]Carbon policy in electric power systemsModeled policy impact using CLDs to track emissions, pricing, and adoption of renewablesInfluenced regulatory frameworks for emission caps and renewable energy incentives
[23]Integrated climate–economy feedbackDemonstrated how economic and technological factors reinforce or balance climate outcomes via policyShaped integrated assessment models (IAMs) that support emission pricing and innovation subsidies
[23]Technological change and policy designShowed how R&D investment feedback affect future mitigation costs and energy adoptionInformed flexible, adaptive policies that support clean tech innovation and cost curve shifts
[30]Public understanding of climate dynamicsCLD-based simulations revealed public misperceptions of emission lags and feedbackLed to climate communication strategies aimed at improving policy support through better systems literacy
Table 4. CLD-based insights in ecosystem management.
StudyFocus AreaInsights GainedApplications
[31]Water–energy–food nexus in urban areasTrade-offs and synergies in resource managementInformed integrated urban planning
[32]Social-ecological systemsDynamic interactions in ecosystem resilienceAdaptive ecosystem management
[16]River system dynamicsFeedback mechanisms between hydrological cycles and biodiversityImproved strategies for river ecosystem conservation
[9]Transition pathways in ecosystemsSocio-ecological feedback loops driving system transitionsPolicy recommendations for ecosystem restoration
[21]Urban ecosystem servicesCLD modeling of urban ecosystem service provision and demandStrengthened urban sustainability strategies
[12]Ecosystem-based governanceAdaptive governance in managing fragmented ecosystemsParticipatory conservation approaches
[25]Climate adaptation strategiesFeedback loops in climate adaptation and biodiversity preservationResilient ecosystem planning for climate impacts
[29]Desertification and land degradationCLD analysis of land use and resource depletion dynamicsStrategies for sustainable land management
[15]Circular economy and ecosystemsInteractions between material flows and ecosystem healthPolicy integration of circular economy principles
[13]Urban resilience and ecosystem servicesFeedback between urban planning and ecosystem healthIntegrated urban and ecological resilience frameworks
[17]Climate systems modelingLong-term dynamics of greenhouse gas emissions and climate impactsGlobal climate policy formulation
[27]Adaptive strategies for ecosystem dynamicsModeling tipping points in ecosystem resilienceEarly warning systems for ecosystem threshold management
Disclaimer/Publisher’s Note: The statements, opinions and data contained in all publications are solely those of the individual author(s) and contributor(s) and not of MDPI and/or the editor(s). MDPI and/or the editor(s) disclaim responsibility for any injury to people or property resulting from any ideas, methods, instructions or products referred to in the content.