Article

Preliminary Comparison of Ammonia- and Natural Gas-Fueled Micro-Gas Turbine Systems in Heat-Driven CHP for a Small Residential Community

by
Mateusz Proniewicz
1,*,
Karolina Petela
1,
Christine Mounaïm-Rousselle
2,
Mirko R. Bothien
3,
Andrea Gruber
4,
Yong Fan
5,
Minhyeok Lee
6 and
Andrzej Szlęk
1,*
1
Department of Thermal Technology, Faculty of Energy and Environmental Engineering, Silesian University of Technology, Konarskiego 22, 44-100 Gliwice, Poland
2
PRISME, University Orléans, INSA-CVL, F-45072 Orléans, France
3
Institute of Energy Systems and Fluid Engineering, Zürich University of Applied Sciences (ZHAW), Technikumstrasse 9, 8401 Winterthur, Switzerland
4
SINTEF Energy Research, Division of Energy Research, Sem Sælands 11, 7034 Trondheim, Norway
5
National Institute of Advanced Industrial Science and Technology (AIST), 1-1-1 Umezono, Tsukuba 305-8560, Japan
6
Department of Mechanical Engineering, The University of Tokyo, 7-3-1 Hongo, Tokyo 113-8656, Japan
*
Authors to whom correspondence should be addressed.
Energies 2025, 18(15), 4103; https://doi.org/10.3390/en18154103 (registering DOI)
Submission received: 1 July 2025 / Revised: 21 July 2025 / Accepted: 28 July 2025 / Published: 1 August 2025
(This article belongs to the Special Issue Clean and Efficient Use of Energy: 3rd Edition)

Abstract

This research considers a preliminary comparative technical evaluation of two micro-gas turbine (MGT) systems in combined heat and power (CHP) mode (100 kWe), aimed at supplying heat to a residential community of 15 average-sized buildings located in Central Europe over a year. Two systems were modelled in Ebsilon 15 software: a natural gas case (benchmark) and an ammonia-fueled case, both based on the same on-design parameters. Off-design simulations evaluated performance over variable ambient temperatures and loads. Idealized, unrecuperated cycles were adopted to isolate the thermodynamic impact of the fuel switch under complete combustion assumption. Under these assumptions, the study shows that the ammonia system produces more electrical energy and less excess heat, yielding marginally higher electrical efficiency and EUF (26.05% and 77.63%) than the natural gas system (24.59% and 77.55%), highlighting ammonia’s utilization potential in such a context. Future research should target validating ammonia combustion and emission profiles across the turbine load range, and updating the thermodynamic model with a recuperator and SCR accounting for realistic pressure losses.

1. Introduction

Climate change is imposing environmental policies focused on decarbonization. To address this, adopting highly efficient solutions that utilize carbon-free sources is essential. However, the energy transition poses a challenge due to the high demand for electrical energy and heat, coupled with the need to ensure reliability, affordability, and environmental sustainability. One of the most viable ways to produce electrical energy and heat is through Combined Heat and Power (CHP) systems (also known as cogeneration). CHP systems, valued for their high thermal efficiency—up to 90% [1]—and cost-effectiveness, are applicable at both large and small scales, offering reduced operational costs and emissions, and are particularly useful for heat generation, which cannot be efficiently transported over long distances [2]. Therefore, such systems are widely adopted in district heating networks [3]. Traditionally, CHP systems rely on internal combustion engines and gas or steam turbines, but integrating them with fuel cells or micro-gas turbines has recently gained attention as well [4]. Leveraging the benefits of CHP in designing efficient systems has been proven by numerous studies. For instance, Wu and Wang evaluated the effectiveness of combined cooling, heating, and power (CCHP) systems in addressing energy challenges, highlighting the need for government and industry collaboration [5]. A study by Mago et al. emphasized that coupling natural gas CHP with cooling systems in small American commercial buildings can significantly reduce primary energy consumption, costs, and emissions [6]. Wang et al. identified optimal configurations for gas-fired-boiler-integrated CHP systems to maximize cost savings [7].
Conventionally, CHP systems have been integrated as fossil-based installations such as coal- or gas-fueled boilers; however, such systems may be designed for renewable fuels as well, with solid biomass (wood chips, pellets) and gaseous biomass (landfill or anaerobic digestion biogas) systems as the most common options [4]. This trend is apparent in the literature; assessment of combined-cycle CHP in terms of varied biomass feed was presented by Wijesekara et al., where optimal feedstock composition towards the system’s best efficiency was identified [8]. Huang et al. presented a comprehensive technical, environmental, and economic comparison of two biomass-based CHP configurations integrated with commercial buildings: Organic Rankine Cycle (ORC) and gasification. Both options have been identified as better choices compared to biomass-fired electricity generation [9]. Perrone et al. analyzed micro-combined cooling, heating, and power (CCHP) based on an internal combustion engine fueled by syngas from biomass gasification, where high system efficiency and economic feasibility were shown [10]. Algieri et al. demonstrated the integration of biofuel-driven CHP with renewable sources for a smart community towards achieving efficient system configuration [11].
However, to satisfy the global energy demand in line with sustainable development goals (particularly SDG 7 Affordable and Clean Energy and SDG 13 Climate Action), there is a need for the diversification of energy sources, as noted in the Net Zero by 2050 report presented by IEA [12]. Apart from bioenergy, one of the other pillars is hydrogen and hydrogen-based fuels such as ammonia. Hydrogen has gained attention due to its renewable nature, as it can be produced via electrolysis where the source of electrical energy can be renewable (green hydrogen), its high lower heating value on a mass basis [13], zero carbon emissions upon its combustion, and its suitability for a broad set of applications, as comprehensively reviewed by Yu et al., who indicated fuel cells as the most efficient option for hydrogen utilization [14]. This is because the heat released during alkaline or PEM electrolysis can be recovered and integrated with the district heating grid, boosting overall system efficiency in a CHP context. Moradpoor et al. explored such integration—relocating electrolyzers from hydrogen-user sites closer to the district heating grid and accounting for the transportation cost of hydrogen—and found that, although the direct economic gain is small, the primary advantage lies in the primary energy reduction required for the heating grid [15]. The direct utilization of pure hydrogen to supply heat for a district heating network is not emphasized in the literature, as reported in the review published by Rieksta et al. [16].
Nevertheless, the storage of hydrogen poses a challenge due to its low volumetric heating value compared to LNG or ammonia, as presented in Table 1. Cooling hydrogen to –253 °C or compressing it to hundreds of bars is also energy-intensive; therefore, its derivative, ammonia, emerges as a viable alternative. Ammonia, produced primarily via the Haber–Bosch process from nitrogen and hydrogen [17], is also a renewable and carbon-free fuel; however, its storage and transport are less demanding. Additionally, its logistics benefit from an existing global infrastructure (terminals, pipelines, tankers) originally built for the fertilizer industry, facilitating the deployment of ammonia without major new capital infrastructure investment [18]. As such, ammonia can serve either as a hydrogen carrier—it can be reconverted to hydrogen after transport—or as an independent, hydrogen-derived fuel supporting energy mix optimization in the ongoing energy transition. Moreover, large-scale seasonal storage of ammonia offers a practical route to balancing variable renewables, additionally contributing to achieving decarbonization goals.
The transition from fossil fuels to ammonia has been addressed from multiple perspectives. Valera-Medina and Banares-Alcantara explored the role of green ammonia in the energy transition, focusing on its applications in power generation, transportation, and heating, and analyzed methods to extract and utilize ammonia’s stored energy [20]. Chehade and Dincer discussed ammonia as a superior alternative to hydrogen due to its higher energy density and established transportation networks, while also addressing the challenges of ammonia combustion and its broader implementation [21]. Tawalbeh et al. reviewed the potential of ammonia as an energy storage medium, highlighting its advantages for peak shaving and its independence from climate-related constraints [22]. Salmon and Bañares-Alcántara discussed ammonia as a derivative of hydrogen, exploring its market potential and identifying a research gap in reliable production and transportation cost assessments [23]. Proniewicz et al., Boero et al., and Frattini et al. considered the environmental impacts and efficiency of ammonia production technologies, proving its potential for reducing climate change impacts [17,24,25].
The utilization of ammonia as a fuel in a CHP context has been shown by Duong et al., who modelled a cascade plant combining a solid oxide fuel cell (SOFC), a gas turbine (GT), and sequential steam, Kalina, and organic Rankine cycles (SRC, KC) to co-produce electricity and hot water, achieving around 60% energy efficiency overall [26]. On a regional level, Bounitsis and Charitopoulos presented a spatially oriented assessment using a clustering method to co-optimize Great Britain’s power and heat capacity planning and operation, including hydrogen and ammonia options to be used in combined-cycle gas turbine systems. The authors proved the inclusion of ammonia plays a key role, but emphasized the need for more research on techno-economic hydrogen/ammonia technologies towards model validation [27]. An integration of ammonia in a CHP module based on an internal combustion engine for supplying heat to a district heating grid has been shown by Sachajdak et al. The study confirmed the technical feasibility of using ammonia in this context and, based on the calculated heat price, indicated its potential cost-effectiveness [28]. To summarize the research interest in renewable-based CHP systems, a comparison of selected studies is provided in Table 2.
Nonetheless, transitioning to ammonia for combustion-based applications poses several challenges associated with its intrinsic characteristics: narrow flammability limit, a low laminar flame speed, NOx and N2O formation, possible ammonia slip, corrosivity, and toxicity [29]. Therefore, designing an efficient combustion system is not a trivial task and is more complex compared to typical natural gas-based systems. Some of the most common options to address these issues include blending ammonia with methane or hydrogen, or focusing on the MILD combustion process [30]. To reduce emissions, exhaust treatments like Selective Catalytic Reduction (SCR) can be employed. From the system-level performance of a micro-gas turbine, these characteristics, coupled with the LHV of ammonia compared to natural gas (18.6 MJ/kg versus 50 MJ/kg, respectively [31]) will impact the mass flow and energy balance compared to a natural gas-fueled system.
However, the literature already confirms that an ammonia-fueled gas turbine can be successfully operated. A micro-gas turbine at 39 kWe running on pure ammonia was presented by Iki et al. [32]. The study demonstrated that retrofitting the combustion chamber and optimizing the SCR via the precise dosing of NH3 at the inlet to the SCR (since NH3 is a reagent used for the SCR) can achieve reduced emissions and satisfactory performance. The feasibility of the SCR for ammonia-based combustion is additionally strengthened by the fact that NH3 present in the exhaust (residual ammonia) can participate with NOₓ in the SCR, as shown by Kuta et al. [33]. The effective operation of an ammonia-fired turbine was also reported by Kurata et al. [34], who achieved stable combustion in a range of 18.4–44.4 kWe of electrical load for a micro-gas turbine system integrated with a recuperator (indicating its minimum operating load at around 40%). The premise that ammonia-fired micro-gas turbine systems are plausible and should be investigated under their partial-load conditions for CHP utilization was a foundation for the study presented by Bonasio and Ravelli [31]. First, they modelled the Turbec T100 Power and Heat system (which is equipped with a recuperator) and benchmarked it against the technical specifications of this unit for natural gas fuel. Second, they conducted off-design analysis based on performance maps (performance dependent on inlet and rotational speed conditions) and changed the fuel feed (varying the ammonia share from 0 to 1), observing that total CHP efficiency remained the same despite a slight drop in electrical efficiency when switching to ammonia.
The literature review confirms that efficient and sustainable technological systems, with the ammonia-based CHP system as fitting these criteria, may serve towards successful decarbonization. However, very limited research on micro-gas turbine performance under partial load conditions, as well as a lack of research on its integration with the district heating grid, is a research gap that this study addresses. The concept proposed in this work is to compare two independent systems: one fueled by natural gas and the second fueled by pure ammonia, and define how efficiently they could provide heat to a residential community, assuming an idealized and simplified technological setup of a micro-gas turbine for the CHP, and maintaining consistent on-design assumptions for both scenarios.

2. Materials and Methods

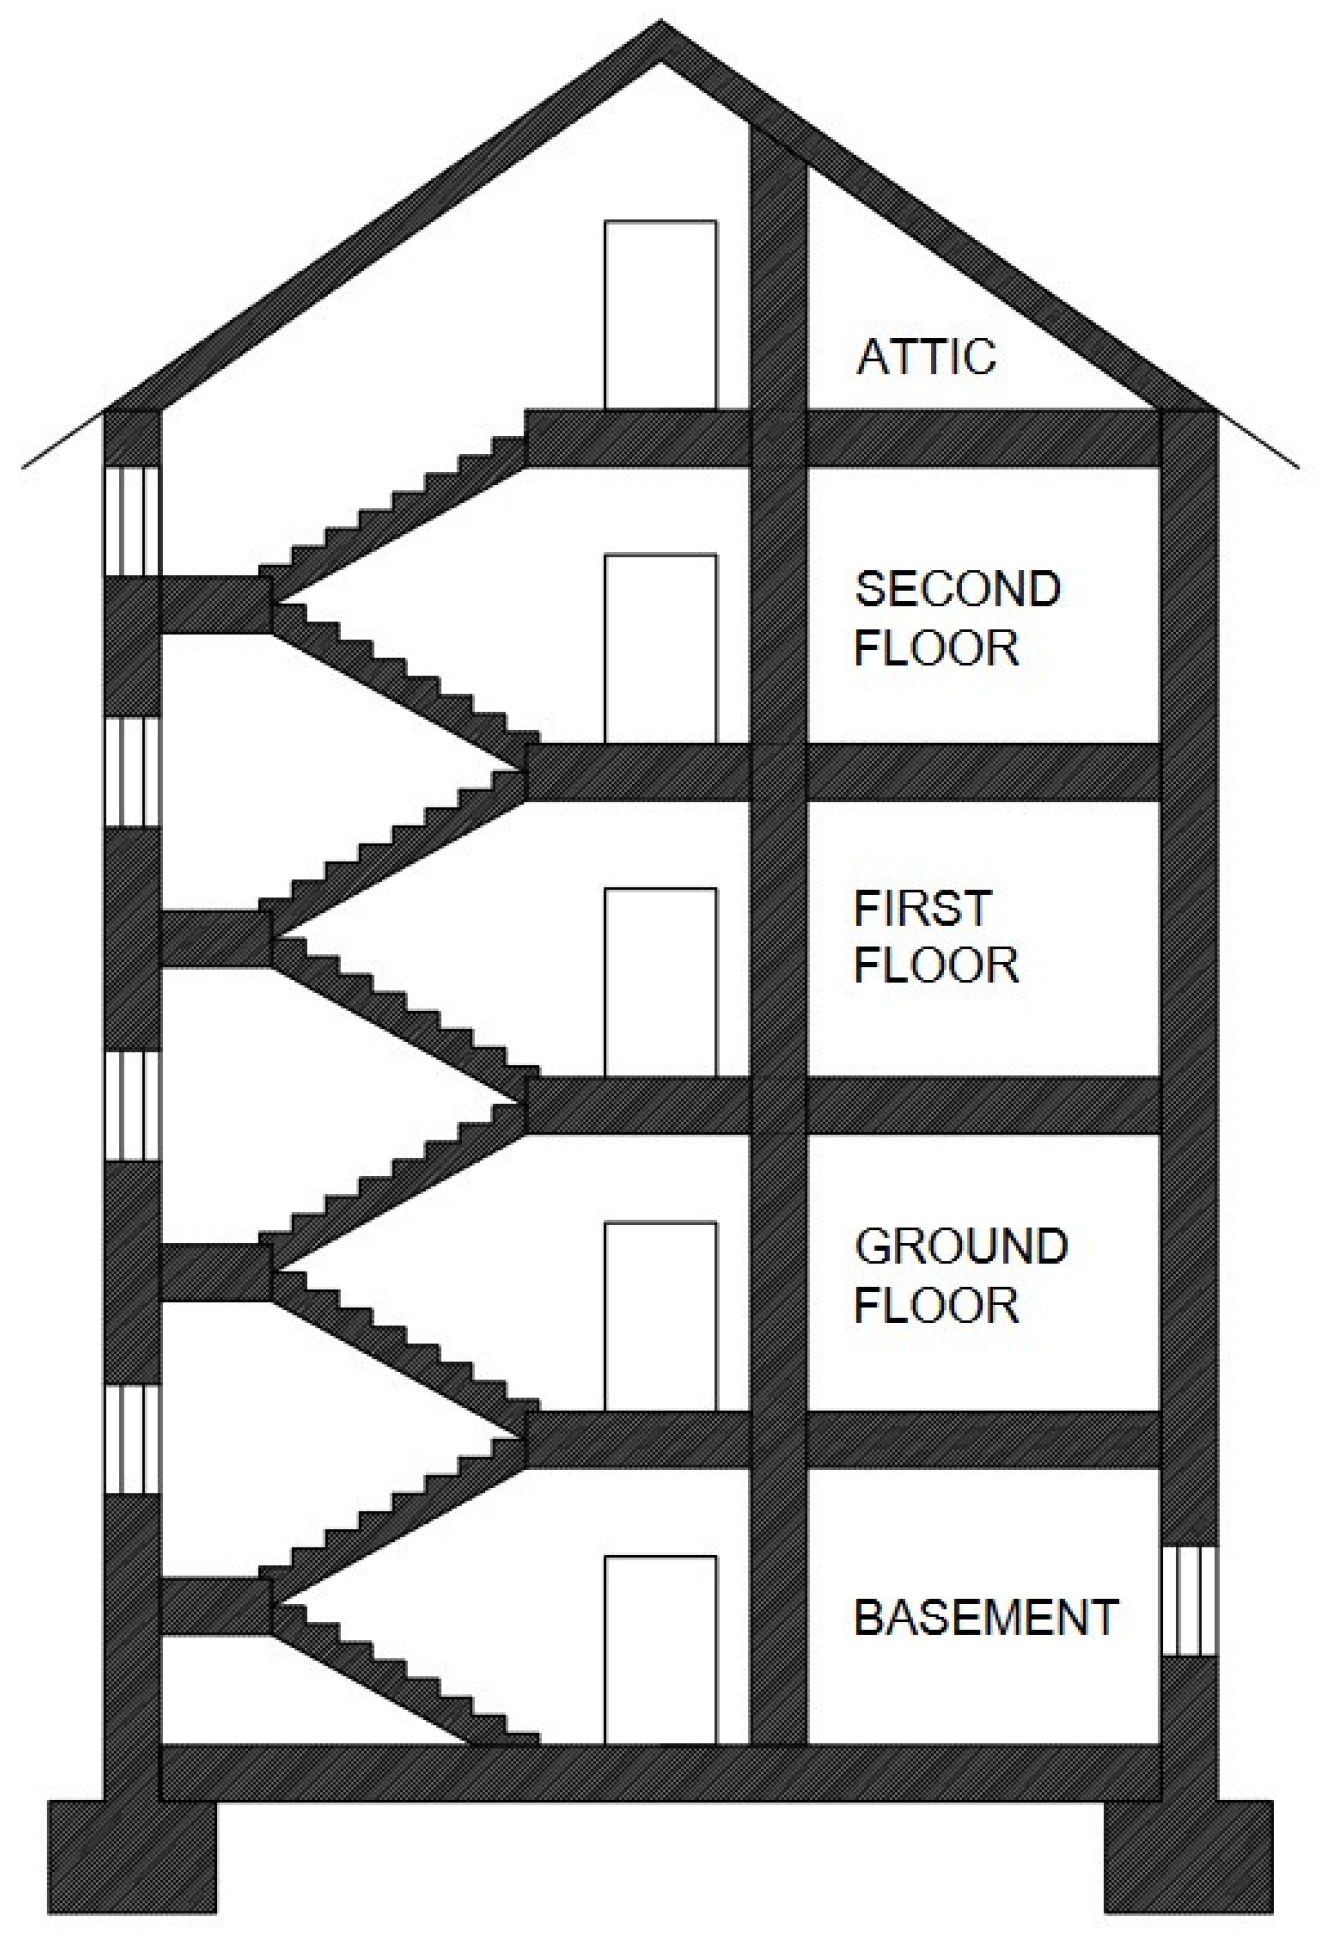
2.1. District Heating Load—Heating Demand

The initial step was to determine the heating load demands for the grid supplying the residential community. First, the heating demands for a typical building located in Europe with a continental climate zone were determined based on the PN-EN ISO 6946:2017-10 [35] standard for thermal transmittance, and the PN-EN ISO 13790:2009 [36] standard for thermal energy demand using the PURMO OZC 6.7 BASIC software. An average-sized representative multi-family residential building was selected; a cross-section of the building is presented in Figure 1 with selected assumptions summarized in Table 3. The building’s yearly heating requirement was determined at 0.57 GJ/(m2 year).
The methodology for defining the time-dependent heating demand for the residential community followed the procedure described below:
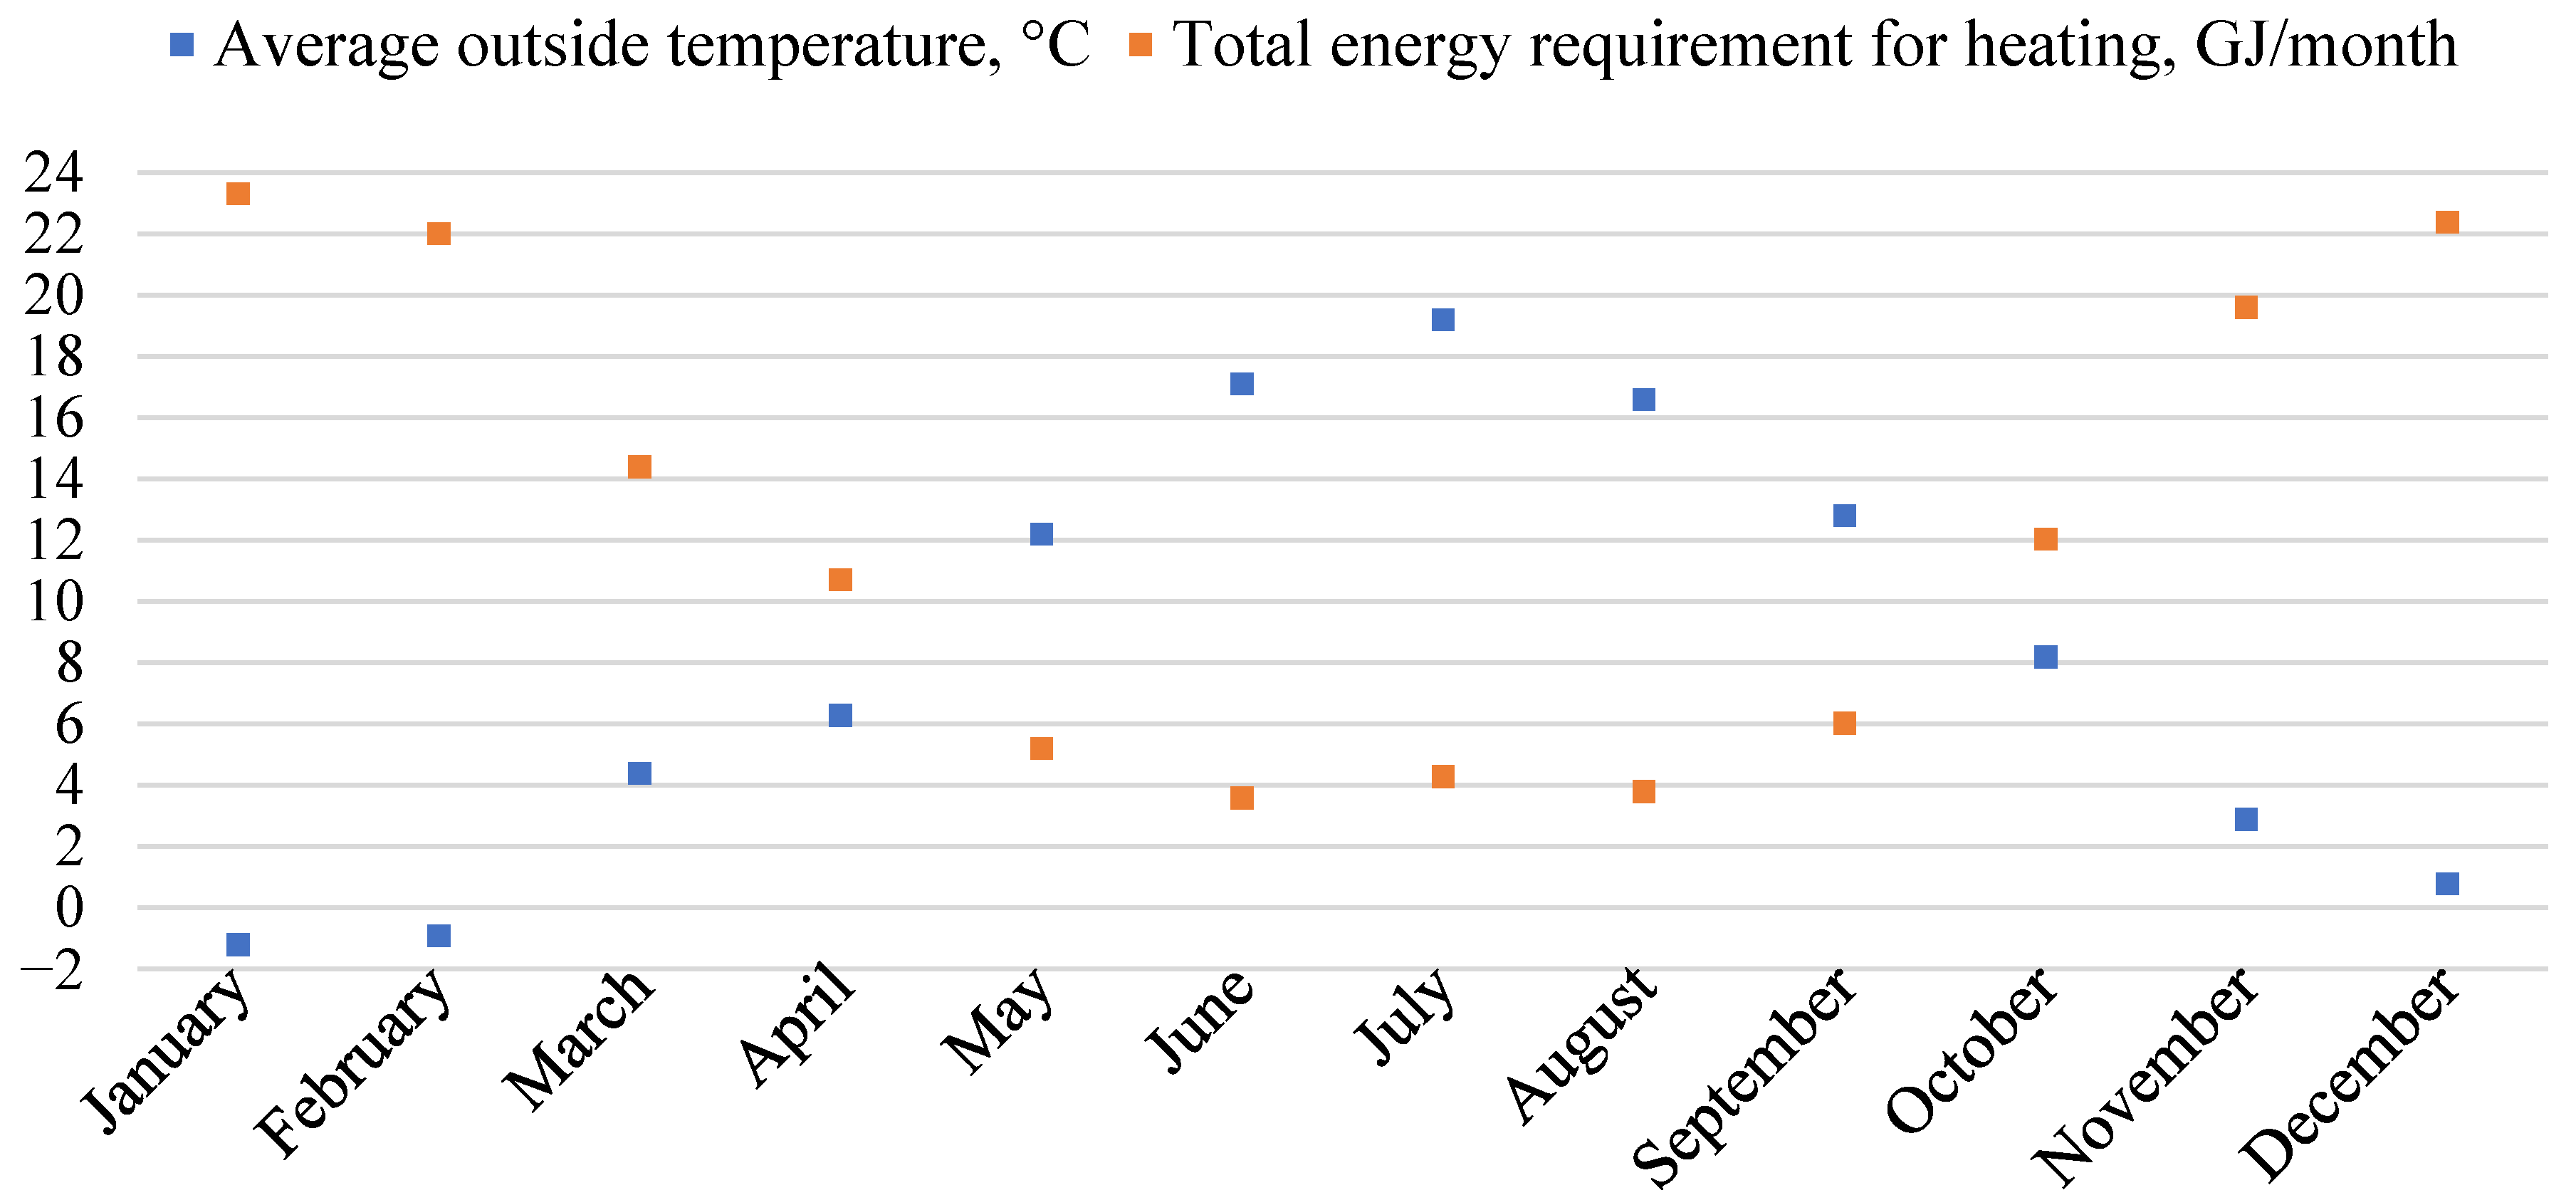
  • Monthly heat demand: calculated based on average outside temperature for each month at a specified location. It is plotted in Figure 2 where the total energy requirement for the heating of the building monthly is shown versus the average outside temperature in the respective month.
  • Thermal power: from a set of heat demands at corresponding temperatures, a linear regression characteristic was used to estimate the relationship between the instantaneous heating demand as a variable dependent on the outside temperature.
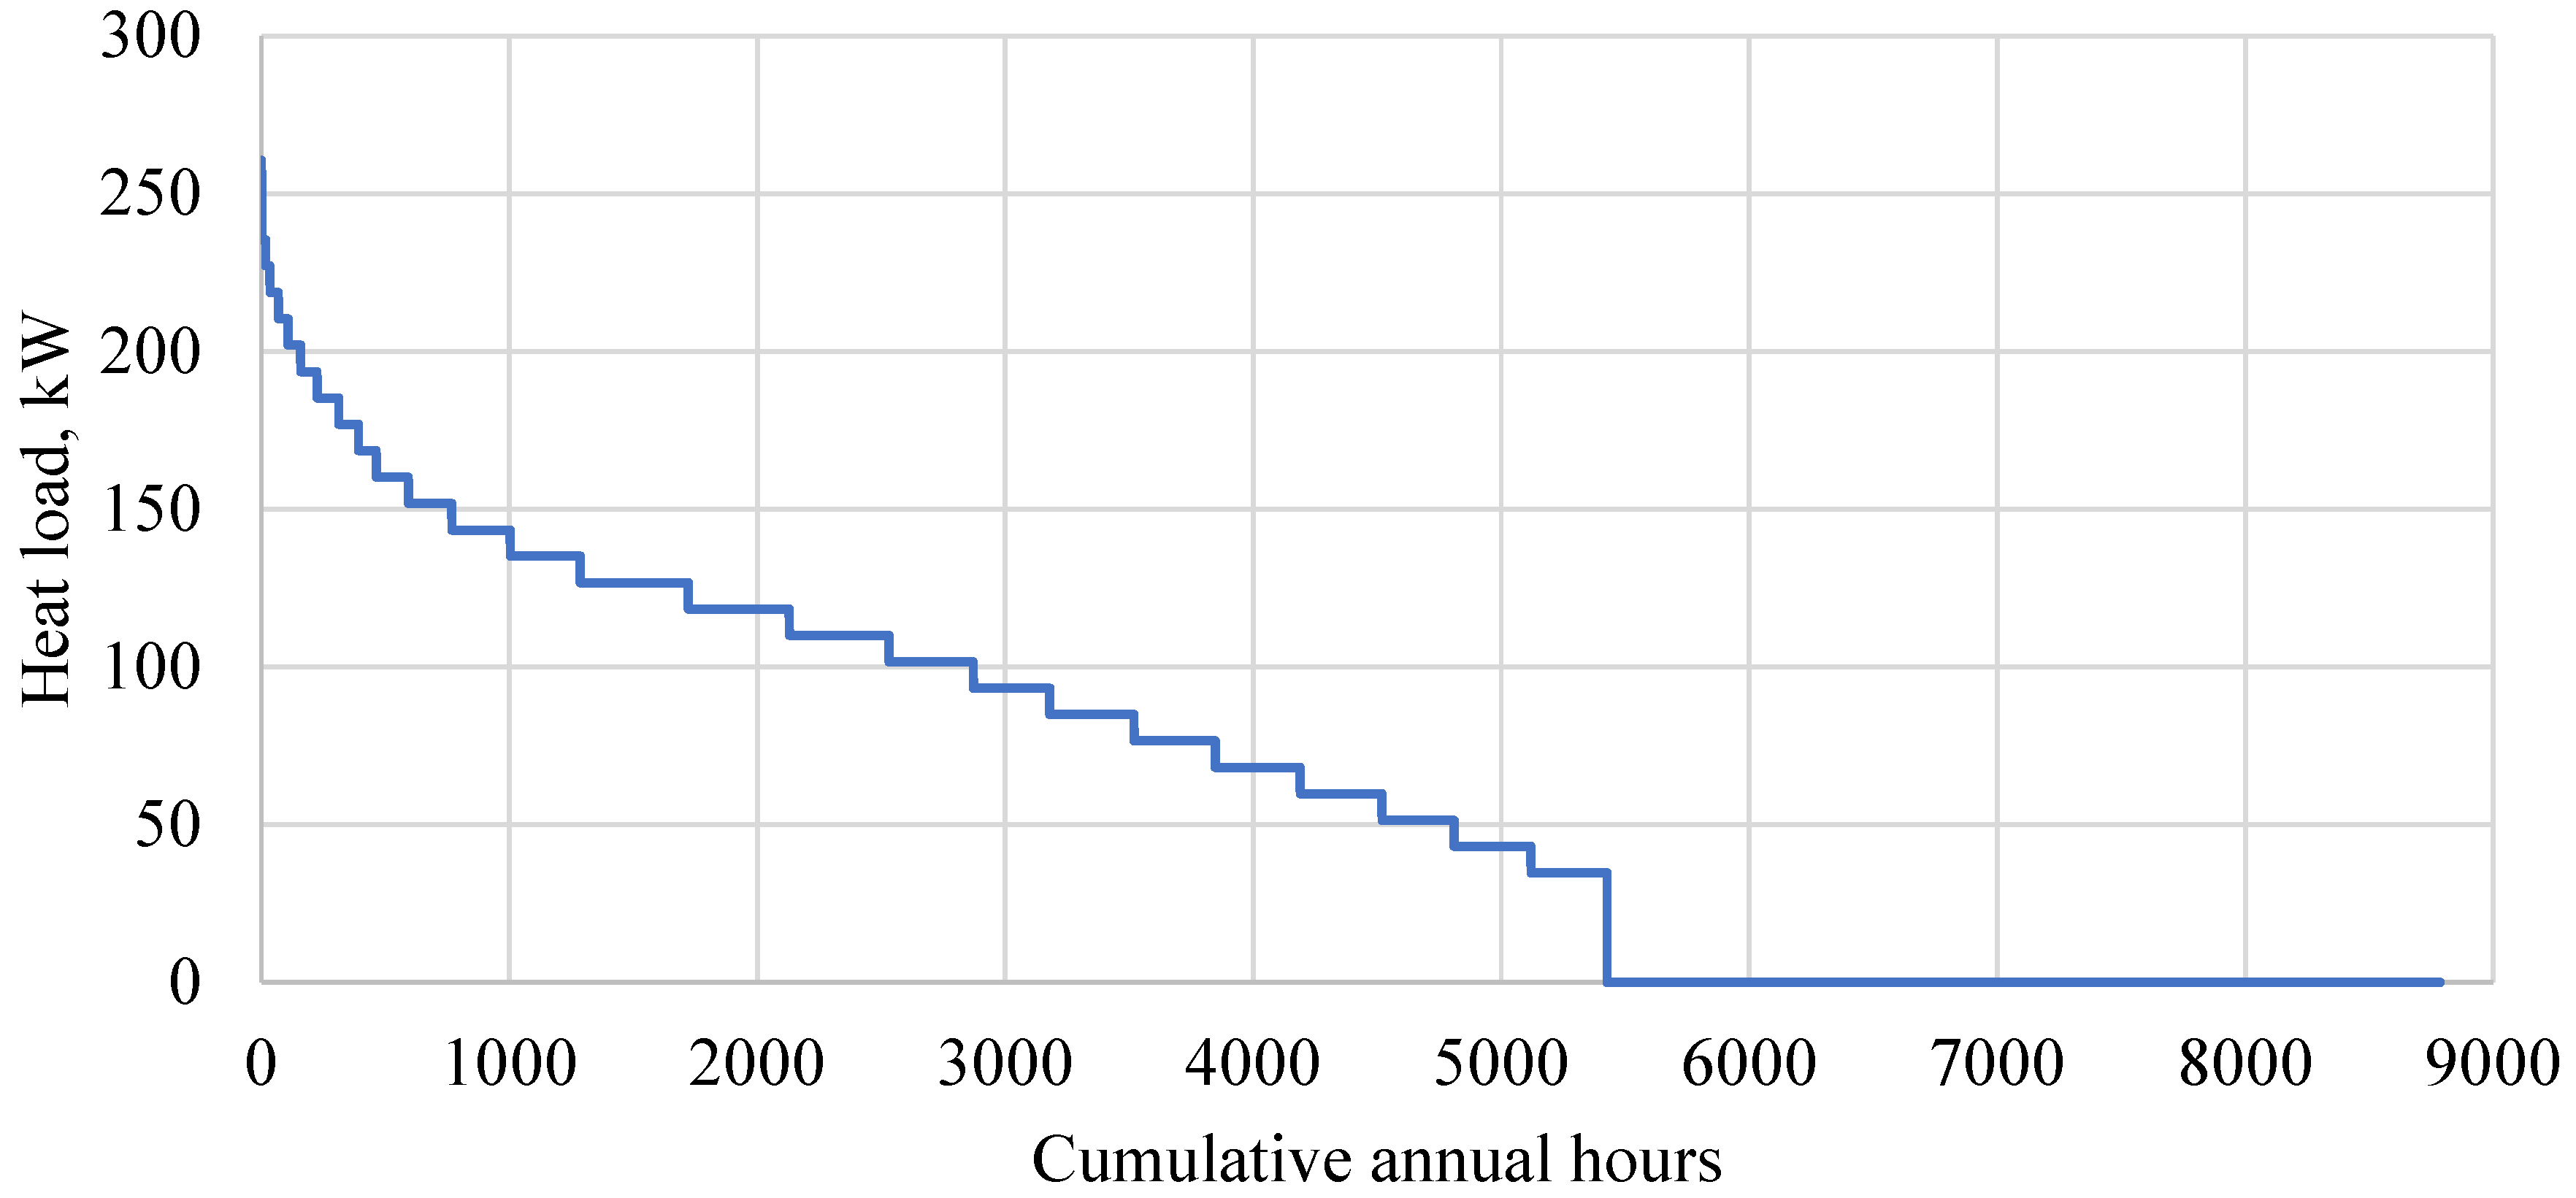
  • Annual demand assessment: from the established relationship, the annual heat demand was derived at an hourly timestep for the building. The annual temperature data for Warsaw was sourced from the ASHRAE IWEC. Final heat demand values were adjusted to account for the CHP system covering 15 buildings within a residential community.
Figure 3 displays a Load Duration Curve (LDC) that illustrates the heat demand of the residential community over time (in a descending order). A noticeable drop around the 5400 h mark is due to the assumption that no heating is required when the outside temperature reaches 12 °C or higher.

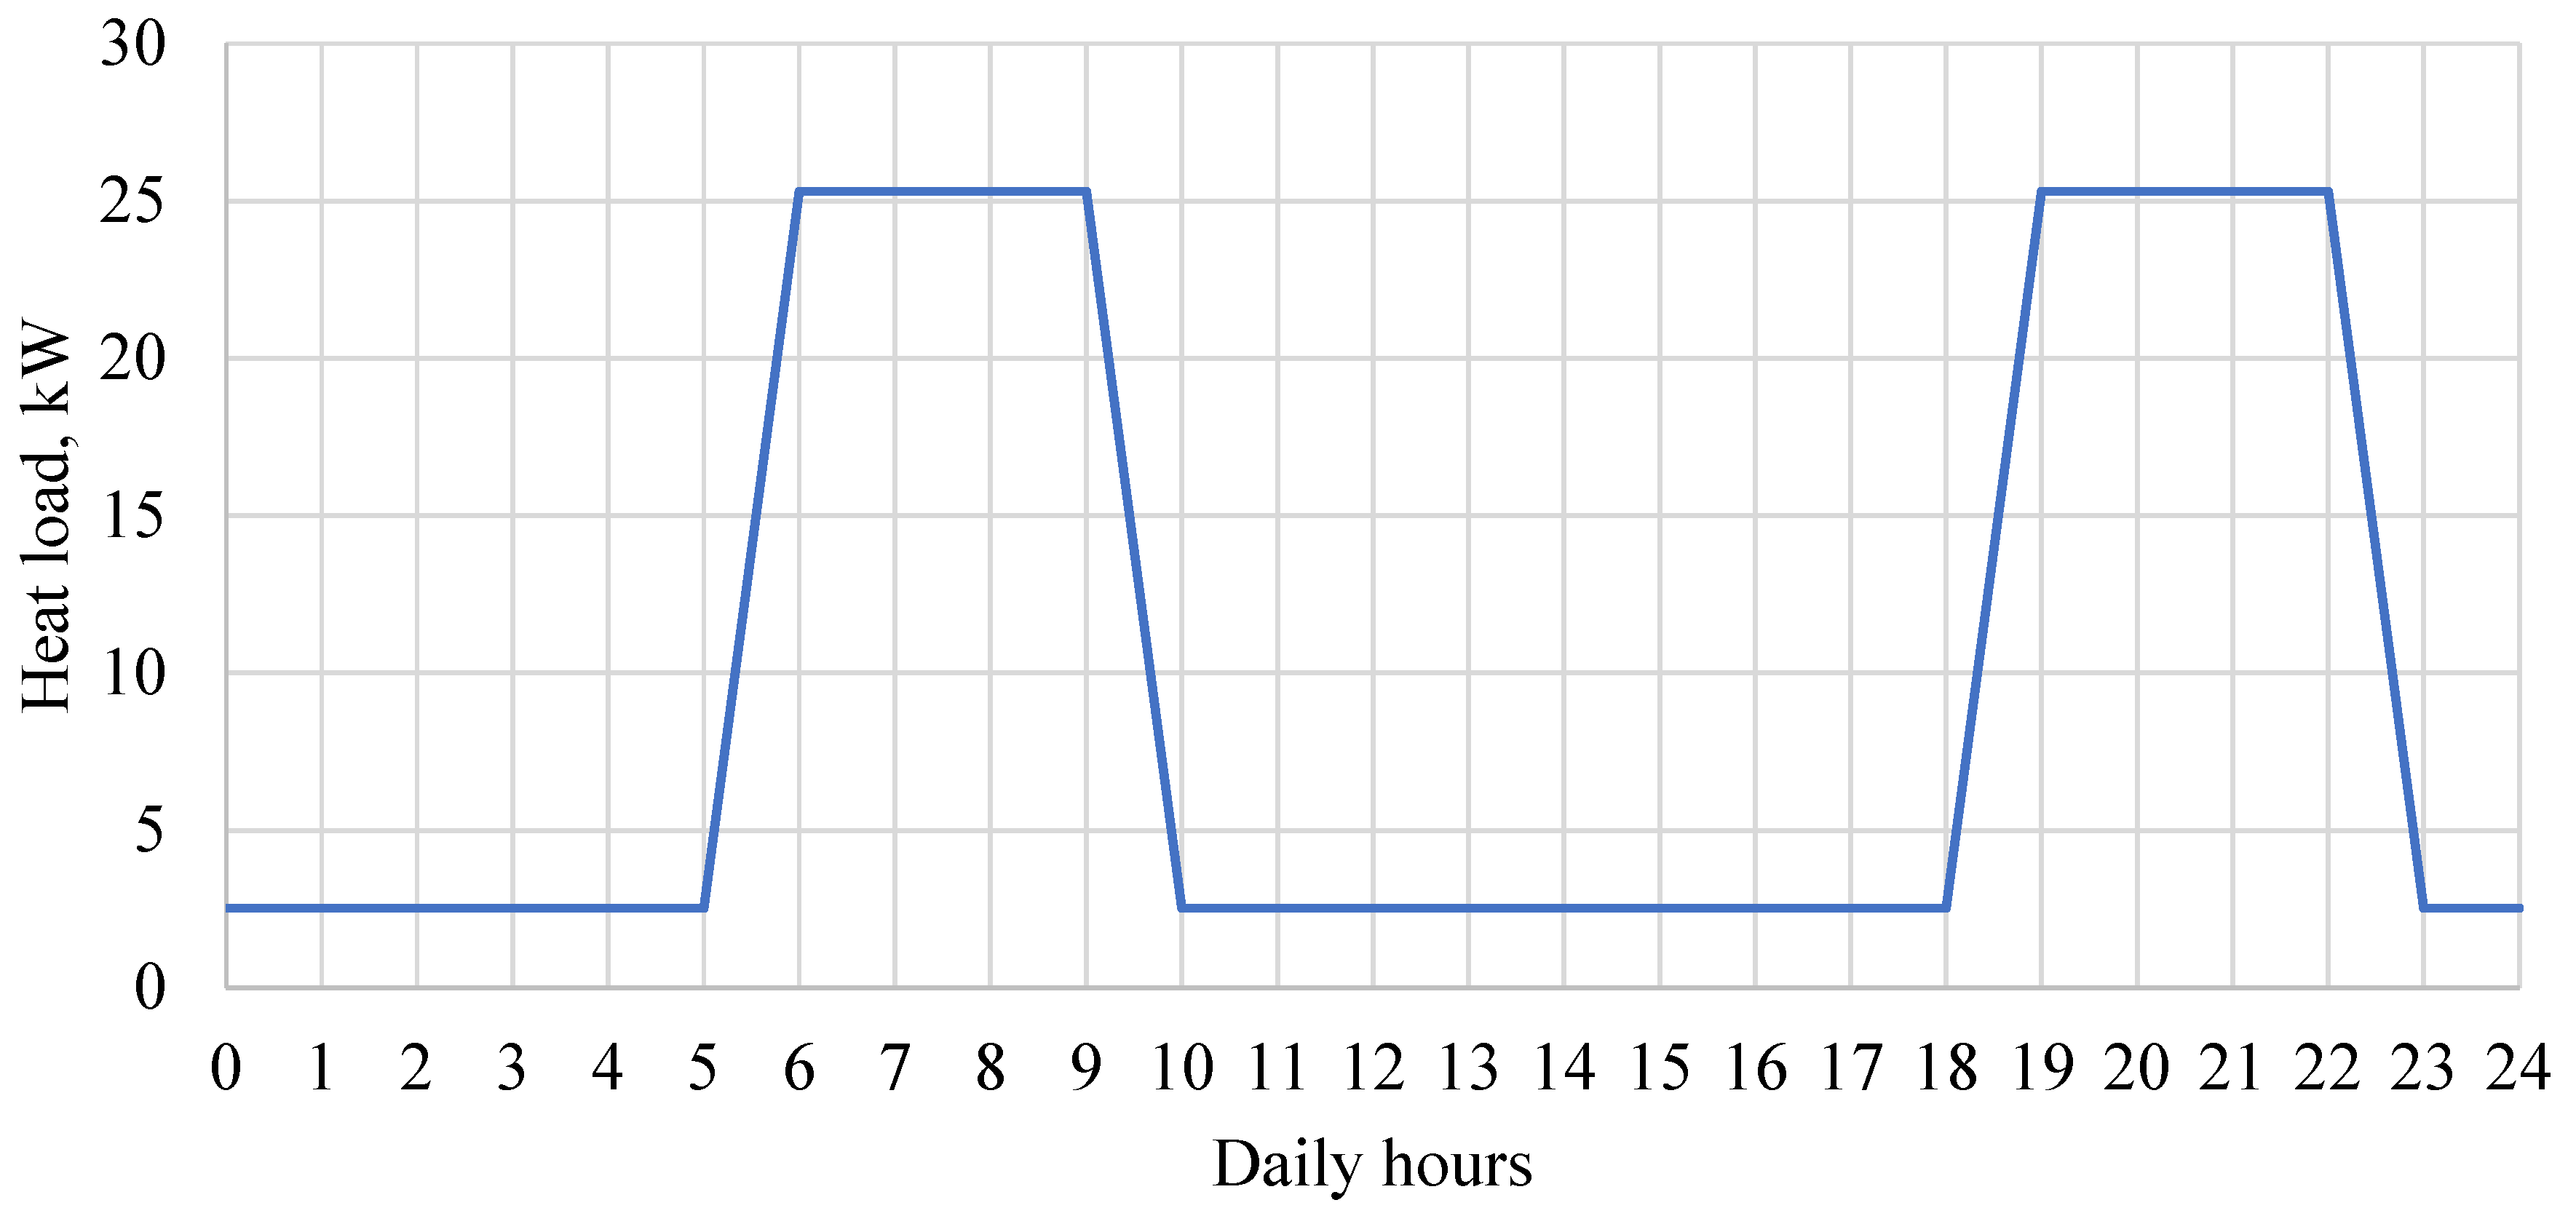
2.2. District Heating Load—Domestic Hot Water Demand

The total heat load of the residential community consists of two parts: the heating load and the domestic hot water (DWH) supply. To estimate the hot water requirements, the assumptions presented in Table 4 apply. The coefficient for a constant DHW load is a factor that estimates how much of the building’s hot water demand remains consistent, regardless of peak usage times. It is assumed that 25% of domestic hot water is utilized evenly throughout the day whereas 75% is consumed during the peak hours. The peak hours occur daily between the 6 am and 9 am, and between 7 p.m. and 10 p.m. To illustrate this, the pattern of daily hot water demand for a residential community is shown in Figure 4.

2.3. Total District Heating Load

Having aggregated both loads—from the heating as well as from the domestic hot water supply, the final value of the heat load for each hour annually was determined. A heat loss of a fixed value of 5% was factored in, attributed to the heat transit between the generation unit and the buildings. This relationship can be represented in the following form:
Q ˙ l o a d = Q ˙ H + Q ˙ D H W 1 f h l  
where Q ˙ l o a d is the heat load required to be produced in a CHP unit at a given hour, Q ˙ H stands for the heat requirement for the heating of the building at a given hour, Q ˙ D H W represents the heat requirement from the domestic hot water supply, f h l is the heat losses factor. A linear approach for heat losses is a simplification considered to be sufficient for the preliminary system-level analysis.
The cumulated annual heat is calculated from the integral over time
Q T l o a d = t _ s t a r t t _ e n d Q ˙ l o a d
where Q T l o a d is an integrated value of annual heat demand, t s t a r t and t e n d represent the first and last hour considering one year of operation (beginning and end of the year).

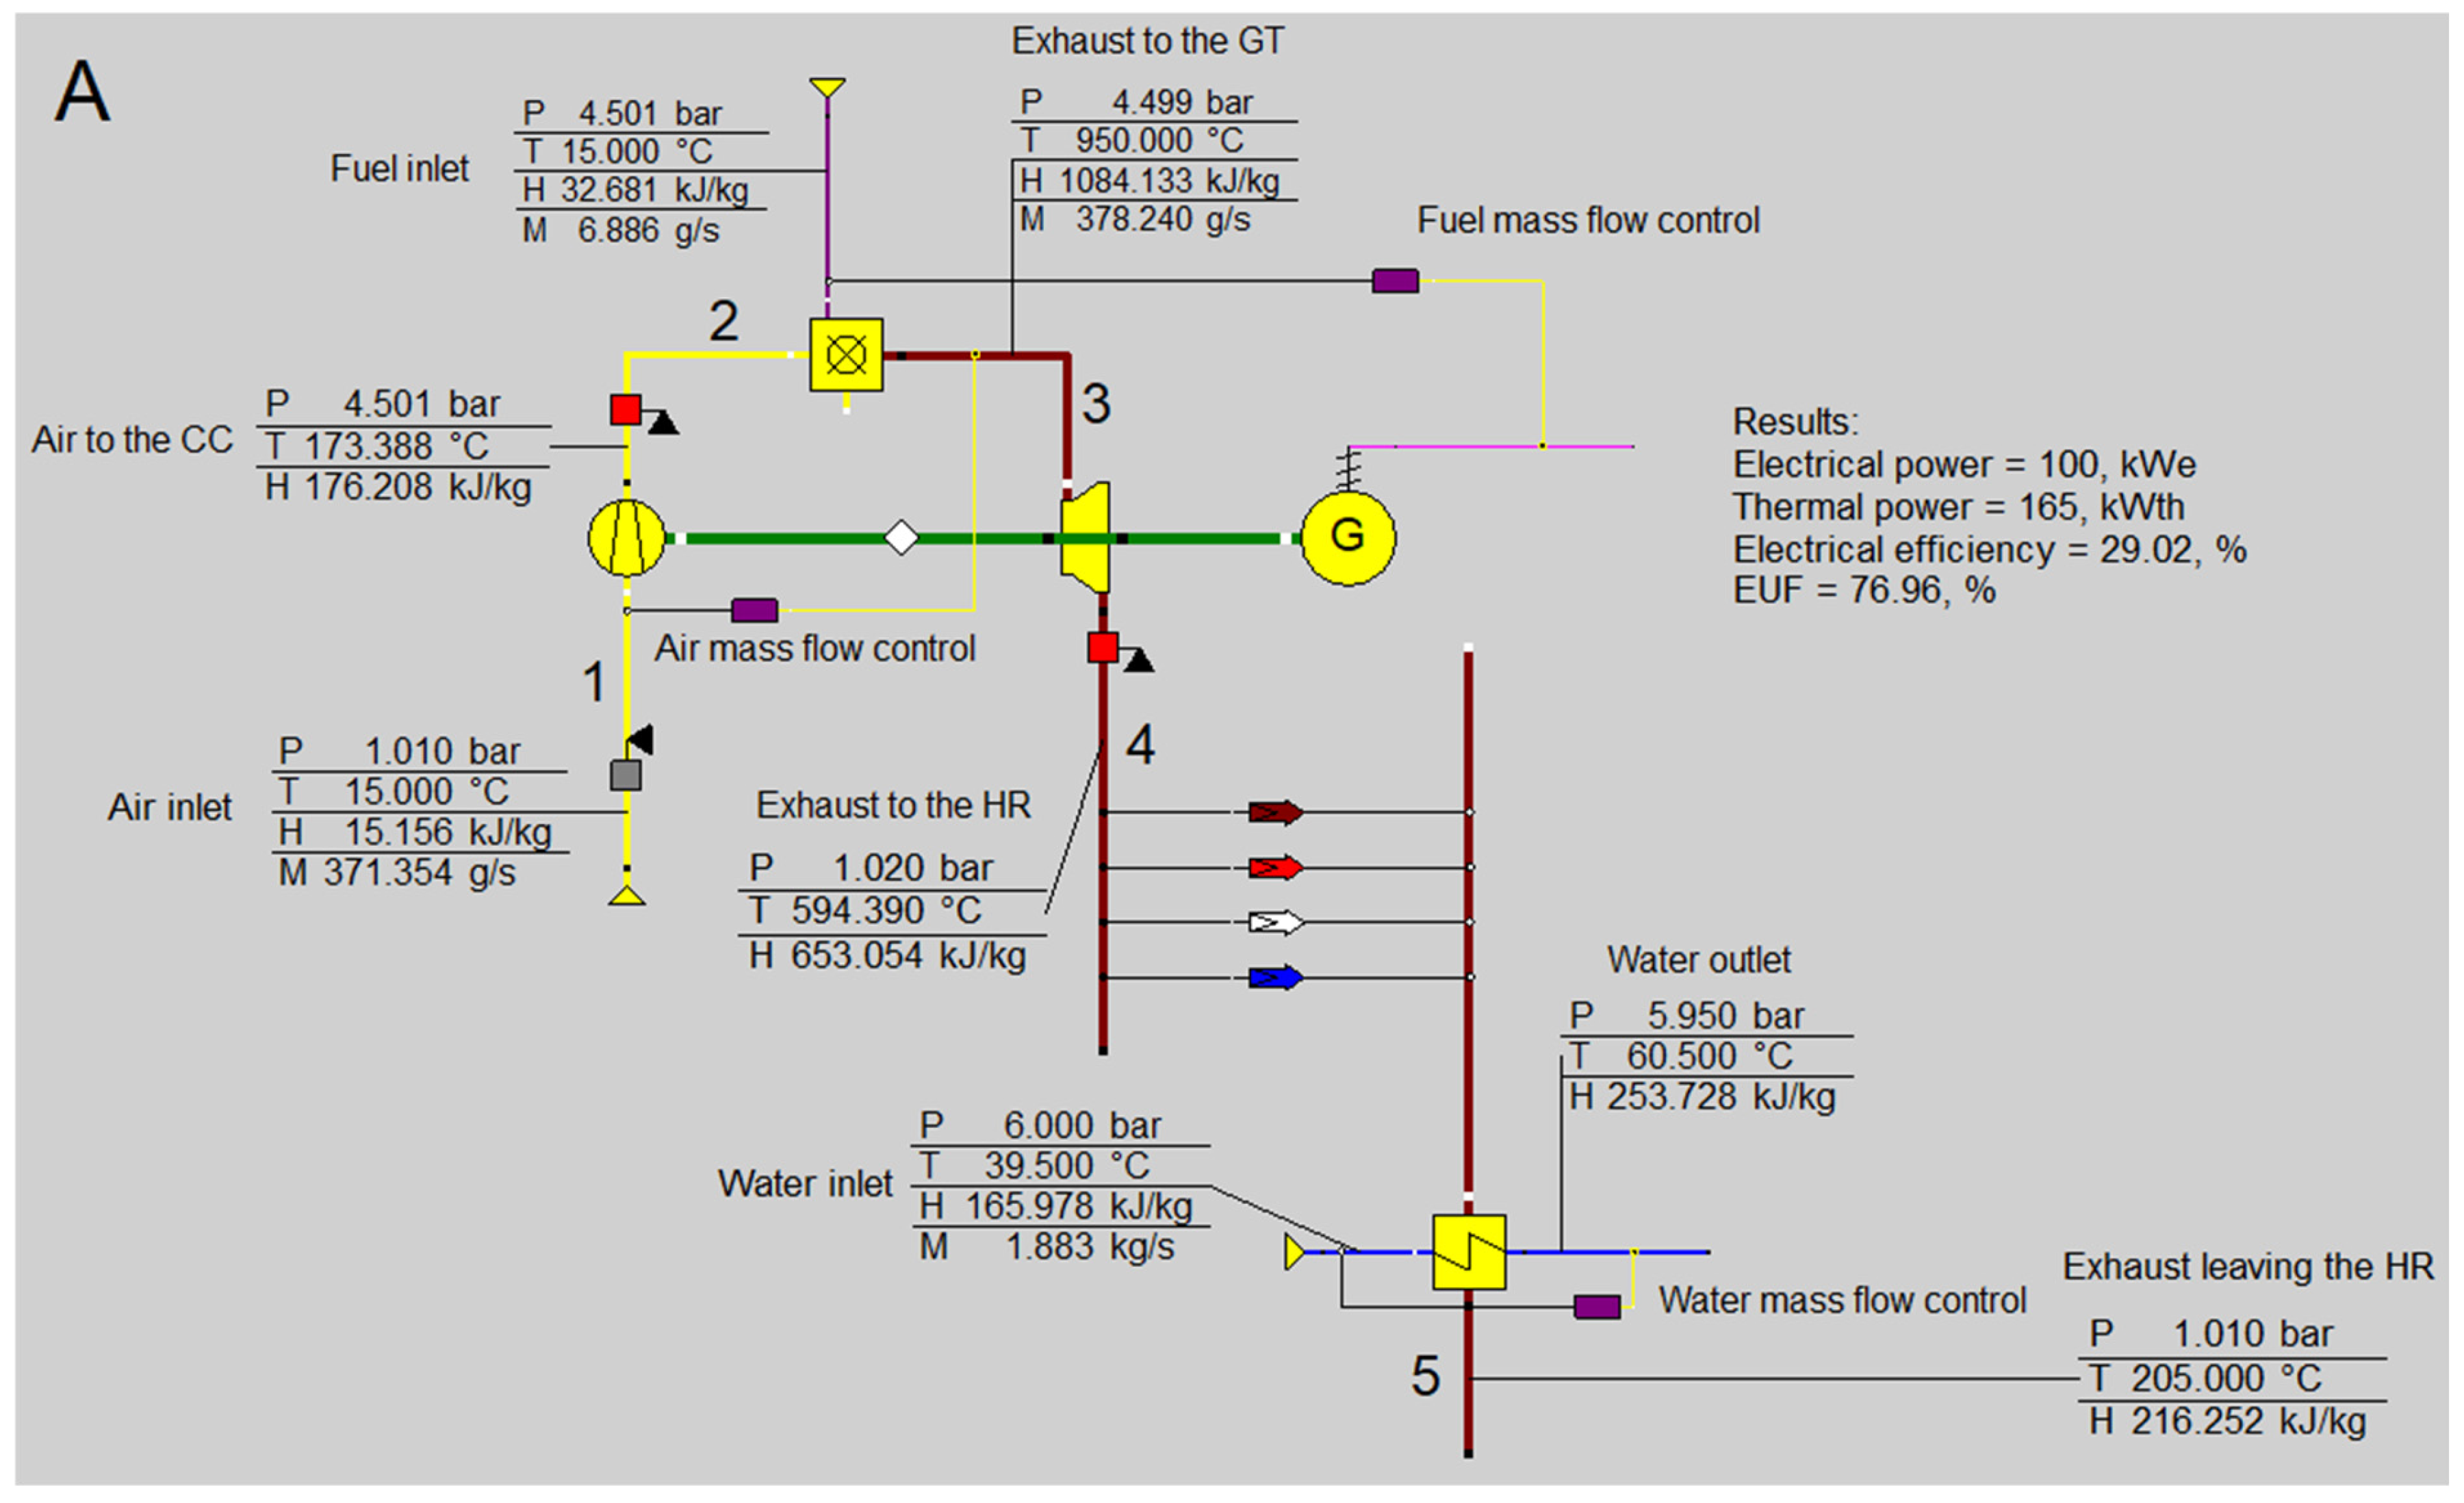
2.4. Plant Model—On-Design

A model of a simple micro-gas turbine system under CHP mode, developed using Ebsilon software, is presented in Figure 5A. In the first stage, a natural gas (methane) fueled micro-gas turbine was analyzed using an on-design approach. The components of the system include the compressor, combustion chamber (CC), gas turbine (GT), and the heat exchanger for the heat recovery unit (HR). The logic of the computational model is based on the following method. Ambient air (state 1) is compressed to state 2 by a single-shaft radial compressor. The mass flow rate of air is a variable solved iteratively so that the energy balance produces the fixed turbine inlet temperature of 950 °C. The combustion chamber outlet (state 3) is the inlet of the gas turbine; pressure equality is enforced, accounting for minor pressure drop. The turbine expands the exhaust to state 4 powering a generator as well as the compressor. The second variable solved iteratively is the mass flow rate of fuel which is dependent on the electrical power of the system and equals 100 kWe at nominal, on-design conditions. At state 4 the exhaust enters the counter-flow heat exchanger; the forced temperature of exhaust at state 5 is enforced. The water loop is matched to the gas side at each time step by varying its mass flow rate at fixed inlet/outlet temperatures (quantitative regulation).
The input data for the design assumptions are presented in Table 5. Having defined the on-design baseline for natural gas-fueled MGT, the same set of assumptions was applied to an ammonia-fueled scenario. The following assumptions apply:
  • The combustion chamber pressure was based on typical values for similar micro-gas turbines (such as Ansaldo AE-T100NG).
  • Internal efficiencies reflect a highly efficient scenario; as such the conditions should be treated as theoretical. The values are listed in Table 6.
  • The study is set in a system-level perspective where the complete combustion of fuel is assumed. This approach is consistent with other studies of such type [31]. Combustion inefficiencies and trace exhaust components are neglected.
  • The composition of the natural gas is taken as pure methane, reflecting a high-quality fuel for a baseline comparison with ammonia.
  • The exhaust temperature after the HR was determined using a thermal power output of 165 kWth, corresponding to 100 kWe electrical power; a ratio between electrical and thermal power is based on Ansaldo AE-T100NG specifications.
  • To offset the 5% heat loss from transportation, the CHP unit’s HR inlet and outlet temperatures were adjusted by 0.5 °C, resulting in 39.5 °C/60.5 °C to ensure that building entry and exit temperatures align with the requirements, maintained consistently year-round.
Apart from the analyzed system, Figure 5 additionally presents electrical and thermal power, efficiencies along with EUF. They are defined in accordance with the following equations.
Electrical efficiency [39]
η = P e l m ˙ f   L H V f
where P e l stands for the electrical power production in kW, m ˙ f is the mass flow rate of fuel in kg/s, and L H V f is the lower heating value of fuel in kJ/kg.
EUF [39]:
E U F =   P e l + T P m ˙ f   L H V f
where T P is the produced thermal power in kW.
Additionally, the specific enthalpy difference across the gas turbine is defined according to the equation [39]
Δ h G T = h 3 h 4
where Δ h G T is the specific enthalpy differential between the specific enthalpy of exhaust at point 3, h 3 , and point 4, h 4 . This is expressed in kJ/kg. The numbering of points follows the scheme presented in Figure 5.
Heat exchanger effectiveness is computed as [40]
ε = Q ˙ H E Q ˙ M A X , H E = Q ˙ H E C m i n ( T h , i n T c , i n )
where Q ˙ H E is the actual heat transfer rate in the heat exchanger, and Q ˙ M A X , H E is the maximum heat transfer rate in the heat exchanger calculated as a product of a smaller heat capacity rate between the two fluids ( C m i n ) and a difference between the inlet temperatures of hot and cold fluids ( T h , i n and T c , i n ), respectively.

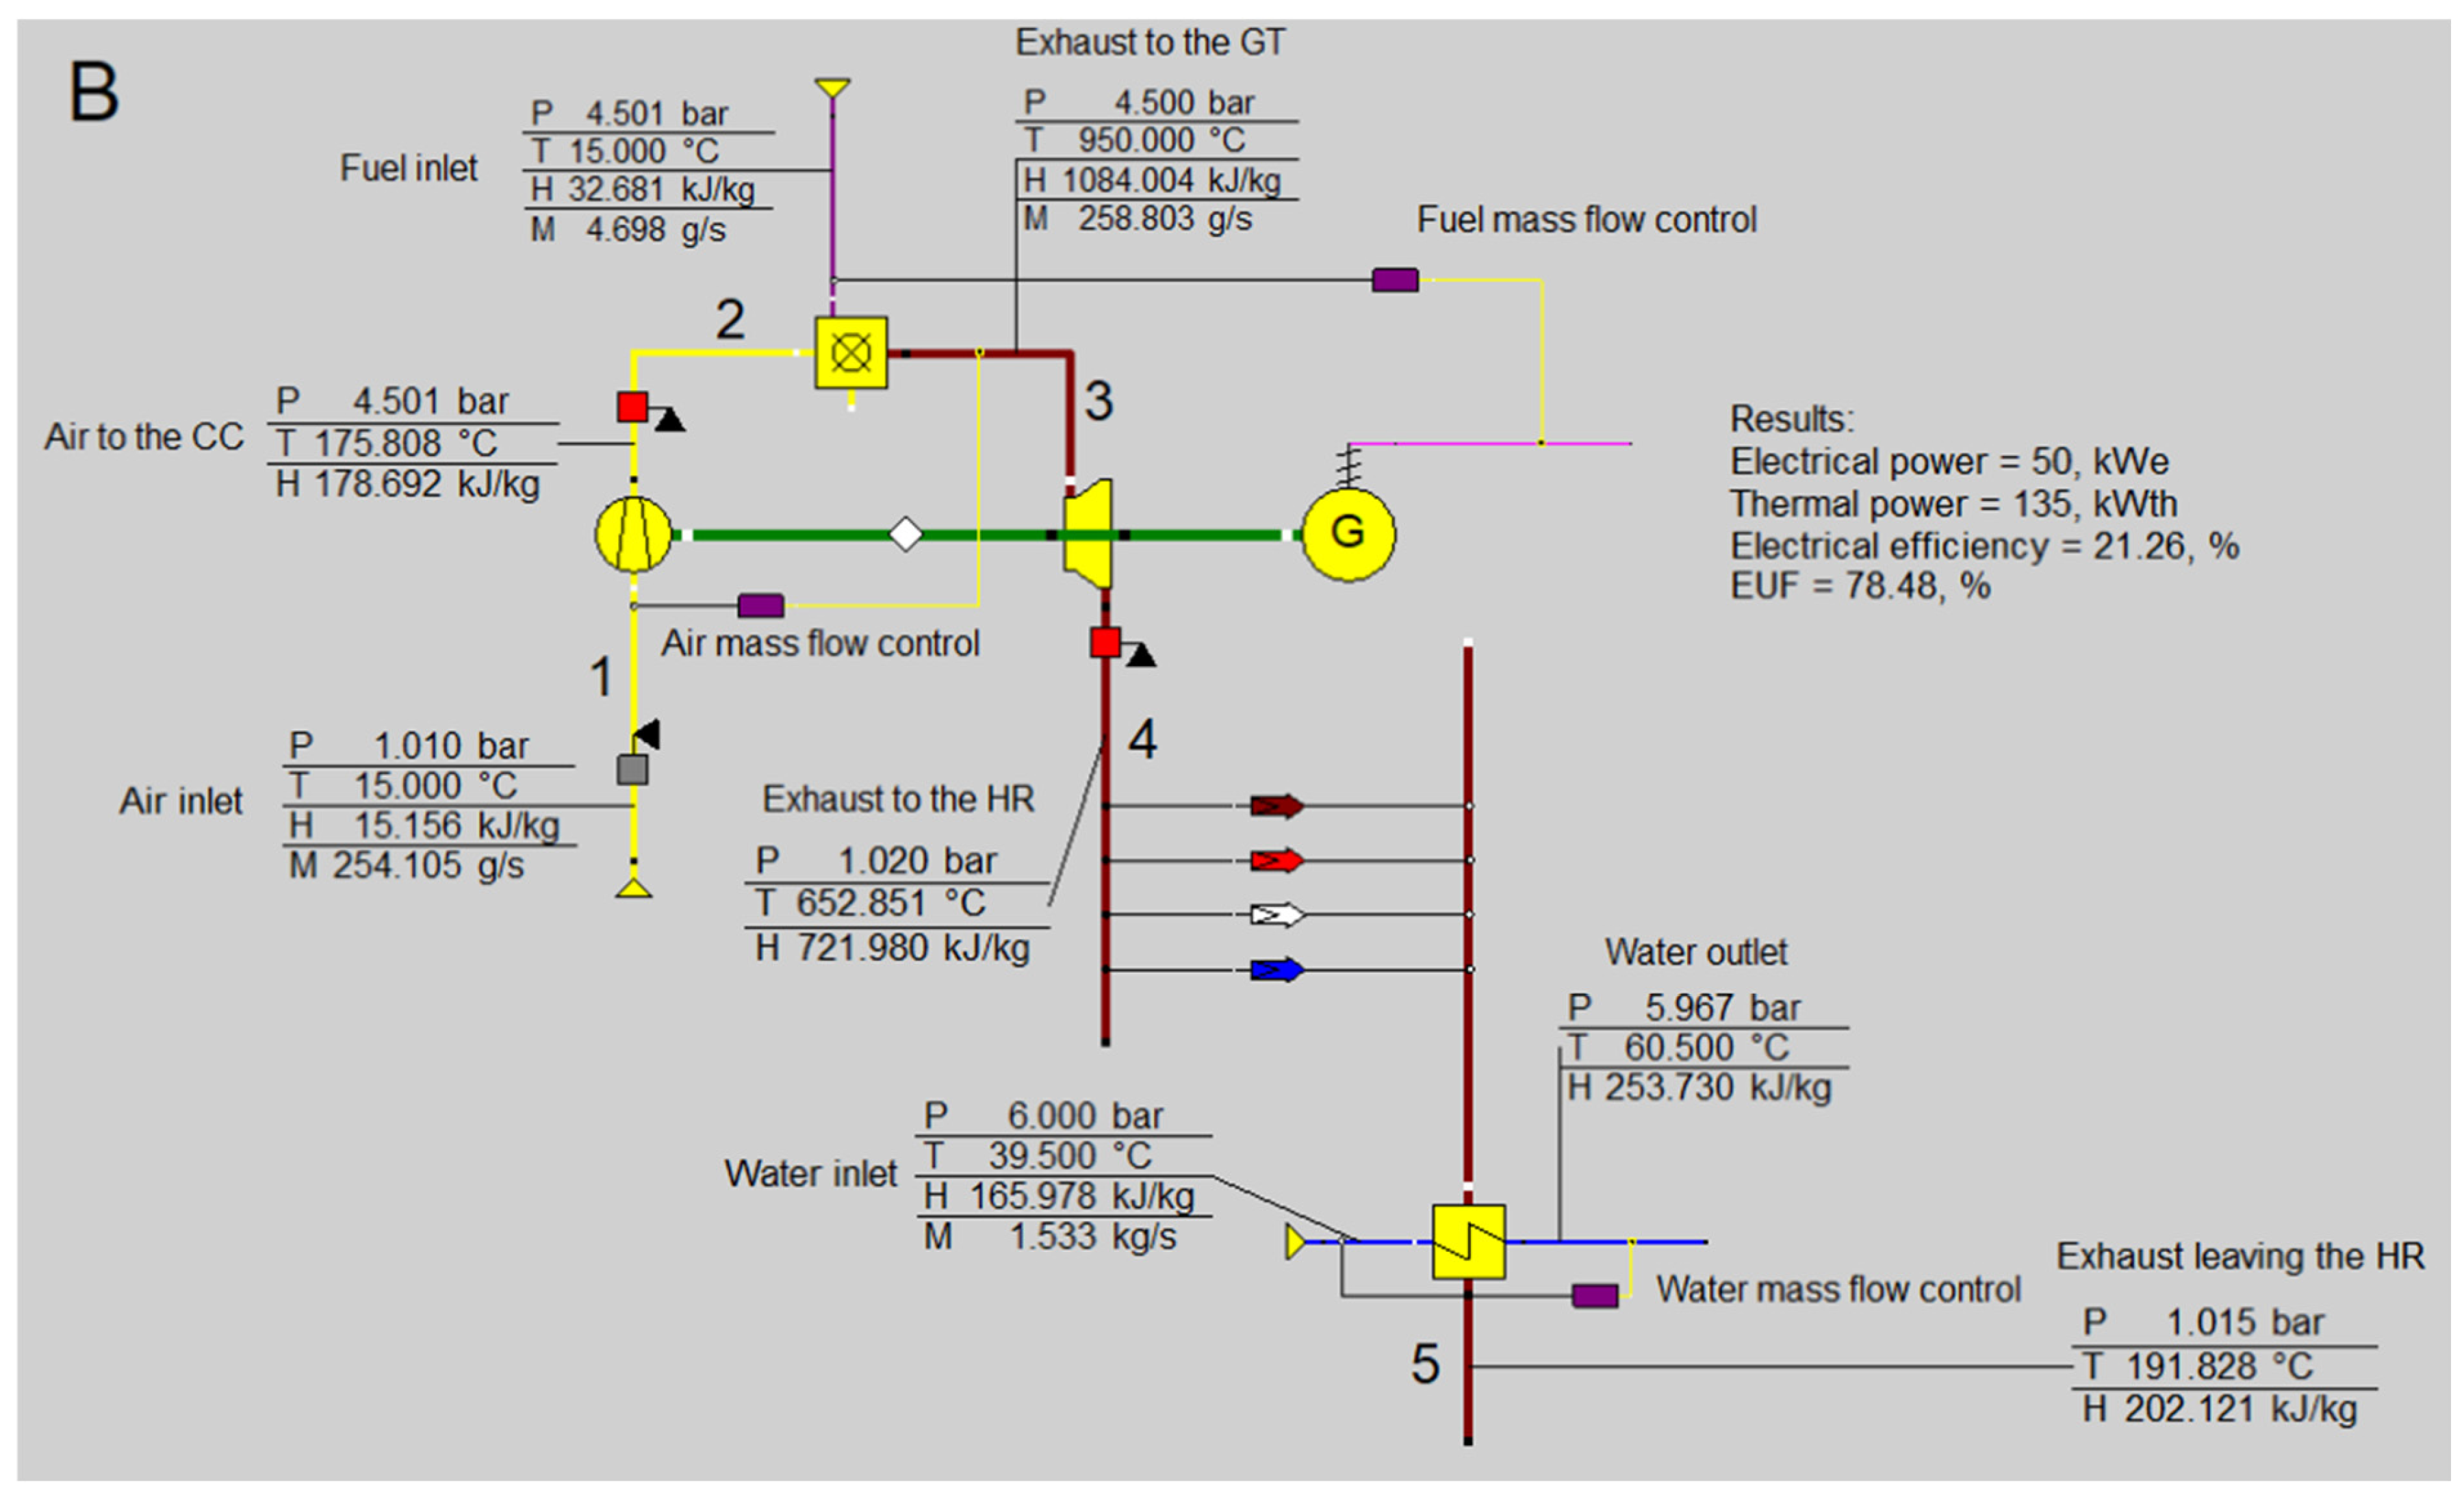
2.5. Plant Model—Off-Design

Following the determination of the on-design conditions for the CHP system, an off-design analysis was conducted to assess the system’s performance under partial load conditions and varying outside temperature conditions. The off-design analysis utilized flow-based characteristics available within the Ebsilon software. The characteristics specifically regard the following:
  • Compressor: internal efficiency as a function of the mass flow rate of air.
  • Gas turbine: internal efficiency as a function of the mass flow rate of exhaust gases.
  • Heat recovery exchanger: the UA parameter (product of heat transfer coefficient and area) as a function of the mass flow rate of exhaust gases.
The results of the off-design calculations at minimum load for the natural gas scenario are presented in Figure 5B. The following assumptions apply:
  • The minimum operational load of the MGT is set at 50% of its electrical power capacity (50 kWe).
  • Air inlet conditions, pressure after the compressor, exhaust temperature after the combustion chamber, pressure after the turbine, exhaust temperature after the HR, and water temperatures before and after the HR remain constant. The model iterates over mass flow rates of air, fuel and water towards solving mass and energy balances to match the required electrical energy, considering the altered performance of the equipment.
Similarly, the ammonia-fueled MGT analysis was conducted, i.e., same on-design assumptions (presented in Table 5 and Table 6) and off-design logic remain valid, the only difference being the introduced—gaseous ammonia at T = 15 °C and P = 4.501 bar—to the combustion chamber.
Constructed models respond to electrical power inputs; however, their actual operation depends on the residential community’s heat load throughout the year. Therefore, a comprehensive assessment was performed to define the relationships between electrical and thermal power outputs across outside temperatures from −16 °C to 12 °C (at 1 °C increments), and loads from 50 kW to 100 kW (at 1 kW increments). Based on electrical and thermal power dependencies defined independently for natural gas and ammonia cases, the annual operation of the systems was simulated.
Finally, the operational strategy of the system was established through a heat tracking algorithm in accordance with the following assumptions:
  • When the heat demand exceeds the system’s heat output capacity, the MGT operates at its maximum capacity to fulfil as much of the heating requirement as possible.
  • If the required heat falls within the operational range (between the maximum and minimum capacities), the MGT adjusts its output to match the actual demand.
  • When the heat demand is below the system’s minimum capacity, the MGT operates at its minimal threshold.
  • The MGT is only activated when the outside temperature drops below a threshold of 12 °C. This is based on the rationale that during warmer periods the heat demand significantly decreases as only the domestic hot water demand must be delivered. During these warmer periods, it is assumed that the heat requirements are met by an alternative heat source, such as a boiler or a heat pump, to avoid the unnecessary operation of the MGT and the consequent generation of excess heat.

3. Results

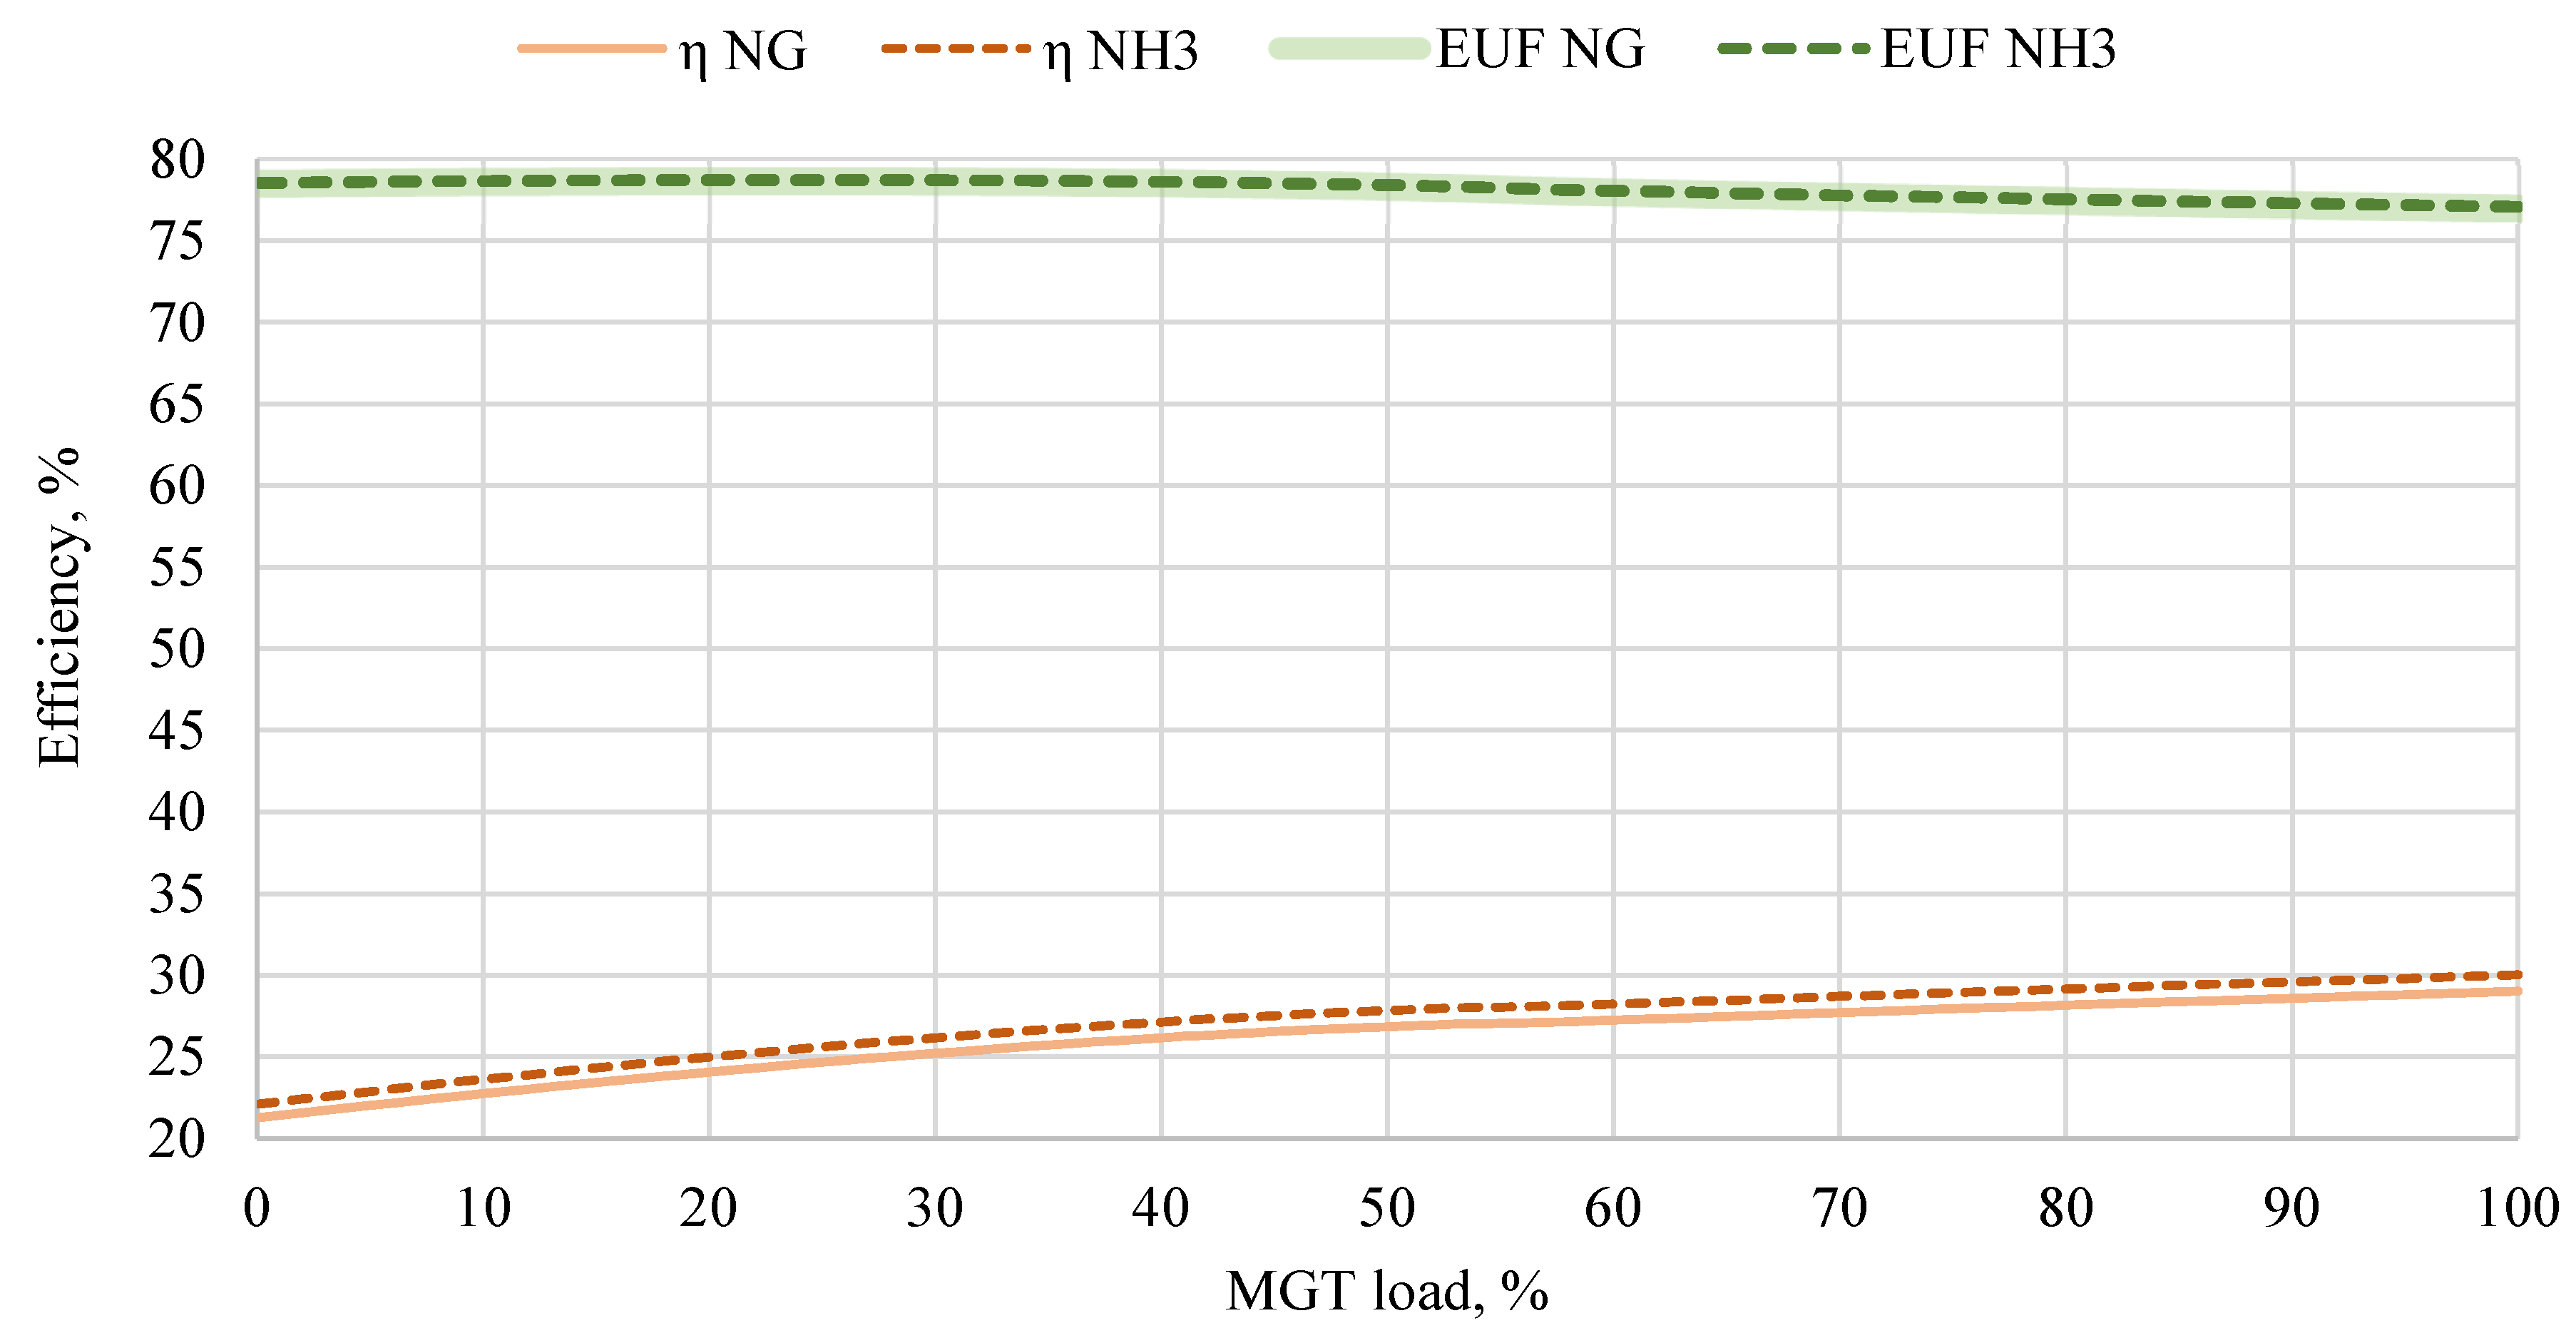
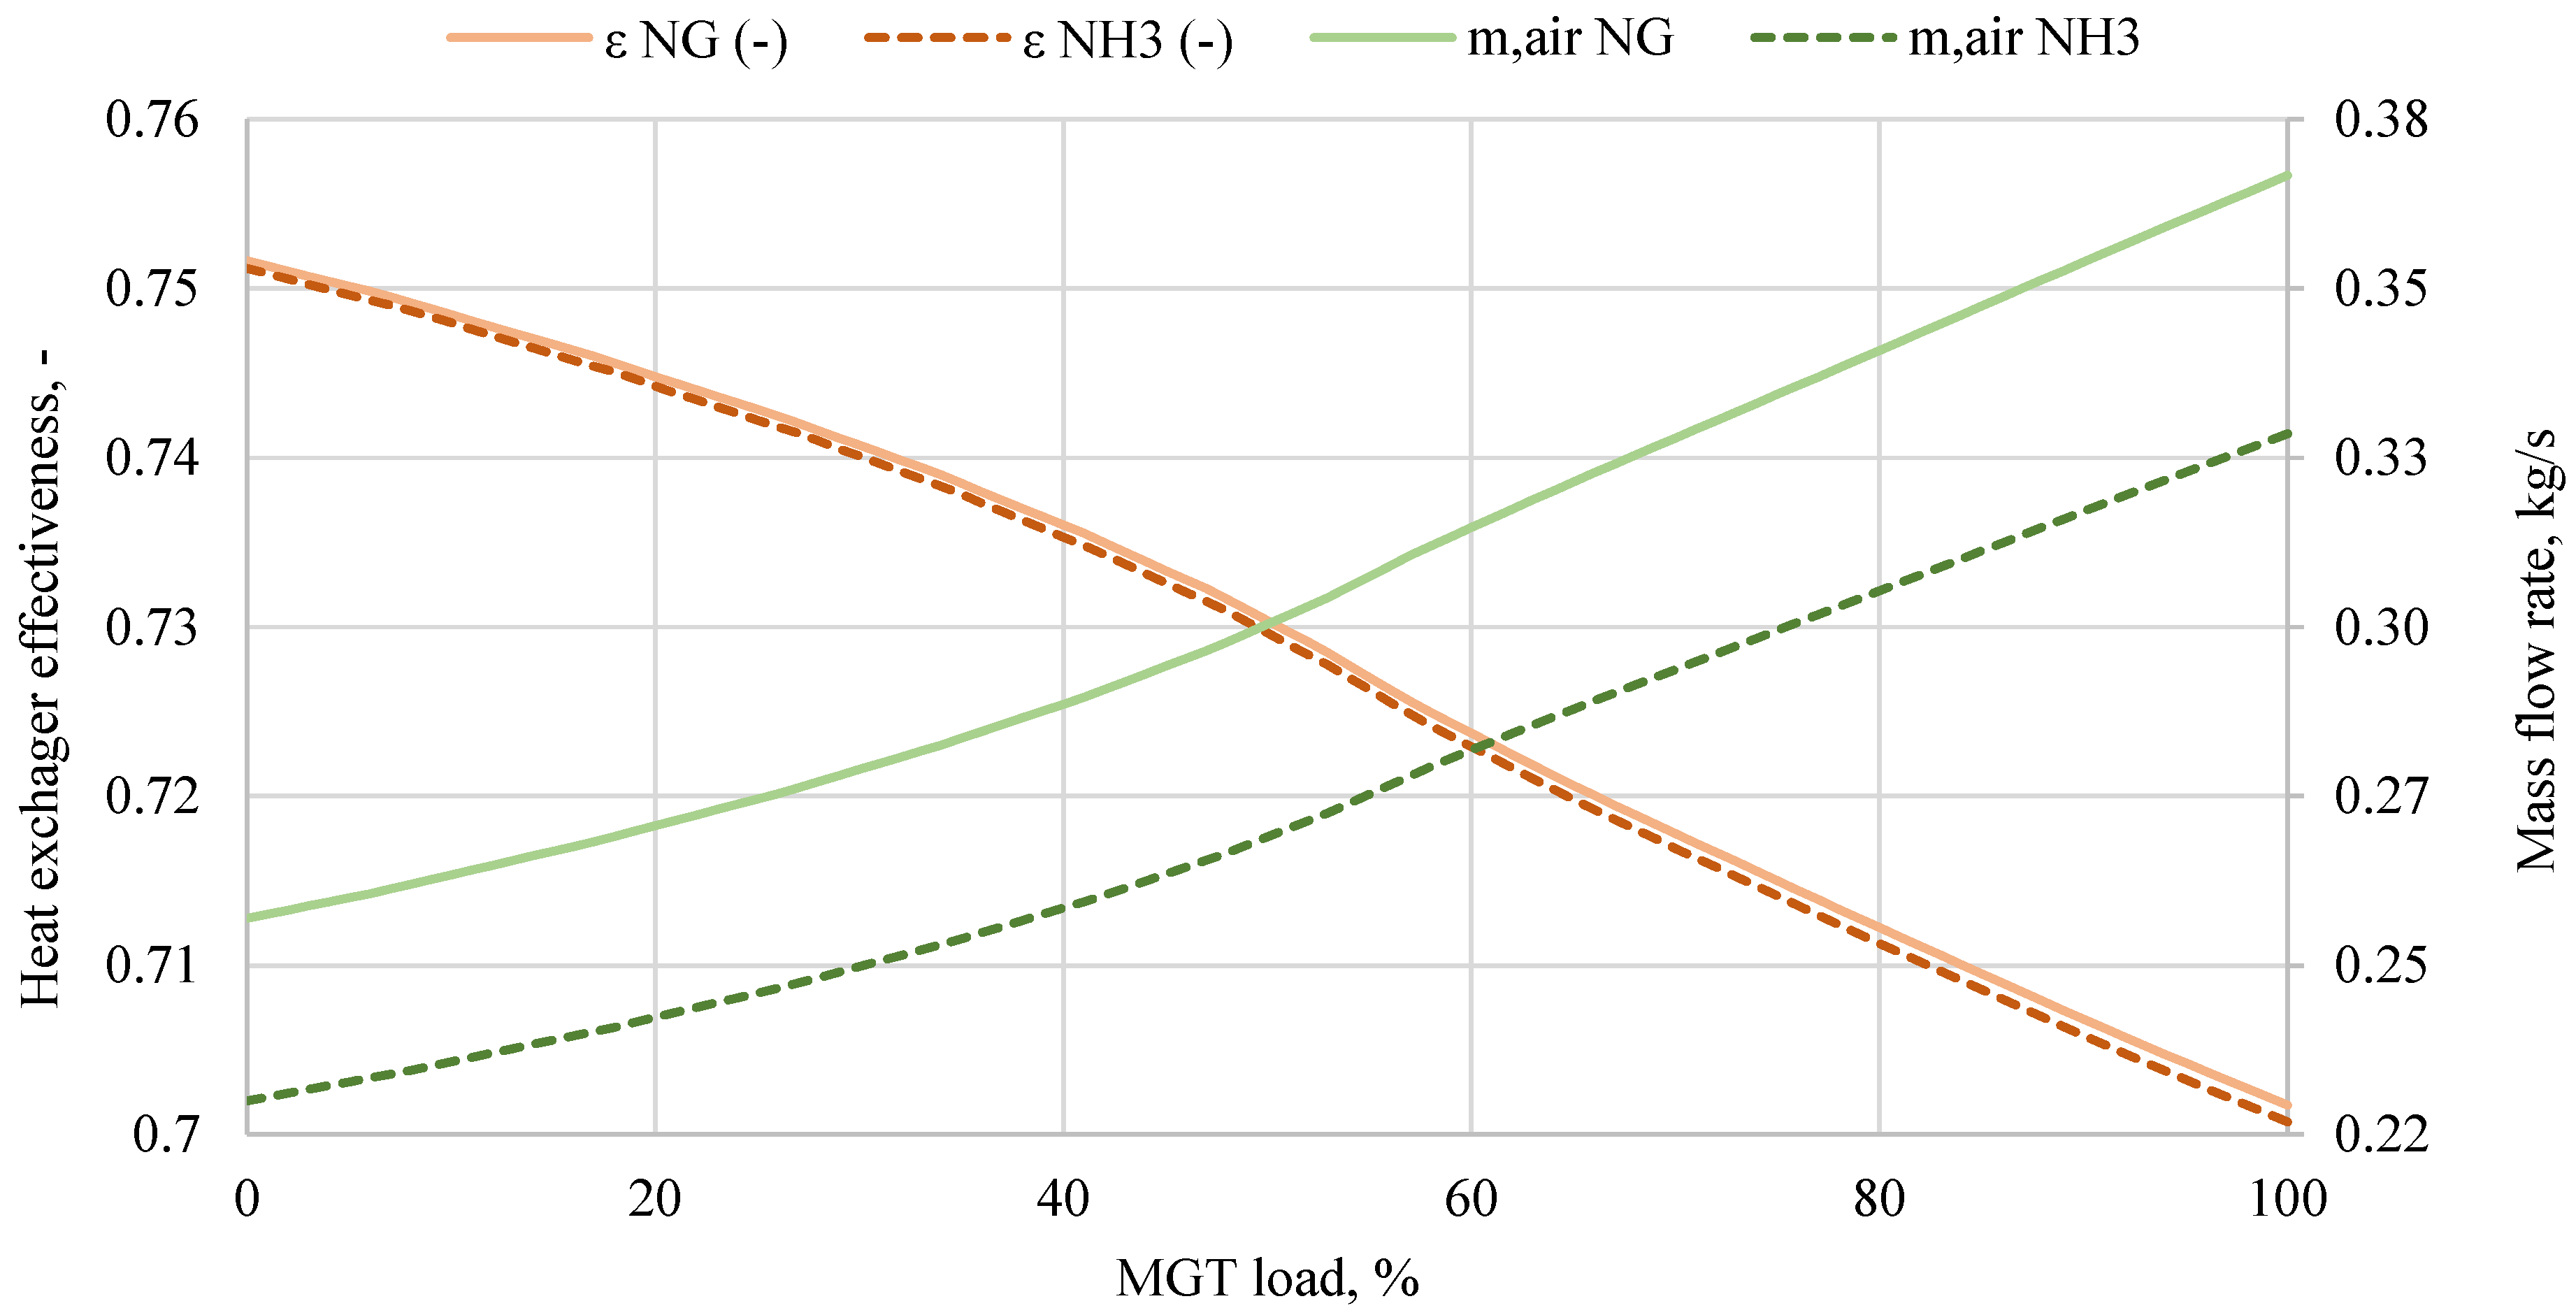
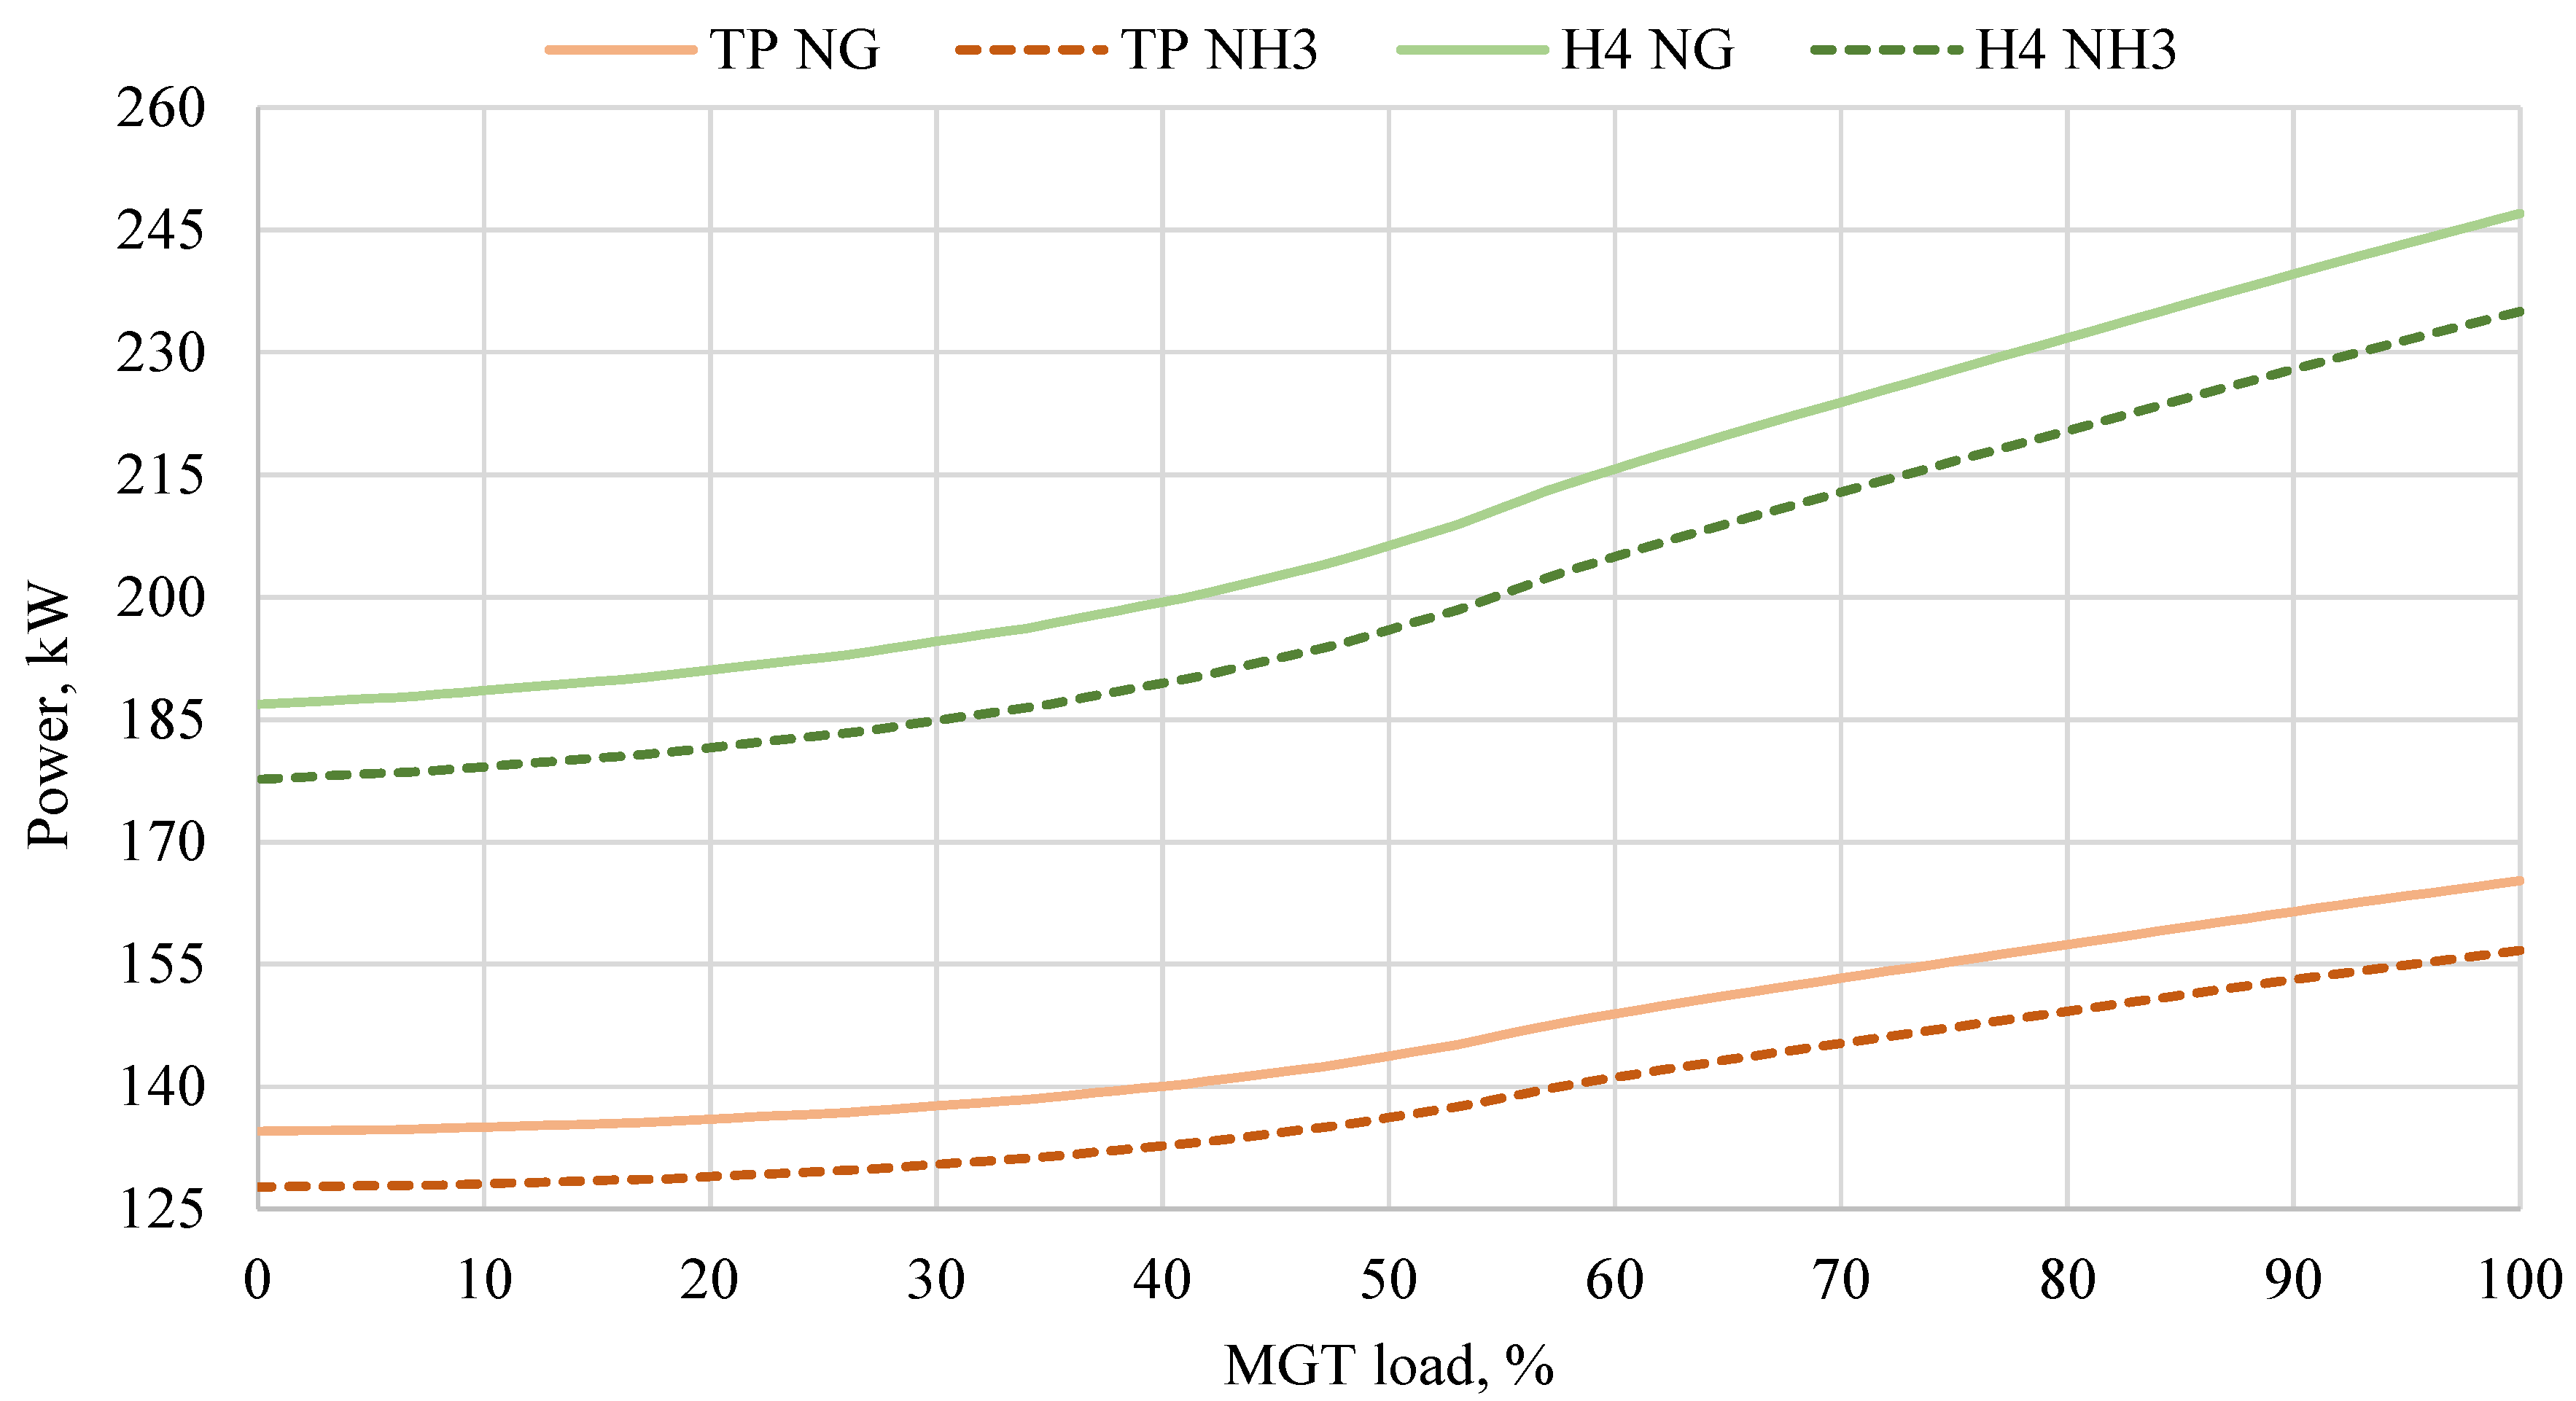
3.1. Partial Load Off-Design Characteristics

The first aspect to investigate is the impact of load on the MGT performance. Such characteristics considering the electrical efficiency (η) and energy utilization factor (EUF) are presented in Figure 6. They outline the system’s normalized operational range (between 50 and 100 kWe referenced from 0 to 100%), represented as a non-dimensional load for the two fuelling scenarios, at constant outside air temperature equal to 15 °C (nominal conditions). In the baseline scenario using natural gas, electrical efficiency peaks at nominal conditions (maximum load). The turbine inlet temperature and pressure drop across the combustor are fixed, so specific enthalpy at point 3 (numbering according to Figure 5), h3, is constant at all loads. However, with a reduced demand for electrical energy, a lesser quantity of fuel is combusted, necessitating a lower air mass flow rate to achieve the desired exhaust temperature before the GT, as illustrated in Figure 7. Consequently, decreasing the mass flow rate of the exhaust leads to a reduced turbine internal efficiency. This indicates less effective energy conversion within the turbine which is confirmed by plotting the specific enthalpy differential across the turbine (ΔhGT), shown in Figure 8. The best energy conversion in the turbine translates to the highest specific enthalpy differential at the nominal load, while the worst energy conversion is at the minimum load. Notably, low energy conversion in the GT corresponds to the high temperature of the exhaust after the turbine. The EUF, which combines both electrical and thermal efficiencies, remains relatively stable across the load range. This suggests an improved efficiency of thermal power production under partial load conditions, effectively offsetting the reduced electrical efficiency. This is primarily driven by a higher exhaust temperature under declining load conditions (Figure 8), thus allowing for more effective heat transfer in the HR. This is confirmed in Figure 7 where the higher effectiveness of the heat exchanger under partial load conditions is showcased.
In the operational range under consideration, the electrical efficiency when using ammonia as a fuel, outlined in Figure 6, is approximately 1 percentage point higher compared to the natural gas baseline. This enhanced efficiency is attributed to the lower mass flow rate of air required to be compressed prior to entering the combustion chamber. Since ammonia has a lower heating value compared to methane, the ammonia-based system necessitates less air to achieve the target post-combustion temperature (given that the stoichiometric air-to-fuel ratio for ammonia is around 3 times lower than that for methane). This is illustrated in Figure 7: at nominal conditions there is around a 0.4 kg/s difference between the mass flow rate of the natural gas-based system versus the ammonia-based one, and an around 0.3 kg/s at minimum load. With less compressor power required, a larger share of the turbine work becomes net electric output, raising the cycle’s electrical efficiency.
Thermal power (TP) produced in the ammonia-fueled scenario, depicted in Figure 9, is lower than that of natural gas, which is attributed to a reduced exhaust enthalpy at the inlet to the heat recovery heat exchanger (H4), also illustrated in Figure 9. This is due to the lower exhaust mass flow rate and exhaust temperature under declining load in the ammonia scenario. The EUF, outlined in Figure 6, demonstrates similar values for both ammonia and natural gas cases, with the trends nearly overlapping. The higher electrical efficiency observed for ammonia implies that its thermal recovery efficiency is marginally lower, which neutralizes the overall EUF, resulting in comparable values for both cases.

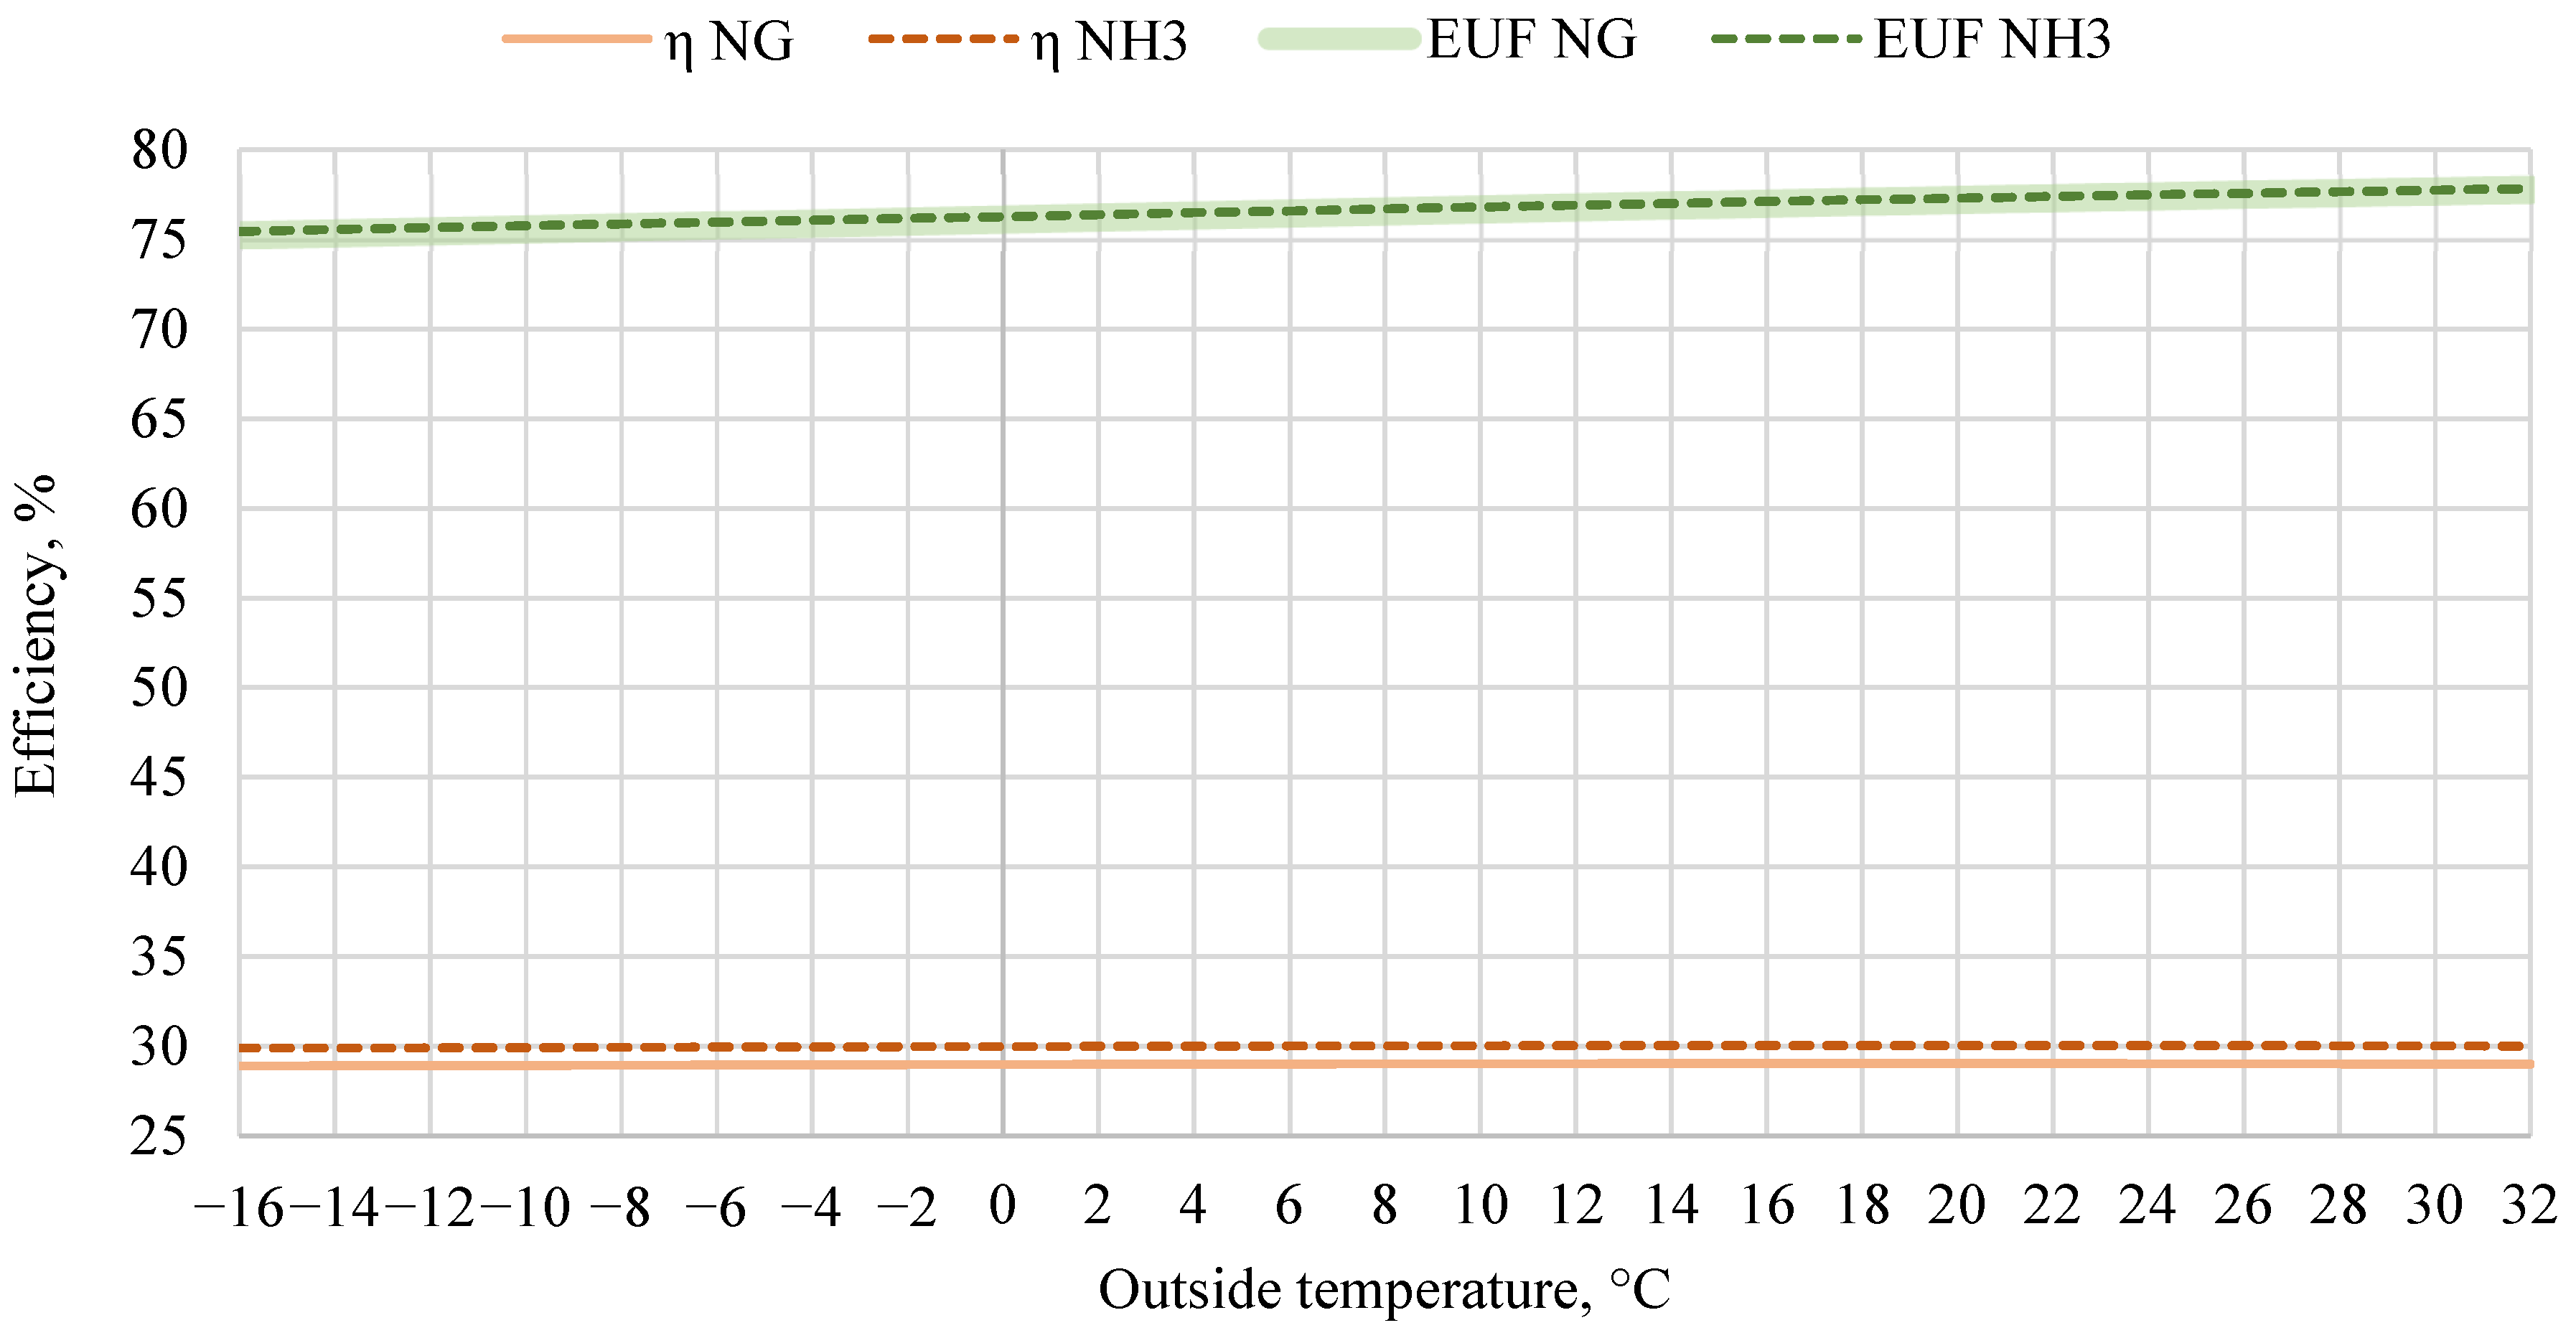
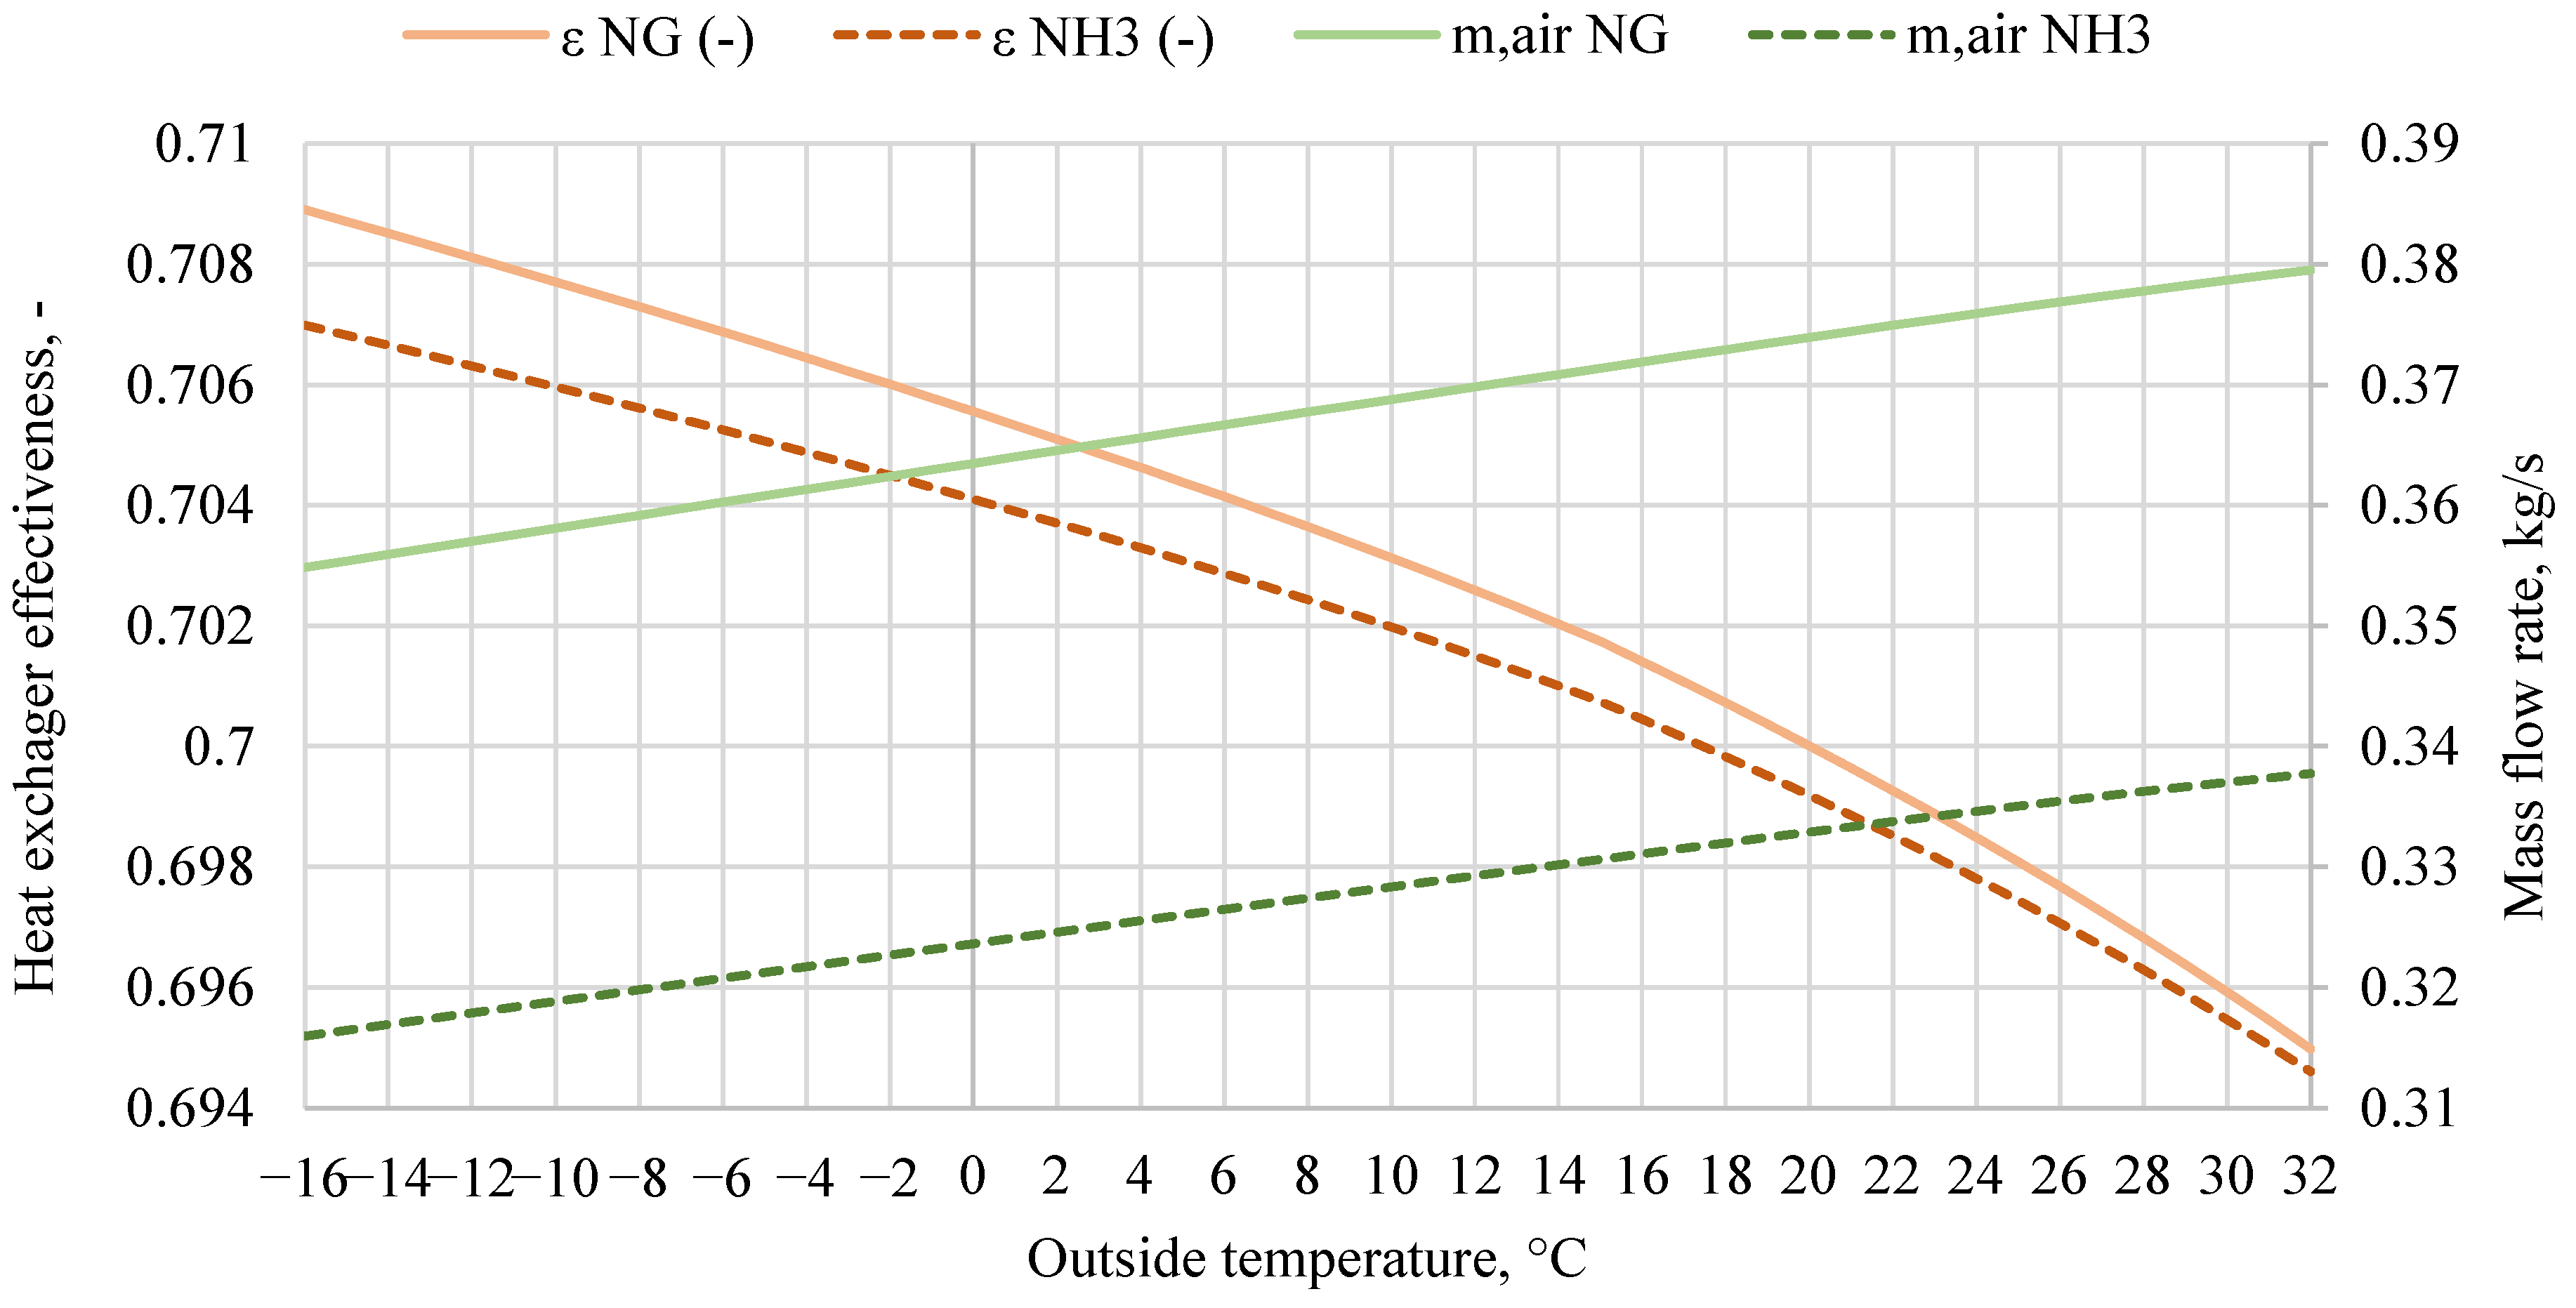
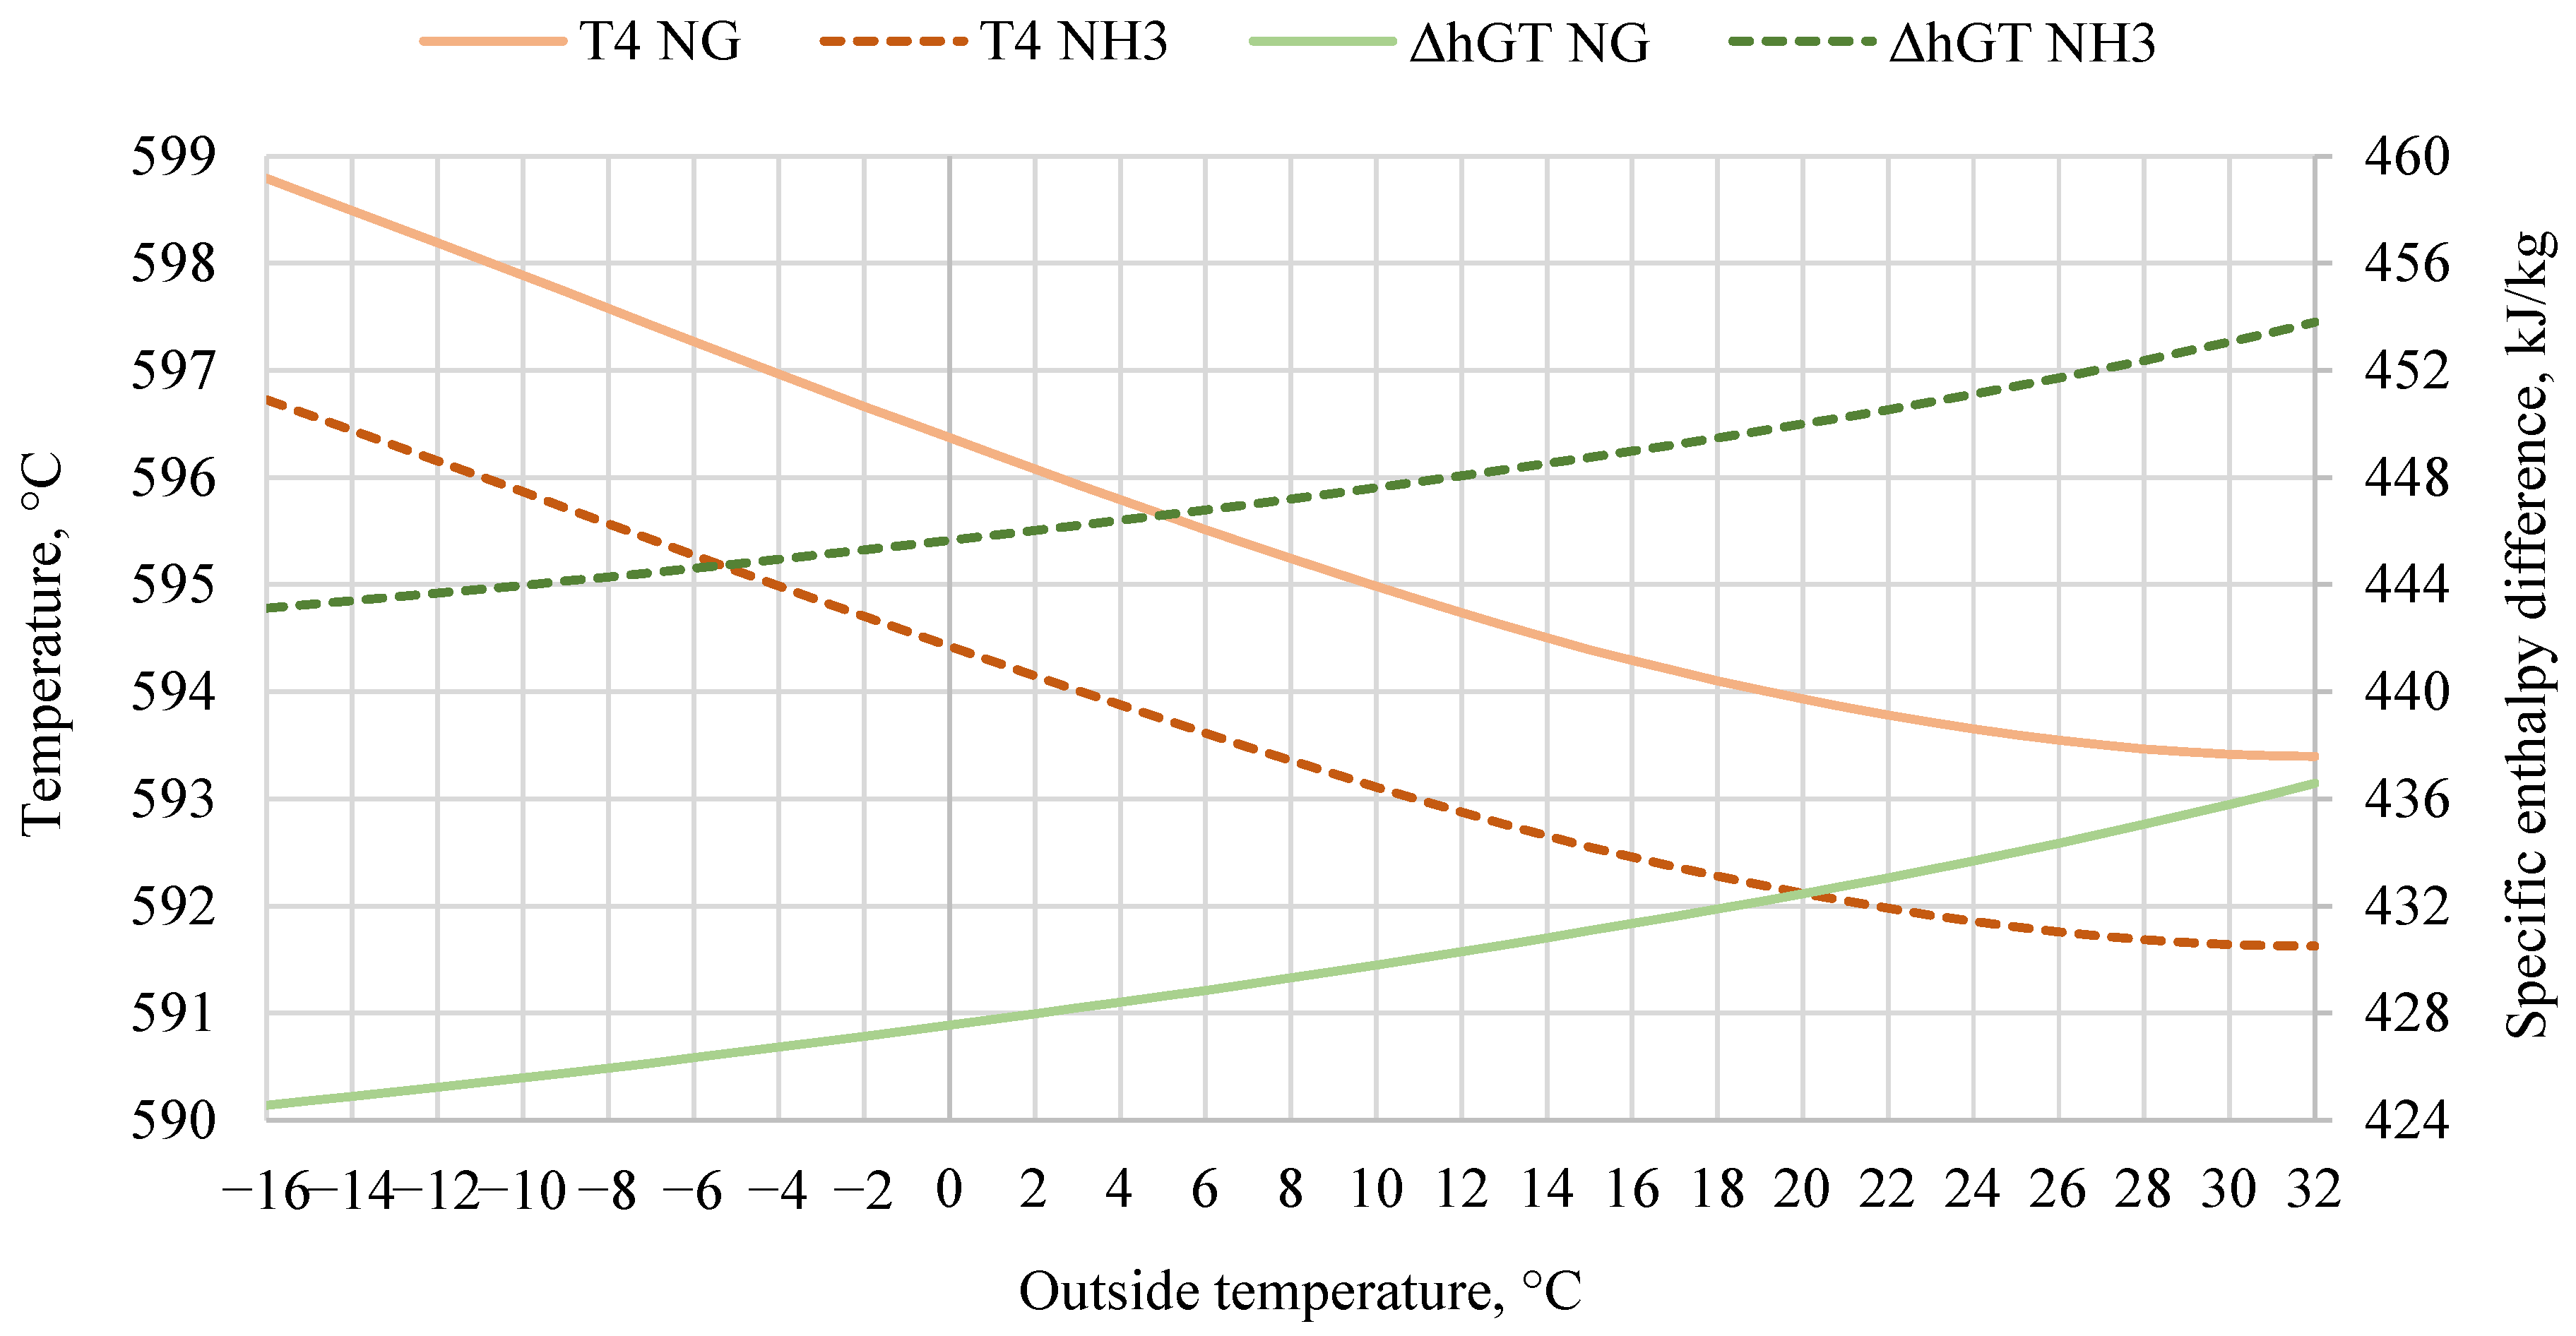
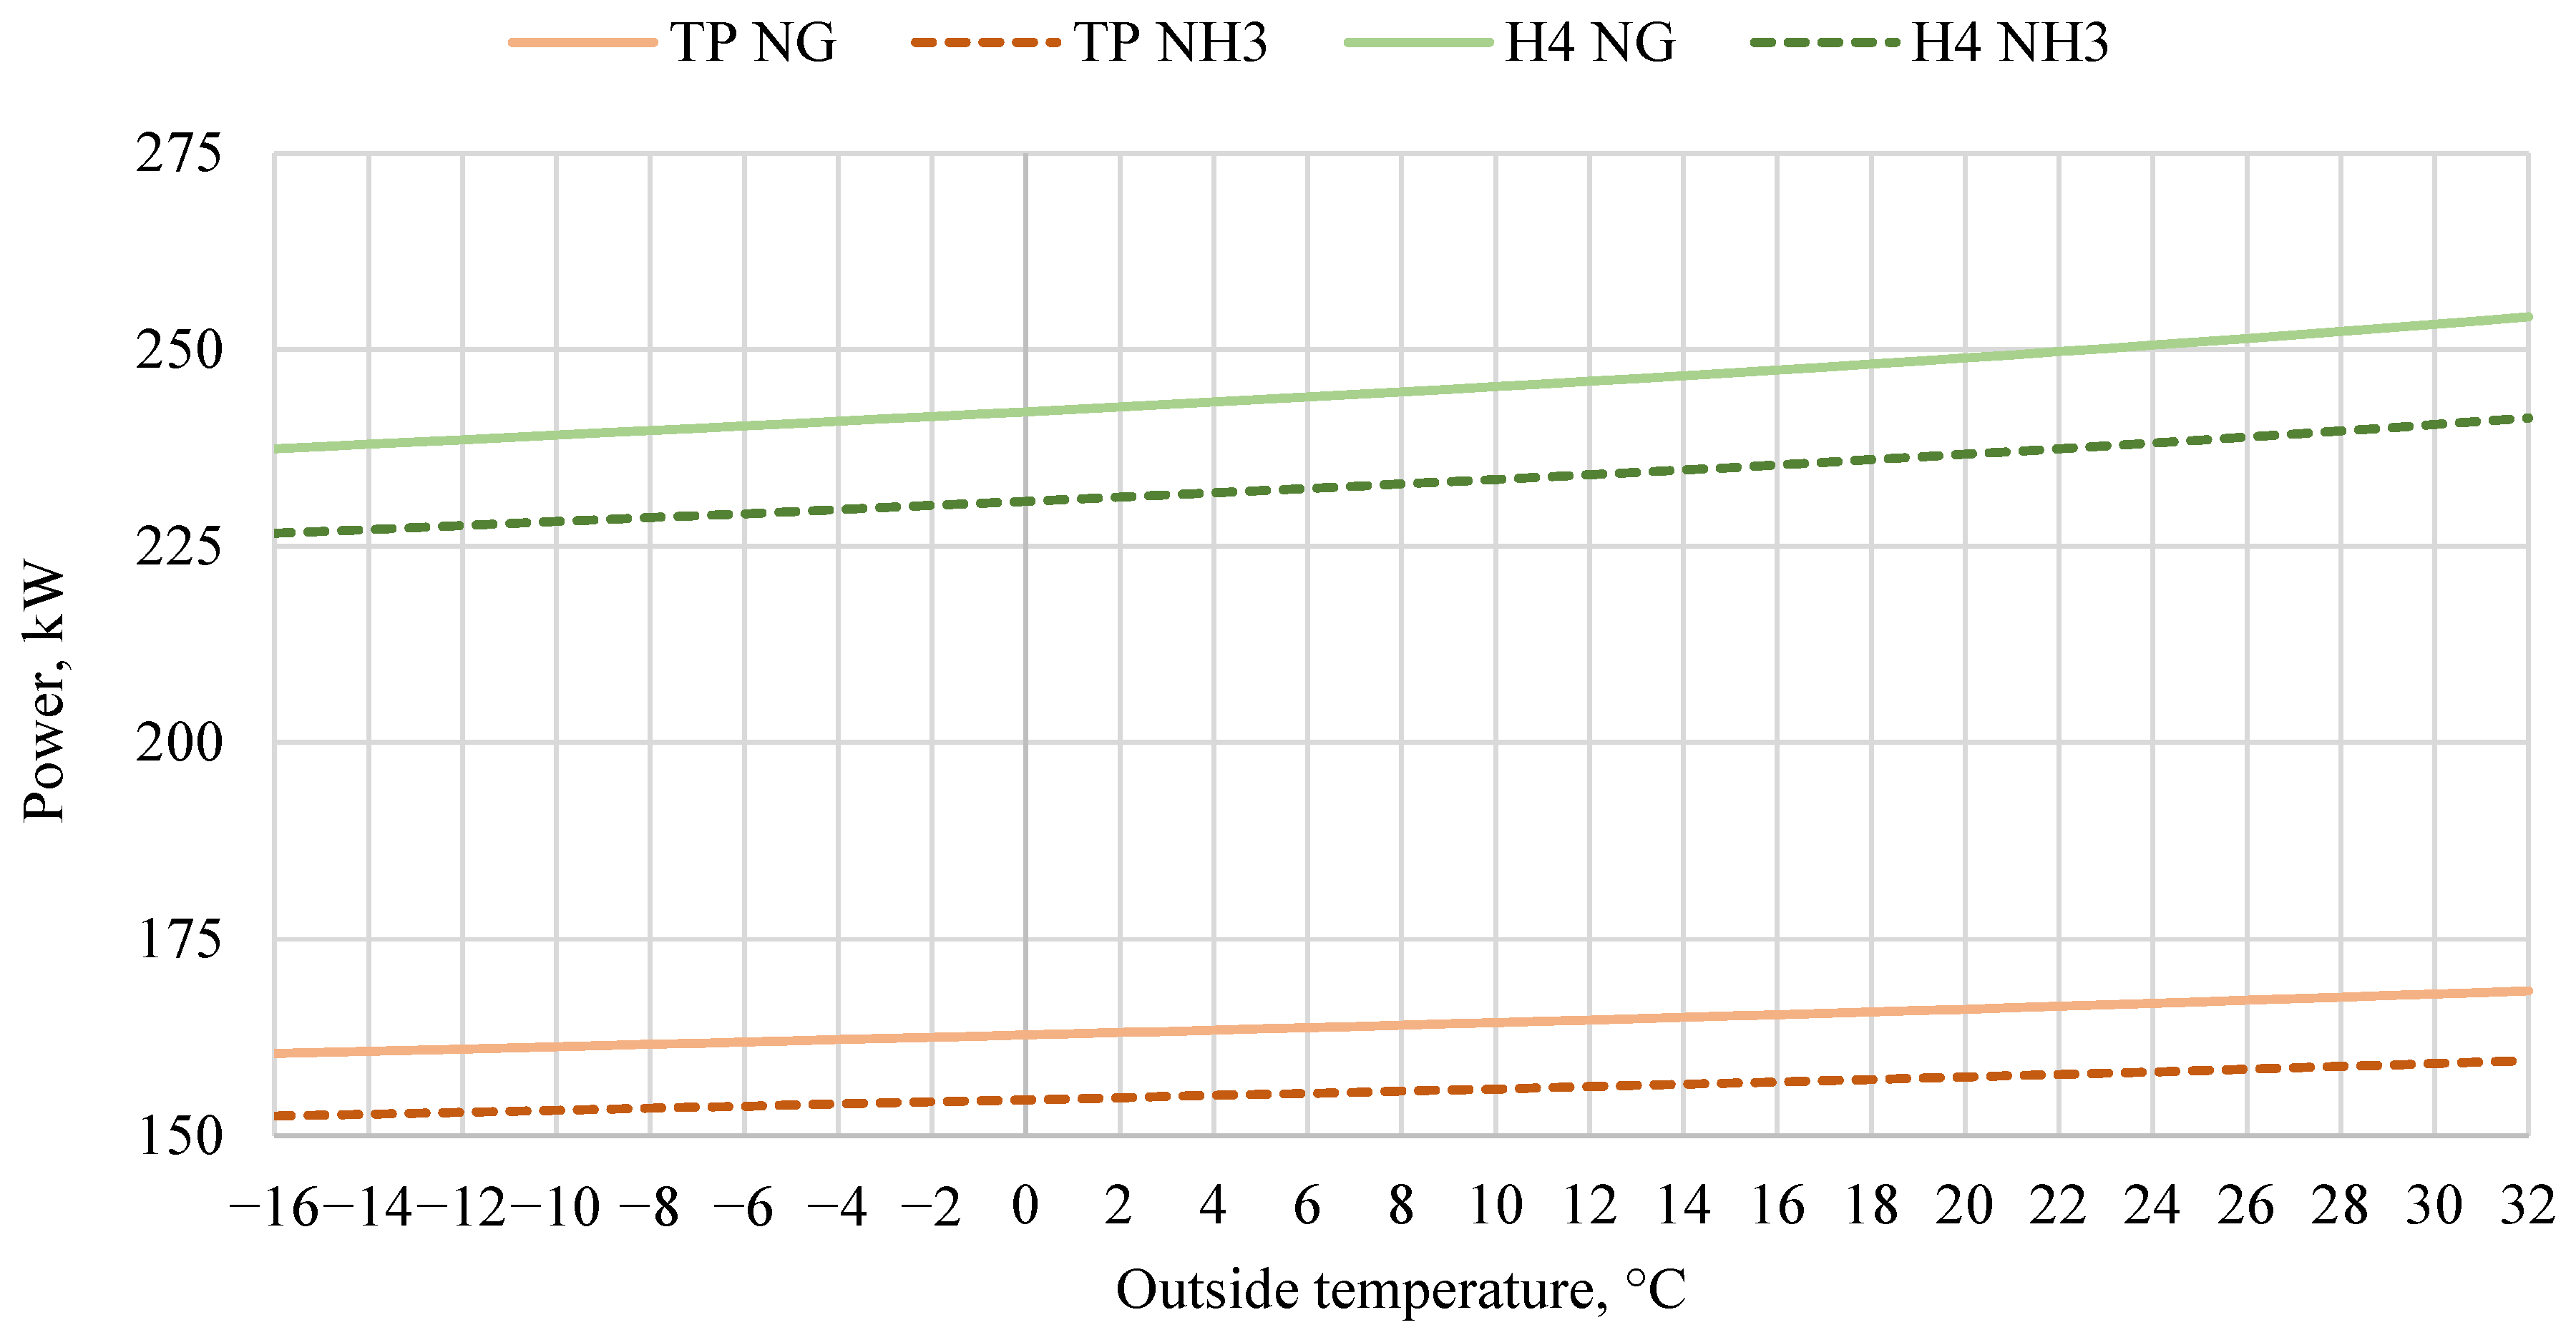
3.2. Varying Outside Temperature Off-Design Characteristics

The second aspect to investigate is the impact of air temperature at the compressor inlet on the MGT performance. Analogously to the partial load characteristics, the same variables were investigated, presented in Figure 10, Figure 11, Figure 12 and Figure 13. These characteristics were defined at 100% load of the MGT system.
The change in the electrical efficiency for the natural gas case over varying air temperatures, presented in Figure 10, resembles a flat line. At low air temperatures, the density of air increases, resulting in a reduction in the mass flow rate of air which translates into a drop in the compressor power requirement. This is confirmed in Figure 11 where a declining trend of air mass flow rate under decreasing ambient air temperature is outlined. Concurrently, the turbine’s internal efficiency decreases, as shown by the declining specific enthalpy differential over declining air temperatures, as presented in Figure 12, caused by the reduced mass flow rate of the exhaust. The two effects offset each other, and therefore the electrical efficiency, while not precisely constant, undergoes negligible changes. Declining the specific enthalpy differential over diminishing air temperatures also results in an increase in turbine outlet temperature T4 at low ambient temperatures, shown in Figure 12, which improves the effectiveness of a heat exchanger, as outlined in Figure 11.
The change in the EUF appears to be almost linearly dependent on the air temperature. Since the electrical efficiency exhibits a flat trend, it implies that the efficiency of thermal power generation increases with the outside temperature. For the natural gas case, thermal power drops at lower air temperatures, as seen in Figure 13, because the enthalpy flow of the exhaust entering the heat exchanger is lower; the reduced exhaust mass flow rate outweighs the higher temperature of exhaust T4. However, fuel input varies only marginally, because the turbine is held at 100 kWe across the entire temperature range; differences stem mainly from the changing enthalpy of the inlet air. Thus, the reduced exhaust mass flow at low ambient temperatures lowers TP and, in turn, the thermal power fraction of EUF, explaining the gentle decline in EUF—even though heat-exchanger effectiveness is actually higher under those colder conditions.
Electrical efficiency is higher for the ammonia case compared to natural gas, while the EUF achieves very similar values. These differences can be explained by the same reason as in the case of varying load analysis; the electrical efficiency gain for the ammonia case is primarily due to the lower air mass flow requirements (Figure 11) and the subsequent reduction in compressor power demand, allowing for a more effective conversion of turbine work into electrical energy. Additionally, a lower exhaust temperature at the turbine outlet (Figure 12) results in lower heat exchanger effectiveness obtained for the ammonia-fueled system (Figure 11). Lower thermal power in the ammonia variant (Figure 13) is due to the reduced exhaust enthalpy from a smaller exhaust mass flow rate. However, similar EUF values for both cases result from the higher electrical efficiency with ammonia balancing out its marginally lower thermal recovery efficiency, leading to an overall similar efficiency in energy utilization between ammonia and natural gas systems.

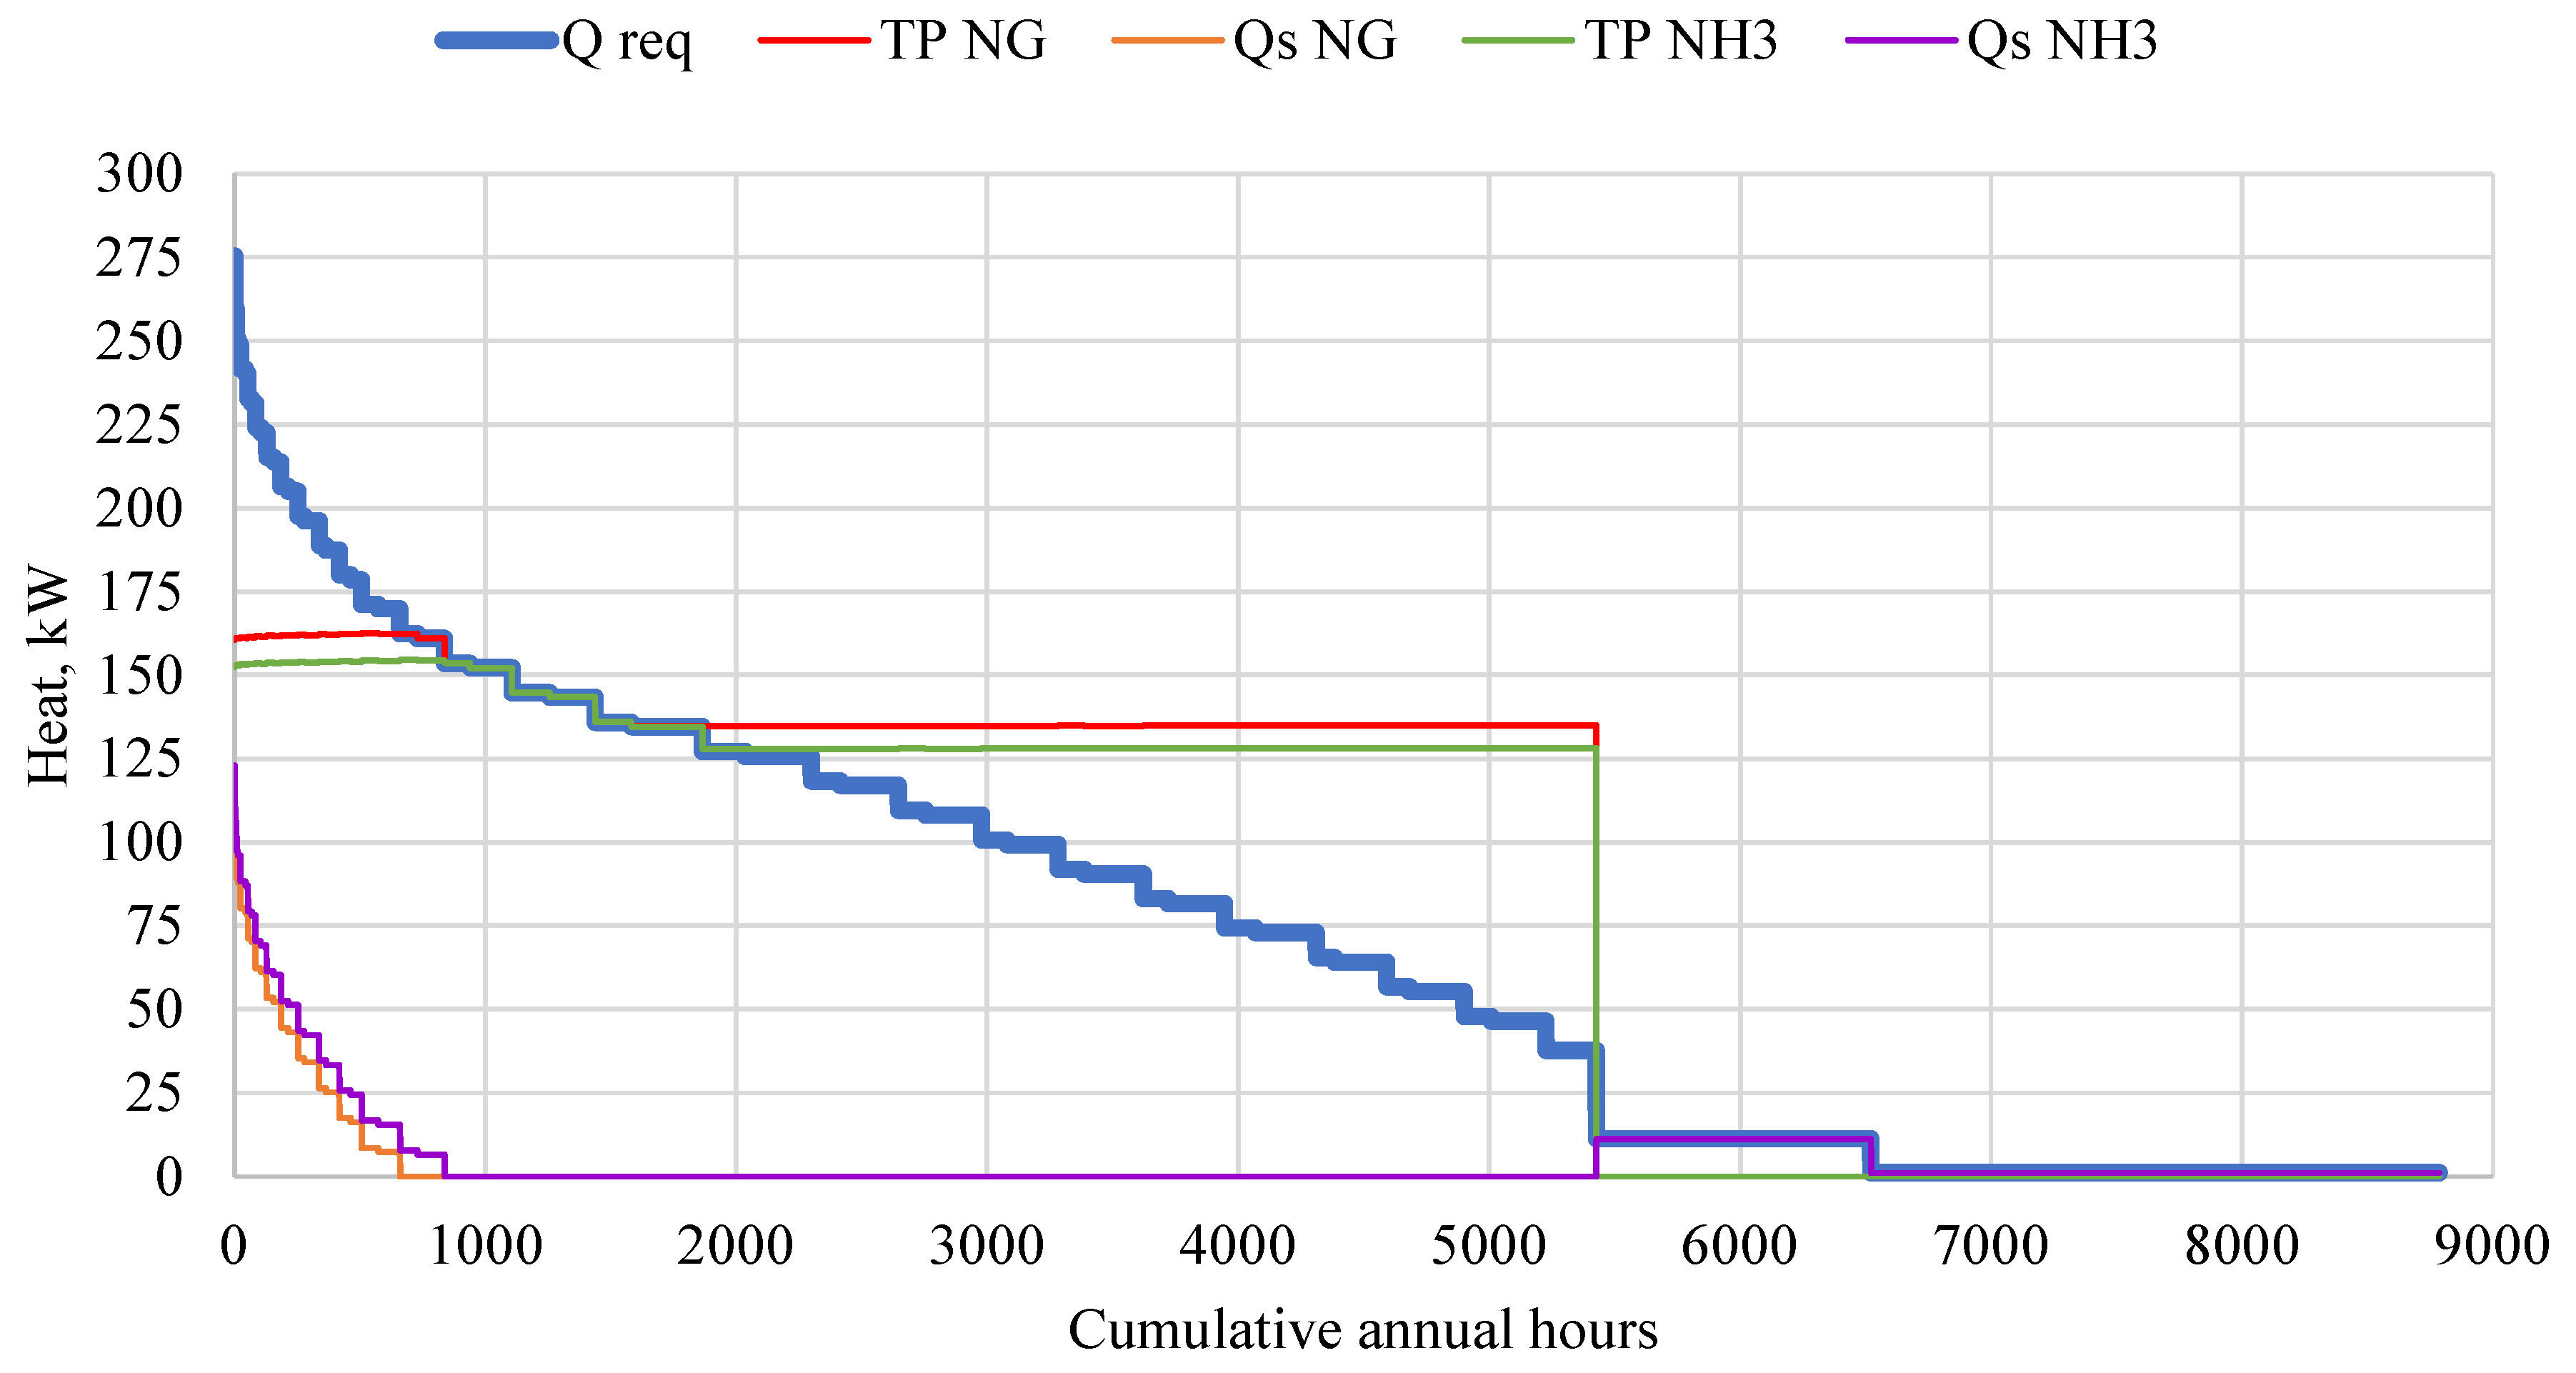
3.3. District Heating Load Results

Figure 14 compares the performance of systems supplying heat to a residential community. The figure outlines the heating requirement of the residential community (Q req), thermal power production of the two considered systems (TP NG and TP NH3), and the amount of heat that would be produced by the peak-reserve source of heat (e.g., gas boiler) in the two scenarios (Qs NG and QS NH3). The results are plotted versus the LDC of heat requirement.
The findings show that the operational range in terms of thermal power demand is slightly different for the two cases; the natural gas system is characterized by a higher thermal power capacity, and therefore its flexible range starts at a higher heat load compared to the ammonia case. Consequently, the peak-reserve heat source for the natural gas system produces less heat compared to that of the ammonia system. This description regards the situation on the graph between 0 and 1000 h (x-axis). Moving further to the right, it is seen that both systems cover the heat demand precisely, as the heat requirement is within their operational range. However, at the minimum load of the natural gas MGT, a higher thermal power is produced, and therefore the natural gas scenario generates more excess heat, which starts around the 2000 h mark. Around the 5400 h mark, both systems are deactivated, and the heat demand is covered solely by the additional heat sources, which match the heat requirement precisely in this range. The shape of thermal power production for both the natural gas and ammonia systems resembles a serrated shape, not a straight line. This stems from the fact that the heat demand, ordered from maximum to minimum, results from two effects: heating demand and domestic hot water demand. While the first part is directly dependent on the outside temperature, the second part depends solely on time. However, since the thermal power capacity of the system depends on ambient air temperature, as shown in 0, there is a discrepancy between the heat demand and thermal generation which causes the serrated shape.
A summary of integrated results is presented in Table 7. From a system-level analysis, an ammonia-based system is characterized by a higher electrical energy production compared to natural gas which is reflected by the 1.46 percentage point increase in electrical efficiency. While the heat produced is lower, the overall value of the EUF for the two cases is similar, as explained in the 0 and 0, resulting in a 0.08 percentage point increase in thermal power generation efficiency. Thus, on a thermodynamic basis, under the present modelling assumptions, it is proven that the ammonia-fueled gas turbine system for power and heat production is a better option than the natural gas-based system.
The ammonia-based configuration requires a higher amount of heat from the peak-reserve heat source, with a difference of 23.8 GJ, due to its lower thermal power capacity. Depending on the efficiency of this heat source, this could lead to further variations in comparison between the two modes of delivering heat to the residential community. An analysis of the peak-reserve heat source is outside of the scope of this study. However, the lower thermal power capacity of the ammonia system also indicates that, overall, less excess heat is produced (a difference of 87.2 GJ) while operating at the minimum load which lasts roughly around half the time of the MGT’s operation, as outlined in Figure 14. By defining an additional parameter as the effective EUF, where instead of accounting solely for the sum of electrical energy and heat produced by the MGT, excess heat is subtracted in the numerator, it is observed that a higher effective EUF is achieved by the ammonia case by 1.6 percentage points. This strengthens the hypothesis of the beneficial usage of ammonia-based CHP. To improve the overall thermodynamic performance of both systems, excess heat utilizatioCn strategies—such as adding thermal storage– or adapting the turbine to a lower minimum load could be adopted; however, these concepts lie beyond the scope of the present study.
In addition to performance metrics, from a carbon dioxide emission perspective, assuming that the peak-reserve heat source is a gas boiler fueled by natural gas with an average thermal efficiency of 85%, on a stoichiometric basis the natural gas-based system emits 293,656.3 kg of CO2, whereas the ammonia-fueled variant leads to the emissions of 10,399.8 kg of CO2. Such a scenario means that the ammonia-based system allows for a 96-percentage point reduction in the impact on climate change in the MGT system. Nonetheless, the peak-reserve heat source could be based on electric sources or boilers that utilize environmentally neutral fuels (such as biogas), which could potentially lead to a complete reduction in greenhouse gas emissions.

3.4. Deviation from the Real-World Performance

A primary assumption behind this study is that it is possible to combust ammonia using a specifically designed combustion chamber efficiently enough across the operational range of the gas turbine. This assumption is derived from the proven possibility of using the ammonia in a gas turbine, as shown in the literature [32,34]. While a complete combustion approach is typical for system-level analysis where the primary focus is on the energy balance and overall system performance, it must be stated that it does not precisely represent reality.
The first aspect it affects is the environmental benefits of the fuel switch. Based on the provided natural gas consumption in Table 7 for the natural gas-based system, the consumption of 103,563.2 kg of CH4 leads to the emission of 284,798.8 kg of CO2, considering stoichiometric conditions. Since the complete combustion of NH3 results in the emissions of N2 and H2O, a considerable environmental advantage would be achieved as these are environmentally neutral. However, from the investigations of ammonia-fired systems [21,41,42], it is known that the emissions of NOx and N2O occur. Combustion efficiency calculations under varying conditions requires conducting a dedicated study, and this would be the first proposed further research direction based on the results presented in this work.
Having accounted for the real combustion, an evaluation of implementation of the exhaust treatment method should be considered. Apart from the mentioned NOx and N2O, a detailed examination of NH3 slip would be required to ensure the safety of the installation, given that the technology is meant to be placed near a residential area. As such, a proper exhaust gas treatment system must ensure not only maximum environmental gains but also safety. These emissions can be addressed by exhaust treatment technologies such as SCR. Successful NOx reduction via SCR has been reported by, among others, Iki et al. [32], Kurata et al. [34], and Jung et al. [43], who reported about an increase in N2O emission due to passing through an SCR system. Therefore, careful consideration in terms of catalyst material selection towards N2O reduction must be performed, given the possible interest in the greenhouse gas reduction (noting that the GPW for N2O is 273).
From a CHP-level perspective, incorporating the SCR into the analysis causes the electrical efficiency to drop due to higher pressure required after the turbine and electrical energy consumption. While Liang et al. [44] estimate 1000 Pa of resistance in exhaust flow due to the SCR, which would not affect the system’s performance considerably, a precise calculation should be made once the concentrations of the pollutants in the exhaust were determined. Then the system’s performance should be recalculated, especially given that the difference in electrical efficiency between the ammonia and natural gas obtained in this study is small.
An additional aspect that could impact the ammonia-fueled MGT performance is its reliability. Common metrics that are used for such an assessment are Mean Time Between Failures (MTBF), Mean Time To Repair (MTTR), and Availability (A), defined as [45]
M T B F = o p e r a t i n g   h o u r s n u m b e r   o f   f a i l u r e s
A = M T B F M T B F + M T T R
Based on data from a commercial microturbine system, such as the Capstone units, the MTBF is reported at 15,000 h and availability at 0.99 [46]. This implies an MTTR of approximately 151.5 h. In the present study, both MGTs operate for approximately 5400 h per year under heat-tracking operations, allowing for effective maintenance planning and ensuring its availability and reliability. For the ammonia-fueled system, a precise estimation of MTBF and MTTR is currently not possible, as these metrics rely on statistical data, which are not yet available for NH3-based systems. However, since the system design remains largely similar to the NG-based configuration, the reliability performance is expected to be comparable, noting that the modified combustion chamber may introduce new maintenance demands, and the inclusion of an SCR unit may require periodic inspection or replacement—e.g., SCR inspection every 6500 h has been suggested in industrial practice [47]. Given the 5400 h annual operation, these inspection intervals can be accommodated with minimal disruption. While safety and reliability monitoring would be particularly important due to ammonia’s toxicity, the buffer time counted in this assessment is assumed to be sufficient to manage any maintenance and repair services in time.
To validate the results presented in this study, a realistic design of the system should be incorporated. Primarily, the system should be enhanced by the inclusion of a recuperator which is a typical approach to improve the gas turbine system’s performance. Secondly, actual values for the internal efficiencies of devices should be considered. In this work, a well-designed, simplified system is analyzed since the primary focus of the study is to understand the impact of the fuel type on the system’s performance. Such an approach allowed for a straightforward comparison, and within this context, the results should be treated as representing a theoretical maximum potential for utilizing each fuel in an MGT.

4. Summary

In this research, a comparative technical analysis was conducted on two micro-gas turbine systems (100 kWe) operating in combined heat and power mode, that are designed to supply heat to a residential community of 15 average-sized buildings located in Central Europe with a continental climate. The heat requirement was determined based on the heating demand, which varies with the ambient temperature, and the domestic hot water demand, which is determined by the usage time throughout the day. Two fuelling scenarios were considered. First, a system powered by natural gas (methane), serving as the benchmark, was defined in the Ebsilon software using an on-design method. In the next step, the analysis was extended to include an ammonia-fueled system, utilizing the same on-design assumptions. After the definition of on-design parameters for the MGT CHP systems, off-design evaluations were conducted to assess the system’s performance under partial load scenarios. The idealized design of the unrecuperated cycle was adopted for both scenarios to isolate the thermodynamic impact of the fuel switch (from methane to ammonia) without additional implications arising from the cycle’s design itself. The off-design characteristics defined for two conditions—a varying load under a constant ambient temperature and a varying outside temperature at a constant load—indicated that the ammonia-fueled MGT CHP system is characterized by a better energy conversion, as reflected by a higher electrical efficiency, but a lower thermal power generation efficiency, which resulted in a very similar overall Energy Utilization Factor (EUF) for the two cases. The annual simulation of the two systems proved it as follows: the ammonia-fueled system achieved 26.05% electrical efficiency and 77.63% EUF, compared to 24.59% and 77.55% for the natural gas case, respectively. These findings demonstrated that ammonia can match natural gas in small-scale CHP applications, highlighting its potential as a viable carbon-free fuel.
The concept of using ammonia as a fuel to supply heating to buildings is based on the rationale that there are off-grid locations where electrical-based solutions might represent a challenge due to technical or financial constraints in terms of supplying electrical energy from renewable sources. Examples include certain islands or regions with high heat demand and outdated electrical infrastructure reliant on fossil fuels. In such cases, a combustion-based CHP system should at least be considered, especially within the broader context of a hydrogen and ammonia economy, even as an interim solution. Additionally, an ammonia-based CHP system could also be a promising option to supply heat to industrial processes (due to the high-temperature heat). While in this paper the heat demand from buildings serves to establish the heat requirement profile, thus determining the operation of the MGT CHP, for industrial applications this profile would differ, but the conclusions drawn from the comparison of the two fuelling systems remain valid. While the adopted assumptions are typical for system-level analysis, these assumptions do not precisely reflect reality. Future research should (i) validate ammonia combustion and emission profiles across the turbine load range; (ii) update the thermodynamic model with a recuperator and SCR accounting for realistic pressure losses; (iii) perform a complete techno-economic and life cycle assessment based on the validated data; (iv) investigate MGT integration with thermal storage and grid interfaces for off-grid or industrial sites.

Author Contributions

Conceptualization, M.P. and A.S.; Data curation, M.P.; Formal analysis, M.P.; Funding acquisition, A.S.; Investigation, M.P.; Methodology, M.P.; Supervision, K.P. and A.S.; Validation, M.P.; Visualization, M.P.; Writing—original draft, M.P.; Writing—review and editing, K.P., C.M.-R., M.R.B., A.G., Y.F., M.L., and A.S. All authors have read and agreed to the published version of the manuscript.

Funding

This work was supported by the European Interest Group (EIG) CONCERT-Japan platform through the National Centre for Research and Development in Poland in the project: Ammonia-Hydrogen Combustion in Micro Gas Turbines (ADONIS), grant no. EIG CONCERT-JAPAN/8/89/ADONIS/2022.

Data Availability Statement

The original contributions presented in the study are included in the article, further inquiries can be directed to the corresponding authors.

Conflicts of Interest

The authors declare no conflicts of interest.

List of Abbreviations

Cminheat capacity rate (smaller one between two fluids), expressed in kW/K.
CCcombustion chamber.
EUFenergy utilization factor, expressed in %.
GTgas turbine.
LDCload duration curve.
hspecific enthalpy, expressed in kJ/kg.
Henthalpy, expressed in kW.
fhlheat losses factor, expressed in non-dimensional scale.
HR heat recovery heat exchanger.
kWekilowatt in regard to electrical power.
LHVlower heating value, expressed in kJ/kg.
Ppressure, expressed in bar.
Pelelectrical power, expressed in kW.
Q˙HEactual heat transfer rate in the heat exchanger, expressed in kW.
Q˙DHWdomestic hot water demand of an analyzed building, expressed in kW.
Q˙Hheating demand of an analyzed building, expressed in kW.
Q˙loadheat load required to be produced in a CHP unit at given hour, expressed in kW.
Q˙MAX,HEmaximum heat transfer rate in the heat exchanger, expressed in kW.
QTloadintegrated value of annual heat demand, expressed in GJ.
Ttemperature, expressed in °C.
Tc,ininlet temperature of cold fluid, expressed in °C.
Th,ininlet temperature of hot fluid, expressed in °C.
TPthermal power, expressed in kW.
m   ˙ mass flow rate, expressed in kg/s.
φhumidity, expressed in %.
η electrical efficiency, expressed in %.
Δ h G T specific enthalpy difference across the gas turbine, expressed in kJ/kg.

References

  1. IEA. Combined Heat and Power; IEA: Paris, France, 2008; Available online: https://www.iea.org/reports/combined-heat-and-power (accessed on 27 July 2025).
  2. Breeze, P. Chapter 3—Combined Heat and Power Principles and Technologies. In Combined Heat and Power; Academic Press: Cambridge, MA, USA, 2018; pp. 21–32. ISBN 978-0-12-812908-1. Available online: https://www.sciencedirect.com/science/article/pii/B9780128129081000031 (accessed on 27 July 2025).
  3. Rezaei, M.; Sameti, M.; Nasiri, F. Biomass-fuelled combined heat and power: Integration in district heating and thermal-energy storage. Clean Energy 2021, 5, 44–56. [Google Scholar] [CrossRef]
  4. Castro, R. Combined Heat and Power. In Electricity Production from Renewables; Springer: Cham, Switzerland, 2022. [Google Scholar] [CrossRef]
  5. Wu, D.W.; Wang, R.Z. Combined cooling, heating and power: A review. Prog. Energy Combust. Sci. 2006, 32, 459–495. [Google Scholar] [CrossRef]
  6. Mago, P.J.; Chamra, L.M.; Hueffed, A. A review on energy, economical, and environmental benefits of the use of CHP systems for small commercial buildings for the North American climate. Int. J. Energy Res. 2009, 33, 1252–1265. [Google Scholar] [CrossRef]
  7. Wang, H.-C.; Jiao, W.-L.; Lahdelma, R.; Zou, P.-H. Techno-economic analysis of a coal-fired CHP based combined heating system with gas-fired boilers for peak load compensation. Energy Policy 2011, 39, 7950–7962. [Google Scholar] [CrossRef]
  8. Wijesekara, D.; Kularathna, L.; Abesundara, P.; Lankathilaka, U.; Muhandiram, I.; Amarasinghe, P.; Abesinghe, S.; Galpaya, C.; Koswattage, K. Comparative Energy and Environmental Analysis of Combined Cycle CHP Combustion Operations via Simulation for Biomass and Industrial Materials Derived from Waste. Energies 2025, 18, 3062. [Google Scholar] [CrossRef]
  9. Huang, Y.; McIlveen-Wright, D.R.; Rezvani, S.; Huang, M.J.; Wang, Y.D.; Roskilly, A.P.; Hewitt, N.J. Comparative techno-economic analysis of biomass fuelled combined heat and power for commercial buildings. Appl. Energy 2013, 112, 518–525. [Google Scholar] [CrossRef]
  10. Perrone, D.; Castiglione, T.; Morrone, P.; Pantano, F.; Bova, S. Numerical and experimental assessment of a micro-combined cooling, heating, and power (CCHP) system based on biomass gasification. Appl. Therm. Eng. 2023, 219, 119600. [Google Scholar] [CrossRef]
  11. Algieri, A.; Morrone, P.; Bova, S. Techno-Economic Analysis of Biofuel, Solar and Wind Multi-Source Small-Scale CHP Systems. Energies 2020, 13, 3002. [Google Scholar] [CrossRef]
  12. IEA. Net Zero by 2050; IEA: Paris, France, 2021; Available online: www.iea.org/reports/net-zero-by-2050 (accessed on 27 July 2025).
  13. Proniewicz, M.; Petela, K.; Szlęk, A. Life cycle assessment of ammonia as carbon-free fuel in internal combustion engine-driven orchard vehicle. Fuel 2025, 400, 135809. [Google Scholar] [CrossRef]
  14. Yu, S.; Fan, Y.; Shi, Z.; Li, J.; Zhao, X.; Zhang, T.; Chang, Z. Hydrogen-based combined heat and power systems: A review of technologies and challenges. Int. J. Hydrogen Energy 2023, 48, 34906–34929. [Google Scholar] [CrossRef]
  15. Moradpoor, I.; Koivunen, T.; Syri, S.; Hirvonen, J. The benefits of integrating industrial hydrogen production with district heating in Cold Climates with different building renovation levels. Energy 2024, 303, 131953. [Google Scholar] [CrossRef]
  16. Rieksta, M.; Zarins, E.; Bazbauers, G. Potential Role of Green Hydrogen in Decarbonization of District Heating Systems: A Review. Environ. Clim. Technol. 2023, 27, 545–558. [Google Scholar] [CrossRef]
  17. Proniewicz, M.; Petela, K.; Szlęk, A.; Adamczyk, W. Life Cycle Assessment of Selected Ammonia Production Technologies From the Perspective of Ammonia as a Fuel for Heavy-Duty Vehicle. J. Energy Resour. Technol. 2024, 146, 030905. [Google Scholar] [CrossRef]
  18. Proniewicz, M.; Petela, K.; Szlęk, A.; Przybyła, G.; Nadimi, E.; Ziółkowski, Ł.; Løvås, T.; Adamczyk, W. Energy and Exergy Assessments of a Diesel-, Biodiesel-, and Ammonia-Fueled Compression Ignition Engine. Int. J. Energy Res. 2023, 2023, 1–20. [Google Scholar] [CrossRef]
  19. Higher Calorific Values of Common Fuels: Reference & Data, The Engineering ToolBox. Available online: https://www.engineeringtoolbox.com/fuels-higher-calorific-values-d_169.html (accessed on 27 July 2025).
  20. Valera-Medina, A.; Banares-Alcantara, R. Techno-Economic Challenges of Green Ammonia as an Energy Vector; Academic Press: Cambridge, MA, USA, 2020; ISBN 978-0-12-820560-0. [Google Scholar] [CrossRef]
  21. Chehade, G.; Dincer, I. Progress in green ammonia production as potential carbon-free fuel. Fuel 2021, 299, 120845. [Google Scholar] [CrossRef]
  22. Tawalbeh, M.; Murtaza, S.Z.M.; Al-Othman, A.; Alami, A.H.; Singh, K.; Olabi, A.G. Ammonia: A versatile candidate for the use in energy storage systems. Renew. Energy 2022, 194, 955–977. [Google Scholar] [CrossRef]
  23. Salmon, N.; Bañares-Alcántara, R. Green ammonia as a spatial energy vector: A review. Sustain. Energy Fuels 2021, 5, 2814–2839. [Google Scholar] [CrossRef]
  24. Boero, A.; Mercier, A.; Mounaïm-Rousselle, C.; Valera-Medina, A.; Ramirez, A.D. Environmental assessment of road transport fueled by ammonia from a life cycle perspective. J. Clean. Prod. 2023, 390, 136150. [Google Scholar] [CrossRef]
  25. Frattini, D.; Cinti, G.; Bidini, G.; Desideri, U.; Cioffi, R.; Jannelli, E. A system approach in energy evaluation of different renewable energies sources integration in ammonia production plants. Renew. Energy 2016, 99, 472–482. [Google Scholar] [CrossRef]
  26. Duong, P.A.; Ryu, B.; Jung, J.; Kang, H. Thermal Evaluation of a Novel Integrated System Based on Solid Oxide Fuel Cells and Combined Heat and Power Production Using Ammonia as Fuel. Appl. Sci. 2022, 12, 6287. [Google Scholar] [CrossRef]
  27. Bounitsis, G.L.; Charitopoulos, V.M. The value of ammonia towards integrated power and heat system decarbonisation. Sustain. Energy Fuels 2024, 8, 2914–2940. [Google Scholar] [CrossRef]
  28. Sachajdak, A.; Kalina, J.; Adamczyk, W.; Przybyła, G. Performance assessment of using ammonia-fired internal combustion engine cogeneration modules in district heating. Int. J. Hydrogen Energy 2025, 144, 1383–1395. [Google Scholar] [CrossRef]
  29. Eyisse, E.F.; Nadimi, E.; Wu, D. Ammonia Combustion: Internal Combustion Engines and Gas Turbines. Energies 2024, 18, 29. [Google Scholar] [CrossRef]
  30. Langella, G.; Sorrentino, G.; Sabia, P.; Ariemma, G.B.; Amoresano, A.; Iodice, P. Ammonia as a Fuel for Gas Turbines: Perspectives and Challenges. J. Phys. Conf. Ser. 2023, 2648, 012009. [Google Scholar] [CrossRef]
  31. Bonasio, V.; Ravelli, S. Performance Analysis of an Ammonia-Fueled Micro Gas Turbine. Energies 2022, 15, 3874. [Google Scholar] [CrossRef]
  32. Iki, N.; Kurata, O.; Matsunuma, T.; Inoue, T.; Tsujimura, T.; Furutani, H.; Kobayashi, H.; Hayakawa, A.; Arakawa, Y.; Ichikawa, A. Micro Gas Turbine Firing Ammonia. In Volume 8: Microturbines, Turbochargers and Small Turbomachines; Steam Turbines; American Society of Mechanical Engineers: Seoul, Republic of Korea, 2016. [Google Scholar] [CrossRef]
  33. Kuta, K.; Przybyła, G.; Kurzydym, D.; Żmudka, Z. Experimental and numerical investigation of dual-fuel CI ammonia engine emissions and after-treatment with V2O5/SiO2–TiO2 SCR. Fuel 2023, 334, 126523. [Google Scholar] [CrossRef]
  34. Kurata, O.; Iki, N.; Matsunuma, T.; Inoue, T.; Tsujimura, T.; Furutani, H.; Kobayashi, H.; Hayakawa, A. Performances and emission characteristics of NH3–air and NH3CH4–air combustion gas-turbine power generations. Proc. Combust. Inst. 2017, 36, 3351–3359. [Google Scholar] [CrossRef]
  35. PN-EN ISO 6946:2017-10; Komponenty Budowlane i Elementy Budynku—Opór Cieplny i Współczynnik Przenikania Ciepła—Metody Obliczania [Building Components and Building Elements—Thermal Resistance and Thermal Transmittance—Calculation Methods]. Polish Committee for Standardization (PKN): Warsaw, Poland, 2020.
  36. PN-EN ISO 13790:2009; Energetyczne Właściwości Użytkowe Budynków—Obliczanie Zużycia Energii na Potrzeby Ogrzewania i Chłodzenia [Energy Performance of Buildings—Calculation of Energy Consumption for Heating and Cooling]. Polish Committee for Standardization (PKN): Warsaw, Poland, 2009.
  37. Specific Heat Capacity of Water: Temperature-Dependent Data and Calculator, The Engineering ToolBox. Available online: https://www.engineeringtoolbox.com/specific-heat-capacity-water-d_660.html (accessed on 27 July 2025).
  38. Water Density, Specific Weight and Thermal Expansion Coefficients - Temperature and Pressure Dependence, The Engineering ToolBox. Available online: https://www.engineeringtoolbox.com/water-density-specific-weight-d_595.html (accessed on 27 July 2025).
  39. Szargut, J. Termodynamika Techniczna (Applied Thermodynamics), 5th ed.; Silesian University of Technology (Politechnika Śląska): Gliwice, Poland, 2010; ISBN 978-83-7335-667-2. [Google Scholar]
  40. Cengel, Y.; Ghajar, A. Heat and Mass Transfer: Fundamentals and Applications, 5th ed.; McGraw-Hill Professional: New York, NY, USA, 2014; ISBN 978-0-07-339818-1. [Google Scholar]
  41. Valera-Medina, A.; Xiao, H.; Owen-Jones, M.; David, W.I.F.; Bowen, P.J. Ammonia for power. Prog. Energy Combust. Sci. 2018, 69, 63–102. [Google Scholar] [CrossRef]
  42. Pashchenko, D. Ammonia fired gas turbines: Recent advances and future perspectives. Energy 2024, 290, 130275. [Google Scholar] [CrossRef]
  43. Jung, Y.; Pyo, Y.; Jang, J.; Woo, Y.; Ko, A.; Kim, G.; Shin, Y.; Cho, C. Nitrous oxide in diesel aftertreatment systems including DOC, DPF and urea-SCR. Fuel 2022, 310, 122453. [Google Scholar] [CrossRef]
  44. Liang, Z.; Ma, X.; Lin, H.; Tang, Y. The energy consumption and environmental impacts of SCR technology in China. Appl. Energy 2011, 88, 1120–1129. [Google Scholar] [CrossRef]
  45. Birolini, A. Reliability Engineering, Theory and Practice; Springer: Berlin/Heidelberg, Germany, 2017; ISBN 978-3-662-54208-8. [Google Scholar] [CrossRef]
  46. Capstone Turbine Corporation. MicroTurbine Applications for the Offshore Oil and Gas Indsutry. U.S. Environmental Protection Agency. Available online: https://www.epa.gov/sites/default/files/2017-07/documents/neworleans5_2008.pdf (accessed on 27 July 2025).
  47. DEF and SCR Maintenance Tips from the Diesel and DEF Experts, Mansfield Service Partners. Available online: https://msp.energy/def-and-scr-maintenance-tips-from-the-diesel-and-def-experts/ (accessed on 16 July 2025).
Figure 1. Cross-section of the analyzed building.
Energies 18 04103 g001
Figure 2. Monthly heat demand versus average outside temperature for a medium-sized residential building located in Central Europe with a continental climate, based on the weather data for Warsaw, Poland.
Energies 18 04103 g002
Figure 3. Annual heat demand of a residential community (load duration curve).
Energies 18 04103 g003
Figure 4. Daily hot water demand for a residential community.
Energies 18 04103 g004
Figure 5. Screenshots from the EBSILON®Professional software. (A) The analyzed GT in a CHP system for on-design results at nominal conditions (100 kWe) for natural gas. (B) The analyzed GT in a CHP system for off-design results at a minimum load (50 kWe) for natural gas.
Energies 18 04103 g005aEnergies 18 04103 g005b
Figure 6. Partial load results—electrical efficiency, EUF.
Energies 18 04103 g006
Figure 7. Partial load results—heat exchanger effectiveness, mass flow rate of air.
Energies 18 04103 g007
Figure 8. Partial load results—exhaust temperature, specific enthalpy differential across the gas turbine.
Energies 18 04103 g008
Figure 9. Partial load results—thermal power, exhaust enthalpy.
Energies 18 04103 g009
Figure 10. Varying air temperature results—electrical efficiency, EUF.
Energies 18 04103 g010
Figure 11. Varying air temperature results—heat exchanger effectiveness, mass flow rate of air.
Energies 18 04103 g011
Figure 12. Varying air temperature results—exhaust temperature, specific enthalpy difference across the gas turbine.
Energies 18 04103 g012
Figure 13. Varying air temperature results—thermal power, exhaust enthalpy.
Energies 18 04103 g013
Figure 14. Comparison of the heat production for two fuelling scenarios.
Energies 18 04103 g014
Table 1. LHV comparison of hydrogen, ammonia and LNG, based on [13,19].
FuelLHV, MJ/L
Liquified hydrogen (1 bar, −253 °C)8.5
Liquified ammonia (1 bar, −34 °C)12.7
Liquified natural gas (1 bar, −161 °C)20.8
Table 2. Comparison of selected studies on renewable-based CHP.
StudyScopeTechnologyFuelMajor Conclusions
Wijesekara et al. [8]Energy-environmental analysis of combined CHP cycle Combined CHP cycleSolid biomass (waste briquettes)Optimal feedstock composition defined; further benefits could be achieved through advancing combustion refinement and emission control.
Huang et al. [9]Techno-economic analysis of CHP for commercial buildingsORC and gasificationSolid biomass (willow chips, miscanthus)Performance comparable to fossil-fuel CHP; results strongly depend on feedstock moisture content.
Perrone et al. [10]Experimental and numerical analysis of a micro-CCHPInternal combustion engine fed by gasified biomassSolid biomass (wood)Technical feasibility and economic profitability demonstrated; performance dependent on feedstock composition and operating settings.
Algieri et al. [11]Techno-economic analysis of small-scale CHP for a 40-home residential communityORC coupled with wind turbine, PV, and auxiliary boilerWaste cooking oil for ORC, wind, solarEfficient and economically justified system demonstrated; results sensitive to the chosen optimization objective.
Moradpoor et al. [15]Techno-economic analysis of integrating electrolysis waste-heat into district heating gridElectrolyzers coupled with heat recoveryElectricity (renewable, for electrolysis)Small economic gains, but primary energy reduction achieved due to alternative heat supply; hydrogen safety issues highlighted.
Duong et al. [26]Thermodynamic modelling of a cascade system SOFC + gas turbine + steam/Kalina/organic Rankine cyclesAmmoniaHigh energy (60.4%) and exergy (57.3%) efficiencies achieved; future research focused on economic and sustainability aspects suggested.
Bounitsis and Charitopoulos [27]Techno-economic analysis of Great Britain’s national power and heat systemMix of commercial generation and storage technologiesMix: renewable and fossil sources, including ammoniaAmmonia’s potential confirmed; further model validation required.
Sachajdak et al. [28]Techno-economic analysis of ammonia-fired engine for CHP coupled with district heatInternal combustion engineAmmoniaTechnical feasibility demonstrated; profitability sensitive to market conditions.
Table 3. Analyzed building parameters.
DescriptionSpecification
Number of apartments6
Building dimensions (width × length)12 m × 9 m
Building height (foundation to rooftop)15.4 m
Roof typeGable roof
Building layersDefault for modern residential building
Radiator supply/return temperatures60 °C/40 °C
Table 4. Assumptions for a single building for domestic hot water load evaluation.
ParameterValueUnit
Water consumption per resident40L/day
Number of apartments in the building6-
Residents per apartment2.5-
Water consumption per building600L/day
Inlet/outlet water temperature60/50°C
Average water temperature (AT)55°C
Specific heat capacity at AT [37]4.19kJ/(kg·K)
Density at AT [38]0.9857g/cm3
Coefficient for constant DHW load25.00%-
Table 5. Design assumptions for the micro-gas turbine CHP system.
PointModelling Assumptions
Air inletP = 1.01 bar
T = 15 °C
φ = 60%
Mass flow rate calculated iteratively from the energy balance of the combustion chamber to achieve an exhaust temperature of 950 °C.
Air to the CCP = 4.501 bar
Other parameters dependent on the mass and energy balance of the compressor.
Fuel inletFuel pressure is dependent on the pressure present in the combustion chamber.
T = 15 °C
Mass flow rate iteratively calculated from the energy balance of the gas turbine, ensuring generator power of 100 kW.
Exhaust gases to the GTPressure drop in the CC equals 0.002 bar.
Other parameters result from the mass and energy balance of the combustion chamber, with air mass flow adjusted for an exhaust temperature of 950 °C.
Exhaust gases to the HRP = 1.02 bar
Temperature determined from the energy balance of the gas turbine.
Exhaust gases after the HRHot side pressure drop is equal to 0.01 bar.
T = 205 °C
Water inletP = 6 bar
T = 39.5 °C
Mass flow rate of water dependent on the energy balance of the HR, considering ΔT = 21 K
Water outlet Cold side pressure drop equals 0.05 bar.
T = 60.5 °C
Table 6. Compressor, gas turbine, and generator internal efficiencies.
CompressorIsentropic efficiency is equal to 0.96.
Mechanical efficiency is equal to 0.99.
Gas turbineIsentropic efficiency is equal to 0.965.
Mechanical efficiency is equal to 0.99.
GeneratorGenerator efficiency is equal to 0.99.
Table 7. Performance metrics for the two fuelling scenarios.
NGNH3Unit
Electrical energy produced by the MGT353,823.9369,176.0kWh
Heat produced by the MGT2743.02632.0GJ
Heat produced by a peak-reserve heat source136.9160.8GJ
Excess heat produced by the MGT632.4545.3GJ
Heat required by the system2247.52247.5GJ
Fuel consumed in the MGT103,563.2273,261.8kg
Fuel LHV50,01518,673kJ/kg
Electrical efficiency of the MGT 24.5926.05%
EUF of the MGT77.5577.63%
Effective EUF 65.3466.94%
Disclaimer/Publisher’s Note: The statements, opinions and data contained in all publications are solely those of the individual author(s) and contributor(s) and not of MDPI and/or the editor(s). MDPI and/or the editor(s) disclaim responsibility for any injury to people or property resulting from any ideas, methods, instructions or products referred to in the content.

