Abstract
For a long time, the explanation of the various determinants of oil price fluctuations and their impact on economic activity has been based on the supply and demand mechanism. However, with various volatile changes in the international situation in recent years, such as threats to public health and an increase in regional conflicts, special attention has been paid to the geopolitical context as an additional driver of oil price fluctuations. This study examines the relationship between oil price changes and GDP growth and other macroeconomic variables from the perspective of the vulnerability of oil-importing and oil-exporting countries to unexpected oil price shocks, driven by tense geopolitical events, in three European countries (Norway, Germany, and Poland). We apply the Structural Vector Autoregressive (SVAR) model and orthogonalized impulse response functions, based on quarterly data, in regard to two samples: the first spans 1995Q1–2019Q4 (pre-2020 sample), with relatively gradual changes in oil prices, and the second spans 1995Q1–2024Q2 (whole sample), with sudden fluctuations in oil prices due to geopolitical developments. A key finding of this research is that vulnerability to unpredictable oil price shocks related to geopolitical tensions is higher than in regard to expected gradual changes in oil prices, both in oil-importing and oil-exporting countries. Different causality patterns and stronger responses in regard to GDP growth during the period, including in regard to tense geopolitical events in comparison to the pre-2020 sample, lead to the belief that economies are not more resilient to oil price shocks as has been suggested by some studies, which referred to periods that were not driven by geopolitical events. Our research also suggests that countries implementing policies to reduce oil dependency and promote investment in alternative energy sources are better equipped to mitigate the adverse effects of oil price shocks.
1. Introduction
Considering recent geopolitical developments, such as the COVID-19 pandemic and Russia’s war in Ukraine, and their impacts on oil price fluctuations and the global economy, the vulnerability of different economies (oil-importing and oil-exporting countries) to oil price volatility has regained interest. Since the end of the 2000s, it has been noted that the dynamic effects of oil price shocks have changed over time, becoming weaker compared to the 1970s and early 1980s [1,2,3,4,5,6,7]. The main explanations for this economic resilience include the evolution of the monetary policy framework [8], a decline in oil dependence in favor of reliance on other energy sources [2,4,6,7,9], increased energy efficiency through energy transformation efforts worldwide, especially in European countries, and the endogeneity of oil price shocks driven by both demand and supply shifts (e.g., [10,11,12,13,14,15]), as opposed to treating oil price shocks as exogenous (e.g., [1,3,16,17]).
The view that economies are more resilient to oil shocks is based on a period with relatively stable oil prices (except 2008) and without extreme geopolitical events like those occurring after 2019, so the response of economies during this period might have been muted, and monetary policy at this time was seen as effective [18,19]. However, since 2020, economies have experienced a significant oil supply–demand mismatch, particularly during the pandemic and afterward, such as a sudden decrease in oil demand due to lockdowns and a large increase in oil prices following economic recovery. Moreover, after Russia’s invasion of Ukraine, this situation worsened as many economies, especially in Europe, faced energy disruptions and sharp increases in oil and gas prices due to the sudden halt of energy imports, mainly from Russia, caused by Western sanctions in response to Russia’s aggression against Ukraine. The consequences of this geopolitical event could have had a substantial impact on economies [20,21,22]; however, their magnitude may vary greatly depending on the level of oil dependence of the economy and whether a country is an oil importer or an oil exporter.
The oil price shocks caused by geopolitical events in recent years have been sudden and unexpected, making the economy more vulnerable to recessions, higher prices, and increased costs, as Huntington [23] has previously noted. Geopolitical shocks can influence oil prices through two main channels [24,25,26], namely the economic activity channel and the risk channel, which tend to shift oil markets in opposite directions. The economic activity channel involves increased uncertainty about economic prospects, leading to a contraction in global economic activity and oil demand and, consequently, a decrease in oil prices. Conversely, the risk channel accounts for financial market pricing in regard to increased risks to future oil supply beyond the immediate geopolitical events, thereby increasing the cash value of oil contracts and exerting upward pressure on oil prices. Determining which channel dominates remains an empirical question.
Moreover, the negative effects of oil price shocks on the economy are likely to be greater than their immediate impact because macroeconomic frictions, which vary by country, amplify these direct effects [27]. If, before oil shocks occur, the economy shows relatively weak growth and high inflation, their impact can be much larger than in stronger economies with little or no inflation [23,28,29]. Additionally, the effects of oil shocks differ depending on whether the country imports or exports crude oil [30], and also in regard to the type of oil shocks (exogenous or endogenous) [5,31].
Numerous studies examine how recent geopolitical turmoil, like the COVID-19 pandemic and Russia’s war in Ukraine, impacts oil prices and, consequently, financial markets [32,33,34] and economic activity [20,21,22,35,36,37,38,39]. However, they fail to account for the asymmetric nature of how oil price shocks are transmitted to economies and mainly focus on bivariate relationships, such as the connection between oil prices and financial markets or oil prices and economic growth (or inflation), neglecting multivariate interactions between oil price shocks and the macroeconomy [3,40,41,42,43,44]. To our knowledge, none of these studies explore the oil price–macroeconomy relationship in the context of the decreasing vulnerability of economies to oil price shocks, as early research suggests [3,4,6,7]. To address these gaps, our study takes this research a step further by modeling the multidimensional links between oil price shocks and economic activity, considering country-specific interactions and the asymmetric transmission of oil shocks. This provides a broader framework for understanding how economies’ vulnerability to oil price changes, driven by geopolitical turmoil, evolves over time.
Our purpose is to analyze the interaction between oil prices and the macroeconomy from the perspective of the vulnerability of oil-importing and oil-exporting countries to unexpected oil price shocks caused by geopolitical events, which can provide valuable insights for monetary policy. After reviewing the literature and previous empirical studies, we formulate the following research hypotheses to address this purpose:
H1.
The vulnerability of different European economies to unexpected oil price shocks caused by geopolitical tensions is greater than the vulnerability to relatively gradual changes in oil prices.
H2.
The vulnerability to sudden changes in oil prices varies across countries depending on the type of country (oil importing and oil exporting) and the degree of oil dependence.
To test these research hypotheses, we analyze the impact of unexpected oil price increases caused by recent geopolitical events on economic growth and other macroeconomic variables, and the degree of vulnerability of different European economies, both oil-importing and oil-exporting countries, to these shocks. We develop a SVAR model for two periods: the first, from 1995Q1 to 2019Q4 (pre-2020 sample), and, the second, from 1995Q1 to 2024Q2 (whole sample). The breaking date corresponds to the beginning of a period characterized by sudden fluctuations in oil prices due to geopolitical developments, in contrast with the earlier period, which experienced relatively gradual oil price changes, except during the 2008 financial crisis. To evaluate the resilience of these economies, we analyze shifts in causality patterns and impulse response behaviors between the two samples for oil-importing countries (Germany and Poland) and the oil-exporting country (Norway) that are structurally differentiated according to their size, economic development, monetary policy regimes, and the role of oil and other forms of energy in the country. To the best of our knowledge, this is the first study to examine the vulnerability of economies to oil price shocks in the context of recent geopolitical turmoil.
Moreover, we base the analysis on time-series data from the early 1990s to 2024 to cover the homogenous period with regard to energy transformation efforts and the major reforms started in European countries since the 1990s (i.e., the reduction in greenhouse gas emission, the phasing out of coal combustion, the development of renewable resources, and the introduction of energy-efficient technologies) to prevent climate change and also to include the period with substantial disruptions in oil prices due to geopolitical events. Most previous studies [3,4,6,7] addressing the diminishing vulnerability of the economy to oil price changes have considered data since the 1960s (including the oil supply shock in the 1970s) up to either 2007 (before the financial crisis in 2008) or extended, at most, to 2016 (before recent geopolitical events took place).
The structure of the paper is as follows: After the introduction, in light of the literature review, we describe the data and present the characteristics of the countries involved. Next, we outline the research methodology and study design, followed by the empirical results and a discussion of the findings and, finally, we present the conclusions.
2. Country Characteristics
Many geopolitical events and the resulting risks from them have a potentially significant impact on oil price uncertainty and are considered a key determinant of fluctuations in economic activity. Figure 1 illustrates the stylized facts regarding the evolution of Brent oil prices and the main geopolitical events that have occurred following the global financial crisis of 2008. However, for the economy, it is not so much the volatility of oil prices that is important, but their predictability, as sudden and unexpected oil price shocks affect the economy very differently from gradually rising oil prices [23,45]. Such unforeseen geopolitical events include the COVID-19 pandemic, Russia’s invasion of Ukraine, and the Hamas–Israel conflict. The outbreak of the pandemic led to substantial volatility in the energy markets, as lockdown restrictions decreased energy demand, resulting in a decline in oil prices. As restrictions to counter the effects of the pandemic were eased, oil demand surged again, but could not be fully met by oil producers, who had adjusted production to the earlier lower demand. Hence, a sizable oil supply–demand mismatch appeared both during the pandemic and the aftermath. In turn, after Russia’s invasion of Ukraine and the ensuing sanctions by the West, there have been significant energy disruptions due to sudden and unexpected price increases for oil and gas, particularly in Europe. Although European countries exhibit varying degrees of dependence on imported oil and gas, the sudden halt of Russian energy products may have had a significant impact on the aggregate economy.
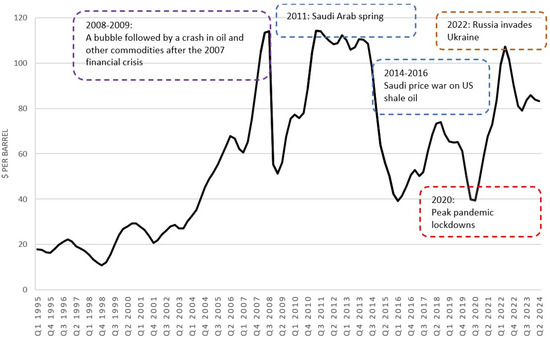
Figure 1.
Brent oil prices (in USD per barrel) and main geopolitical events.
Summing up, it is clear that the behavior of oil prices shows different patterns. Specifically, oil price increases were relatively moderate in the pre-2020 period. However, in the post-2020 period, oil prices have become more volatile, against a backdrop of rising demand and stagnant supply, as well as the occurrence of some notable geopolitical events.
The implications of oil price shocks for the economy depend not only on whether the shock is sudden or spread over several periods [23], but also on some country-specific structural features concerning the share of oil and the share of other energy sources in terms of the final energy consumption [46], including renewable energy and changes in energy intensity, as well the economic conditions prior to the shock. Figure 2 shows some of the country-specific characteristics for Norway, Germany, and Poland that may explain the differences in the economic effects of oil shocks across the studied countries.
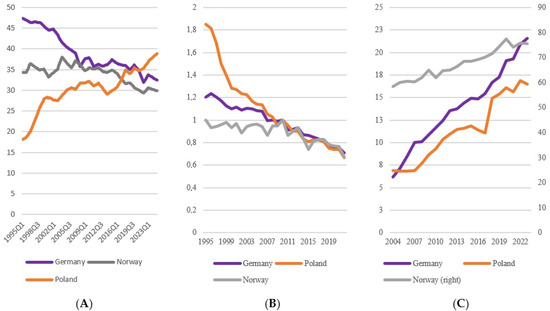
Figure 2.
Profiles of Norway, Germany, and Poland in terms of oil share, energy intensity, and renewable energy sources: (A) oil share (in %); (B) energy intensity growth rate (2010 = 100); and (C) renewable energy sources (in %).
Germany and Poland are both oil-importing countries, but they display different trends in regard to oil share, namely Germany follows a persistent decreasing trend in terms of the importance of oil to the economy, whereas Poland exhibits an increasing trend in terms of oil share (Figure 2A). Although between 2005 and 2015 the oil share in Poland shows a slowdown in the speed of its growth, since 2016, the oil share has been growing again, as the new government in 2016 postponed crucial decisions about the energy transformation. Moreover, domestic fuel consumption over significant periods was supported by fuel tourism at the western and southern borders, due to lower prices in Poland compared to neighboring European countries.
Both countries have followed different paths toward energy transformation and the substitution of fossil fuels, mainly coal, with other alternative energy resources. Germany started reducing the amount of fossil fuels within its energy supply in 2011 (after announcing the energy transition, Energiewende) and developing alternative energy sources, initially, based on oil and gas and, later, on renewable energy (Figure 2C). As a result of this energy transformation, clean sources (mainly wind 27% and solar 12%) produced a record 54% of the German electricity mix in 2023 [47], but 46% of electricity generation still relied on fossil fuels. Germany has upheld its commitment to phase out coal and lignite-fired generation by 2038 at the latest, even though, due to the energy crisis caused by Russia’s war in Ukraine, it temporarily reopened the decommissioned and soon-to-be decommissioned coal power plants in 2022 to avert gas shortages [48].
In contrast, Poland’s economy is among the most carbon intensive in the EU. In 2023, Poland generated about 73% of its electricity from fossil fuels, with a 61% coal share in its electricity generation. From clean sources (mainly wind and solar) comes about 27% of the Polish electricity mix [49]. Although in recent years Poland has significantly increased the share of renewable energy (Figure 2C), reduced carbon dioxide emissions, and the coal share in its energy mix, it still continues to use coal and remains the largest producer of coal in the EU [50]. Decarbonization of the Polish economy and the energy transformation are among the country’s most formidable challenges. However, due to a decades-long failure in energy policy and the country’s lack of a coherent and long-term strategy for the energy transition, Poland’s reliance on fossil fuels will continue for many years, as the schedule to shut down its remaining mines is due to be completed in 2049 [50]. Nevertheless, the appropriate decision about becoming independent from gas (since April 2022) and oil supplies from Russia (since 2023) and its effective implementation not only strengthened Poland’s energy sovereignty, but also enabled the country to avoid the energy market disruptions that occurred after Russia’s invasion of Ukraine.
Norway has a predominant role in foreign exports of crude oil and natural gas. Its oil and gas industry has contributed about 20–25% of the country’s GDP during recent years, except in 2022, with the peak of 35% driven by exceptional circumstances (rising oil and gas prices) due to Russia’s invasion of Ukraine. Crude oil and natural gas amounted to 61% of the total value of Norway’s exports of goods in 2024 (https://www.norskpetroleum.no, accessed on 30 May 2025). However, the oil share in Norway relative to overall energy use has been persistently decreasing (Figure 2A). Even though Norway is the world’s leading fossil fuel exporter, simultaneously, it is a leading example of low-carbon electricity generation, as more than 98% of its electricity comes from clean sources (in 2023), with hydropower as a primary source that constitutes almost 90% of the electricity supply.
All of the countries involved in this study have experienced significant progress in energy intensity in recent years (Figure 2B). Germany and Poland, as EU members, were required under the relevant EU directives (since 2012) to use energy more efficiently at all stages of the energy chain (including energy generation, transmission, distribution, and end-use consumption). This target, to reach a 20% reduction in energy intensity, was overachieved in 2020, which was highly influenced by the occurrence of the COVID-19 pandemic. The revised EU directive more than doubles the annual energy savings obligation in regard to end-use sectors (such as buildings, industry, and transport) by 2030 (i.e., annual savings of at least 0.8% of final energy consumption in 2021–2023, at least 1.3% in 2024–2025, 1.5% in 2026–2027, and 1.9% in 2028–2030) [51]. Nevertheless, the Polish economy, despite significant improvements, is still among the most energy-intensive countries [52] and, therefore, it must increase its efforts to improve its energy efficiency, as the energy efficiency directive adopted by the EU in July 2023 makes access to EU funding conditional on undertaking infrastructure modernization [50].
Although Norway is not a member state of the EU and, therefore, is not obligated to comply with EU directives, it supports the development of energy and climate technology, and several EU directives related to energy efficiency have been adopted into Norway’s national laws and regulations. Therefore, Norway’s primary target for energy efficiency is to reduce the overall energy intensity of its economy by 30% by 2030 compared to 2015 [53].
In general, the improvements in energy efficiency in these countries may be possible reasons that their economies seem to be more resilient to oil price shocks (or the effect of oil price shocks on their economies has become weaker).
3. Research Methodology and Data Description
3.1. Theoretical Framework
A large body of economic studies has established a theoretical framework to analyze the various mechanisms of transmission between oil prices and economic activity. First, there is a well-recognized supply-side effect described in the literature, according to which an increase in oil prices leads to a rise in production costs. Consequently, the growth of the output and productivity is reduced [54,55,56,57]. This may have an adverse effect on investment and stock prices, as investors wait for an improvement in the investment environment to avoid investment risk. Moreover, long-lasting oil price increases may cause a change in the production structure, as a rise in oil prices can lead to a decline in the rentability of oil-intensive sectors and can push firms to adopt new production methods that are less oil intensive. This change leads to a reallocation of capital and labor across sectors that can affect unemployment in the long run [58].
Second, the demand-side effect results in a reduction in real household incomes and consumer spending, due to inflationary pressures generated by a rise in oil prices. Thus, an increase in oil prices deteriorates the terms of trade for oil-importing countries. As a result, the wealth transfer is observed to occur from oil-importing countries to oil-exporting ones, leading to a fall in the purchasing power of households and firms in oil-importing countries [55,59]. Furthermore, the inflation generated by rising oil prices can be accompanied by second-round effects, causing a price–wage loop.
Third, according to the real balance effect (or money supply side), an oil price increase leads to an increase in money demand. As the monetary authorities fail to respond adequately to growing money demand, along with increased supply, interest rates rise and economic growth slows [54].
3.2. Analytical Framework
Investigating the relationship between economic growth and oil prices requires a methodological framework that captures dynamic and structural interdependencies among macroeconomic variables. The Structural Vector Autoregressive (SVAR) model is particularly well-suited for this purpose, as it enables the identification of the transmission channels through which oil prices can affect economic activity, according to the relevant theoretical framework.
The variables included in the model are the following: GDP growth, inflation, exchange rate, short-term interest rates, and oil prices. We use only one measure of economic activity, i.e., GDP growth, thus neglecting the separate role of unemployment. The remaining variables are included to capture the most important transmission channels through which oil prices may indirectly impact economic activity, in part by stimulating changes in monetary policies. These channels include the effects of oil prices on inflation and exchange rates, which, in turn, induce changes in economic activity. In our model, we also incorporate the monetary channel through short-term interest rates, which can respond to inflationary pressures.
The SVAR model is an extension of the VAR model. Therefore, the initial step is to identify the VAR model, which takes the following form [60]:
where is the (K × 1) vector of endogenous variables, c is an intercept vector of the VAR [c = ()], is the (K × K) matrix of the autoregressive coefficients for i = 1, 2, …, p, and is a (K × 1) vector of the error terms, with a zero mean and the variance–covariance matrix, Ω. represents the vector of the dummy variables to capture the effects of structural changes. While the VAR model captures dynamic relationships between variables without relying on explicit economic theory, estimating these dynamics is purely data driven and mechanical in nature. The lack of a theoretical structure is a key limitation of the VAR model. To overcome that weakness, the SVAR approach was developed, which imposes a set of constraints to make the model more relevant to existing economic theory [61].
The SVAR model takes the following general form:
Matrix A is used to define the impulse responses of endogenous variables to structural shocks. Matrix B contains the structural form coefficient of the model. Moreover, is a K-vector of serially uncorrelated, zero mean structural shocks, with an identity covariance matrix .
The utilization of an orthogonalized system is intended to prevent error terms from being correlated with each other in the IRFs. Identifying the structure of the SVAR model involves imposing restrictions on the appropriate parameter matrices of the reduced VAR model. The process of imposing restrictions (triangularization) on the reduced VAR model (1) leads to the orthogonalization of the residuals, which also results in the identification of a recursive structure. This process is also known as using the Cholesky decomposition in the reduced VAR model [62]. In addition to triangularization, the ordering of the variables in the system is important, as it imposes restrictions on the contemporaneous influence of the variables. The first variable in the ordering is assumed to respond exclusively to the lagged values of all the variables in the system and is not contemporaneously affected by shocks to any other variable. The second variable may respond to both the lagged values and contemporaneous values of the first variable. Similarly, the third variable can be influenced by the first and second variables, as well as the lagged values, and this pattern continues throughout the system. Consequently, the final variable in the sequence is permitted to respond contemporaneously to shocks in regard to all the preceding variables. This recursive identification scheme imposes a lower triangular structure on the contemporaneous impact matrix. It is widely used due to its simplicity and computational efficiency, although it relies heavily on assumed variable ordering [6,63].
In our study, we have assumed the following ordering: oil price changes, short-term interest rates, exchange rates, inflation, and GDP growth. Then, we treat oil price changes as the most exogenous variable, since global market forces primarily drive them and remain largely unaffected by domestic economic conditions in the short term. In contrast, economic growth is considered the most endogenous variable, as it responds to both internal and external shocks. These include changes in inflation, exchange rates, interest rates, global oil prices, and international demand. In that case, GDP reflects the combined impact of various transmission mechanisms, making it exceptionally responsive to shocks in the system [13,64]. This identification strategy aligns with the existing literature on the macroeconomic implications of oil price shocks [7,13,46,61,63,65].
Based on the developed SVAR models, Granger causality analysis (for direct causation) and block exogeneity tests (for indirect causation) are performed. The SVAR model is better adjusted to identify shocks through structural impulse responses (IRF). The IRF is used to examine the dynamic reaction of each variable to present and future values of the other variables [61,66].
3.3. Data and Preliminary Analysis
Our study examines three countries, Germany, Poland (which represent oil-importing countries), and Norway (which represents an oil-exporting country), based on quarterly data for the period of 1995–2024. The data were collected from the FRED database (Federal Reserve Economic Data: https://fred.stlouisfed.org/, accessed on 30 November 2024), see Table 1.

Table 1.
Variables and data sources.
We use the asymmetric approach proposed by Mork [67] to capture the reaction of GDP growth to changes in positive and negative oil price shocks. The positive and negative changes in the oil price are defined as follows:
It has been evidenced in many empirical studies that economic activity reacts asymmetrically to oil price shocks (e.g., [54,55,67,68]), i.e., increasing oil prices appear to slow down aggregate economic activity more than falling oil prices stimulate it. Therefore, to incorporate this characteristic, we propose using the asymmetric specification of the oil price in the VAR model. This specification, distinguishing between positive and negative oil price changes, is frequently used in existing studies (e.g., [6,67,68,69,70]) and, thus, enables a comparison of our study with the literature.
All the variables are first seasonally adjusted using the Census-X13 method and then expressed in natural logarithms. Since the primary objective of using the SVAR model is to examine the impact of dynamic shocks generated by oil price increases and decreases on economic activity in three economies, we first need to check the stationarity of the data series by examining the order of integration, based on the Augmented Dickey–Fuller (ADF) unit root test. We perform the ADF test on all of the data series in regard to their levels and first differences. The test results are reported in Table A1. As seen in the table, all of the data series are found to be nonstationary in levels (the null hypothesis of a unit root cannot be rejected). In contrast, they are all stationary after the first differencing (as the null hypothesis of a unit root in differenced variables is rejected), except inflation in Poland, which turned out to be stationary only for second differences.
Therefore, VAR models are built for the first differences of the variables, except for the model for Poland, in which inflation appears as the second differences and the other variables as the first differences.
4. Findings and Discussion
4.1. Pattern of Causality Between GDP Growth and Oil Price Changes
During investigations on the effect of oil price changes on GDP growth and other macroeconomic variables, we are interested in whether this effect is different when the economy is faced with tense geopolitical factors. To do that, we develop the SVAR model with asymmetric specification for two samples (pre-2020 period with moderate changes in oil prices and whole sample with sudden and unexpected oil price disruptions due to geopolitical events) and compare the differences in the causality patterns and impulse response functions.
The results of the direct Granger causality testing, as displayed in Table 2, show that the causality patterns vary between these two samples. In regard to the pre-2020 sample, GDP seems to be less vulnerable to oil prices in two oil-importing countries (Germany and Poland), as there is no significant relationship between oil price increases and GDP growth. The effect of the decrease in oil prices is significant only for Germany. All of this together could point to less responsiveness of these economies to gradual oil prices movements upward or downward, as had occurred in the pre-2020 period. However, this reaction may also be associated with the relevant monetary accommodation policy implemented at this time that is likely to be effective in such favorable economic conditions [23,71]. However, the indirect channel through the use of a third variable (Table 3) has a more important role for Germany and Poland, being highly significant. This indicates that changes in oil prices affect GDP growth through other macroeconomic variables, making these economies indirectly vulnerable to oil price shocks. Therefore, it cannot be assumed that future oil price disruptions will not be a problem for policymakers.
Table 2.
Direct Granger causality test results based on oil prices increases and decreases in two samples for Norway, Germany, and Poland.
Table 3.
Indirect Granger causality test results based on oil price increases and decreases in regard to GDP through the use of third macroeconomic variables (like inflation, interest rates, or exchange rates) for Norway, Germany, and Poland in two samples.
In turn, in Norway, which profits from growing oil prices (in contrast to oil-importing countries) and suffers losses in the case of decreasing oil prices, the direct and indirect impact of oil price increases and decreases on the GDP is insignificant (Table 2 and Table 3) in the pre-2020 sample. This suggests that the Norwegian economy, as an oil-exporting country, is the most resilient to oil price shocks, even in the case of decreases in oil prices.
Whereas, in regard to the whole sample (including periods with extreme oil price fluctuations, like during the COVID-19 outbreak and the war in Ukraine), the direct reaction of the GDP to oil price increases is significant in Poland and Norway. This indicates that the Norwegian and Polish economies turn out to be more vulnerable to oil price shocks compared to the results based on the pre-2020 sample. Moreover, this occurs with a potential opposite influence, i.e., rising oil prices result in increased government revenue in Norway (as an oil-exporting country), but rising production costs and consumer expenditure in Poland (as an oil-importing country). In addition, the vulnerability of these economies to oil price shocks is exacerbated by the indirect effect of oil price increases on economic growth through other macroeconomic variables (Table 3). When it comes to oil price declines in Norway and Poland, their direct effect on GDP growth is again insignificant, as in the pre-2020 sample; however, the indirect impact is significant only in Poland (Table 3). The latter reflects the stimulating effect of falling oil prices on the Polish economy, which is dependent on oil imports, in contrast to the Norwegian economy.
While in Germany, the direct impact of oil price increases on GDP growth in the whole sample remains insignificant, as in the pre-2020 sample, the indirect effect of rising oil prices is already significant (Table 3). These results show the German economy has become more vulnerable to oil shocks in regard to the whole sample, including tense geopolitical events, compared to the pre-2020 sample. In turn, the direct impact of oil price declines on GDP growth remains significant, as it did in the pre-2020 sample, but the indirect effect of oil price shocks is insignificant (Table 3). This finding suggests that the direct stimulating effect of falling oil prices on the German economy is more important than the direct harmful effect of rising oil prices.
4.2. Orthogonalized Impulse Response Functions
Following the description of the Granger causality results, next, we analyze the impact of oil price shocks, both increases and decreases, on GDP and other macroeconomic variables, such as inflation, exchange rates, and short-term interest rates, in Norway, Germany, and Poland, using the impulse response function. Figure 3, Figure A1, Figure A2 and Figure A3 show the orthogonalized impulse responses of GDP and other variables after a one standard deviation shock in regard to positive and negative oil price changes.
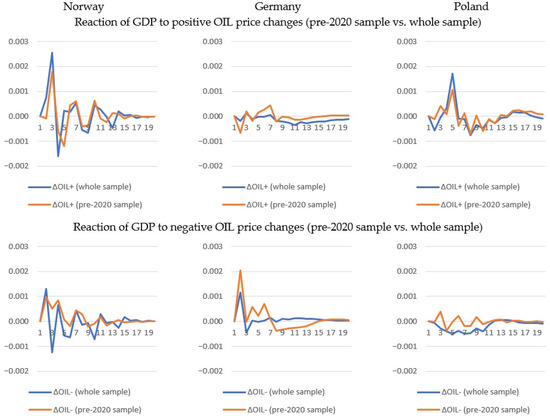
Figure 3.
Impulse reactions of GDP to oil price increases and decreases in Norway, Germany, and Poland: results for pre-2020 sample vs. whole sample.
Figure 3 shows that each country develops differently in terms of the response of GDP growth to oil price shocks. Norway experiences an almost immediate rise in GDP growth in response to increases in oil prices, which is significant and clearly strengthened in the whole sample, in contrast to the pre-2020 sample. This is the result of the fact that Norway, as an oil-exporting country, has benefited significantly from rising oil prices due to Russia’s invasion of Ukraine (GDP growth increased by 35% in 2022) as a result of the terms of trade profit from higher export prices, causing a positive spillover to the Norwegian economy. In turn, the responses of GDP growth to oil price decreases are visibly weakened in comparison to the responses to oil price increases, although insignificant. This is likely explained by the existence of the Government Pension Fund Global (GPFB), known as the Oil Fund, which plays a crucial role in offsetting the impact of low oil prices on the Norwegian economy. If oil prices fall, the GPFG can be used to support counter-cyclical spending and maintain economic stability [72]. Nevertheless, some differences in GDP growth responses in Norway are seen when oil price decreases occur without (in the pre-2020 sample) and with (in the whole sample) geopolitical turmoil, i.e., in the former sample, the GDP response is positive, and, in the latter sample, negative since the second quarter, and oscillating. This negative reaction can be linked to the deep depreciation of the Norwegian krone against the US dollar since mid-2023.
In the case of Germany, the responses of GDP growth to increases in oil prices are insignificant and muted in both samples, although they are negative in the second quarter. This result is in line with the theoretical assumption that a lower dependence on oil imports makes a country less vulnerable to price fluctuations. Germany continues to show a persistent declining trend in its oil share and exhibits a growing share of renewables over the entire observation period (Figure 2). However, there are some differences in the development of the responses, i.e., the response of GDP growth surprisingly seems to be strengthened in the pre-2020 sample with the gradual changes in oil prices, but not in regard to the whole sample, as a result of a sudden rise in oil prices (Figure 3). Considering the significant indirect impact of oil shocks on economic growth (Table 3) and the significant influence of oil price changes on interest rates (Table A2), this suggests that actions through the monetary channel were taken to mitigate the adverse effects of oil prices increases, particularly in light of the energy disruptions to the German economy after the sudden halt to oil and gas imports from Russia following the country’s invasion of Ukraine. This may also indicate that the German economy is well-equipped to deal with rising oil prices, likely due to the country’s strong economic standing and the ongoing energy transition to phase out fossil fuels. However, it cannot be argued that the German economy is entirely resilient to rising oil prices, since its impact is transmitted to the economy by other macroeconomic variables (Table 2 and Table 3).
On the other hand, Germany experienced a significant rise in GDP growth in response to decreasing oil prices since the second quarter in both samples. Still, this effect is weakened in regard to the whole sample compared to the pre-2020 sample (Figure 3). This may suggest that energy disruptions caused by geopolitical factors slow down the economy’s ability to recover. However, such a GDP growth response still signals the stimulating effect of falling oil prices, due to reduced energy costs for consumers and businesses.
The Polish economy experienced a significant drop in GDP growth in response to oil price increases in the whole sample, followed by a rise in growth after several quarters, before it gradually fades out. This reaction of GDP growth, which is clearly strengthened in the whole sample compared to the pre-2020 sample, is evidence of Poland’s higher level of vulnerability to unexpected and sudden changes in oil prices due to tense geopolitical events in comparison to the pre-2020 sample, which involved oil prices moving upward gradually (Figure 3). This result is primarily due to the high and still growing oil share (Figure 2) in the Polish economy, which reinforces the impact of oil price changes on economic growth. In turn, the response of GDP growth to oil price declines is insignificant in both samples, showing no direct stimulating effects of decreases in oil prices on the Polish economy. This is likely due to the specific characteristics of Poland’s economy, which is the most carbon intensive in the EU, and regards lower energy prices as a disincentive to invest in renewable energy sources and energy efficiency technologies. This may deepen its dependence on fossil fuels and hinder long-term sustainability. On the other hand, GDP growth is indirectly affected by falling oil prices through other macroeconomic variables (Table 3), of which the short-term interest rate, representing the monetary channel, appears to be particularly important (Table A2).
4.3. Robustness Check
To verify the robustness of our results, we analyzed some more alternative specifications of the SVAR model. First, we weight the oil prices by the lagged oil share ( in the SVAR model (as in [2,6,7,15,73]) to control for the effect of the changing energy share and the extent to which this can impact the responses of oil price shocks on GDP in the context of geopolitical events. Second, we extend the specification of the SVAR model by adding four periods of lagged exogenous variables separately, namely (1) oil share and (2) energy intensity, to control for the effects of improvements in energy efficiency on the responses of GDP to oil price shocks compared to our baseline results. The results of the impulse responses of the weighted oil price on GDP are shown in Figure 4. It turns out that all the results are similar to the baseline results. Since the other results of the robustness check are also in line with our baseline results, we have omitted their presentation in the paper, but have included them in the repository (https://zenodo.org/records/15757805).
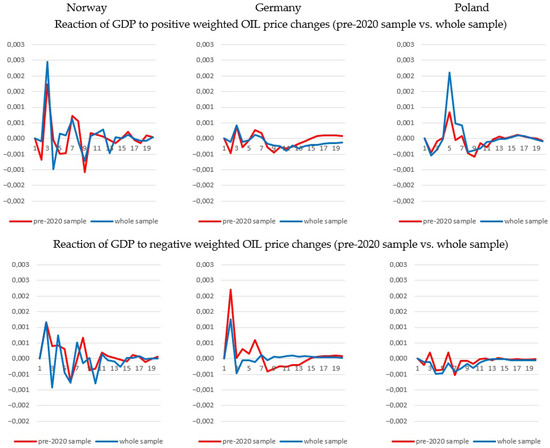
Figure 4.
Impulse reactions of GDP to weighted oil price increases and decreases in Norway, Germany, and Poland: results for pre-2020 sample vs. whole sample.
Overall, the evidence supports the point of this paper that the vulnerability of various European economies to unpredictable oil price shocks caused by tense geopolitical events is higher than the vulnerability to relatively gradual changes in oil prices. This is especially true for oil-importing countries.
5. Conclusions
The purpose of this paper is to examine the interaction between oil prices and GDP growth in the context of vulnerability to sudden and unexpected oil price shocks driven by tense geopolitical events in selected oil-importing and oil-exporting countries. To investigate this, we develop a Structural VAR model, involving an asymmetric specification of oil price changes for two samples: a pre-2020 sample, covering periods with relatively gradual changes in oil prices, and, a whole sample, covering periods with unpredictable oil price fluctuations due to tense geopolitical events. We compare the changes in causality patterns and impulse response behavior across the two samples for oil-importing countries (Germany and Poland) and the oil-exporting country (Norway) to evaluate the extent to which these economies are vulnerable to oil shocks.
Our findings suggest that sudden and unexpected oil price shocks triggered by geopolitical events affect economies differently than gradual oil price shocks. This is demonstrated by direct (in Norway and Poland) and/or indirect (in Norway, Poland, Germany) significant causality caused by rising oil prices in regard to GDP growth in the sample that includes tense geopolitical events, as well as stronger GDP growth in Norway and a decline in Poland in response to oil price increases, compared to the pre-2020 sample. In contrast, the effect of falling oil prices is significant only for Germany, which experiences a rise in GDP growth, that, however, is dampened by severe energy disruptions caused by tense geopolitical events (such as stopping oil and gas imports from Russia after the invasion of Ukraine), compared to the pre-2020 sample.
Based on the overall findings, we conclude that for all of the economies studied, vulnerability to unpredictable oil price shocks related to geopolitical tensions is greater than to expected gradual changes in oil prices. Differences in vulnerability to these sudden and unexpected oil shocks across countries can be attributed to both the type of country (oil importing or oil exporting) and country-specific characteristics, such as the degree of oil dependence, the share of renewable energy sources, energy intensity, and the level of economic development. An important role is also assigned to the ability of countries’ monetary policies to provide adequate compensation for the damaging effect of oil shocks, which may be hampered, as expansionary policies would exacerbate inflationary pressures, while contractionary policies would enhance output declines [45,71].
The findings of this study offer several policy implications for the countries examined.
Given that the strategic importance of oil will continue to be significant for a long time to come in oil-importing countries (as it is an essential component in meeting the energy needs of the economy), these countries should increasingly adopt various policies to boost energy efficiency and invest in alternative energy sources, such as renewables. This can lead to a reduction in oil dependence and make them more resilient to fluctuations in oil prices. Such policies can significantly impact long-term oil consumption, enhance national energy security, and contribute to a sustainable energy future. The Norwegian economy is an example of a country that has implemented an energy strategy for many years, investing in clean energy sources and promoting a safe and sustainable economy to meet its energy demands. Although Norway is the world’s leading exporter of fossil fuels, it recognizes that its oil reserves will eventually run out and that it must be prepared for this. In addition, oil-importing countries should establish a defensive mechanism, following the example of Norway, to prevent the immediate adverse effects of rising oil prices, just as Norway successfully offsets the adverse effects of falling oil prices through the existence of the Oil Fund.
This paper examines the responses of the economy to oil price shocks through key channels in a limited group of countries and over a relatively short time frame. However, the labor market channel and a larger number of countries are not included. Therefore, it is worthwhile examining this additional channel and a wider group of countries, as longer time-series data are obtained. This line of research, including the use of more advanced models, remains on the agenda for further study.
Author Contributions
Conceptualization, supervision, and project administration, M.P.; literature review, M.P.; formal analysis, A.G. and M.P.; dataset preparation and methodology, A.G.; writing—original draft, revision, and editing, M.P. and A.G. All authors have read and agreed to the published version of the manuscript.
Funding
This research received no external funding.
Data Availability Statement
Data is contained within the article.
Conflicts of Interest
The authors declare that there are no conflicts of interest.
Abbreviations
| ADF | Augmented Dickey–Fuller test |
| CPI | Consumer price index |
| CENSUS X13 | U.S. Census Bureau’s X-13ARIMA-SEATS seasonal adjustment program |
| ARIMA-SEATS | AutoRegressive Integrated Moving Average-Signal Extraction in ARIMA Time Series |
| EU | European Union |
| ExR | Exchange rate |
| FRED | Federal Reserve Economic Data |
| GDP | Gross domestic product |
| GPFG | Government Pension Fund Global |
| IRs | Short-run interest rates |
| LR | Likelihood ratio test |
| LLVAR | Log likelihood from the VAR model |
| LLSVAR | Log likelihood from the restricted SVAR model |
| OIL | Brent oil prices |
| SHARE | Oil share |
| SVAR | Structural Vector Autoregressive |
| VAR | Vector Auto Regression |
Appendix A. Supporting Information
Supplementary data associated with this article can be found in the online version of the repository (https://zenodo.org/records/15757805).
Appendix B. Supplementary Results
Table A1.
Unit root test (ADF) results.
Table A1.
Unit root test (ADF) results.
| Norway | Germany | Poland | ||||
|---|---|---|---|---|---|---|
| Levels | Differences | Levels | Differences | Levels | Differences | |
| GDP | −3.312 (c + t) | −12.587 (c) *** | −3.035 (c + t) | −12.44 (c) *** | −1.173 (c) | −14.08 (c) *** |
| CPI # | 0.286 (c + t) | −10.75 (c) *** | −3.439 (c + t) | −3.171 (c) ** | −1.273 (c + t) | −3.079 (c + t) |
| ExR | −1.51 (c + t) | −10.81 (c) *** | −2.004 (c + t) | −10.79 (c) *** | −2.566 (c + t) | −11.04 (c) *** |
| IR_sr | −2.275 (c + t) | −5.526 (c) *** | −2.799 (c + t) | −5.147 (c) *** | −3.095 (c + t) | −6.707 (c) *** |
| OIL | −2.381 (c + t) | −8.876 (c) *** | −2.381 (c + t) | −8.876 (c) *** | −2.381 (c + t) | −8.876 (c) *** |
Notes: ***, ** stand for the 1% and 5% significance level; c refers to ADF test with constant, t to ADF test with trend, and c + t to ADF test with constant and trend. Levels denote the ADF unit root test for the different levels of data series and differences for first differences. # For inflation in Poland, the null hypothesis that its first differences are non-stationary cannot be rejected. However, the null hypothesis of non-stationarity of the second differences of inflation has already been rejected (ADF= −5.911 ***).
Table A2.
Granger causality results based on VAR models.
Table A2.
Granger causality results based on VAR models.
| NORWAY | Pre-2020 | |||||
| ΔGDP | ΔCPI | ΔExR | ΔIR_sr | ΔOIL+ | ΔOIL- | |
| ΔGDP | - | 0.2422 | 0.6905 | 0.6954 | 0.4523 | 0.0788 |
| ΔCPI | 0.5998 | - | 0.0369 ** | 0.0094 *** | 0.0137 ** | 0.3301 |
| ΔExR | 0.0185 ** | 0.3185 | - | 0.6664 | 0.0868 | 0.5772 |
| ΔIR_sr | 0.0038 *** | 0.0009 *** | 0.5784 | - | 0.4863 | 0.0000 *** |
| ΔOIL+ | 0.9157 | 0.0365 ** | 0.0712 | 0.0000 *** | - | 0.0041 *** |
| ΔOIL- | 0.8317 | 0.0511 | 0.6535 | 0.4622 | 0.2614 | - |
| Whole sample | ||||||
| ΔGDP | - | 0.0013 *** | 0.1574 | 0.4111 | 0.0195 ** | 0.0629 |
| ΔCPI | 0.4267 | - | 0.5111 | 0.0971 | 0.0446 ** | 0.0390 ** |
| ΔExR | 0.0135 ** | 0.0282 ** | - | 0.0168 | 0.0202 ** | 0.0296 ** |
| ΔIR_sr | 0.2144 | 0.0488 ** | 0.0700 | - | 0.3469 | 0.0659 |
| ΔOIL+ | 0.2217 | 0.3680 | 0.0022 *** | 0.5466 | - | 0.0762 |
| ΔOIL- | 0.6043 | 0.2241 | 0.1160 | 0.5651 | 0.4974 | - |
| GERMANY | Pre-2020 | |||||
| ΔGDP | ΔCPI | ΔExR | ΔIR_sr | ΔOIL+ | ΔOIL- | |
| ΔGDP | - | 0.0708 | 0.2402 | 0.5999 | 0.3011 | 0.0019 *** |
| ΔCPI | 0.9001 | - | 0.3872 | 0.9214 | 0.8245 | 0.4443 |
| ΔExR | 0.6290 | 0.8137 | - | 0.8023 | 0.3671 | 0.1821 |
| ΔIR_sr | 0.0085 *** | 0.4785 | 0.4508 | - | 0.0176 ** | 0.0004 *** |
| ΔOIL+ | 0.7426 | 0.5188 | 0.2693 | 0.4403 | - | 0.4608 |
| ΔOIL- | 0.0134 ** | 0.3698 | 0.0061 *** | 0.4097 | 0.3574 | - |
| Whole sample | ||||||
| ΔGDP | -- | 0.1535 | 0.2902 | 0.9433 | 0.7778 | 0.0007 *** |
| ΔCPI | 0.0063 *** | - | 0.2639 | 0.1986 | 0.1084 | 0.3589 |
| ΔExR | 0.7418 | 0.6203 | - | 0.7398 | 0.0687 | 0.1298 |
| ΔIR_sr | 0.2057 | 0.0020 *** | 0.2383 | - | 0.0461 ** | 0.0008 *** |
| ΔOIL+ | 0.0099 *** | 0.7237 | 0.2670 | 0.1764 | -- | 0.2881 |
| ΔOIL- | 0.0000 *** | 0.0109 ** | 0.1509 | 0.0039 *** | 0.6837 | - |
| POLAND | Pre-2020 | |||||
| ΔGDP | ΔCPI | ΔExR | ΔIR_sr | ΔOIL+ | ΔOIL- | |
| ΔGDP | - | 0.6461 | 0.7291 | 0.0015 *** | 0.6854 | 0.9917 |
| ΔCPI | 0.7030 | - | 0.1262 | 0.5859 | 0.9037 | 0.9463 |
| ΔExR | 0.8022 | 0.0431 ** | - | 0.3620 | 0.1610 | 0.1043 |
| ΔIR_sr | 0.0336 ** | 0.1698 | 0.0119 ** | - | 0.0610 | 0.0074 *** |
| ΔOIL+ | 0.0914 | 0.5510 | 0.5074 | 0.1893 | - | 0.6503 |
| ΔOIL- | 0.0378 ** | 0.8552 | 0.8950 | 0.9255 | 0.9062 | - |
| Whole sample | ||||||
| ΔGDP | - | 0.0343 ** | 0.1176 | 0.0000 *** | 0.0006 *** | 0.3135 |
| ΔCPI | 0.1209 | - | 0.0243 ** | 0.0113 ** | 0.9582 | 0.9013 |
| ΔExR | 0.4469 | 0.3642 | - | 0.4937 | 0.0713 | 0.0616 |
| ΔIR_sr | 0.2587 | 0.8194 | 0.0477 ** | - | 0.3316 | 0.0311 ** |
| ΔOIL+ | 0.0080 *** | 0.4859 | 0.2966 | 0.1391 | - | 0.8977 |
| ΔOIL- | 0.0847 | 0.7095 | 0.4213 | 0.8095 | 0.7971 | - |
Notes: ***, ** stand for the 1% and 5% significance level.

Figure A1.
Impulse reactions of CPI to oil price increases and decreases in Norway, Germany, and Poland: results for pre-2020 sample vs. whole sample.

Figure A2.
Impulse reactions of ExR to oil price increases and decreases in Norway, Germany, and Poland: results for pre-2020 sample vs. whole sample.

Figure A3.
Impulse reactions of IRs to oil price increases and decreases in Norway, Germany, and Poland: results for pre-2020 sample vs. whole sample.
References
- Herrera, A.M.; Pesavento, E. Oil Price Shocks, Systematic Monetary Policy, and The “Great Moderation”. Macroecon. Dyn. 2009, 13, 107–137. [Google Scholar] [CrossRef]
- Edelstein, P.; Kilian, L. How Sensitive Are Consumer Expenditures To Retail Energy Prices? J. Monet. Econ. 2009, 56, 766–779. [Google Scholar] [CrossRef]
- Blanchard, O.J.; Gali, J. The Macroeconomic Effects of Oil Shocks: Why Are the 2000s So Different from the 1970s? 2007. Available online: https://www.nber.org/papers/w13368 (accessed on 30 May 2025).
- Katayama, M. Declining Effects of Oil Price Shocks. J. Money Credit Bank. 2013, 45, 977–1016. [Google Scholar] [CrossRef]
- Baumeister, C.; Kilian, L. Forty years of oil price fluctuations: Why the price of oil may still surprise us. J. Econ. Perspect. 2016, 30, 139–160. [Google Scholar] [CrossRef]
- Bergmann, P. Oil price shocks and GDP growth: Do energy shares amplify causal effects? Energy Econ. 2019, 80, 1010–1040. [Google Scholar] [CrossRef]
- Lyu, Y. Accounting for the declining economic effects of oil price shocks. Energy Econ. 2021, 96, 105015. [Google Scholar] [CrossRef]
- Bernanke, B.; Gertler, M.; Watson, M.W. Oil Shocks and Aggregate Macroeconomic Behavior: The Role of Monetary Policy: A Reply. J. Money. Credit. Bank. 2004, 36, 287–291. [Google Scholar] [CrossRef]
- James, D. Hamilton Causes and Consequences of the Oil Shock of 2007–08. Brook. Pap. Econ. Act. Econ. Stud. Program Brook. Inst. 2009, 40, 215–283. [Google Scholar]
- Barsky, R.B.; Kilian, L. Do We Really Know That Oil Caused the Great Stagflation? A Monetary Alternative. NBER Macroecon. Annu. 2001, 16, 137–183. [Google Scholar] [CrossRef]
- Barsky, R.B.; Kilian, L. Oil and the Macroeconomy Since the 1970s. J. Econ. Perspect. 2004, 18, 115–134. [Google Scholar] [CrossRef]
- Kilian, L. The economic effects of energy price shocks. J. Econ. Lit. 2008, 46, 871–909. [Google Scholar] [CrossRef]
- Kilian, L. Not All Oil Price Shocks Are Alike: Disentangling Demand and Supply Shocks in the Crude Oil Market. Am. Econ. Rev. 2009, 99, 1053–1069. [Google Scholar] [CrossRef]
- Lippi, F.; Nobili, A. Oil and the Macroeconomy: A Quantitative Structural Analysis. J. Eur. Econ. Assoc. 2012, 10, 1059–1083. [Google Scholar] [CrossRef]
- Baumeister, C.; Kilian, L. Lower oil prices and the U.S. economy: Is this time different? Brookings Pap. Econ. Act. 2016, 2016, 287–357. [Google Scholar] [CrossRef]
- Edelstein, P.; Kilian, L. The Response of Business Fixed Investment to Changes in Energy Prices: A Test of Some Hypotheses about the Transmission of Energy Price Shocks. B.E. J. Macroecon. 2007, 7, 1–41. [Google Scholar] [CrossRef]
- Huntington, H.G. Energy disruptions, interfirm price effects and the aggregate economy. Energy Econ. 2003, 25, 119–136. [Google Scholar] [CrossRef]
- Pescatori, A. The Great Moderation: Good Luck, Good Policy, or Less Oil Dependence? Economic Commentary; Federal Reserve Bank of Cleveland: Cleveland, OH, USA, 2008. [Google Scholar]
- Zachman, G.; Favoino, D. Is The Oil Price-GDP Link Broken? Available online: https://www.bruegel.org/blog-post/oil-price-gdp-link-broken (accessed on 25 April 2025).
- Yagi, M.; Managi, S. The spillover effects of rising energy prices following 2022 Russian invasion of Ukraine. Econ. Anal. Policy 2023, 77, 680–695. [Google Scholar] [CrossRef]
- Zhang, Y.; Shan, Y.; Zheng, X.; Wang, C.; Guan, Y.; Yan, J.; Ruzzenenti, F.; Hubacek, K. Energy price shocks induced by the Russia-Ukraine conflict jeopardize wellbeing. Energy Policy 2023, 182, 113743. [Google Scholar] [CrossRef]
- Martínez-García, M.; Ramos-Carvajal, C.; Cámara, Á. Consequences of the energy measures derived from the war in Ukraine on the level of prices of EU countries. Resour. Policy 2023, 86, 104114. [Google Scholar] [CrossRef]
- Huntington, H.G. The Economic Consequences of Higher Crude Oil Price; EMF SR 9; Stanford University: Stanford, CA, USA, 2005. [Google Scholar]
- Minesso, M.F.; Lappe, M.-S.; Rößler, D. Geopolitical risk and oil prices. In Economic Bulletin; European Central Bank: Frankfurt am Main, Germany, 2023; pp. 53–58. [Google Scholar]
- Jawadi, F.; Rozin, P.; Gnegne, Y.; Cheffou, A.I. Geopolitical risks and business fluctuations in Europe: A sectorial analysis. Eur. J. Polit. Econ. 2024, 85, 102585. [Google Scholar] [CrossRef]
- Caldara, D.; Iacoviell, M. Measuring Geopolitical Risk. Am. Econ. Rev. 2022, 112, 1194–1225. [Google Scholar] [CrossRef]
- Lin, J.; Xiao, H.; Chai, J. Dynamic effects and driving intermediations of oil price shocks on major economies. Energy Econ. 2023, 124, 106779. [Google Scholar] [CrossRef]
- Elder, J.; Serletis, A. Oil Price Uncertainty. J. Money Credit Bank. 2010, 42, 1137–1159. [Google Scholar] [CrossRef]
- Baba, C.; Lee, J. Second-Round Effects of Oil Price Shocks Implications for Europe’s Inflation Outlook; Working Papers No. 2022/173; IMF Working Papers: Washington, DC, USA, 2022. [Google Scholar]
- Baumeister, C.; Peersman, G.; Van Robays, I. The Economic Consequences of Oil Shocks: Differences across Countries and Time. In Proceedings of the RBA Annual Conference 2009, Kirribilli, Australia, 17–18 August 2009; Reserve Bank of Australia: Sydney, Australia, 2009. [Google Scholar]
- Balke, N.S.; Brown, S.P.A.; Yucel, M.K. Oil Price Shocks and U.S. Economic Activity: An International Perspective. SSRN Electron. J. 2010. [Google Scholar] [CrossRef][Green Version]
- Zhang, Y.; He, J.; He, M.; Li, S. Geopolitical risk and stock market volatility: A global perspective. Financ. Res. Lett. 2023, 53, 103620. [Google Scholar] [CrossRef]
- Zeng, J.; Zhang, Y.; Yin, Y.; Moffatt, P.G.; Zeng, J.; Zhang, Y.; Yin, Y.; Moffatt, P.G. The effect of the Covid pandemic on stock market volatility: Separating initial impact from time-to-recovery. Data Sci. Financ. Econ. 2024, 4, 531–547. [Google Scholar] [CrossRef]
- Bahari, N.N.; Bahaludin, H.; Ismail, M.; Razak, F.A.; Bahari, N.N.; Bahaludin, H.; Ismail, M.; Razak, F.A. Network, correlation, and community structure of the financial sector of Bursa Malaysia before, during, and after COVID-19. Data Sci. Financ. Econ. 2024, 4, 362–387. [Google Scholar] [CrossRef]
- Yu, Y.; Guo, S.L.; Chang, X.C. Oil prices volatility and economic performance during COVID-19 and financial crises of 2007–2008. Resour. Policy 2022, 75, 102531. [Google Scholar] [CrossRef]
- Brada, J.C.; Gajewski, P.; Kutan, A.M. Economic resiliency and recovery, lessons from the financial crisis for the COVID-19 pandemic: A regional perspective from Central and Eastern Europe. Int. Rev. Financ. Anal. 2021, 74, 101658. [Google Scholar] [CrossRef]
- Gradzewicz, M.; Jabłonowski, J.; Sasiela, M.; Żółkiewski, Z. The impact of energy price increases on the Polish economy. Energy Econ. 2024, 140, 107944. [Google Scholar] [CrossRef]
- Marangoz, C. Geopolitical turmoil and energy dynamics: Analyzing the impact on inflation in selected European economies. Heliyon 2025, 11, e42302. [Google Scholar] [CrossRef]
- Upadhyaya, K.P.; Mixon, F.G.; Basnet, H.C. Oil price shocks and the macroeconomy: New evidence from Eastern European countries. Appl. Econ. 2025, 1–14. [Google Scholar] [CrossRef]
- Feng, Y.; Xu, D.; Failler, P.; Li, T. Research on the Time-Varying Impact of Economic Policy Uncertainty on Crude Oil Price Fluctuation. Sustainability 2020, 12, 6523. [Google Scholar] [CrossRef]
- Ding, Y.; Liu, Y.; Failler, P. The Impact of Uncertainties on Crude Oil Prices: Based on a Quantile-on-Quantile Method. Energies 2022, 15, 3510. [Google Scholar] [CrossRef]
- Nyga-Łukaszewska, H.; Aruga, K. Energy Prices and COVID-Immunity: The Case of Crude Oil and Natural Gas Prices in the US and Japan. Energies 2020, 13, 6300. [Google Scholar] [CrossRef]
- Peng, J.; Li, Z.; Drakeford, B.M. Dynamic Characteristics of Crude Oil Price Fluctuation-From the Perspective of Crude Oil Price Influence Mechanism. Energies 2020, 13, 4465. [Google Scholar] [CrossRef]
- Zörner, T.; Petz, N. Macroeconomic Implications and Differences of Oil and Gas Price Shocks. SUERF Policy Br., No 335, May 2022. Available online: https://www.suerf.org/wp-content/uploads/2023/12/f_f3ebd784518ba600e0ae288653819b5e_45875_suerf.pdf (accessed on 25 April 2025).
- Labonte, M. The Effects of Oil Shocks on the Economy: A Review of the Empirical Evidence; CRS Report for Congress; Congressional Research Service, The Library of Congress: Washington, DC, USA, 2004. [Google Scholar]
- Peersman, G.; Van Robays, I. Cross-Country Differences in the Effects of Oil Shocks. Energy Econ. 2012, 34, 1532–1547. [Google Scholar] [CrossRef]
- IEA Germany Energy Mix. Available online: https://www.iea.org/countries/germany/energy-mix (accessed on 25 April 2025).
- Wettengel, J. Germany, EU Remain Heavily Dependent on Imported Fossil Fuels. Available online: https://www.cleanenergywire.org/factsheets/germanys-dependence-imported-fossil-fuels (accessed on 25 April 2025).
- IEA Poland Energy Mix. Available online: https://www.iea.org/countries/poland/energy-mix (accessed on 25 April 2025).
- Kardaś, S. From Coal to Consensus: Poland’s Energy Transition and Its European Future | ECFR. Available online: https://ecfr.eu/publication/from-coal-to-consensus-polands-energy-transition-and-its-european-future/ (accessed on 25 April 2025).
- European Commission Energy Efficiency Directive. Available online: https://energy.ec.europa.eu/topics/energy-efficiency/energy-efficiency-targets-directive-and-rules/energy-efficiency-directive_en (accessed on 25 April 2025).
- Wysokiński, M.; Gromada, A.; Golonko, M.; Trębska, P. Energy Intensity of Economies in the European Union and the World. Ann. Polish Assoc. Agric. Agribus. Econ. 2020, 2020, 219–227. [Google Scholar] [CrossRef]
- IEA. Energy Policy Review Norway 2022. 2022. Available online: https://iea.blob.core.windows.net/assets/de28c6a6-8240-41d9-9082-a5dd65d9f3eb/NORWAY2022.pdf (accessed on 25 April 2025).
- Brown, S.; Yücel, M.K. Energy prices and aggregate economic activity: An interpretative survey. Q. Rev. Econ. Financ. 2002, 42, 193–208. [Google Scholar] [CrossRef]
- Ferderer, J.P. Oil price volatility and the macroeconomy. J. Macroecon. 1996, 18, 1–26. [Google Scholar] [CrossRef]
- Hamilton, J. A Neoclassical Model of Unemployment and the Business Cycle. J. Polit. Econ. 1988, 96, 593–617. [Google Scholar] [CrossRef]
- Abel, A.B.; Bernanke, B. Macroeconomics, 4th ed.; Addison Wesley: Boston, MA, USA, 2001; ISBN 0321122283. [Google Scholar]
- Loungani, P. Oil Price Shocks and the Dispersion Hypothesis. Rev. Econ. Stat. 1986, 68, 536–539. [Google Scholar] [CrossRef]
- Lardic, S.; Mignon, V. Oil prices and economic activity: An asymmetric cointegration approach. Energy Econ. 2008, 30, 847–855. [Google Scholar] [CrossRef]
- Lütkepohl, H. Structural VARs and VECMs. In New Introduction to Multiple Time Series Analysis; Springer: Berlin/Heidelberg, Germany, 2005; pp. 357–386. [Google Scholar]
- Alenoghena, R.O. Oil price shocks and macroeconomic performance of the Nigerian economy: A structural VAR approach. Facta Univ.-Econ. Organ. 2020, 17, 299–316. [Google Scholar] [CrossRef]
- Sims, C.A. Macroeconomics and Reality. Econometrica 1980, 48, 1–48. [Google Scholar] [CrossRef]
- Basnet, H.C.; Upadhyaya, K.P. Impact of oil price shocks on output, inflation and the real exchange rate: Evidence from selected ASEAN countries. Appl. Econ. 2015, 47, 3078–3091. [Google Scholar] [CrossRef]
- Ratti, R.A.; Vespignani, J.L. OPEC and non-OPEC oil production and the global economy. Energy Econ. 2015, 50, 364–378. [Google Scholar] [CrossRef]
- Emami, K.; Adibpour, M. Oil income shocks and economic growth in Iran. Econ. Model. 2012, 29, 1774–1779. [Google Scholar] [CrossRef]
- Ali Ahmed, H.J.; Wadud, I.K.M.M. Role of oil price shocks on macroeconomic activities: An SVAR approach to the Malaysian economy and monetary responses. Energy Policy 2011, 39, 8062–8069. [Google Scholar] [CrossRef]
- Mork, K.A. Oil and the Macroeconomy When Prices Go Up and Down: An Extension of Hamilton’s Results. J. Polit. Econ. 1989, 97, 740–744. [Google Scholar] [CrossRef]
- Hamilton, J.D. This is what happened to the oil price-macroeconomy relationship. J. Monet. Econ. 1996, 38, 215–220. [Google Scholar] [CrossRef]
- Jiménez-Rodríguez, R.; Sánchez, M. Oil price shocks and real GDP growth: Empirical evidence for some OECD countries. Appl. Econ. 2005, 37, 201–228. [Google Scholar] [CrossRef]
- Lee, K.; Ni, S.; Ratti, R.A. Oil Shocks and the Macroeconomy: The Role of Price Variability. Energy J. 1995, 16, 39–56. [Google Scholar] [CrossRef]
- Bernanke, B.S.; Gertler, M.; Watson, M.; Sims, C.A.; Friedman, B.M. Systematic Monetary Policy and the Effects of Oil Price Shocks. Brook. Pap. Econ. Act. 1997, 1997, 91–157. [Google Scholar] [CrossRef]
- Olsen, K.; Cekov, D. Why Has the NOK Weakened So Much? Available online: https://www.nordea.com/en/news/why-has-the-nok-weakened-so-much (accessed on 17 July 2025).
- Baumeister, C.; Kilian, L.; Zhou, X. Is the Discretionary Income Effect of Oil Price Shocks a Hoax? Energy J. 2018, 39, 117–137. [Google Scholar] [CrossRef]
Disclaimer/Publisher’s Note: The statements, opinions and data contained in all publications are solely those of the individual author(s) and contributor(s) and not of MDPI and/or the editor(s). MDPI and/or the editor(s) disclaim responsibility for any injury to people or property resulting from any ideas, methods, instructions or products referred to in the content. |
© 2025 by the authors. Licensee MDPI, Basel, Switzerland. This article is an open access article distributed under the terms and conditions of the Creative Commons Attribution (CC BY) license (https://creativecommons.org/licenses/by/4.0/).