Article

Study on Reasonable Well Spacing for Geothermal Development of Sandstone Geothermal Reservoir—A Case Study of Dezhou, Shandong Province, China

1
The Second Institute of Hydrogeology and Engineering Geology, Shandong Provincial Bureau of Geology & Mineral Resources (Lubei Geo-Engineering Exploration Institute), Dezhou 253072, China
2
Shandong Provincial Research Center of Geothermal Resources and Reinjection, Dezhou 253072, China
3
Dezhou Geothermal Clean Energy Development and Utilization Pilot Base, Dezhou 253072, China
4
801 Institute of Hydrogeology and Engineering Geology, Shandong Provincial Bureau of Geology and Mineral Resources (SPBGM), Jinan 250014, China
5
Key Laboratory of Groundwater Resources and Environment, Ministry of Education, Jilin University, Changchun 130021, China
*
Author to whom correspondence should be addressed.
Energies 2025, 18(15), 4149; https://doi.org/10.3390/en18154149
Submission received: 15 March 2025 / Revised: 12 July 2025 / Accepted: 30 July 2025 / Published: 5 August 2025

Abstract

Shandong Province is rich in geothermal resources, mainly stored in sandstone reservoirs. The setting of reasonable well spacing in the early stage of large-scale recharge has not attracted enough attention. The problem of small well spacing in geothermal engineering is particularly prominent in the sandstone thermal reservoir production area represented by Dezhou. Based on the measured data of temperature, flow, and water level, this paper constructs a typical engineering numerical model by using TOUGH2 software. It is found that when the distance between production and recharge wells is 180 m, the amount of production and recharge is 60 m3/h, and the temperature of reinjection is 30 °C, the temperature of the production well will decrease rapidly after 10 years of production and recharge. In order to solve the problem of thermal breakthrough, three optimization schemes are assumed: reducing the reinjection temperature to reduce the amount of re-injection when the amount of heat is the same, reducing the amount of production and injection when the temperature of production and injection is constant, and stopping production after the temperature of the production well decreases. However, the results show that the three schemes cannot solve the problem of thermal breakthrough or meet production demand. Therefore, it is necessary to set reasonable well spacing. Therefore, based on the strata near the Hydrological Homeland in Decheng District, the reasonable spacing of production and recharge wells is achieved by numerical simulation. Under a volumetric flux scenario ranging from 60 to 80 m3/h, the well spacing should exceed 400 m. For a volumetric flux between 80 and 140 m3/h, it is recommended that the well spacing be greater than 600 m.

1. Introduction

As renewable energy and clean energy integrating thermal energy and water resources, geothermal resources have attracted more and more attention, playing an increasingly important role in clean energy heating [1,2,3,4,5,6,7,8,9,10,11]. The efficient development and utilization of geothermal resources is of great significance to promoting the transformation of energy structures, enabling green development, and helping achieve the goal of “dual-carbon”. To this end, the Chinese Government issued the Renewable Energy Law of the People’s Republic of China, including geothermal resources in the development of a new energy scope that the government encourages, while the National Development and Reform Commission and nine other departments issued a different renewable energy development plan, put forward to promote deep geothermal heating, adjust measures to local conditions to choose “heat not water consumption, layer recharge” technology, encourage overall geothermal block development, promote “geothermal+” complementary mode, promote deep geothermal energy centralized planning and unified development, etc., pointing out the direction of geothermal development for the future. Under the requirement to speed up the energy transformation, the provinces have formulated relevant preferential policies, encouraging the vigorous development of geothermal resources; at the same time, with geothermal resource exploitation and the utilization of technological innovation, thermal energy utilization efficiency has greatly improved, resulting in lower development costs and green low-carbon advantages. Based on the geothermal energy complementary mode, it has entered the stage of exploration, laying a good foundation for geothermal scaling, industrialization, and the intensive utilization of resources.
In addition, China is the world’s largest energy consumer, with a high degree of energy dependence on foreign countries. Energy and resource security are related to national security. With the steady development of the economy, the energy demand of our provinces will further increase, and the contradiction between supply and demand will become more prominent. With the background of globalization and the accelerated reshaping of geopolitical patterns, vigorously developing clean energy and promoting the diversified development of energy structure is an important guarantee for realizing the security of energy resources. Shandong is a major province in energy production and consumption. Its annual coal consumption is about 400 million tons, and its carbon emissions are 8 to 1 billion tons, accounting for about 9% of the national carbon emissions, ranking among the top in China. As a stable, renewable, and sustainable clean energy, the development and utilization of geothermal energy plays an important role in reducing the dependence on external energy supply, promoting the diversification of energy structure and improving the independence and controllability of energy supply.
Shandong Province is rich in geothermal resources [12]. In recent years, the Shandong Provincial Government has issued relevant supporting policies to encourage the development and utilization of geothermal resources. Based on previous surveys, Shandong Province is rich in geothermal resources, providing heating and geothermal water for the whole province. The recoverable resources during the heating period are 32.7539 million m3/d (about 3.93 billion m3/a), equivalent to 40.7051 million t/a. The heating area is 1.972 billion m2, ranked first among 31 provinces (cities, districts) [13]. Among them, the geothermal resources in northwest Shandong (including Dongying City, Dezhou City, Binzhou City, Liaocheng City, Heze City, etc.), which mainly exploit sandstone heat storage, account for about two-thirds of the province’s resources. Dezhou City has been a large-scale mining hub for more than 20 years, with the greatest degree of mining, acting as the main battlefield of geothermal exploitation, utilization, and recharge. However, there are problems of water waste and significant decreases in heat storage levels caused by the direct discharge of tail water causing thermal pollution and water chemical pollution to the surrounding environment [14,15]. Geothermal tail water recharge is an effective way to solve the above problems [16,17,18,19]. This area has also become the main battlefield of geothermal tail water recharge in Shandong Province.
However, in recent years, it has been found that low-temperature geothermal tail water recharge will reduce the heat storage temperature around the recharge well, avoiding the recovery of the original heat storage temperature before the next heating season [1,18,20], This leads to the failure of the planned alternate use of mining and recharge wells to alleviate the recharge well blockage problem, and there is also a risk of thermal breakthrough, which reduces the quality of geothermal resources and fails to meet the production demand.
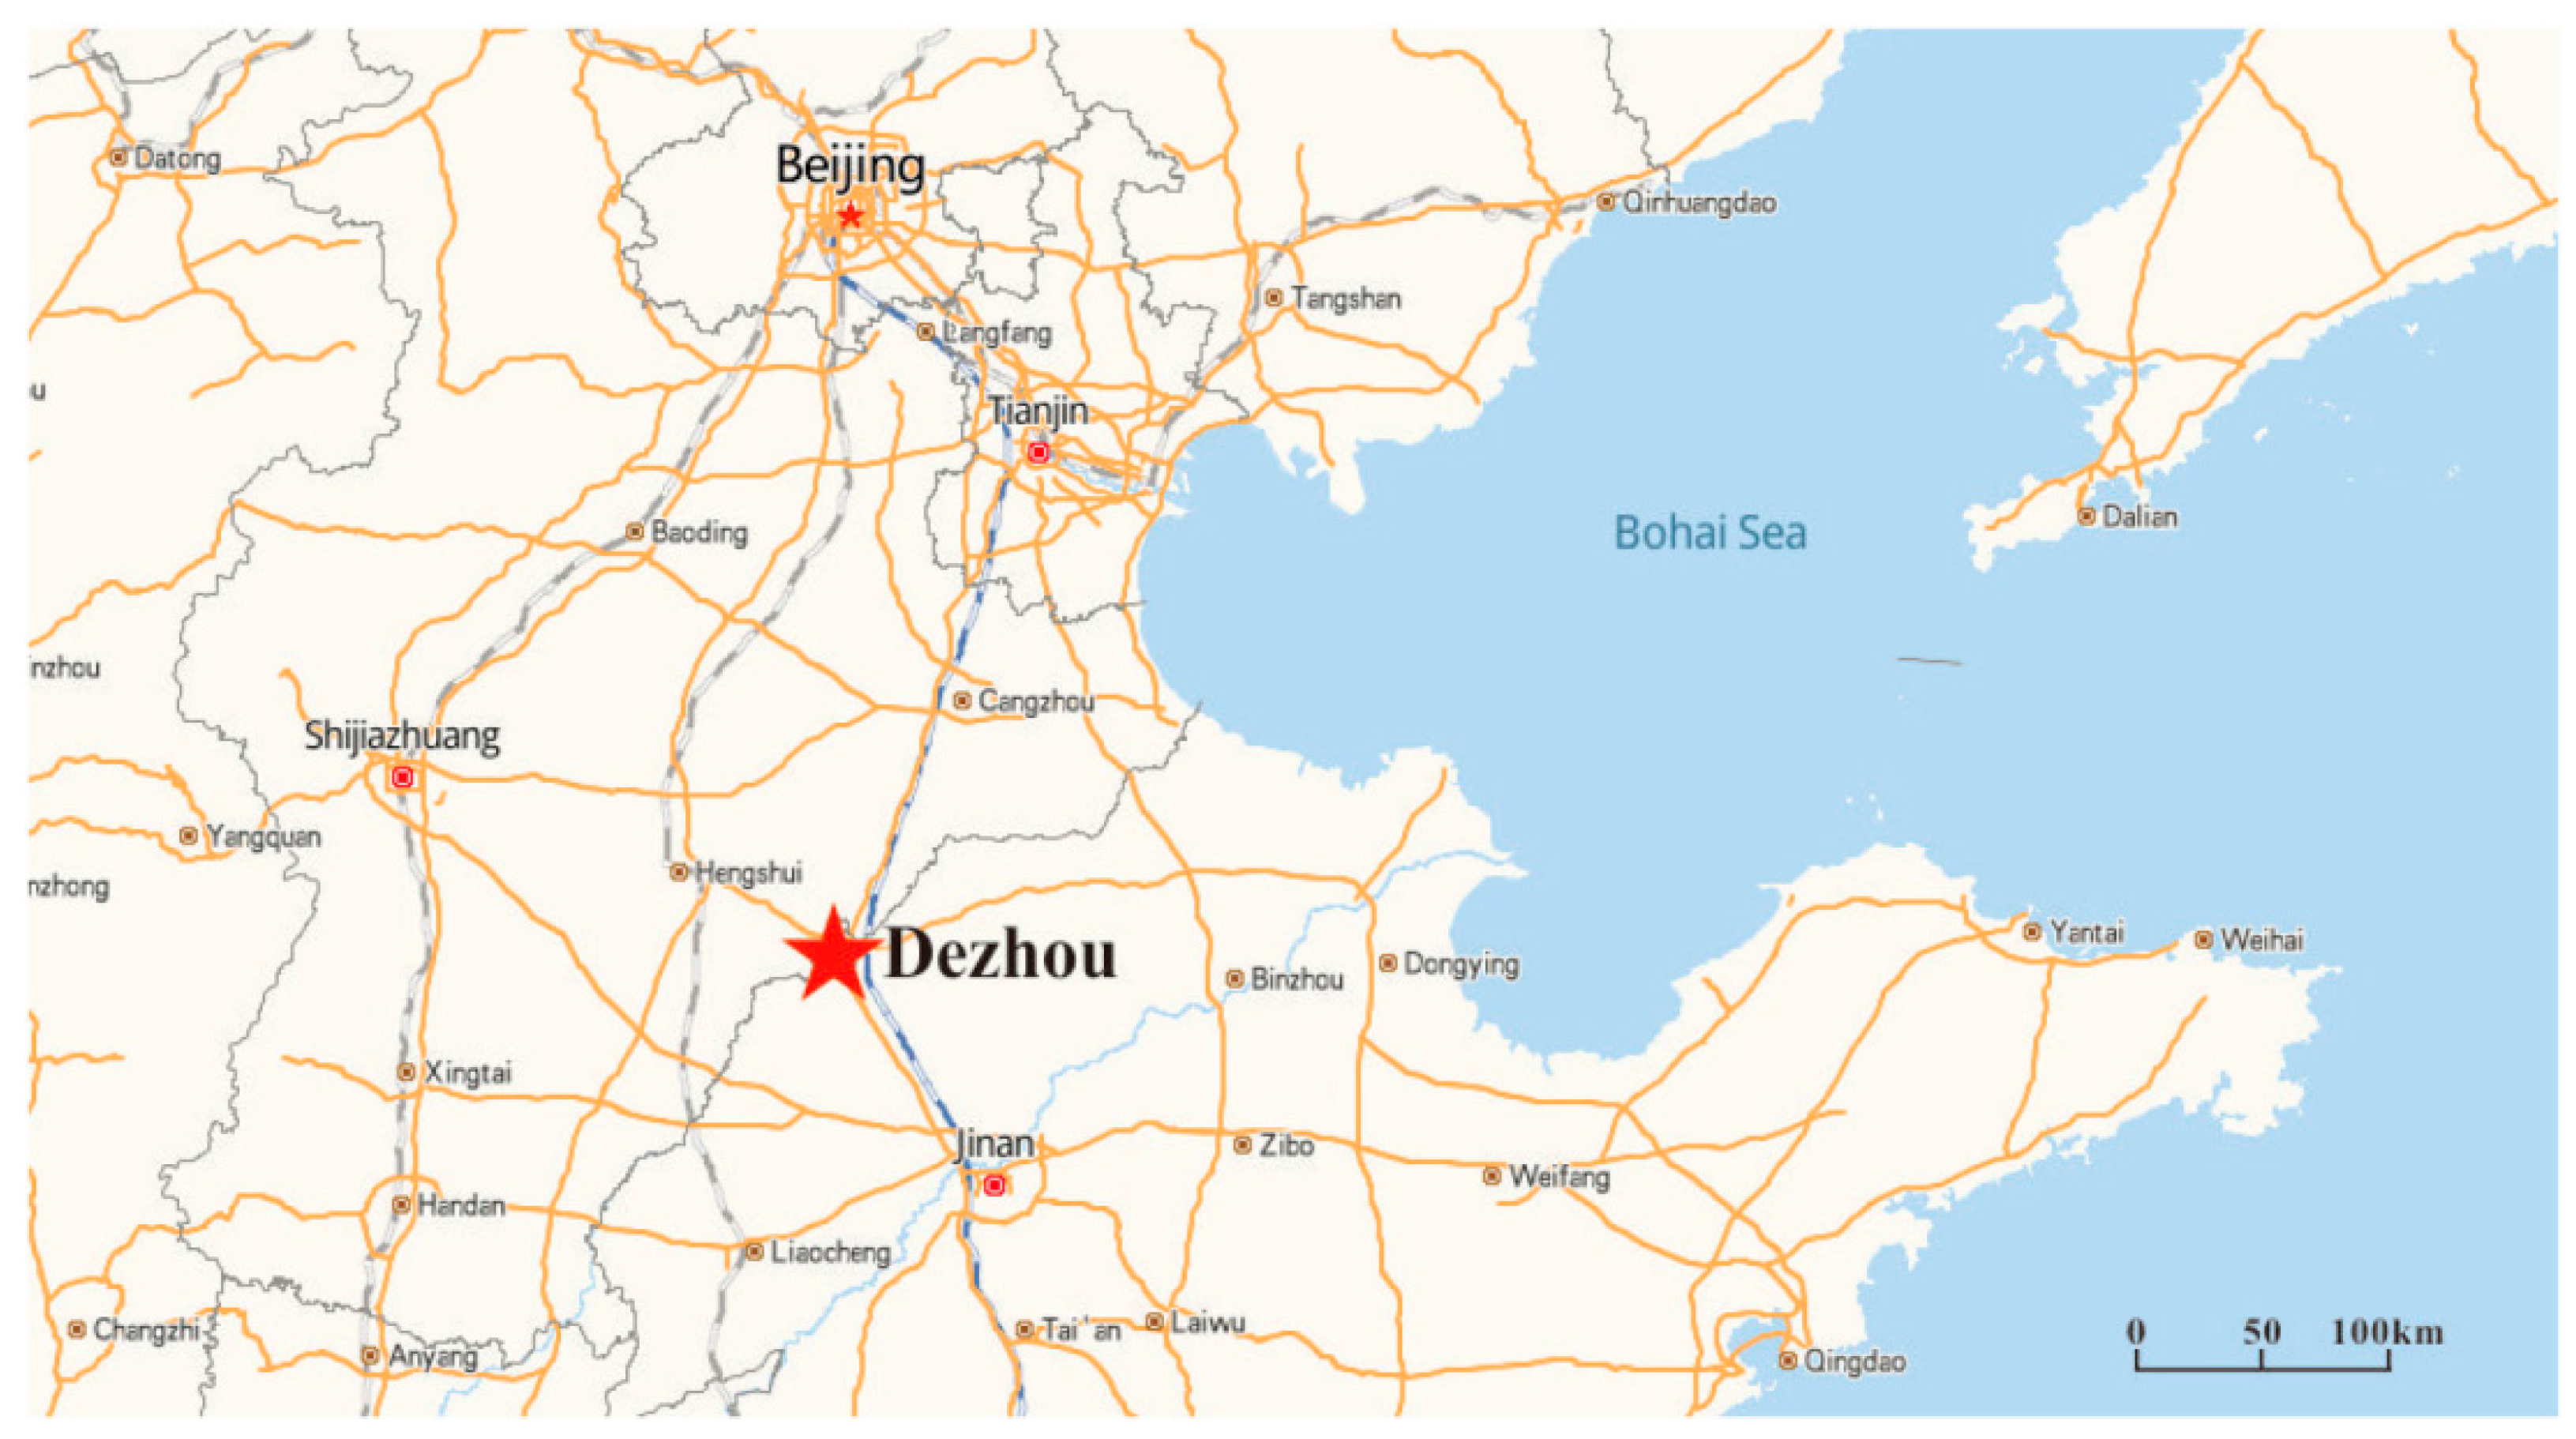
In this paper, the geothermal field monitoring data of typical mining and irrigation projects in sandstone thermal reservoirs in Dezhou City are systematically analyzed (Figure 1). Through numerical simulation, the necessity of setting reasonable spacing between mining and irrigation wells is proposed, and reasonable spacing between mining and irrigation wells is obtained, which provides technical support for geothermal utilization in the Lubei Plain and other similar areas.

1.1. Geological Conditions

Dezhou City belongs to the North China Plate (Grade I) geotectonic unit. The Liaocheng–Lankao fault and Qihe–Guangrao fault are divided into two grade II tectonic units. North of the fault is the North China Depression (I), and south of the fault is the Luxi uplift area (II) [21]. Since the Mesozoic and Cenozoic, under the influence of the Himalayan movement and the Yanshan movement, the fault structure has developed, and III-level structural units with convex and concave phases have been formed, including Jiyang Depression (Ia), Linqing Depression (Ib), and Luzhong Uplift (IIa). Under the influence and control of fault activity in the depression and uplift areas, many secondary tectonic units—subfault depressions and subfault uplifts—have been formed. Affected by the Neocathaysian tectonic system, the bedrock fracture structure in the area is well developed and the activity intensity is high. The main directions of fracture development are NNNE, NE, and near EW, followed by NW, and the fracture structures are all concealed.

1.2. Thermal Storage Characteristics

The occurrence and distribution of geothermal resources in the study area are controlled by the geological structure and formation lithology. The uneven base structural pattern has an important influence on the distribution of geothermal resources in this area. In general, within the depth of the new boundary cover, the geothermal temperature gradient of the positive structure is low, and the geothermal temperature distribution of the shallow crust is positively correlated with the fluctuation of the bedrock surface. Secondly, the ubiquitous existence of pores, cracks, or dissolution in strata is a necessary condition for the formation and occurrence of geothermal resources. The multilayer structure in the region is below the Quaternary. Among them, the Neogene and Paleogene hydrobearing rock groups have thick lithology, large pores, and wide distribution, which provide good storage space for geothermal water [22,23,24].
The geothermal heat storage in Dezhou City includes the thermal reservoir of upper Neogene and Paleogene clastic rocks and the thermal reservoir of deep Cambrian–Ordovician bedrock. The main thermal reservoirs are the Neogene Guantao Formation, Paleogene Dongying Formation clastic rock, and deep Ordovician Cambrian limestone, among which the sandstone pore fissure thermal reservoir of the Neogene Guantao Formation is the main thermal reservoir in Dezhou City. The thermal storage characteristics are shown in Table 1.

2. Current Situation of Geothermal Engineering Development

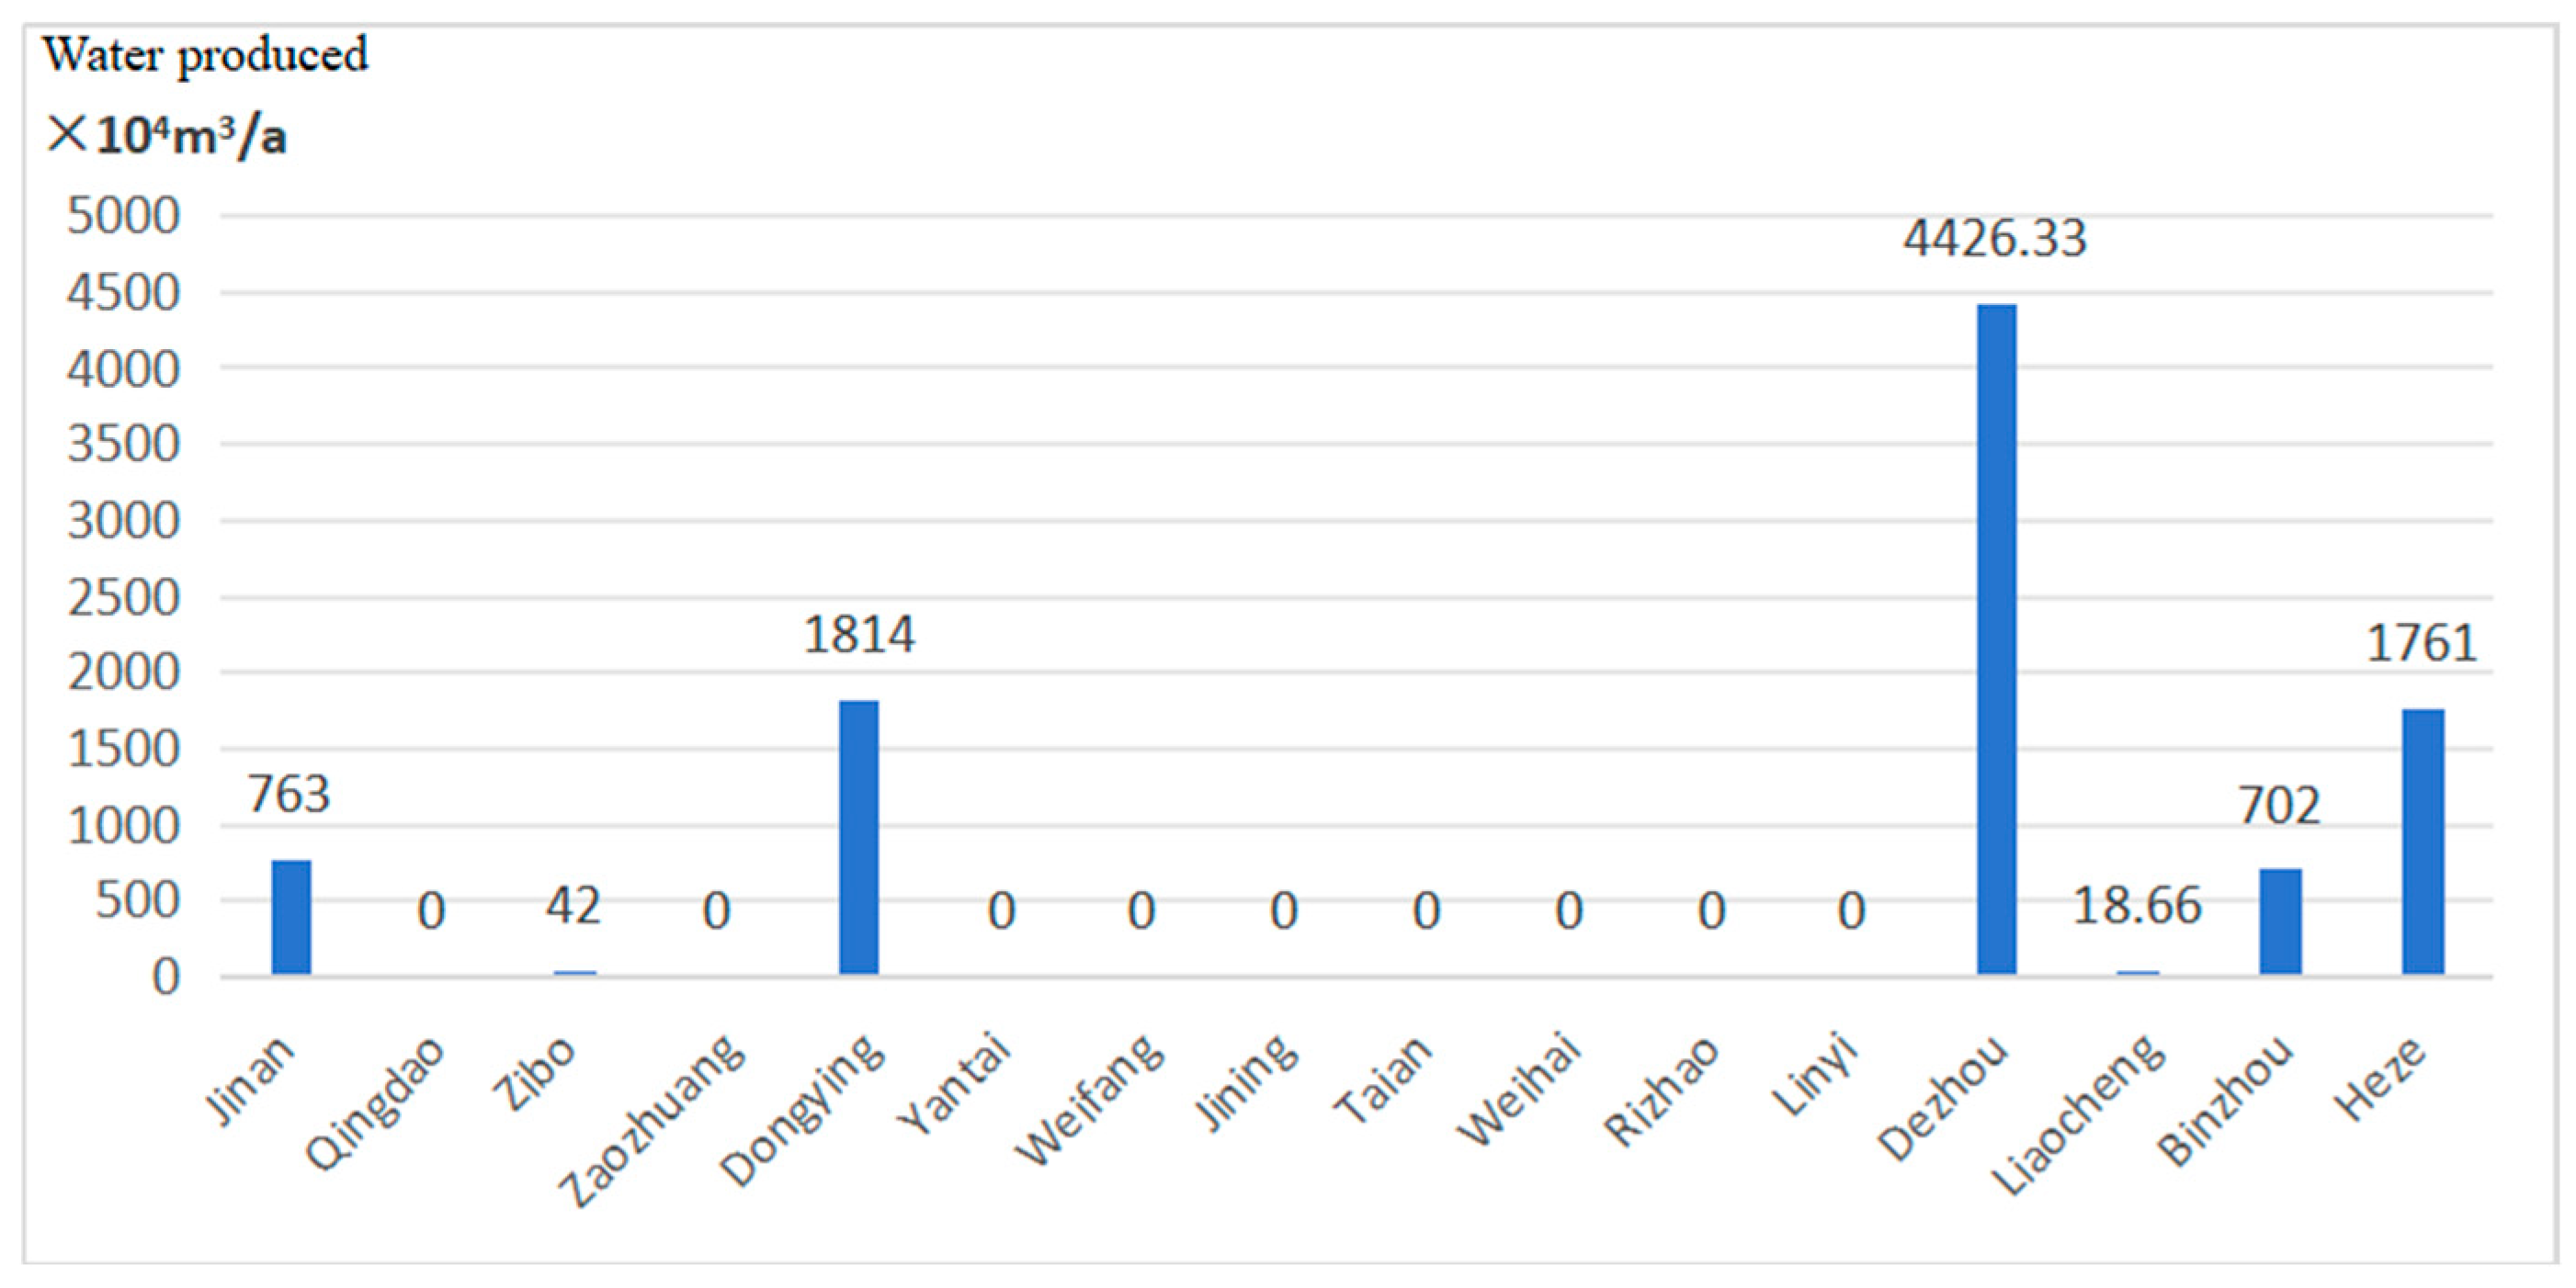
According to the statistical data of 2023, there are 518 geothermal projects in operation in Shandong Province, with a total production capacity of 109 million cubic meters per year, among which there are 655 geothermal heating projects, with a total mining capacity of 95.27 million cubic meters per year, which is the main application scenario for geothermal development and utilization. Among many geothermal heating projects, Dezhou Guantao Group possesses the largest heat storage capacity and exploitation amount (Figure 2). In order to ensure the sustainable development and utilization of geothermal resources, according to policy requirements, all the geothermal tail water used for heating must be recharged to the thermal reservoir. Due to the early stage of scale recharge and low-temperature cold water recharge temperature influence characteristics not being well understood, recharge engineering construction has not kept large distances, as demonstrated in the most concentrated city, Decheng Area, with a recharge well distance of less than 200 m accounting for 63% of cases and a recharge well distance of more than 400 m in only 8.7% (Table 2), showing that small recharge well spacing is a common phenomenon.
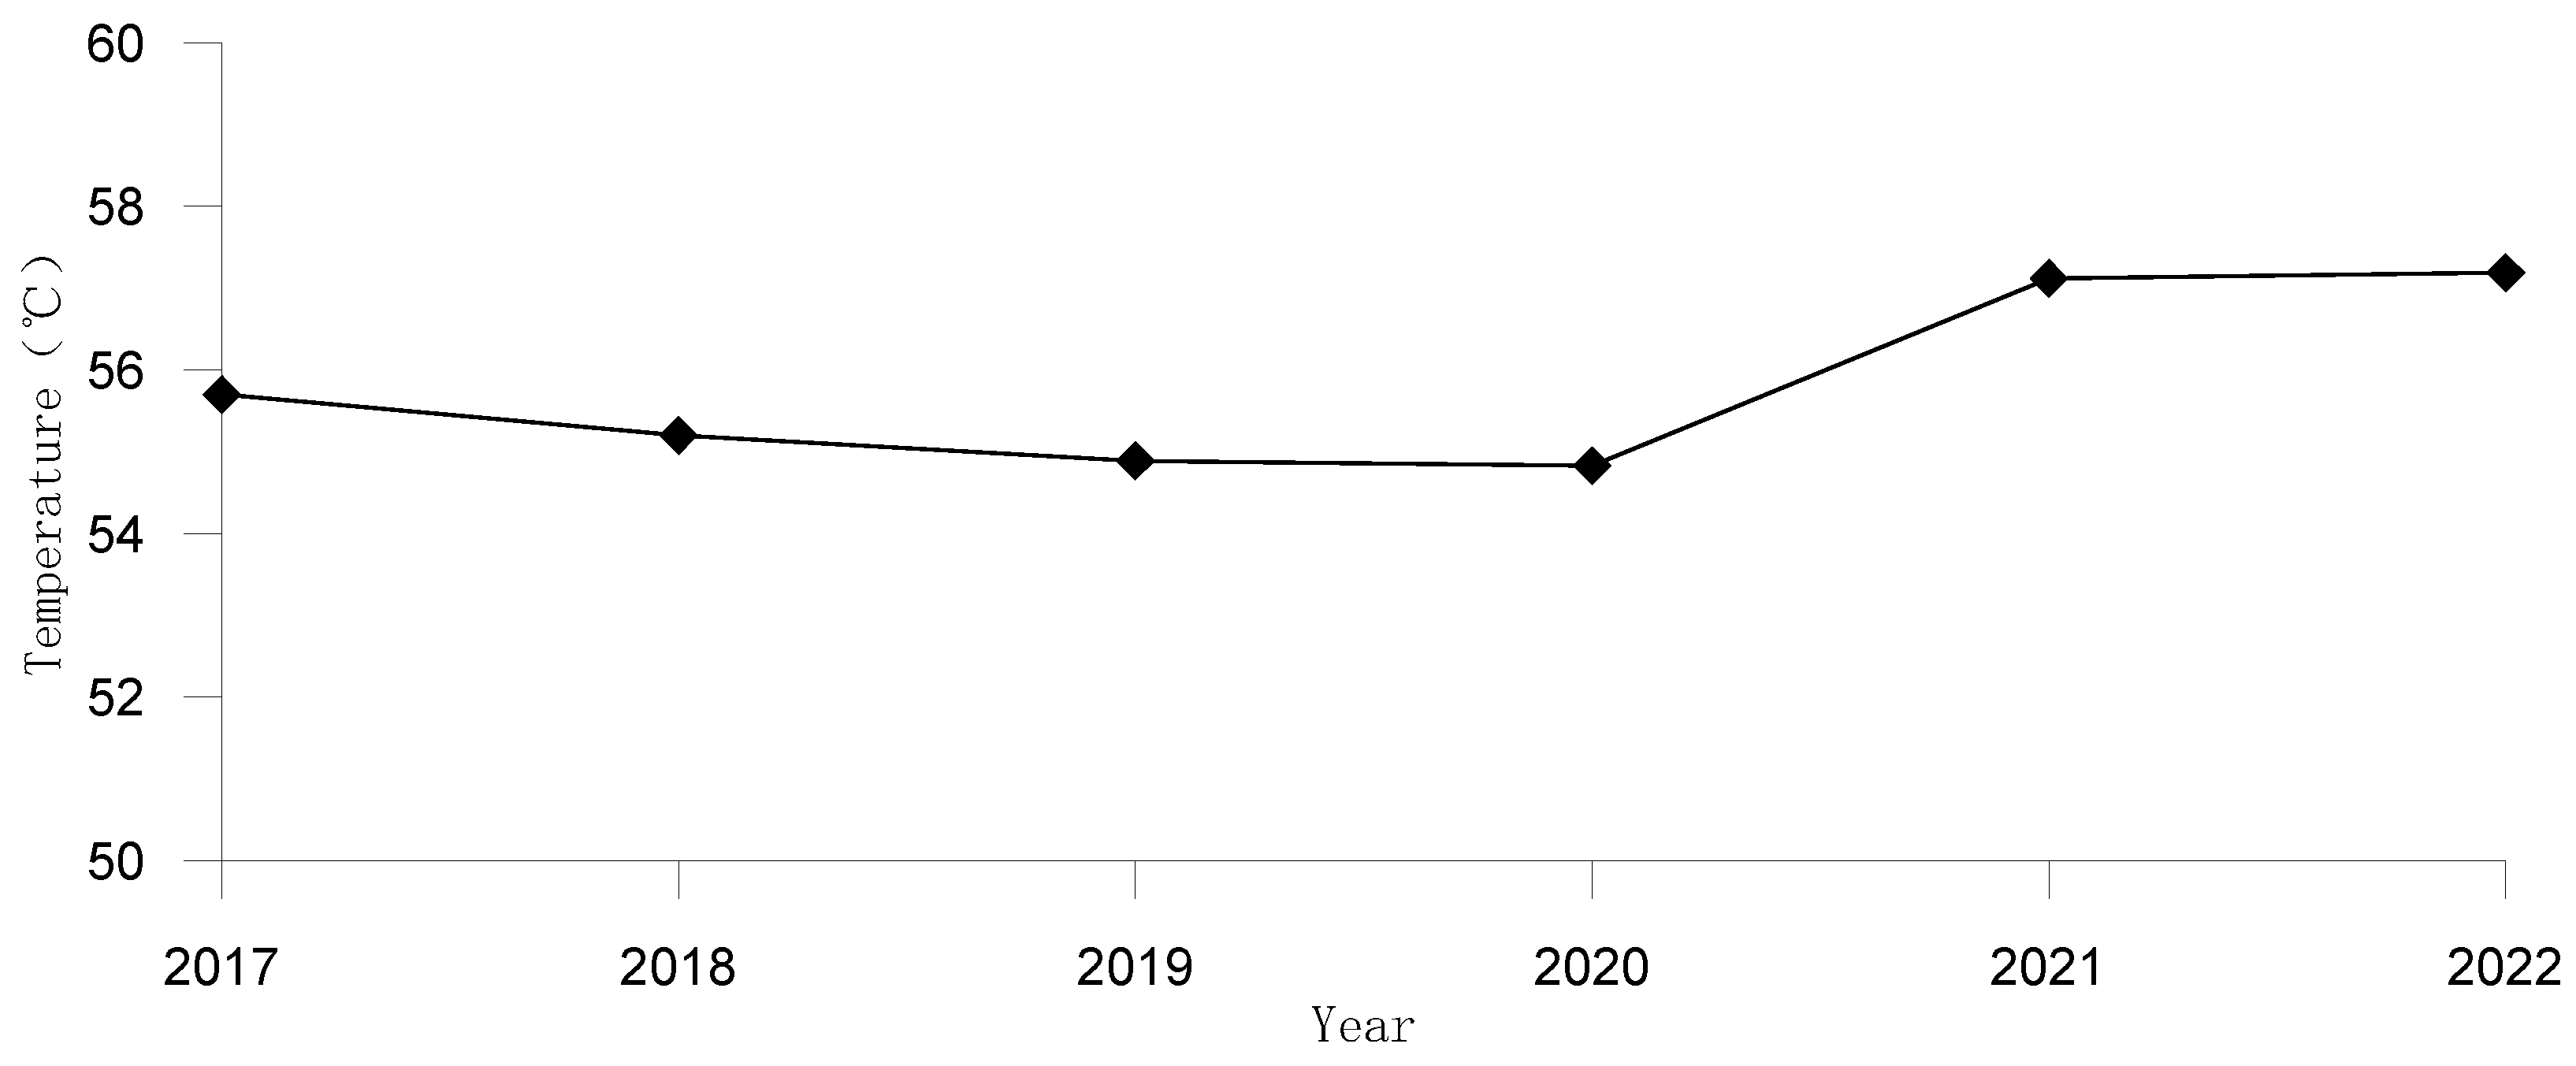
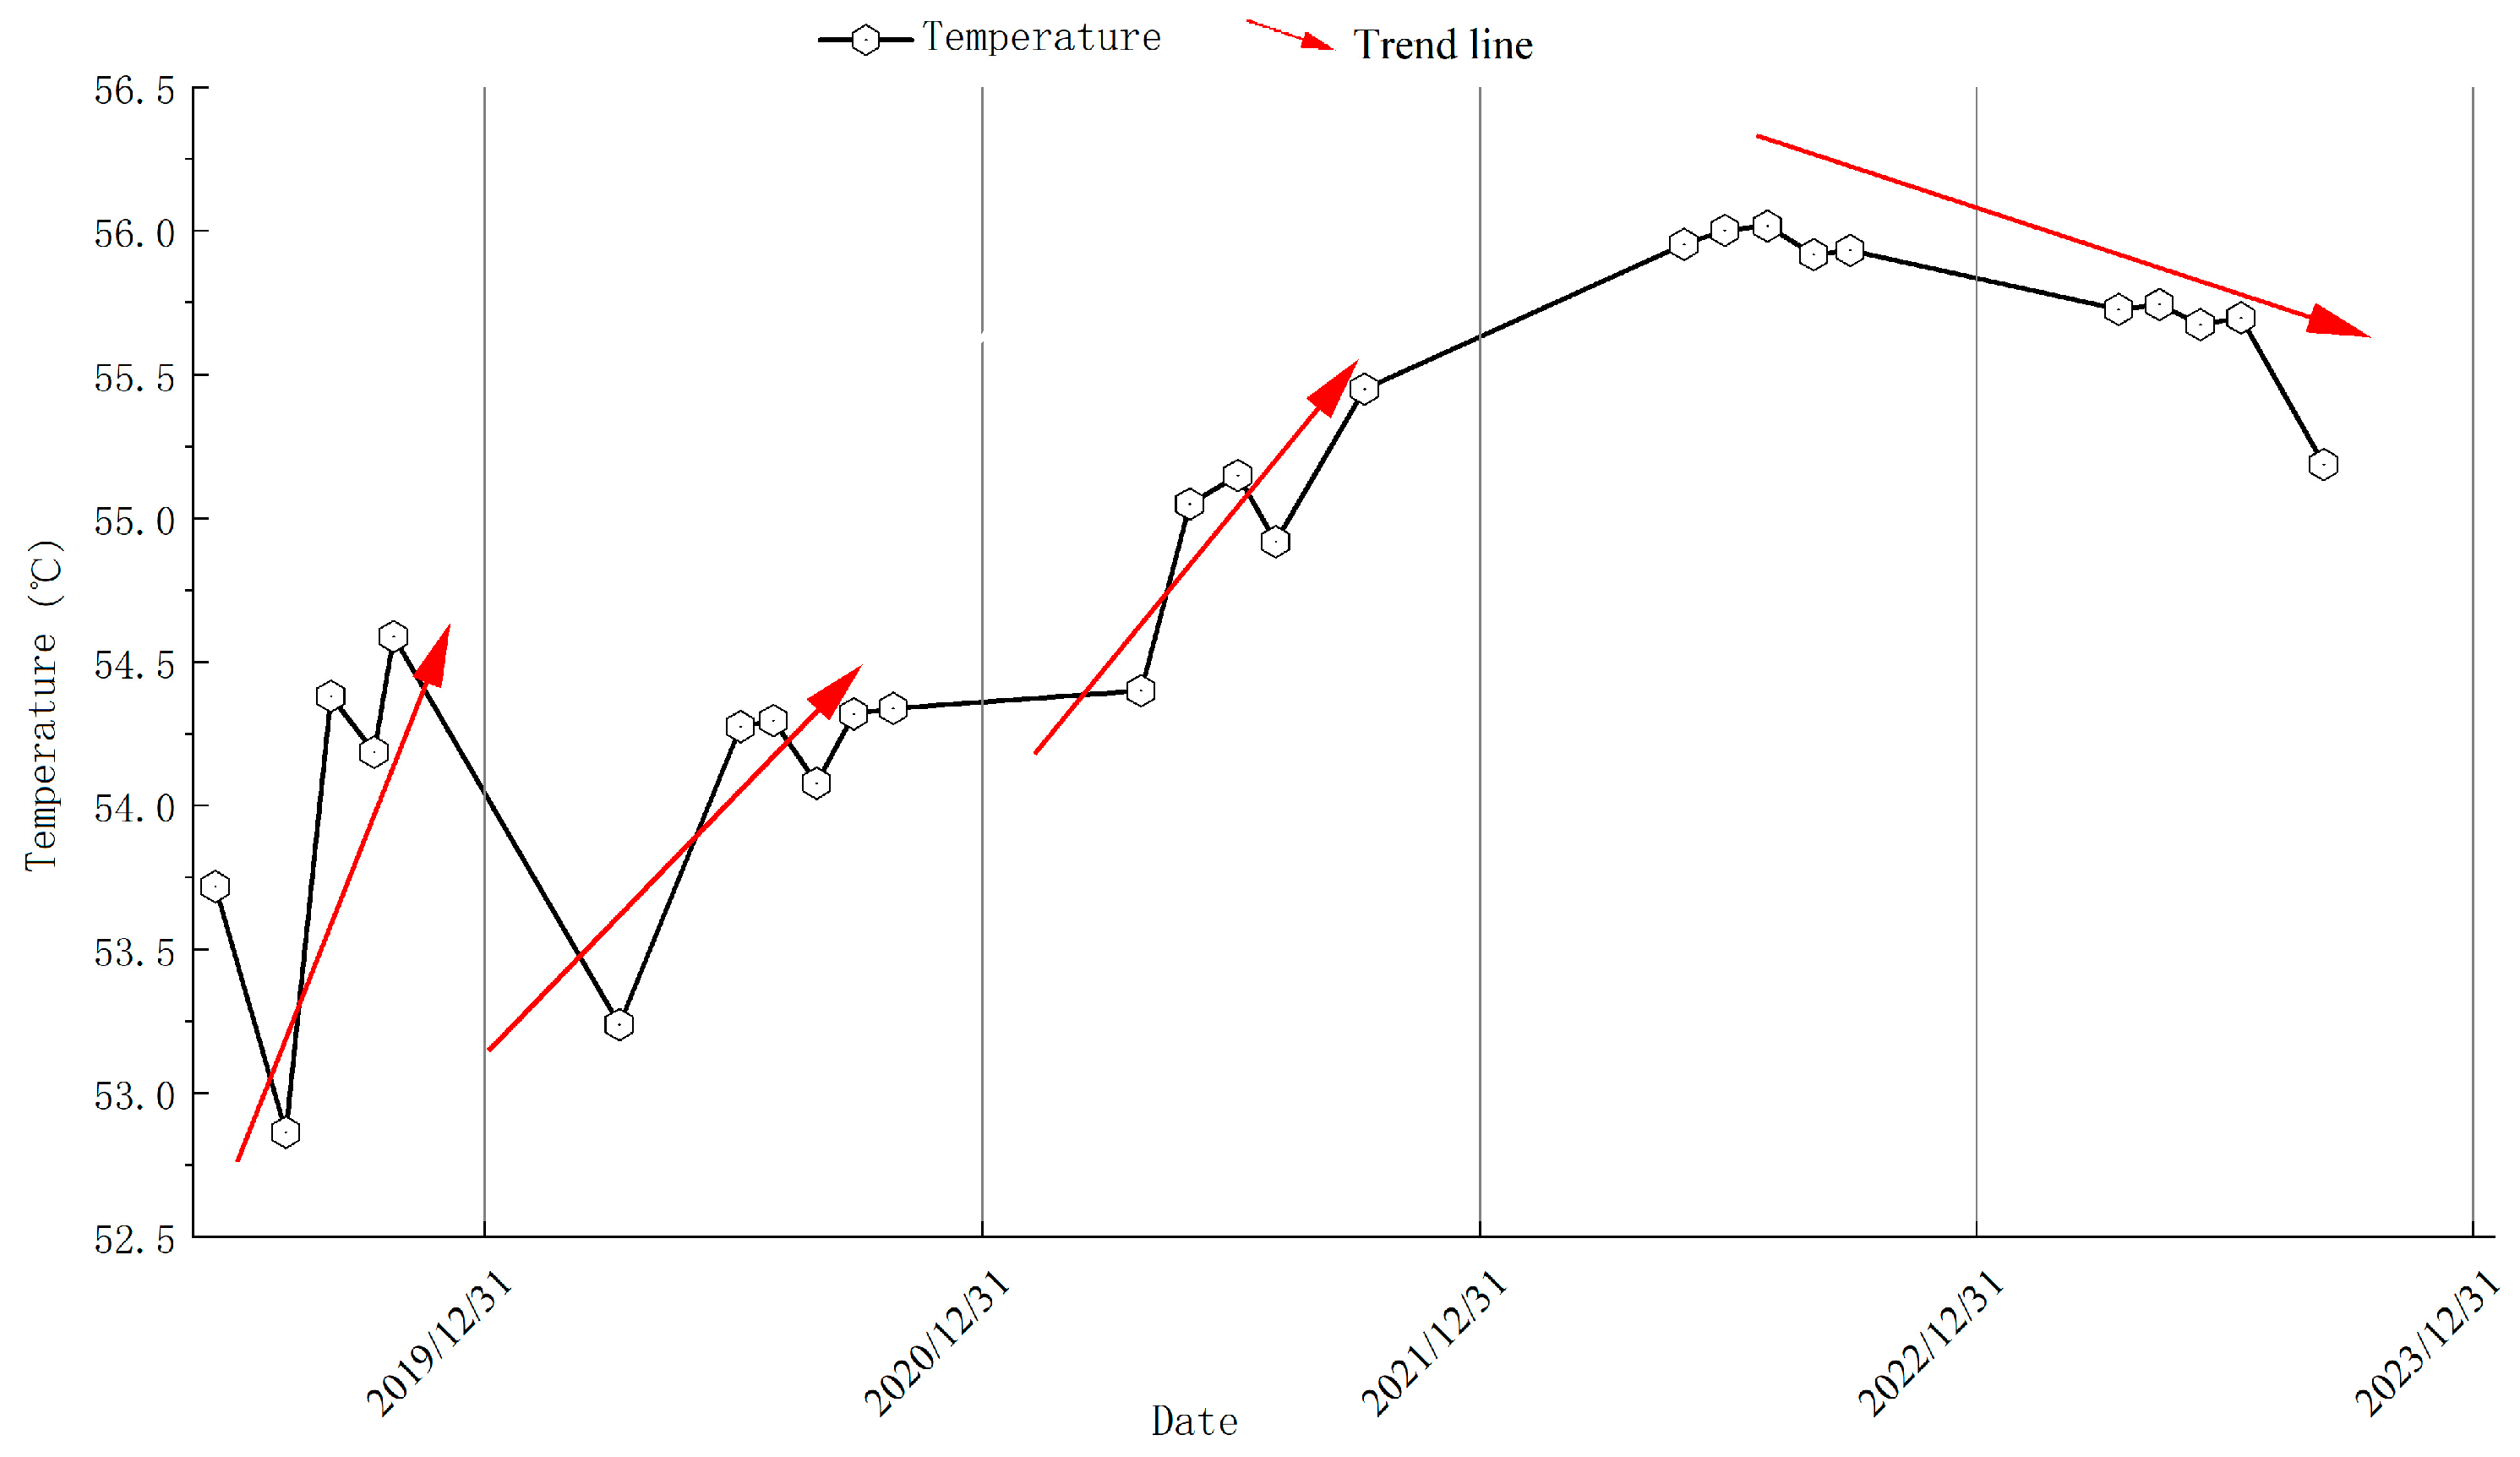
Since 2017, Shandong Lubei Geological Engineering Survey Institute has carried out long-term monitoring of the temperature throughout the whole well section of a hydro and recharge project (well spacing of 180 m), and obtained the temperature change rule of the whole well section of mining wells and recharge wells [1]. According to the latest monitoring data, the outlet temperature of the production wells increased in the 2020–2021 heating season (Figure 3). This is somewhat different from the previous perception. In addition, the average temperature of the water intake section (1330 m–1465 m) increased in the non-heating season in 2019, 2020, and 2021. The average water temperature throughout these years has increased by 0.87 °C, 1.10 °C, and 1.05 °C, respectively. The average temperature was essentially flat in 2022 and started to decline in 2023. Through these years, it decreased by 0.022 °C in 2022 and by 0.539 °C in 2023 (Figure 4). Well production temperatures are expected to continue to drop in 2024.
The above monitoring data show that the mining and recharge project has affected the water temperature of the mining well after many years of recharge. Therefore, during the construction of similar projects, the mining scheme needs to be optimized or set a reasonable well distance. Next, we will use this project as the background to build a numerical model and propose a solution to the problem.

3. Numerical Model Construction and Current Situation Prediction

3.1. Numerical Model of the Hydrothermal Coupling

The theoretical model and numerical simulation of thermal storage have played an important role in geothermal resource evaluation, design optimization of mining and recharge schemes, and thermal breakthrough prediction of geothermal wells. The quantitative interpretation of tracer test data, the optimal design of geothermal recharge schemes, and the accurate prediction of the mining life of geothermal wells are inseparable from the simulation [25] of heat storage under different mining and recharge conditions. In the early stage of geothermal development, the analytical model with a highly idealized but clear concept and less calculation was adopted due to the few known data [26], or the centralized parameter model [27] could make some rough estimation of the thermal reservoir. With the development of computer technology, modern numerical simulation methods can finely characterize the heterogeneity of thermal storage and the evolution law of physical, chemical, and thermodynamic characteristics in the process of production and recharge, which has become the main method for the study and evaluation of multi-field coupling effects in thermal storage engineering. Domestic and foreign scholars have performed a lot of work in multi-field coupling. The common numerical methods mainly include the finite element method, boundary element method, finite difference method, and finite volume method. The main representative multi-field coupling procedures are shown in Table 3 [28,29].
In this study, TOUGH 2 software was used to build the numerical model. The construction process includes thermal storage parameter identification, hydrological parameter identification, and the construction of a geological model.

3.2. Simulation Approach

3.2.1. Simulation Code

TOUGH2 has become a common choice for simulating non-isothermal, multiphase transport in porous and fractured formations. By coupling wellbore hydraulics with the original TOUGH2 framework, the T2Well simulator was created. Within T2Well, the EOS1 fluid-property package—tailored for hydrothermal applications—is implemented [12].

3.2.2. Governing Equations

The fundamental governing principles comprise mass and energy balance equations. These conservation laws are mathematically represented by Equation (1), which incorporates three distinct components: the accumulation term (M), the flux term (F), and the source/sink term (q) [12].
d d t M κ   d V n = F κ · n d Γ n + q κ   d V n
The mathematical formulations of these three components exhibit distinct variations when applied to mass and energy conservation across different disciplines. Notably, the accumulation and flux components demonstrate remarkable similarity in both wellbore and reservoir mass balance equations, as evidenced by Equations (2) and (3) [12].
M κ = ϕ ρ X κ
F κ = ρ u X κ
In fluid component modeling, the parameter κ serves as a component identifier with specific definitions. Although the subject under study is solely a water medium, different water origins can be distinguished through κ values, such as treating formation water and recharge water as separate components for numerical processing. In the mass conservation equation, ρ represents fluid density,  u denotes the velocity vector, and X κ is defined as the mass fraction of component κ . For medium–low temperature geothermal systems, the water phase remains consistently liquid, exhibiting single-phase flow characteristics. The porosity parameter ϕ takes a value of one in wellbore environments, while the calculation method for velocity u requires differential treatment based on domain type (reservoir or wellbore) [12].
The energy balance equations involve more intricate formulations for both accumulation and flux terms. Specifically, the reservoir’s accumulation term accounts for the combined internal energy contributions from both the fluid phase and the solid rock matrix, as mathematically represented in Equation (4). Regarding the flux term, it encompasses three principal mechanisms: convective energy transport via fluid motion (advection), conductive heat transfer, and mechanical work performed by the fluid system. As demonstrated in Equation (5), the composite effects of internal energy and mechanical work can be conveniently expressed through the thermodynamic property of specific enthalpy, ρ h = ρ U P [12].
M κ = ρ U + ρ R C R T
F κ = λ T + ρ h u
In the context of wellbore modeling, both kinetic energy and gravitational potential energy contributions must be incorporated into the energy balance formulation, as mathematically described by Equations (6) and (7) [12].
M κ = ρ U + 0.5 ρ u 2
F κ = λ T + ρ h u + 0.5 ρ u 3 + ρ u g z cos θ
q = ρ u g cos θ + q
In the energy conservation framework, the parameters λ , h, and θ correspond to the medium’s thermal conductivity, the fluid’s specific enthalpy, and the wellbore’s deviation angle from vertical, respectively. The source/sink term (q) incorporates both gravitational potential energy contributions and additional energy transfer mechanisms (q′), including thermal interactions with adjacent geological formations [12].
The mathematical formulation of fluid flow phenomena requires distinct governing equations for different spatial domains. In porous media applications, fluid movement through the reservoir is characterized by Darcy’s law (Equation (9)), while wellbore flow dynamics are governed by the momentum conservation principle (Equation (10)). Within the momentum balance formulation, the geometric parameter Γ represents the wellbore’s circumferential dimension, and τ w denotes the frictional resistance at the conduit wall [12].
u = k μ P ρ g cos θ
t ρ u + z ρ u 2 = P z Γ τ w A ρ g cos θ
For the momentum equation, Γ is the perimeter of the wellbore, and τ w is the wall shear stress [12].

3.3. Numerical Simulation

3.3.1. Model Building

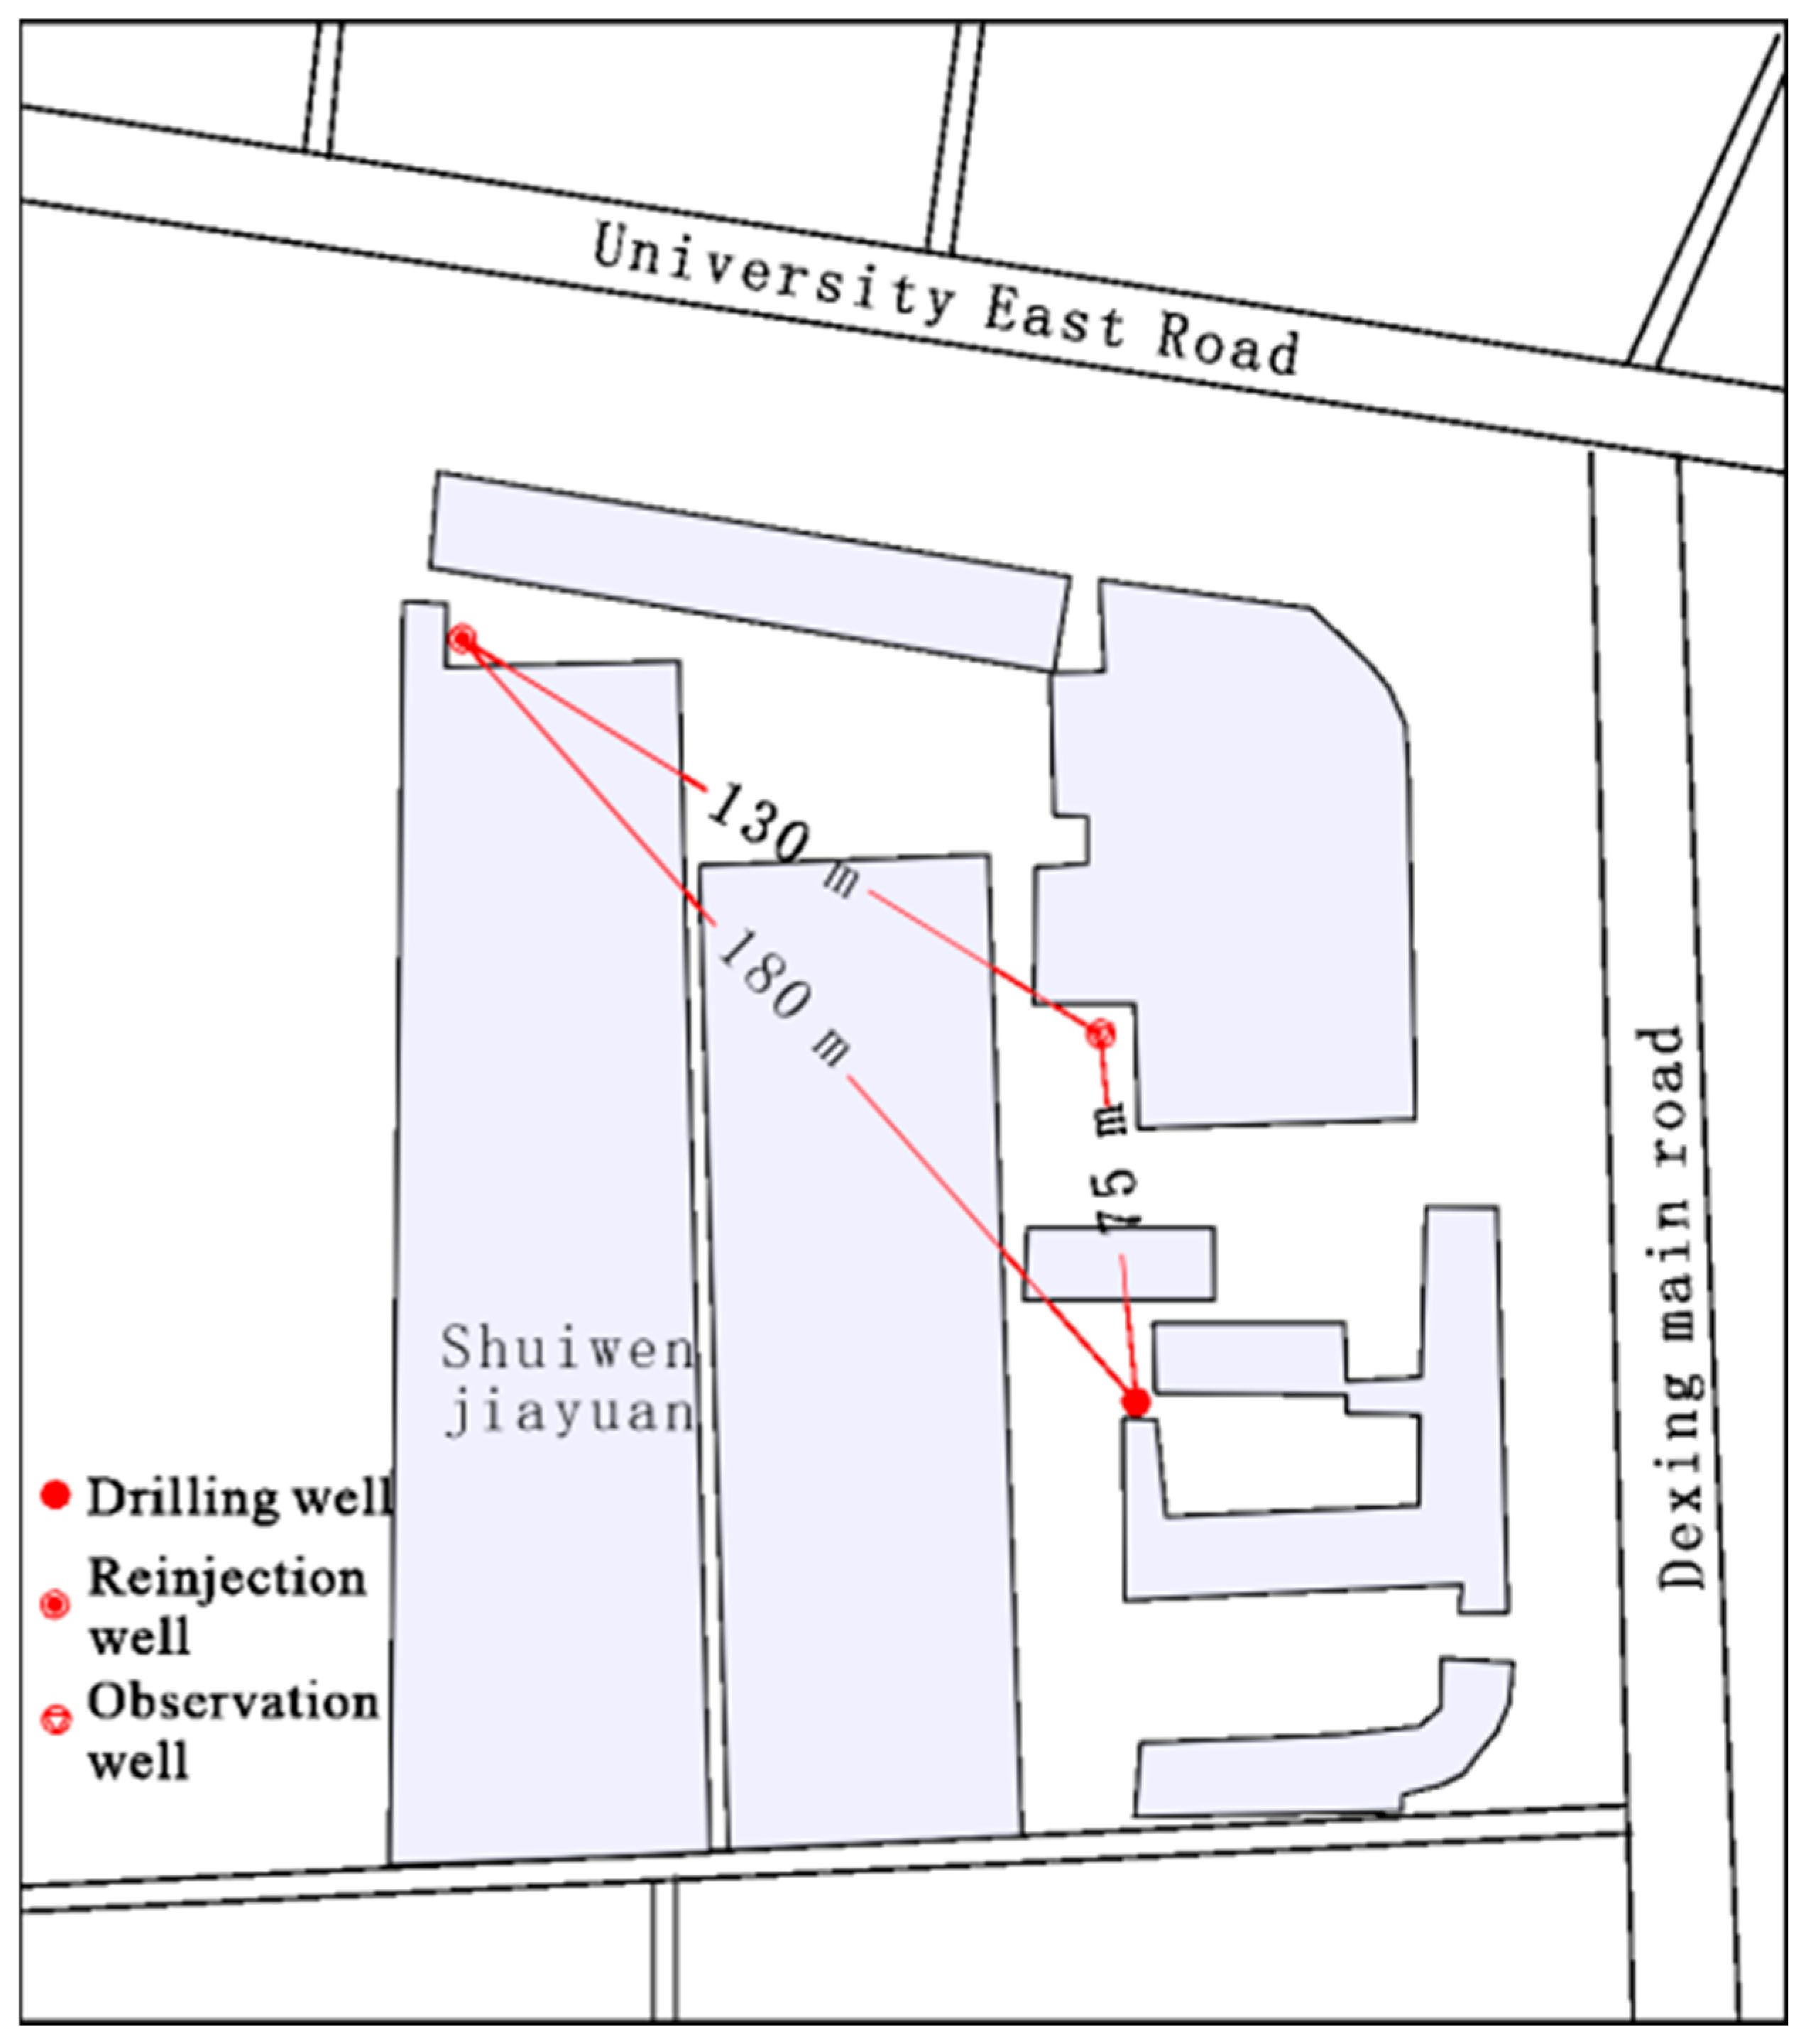
The mining and recharge project in Decheng District includes three types of geothermal wells, namely mining wells, recharge wells, and observation wells (Figure 5). The distance between the mining well and the recharge well is about 180 m, and there is a closed mining well in the middle as the observation well for monitoring. The low-temperature geothermal tail water directly enters heat storage through the recharge well. Therefore, when constructing the numerical model, the exposed formation of the recharge well should prevail. According to the thickness and lithology distribution of the comprehensive cylindrical chart of drilling wells during completion in 2016, the main strata involved in the model from the surface down are Quaternary loose strata, Neogene Minghua Formation strata (mudstone and fine sandstone strata), Neogene ceramic strata (mainly including mudstone, fine sandstone, gravel coarse sandstone, and conglomerate) and Paleogene Dongying Formation strata (Table 4). In this time, the built-in program MESHMAKER in TOUGH2 was used to separate the formation into 82 grids in the vertical direction, with a discrete length between 0.26 m and 37 m. According to the geothermal distribution trend of the quaternary loose rock strata, the model roof is extended to the buried depth of 39 m, and the roof grid is located below the underground perennial constant temperature zone (buried depth of 20 m).

3.3.2. Measured Data and Model Correction

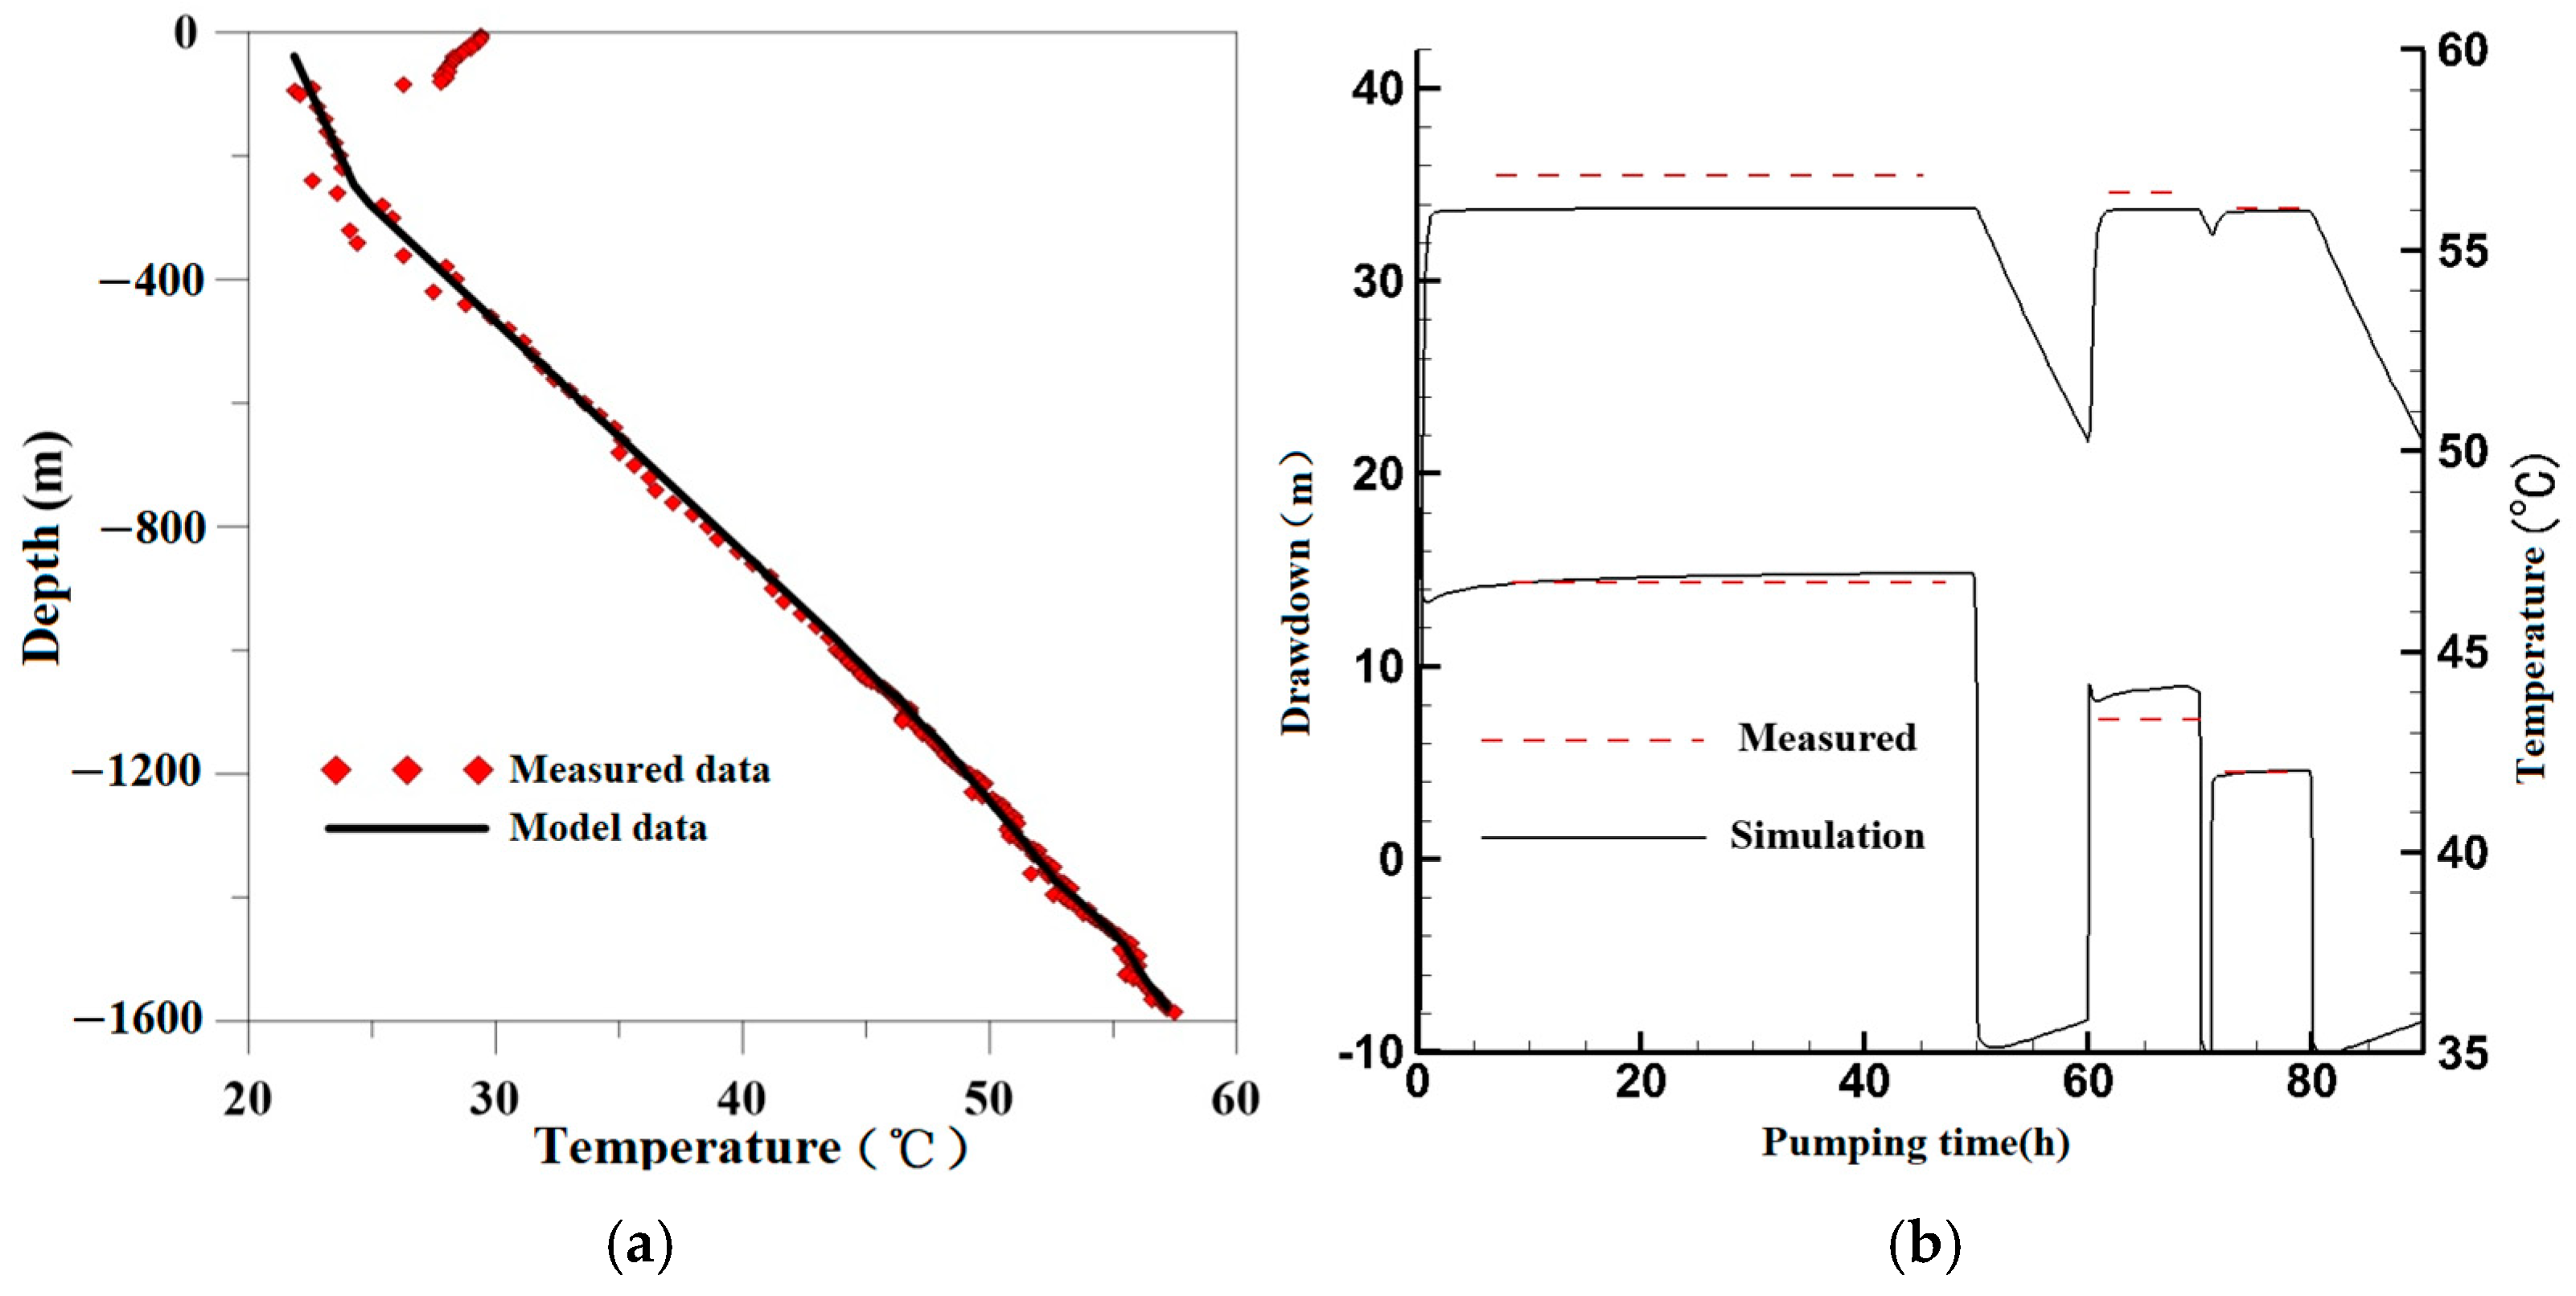
After the construction of the geothermal well, in order to find out the characteristics of the temperature vertical change, we carried out steady-state temperature measurement. The instrument was a ZDKJ-A1 downhole detector produced by Zhongda Electronic Technology Co., Ltd., Xi’an, China. The measurement accuracy was 0.1 °C, observed from the wellhead to the bottom of the well and taking the average value of the two. During measurement, the spacing between measuring points of the heat storage section was 5 m, and the spacing between measuring points of other positions was 20 m. To evaluate the heat storage permeability performance around the recharge well, we conducted three deep pumping tests, as well as water level measurement using pressure-type automatic water-level monitoring, with a measuring accuracy of 0.01 m, and water monitoring with an electromagnetic meter for automatic monitoring, with data transmitted to a geothermal resource monitoring system, producing a measurement accuracy of 0.01 m3. The pumping test data and results are shown in Table 5. In addition, we collected the calculation results of pumping tests at different layers of the cover well.
We brought the above calculation results into the model and corrected the thermal conductivity and permeability of each stratum according to the measured data (Figure 6). At this time, the thermal conductivity of each lithology is shown in Table 6, and the permeability value is shown in Table 7.

3.3.3. Construction of a Thermal Coupling Model for Well Water

The drilling depth of the hydrological home mining and recharge project is 1479.72 m, and the recharge well is located 180 m northwest of the mining well, with a depth of 1536.44 m; the water intake layers of the two wells are the lower part of the new pottery thermal reservoir. Previous scholars have deeply studied the project and constructed numerical models at different scales, which are optimized based on the model framework [12] of Xu Tianfu and other models, and assigned different formation parameters according to the corrected data.
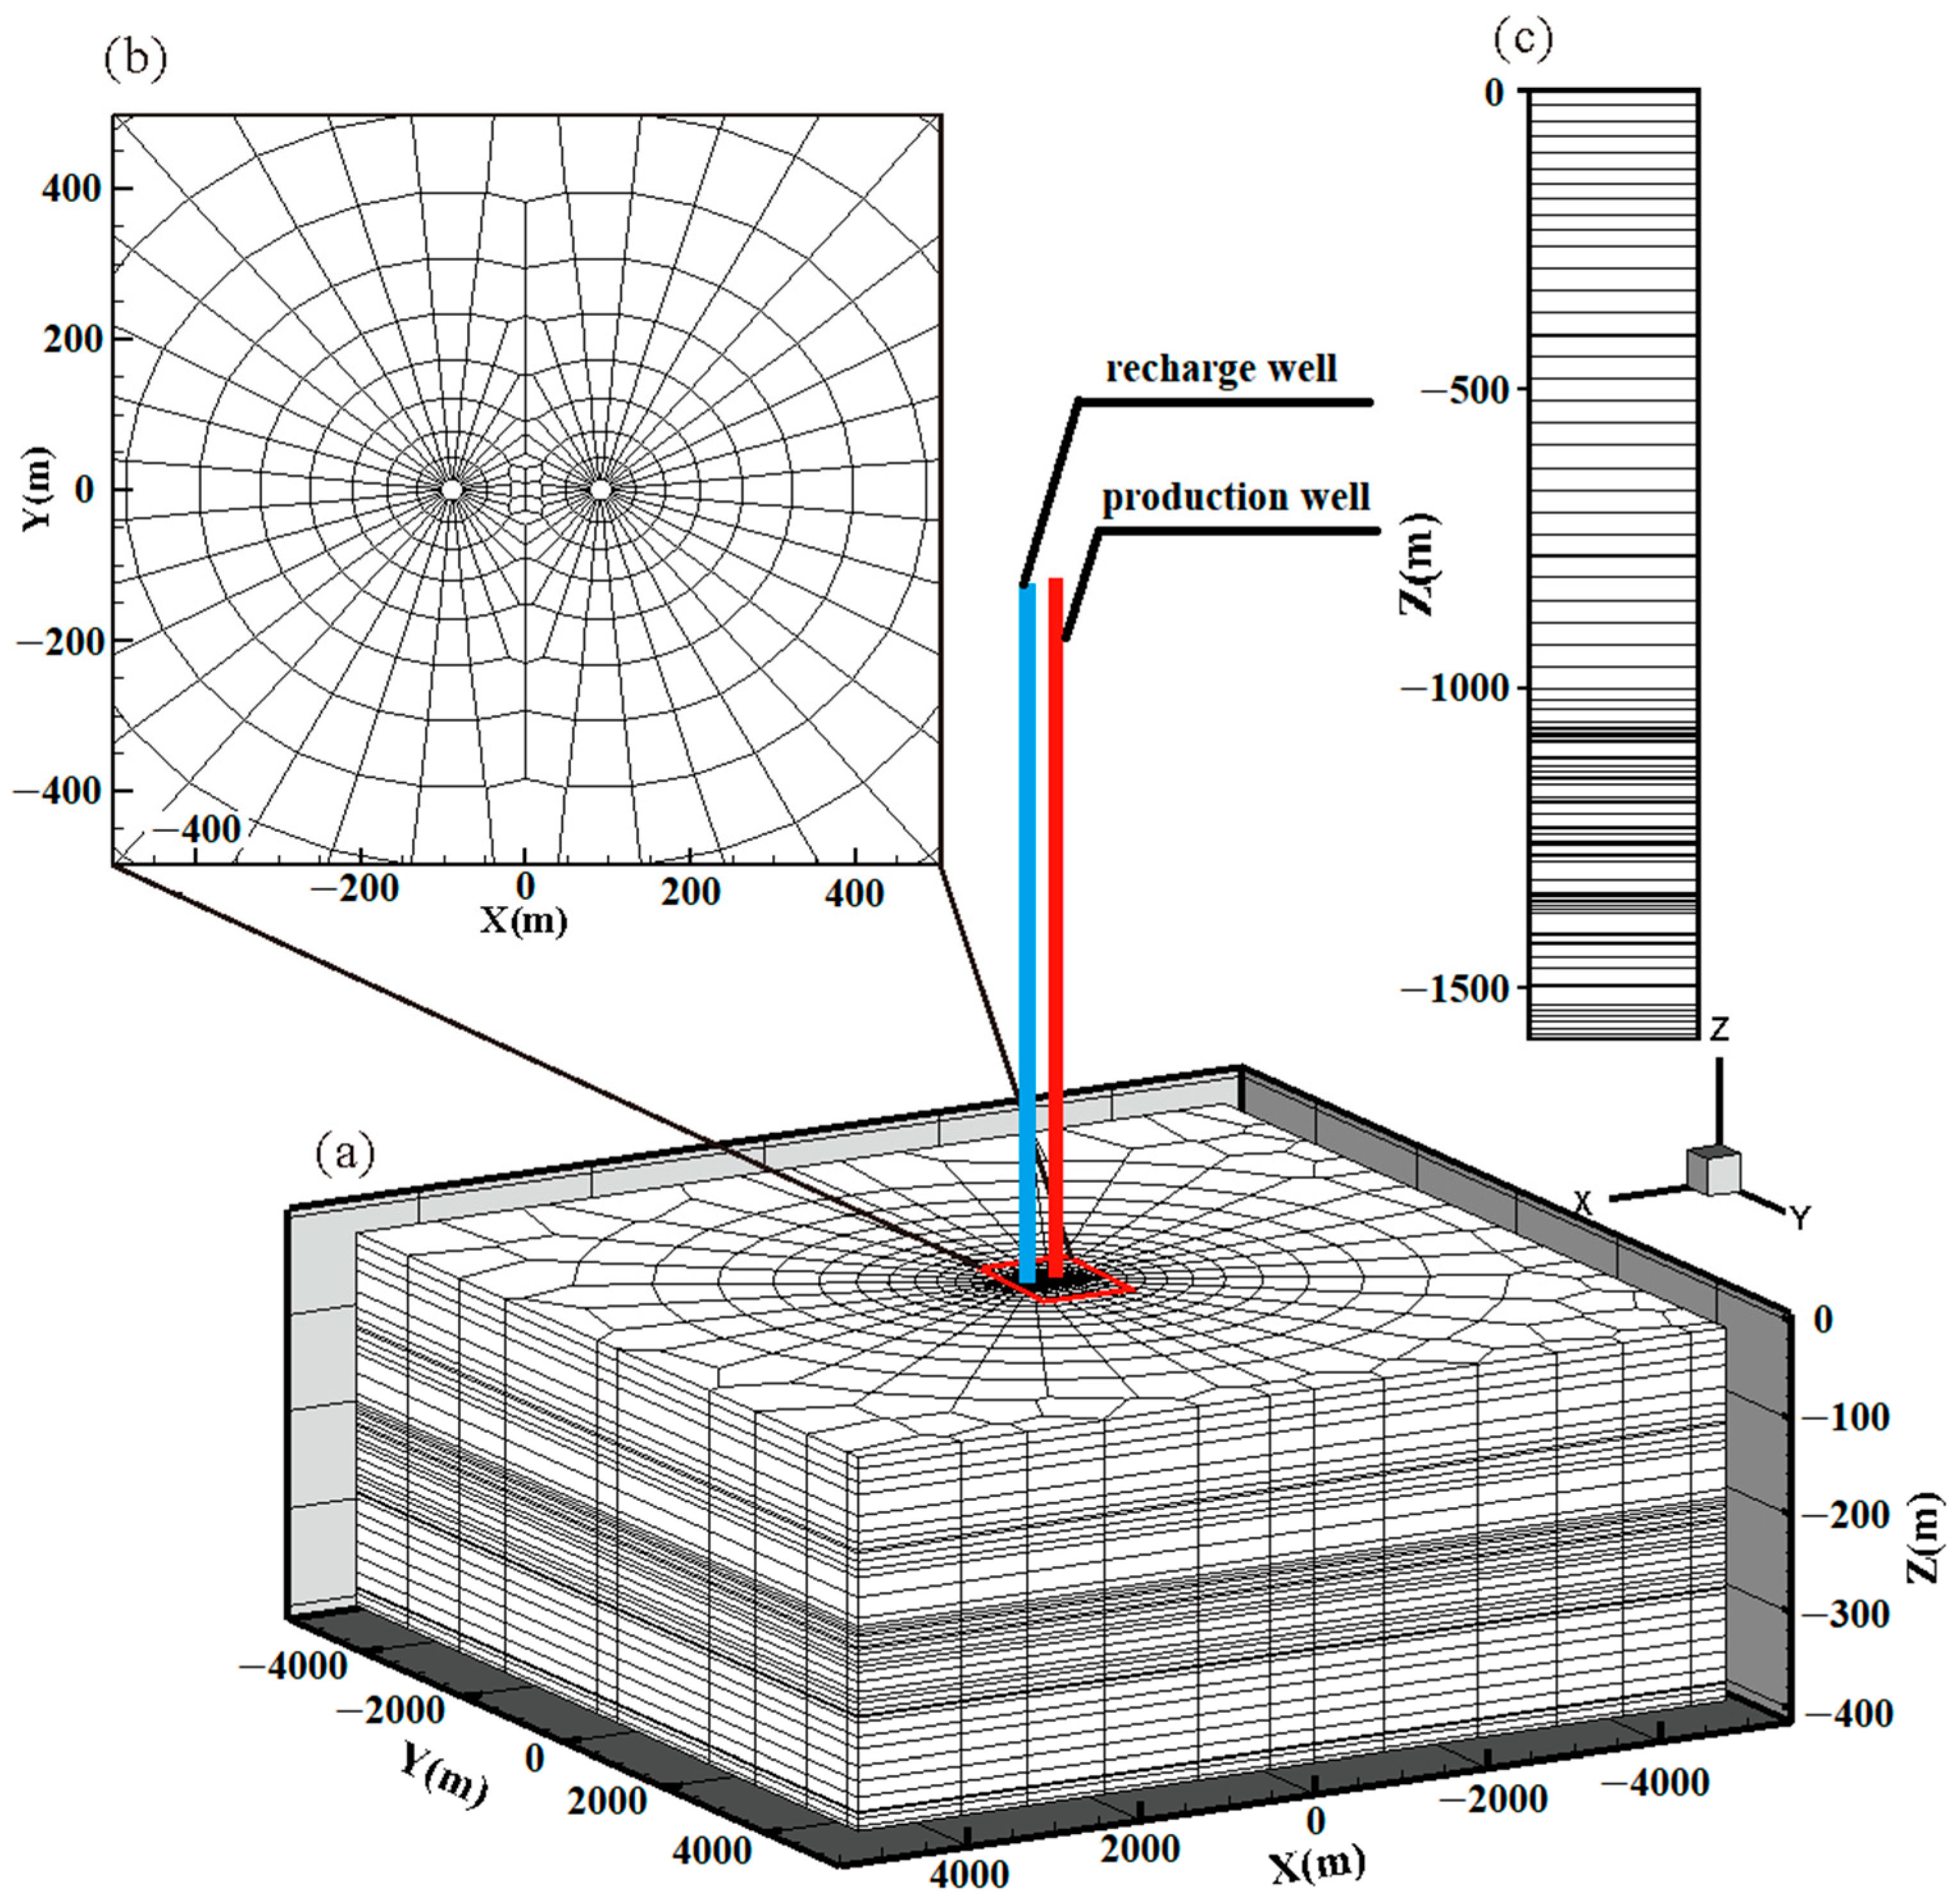
The model is centered on the recharge well and the mining well, selecting a rectangular area of 10 × 10 km2 for simulation, and the model thickness is 394.5 m.
The shaft grid adopts the MESHMAKER 1 D radial section, with a shaft radius of 0.0889 m, from the surface down to an underground depth of 1544.5 m, and a total of 78 layers (Figure 7c). The reservoir grid is divided by TOUGHVISUAL at an underground depth of 1150 m to 1544.5 m. The main simulated layers are the Neogene Formation and part of the Dongying mudstone (Figure 7a); the vertical dispersion is consistent with the dispersion of the shaft below 1150 m. The dispersion amounts to 42 layers, the number of discrete grids in each layer is 846, and the whole model consists of 35,704 grids in the near-well area (Figure 7b).
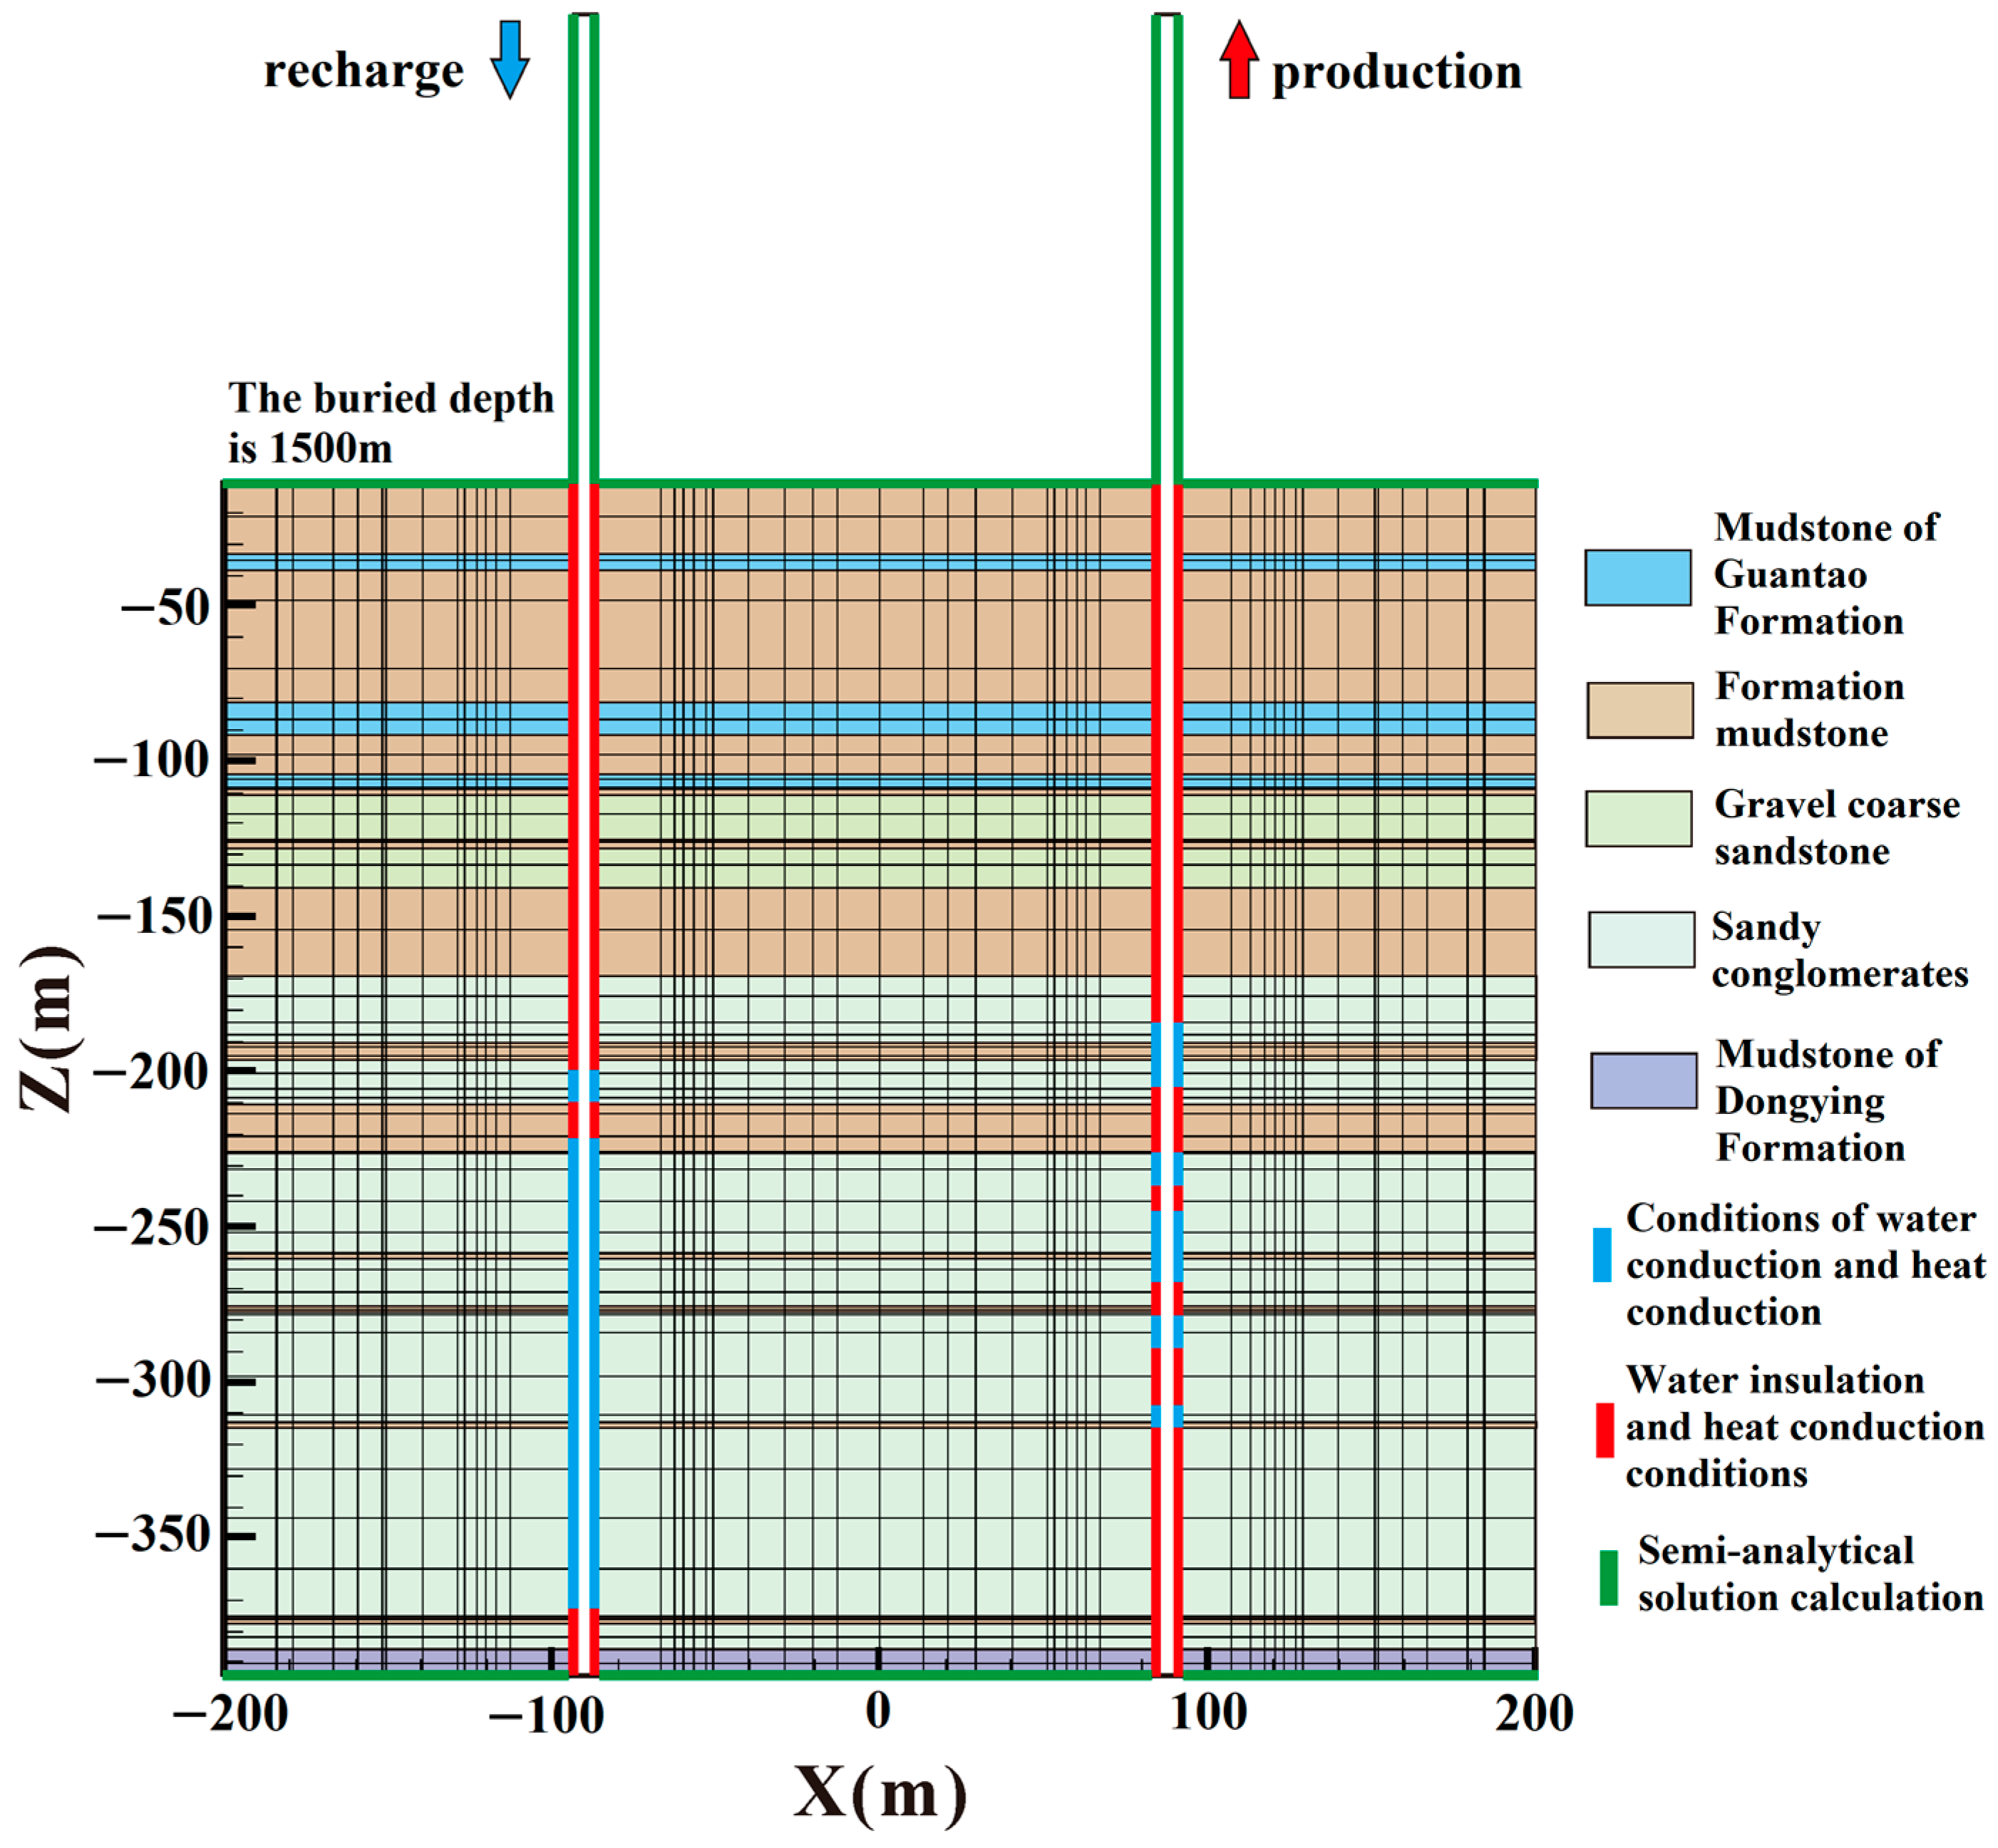
The initial pressure of the model is set according to the hydrostatic pressure; the initial temperature is assigned according to the steady-state temperature measurement data. According to the analytical calculation and measured data, the influence radius of the geothermal well is generally not more than 1.5 km. The simulated lateral boundary is nearly 5 km from the geothermal well, so it can be set as the fixed temperature and pressure boundary; the two wells have fixed flow pumping in the heating season as the given flow boundary. The heat transfer between the heat reservoir and the overlying and underlying strata and the heat transfer between the shaft section and the surrounding rock not connected with the reservoir are calculated by the semi-analytical method. In an actual engineering situation, the filter pipe of the recharge well is located at buried depths of 1343.4~1354.64 m and 1366.4~1524.74 m along the shaft. The filter pipe of the mining well is located at buried depths of 1335.6~1356.32 m, 1376.29~1386.40 m, 1396.55~1417.03 m, 1428.28~1438.87 m, or 1457.14~1464 m, respectively. This part of the bore grid not only performs heat exchange with the reservoir but also conducts water volume exchange. Therefore, it is set to the conducting water and heat conduction condition. The rest of the shaft grids are set to water insulation and thermal conductivity conditions (Figure 8).
To simulate the key physical parameters of each lithology (density), thermal parameters (thermal conductivity and specific heat capacity), and hydrogeological parameters (permeability) according to the actual distribution of reservoir lithology (Figure 8), they were set based on the previous fitting results. The specific settings are shown in Table 8.

3.4. Current Mining and Recharge Conditions and Their Simulation

3.4.1. The Current Mining and Recharge Conditions Are Determined

The recharge overview of the project from 2017 to 2023 is shown in Table 9:
Based on the basic situation of the above six years of recharge, the basic case of the simulation under the current mining and recharge conditions is that the mining well has a yield of 60 m3/h, and the recharge water is recharged in the same period of mining at a temperature of 35 °C.

3.4.2. Simulation Results of the Current Harvest and Recharge Conditions

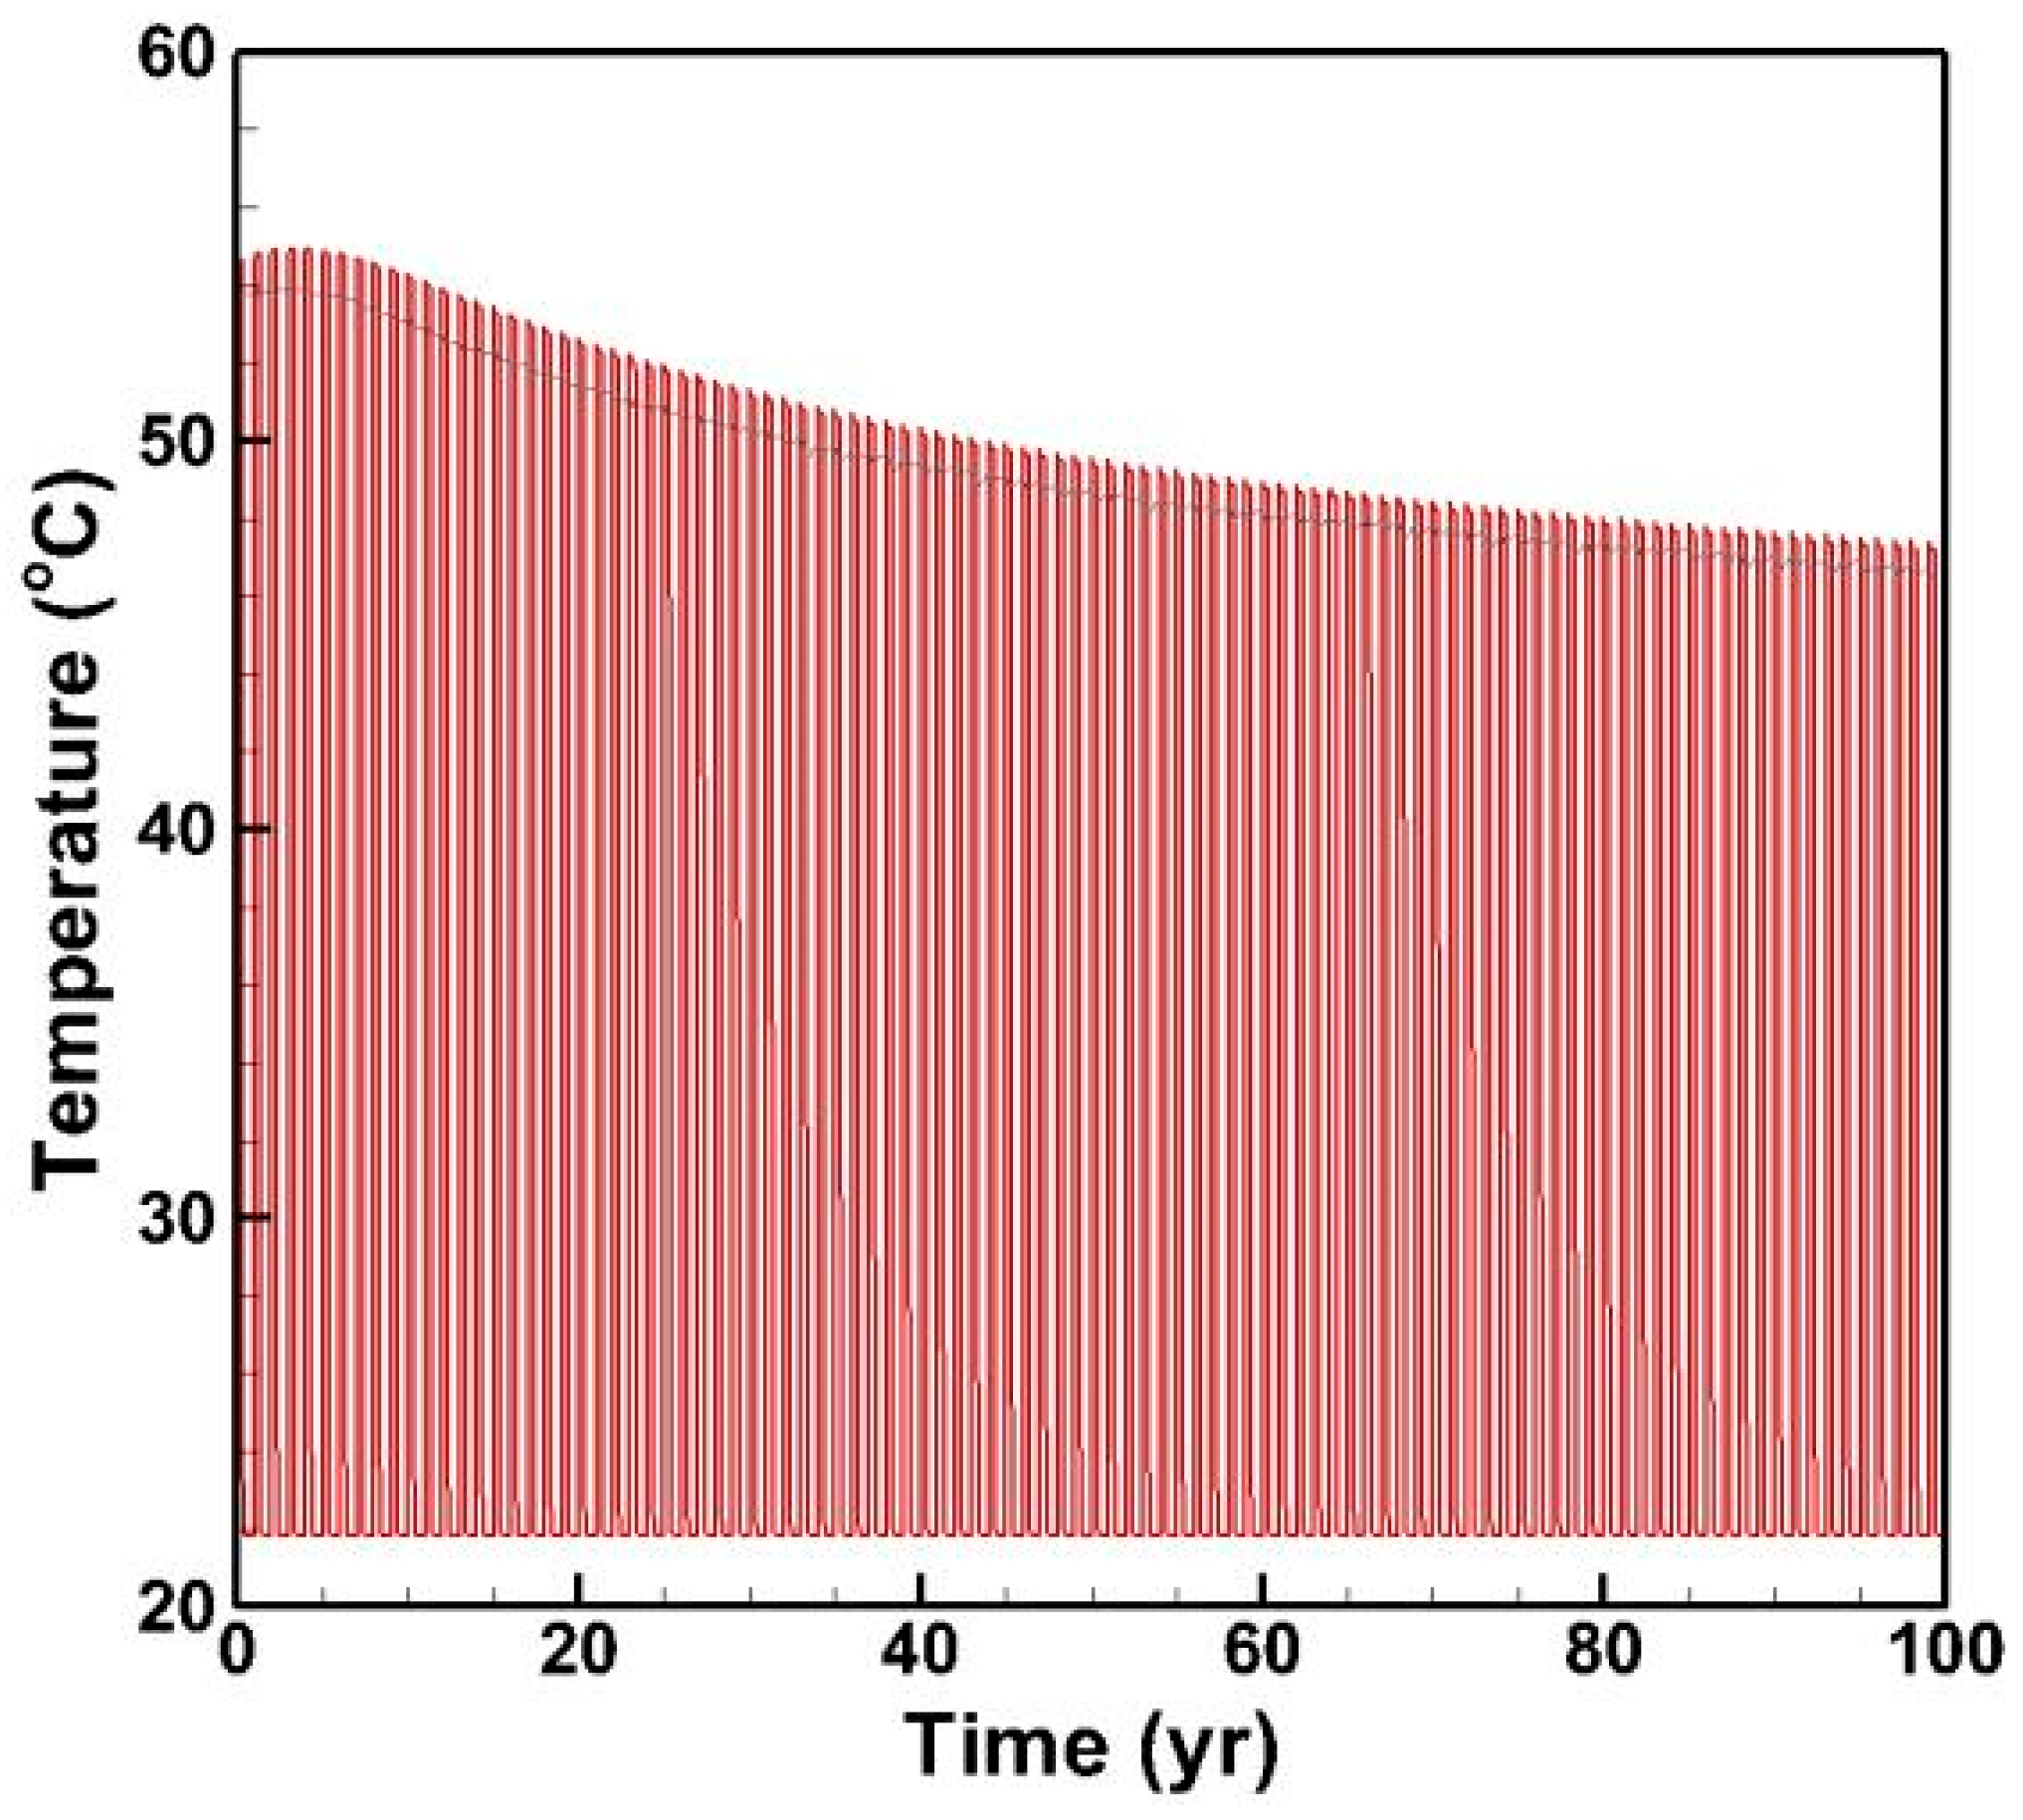
According to the simulation results, based on the recharge process after 10 years, recharge low-temperature water affected the mining well at the bottom of the water section, which also led to a change in the drilling water temperature over 10 years (Figure 9). It is worth noting that the simulation results show that the outflow temperature gradually increased, by about 55 °C; this is basically the same as our measured data (Figure 3). Mainly because the mining well water section position is shallow, from the bottom to the pavilion, and the recharge well recharge section is located at the bottom of the pavilion and the coarse, permeable layer [30], low-temperature cold water tends to move downward, driving the hot water at the production well bottom upward and causing the temperature to be slightly increased; but with continuous recharge, the cold water range gradually expands, and the mining well temperature will gradually decrease, so that 100 years later, the temperature is about 47.8 °C. In addition, with the increasing range of the cold temperature field, the range of horizontal temperature supply becomes progressively larger. This leads to a situation where the temperature at certain positions does not plummet significantly, as illustrated by the production well water temperature curve (Figure 9). In the initial stages, the temperature declines relatively fast and then gradually stabilizes. Therefore, establishing a reasonable distance between extraction and recharge wells can effectively prolong the influence period of the cold temperature field on the extraction well, thereby extending the service life of geothermal wells.

4. Geothermal Exploitation Optimization Scheme

According to the prediction results of hydrological model, under the scenario of a well spacing of 180 m and a flux of 60 m3/h, the low-temperature front reaches the production well. Three other scenarios are given to discuss the influence of circulation flux and recharge temperature on heat extraction behavior, low-temperature front movement, and system lifespan.
(1)
Scheme 1: lower recharge temperature and circulation flux, keeping almost the same heat extraction rate as the base case;
(2)
Scheme 2: Maintain constant reinjection temperature while reducing reinjection flow rate;
(3)
Scheme 3: The system terminates when the outflow temperature drops to a certain value;

4.1. Lower Recharge Temperature and Circulation Flux with the Same Heat Extraction Rate (Scheme 1)

In order to explore the reasonable mining and recharge capacity of 180 m in this project, it is proposed that the recharge temperature can be reduced under the same heat extraction, so as to increase the heat temperature difference and reduce the recharge volume. At the same time, according to the survey, some experts and enterprises also put forward the maximum use of a geothermal water scheme that extracts the mining water temperature to the minimum and then recharges, which can reduce the mining amount, ensure 100% recharge, and also save costs. Accordingly, we have set up this simulation.
On the basis of the above model construction, the low temperature and low capacity of geothermal field changes (referred to as the low-temperature recharge scheme) are considered in order to ensure heat transfer efficiency as the premise, where, on the basis of the existing recharge rate (60 m3/h, recharge temperature 35 °C), the capacity and recharge water temperature are changed, using a set of low-temperature recharge cases, with a recharge temperature of 20 °C. According to the heat of the same, calculated by Equation (11), the recharge rate is 33.5 m3/h.
QH = ρw cwQ (T1T2)
among which:
QH—heat extraction rate (W);
ρw—fluid density (kg/m3);
cw—specific heat capacity of water [J/(kg·°C)];
Q—pumping and recharging rate (m3);
T1—water temperature of the mining well (°C);
T2—recharge temperature (°C).
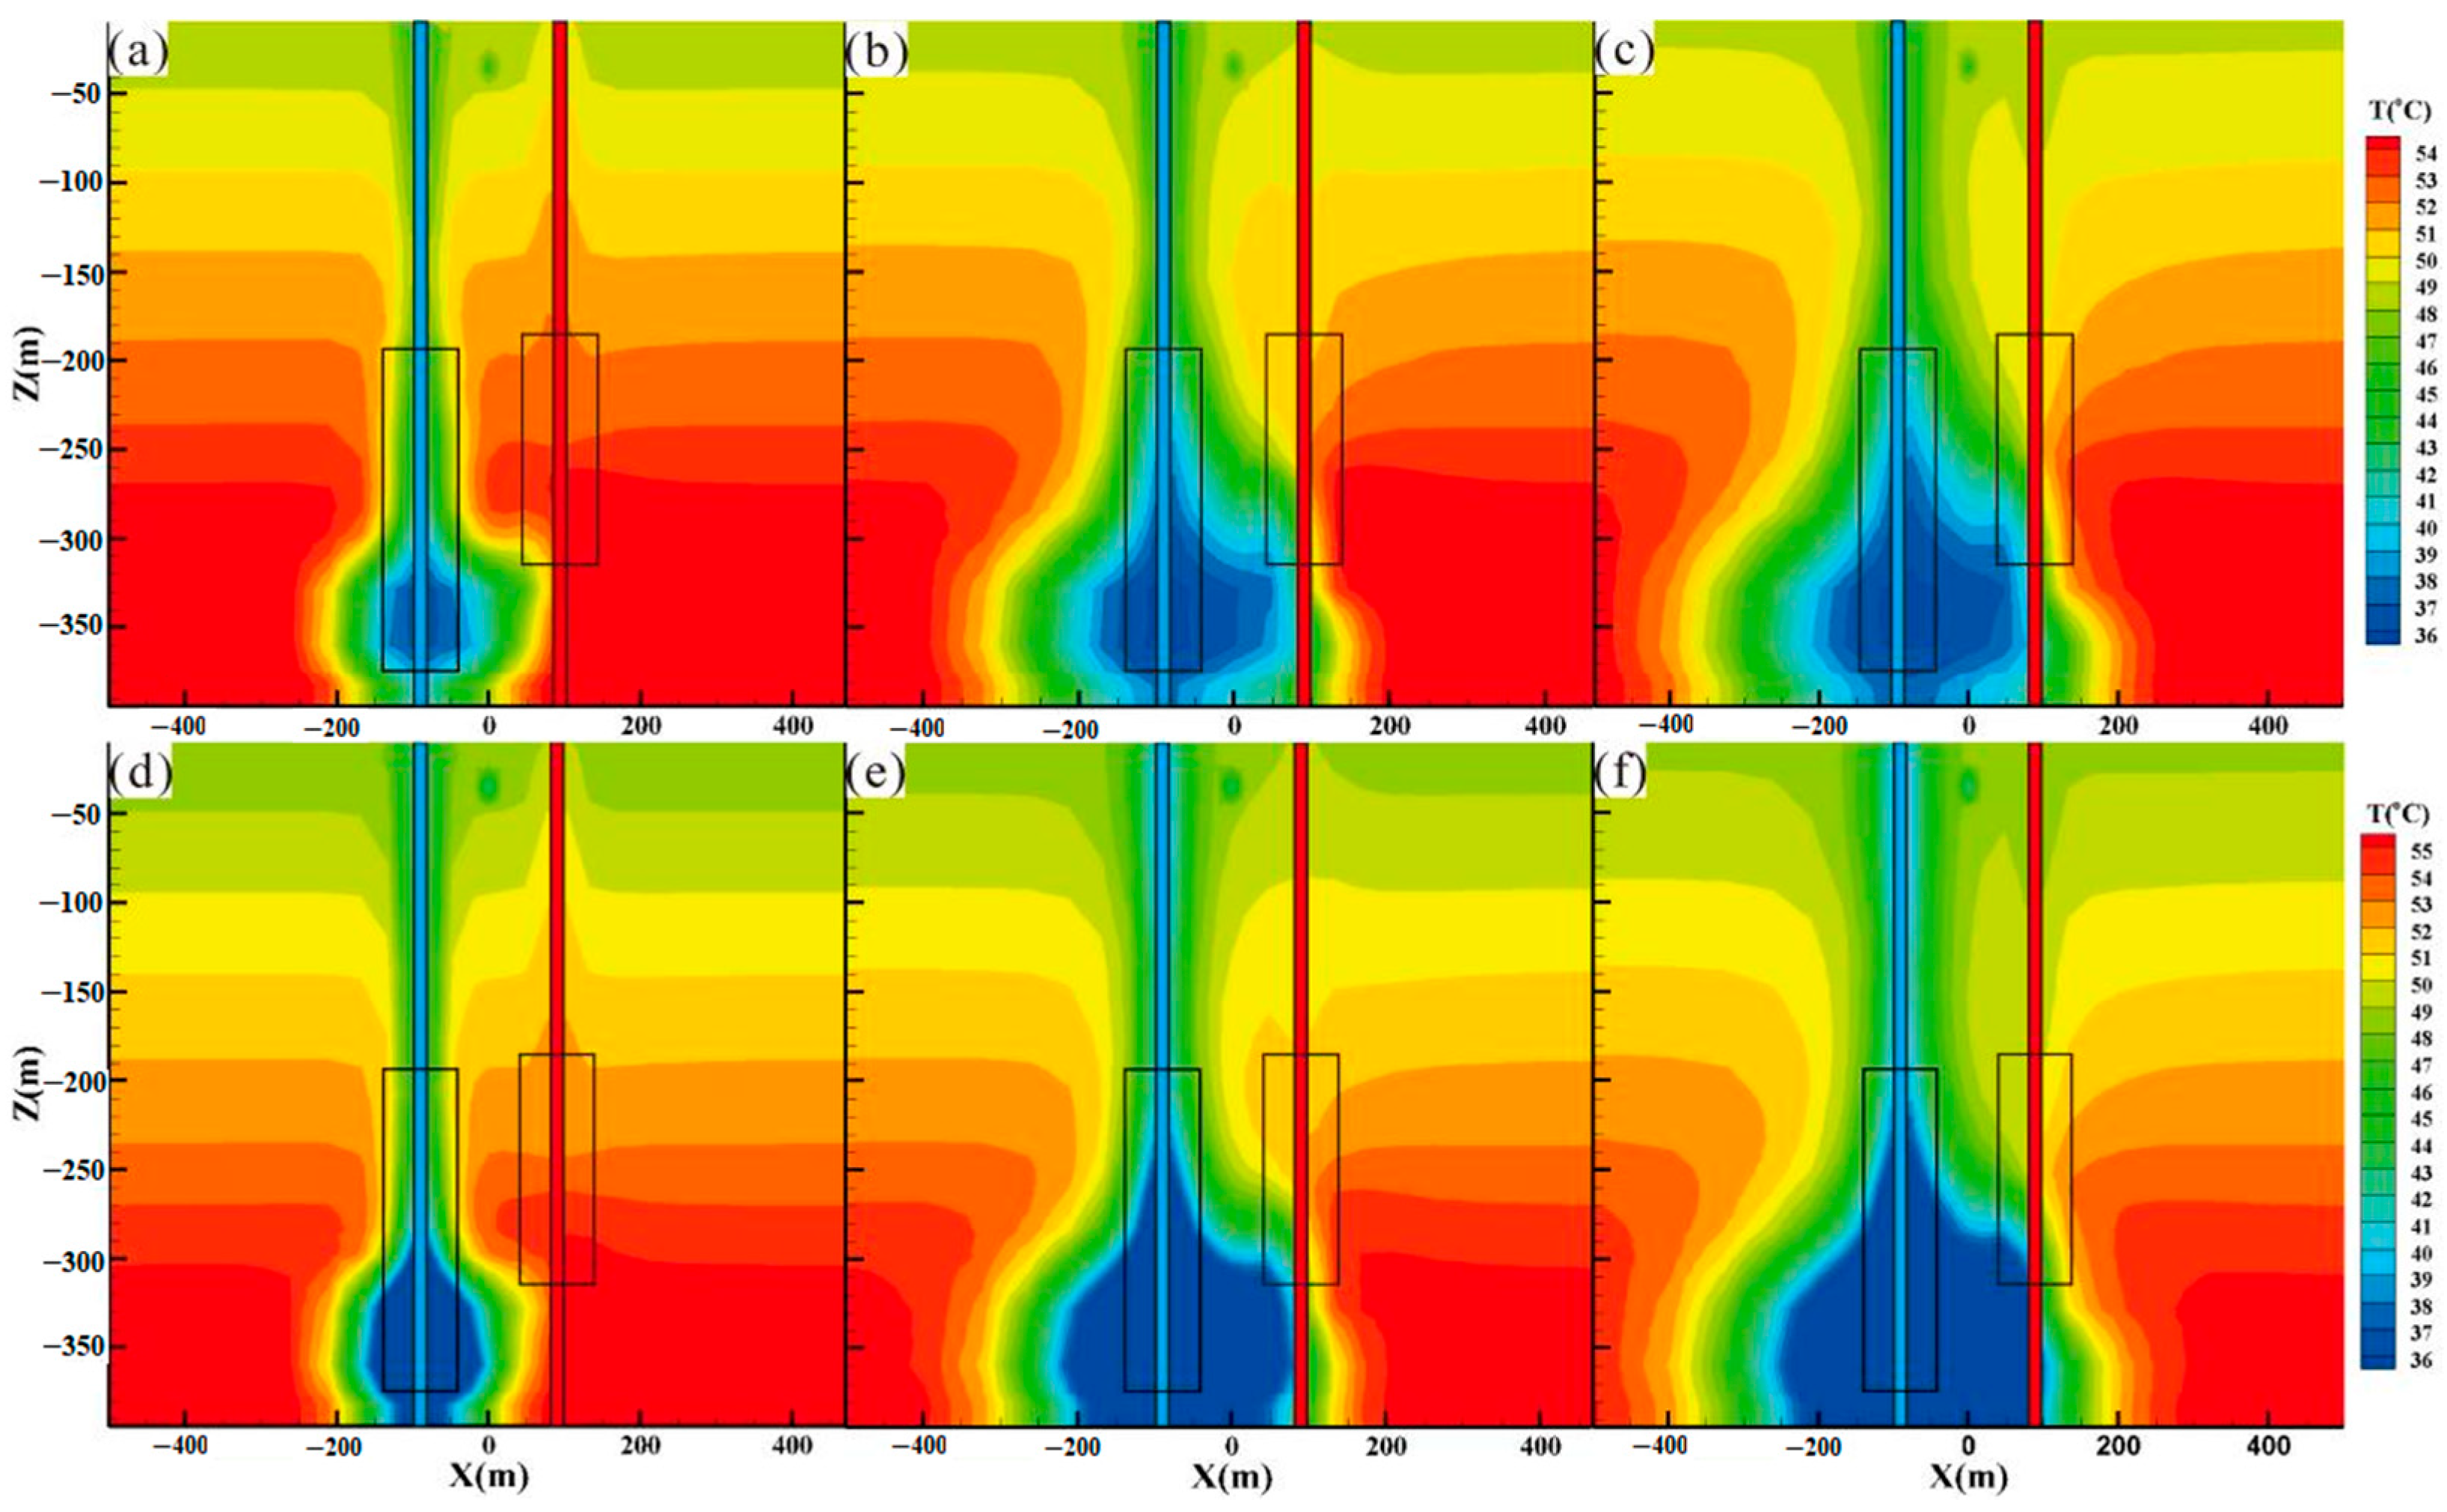
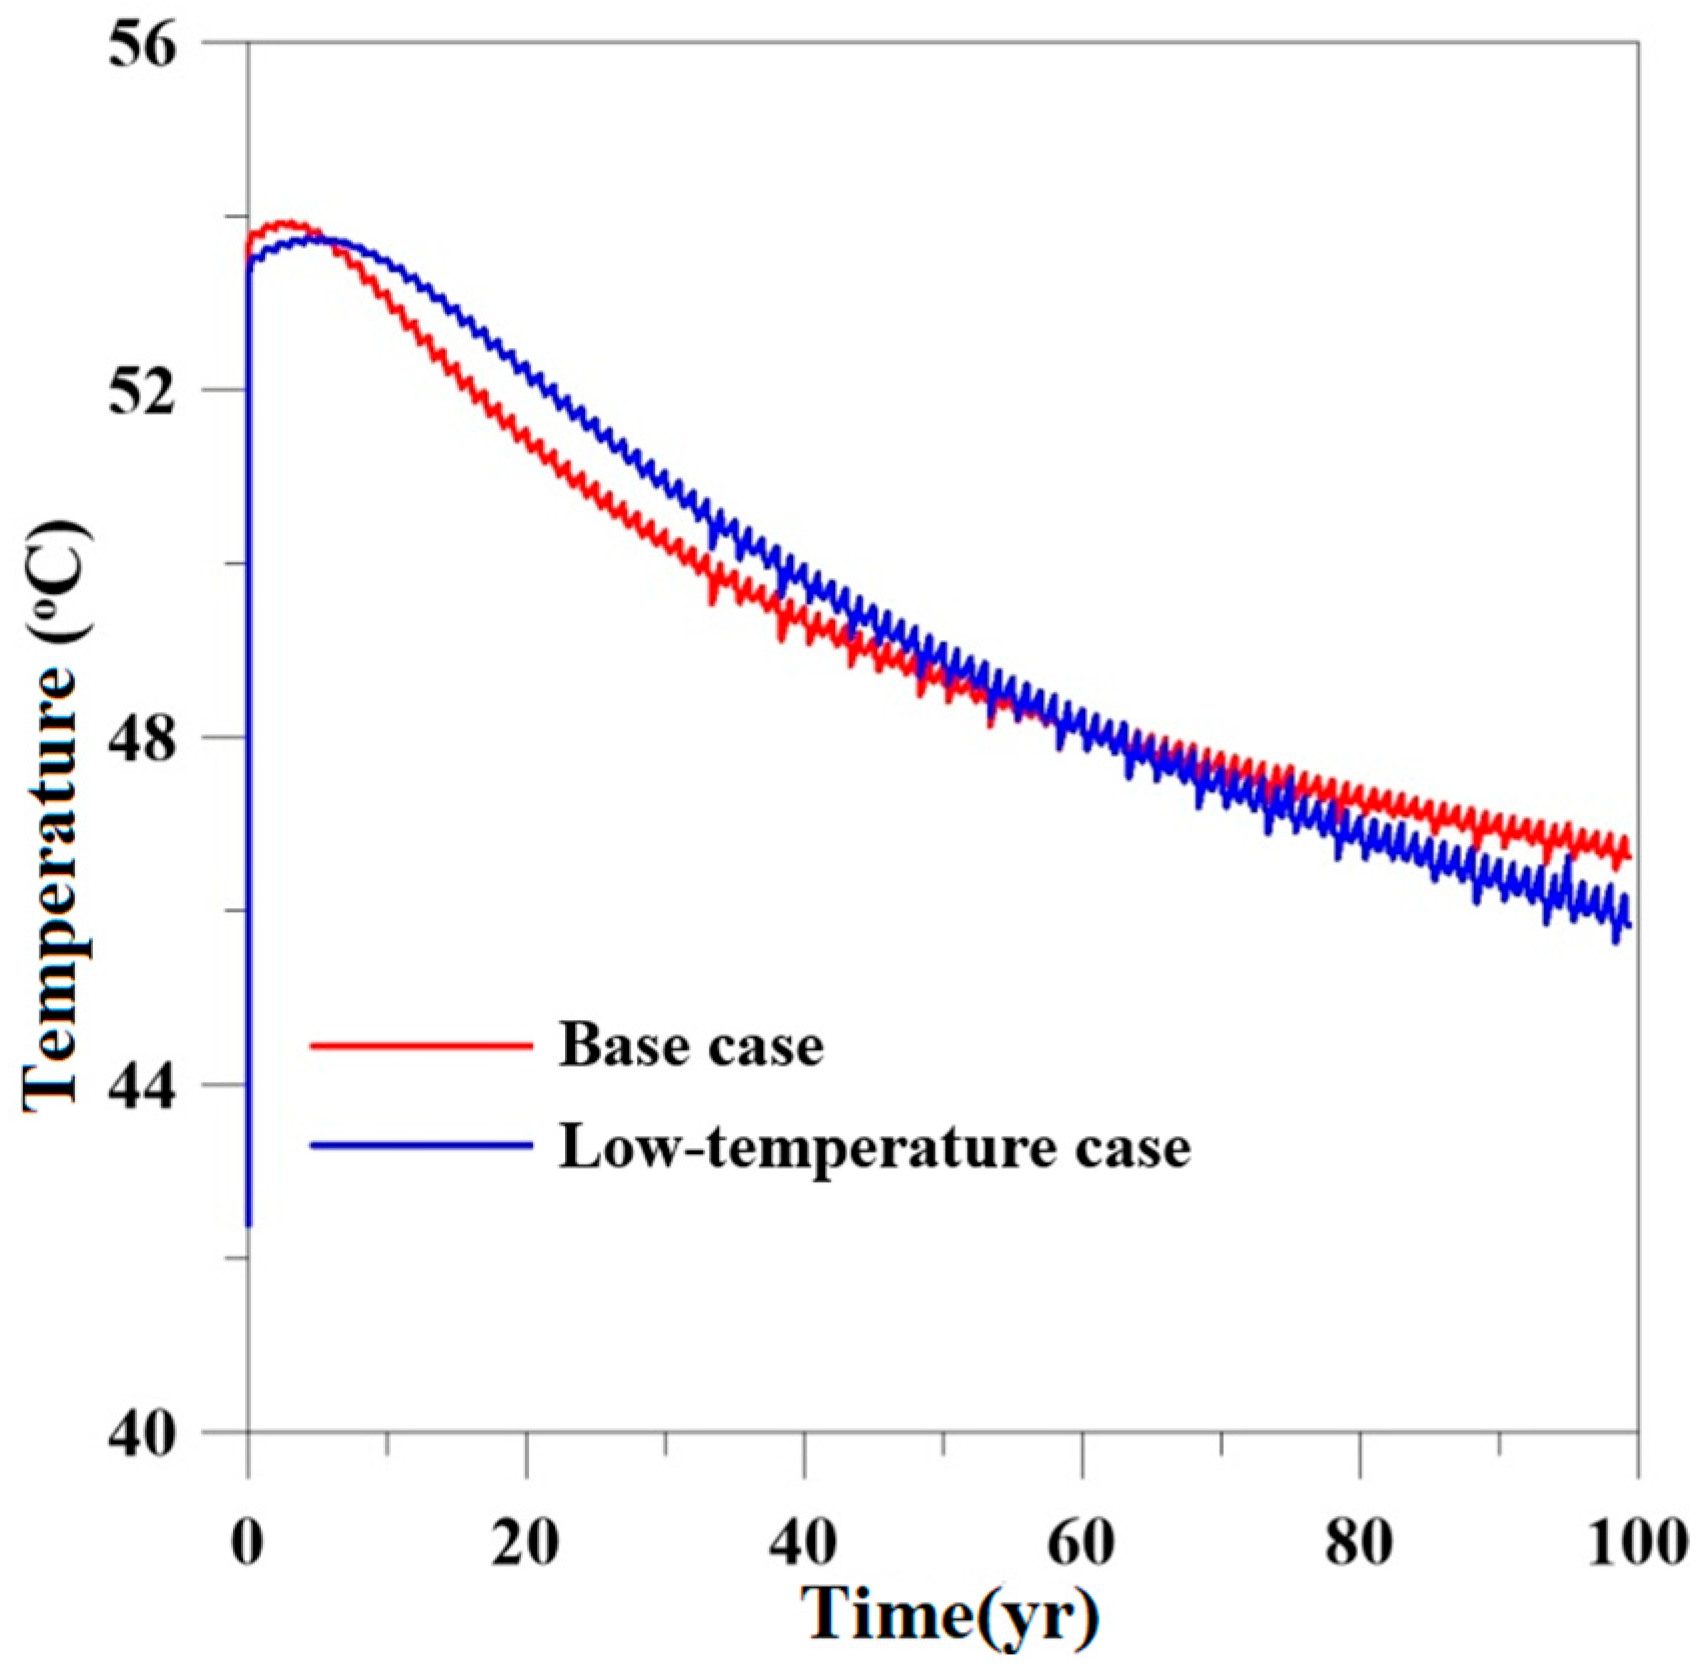
The simulation results are shown in Figure 10, roughly the same as the prediction results of the basic case (current mining conditions), but the range of the low temperature recharge scheme is large. For example, compared with the lateral distribution diagram of 50 and 100 years (c and f) under the two mining and recharge schemes, the distribution and range of water in the influence area below 50 °C in the reservoir are basically the same. When recharging with 20 °C water, the influence range of water lower than 35 °C is greater. In addition, due to the small flow of recharge and the short recharge time, the outlet temperature of the mining well is affected (Figure 11, Table 10). After 60 years of mining and recharge, the low-temperature water spreads to the mining well, and the outlet temperature drops below the outlet temperature of the basic case.
In conclusion, the transport distance of the low-temperature front is basically the same as the current condition, and the influence of the water temperature during the mining period is less than the influence of the current condition. Therefore, when the distance of the project is only 180 m, the water temperature decreases.

4.2. Keep the Mining and Recharge Temperature Unchanged and Reduce the Mining and Recharge Capacity (Scheme 2)

The above simulation shows that when the heat extraction is the same, the temperature of the production well cannot be guaranteed to remain the same, so whether the cooling temperature field of the project will affect the production well is uncertain. Therefore, the suggestion of keeping the production and recharge temperature unchanged and reducing the production and recharge flux is made.
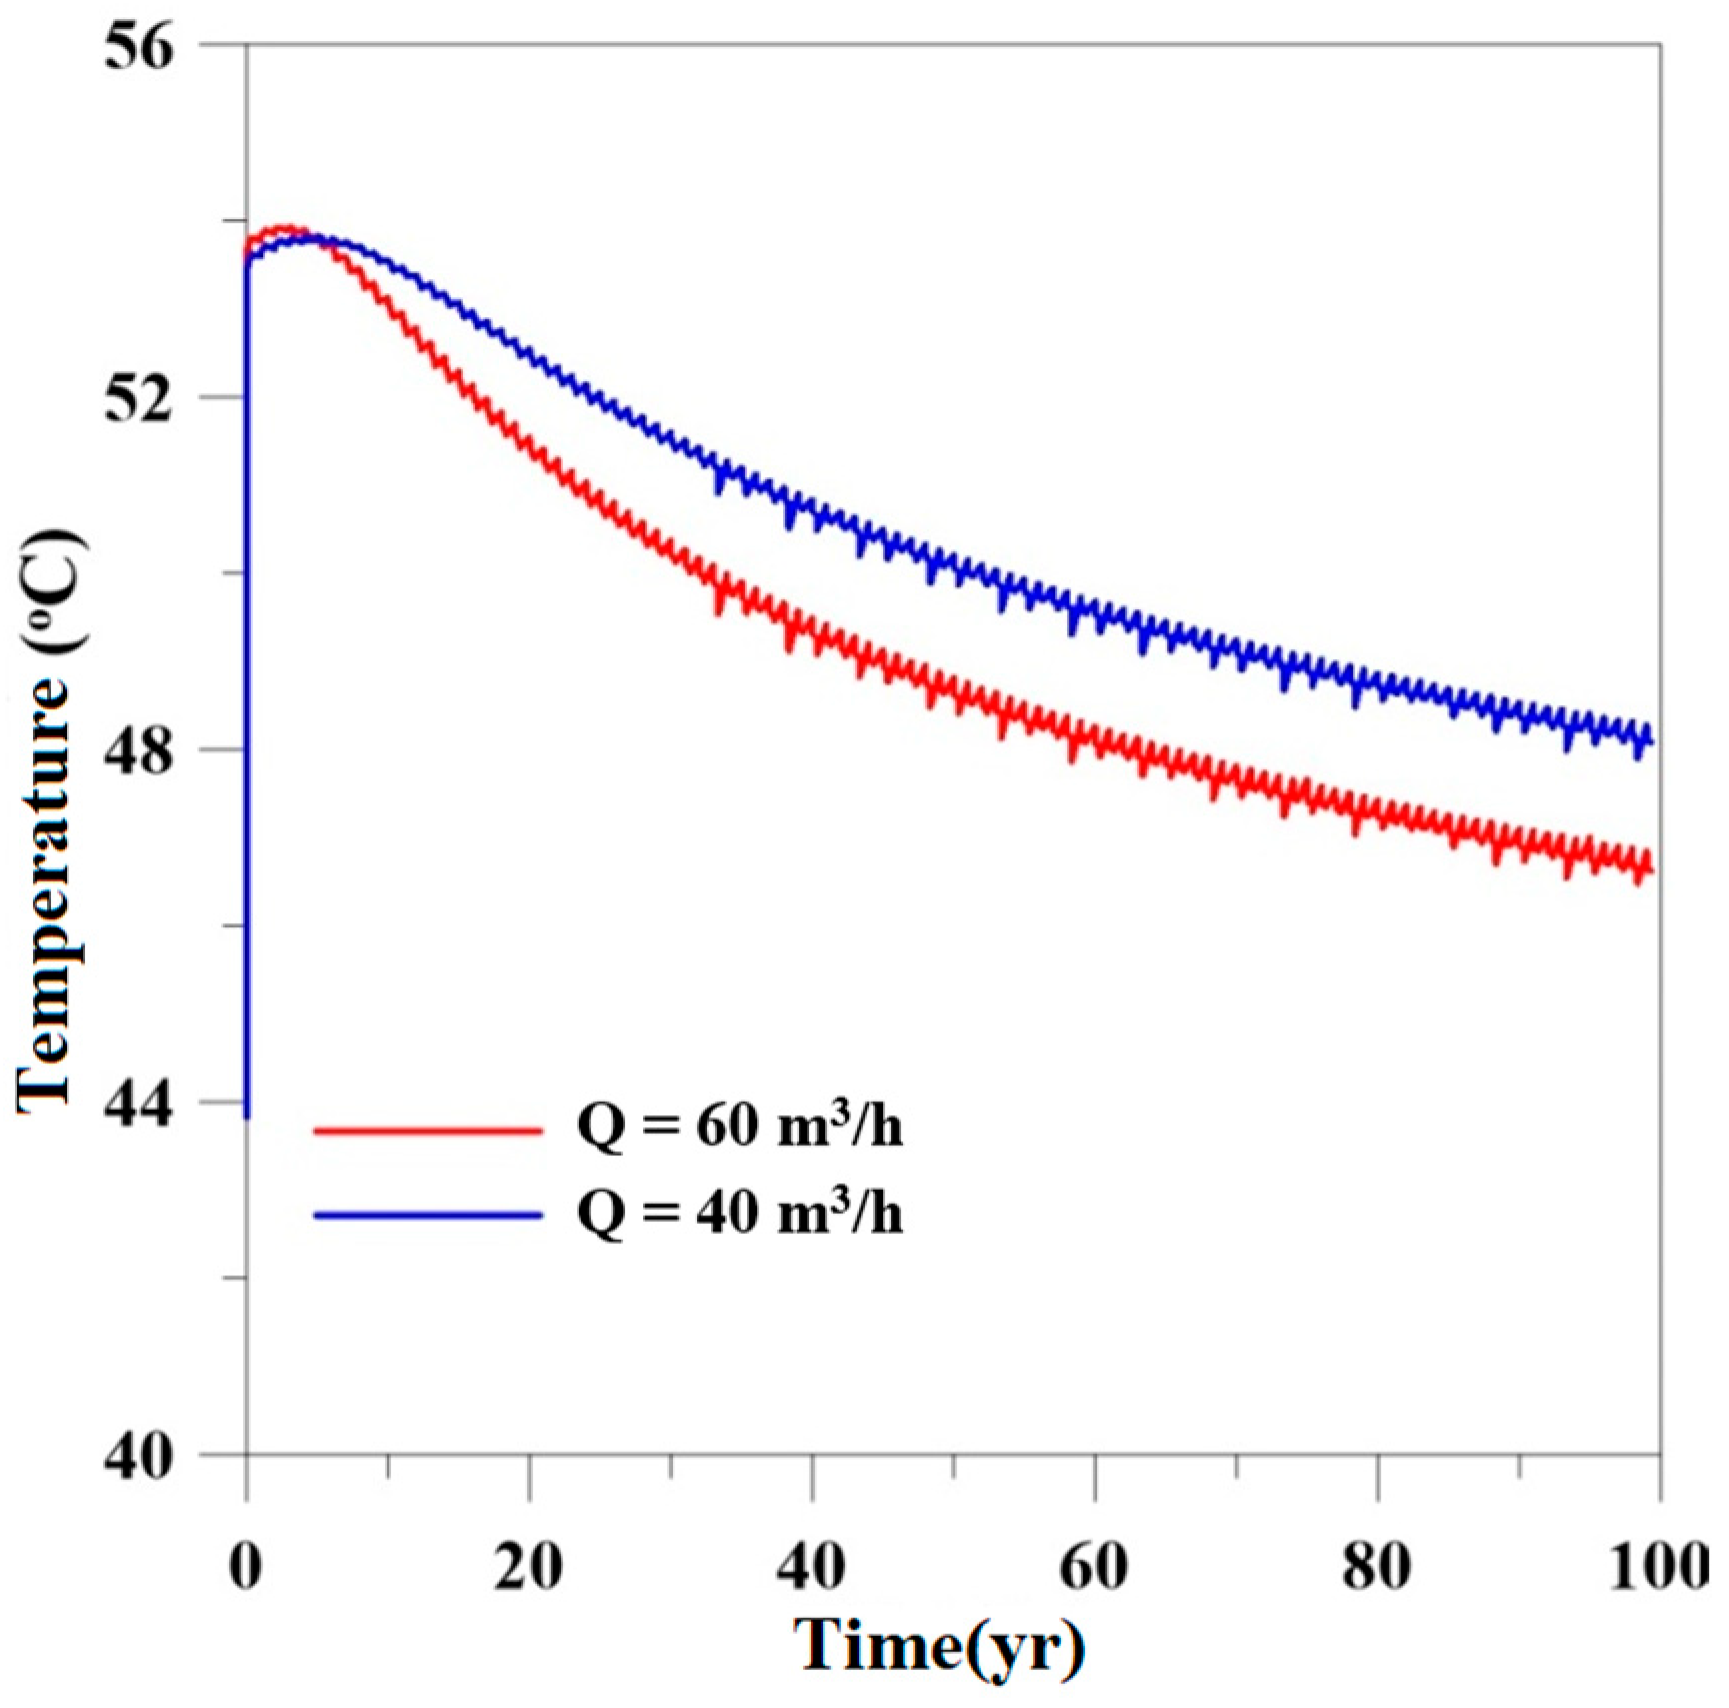
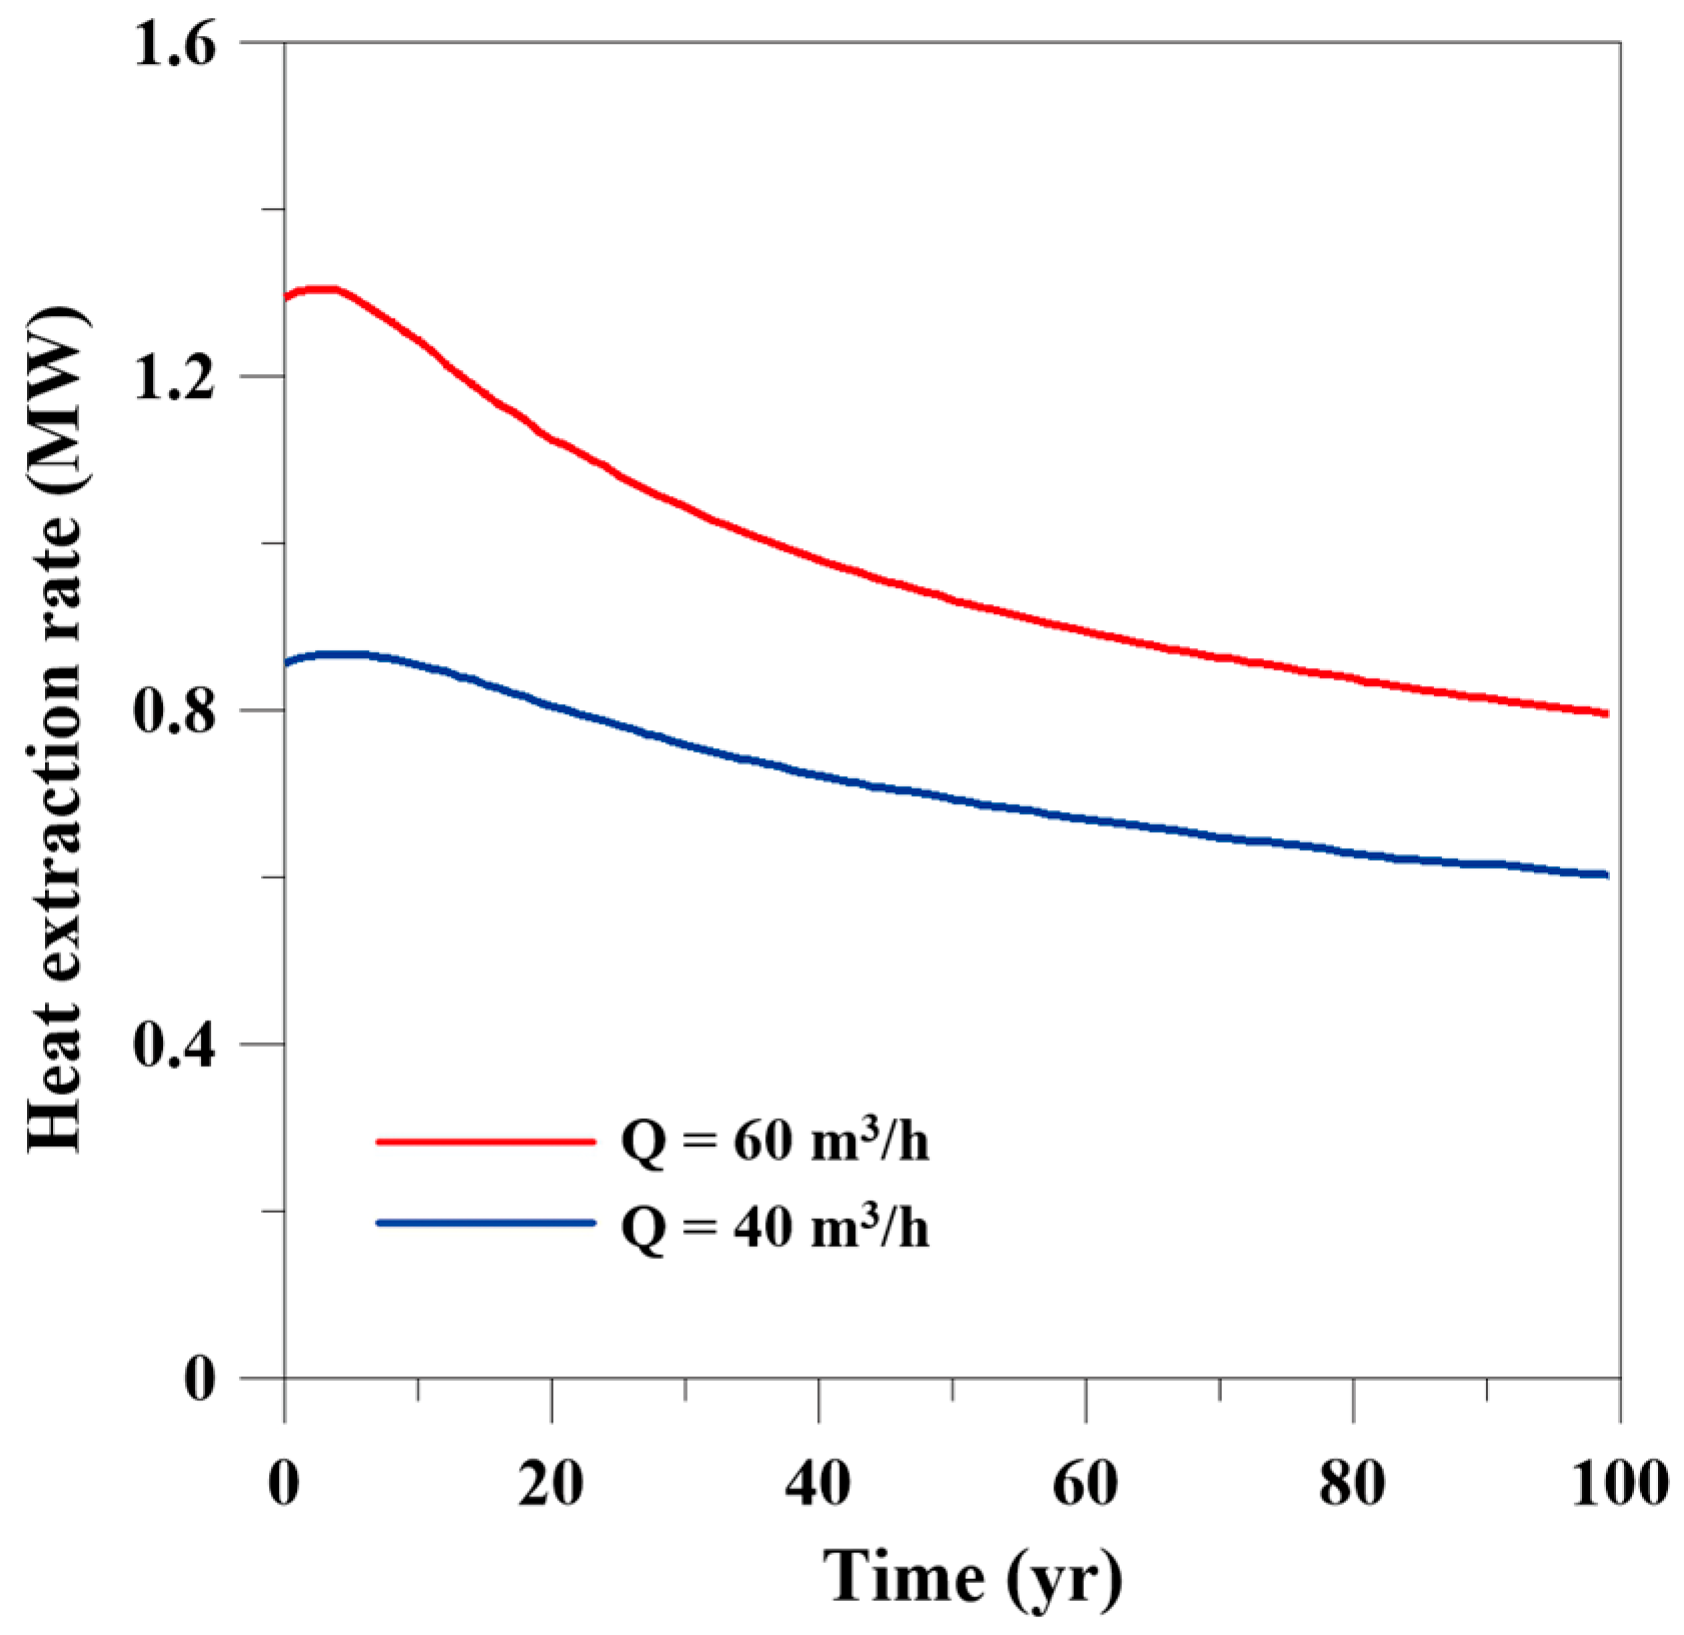
On the basis of the above cases, the production and recharge capacities were reduced to 40 m3/h at the same time to explore the change in the regional temperature field during 100 years of continuous production and recharging. Compared with the change in effluent temperature over time under two different production and recharge conditions, it can be seen that in the initial operation (about 6 years), at the rate of 60 m3/h, the displacement of underground hot water in the shaft was faster. Therefore, the outlet temperature at the rate of 60 m3/h was slightly higher than the outlet rate of 40 m3/h (Figure 12). With the passage of running time, the production well in the large flow production and recharge scheme was affected by heat breakthrough earlier, the effluent temperature began to drop earlier, and the water temperature dropped faster. After 50 years of 60 m3/h recharge heating, the temperature dropped to 48.6 °C and to 46.6 °C within 100 years; after 50 years, the temperature dropped to 50.1 °C and to 48.2 °C within 100 years (Table 11).
In energy extraction engineering, energy efficiency analysis is generally carried out by thermal extraction efficiency (Wh):
W h   =   Q out h out Q inj h inj
Qout: output fluid rate;
Qinj: the rate of recharge fluid;
hout: the thermal enthalpy of the output fluid;
hinj: the thermal enthalpy of the recharge fluid.
In the current mining scheme, with a mining and recharge flow of 60 m3/h, the heat extraction efficiency decreases rapidly within 10 years. After 50 years, it is reduced from 1.3 MW to 0.9 MW in 100 years and to 0.8 MW in 100 years. According to the heating demand of 35 W per square meter in Shandong, the heating demand area within 50 years is 37~27,000 m2, and the heating demand area that can be met after 100 years is 23,000 m2. In the simulation scheme with a mining and recharge capacity of 40 m3/h, the thermal extraction efficiency is reduced from 0.87 MW to 0.7 MW within 50 years, and the heating demand area is 25,000–200,000 m2. After 100 years, the thermal extraction efficiency is 0.6 MW, which can meet the heating demand for an area of 17,000 m2 (Table 12).
The difference in thermal extraction efficiency between the two regimens is mainly caused by the different mining and recharge capacity. Due to the smoother change in water production temperature in the exploitation of the 40 m3/h flow rate, the change in thermal extraction efficiency is also smaller than the change in the 60 m3/h base scheme (Figure 13).
Due to the small spacing between production and recharge wells in the study area (180 m), combined with the actual heating demand of the research area, the water production temperature should not be too low. To ensure water temperature within 50 °C, the flux of production and recharge should be set at about 40 m3/h, but under the condition of recharge, the production well water temperature will still be affected after 10 years.

4.3. Suspand When Outflow Temperature Drop to a Certain Value (Scheme 3)

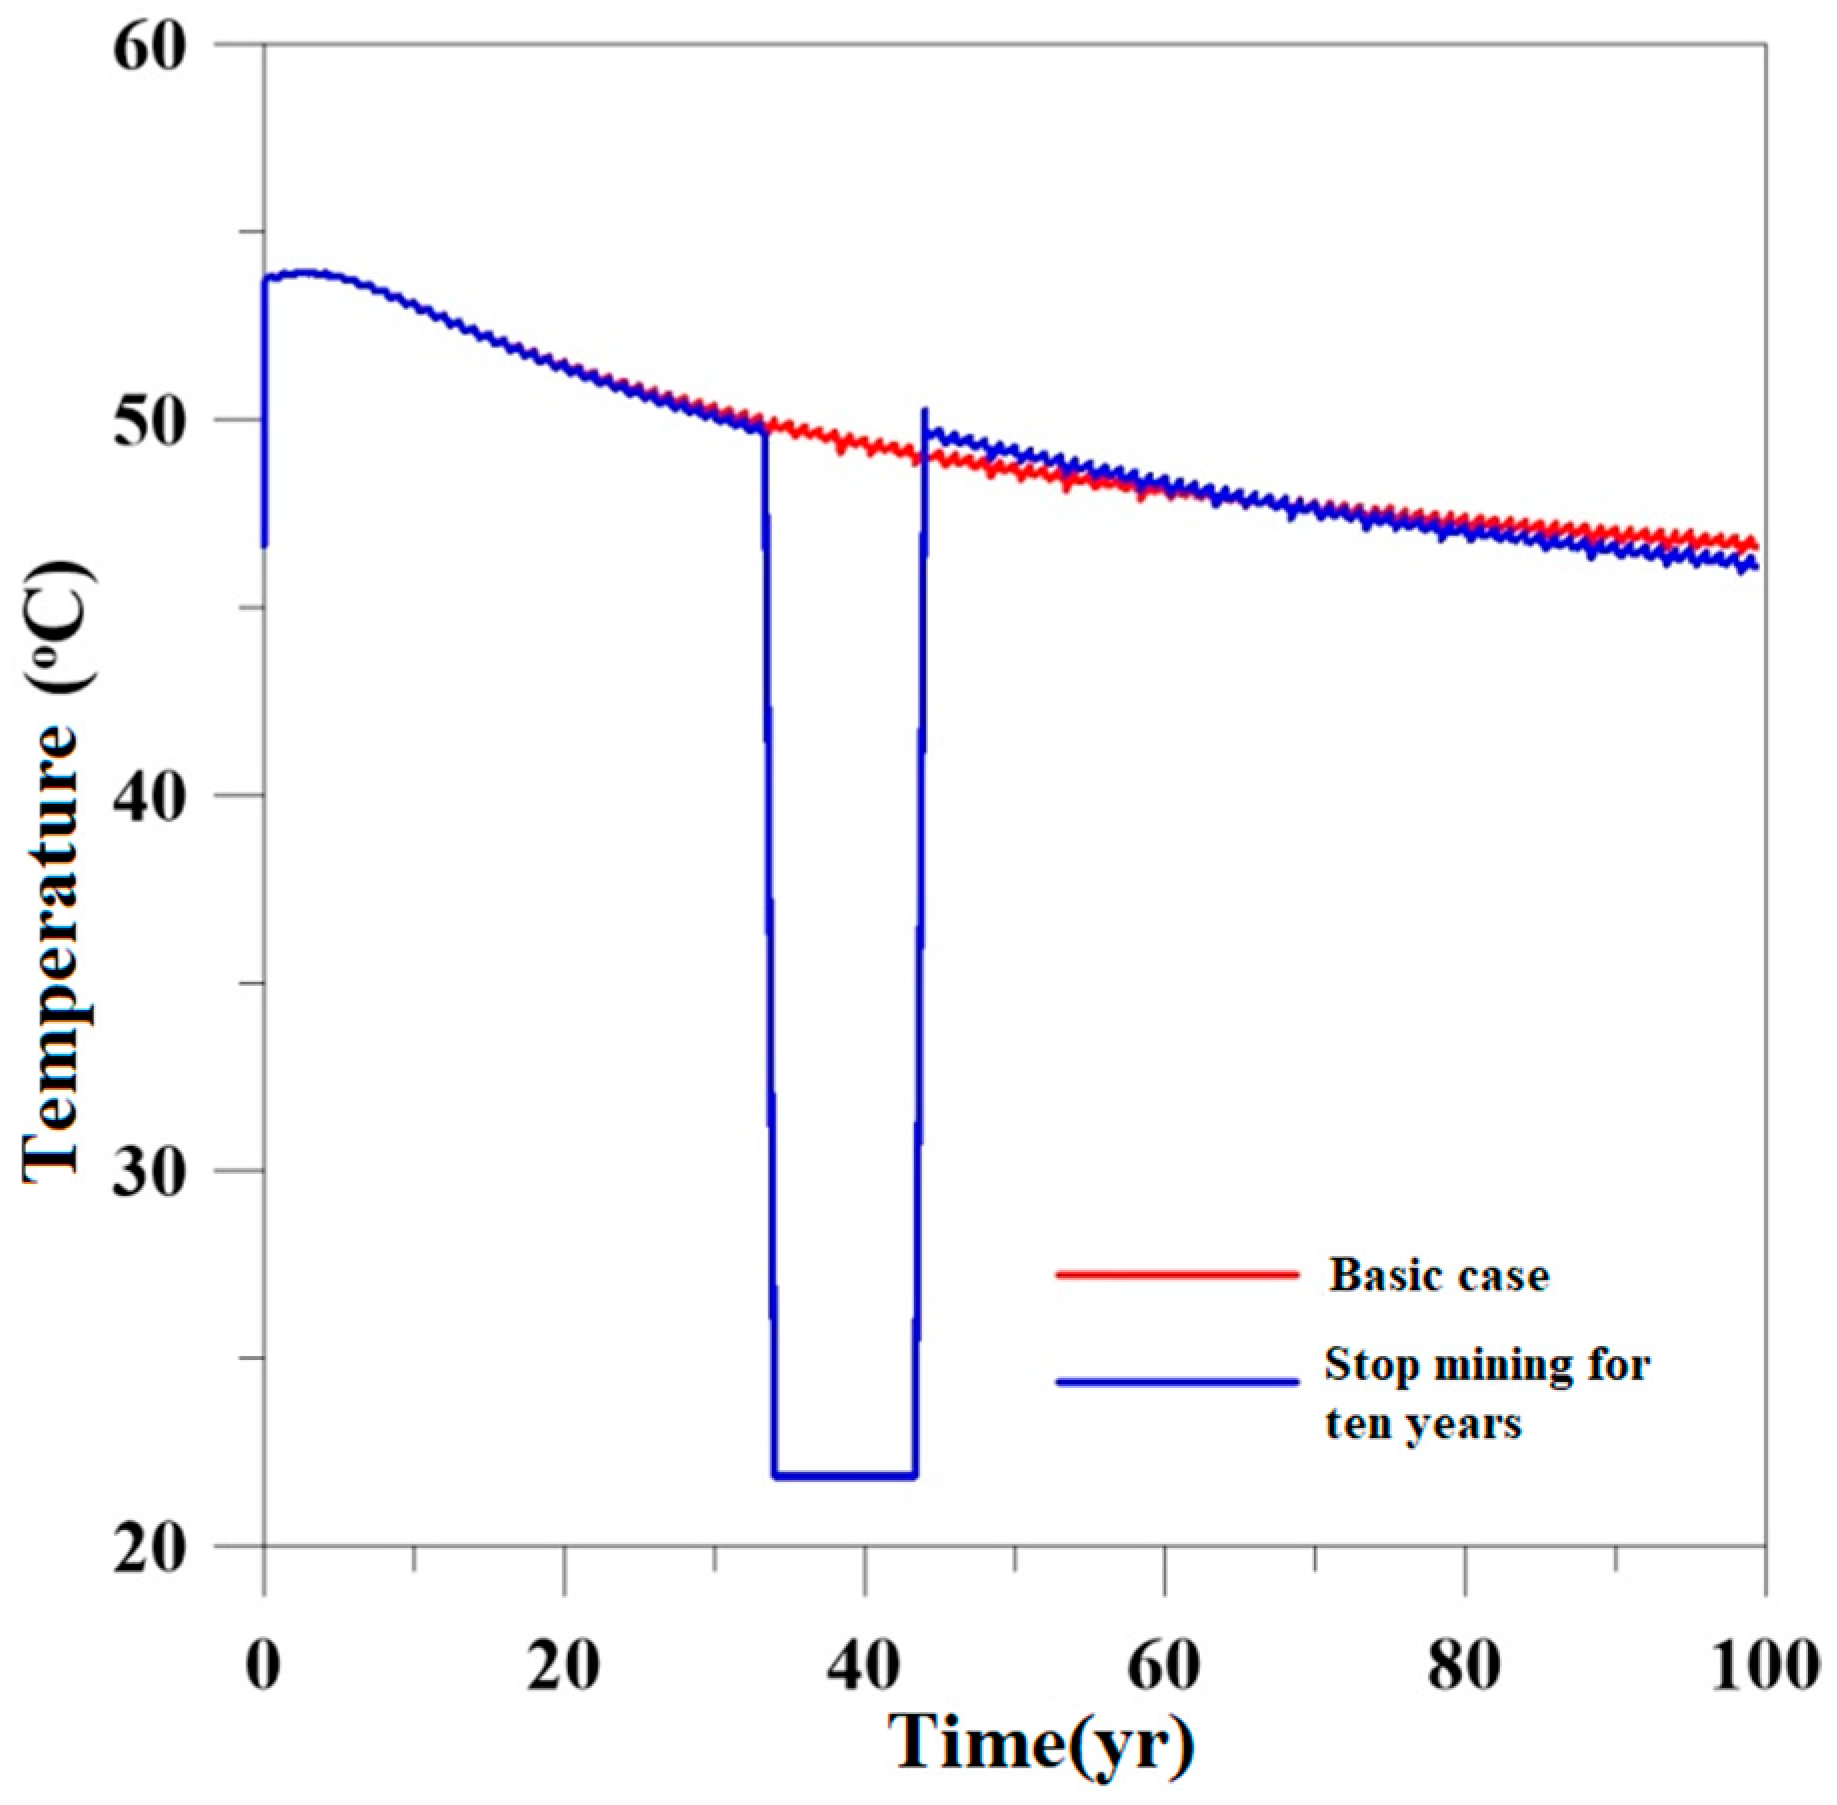
According to the above forecast, under the condition of a distance of 180 m between production and recharge wells in this project, with increasing recharge each year, the cooling temperature field will affect the water temperature of the production well, causing it to decrease to a certain temperature, affecting the heating effect. After temperature recovery, to determine whether the temperature will recover to the initial temperature within the limited life, the temperature recovery forecast after shutdown is added.
In order to reduce the impact of continuous exploitation on the reservoir temperature, on the basis of the basic case, the exploitation was stopped in the 34th year when the outlet temperature decreased below 50 °C. After the reservoir temperature recovered, the extraction was resumed to observe the recovery of the outlet temperature. The prediction results are shown in Figure 14. After 33 years of harvesting and recharge, the outlet temperature decreased to below 50 °C, stopping the production and recharge process, with a 10-year period of water temperature and water level recovery. After stopping the pumping, the wellhead temperature quickly returned to the initial temperature of 21.85 °C. Ten years later, well was used again. In the 44th year, the effluent temperature was about 0.2 °C higher than the basic case. The change in the effluent temperature of the production well was roughly the same as when it was not stopped. It can be found that after long-term recharge, the range of the cold temperature field has already large. Even if the production and recharge stopped for ten years, the temperature also cannot rise greatly, and the impact of recharge on production will still not decrease. If the water outlet temperature of the production well is restored to the original value, it will still take quite a long time. Therefore, after the temperature of the production well is reduced to a certain temperature, the temperature cannot be effectively increased within a limited period.
In conclusion, when the spacing between mining and recharge wells is 180 m, the three set solutions cannot effectively prevent the influence of the cold temperature field on the mining wells. Therefore, it is very important to set a reasonable distance between mining and recharge wells.

5. Reasonable Well Spacing

5.1. Model Building

According to the above prediction, when the distance between the mining and recharge wells is small, the thermal breakthrough phenomenon will reduce the temperature of the mining well. According to the study, the migration range of the cold temperature field is directly related to the mining and recharge volume. To increase the mining and recharge capacity without affecting the outlet temperature and water level of the mining well, the spacing between the mining and recharge wells can only be increased.
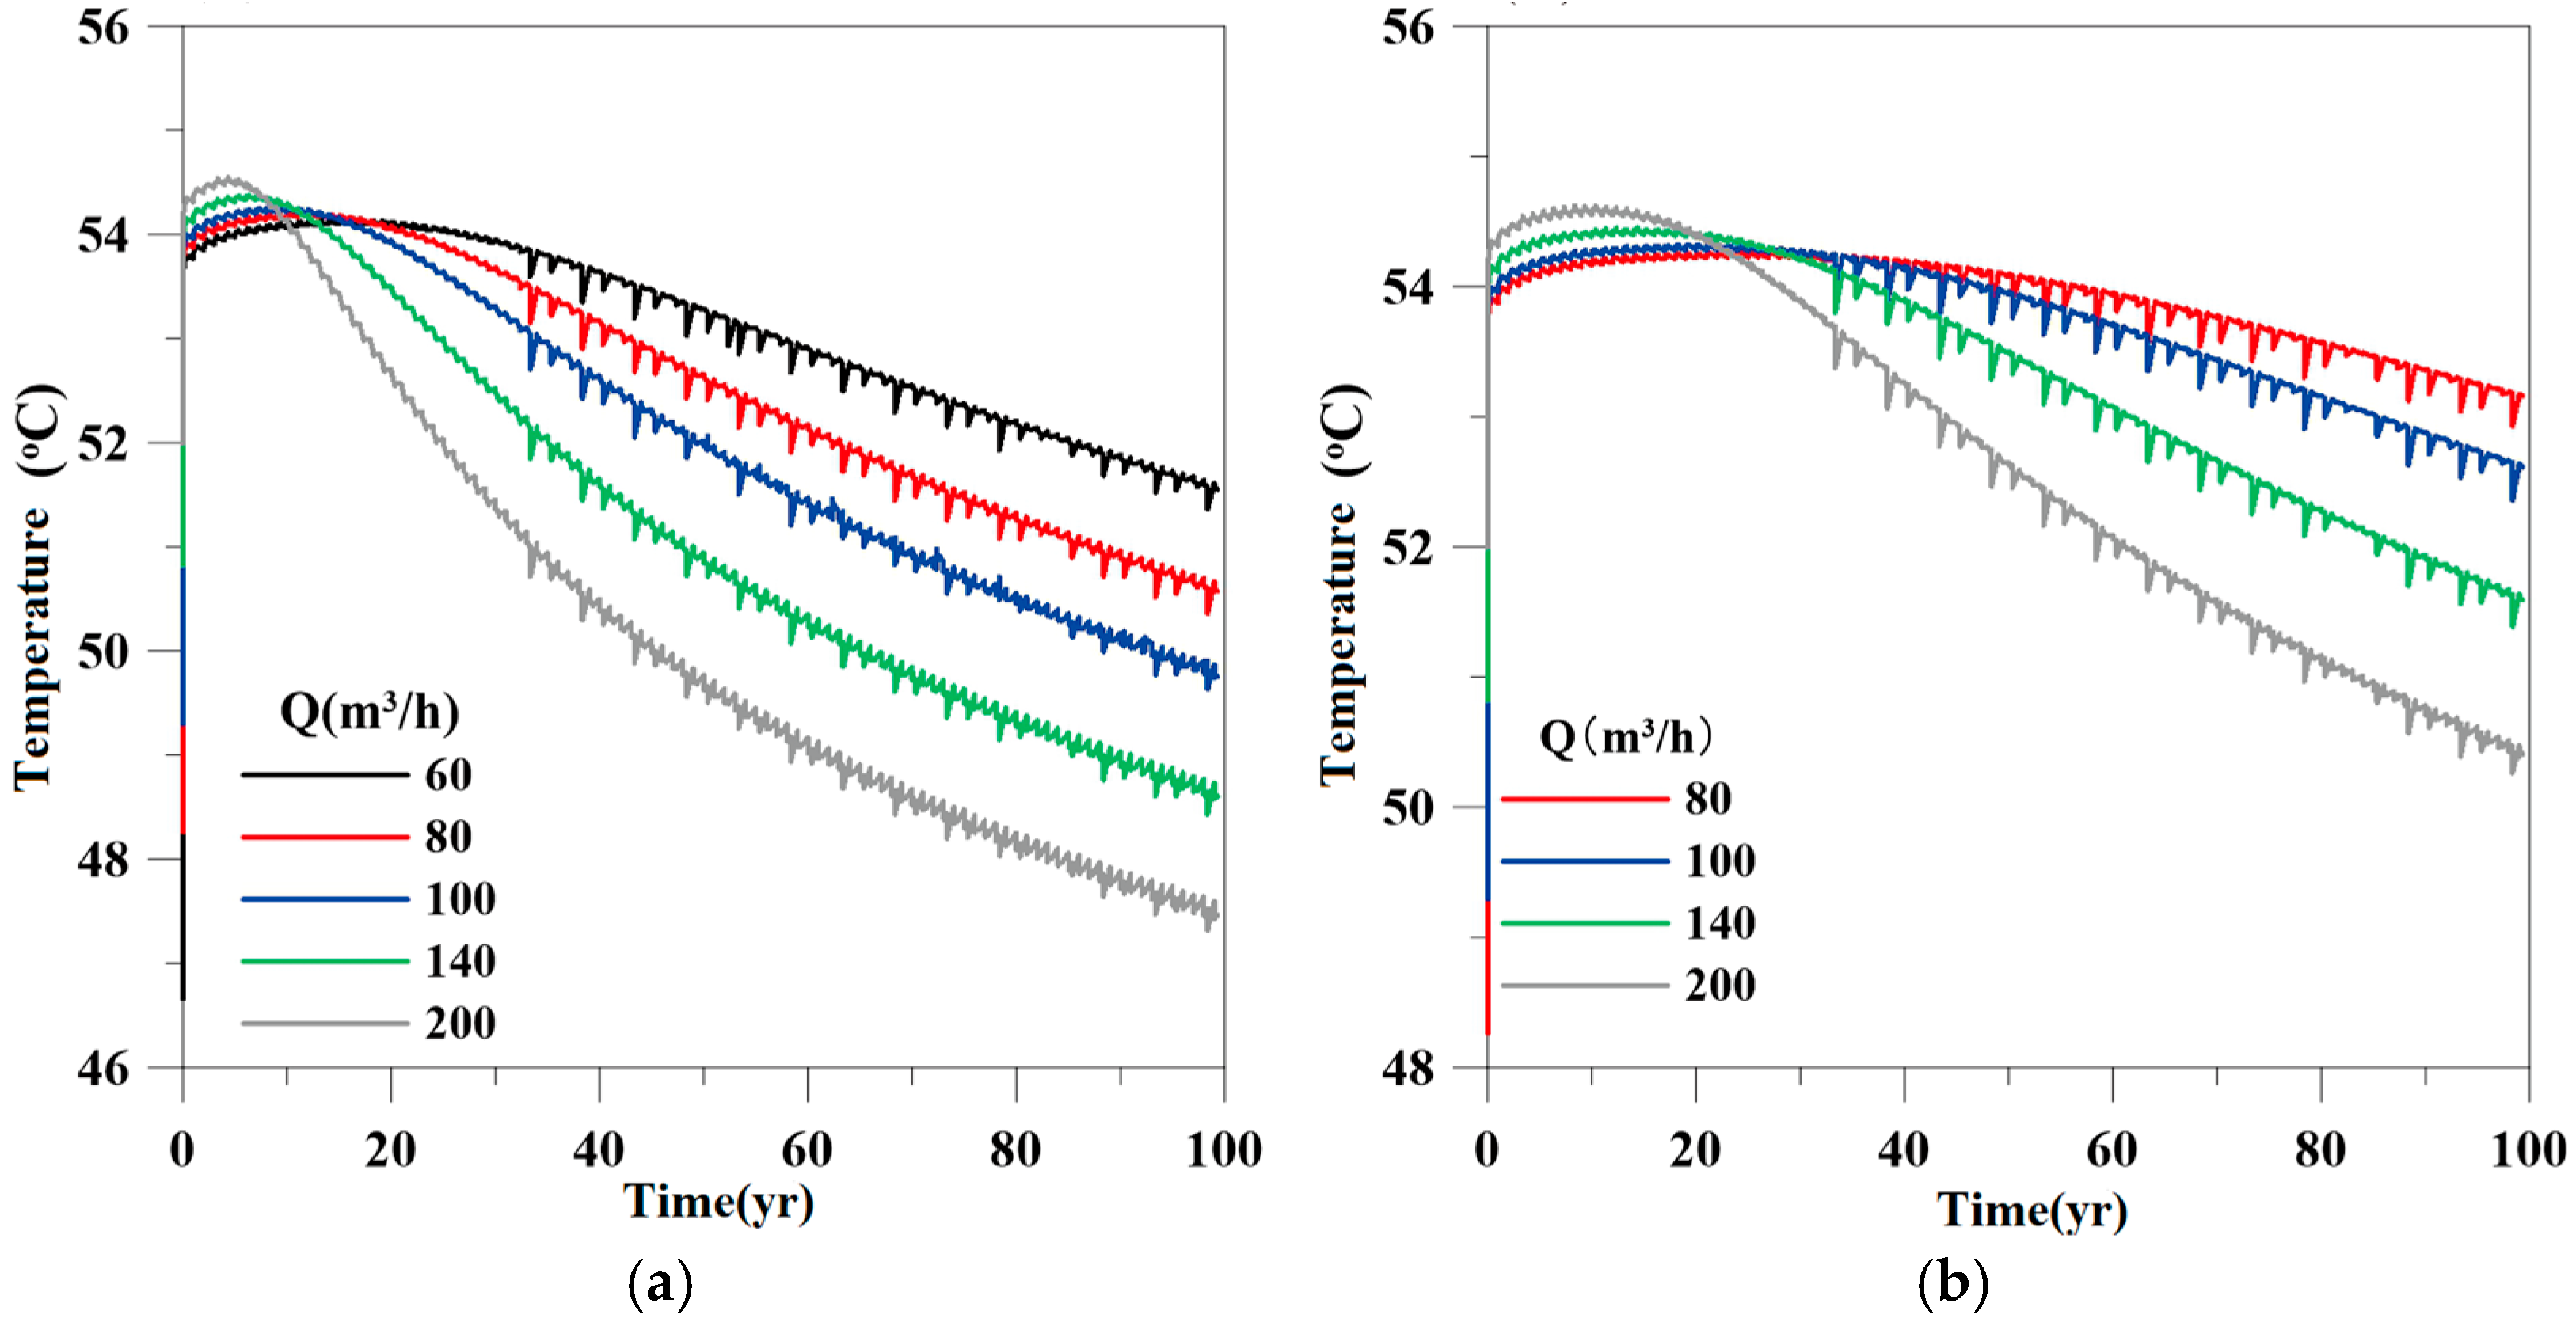
On the basis of the basic case well spacing of 180 m, two groups of models with well spacings of 400 m and 600 m were added to explore the evolution trend of effluent temperature with time during different mining and recharge capacities under different well spacing conditions.

5.2. Forecast Results

1.
Water Outlet Temperature of the Mining Well
The simulation results show that with a large and fast flow rate, the water temperature in the initial stage of recharge is slightly higher than the water temperature of the deep high-temperature fluid moving to the mining well in the initial mining stage (Figure 15).
When the well spacing is certain, the faster the mining rate, the higher the effluent temperature in the initial stage of mining, but the earlier the thermal breakthrough time, the faster the water temperature drops rapidly.
When the mining and recharge capacities are the same, the larger the well spacing, the later the impact of cold recharge water, the later the water temperature begins to drop, and the less the water temperature drop during the same mining period. For example, when the recharge rate is 80 m3/h, the effluent temperature, in the first year of production, is 53.9 °C. When the well spacing is 400 m, the water temperature of mining (1–11) increases slightly. The maximum temperature is 54.2 °C. The water temperature begins to drop in the 12th year of mining, with water temperature decreasing by 1.3 °C in 50 years. When the well spacing is 600 m, the water production temperature slowly rises during initial mining, reaching the highest outlet temperature in the 33rd year of mining. The maximum temperature is 54.2 °C. In the 34th year, water temperature begins to drop, and by 50 years, the water temperature is 54.1 °C, 0.2 °C higher than the first year (Table 13 and Table 14).
2.
Reasonable Mining and Recharge Well Distance
According to the above forecast results, based on the strata near the hydrological home of Decheng District, if the decline over 50 years is less than 1 °C, the mining well distance should be 60–80 m3/h and no less than 400 m, and the mining well distance should be no less than 800 m if the mining capacity is 80–140 m3/h.
In contrast with the predicted results of Xu Tianfu et al., the prediction of a reasonable mining and recharge well distance under different mining and recharge capacities is basically the same. The difference is that we have optimized the stratigraphic hydrogeological parameters and considered the effect of well loss. The value of the bottom permeability of the Guantao group changed from 4.0 × 10⁻¹² m2 to 2.3 × 10⁻¹² m2. Other related parameters such as thermal conductivity and permeability were also fine-tuned; it is thus clear that adjusting the size of permeability within a reasonable range will not have a great impact on the calculation results of reasonable mining and recharge well distance. Therefore, in the northwest region of Shandong, where the geothermal gradient is not much different and geothermal engineering focuses on thermal reservoirs of the same thickness, this can be used for reference in the setting of a reasonable mining and recharge well distance.

6. Conclusions

(1)
The issue of setting a reasonable mining and recharge well distance has not been paid full attention in the past, and the problem of small mining and recharge well spacing in the sandstone heat storage and mining area of Shandong Province represented by Dezhou is particularly prominent.
(2)
When the recovery and recharge capacity is 60 m3/h and the recharge temperature is 35 °C, the continuous recharge of the geothermal project (180 m away) after 10 years will cause the rapid decline of the outlet temperature of the mining well.
(3)
Under the condition of keeping the well spacing unchanged, neither lowering the recharge temperature and recharge capacity with constant heat (scheme 1), maintaining temperature but reducing capacity (scheme 2), nor stopping the process after the mining well temperature drops (scheme 3) can solve the problem of thermal breakthrough or meet the demand of production; therefore, setting a reasonable recharge distance is necessary.
(4)
Based on the strata near the Hydrological Home of Decheng District, the decline of mining wells in 50 years is less than 1 °C. the mining and recharge distance should not be less than 400 m, and the mining and recharge distance should not be less than 600 m when the mining capacity should be 80~140 m3/h.
(5)
For the project on small well spacing, high-temperature hot water recharge can be carried out in the recharge well during the non-recharge period to prevent the occurrence of thermal breakthrough.

Author Contributions

Conceptualization, S.L. and Y.Y.; methodology, S.L. and W.S.; validation, L.Z. and Y.Y.; formal analysis, J.C.; investigation, G.F. and W.S.; resources, Y.F.; writing—original draft preparation, S.L. and Y.F.; writing—review and editing, W.S.; All authors have read and agreed to the published version of the manuscript.

Funding

This study is funded by the geological exploration project of Shandong Provincial Department of Natural Resources, project number is 202483.

Data Availability Statement

The original contributions presented in this study are included in the article. Further inquiries can be directed to the corresponding author.

Conflicts of Interest

The authors declare no conflicts of interest.

References

  1. Liu, S.; Liu, Z.; Feng, S.; Wang, X.; Bai, T.; Ma, X.; Wang, H. Effect of Heating Tail Water Re-Charge on Geothermal Field of Sandstone Heat Storage: A Case Study in Northern Shandong. Geol. Rev. 2021, 67, 1507–1520. (In Chinese) [Google Scholar]
  2. Rybach, L.; Megel, T.; Eugster, W.J. How renewable are geothermal resources? Trans. Geotherm. Resour. Counc. 1999, 23, 17–20. [Google Scholar]
  3. Axelsson, G.; Stefansson, V.; Xu, Y. Sustainable management of geothermal resources. In Proceedings of the 2002 Beijing International Geothermal Symposium, Beijing, China, 29–31 October 2002; pp. 277–283. [Google Scholar]
  4. Sullivan, M.O.; Mannington, W. Renewability of the Wairakei–Tauhara Geothermal Resource. In Proceedings of the World Geothermal Congress, Antalya, Turkey, 24–29 April 2005. [Google Scholar]
  5. Kang, F.; Zhang, Z.; Xu, J.; Wang, Y.; Zhao, J.; Liu, G.; Liang, W. Geothermal Geological Conditions and Exploitation and Utilization in Shandong Province, China. In Collection of China High-Level Seminar on Scientific Development of Geothermal Resources; China Energy Research Society: Beijing, China, 2008; pp. 79–83. (In Chinese) [Google Scholar]
  6. Kang, F.; Yang, X.; Wang, X.; Zheng, T.; Bai, T.; Liu, Z.; Sui, H. Hydrothermal Features of a Sandstone Geothermal Reservoir in the North Shandong Plain, China. Lithosphere 2022, 2022, 1–20. [Google Scholar] [CrossRef]
  7. Kang, F.; Ma, Z.; Shi, Q.; Liu, X.; Huang, H. Renewable Capacity of Karst Geothermal Water and Production Reinjection Balanced Resources Evaluation: A Case Study of Heze Buried Uplift Geothermal Fields. Earth Sci. 2023, 48, 1118–1137, (In Chinese with English Abstract). [Google Scholar]
  8. Kang, F.; Zhao, J.; Tan, Z.; Zhang, X.; Wang, C.; Li, Y.; Chen, Y.; Liu, Z.; Liu, T.; Yu, H. Geothermal Power Generation Potential in the Eastern Linqing Depression. Acta Geol. Sin. 2021, 95, 1870–1881. [Google Scholar] [CrossRef]
  9. Li, J.; Kang, F.; Yang, Y.; Zhang, Y.; Wang, C.; Liu, T.; Chen, Y.; Zhao, J. Temperature Field Evolution Rule, Response Mechanism and Recovery Ability of a Production-Reinjection Doublet System in Sandstone Geothermal Reservoirs. Acta Geol. Sin. 2025, 99, 568–587, (In Chinese with English Abstract). [Google Scholar]
  10. Lin, W.; Wang, G.; Zhang, S.; Zhao, J.; Ma, Z.; Kang, F.; Shi, Q.; Liu, T.; Li, J.; Yang, Y. Heat Aggregation Mechanisms of Hot Dry Rocks Resources in the Gonghe Basin, Northeastern Tibetan Plateau. Acta Geol. Sin. 2021, 95, 1793–1804. [Google Scholar] [CrossRef]
  11. Wang, G.; Lin, W. Main Hydro-Geothermal Systems and Their Genetic Models in China. Acta Geol. Sin. 2020, 94, 1923–1937, (In Chinese with English Abstract). [Google Scholar]
  12. Xu, T.; Zhao, Y.; Zhao, J.; Zhang, L.; Liu, S.; Liu, Z.; Feng, B.; Feng, G.; Yue, G. Heat Extraction Performance and Optimization for a Doubletwell Geothermal System in Dezhou, China. Energy Explor. Exploit. 2021, 1–20. [Google Scholar] [CrossRef]
  13. Kang, F. Comprehensive Evaluation of Geothermal Clean Energy in Shandong Province; Science Press: Beijing, China, 2018; pp. 1–14. [Google Scholar]
  14. Tao, H.; Ding, J. Groundwater Environmental Geological Problems and Preventive Treatment in Guanzhong Urban Agglomeration. Geol. Rev. 2014, 60, 231–235. (In Chinese) [Google Scholar]
  15. Wu, L.; Zhao, J.; Li, A.; Xing, S. Key Issues of Geothermal Resource Exploitation and Utilization in the Depression Area of Northern Shandong Province. Geol. Explor. 2016, 52, 300–306. (In Chinese) [Google Scholar]
  16. He, M.; Liu, B.; Yao, L.; Xu, N. Study on the Theory of Seepage Field for Geothermal Single Well Reinjection. Acta Energ. Solaris Sin. 2003, 24, 197–201. (In Chinese) [Google Scholar]
  17. Zhu, J.; Zhu, X.; Lei, H. Analysis of Impact of Pressure Compensation Between Geothermal Wells on Reinjection Efficiency. Acta Energ. Solaris Sin. 2012, 33, 56–62. (In Chinese) [Google Scholar]
  18. Liu, Z.; Liu, S.; Song, W.; Yang, X.; Zhou, Q. Change Characteristics of Geothermal Field for Geothermal Return Water Reinjection of Sandstone Reservoir in the Northern Shandong. Acta Geol. Sin. 2019, 93, 149–157. (In Chinese) [Google Scholar]
  19. Wang, X.; Liu, H.; Jiang, S. Reinjection Experimental Research on Sedimentary Basin Sandstone Reservoir—A Case Study of Yucheng City, Shandong. Geol. Rev. 2020, 66, 485–492. Available online: https://www.geojournals.cn/georev/georev/article/abstract/20206602017?st=search (accessed on 12 July 2025). (In Chinese).
  20. Feng, S.; Wang, C.; Yang, Y.; Song, W.; Liu, S.; Zhao, J.; Deng, R. Impact Assessment of Reinjection on Sandstone Geothermal Reservoir: A Case Study of Northwest Shandong Depression. Acta Geol. Sin. 2019, 93, 158–167. (In Chinese) [Google Scholar]
  21. Wang, S.; Tian, H.; Zhao, X.; Yan, Y.; Yang, X.; Wang, X. Assessment of the Geological Storage Potential and Suitability of CO2 in the Deep Saline Aquifers in the Northwest Plain of Shandong Province, China. Energies 2024, 17, 6387. [Google Scholar] [CrossRef]
  22. Liu, G. Basic Characteristics of Deep Ground Water and Groundwater Environmental Problems in Lubei Plain. Shandong Geol. 2001, 17, 43–47. (In Chinese) [Google Scholar]
  23. Yan, S.; Pan, M.; Zou, Z.; Liu, G. Geochemical Characteristics and Origin of Geothermal Water in the Dezhou Hollow. Geol. China 2007, 34, 149–152. (In Chinese) [Google Scholar]
  24. Wang, Y.; Liu, G.; Hu, S. Division of the Geothermal Resources in the Northern Shandong Province. Geol. Surv. Res. 2008, 31, 270–277. (In Chinese) [Google Scholar]
  25. Liu, G. Numerical Method for the Coupled THM Processes in Deep Geothermal Reservoirs at City Scale and Application. Ph.D. Thesis, China University of Mining and Technology, Xuzhou, China, 2019. (In Chinese). [Google Scholar]
  26. Axelsson, G.; Bjornsson, G.; Montalvo, E. Quantitative Interpretation of Tracer Test Data. In Proceedings of the World Geothermal Congress, Antalya, Turkey, 24–29 April 2005. [Google Scholar]
  27. Axelsson, G. Simulation of Pressure Response Data from Geothermal Reservoirs by Lumped Parameter Models. In Proceedings of the 14th Workshop on Geothermal Reservoir Engineering, Stanford, CA, USA, 24–26 January 1989; pp. 257–263. [Google Scholar]
  28. Steefel, C.I.; Appelo, C.A.J.; Arora, B.; Jacques, D.; Kalbacher, T.; Kolditz, O.; Lagneau, V.; Lichtner, P.C.; Mayer, K.U.; Meeussen, J.C.L.; et al. Reactive Transport Codes for Subsurface Environmental Simulation. Comput. Geosci. 2015, 19, 445–478. [Google Scholar] [CrossRef]
  29. Zhao, Z.; Liu, G.; Xu, H. A Robust Numerical Modeling Framework for Coupled Thermo-Hydro-Mechanical Process in Deep Geo-Energy Engineering. Eng. Mech. 2019, 36, 1–11. (In Chinese) [Google Scholar]
  30. Liu, S.; Kang, F.; Zeng, Y.; Song, W.; Yang, Y.; Feng, G.; Chen, J.; Zhao, J. Analysis of Thermal Reservoir Difference between Guantao Formation and Dongying Formation Based on the Stratified Pumping Test: A Case Study in the West of Dongying Depression. In Proceedings of the World Geothermal Congress 2023, Beijing, China, 15–17 September 2023. Unpublished Work 2023. [Google Scholar]
Figure 1. Study area location.
Energies 18 04149 g001
Figure 2. Statistical chart of geothermal water produced in all cities of Shandong Province.
Energies 18 04149 g002
Figure 3. Temperature change curve of wellhead of mining well in Decheng District.
Energies 18 04149 g003
Figure 4. Change curve of average temperature of water intake section of mining well over the years.
Energies 18 04149 g004
Figure 5. Relative position diagram of geothermal wells in the Hydrological Home, Decheng District, Dezhou City.
Energies 18 04149 g005
Figure 6. Comparison of measured values and simulated correction results (a). Comparison of measured and simulated values of ground temperature, (b). Fitting effect of simulated and measured values of reduced depth and effluent temperature).
Energies 18 04149 g006
Figure 7. (a) Schematic diagram of grid section of the well mining model (length: width: height: 1:1:10); (b) cryptosection of the near-well (c) vertical section of the shaft.
Energies 18 04149 g007
Figure 8. Schematic diagram of the boundary conditions and lithology setting of the well mining model.
Energies 18 04149 g008
Figure 9. Evolution of production wellhead temperature in different years.
Energies 18 04149 g009
Figure 10. Base case and simulation results in Scheme 1. (ac) Temperature distribution at the 10th, 50th, and 100th year of Basic Case.; (df) Temperature distribution at the 10th, 50th, and 100th year of Low Temperature Recharge Case.
Energies 18 04149 g010
Figure 11. Comparison of effluent temperature evolution with temperature of base case (Scheme 1).
Energies 18 04149 g011
Figure 12. Temperature evolution of outflow under different scenarios of different flow rate.
Energies 18 04149 g012
Figure 13. Evolution of the heat extraction rate under different flux scenarios within 100 years.
Energies 18 04149 g013
Figure 14. The evolution of outflow temperature in Scenario 3.
Energies 18 04149 g014
Figure 15. Evolution curve of water outlet temperature over time with well spacings of 400 m (a) and 600 m (b).
Energies 18 04149 g015
Table 1. List of main thermal storage characteristics in Dezhou City, Shandong Province, China.
LithologyDistribution Characteristics Outflow TemperatureTotal Dissolved SolidDischarge Rate (m3/d)Hydrochemical Type
Pavilion pottery groupExcept for partial loss in the southern mountain front area and regional structure and base fluctuation, the overall distribution pattern is shallow, thin, deep, and thick45~65 °C6~10 g/L70~120Cl-Na
Dongying groupIt is mainly distributed in Wucheng–Xiajin and Dezhou–Lingcheng plain lines in the Linqing Depression, and in Yucheng and Linyi in the Jiyang Depression, while the rest of the area is missing60~70 °C10~15 g/L30~60Cl-Na, Cl·SO4-Na
The Cambrian–Ordovician carbonate thermal reservoirIt is mainly distributed in the Ningjin bulge, Luxi uplift, Gucheng–Wucheng bulge, Gaotang bulge, and other areas60~100 °Cfrom 1~2 g to more than 10 g/L50~60from HCO3-Ca·Na to HCO3·SO4-Ca·Na and Cl-Na
Table 2. Statistics of well spacing of 46 pairs of mining and recharge projects in Decheng District.
Well Spacing (m)QuantityTotalProportion
<100112963.00%
100–1506
150–20012
200–30081328.30%
300–4005
>400448.70%
Table 3. Multi-field coupled program for geothermal engineering.
ProgramMulti-Field Coupling FunctionNumerical Method
COMSOLTHMCfinite element
FALCONTHMCfinite element
FEHMTHMCfinite element
FEFLOWTHfinite element
FluentTHMfinite volume
GEOFRACTHMBoundary element
GEOSHMfinite element + Limited volume
GPRSTHfinite volume
MRSTTHfinite volume
NUFTTHCfinite volume
OpenGeoSysTHMCfinite element
SHEMATTHCfinite difference
STOMPTHMCfinite volume
TOUGHREACTTHCfinite volume
THOUGH-FLACTHMfinite volume
Table 4. Formation sequences exposed by the recharge wells.
FormationBottom Depth (m)Thickness (m)Lithologic Character
Q260260Clay, siltstone, fine sandstone
Nm1150890Mudstone, fine sandstone interbedded
NgUpper1319169Mudstone, with a thin layer of fine sandstone
Lower1536217Including gravel coarse sandstone, conglomerate, thin layer mudstone
Ed1544.5 (Unpenetrated)8.5mudstone
Table 5. Calculation results of thermal reservoir parameters.
ParameterThe MAX DrawdownThe Medium DrawownThe MIN Drawdown
Flux (m3/h)92.2478.7466.89
Drawdown (m)14.387.234.49
Hydraulic conductivity (m/d)0.901.441.88
Permeability (Darcy)0.530.851.11
Radius of influence (m)136.5486.8661.62
Table 6. Lithological thermal conductivity correction values for different strata.
FormationLithologyThermal Conductivity W/(m·°C)
QUnconsolidated formation3.7
N2mMudstone2.0
Fine sandstone1.25
N1gMudstone2.0
Fine sandstone1.7
Gravel coarse sandstone2.0
Glutenite2.1
E3dMudstone2.2
Table 7. The permeability of each lithology is corrected and positive.
FormationLithologyPermeability (×10−12 m2)
NgMudstone0.057
Fine sandstone1.5
Gravel coarse sandstone1.9
Glutenite2.3
EdMudstone0.052
Table 8. Key hydrogeology and thermal property parameters setting of different lithology.
FormationLithologyDensity (kg/m3)Permeability (×10−12 m2)Thermal Conductivity (W/m/°C)Specific Heat Capacity (J/kg·°C)
Qunconsolidated formation22320.233.7919
NNmmudstone19680.0572.0934
Fine sandstone18501.311.25958
NgMudstone19680.0572.0934
Fine sandstone18501.51.8909
Gravel coarse sandstone20001.92.0909
glutenite20002.32.1909
EEdMudstone19680.0522.2909
Table 9. Recharge data over the years.
Production and Recharge TestDays (d)Production Flux (m3/h)Injection Flux (m3/h)Recharge Water Temperature (°C)Outflow Temperature (°C)
201713270.7852.824055.67
201811564.1554.8434.154.9
201913063.3362.4734.154.3
202014564.4160.6934.1254.23
202114958.2758.0833.1056.89
202213764.7965.5232.5656.31
Base case130606035
Table 10. List of effluent temperature changes in the two schemes.
TimeBasic Case (Q = 60 m3/h, T = 35 °C)Low Temperature Recharge Case (Q = 33.5 m3/h, T = 20 °C)
Outflow Temperature (°C)Temperature Drop (°C)Outlet Temperature (°C)Temperature Drop (°C)
First year53.90.053.50.0
The 50th year48.65.348.94.6
The 100th year46.67.345.87.7
Tips: Q represents the mining and recharge flow, and T represents the temperature of the recharge water.
Table 11. Results of the outflow temperature under different flux scenarios.
TimeBase Case (60 m3/h)Flux of 40 m3/h
Outlet Temperature (°C)Temperature Drop (°C)Outlet Temperature (°C)Temperature Drop (°C)
First year53.90.053.80.0
The 50th year48.65.350.13.7
The 100th year46.67.348.25.6
Table 12. Changes in heat extraction efficiency of different mining and recharge volumes.
TimeQ = 60 m3/h (Base Case)Q = 40 m3/h
Heat Extraction Rate (MW)Decreasing Amplitude (MW)Heat Extraction Rate (MW)Decreasing Amplitude (MW)
First year1.30.00.870.0
The 50th year0.90.40.70.17
The 100th year0.80.50.60.27
Table 13. Variation in effluent temperature at different mining rates at well spacing 400 m.
Flow
(m3/h)
6080100140200
Time Temperature °CReduced °CTemperature °CReduced °CTemperature °CReduced °CTemperature °CReduced °CTemperature °CReduced °C
First year53.80.053.90.054.00.054.10.054.30.0
The 50th year53.30.552.61.352.02.050.93.249.74.6
The 100th year51.62.250.63.349.84.248.65.547.56.8
Table 14. Variation in effluent temperature at different mining rates with well spacing of 600 m.
Flow
(m3/h)
80100140200260
Time Temperature °CReduced °CTemperature °CReduced °CTemperature °CReduced °CTemperature °CReduced °CTemperature °CReduced °C
First year53.90.054.00.054.10.054.30.054.50.0
The 50th year54.1−0.254.00.053.50.652.71.651.92.6
The 100th year53.20.752.61.451.62.550.43.949.64.9
Disclaimer/Publisher’s Note: The statements, opinions and data contained in all publications are solely those of the individual author(s) and contributor(s) and not of MDPI and/or the editor(s). MDPI and/or the editor(s) disclaim responsibility for any injury to people or property resulting from any ideas, methods, instructions or products referred to in the content.