Abstract
The safety of lithium-ion batteries during transportation is critically important. However, current standards exhibit limitations, as their environmental testing parameter thresholds fail to fully encompass actual transportation conditions. To enhance both safety and standard applicability, in this study, we focused on four representative environmental conditions: temperature, vibration, shock, and low atmospheric pressure. Field measurements were conducted across road, rail, and air transport modes using a self-developed data acquisition system based on the NearLink communication technology. The measured data were then compared with the threshold values defined in current international and national standards. The results reveal that certain measured values exceeded the upper limits prescribed by existing standards, indicating limitations in their applicability under extreme transport conditions. Based on these findings, we propose revised testing parameters that better reflect actual transport risks, including a temperature cycling range of 72 ± 2 °C (high) and −40 ± 2 °C (low), a shock acceleration limit of 50 gn, adjusted peak frequencies in the vibration PSD profile, and a minimum pressure threshold of 11.6 kPa. These results provide a scientific basis for optimising safety standards and improving the safety of lithium-ion battery transportation.
1. Introduction
With the surging global demand for electronic devices and energy storage systems, the lithium-ion battery industry is experiencing exponential growth. According to the 2023 Annual Development Report on the Power Battery Transportation Industry released by China’s Ministry of Industry and Information Technology, China produced 628 GWh of lithium-ion batteries in 2023, accounting for 72.3% of total lithium battery output, with road transportation responsible for an 89.7% share [1].
However, the safety risks during transportation became amplified. Statistics show that thermal runaway incidents caused by transportation account for 38% of battery safety events worldwide [1], representing a 17% increase compared to that in 2020. Typical incidents include the semi-trailer truck fire in California, USA in 2024 [2], and the explosion at a battery recycling plant in Missouri [3].
Research findings and empirical data indicate a correlation between transportation conditions and the risk of battery thermal runaway. Studies based on failure mode and effects analysis identified storage and transportation environmental parameters as important sources of battery failure risk [4,5]. Therefore, urgently developing a safety testing system based on real transportation conditions is crucial for the industry.
Currently, multiple standards coexist for environmental testing of power lithium-ion batteries during transportation, including the United Nations’ UN38.3 [6], the International Safe Transit Association’s ISTA 3E [7], and China’s national standard GB 38031 [8]. These standards differ significantly in terms of key parameter settings. Such variations increase the cost of repeated testing in international logistics and, to some extent, reduce the relevance of testing results to real transport scenarios.
Based on relevant domestic and international standards and research, vibration, shock, temperature, and low atmospheric pressure are widely adopted as the four most critical environmental factors affecting power lithium-ion batteries. Section 2 presents a review of related literature. Although all these parameters are covered in existing standards, their applicability does not fully reflect the extreme conditions that may occur in actual transportation.
In this study, we adopted a measured data-based analysis approach and selected regions such as Mohe, Turpan, and Tianjin–Shanghai, which exhibit typical climate and transport characteristics, for field measurements. A comparative analysis was conducted between current standards and measured data to identify key parameters that accurately reflected actual transport environments. The aforementioned four types of representative conditions were systematically investigated.
2. Review of Literature and Current Standards
2.1. Selection of Representative Transport Conditions
Power lithium-ion batteries are subject to different environmental conditions during transportation by road, rail, water, and air, as shown in Table 1. In this study, we selected four typical transport environmental conditions—temperature, vibration, shock, and low pressure—based on the following considerations: First, these four conditions are explicitly covered by multiple existing transport safety standards, such as UN38.3, ISTA 3E, and GB 38031. These widely applied standards for battery transport compliance verification indicate that the selected conditions receive considerable attention and are practically relevant in transport safety assessments. Second, each condition is characterised by distinct physical dimensions and established measurement methods, which facilitate quantification and standardised testing, thereby effectively supporting experimental data acquisition and analysis. In particular, vibration and shock are easier to quantify and standardise compared to other stressors [9]. Additionally, in special transport scenarios, such as rail and aviation, high-temperature and low-pressure environments must not be overlooked.

Table 1.
Environmental conditions involved in different transport modes.
Although maritime transport accounts for a certain proportion of battery logistics, its environmental stress levels are generally low. Cargo is typically stored in temperature-controlled or well-ventilated compartments, where temperature fluctuations are smaller than those encountered during prolonged exposure in open railcars or trucks under direct sunlight. The amplitude of vibration and shock on vessels is significantly lower than that observed in road transport. Although salt spray corrosion presents a potential risk, real-time monitoring methods have not yet been developed, and short-term exposure has limited impact on well-packaged batteries. Therefore, maritime transport was excluded from the present study.
This section presents a systematic analysis of relevant research findings and major standards, focusing on the four key environmental conditions: temperature, vibration, shock, and low pressure. In addition, a review of related testing parameters in current standards is provided to establish a theoretical foundation for subsequent standard evaluation and field testing design.
2.2. Overview of Critical Environmental Conditions
2.2.1. Temperature
Lithium-ion batteries often face extreme temperature conditions in static environments, such as during transportation and storage, which can pose potential threats to their performance and safety. Kwasiborska et al. [10] noted that even with intact packaging, temperature instability in cargo holds may still trigger battery fires or thermal runaway. Meng et al. [11] demonstrated that while low temperatures may suppress the peak of thermal runaway, they prolong the heat release process, presenting a persistent hazard. Zhang et al. [12] further reported that the conductivity of conventional electrolytes drops sharply at low temperatures (<0 °C), while at high temperatures, increased volatility exacerbates interfacial film thickening, thereby increasing the risk of thermal runaway.
However, the upper and lower temperature limits defined in current standards vary significantly. For instance, the high-temperature setting in the temperature cycling test specified in GB 38031 is 85 °C, compared to 72 °C in UN38.3, while ISTA 3E specifies a maximum of only 60 °C. These discrepancies reflect inconsistent assessments of temperature-related risks during transportation and storage among the various standards.
Studies have shown that high temperatures accelerate internal chemical reactions within batteries, especially redox reactions at the cathode and anode, which are major sources of heat generation [13]. When battery temperature exceeds 80 °C, the likelihood of spontaneous thermal runaway increases significantly [14], and uncontrolled micro-reactions under such conditions further exacerbate the process [15]. In addition, elevated temperatures can lead to separator melting, cathode decomposition, and internal short circuits, potentially resulting in fire or explosion. Furthermore, low temperatures reduce the lithium-ion diffusion rate, thus increasing the risk of internal short circuits [16].
Thermal management of lithium-ion batteries in static environments should not be overlooked owing to intense reactions at elevated temperatures as well as performance degradation and delayed hazards at low temperatures.
2.2.2. Vibration
Vibration conditions are prevalent in road transportation, and their cumulative effects are significant. Compared to rail, maritime, and air transport, road transportation exhibits greater vibration amplitudes and higher unpredictability. Factors such as road conditions, fluctuations in driving speed, and driver behaviour can all influence vibration levels, thereby increasing the potential structural damage to batteries [17].
The impact of vibration on battery performance extends beyond structural damage, inducing cumulative degradation at the material level. Wang et al. [18] reported that under high states of charge, vibration accelerates the growth of internal resistance and capacity fade in lithium-ion batteries, leading to microstructural damage of electrode materials and non-uniform lithium plating. Du et al. [19] proposed that under the combined influence of high temperature and vibration, batteries using phase change materials for thermal management experience reduced thermal conductivity, significantly increasing the risk of thermal runaway.
Current standards exhibit significant differences in terms of vibration frequency ranges and power spectral density (PSD) curves. In the context of rail transport, the PSD curves defined by GB/T 4857 [20] and IEC 61373 [21] differ in both frequency coverage and energy distribution trends, likely owing to differences in train types and track conditions across regions. For road transport, the PSD curves in GB/T 4857 and ISTA 3E are relatively consistent; however, when compared with GB 38031, clear deviations appear in the location of the second peak and the overall attenuation trend. This may be because GB 38031 targets vehicle traction batteries and better reflects vibration characteristics under actual driving conditions.
2.2.3. Shock
Shock is another critical factor that can lead to structural damage and failure of power lithium-ion batteries. Under certain extreme conditions, shock loads can become the primary cause of damage. In air transport, instantaneous shock loads generated during aircraft landing can cause localised structural instability in battery systems, resulting in high stress concentrations. When shock velocities exceed the normal range for flight, the protective capacity of battery enclosures decreases, increasing the risk of cell damage and potentially triggering fire or other serious safety hazards [22].
An analysis of existing standards indicates that the UN38.3 shock test specifies a shock acceleration of 150 g for small batteries and 50 g for large batteries, which is substantially higher than the 7 g mechanical shock requirement in GB 38031.
From a structural safety perspective, the failure mechanisms induced by shock loads attracted considerable attention. Liu et al. [23] reported that increased shock acceleration intensifies interface delamination between active materials and current collectors, affecting battery cycle life. Li et al. [24] further revealed that such structural disturbances increase battery impedance and accelerate capacity degradation, thereby shortening service life. Under repeated shocks, aged batteries become more prone to structural failure [25].
Focusing on practical applications, Wang et al. [26] reported that battery systems mounted at the bottom of vehicles are most susceptible to concentrated mechanical stress during impact, which can lead to separator tearing, internal short circuits, and thermal runaway. Notably, battery damage caused by extreme impact under accident conditions is beyond the scope of this study.
2.2.4. Pressure
Low-pressure environments are a critical external factor in air transportation and road transport across high-altitude regions, posing potential threats to the performance and safety of lithium-ion batteries. During air transport, a drop in pressure may cause stress changes in battery sealing structures, thereby increasing the risk of thermal runaway and other failures. This risk becomes more pronounced when combined with mechanical stress [27].
Experimental data show that when ambient pressure decreases from 96 to 30 kPa, the battery capacity loss rate rises from 0.5 to 17.4% [28]. Meng et al. [11] revealed that under combined low-pressure and low-temperature conditions, although the onset of thermal runaway is delayed, the duration of heat release is significantly extended, potentially leading to sustained internal structural damage within the battery. Chen et al. [29] and Li et al. [30] further indicated potential risks from a thermal safety perspective, suggesting that pressure changes during high-altitude flight may restrict heat dissipation inside sealed enclosures and trigger thermal runaway.
Variations in how current standards address low-pressure conditions also reflect varying transport scenario considerations. The altitude simulation test in UN38.3 specifies a low-pressure value of 11.6 kPa, corresponding to extreme conditions in aircraft cargo holds. In contrast, GB 38031 specifies 61.2 kPa for high-altitude testing, which corresponds to the atmospheric pressure at an altitude of 4000 m and sufficiently covers the actual transport needs of most plateau regions in China.
2.3. Comparison of Test Standards
To further clarify the applicability boundaries of the aforementioned key environmental conditions across different standards, we classify and summarise the test parameters in UN38.3, ISTA 3E, and GB 38031. A comparative analysis is conducted focusing on the parameter values and applicable scenarios of the four typical transport conditions. Table 2 summarises the test standards for temperature, vibration, shock, and low pressure as specified in each standard.
Table 2.
Summary of battery transportation testing standards.
2.3.1. Temperature Parameters
The temperature settings specified in the UN38.3 T.2 standard closely align with those observed in aircraft cargo holds and extreme ground environments. The environmental adaptability requirements for battery transport, outlined in the Technical Instructions for the Safe Transport of Dangerous Goods by Air by the International Civil Aviation Organisation (ICAO) [33] and the Dangerous Goods Regulations by the International Air Transportation Association (IATA) [34], indicate that the temperature parameters in UN38.3 primarily account for the harsh temperature variations encountered in global, particularly air, transportation scenarios.
In contrast, the ISTA 3E standard reflects typical storage and transport conditions in general logistics, with a focus on ordinary logistics scenarios. It does not fully consider the extreme transportation requirements of lithium batteries or other hazardous materials, and thus lacks sufficient adaptability to extreme climate conditions.
The GB 38031 standard primarily simulates transport and storage environments across the extreme climatic zones of northern and southern China, making it particularly applicable to road transport and long-term use scenarios.
2.3.2. Vibration Parameters
Average vibration intensity is typically represented by PSD, derived from vibration signals measured via the fast Fourier transform (FFT) algorithm. Random vibration is commonly used in tests to better replicate the PSD trends along three axes under actual transport conditions.
The UN38.3 T.3 standard aims to comprehensively capture the vibration characteristics that goods may encounter across different transportation environments. The ISTA 3E standard, which reflects general packaging logistics and adopts a conservative PSD, cannot be applied to high-frequency and high-intensity vibration environments. The GB 38031 standard is based on vibration data from typical road conditions in China, with particular consideration of vibration characteristics on highways and urban roads. The IEC and GB/T standards are more oriented toward generic device testing, and their vibration intensities deviate significantly from real-world conditions.
2.3.3. Shock Parameters
Shock testing defines different maximum acceleration values and pulse durations depending on the characteristics of the object under test. The UN38.3 T.4 standard simulates extreme shock scenarios and specifies relatively high acceleration limits. The ISTA 3E standard does not specify shock acceleration values for batteries; rather, it evaluates the overall shock resistance of packaging units and is thus unsuitable for dangerous goods. The acceleration values in the GB 38031 standard are more conservative and closer to conventional road conditions; however, they do not account for complex road scenarios or extreme shock conditions.
2.3.4. Low-Pressure Parameters
The UN38.3 T.1 standard simulates low-pressure conditions in aircraft cargo holds during high-altitude air transport, ensuring a high level of safety adaptability for lithium batteries in aviation transportation. The GB 38031 standard primarily simulates high-altitude road transport conditions in China but is not applicable to air transport or more extreme low-pressure environments. The ISTA 3E standard does not include relevant testing parameters and has limited applicability.
2.3.5. Summary
Significant differences are detected in the key parameter settings among the different standards. Such discrepancies may result in the requirement of repeated testing for the same battery product during cross-border transportation and limit the representativeness of test results for actual conditions. Therefore, the relevant parameters should be revised and adapted scientifically, based on measured data and typical transport conditions, during the process of standard development.
3. Methods
To verify whether current standards accurately reflect actual transport conditions in terms of key environmental parameters (i.e., temperature, vibration, shock, and low pressure), we focused on the extreme environmental conditions encountered during three typical modes of transportation: road, rail, and air. Field measurements of the transport environment were conducted accordingly. The schematic of the experimental procedure is shown in Figure 1.
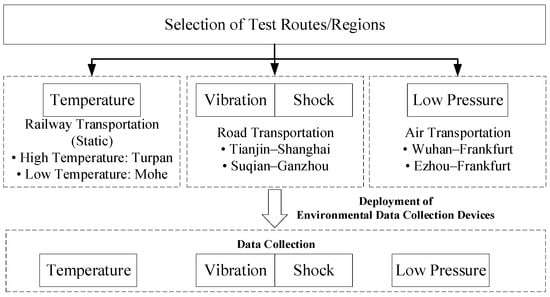
Figure 1.
Schematic of the experimental procedure.
3.1. Development of Experimental Equipment
To obtain the real environmental parameters experienced by power lithium-ion batteries during transportation, a self-developed freight environment data acquisition system based on StarFlash communication was established in this study, as shown in Figure 2. This system is capable of multi-dimensional parameter acquisition, local data storage, and visualised analysis, allowing real-time recording and post-processing of key environmental stressors such as temperature, vibration, shock, and pressure during typical transport processes.
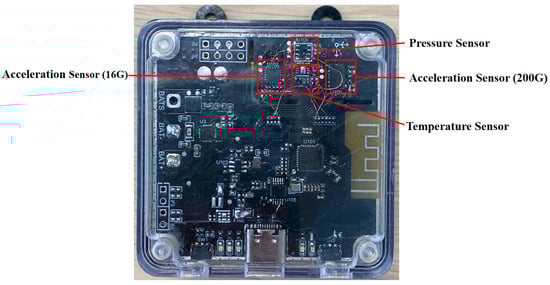
Figure 2.
Freight environment data acquisition system based on StarFlash communication.
The data acquisition module used the Hi3863 chip (HiSilicon Semiconductor, Shenzhen, China) as the main control unit and was equipped with an ADXL375 triaxial high-g accelerometer (Analog Devices, Inc., Wilmington, MA, USA; sampling frequency: 1 kHz) and an SHT30 temperature sensor (Sensirion AG, Stäfa, Switzerland; −40 to 125 °C, accuracy: ±0.3 °C). This configuration enabled high-frequency real-time acquisition of environmental variables such as temperature, humidity, vibration, and shock inside the cargo compartment. The collected data were transmitted in real time via the StarFlash communication link to the data storage and analysis module, ensuring data integrity and transmission stability.
The data storage and analysis module adopted the AX650N high-performance vision processing chip (AxinChip Semiconductor Co., Ltd., Jiaxing, China), which provided 72 TOPS INT4 computing power and ran a Linux operating system (Debian distribution). In addition to receiving data from the compartment module, it collected information from connected sensors including GPS, pressure, altitude, speed, and image/video streams.
In summary, the self-developed data acquisition system operated reliably under complex transportation conditions and met the requirements for high-precision, multi-dimensional environmental data collection. It provided a robust data foundation for comparative analysis between measured transport conditions and standard threshold values.
3.2. Temperature Testing
The temperature test focused on the thermal adaptability boundaries of lithium-ion batteries under static high- and low-temperature transportation conditions. To capture extreme temperature conditions during transport, field testing was conducted in Turpan, Xinjiang, and Mohe, Heilongjiang.
Turpan is located in a typical hot and arid region of China, with a historical summer temperature peak of 47.8 °C, representing the most unfavourable transport condition for batteries in high-temperature environments. Mohe, situated at the northernmost point of China, where winter temperatures can reach −52.3 °C, is a representative severe cold region suitable for simulating the thermal stress boundaries during road transportation, storage, or transit in cold climate zones.
Tests were conducted in August 2024 (Turpan) and January 2025 (Mohe). A standard 20-foot container was used as the test unit, with 16 sets of environmental data acquisition devices placed inside and outside the container. Sensor positions included the container centre, corners, floor, and roof, as shown in Figure 3. The sampling interval was 5 min. A spatially uniform distribution strategy was used to capture temperature gradient data. During data processing, intervals with the highest temperature change rates were selected as analysis samples.
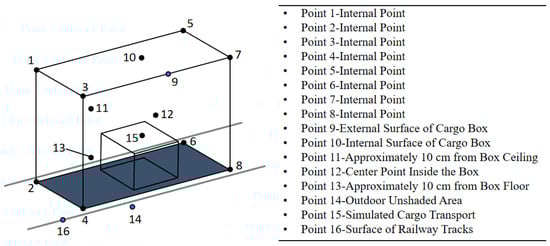
Figure 3.
Temperature sensor layout diagram.
3.3. Vibration and Shock Testing
To systematically evaluate the mechanical stress experienced by power lithium-ion batteries under typical road transportation conditions, we conducted in-transit vibration and shock tests, focusing on the actual distribution of PSD characteristics and peak shock acceleration.
Two freight routes—Tianjin–Shanghai and Suqian–Ganzhou—were selected for data collection. The Tianjin–Shanghai route spans central to northern China and includes highways, urban expressways, and mountain roads, making it a representative medium-to-long-distance interprovincial transport route. The Suqian–Ganzhou route passes through Jiangsu, Anhui, and Jiangxi provinces, featuring humid southern climates and hilly terrain, which are suitable for observing shock responses caused by frequent braking, turning, and acceleration. Both routes are critical paths for transporting batteries from China’s industrial centres to major export ports, thus having strong practical relevance.
A 16.5 m box truck was selected as the test vehicle. Devices including environmental data acquisition devices and GPS were installed inside the cargo compartment, as shown in Figure 4. To ensure data stability and representativeness, the total data collection mileage exceeded 10,000 km, covering a variety of road types, including highways, trunk roads, and urban roads.
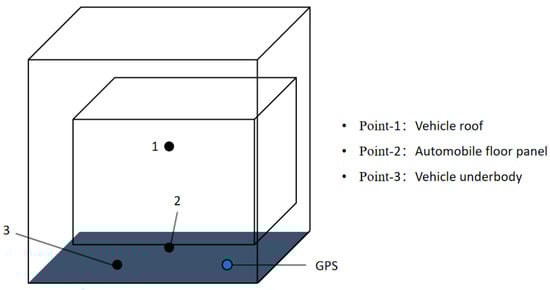
Figure 4.
Sensor layout diagram.
3.4. Pressure Testing
To collect real atmospheric pressure variation data under air transport conditions, we conducted in-flight monitoring experiments. Two intercontinental cargo routes—Wuhan–Frankfurt and Ezhou–Frankfurt—were selected for field measurements. These routes connect China’s lithium battery manufacturing centres with major import ports in Europe, making them key routes for current battery exports.
The tests were conducted from November to December 2024 using a Boeing 747-400F cargo aircraft (The Boeing Company, Seattle, DC, USA), covering a total distance of 36,680 km. Multiple environmental data acquisition devices were installed in the cargo hold to record pressure variations from sea level to 15,000 m altitude, with measurements taken at 500 m intervals.
4. Results
4.1. Temperature Data
Temperature data were extracted from all sensor positions. To eliminate incidental anomalies caused by external interference, outliers were identified and removed using the interquartile range method. Short, missing segments were interpolated using linear methods, and baseline alignment was performed on the raw data.
For the high-temperature test, monitoring data demonstrated that under ambient temperatures ranging from 34 to 44 °C, sensor Point 10—located on the internal surface of the container—recorded a transient peak of 71.86 °C due to thermal inertia. However, the duration was short, indicating a transient high-temperature event. Studies have shown that rapid temperature changes can damage internal battery structures, and such transient high temperatures may induce battery polarisation or other adverse reactions [35].
For the low-temperature test, under ambient conditions of −35 to −14 °C, sensor Point 11, positioned near the top interior area of the container, recorded an extreme low of −37.36 °C.
Table 3 details the temperature gradient evolution for both tests. A total of 1666 high-temperature data points and 3137 low-temperature data points were collected. These results comprehensively reveal the unsteady heat transfer behaviour within enclosed transport units under extreme environmental conditions.
Table 3.
Measured data from both high- and low-temperature tests.
Although the recorded peak temperature of 71.86 °C during transport is a short-term extreme event, which may be associated with the thermal safety behaviour of lithium-ion batteries, the generalizability and practicality of standard-setting must be considered. Long-duration high-temperature loading tests are more suitable for simulating the long-term stability of batteries under extreme thermal exposure. The temperature cycling test conditions specified in UN38.3 offer clear repeatability and evaluation boundaries. Therefore, we recommend adopting the temperature protocol outlined in UN38.3 T.2 for temperature cycling experiments.
4.2. Vibration and Shock Data
Owing to potential displacement of data acquisition devices or interference from static environmental noise, the collected signals must be pre-processed before frequency domain analysis. First, the mean value of the signal is removed to eliminate the DC component and reduce its impact on the frequency spectrum, as shown in Equation (1).
Subsequently, a Hamming window function is applied to the signal to smooth the truncated edges and reduce spectral leakage. The window function is defined as follows:
To ensure energy consistency of the signal, a normalisation factor is introduced based on the energy characteristics of the window function. Thereafter, the windowed signal is normalised as shown below (Equations (3) and (4)).
The pre-processed signal is transformed from the time domain to the frequency domain via FFT, and the PSD, which represents the distribution of vibration energy across frequencies, is calculated using Welch’s method. The FFT is expressed as follows:
The PSD is computed as follows:
where represents the squared amplitude of the frequency domain signal, indicating the signal power at a specific frequency.
To improve the stability of the PSD estimation, the Welch method is employed. This method divides the long time series into M segments, each of length N/M. The power spectrum is computed for each segment, and the average of all the segments is determined, as shown in Equation (7). Finally, the PSD values across all frequency points are concatenated and smoothed to yield the PSD curve characterising the distribution of vibration energy.
After processing, over 50,000 road profile data entries were obtained, with root mean square acceleration; g (Grms) as the primary parameter. Based on these data, PSD curves for the Tianjin–Shanghai and Suqian–Ganzhou routes were generated (Figure 5). These plots provided clearer and more intuitive insights into the vibration characteristics experienced by the vehicle across different road segments.
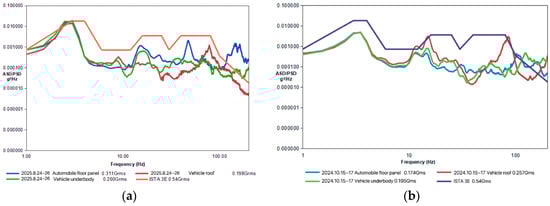
Figure 5.
PSD curves: (a) Tianjin–Shanghai and (b) Suqian to Ganzhou.
As illustrated in Figure 4, vibration characteristics vary by vehicle location. Overall vibration levels on the Suqian–Ganzhou route were lower than those on the Tianjin–Shanghai route, particularly in the low-frequency range (1–10 Hz), where PSD peak values were reduced. In the mid-to-high-frequency range (10–100 Hz), PSD curves from both routes exhibited similar trends, characterised by multiple resonant peaks. To further analyse the vibration profile, the acceleration variation curve for the Tianjin–Shanghai route is presented in Figure 6. The maximum impact acceleration at the vehicle floor reached 44.06 g, indicating relatively severe shock conditions along the route. In contrast, the maximum impact acceleration for the Suqian–Ganzhou route was only 19.93 g at the floor, with peak values of 22.11 g at the roof and 27.34 g at the underbody, all of which were lower than those recorded on the Tianjin–Shanghai route, suggesting that the road conditions exerted less impact-related stress on the vehicle. These variations in test data highlight the need for further optimisation of testing standards for the transportation safety evaluation of lithium-ion batteries, with consideration of the actual vibration scenarios across different transportation routes to enhance their applicability.
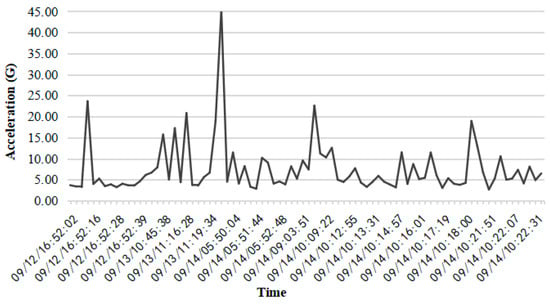
Figure 6.
Vehicle deck acceleration variation curve for the Tianjin–Shanghai route.
4.3. Pressure Data
Raw data were uniformly sampled at 500 m altitude intervals. During data cleaning, missing segments, resulting from intermittent sampling, were filled using segmented interpolation. Data consistency across sensors was examined, and the minimum pressure values were extracted.
Data analysis revealed a minimal aircraft external pressure of 26.89 kPa; the relationship between the cabin pressure and altitude is illustrated in Figure 7. The cabin pressure varied with flight altitude, exhibiting typical characteristics of a pressurised cargo hold. Additionally, lithium iron phosphate batteries were placed at the main cargo hold door, while nickel–cobalt–manganese (NCM) and nickel–cobalt–aluminium (NCA) batteries were stored near the rear lower cargo hold door. No cargo was stacked above the battery packaging boxes to guarantee safe transportation.
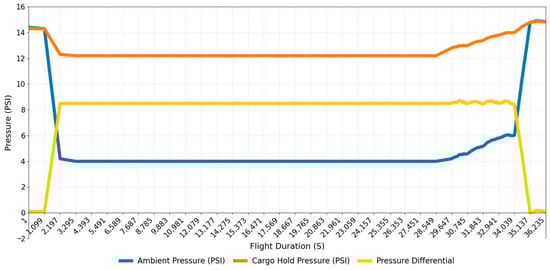
Figure 7.
Aircraft cargo hold pressure variation over time.
5. Discussion
This section provides an in-depth analysis of the measured data and compares it with the current standards to explore the impact of extreme environmental parameters on the transportation safety of lithium-ion batteries.
5.1. Temperature Analysis
Measured data from the Turpan Railway Hub (Figure 8a) demonstrated a peak transient temperature of 71.86 °C at Point 10—the inner surface of the container—between 13:00 and 15:00. This value exceeds the ISTA 3E standard limit (60 ± 2 °C) by 18.9% and approaches the upper threshold of the UN38.3 standard (74 °C). Notably, at Location 11—the top area inside the container—a sustained high temperature of 68.56 °C was observed during the same period. While this remains within the safety margin of the GB38031 standard requirement (85 °C), it significantly surpasses typical road transport temperatures.
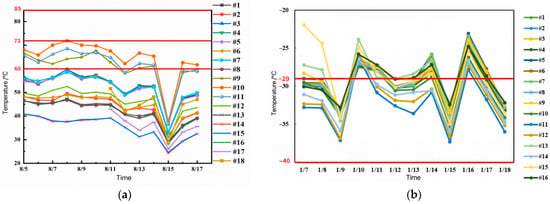
Figure 8.
Measured temperature curves for the (a) Turpan high-temperature test and (b) Mohe low-temperature test. The legends indicate the corresponding points seen in Table 3.
In the Mohe low-temperature test (Figure 8b), a minimum temperature of −37.36 °C was recorded at Location 11—the top area inside the container. This value is 27.4% lower than the ISTA 3E low-temperature limit (−29 ± 2 °C), but remains within the requirements of both the UN38.3 and GB38031 standards (−40 °C).
5.2. Vibration Analysis
In this study, FFT was applied to 10,000 km of highway transportation data to obtain the vibration PSD for the two transport routes. With a sampling frequency of 1 kHz, the resulting PSD curves exhibited distinct differences as the vibration frequency increased [36].
For both routes, experimental results indicate localised exceedances in the mid-to-high-frequency range when compared with the ISTA 3E and GB/T 4857 standards. However, no direct violations were observed relative to UN38.3, IEC 61373, or GB 38031. The frequency ranges tested by each standard are shown in Table 4. Structural optimisation should prioritise targeting the frequency bands that exceed ISTA 3E and GB/T 4857 thresholds. In addition, incorporating the sweep frequency resonance verification specified in GB 38031 is recommended to ensure the long-term reliability of batteries throughout their lifecycle.
Table 4.
Comparison of core requirements in standards.
These findings suggest that safety assessments for the transportation of lithium-ion batteries should incorporate actual vibration profiles based on specific transportation modes. This approach will help improve the applicability of test standards.
5.3. Shock Analysis
Based on the measured data from the Tianjin–Shanghai route, a total of 1237 valid impact events (acceleration ≥ 5 g) were recorded. Statistical distribution analysis (Figure 9) showed that approximately 12.3% of these events exceeded the 7 g limit specified by GB38031, while all values remained below the UN38.3 thresholds for large batteries (50 g) and small batteries (150 g).
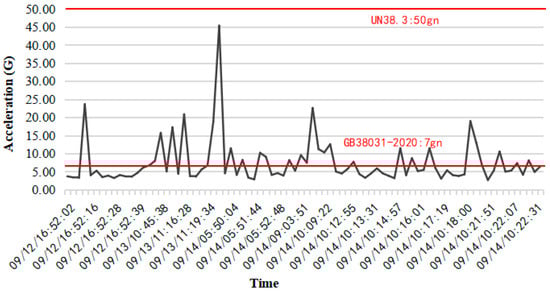
Figure 9.
Comparison of measured shock acceleration against current standards.
Notably, a single impact acceleration peak of 44.06 g was recorded at the vehicle floor on the Tianjin–Shanghai route, equivalent to 6.3 times the GB38031 standard, but only 88.1% of the UN38.3 large battery limit. This discrepancy likely stems from differences in the standard scope: UN38.3 primarily addresses international battery transportation safety, covering road, rail, sea, and air transport, while GB38031 is specifically designed for road transport, thus imposing lower impact limits. Therefore, it is recommended that the impact standards in GB38031 be revised to better reflect real-world impact conditions encountered in complex transportation environments.
5.4. Pressure Analysis
Cargo hold pressure measurements along the Wuhan–Frankfurt air route (Figure 7) exhibited a nonlinear dynamic relationship between cabin pressure and flight altitude. During ascent (0–10,000 m), pressure dropped sharply from 101.3 to 26.89 kPa at an average rate of 8.2 kPa/min. In the cruising phase (10,000–15,000 m), pressure fluctuations were limited to 11.6–15.2 kPa. Notably, the upper bound exceeded the UN38.3 standard limit of 11.6 kPa by 31.0%. During descent, the pressure recovery rate peaked at 12.5 kPa/min. Such high-frequency and rapid pressure changes may induce plastic deformation of lithium-ion battery casings [37].
While the UN38.3 low-pressure limit of 11.6 kPa aligns with the observed lower bound during cruising, it fails to account for the dynamic pressure variations occurring during ascent and descent. In contrast, the GB 38031 standard prescribes a limit of 61.2 kPa, intended for high-altitude road transportation, and is not suitable for the extremely low-pressure conditions in aviation. These findings indicate that current standards lack sufficient adaptability to dynamic cabin pressure fluctuations during air transport, and an expansion of the test coverage is necessary.
6. Conclusions
In this study, experimental measurements were conducted to collect test data on four critical environmental conditions—vibration, shock, temperature, and low pressure—that lithium-ion batteries might encounter during transportation or storage under extreme environments. These data were compared with the current standard limits to assess the applicability of existing regulations under extreme transport conditions. Recommendations for revising inadequate parameter thresholds were proposed to improve standard coverage.
Based on the discussions in Section 4 and Section 5, suggestions for updating national and international standards are provided. We recommend adopting the temperature limits and procedures defined in UN38.3 T.2 for high- and low-temperature testing (i.e., high temperature at 72 ± 2 °C and low temperature at −40 °C). For vibration testing, standards with exceeded frequency bands should be optimised by adjusting the peak frequency of the PSD curve. The allowable shock acceleration threshold should be increased to 50 g. For pressure testing, the minimum pressure tolerance should be lowered to 11.6 kPa.
This study offers a scientific reference for revising standard parameters to enhance the safety of lithium-ion batteries under extreme transportation and storage scenarios. Future investigations should be focused on further integrating multi-scenario empirical data and numerical simulation analyses to further refine the battery transportation safety evaluation framework.
Author Contributions
Funding acquisition, X.L. and J.W.; Investigation, Y.P.; writing—original draft preparation, Y.P. and H.Z.; writing—review and editing, X.L., J.W. and L.Z. All authors have read and agreed to the published version of the manuscript.
Funding
The authors thank National Key Research and Development Programof China (No. 2023YFC3009500).
Data Availability Statement
The original contributions presented in the study are included in the article, further inquiries can be directed to the corresponding author.
Conflicts of Interest
Authors Lina Zhu wasemployed by the company Shanghai Institute of Chemical Industry Testing Co., Ltd. The remaining authors declare that the research was conducted in the absence of any commercial or financial relationships that could be construed as a potential conflict of interest.
Abbreviations
The following abbreviations are used in this manuscript:
| FMEA | failure modes and effects analysis |
| UN38.3 | UN Manual of Tests and Criteria, Section 38.3 |
| PCM | phase change materials |
| PSD | power spectral density |
| SEI | solid electrolyte interphase |
| ICAO | International Civil Aviation Organization |
| IATA | International Air Transportation Association |
| FFT | fast Fourier transform |
| NCM | nickel–cobalt–manganese |
| NCA | nickel–cobalt–aluminum |
References
- Ministry of Transport of the People’s Republic of China (MOT). Statistical Bulletin on the Development of the Transport Industry in 2023; MOT: Beijing, China, 2024. Available online: https://xxgk.mot.gov.cn/2020/jigou/zhghs/202406/t20240614_4142419.html (accessed on 12 March 2025).
- OFweek Lithium Battery Network. Thermal Runaway and Fire Risks of Lithium Batteries During Transport: New Study Released. Available online: https://libattery.ofweek.com/2024-08/ART-36000-8130-30642053.html (accessed on 1 August 2024).
- Powder & Bulk Solids. Large Fire, Explosion at Lithium–Ion Battery Plant Results in Evacuations. Available online: https://www.powderbulksolids.com/industrial-fires-explosions/large-fire-explosion-at-lithium-ion-battery-plant-results-in-evacuations (accessed on 15 July 2024).
- Held, M.; Bronnimann, R. Safe cell, safe battery? Battery fire investigation using FMEA, FTA and practical experiments. Microelectron. Reliab. 2016, 64, 705–710. [Google Scholar] [CrossRef]
- Ullah, E.; Baig, M.M.; Hosseini, H.G.; Lu, J. Failure mode and effect analysis(FMEA) to identify and mitigate failures in a hospital rapid response system (RRS). Heliyon 2022, 8, e08944. [Google Scholar] [CrossRef] [PubMed]
- United Nations. UN Manual of Tests and Criteria, Rev. 22 (U38.3: Lithium Battery Testing); United Nations Publications: Geneva, Switzerland, 2022. [Google Scholar]
- International Safe Transit Association (ISTA). ISTA 3E Standard: Packaged–Products for Parcel Delivery System Shipment; ISTA: East Lansing, MI, USA, 2020. [Google Scholar]
- GB 38031-2020; Standardization Administration of China (SAC). Safety Requirements for Power Battery of Electric Vehicles. China Standards Press: Beijing, China, 2020.
- Texas Instruments. Best Practices for Board Layout of DC/DC Converters (Application Report SNAA390). Available online: https://www.ti.com/lit/an/snaa390/snaa390.pdf (accessed on 25 March 2025).
- Kwasiborska, A.; Ścigaj, S. Assessment of the risks associated with the handling and transportation of air shipments containing lithium–ion batteries. Energies 2025, 18, 1538. [Google Scholar] [CrossRef]
- Meng, D.; Weng, J.; Wang, J. Experimental investigation on thermal runaway of lithium–ion batteries under low pressure and low temperature. Batteries 2024, 10, 243. [Google Scholar] [CrossRef]
- Zhang, Y.; Lu, Y.; Jin, J.; Wu, M.; Yuan, H.; Zhang, S.; Davey, K.; Guo, Z.; Wen, Z. Electrolyte design for lithium–ion batteries for extreme temperature applications. Adv. Mater. 2024, 36, 2308484. [Google Scholar] [CrossRef]
- Feng, X.; Zheng, S.; Ren, D.; He, X.; Wang, L.; Cui, H.; Liu, X.; Jin, C.; Zhang, F.; Xu, C.; et al. Investigating the thermal runaway mechanisms of lithium–ion batteries based on thermal analysis database. Appl. Energy 2019, 246, 53–64. [Google Scholar] [CrossRef]
- Hammami, A.; Raymond, N.; Armand, M. Runaway risk of forming toxic compounds. Nat. Int. Wkly. J. Sci. 2003, 424, 635–636. [Google Scholar] [CrossRef]
- Wang, Q.; Ping, P.; Zhao, X.J.; Chu, G.; Sun, J.; Chen, C. Thermal Runaway Caused Fire and Explosion of Lithium Ion Battery. J. Power Sources 2012, 43, 210–224. [Google Scholar] [CrossRef]
- Feng, X.; Ouyang, M.; Liu, X.; Lu, L.; Xia, Y.; He, X. Thermal runaway mechanism of lithium ion battery for electric vehicles: A review. Energy Storage Mater. 2018, 10, 10246–10267. [Google Scholar] [CrossRef]
- James, M.L.; Vincent, R. On the parameters that influence road vehicles vibration levels. Packag. Technol. Sci. 2021, 34, 525–540. [Google Scholar] [CrossRef]
- Wang, Z.; Zhao, Q.; Yu, X.; An, W.; Shi, B. Impacts of vibration and cycling on electrochemical characteristics of batteries. J. Power Sources 2024, 601, 234274. [Google Scholar] [CrossRef]
- Du, W.; Chen, S. Effect of mechanical vibration on phase change material based thermal management module of a lithium–ion battery at high ambient temperature. J. Energy Storage 2023, 59, 106465. [Google Scholar] [CrossRef]
- GB/T 4857.23–2012; Standardization Administration of China (SAC). Packaging—Basic Tests for Transport Packages—Part 23: Random Vibration Test Method. China Standards Press: Beijing, China, 2012.
- IEC 61373:2010; Railway Applications—Rolling Stock Equipment—Shock and Vibration Tests. International Electrotechnical Commission (IEC): Geneva, Switzerland, 2010.
- Zhang, Y.; Li, Z.; Huang, Y.; Cui, B.; Zhou, J.; Guo, Y. Modelling and simulation of high–and low–speed impact damage of lithium batteries for light and small UAVs. Int. J. Impact Eng. 2023, 180, 104703. [Google Scholar] [CrossRef]
- Liu, Y.; Pan, Y.; Wang, H.; Li, H.; Bao, H.; Zhao, Z.; Liu, B. Mechanical issues of lithium–ion batteries in road traffic conditions: A review. Thin–Walled Struct. 2024, 201, 111985. [Google Scholar] [CrossRef]
- Li, R.; Li, W.; Singh, A.; Ren, D.; Hou, Z.; Ouyang, M. Effect of external pressure and internal stress on battery performance and lifespan. Energy Storage Mater. 2022, 52, 395–429. [Google Scholar] [CrossRef]
- Spielbauer, M.; Berg, P.; Soellner, J.; Peters, J.; Schaeufl, F.; Rosenmüller, C.; Bohlen, O.; Jossen, A. Experimental investigation of the failure mechanism of 18650 lithium–ion batteries due to shock and drop. J. Energy Storage 2021, 43, 103213. [Google Scholar] [CrossRef]
- Wang, G.; Guo, X.; Chen, J.; Han, P.; Su, Q.; Guo, M.; Wang, B.; Song, H. Safety performance and failure criteria of lithium–ion batteries under mechanical abuse. Energies 2023, 16, 6346. [Google Scholar] [CrossRef]
- Xie, S.; Yang, X.; Sun, Q.; Wang, Z.; He, Y. Research progress and prospects on thermal safety of lithium–ion batteries in aviation low–temperature and low–pressure environments. J. Energy Storage 2024, 83, 110734. [Google Scholar] [CrossRef]
- Xie, S.; Ping, X.; Yang, X.; Lv, P.; Li, G.; He, Y. Influence of atmospheric pressure on the aging mechanism of LiCoO2/graphite cells. Electrochim. Acta 2024, 474, 143541. [Google Scholar] [CrossRef]
- Chen, M.; Ouyang, D.; Weng, J.; Liu, J.; Wang, J. Environmental pressure effects on thermal runaway and fire behaviors of lithium–ion battery with different cathodes and state of charge. Process Saf. Environ. Prot. 2019, 130, 250–256. [Google Scholar] [CrossRef]
- Li, Y.; Jiang, L.; Huang, Z.; Jia, Z.; Qin, P.; Wang, Q. Pressure Effect on the Thermal Runaway Behaviors of Lithium–Ion Battery in Confined Space. Fire Technol. 2022, 59, 1137–1155. [Google Scholar] [CrossRef]
- IEC 60068–2–6:2020; Environmental Testing—Part 2–6: Test Fc: Vibration (Sinusoidal). International Electrotechnical Commission (IEC): Geneva, Switzerland, 2020.
- IEC 60068–2–64:2019; Environmental Testing—Part 2–64: Test Fh: Vibration, Broadband Random and Guidance. International Electrotechnical Commission (IEC): Geneva, Switzerland, 2019.
- International Civil Aviation Organization (ICAO). Technical Instructions for the Safe Transport of Dangerous Goods by Air (Doc 9284); International Civil Aviation Organization: Montreal, QC, Canada, 2023. [Google Scholar]
- International Air Transport Association (IATA). Dangerous Goods Regulations Manual, 64th ed.; International Air Transport Association: Montreal, QC, Canada, 2023. [Google Scholar]
- Shi, D.; Cui, Y.; Shen, X.; Gao, Z.; Ma, X.; Li, X.; Fang, Y.; Wang, S.; Fang, S. A review of the combined effects of environmental and operational factors on lithium-ion battery performance: Temperature, vibration, and charging/discharging cycles. RSC Adv. 2025, 15, 13272–13283. [Google Scholar] [CrossRef] [PubMed]
- Jongmin, P.; Sangil, C.; Mo, H.J. Measurement and Analysis of Vibration Levels for Truck Transport Environment in Korea. Appl. Sci. 2020, 10, 6754. [Google Scholar] [CrossRef]
- Chen, M.; Liu, J.; Ouyang, D.; Wang, J. Experimental investigation on the effect of ambient pressure on thermal runaway and fire behaviors of lithium-ion batteries. Int. J. Energy Res. 2019, 43, 4898–4911. [Google Scholar] [CrossRef]
Disclaimer/Publisher’s Note: The statements, opinions and data contained in all publications are solely those of the individual author(s) and contributor(s) and not of MDPI and/or the editor(s). MDPI and/or the editor(s) disclaim responsibility for any injury to people or property resulting from any ideas, methods, instructions or products referred to in the content. |
© 2025 by the authors. Licensee MDPI, Basel, Switzerland. This article is an open access article distributed under the terms and conditions of the Creative Commons Attribution (CC BY) license (https://creativecommons.org/licenses/by/4.0/).