Abstract
The rapid development of the modern power system puts forward high requirements for economic dispatch, and the defects of the traditional centralized economic dispatch method with low security and poor optimization effect have been difficult to adapt to the development of power system. Therefore, finding an economic dispatch method that reduces electricity generation costs and CO2 emissions is important. This study establishes a multi-region distributed optimization model and combines the multi-region distributed optimization model with a multi-gradient optimization algorithm to propose a multi-region distributed multi-gradient whale optimization algorithm (MRDMGWOA). In this study, MRDMGWOA is simulated on the IEEE 39 system and 118 system, and its performance is compared with other heuristic algorithms. The results show that: (1) in the IEEE 39 system, MRDMGWOA reduces the power generation cost and CO2 emission by 17% and 22%, respectively, and reduces the computation time by 16.14 s compared with the centralized optimization; (2) in the IEEE 118 system, the two metrics are further optimized, with a 20% and 17% reduction in the cost and emission, respectively, and an improvement in the computational efficiency by 45.46 s; (3) in the spacing, hypervolume, and Euclidian metrics evaluation, MRDMGWOA outperforms other algorithms; (4) compared with the existing DMOGWO and DMOMFO, the computation time of MRDMGWOA is reduced by 177.49 s and 124.15 s, respectively, and the scheduling scheme obtained by MRDMGWOA is more optimal than DMOGWO and DMOMFO.
1. Introduction
With rapid socio-economic development, the demand for electricity in various industries continues to rise [1]. Although various countries are now actively building new power systems centered on clean energy, thermal power still occupies an important position in them [2]. Thermal power generates heat energy and converts it into electricity primarily by burning fossil fuels [3]. Greenhouse gas emissions generated through the process of fossil fuel burning play a role in driving global warming and giving rise to ecological problems [4]. Therefore, exploring low-carbon emission and cost-effective power scheduling solutions has become the key to achieving sustainable social development [5].
The goal of economic dispatch (ED) of a power system is to rationally allocate the output of each generating unit to minimize generation costs, reduce carbon emissions, and improve energy efficiency while meeting system operational constraints [6]. Most traditional economic dispatch problems are solved using centralized methods [7]: (1) the dispatch center obtains the necessary information on all equipment in the system [8]; (2) dispatch centers analyze information from across the system [9]; (3) the dispatch center sends optimized information in the form of power generation commands to each device in the system [10]. The main existing centralized optimization methods are: linear programming [11], mixed-integer linear programming [12], quadratic programming method [13], and particle swarm optimization [14]. However, as the size of the grid grows, centralized optimization exposes many shortcomings [15]. For example: (1) centralized optimization requires real-time access to state data from each power plant and each load point and relies on highly reliable communication networks [16]; (2) centralized systems rely on a centralized control unit, and a failure of the central unit can bring down the entire dispatch system [17]; (3) centralized optimization makes it difficult to respond quickly to sudden changes or local failures that occur in the system [18].
Nowadays, most of the research focuses on distributed optimization at home and abroad [19]. Distributed optimization exhibits higher robustness and scalability compared to centralized optimization [20]. Distributed optimization provides greater information confidentiality than centralized optimization. In a distributed framework, each subsystem maintains the confidentiality of proprietary data such as operational state and topology information without compromising data privacy and decision independence [21]. In addition, distributed optimization has the following advantages: (1) in distributed economic dispatch (DED), communication costs are low because decision making and resource allocation are performed locally, eliminating the need for frequent centralized communication [22]; (2) distributed system architecture is more flexible and scalable, and the system can be scaled by adding or removing nodes, reducing the difficulty of implementation and maintenance [23]. The solution steps of distributed optimization are: firstly, distributed optimization decomposes the whole model into local models of participating intelligence; then, the boundary information is exchanged between neighboring intelligence, and each intelligence gets its own optimal solution through the distributed optimization method; ultimately, the set of optimal solutions of all intelligence constitutes the global optimal solution of the whole economic dispatch [24]. The main existing distributed optimization methods are: alternating direction multiplier method [25], target cascade approach [26], and optimal condition decomposition method [27].
Most of the early studies on the ED of power systems considered only a single objective, i.e., minimization of generation costs [28]. As power systems continue to evolve and under the growing pressure of global environmental conservation efforts, economic dispatch (ED) in power systems must take into account not only the reduction of generation costs to the minimum but also the environmental repercussions caused by CO2 emissions [29]. However, optimizing costs and CO2 emissions simultaneously is a conflicting issue. Reducing the cost of electricity generation usually requires the use of conventional fossil fuels for electricity generation, but the use of large quantities of extracted fossil fuels leads to large carbon emissions; optimizing carbon emissions requires the consideration of cleaner sources of energy for electricity generation, but the cost of cleaner sources of energy for electricity generation is high and uncertain [30]. Therefore, the study of multi-gradient economic dispatch (MGED) modeling that simultaneously satisfies low generation costs and low carbon emissions is of great interest [31]. In practice, MGED requires comprehensive consideration of the trade-off relationship between the two objectives, and other constraints need to be taken into account to balance the dual objectives of economic and environmental protection.
Distributed multi-gradient optimization methods can have the advantages of both distributed scheduling and multi-gradient dispatching. Existing distributed multi-gradient optimization methods mainly include: distributed multi-objective gray wolf optimizer (DMOGWO) [32], distributed multi-objective moth–flame algorithm (DMOMFO) [33], distributed multi-objective atomic orbital search algorithm (DMOAOS) [34]. Nevertheless, amid the swift advancement of intelligent algorithms and the ever-expanding scale of power systems, the existing MGED optimization approach, characterized by its sluggish calculation speed and subpar optimization performance, is no longer competent to fulfill the computational demands of large-scale multi-region power systems. For instance, when addressing the 118-system case, DMOGWO and DMOMFO exhibit several critical drawbacks. Firstly, their high computational cost stems from the need to evaluate multiple objectives iteratively while maintaining population diversity, which becomes computationally prohibitive as problem scale increases. Secondly, both algorithms demonstrate significant carbon footprint concerns due to excessive energy consumption during prolonged optimization runs, particularly when deployed on large-scale power systems requiring real-time decision making. Consequently, it becomes imperative to put forward a novel optimization algorithm to align with the computational demands of contemporary power systems.
To surmount the drawbacks of the currently available ED optimization approaches, this study combines the multi-region distributed optimization model and multi-gradient whale optimization algorithm (MGWOA) [35] and proposes a multi-region distributed multi-gradient whale optimization algorithm (MRDMGWOA). Multi-area distributed optimization methods can simplify the complexity of system computation and have faster solution speed and better convergence than centralized optimization methods in addressing power systems of high complexity; the MGWOA is highly adaptive and can adjust the search strategy according to the changes in the environment and objectives, and it is better than GWO [36], PSO [37], MFO [38], and GOA [39] in solving multi-gradient optimization problems. The standard deviation of MGWOA in solving real engineering problems such as disc brake, four-bar truss, and reducer is lower than PSO, MFO, GWO and GOA, which indicates that the MGWOA has the advantages of high accuracy and good performance. In addition, the bubble net attack mechanism of MOWOA generates diversified search paths in the decision space to avoid local Pareto front stagnation caused by premature particle swarm aggregation in MOPSO. MGWOA can obtain a stable system with low overshooting and oscillation frequencies under the microgrid model, and the computation speed of MGWOA is faster than that of PSO, MFO, GWO, and GOA. Therefore, MGWOA is characterized by excellent performance and global search capability. MRDMGWOA can overcome the deficiencies of DMOGWO and DMOMFO, such as slow computation speed and poor optimization effect, thus meeting the requirements of real-time dispatching in power systems. The existing ED optimization methods are shown in Table 1.

Table 1.
Optimization framework and algorithms for ED.
The principal contributions made by this study are as follows:
- (1)
- Considering the existing centralized approaches with the defects of slow calculation speed and low privacy, this study establishes a multi-region distributed optimization model to handle the distributed dispatch problem. The multi-region distributed optimization model can reduce the communication burden of the power system and effectively protect the security of the equipment.
- (2)
- Considering that there is a lack of pertinent literature offering an in-depth investigation into the multi-region distributed optimization framework, the concept of multi-region distributed optimization is combined with MGWOA, leading to the proposal of MRDMGWOA to address this framework. MRDMGWOA can compensate for the limitations of centralized optimization in dealing with complex constraints and regional autonomy.
- (3)
- Multi-region distributed optimization can only solve the problem of distributed optimization, and MGWOA can only solve the problem of multi-gradient optimization, which is not strongly correlated. In contrast, the MRDMGWOA has the advantages of both MGED and multi-regional distributed optimization and can solve both problems simultaneously.
- (4)
- The proposal of MRDMGWOA fills the gap of the multi-region distributed optimization framework.
2. Multi-Regional Distributed Low-Carbon Dispatch Model
The multi-region distributed low-carbon scheduling model further divides the system into multiple independent regions on the basis of distributed optimization, with distributed optimization within each region, thus optimizing the operation of large-scale power systems more efficiently.
2.1. Objective Function for Economic Dispatch
The objective function of ED of the power system is mainly to minimize the generation cost. Where the objective function of generation cost is:
where denotes the total generation cost objective function; denotes the number of thermal power units; denotes the active output of the hth thermal unit in t; is the generation cost of the hth thermal unit in t; T denotes the dispatching period (set to 24 h in this paper); , , and are the quadratic, primary, and constant term coefficients of the cost of generating electricity for the hth thermal unit, respectively.
Since the power sector is one of the main sources of greenhouse gas emissions such as CO2, ED should not only consider the issue of power generation cost but also the reduction of CO2 emissions. Therefore, this study sets the objective function of carbon emission minimization, i.e.,
where is the objective function for total carbon emissions; , , and are the quadratic, primary, and constant term coefficients of carbon emissions from thermal power units, respectively.
2.2. Constraints for Economic Dispatch
The constraints for ED of power systems mainly include equation constraints and inequality constraints.
where denotes the system load demand at time t.
The inequality constraints are:
where and represent the lower and upper limits of the units’ active power, respectively; denotes the active output of the unit at the moment t − 1; denotes the active output of the unit at moment t; , are the up and down climb values of the power of the genset; stands for 60 min.
2.3. Computational Principles of Multi-Region Distributed Economic Dispatching
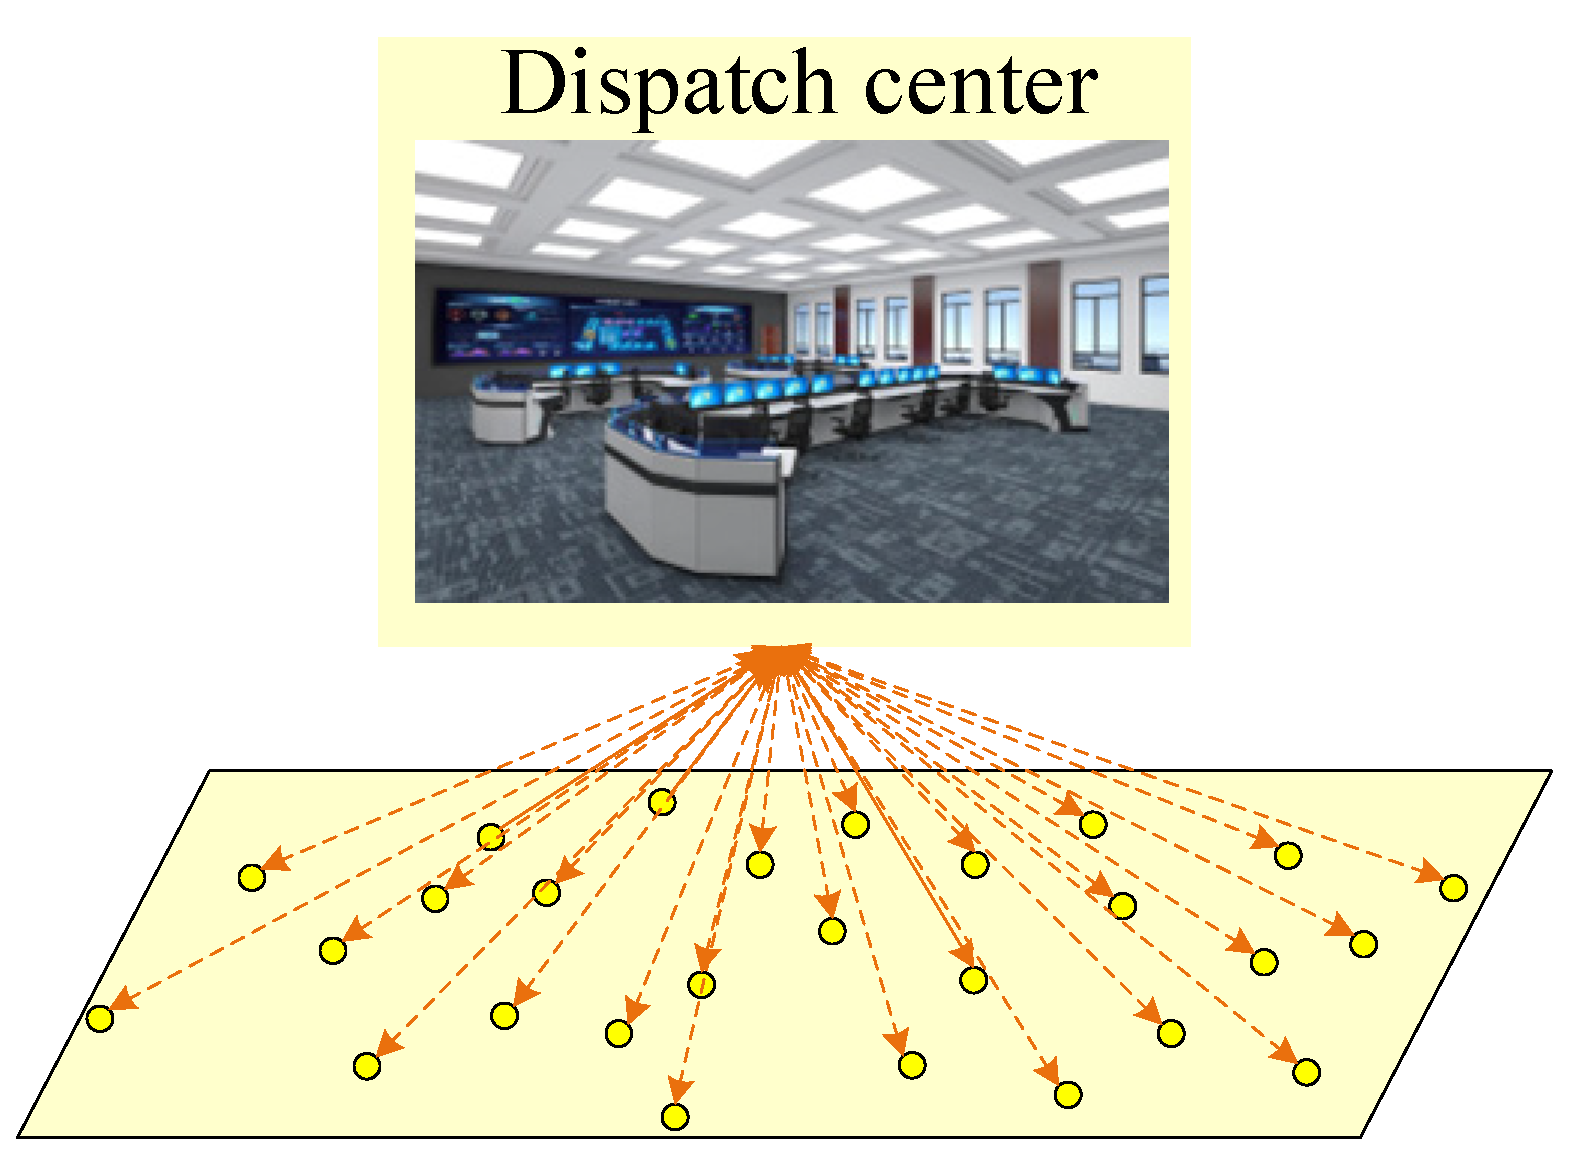
Traditional ED employs mostly centralized economic dispatch (CED). All dispatch decisions and control instructions within CED are made and given from a centralized dispatch center (as shown in Figure 1).
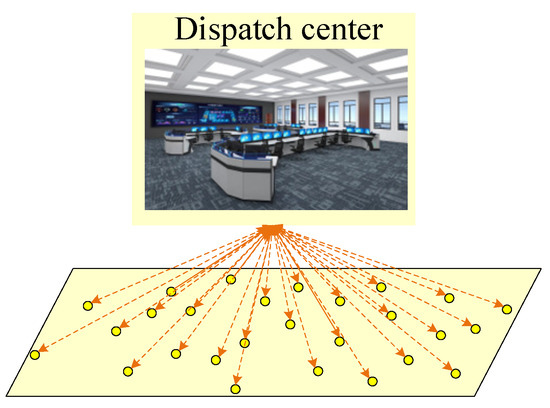
Figure 1.
CED model.
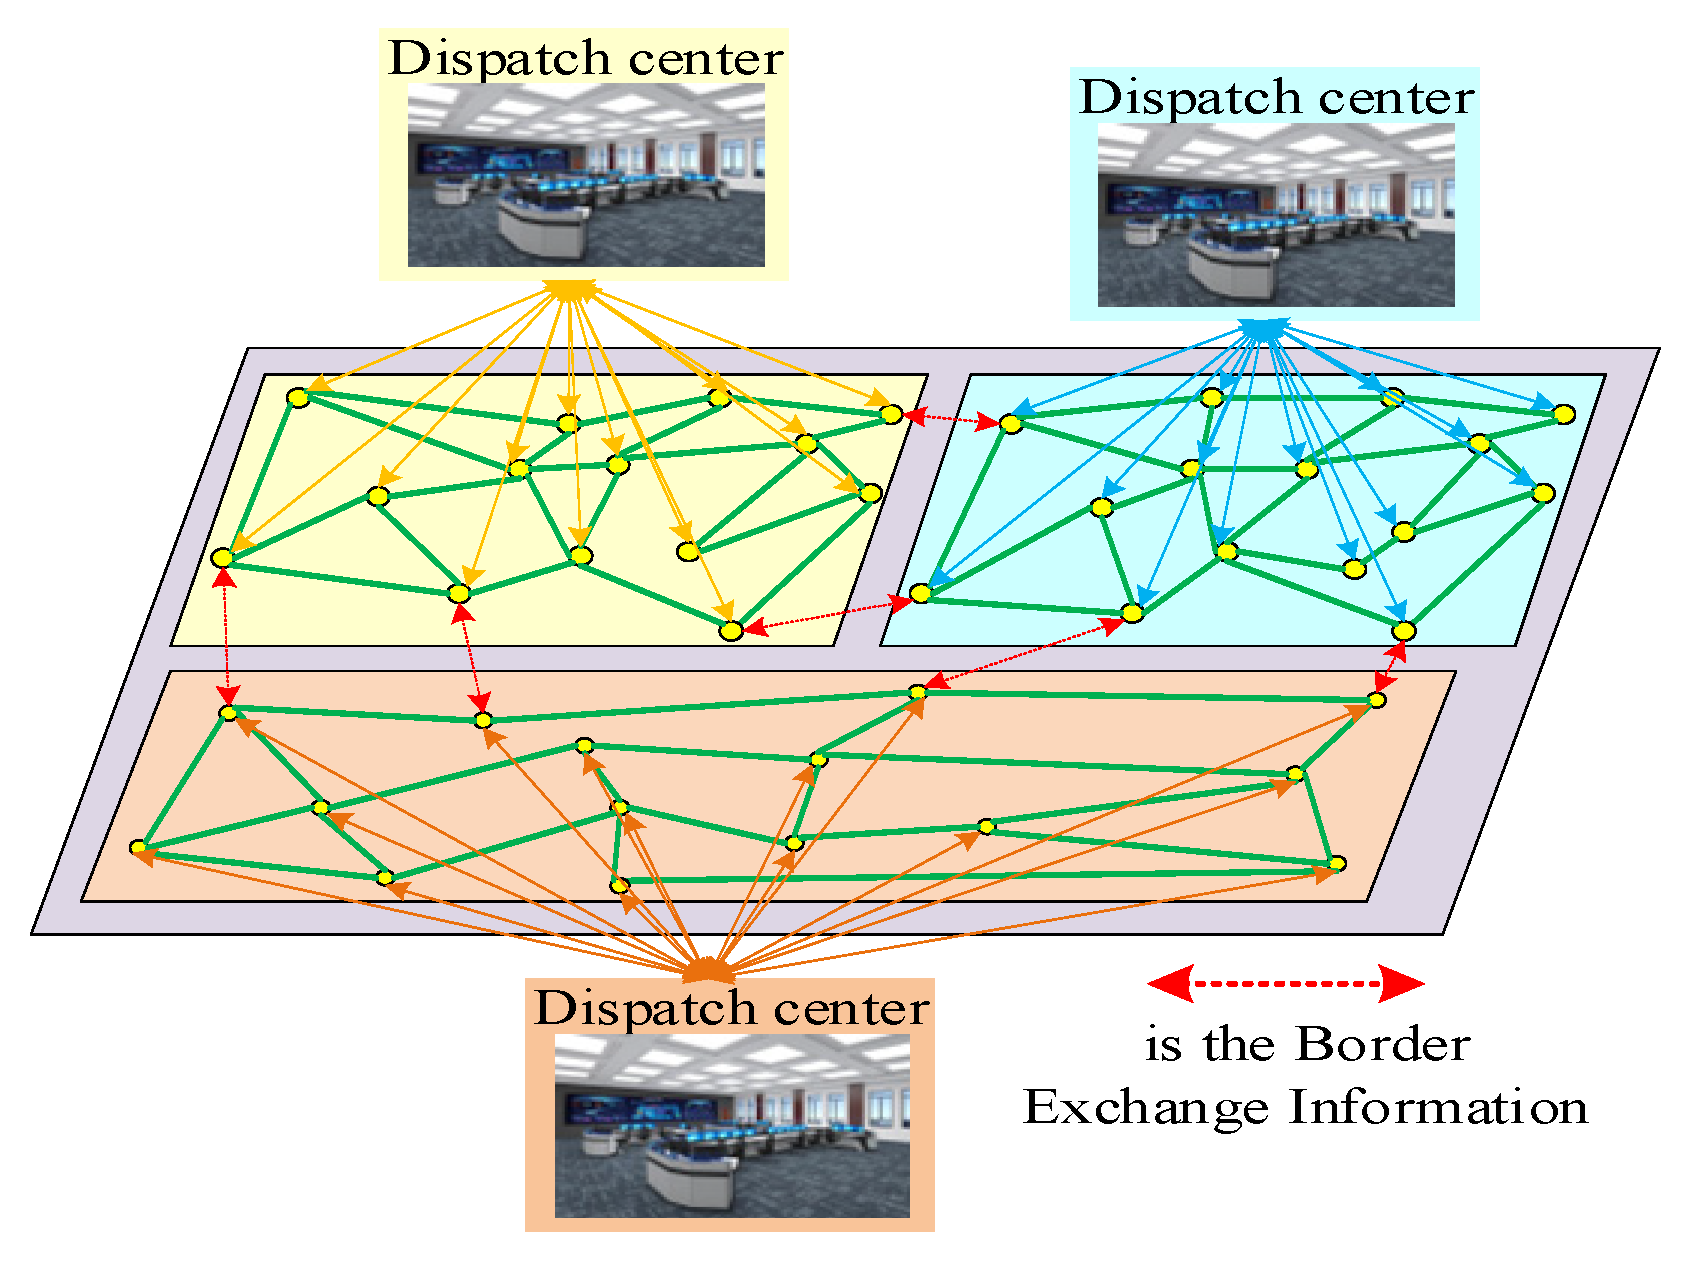
In distributed economic dispatch (DED) optimization, each unit acts as an independent intelligent body, optimizing its own objectives while exchanging only part of the information with neighboring intelligence, thus realizing the distributed and coordinated optimization of the system (as shown in Figure 2).

Figure 2.
DED model.
As shown in Figure 3, multi-region distributed optimization is a further refinement of distributed optimization to multiple independent regions (e.g., different geographic regions or power grids). The solution principle of multi-region distributed economic dispatch is that the complete system is divided into several subregions, each of the subregions is optimized independently and in parallel, and the optimal power generation calculated in each region is exchanged through virtual contact lines. Compared with traditional distributed optimization, multi-region distributed optimization enables cross-region wide-scale optimization.
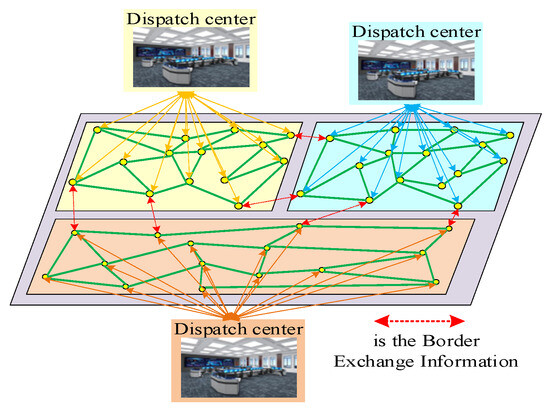
Figure 3.
Multi-regional distributed economic dispatch modeling.
Distributed computing that divides the system into multiple subregions can improve the overall optimization calculation speed of the system. The distributed computing method used in this paper is the bus-tearing method. The bus-tearing method is to divide a large system into several non-overlapping subregions on the basis of satisfying the constraints of each subregion and contact line. The bus-tearing method is an equivalent treatment of the grid, which focuses on separating and decoupling the contact variables between the subregions while ensuring the balance of the boundary variables of the two subregions. In order to ensure the balance of the boundary variables of the two subregions, the bus-tearing method needs to disconnect the contact lines between the subregions and add new virtual nodes in each subregion. Each virtual node corresponds to several virtual variables, including voltage magnitude, voltage phase angle, and active power injected into the node. The variables of the two virtual nodes corresponding to the same disconnected contact line should be balanced, which is reflected in the algorithm by periodically exchanging the boundary information of each region.
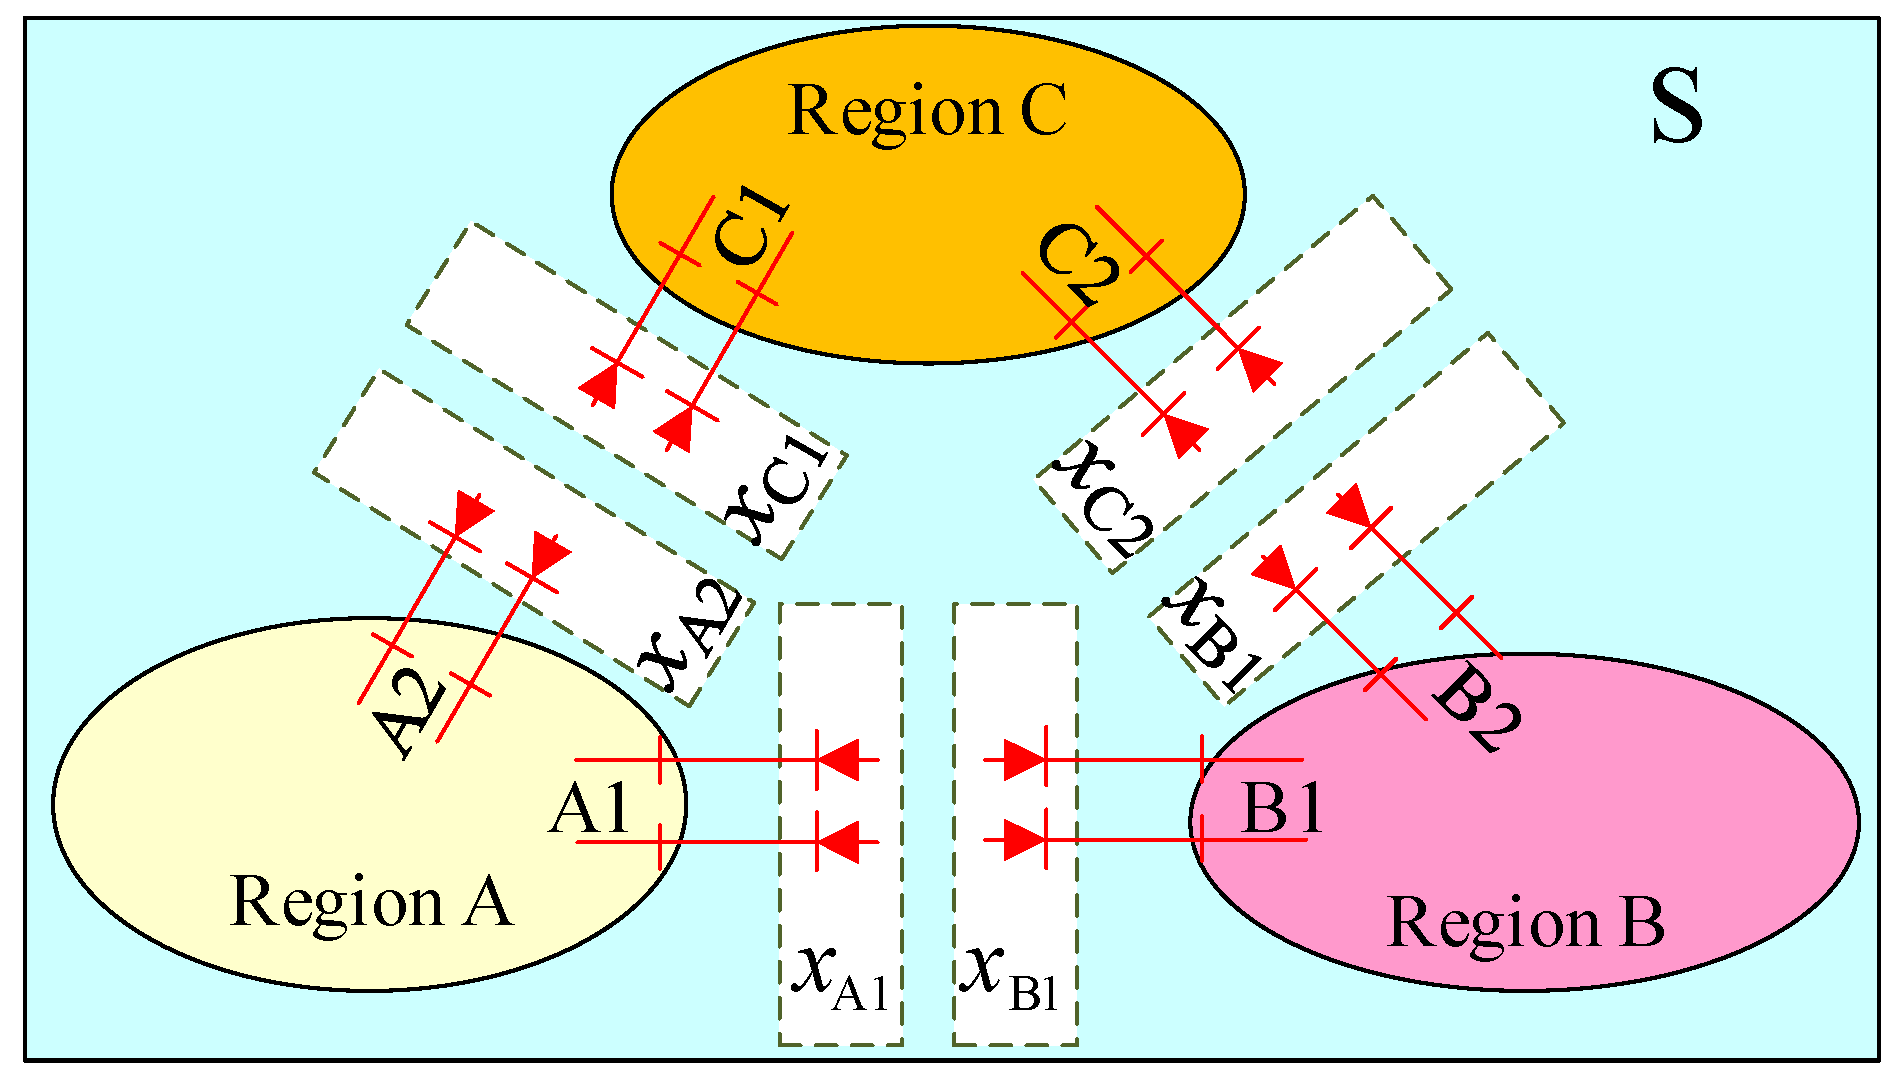
Taking the three-region distributed dispatch system in Figure 4 as an example, the busbar-tearing approach is used to divide the whole system S into three subregions, A, B, and C, and the regions are interconnected with each other through contact lines. A1, A2, B1, B2, C1, C2 are the virtual boundary buses of the corresponding regions; , , , , , are dummy boundary variables for the corresponding regions.
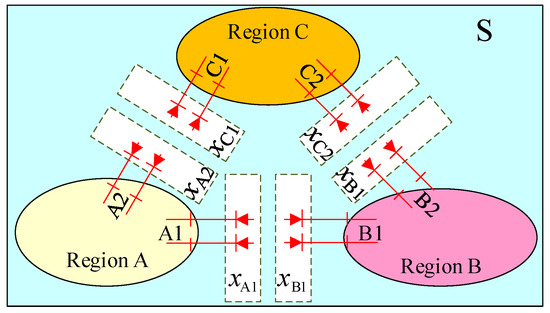
Figure 4.
Computational principles of three-region distributed systems.
In the three-region distributed system of Figure 4, the three-region distributed model with two objectives can be built by specifying the boundary nodes among the regions as the same node, which transforms the multi-gradient problem into Equation (5).
where , , and denote the carbon emission targets of each region; , , and denote the generation cost targets for each region; , , and denote the equation constraints for each region; , , and denote the inequality constraints for each region; is the power flow coefficient for regions A and B. To guarantee the consistency of power flow, this study sets the power flow from region C to regions A and B to be positive and the power flow from region A to region B to be positive.
By explicitly specifying the power direction through the above formulation, this study has quantitatively dealt with the tidal directionality problem at the model level: the region-partitioning strategy is independent of the direction, while the boundary coordination mechanism achieves ambiguity-free information interaction and constraint checking through the symbolic power variables. This setup resolves the potential ambiguity caused by the directionality of the tidal currents and ensures the synergetic consistency among regions in distributed optimization.
3. Multi-Region Distributed Multi-Gradient Whale Optimization Algorithm
This section first introduces the principles of the MGWOA, followed by the application of MGWOA to a multi-region distributed scheduling system.
3.1. Whale Optimization Algorithm
Inspired by the feeding behavior of whales in nature [40], especially the unique feeding strategy of humpback whales, the whale optimization algorithm (WOA) solves complex optimization problems by simulating their natural behavior [41]. WOA comprises the key stages outlined as follows:
- (1)
- Initialization phase
The formula for initializing the location of the whale stock in the WOA is as follows:
where is the position of the ith whale; and are the lower and upper bounds of the whale search space; is between [0, 1].
- (2)
- Siege phase
This phase simulates the behavior of a whale encircling its prey, where the whale adjusts its position according to the current position of the optimal solution and gradually moves closer to its prey. The manifestation of this behavior is captured by the subsequent equations:
where t indicates the current number of iterations; and are the coefficients; is the location of the current solution set; is the location of the current optimal solution; a decreases from 2 to 0 during the iteration.
- (3)
- Bubble net attack methodology (development phase)
To simulate the behavior of humpback whales swimming around their prey in a contracted circle while following a spiral path, a stochastic selection mechanism was devised so that the whales had a 50% probability of choosing either the contracted surround or spiral model to update their position during the optimization process. The mathematical model is as follows:
where b is a constant defining the shape of the logarithmic spiral; l is in [−1, 1]; denotes the best solution obtained by the algorithm so far; p is between [0, 1].
- (4)
- Finding prey (search phase)
In addition to the bubble net method of predation, humpback whales randomly seek out prey by changing the value of AX. When , the whale will move away from the target prey. In contrast to the bubble net feeding phase, here the position of one whale will be randomly selected as a reference to update the next position, instead of the so far optimal individual position. The math formula for the search phase is as follows:
where denotes the location of a random whale.
The optimization mechanism of WOA consists of three core aspects: firstly, a dynamic parameter adjustment strategy is adopted to achieve a balanced regulation of global exploration and local development by a linearly decrease from the initial value of 2 to 0; secondly, a dual decision-making mechanism is introduced in the position-updating process, which adopts a randomized individual guidance strategy when and switches to the current optimal solution guidance mode when . In addition, the traversal capability of the solution space is effectively expanded by intelligently switching the two motion modes of spiral envelopment and spinning search through the probability threshold parameter p. The algorithmic process starts from initializing a random candidate solution set, and after several rounds of iterative optimization, the optimal solution is output when a preset convergence condition is reached. This composite mechanism, incorporating parameter tuning, multi-mode search, and intelligent decision making, significantly improves the adaptability of the algorithm in different problems.
3.2. Multi-Gradient Whale Optimization Algorithm
MGWOA is improved and optimized based on WOA [42]. The main optimization mechanisms introduced by MGWOA are the non-dominated ordering mechanism and the congestion distance screening mechanism. The introduction of these two mechanisms enables WOA to efficiently select Pareto-optimal solutions to smoothly solve multi-gradient problems, while ensuring diversity of Pareto frontiers and algorithmic exploration. The following is a detailed description of the two mechanisms.
- (1)
- Non-dominated sorting mechanisms
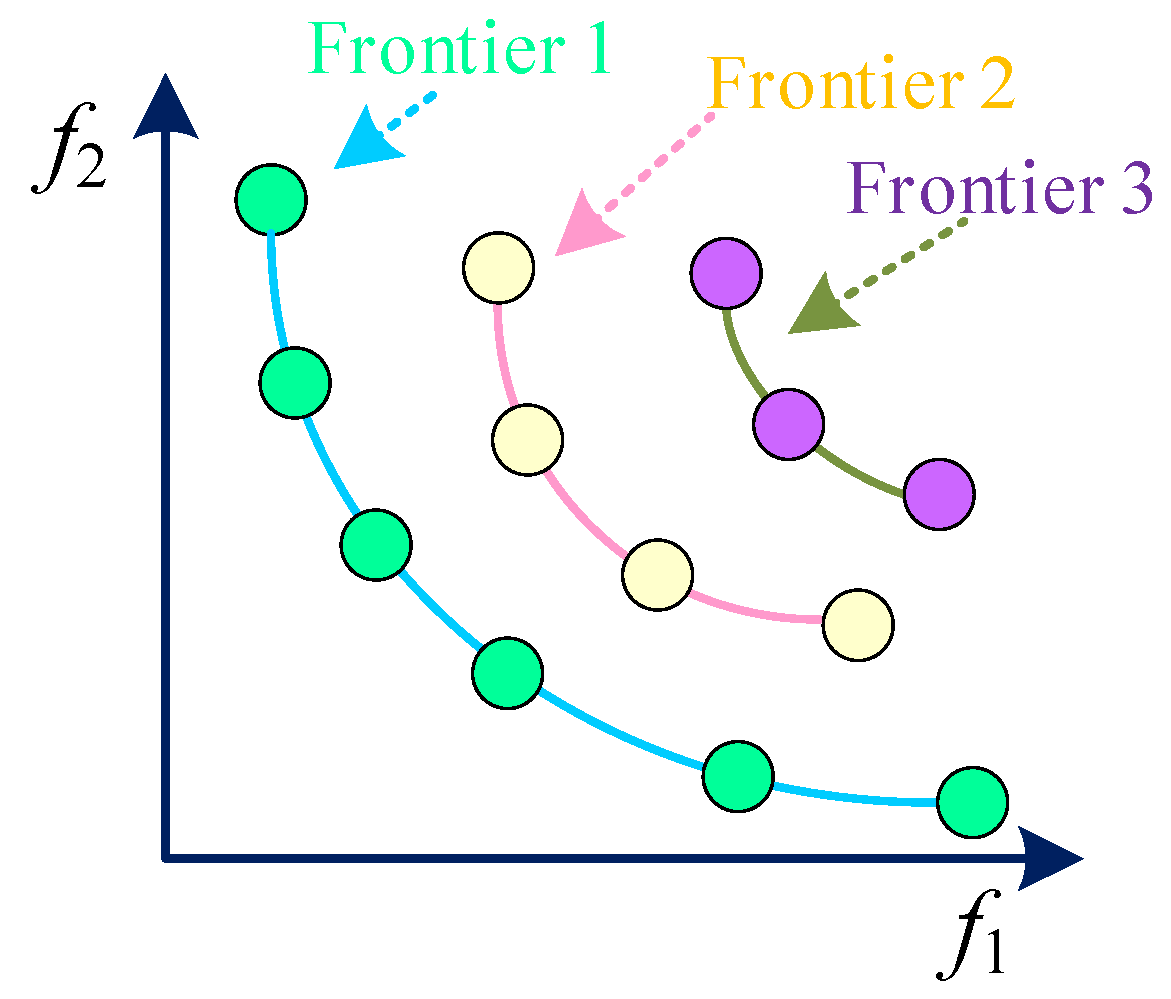
The non-dominated sorting mechanism evaluates the fitness values of the initial populations generated or the solutions generated after the WOA search. The non-dominated sorting mechanism operates as follows: first, the fitness values of the population are traversed, and the set of individuals that are not dominated by any individual is taken as the first frontier and its non-dominated rank is set to 1. Then, among the remaining sets, the set of individuals that are not dominated by any individual continues to be identified and is taken as the second frontier, and its non-dominated rank is set to 2. Subsequently, the remaining sets are traversed again and the above process is repeated, with the sets that are not dominated by any individual as the third frontier, the fourth frontier, etc., in order, and the corresponding non-domination levels are set. This process will continue until all individuals are assigned to different non-dominated ranks. The principle of non-dominated ranking is shown in Figure 5.
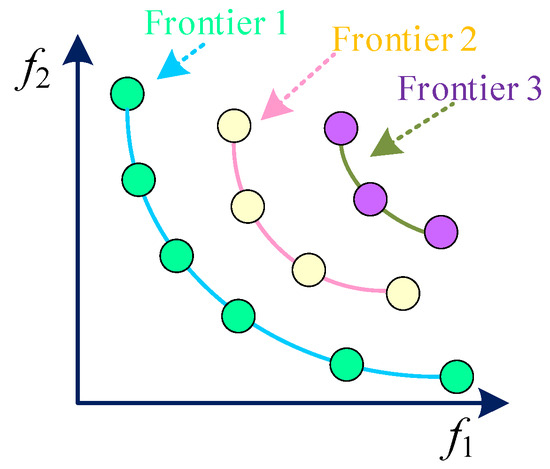
Figure 5.
Principles of non-dominated sorting mechanisms.
- (2)
- Congestion distance screening mechanism
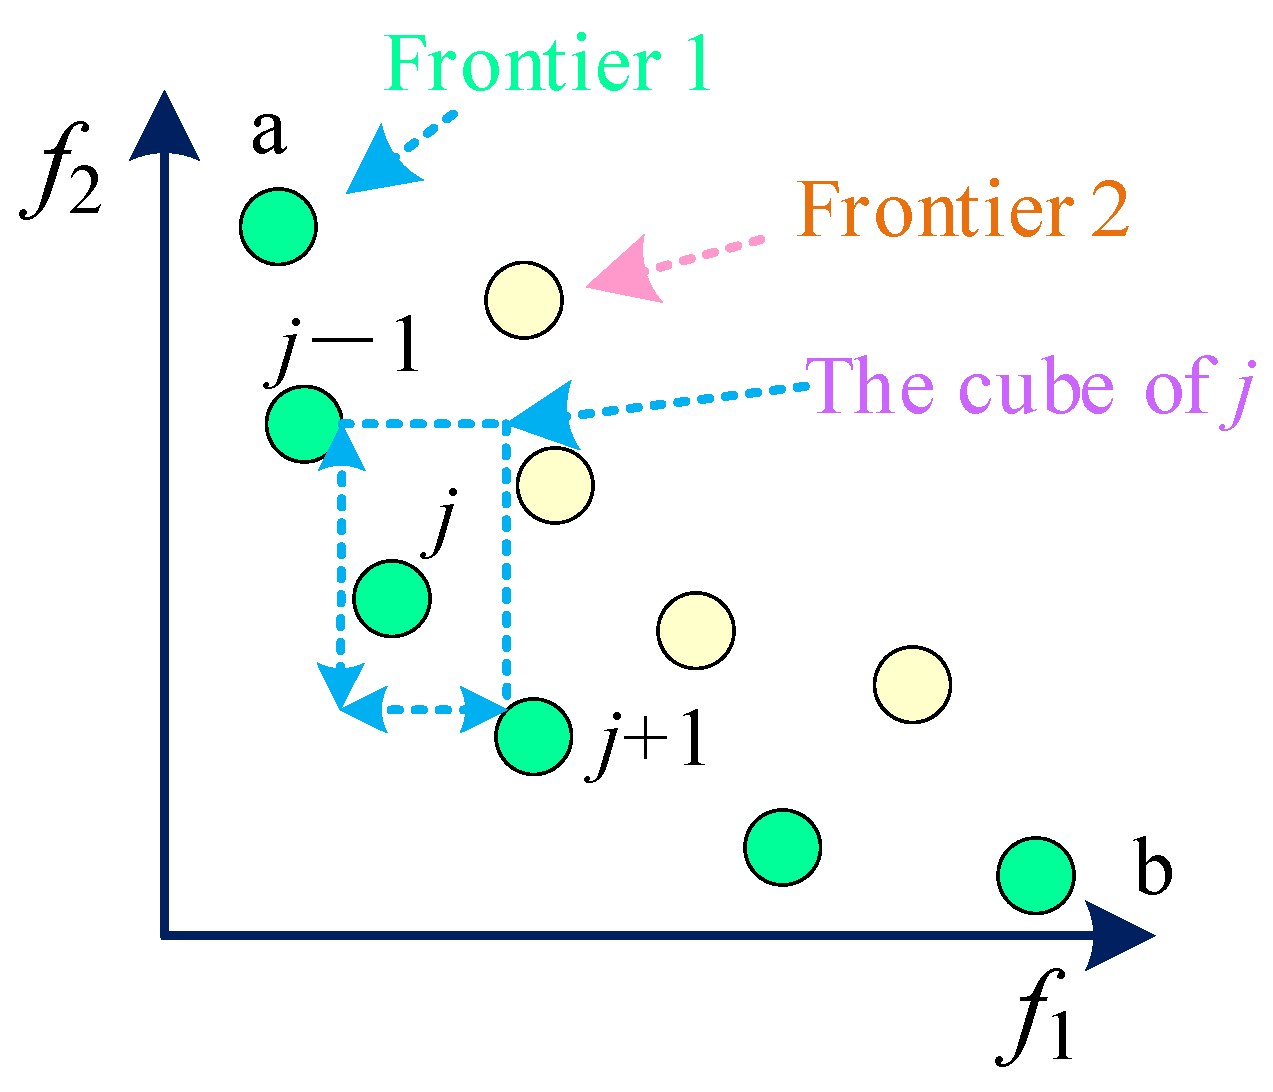
In the iterative process of MGWOA, an increasing number of individuals will gradually result in greater spatial crowding within the archive. Consequently, to preserve population diversity, it is necessary to eliminate individuals with the minimal crowding distances and introduce new ones into the archive, thereby achieving a more optimal Pareto solution set (shown in Figure 6). The approach for calculating congestion distance is presented in Equation (14).
where and denote the maximum and minimum values of the jth objective function, respectively.
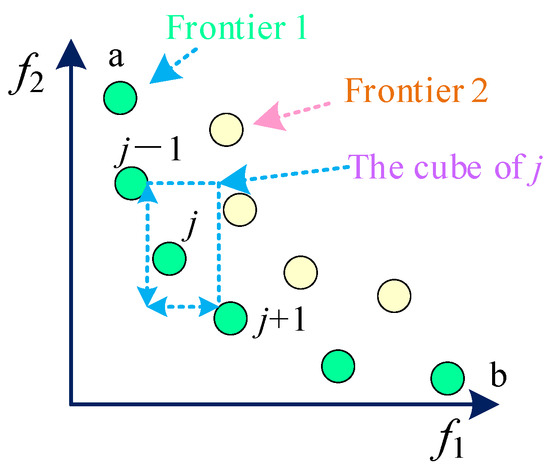
Figure 6.
Principle of congestion distance screening mechanism.
3.3. Introduction of a Multi-Regional Distributed Model
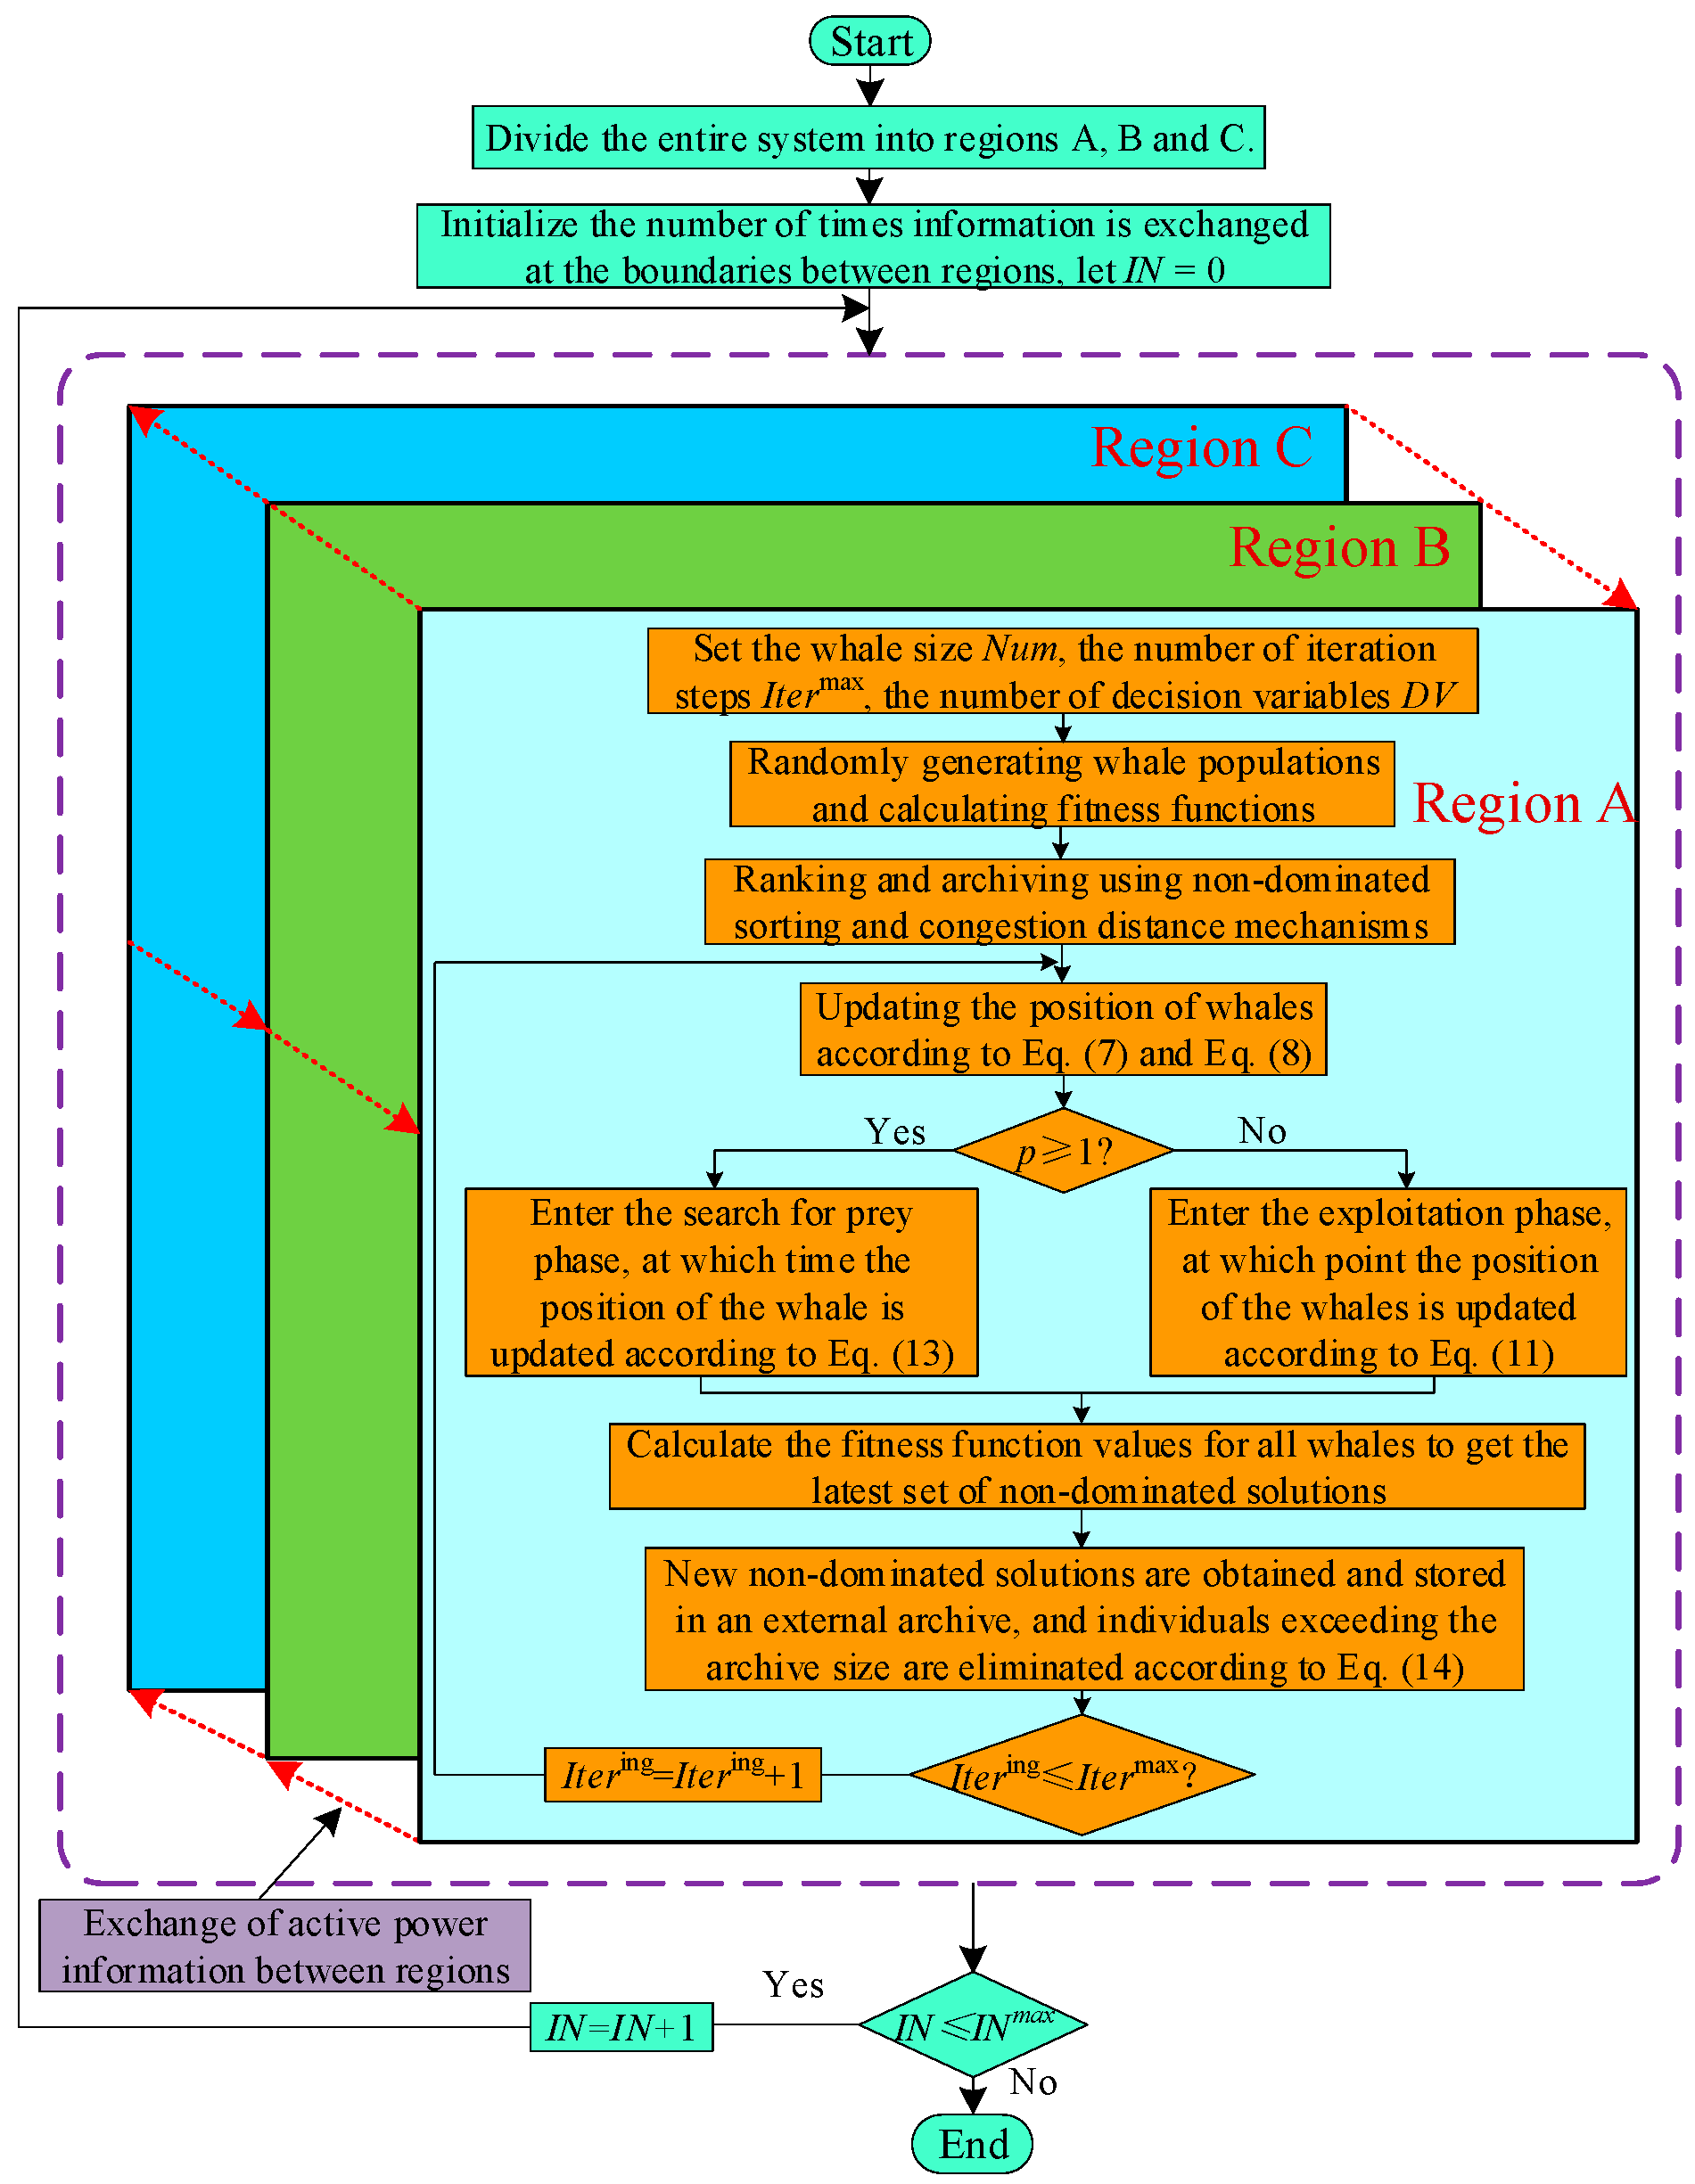
In this study, a multi-region distributed model is introduced in the multi-gradient whale optimization algorithm and MRDMGWOA is proposed. The multi-region distributed optimization approach enables the partitioning of the entire system into multiple subregions, with each subregion undergoing optimization as a cohesive unit through the exchange of merely a portion of the information pertaining to the boundary nodes of the region. The information exchanged between the regions is the active output of the boundary node that acts as a virtual generator after the bus is torn. The computational flow of MRDMGWOA is shown in Figure 7:
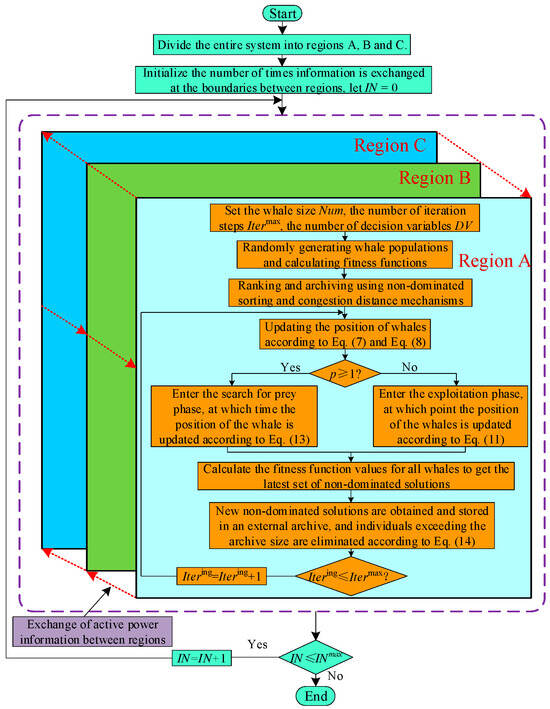
Figure 7.
MRDMGWOA calculation process.
Step 1: Start; enter system and generator parameters.
Step 2: Divide the system into three subregions A, B, C.
Step 3: Set the count of times the boundary exchanges data, letting .
Step 4: Regions A, B, and C are optimized in parallel (i.e., Step 4, Step 5, and Step 6 are optimized simultaneously).
Step 4.1: Set the number of whales in region A , the maximum number of iterations , and the number of decision variables .
Step 4.2: Under the constraints, the whale population was randomly generated and the fitness function of the whale population was calculated.
Step 4.3: Hierarchical classification of whale populations using the non-dominated sorting mechanism and the congestion distance mechanism and archiving of populations.
Step 4.4: The position of the whale is updated according to Equations (6) and (7).
Step 4.5: Determine whether ; if p < 0.5, the whale enters the exploitation phase and uses the bubble net method to attack the prey, at which time the position of the whale is updated according to Equation (10); if , the whale enters the prey search phase, at which time the position of the whale is updated according to Equation (11).
Step 4.6: The fitness function values were calculated for all whales after updating their positions.
Step 4.7: The updated whale population was deposited in an external archive, and then the population in the external archive was ranked using the non-dominated sorting mechanism and the crowding distance mechanism, and individuals exceeding the archive size were eliminated according to Equation (12).
Step 4.8: Determine . If it is not greater than, make and return to Step 4.4; if the condition is satisfied, exchange the boundary information with the other two regions.
Step 5: Optimization of region B.
Step 5.1–Step 5.8 are the same as Step 4.1–Step 4.8.
Step 6: Optimization of region C.
Step 6.1–Step 6.8 are the same as Step 4.1–Step 4.8.
Step 7: Determine if is satisfied. If it is satisfied, go to Step 8; if it is not satisfied, make , and go back to Step 4.
Step 8: Output optimization outcome.
Thus, the MRDMGWOA has the following properties:
- (1)
- The MRDMGWOA is the first of its kind to combine a multi-area distributed optimization framework with heuristic intelligence algorithms as a cross-fertilization between the fields of power system optimization and computational intelligence algorithms. The multi-region distributed optimization paradigm facilitates the segmentation of the power system into several subregions, thereby mitigating the challenges associated with solving large-scale power system problems; MGWOA can achieve a balance between economy and environmental protection through iterative optimization.
- (2)
- The ED is characterized by high dimensionality, non-linearity, non-convexity, and multiple constraints, while the MRDMGWOA proposed in this study can effectively handle these complex features and can meet the real-time scheduling requirements through the powerful optimization-seeking capability of MGWOA.
- (3)
- In ED of power systems, each region is not an isolated unit. If MGWOA is directly applied independently in each region, with each region only optimizing its own economic efficiency and carbon emissions, it may lead to conflicts in solutions between regions. MRDMGWOA addresses this issue by designing a multi-regional Pareto frontier fusion mechanism: at the regional level, MGWOA in each region generates a local frontier; at the system level, the algorithm constructs a global Pareto frontier through non-dominated sorting. MRDMGWOA ensures that the final solution not only satisfies the constraints of each region but also achieves the optimal trade-off between global economic efficiency and global carbon emissions, which cannot be achieved by independently applying MGWOA without the fusion and global optimization of cross-regional solutions.
4. Case Studies
This study applies the IEEE 39 and 118 systems to verify the feasibility of MRDMGWOA in solving ED problems. The virtual environment platform used in this section is MATLAB (R2024b) and the CPU model used is Inter (R) Core (TM) i7-13600KF with 3.5 GHz and 64 GB of memory (RAM). The cost coefficients and generator set parameters for the IEEE 39 and 118 systems are taken from the literature [43] and [44]. The main reason for choosing two and three regions for simulation validation in this study is that most of the existing references have been studied with two and three regions. Although partitioning more regions may lead to finer local optimization, it will significantly increase the coordination cost and communication overhead between regions. In addition, too many partitions can lead to complexity in the constraints of the system as well as higher management costs.
4.1. IEEE 39 System (Case I)
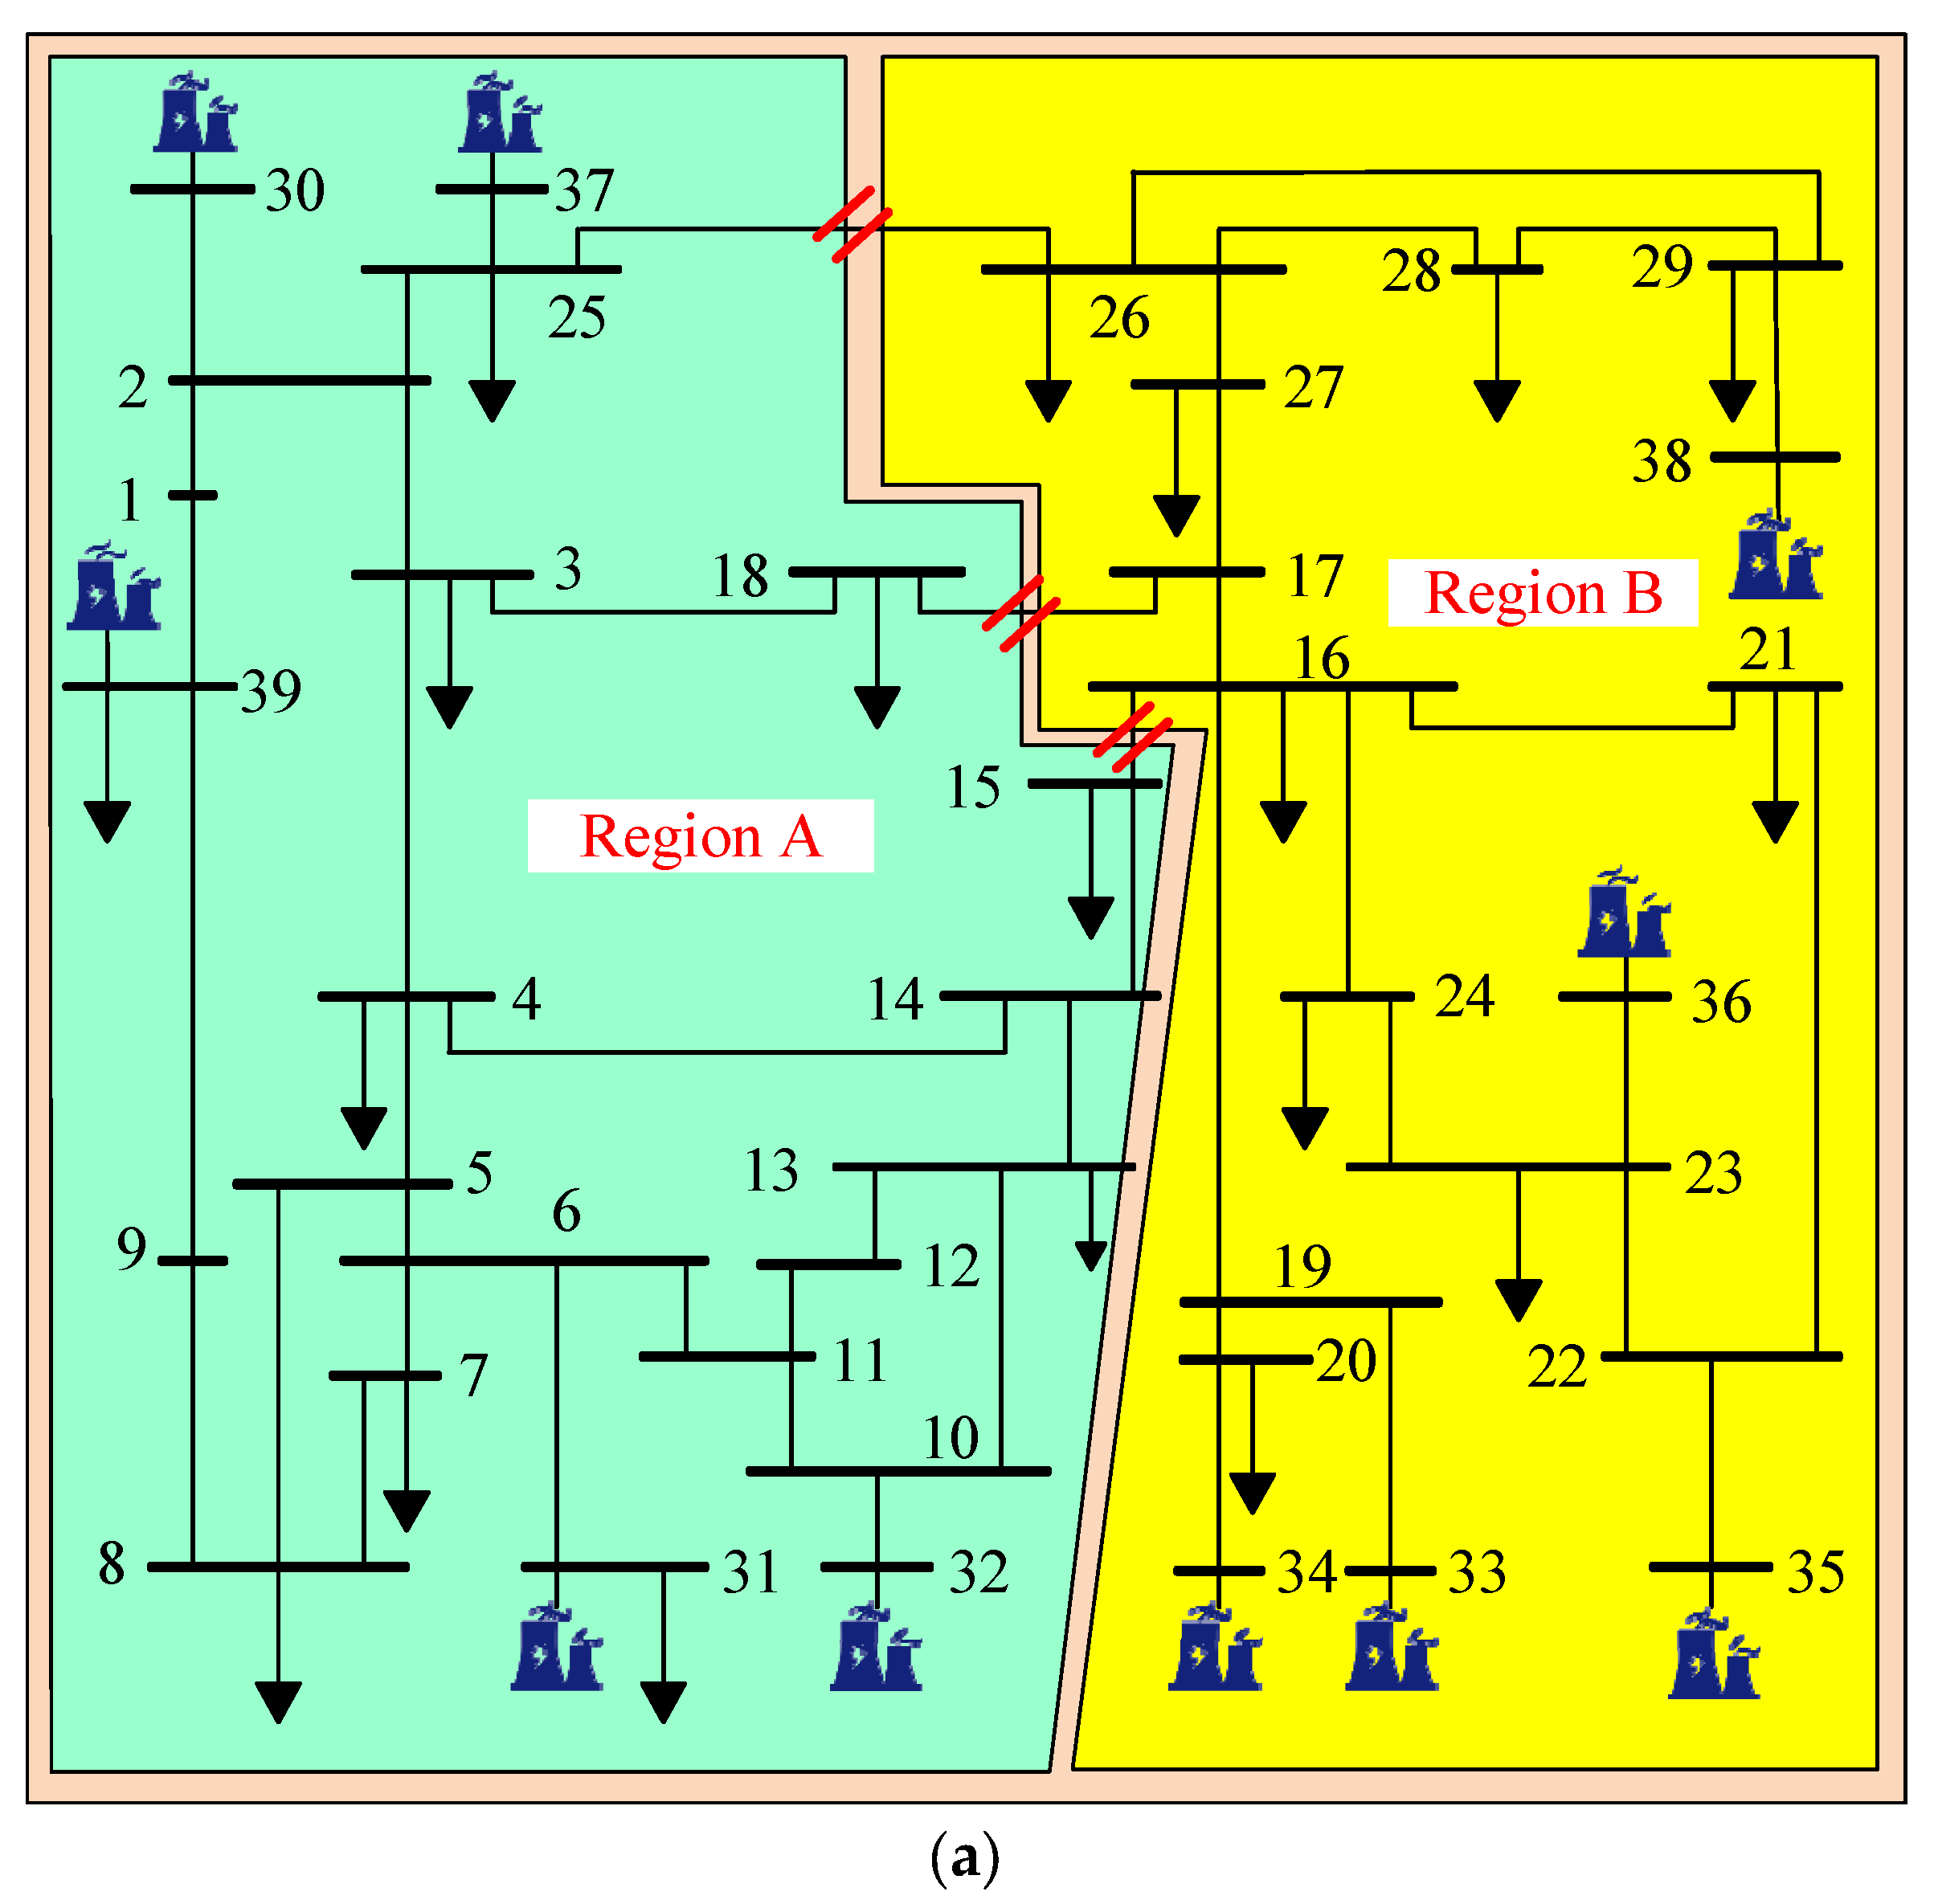
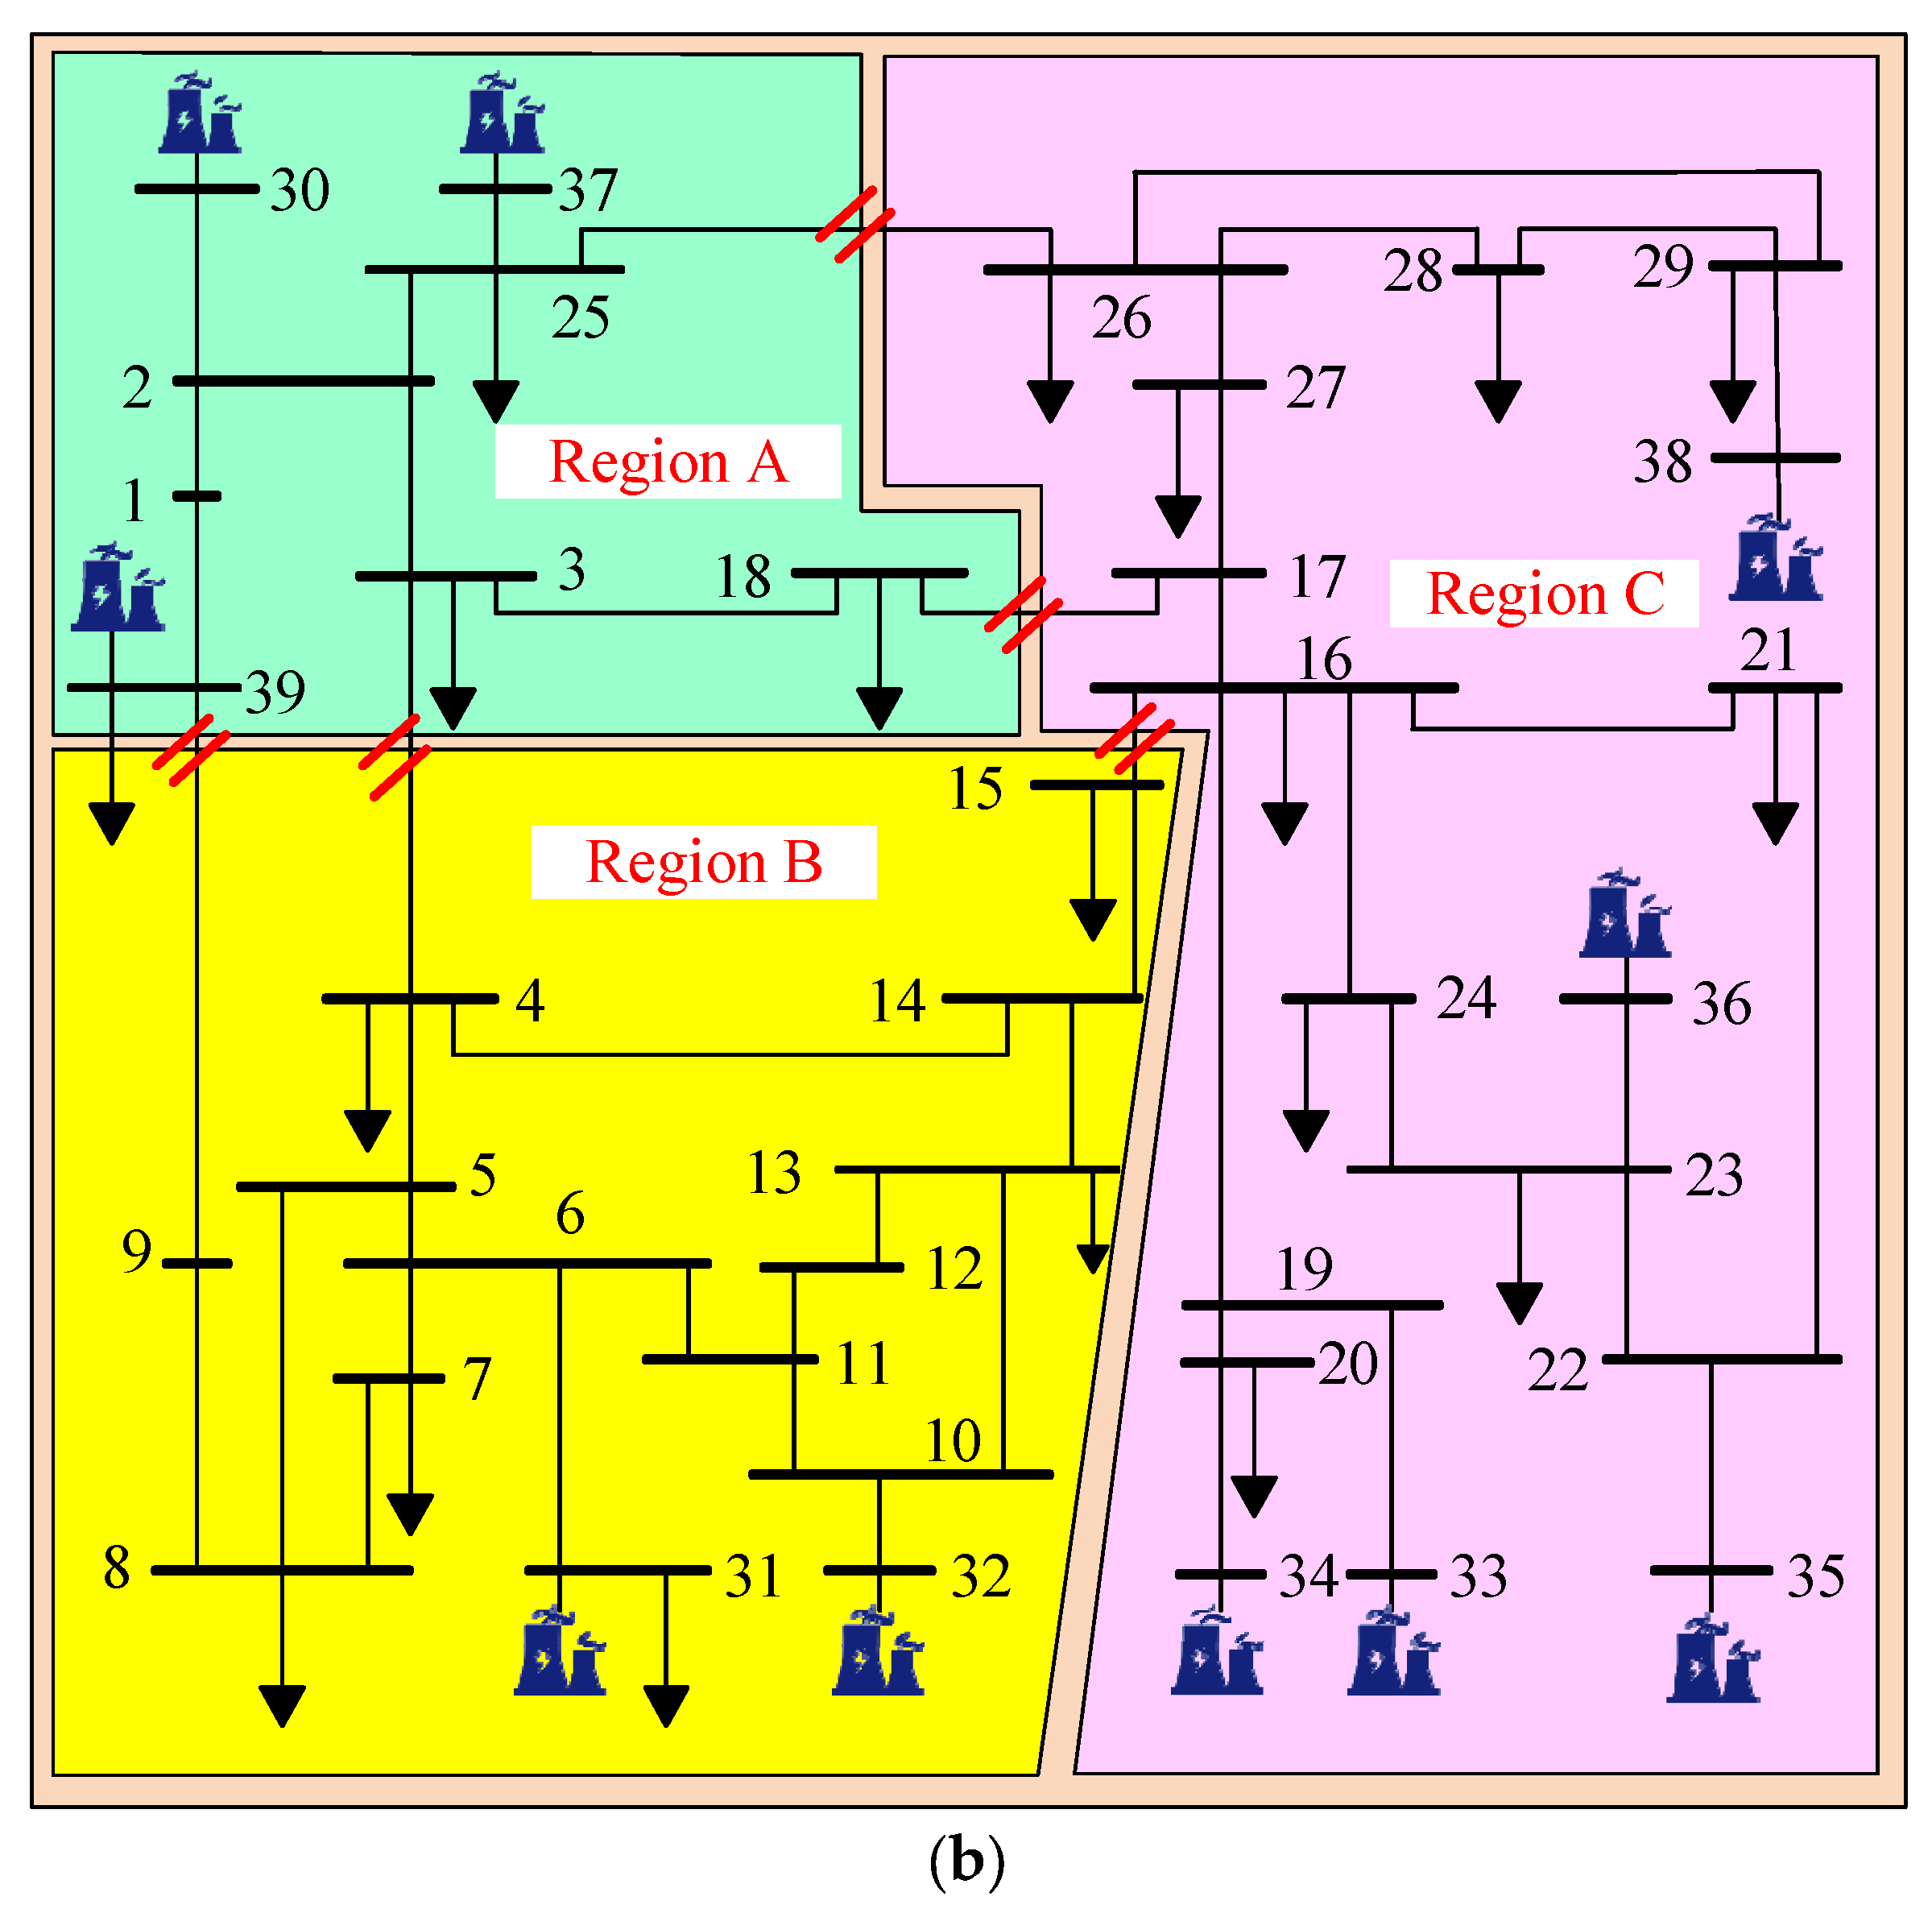
In this study, the 39 system is divided into two and three regions for solving the problem, and the topological complementary structure of the two and three IEEE 39 regions is shown in Figure 8. The number of units, number of buses, and contact line information between zones after IEEE 39 system partitioning are shown in Table 2. In addition, this study uses the contact line as the boundary, which itself has bi-directional transmission capability, and its physical properties do not affect the topological basis of zoning due to a change in the direction of tidal currents. The topological basis on which zoning is based remains stable at all times and is not directly affected by the directionality of the tidal currents.
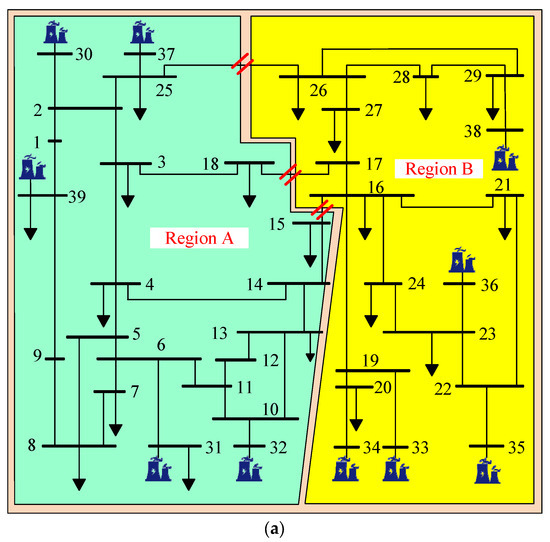
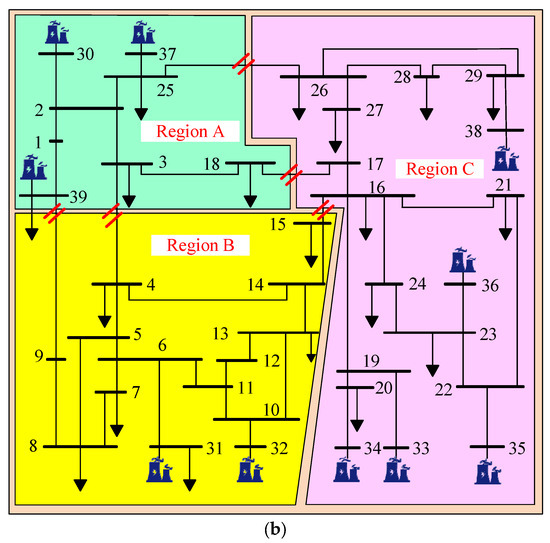
Figure 8.
(a). Topology of the two-region distributed IEEE 39 system. (b). Topology of the three-region distributed IEEE 39 system.

Table 2.
Number of buses and generators before and after IEEE 39 system zoning.
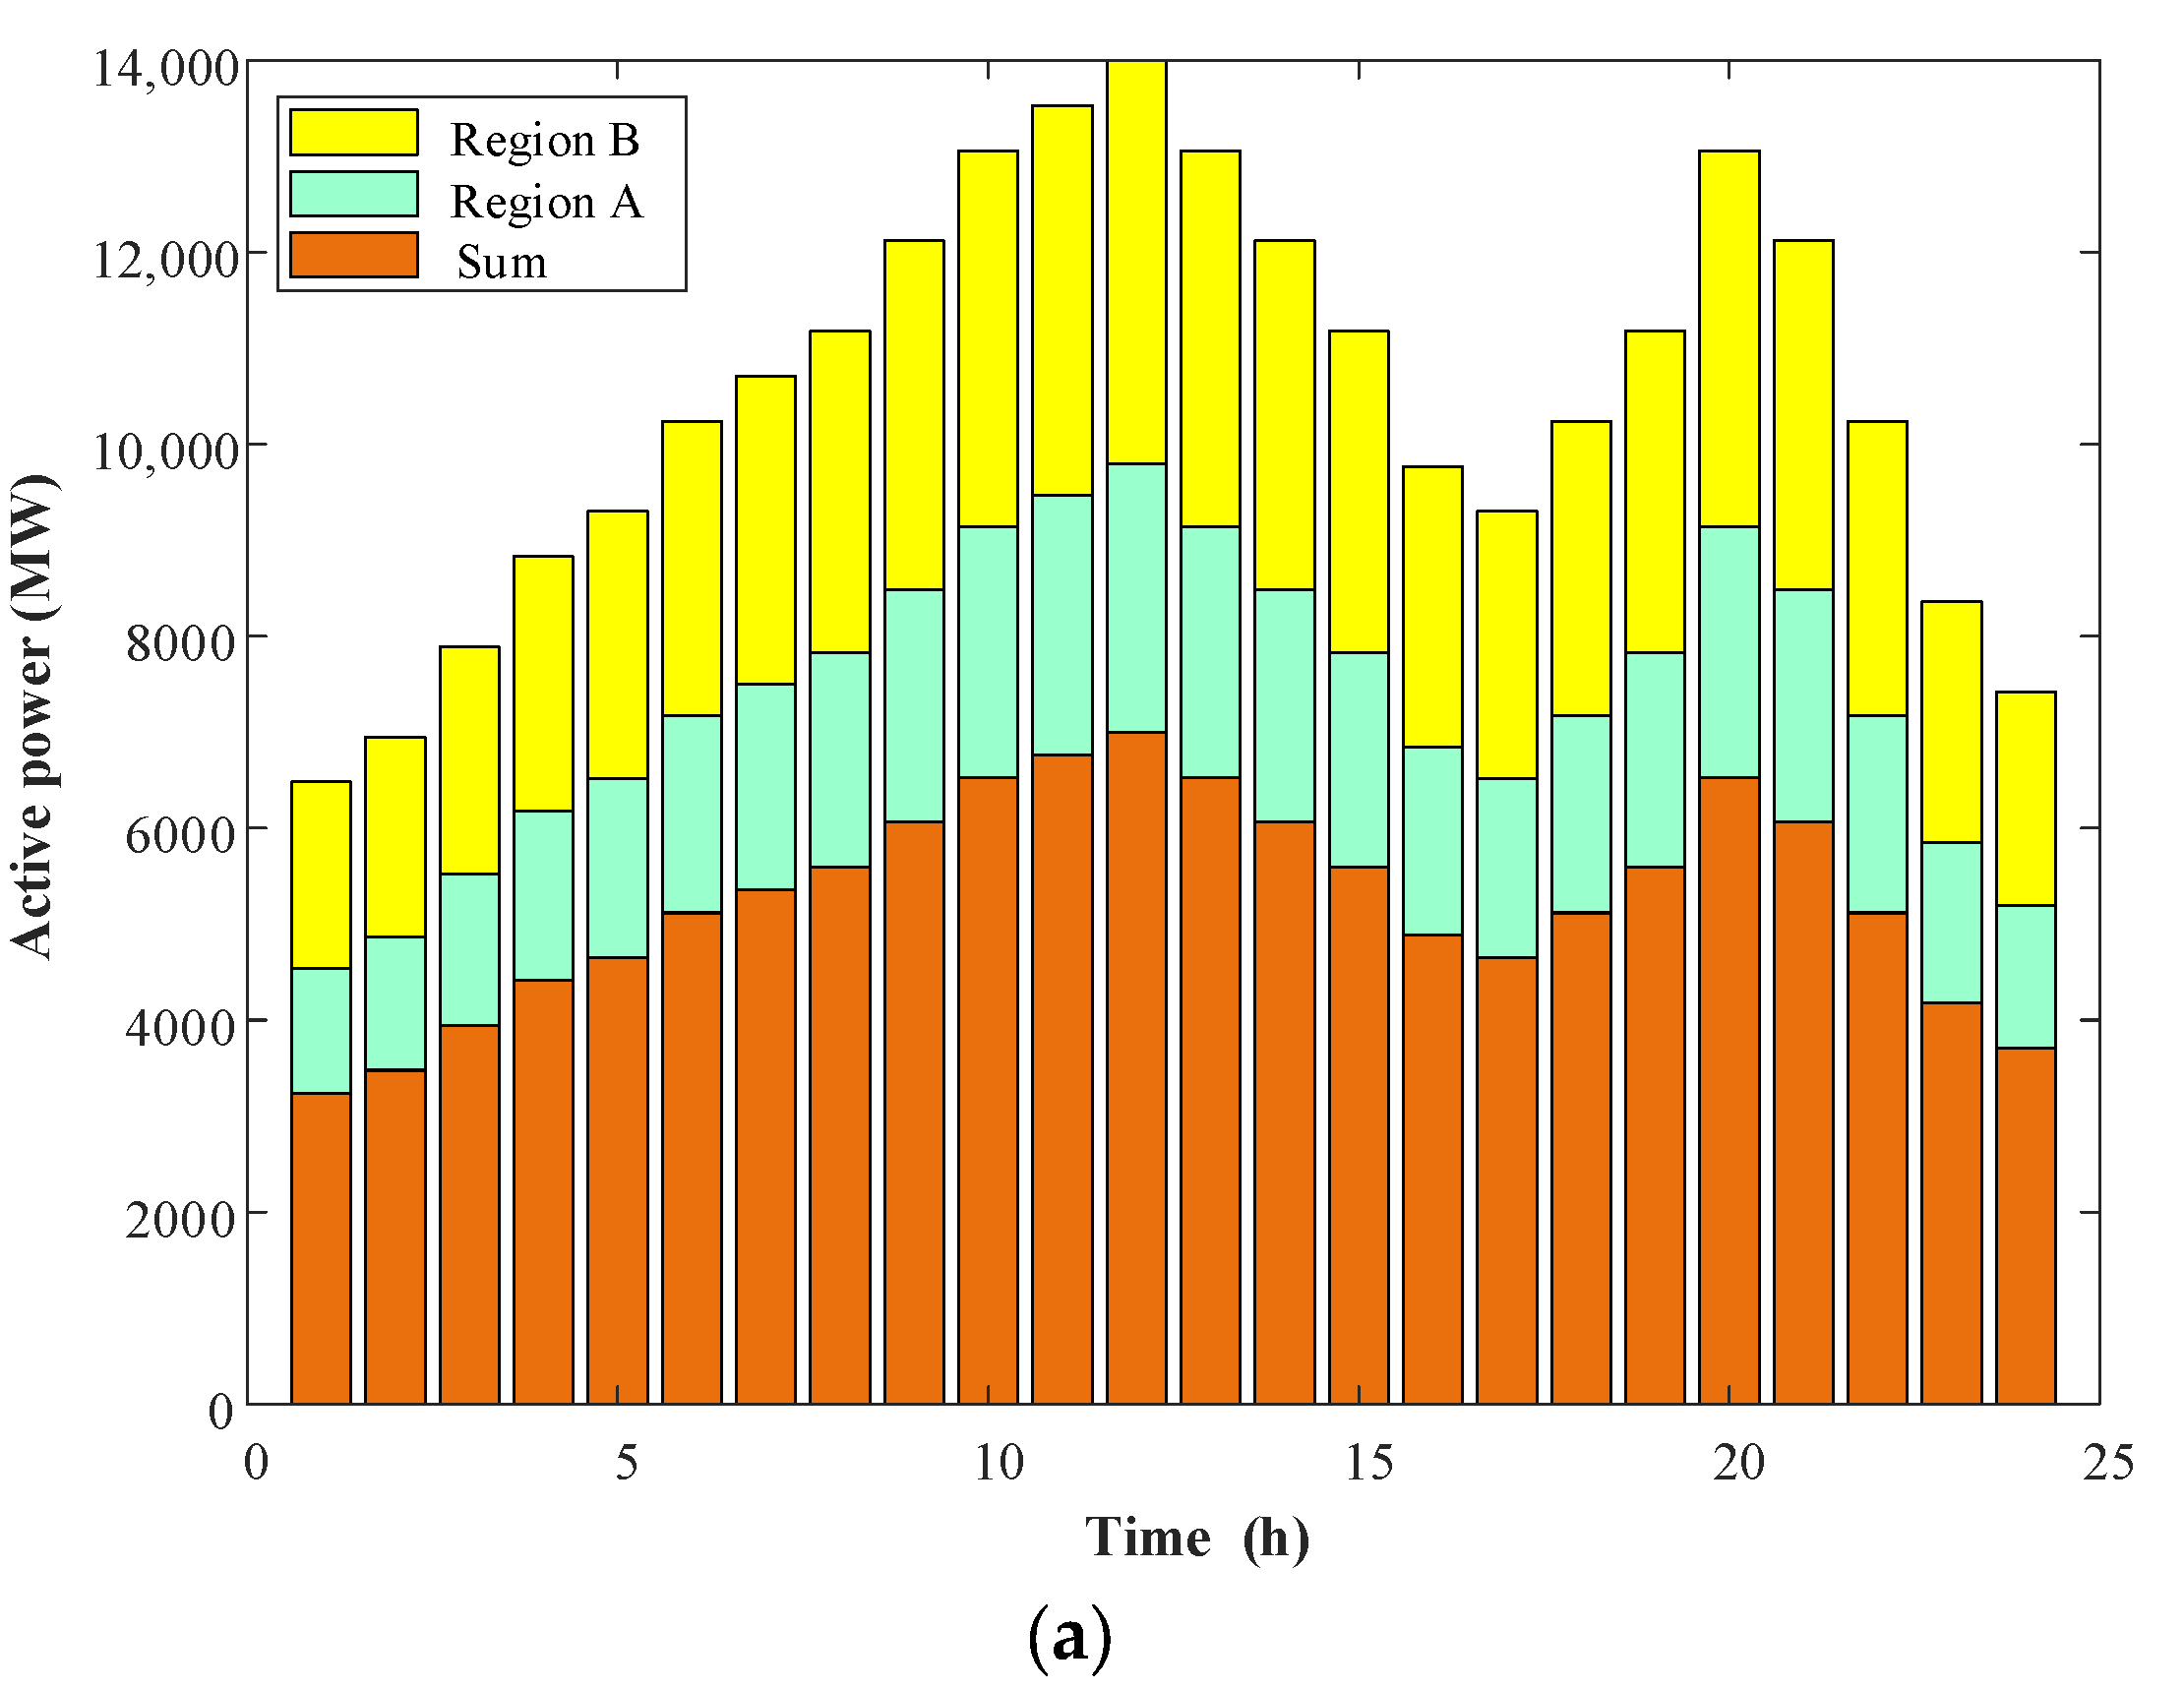
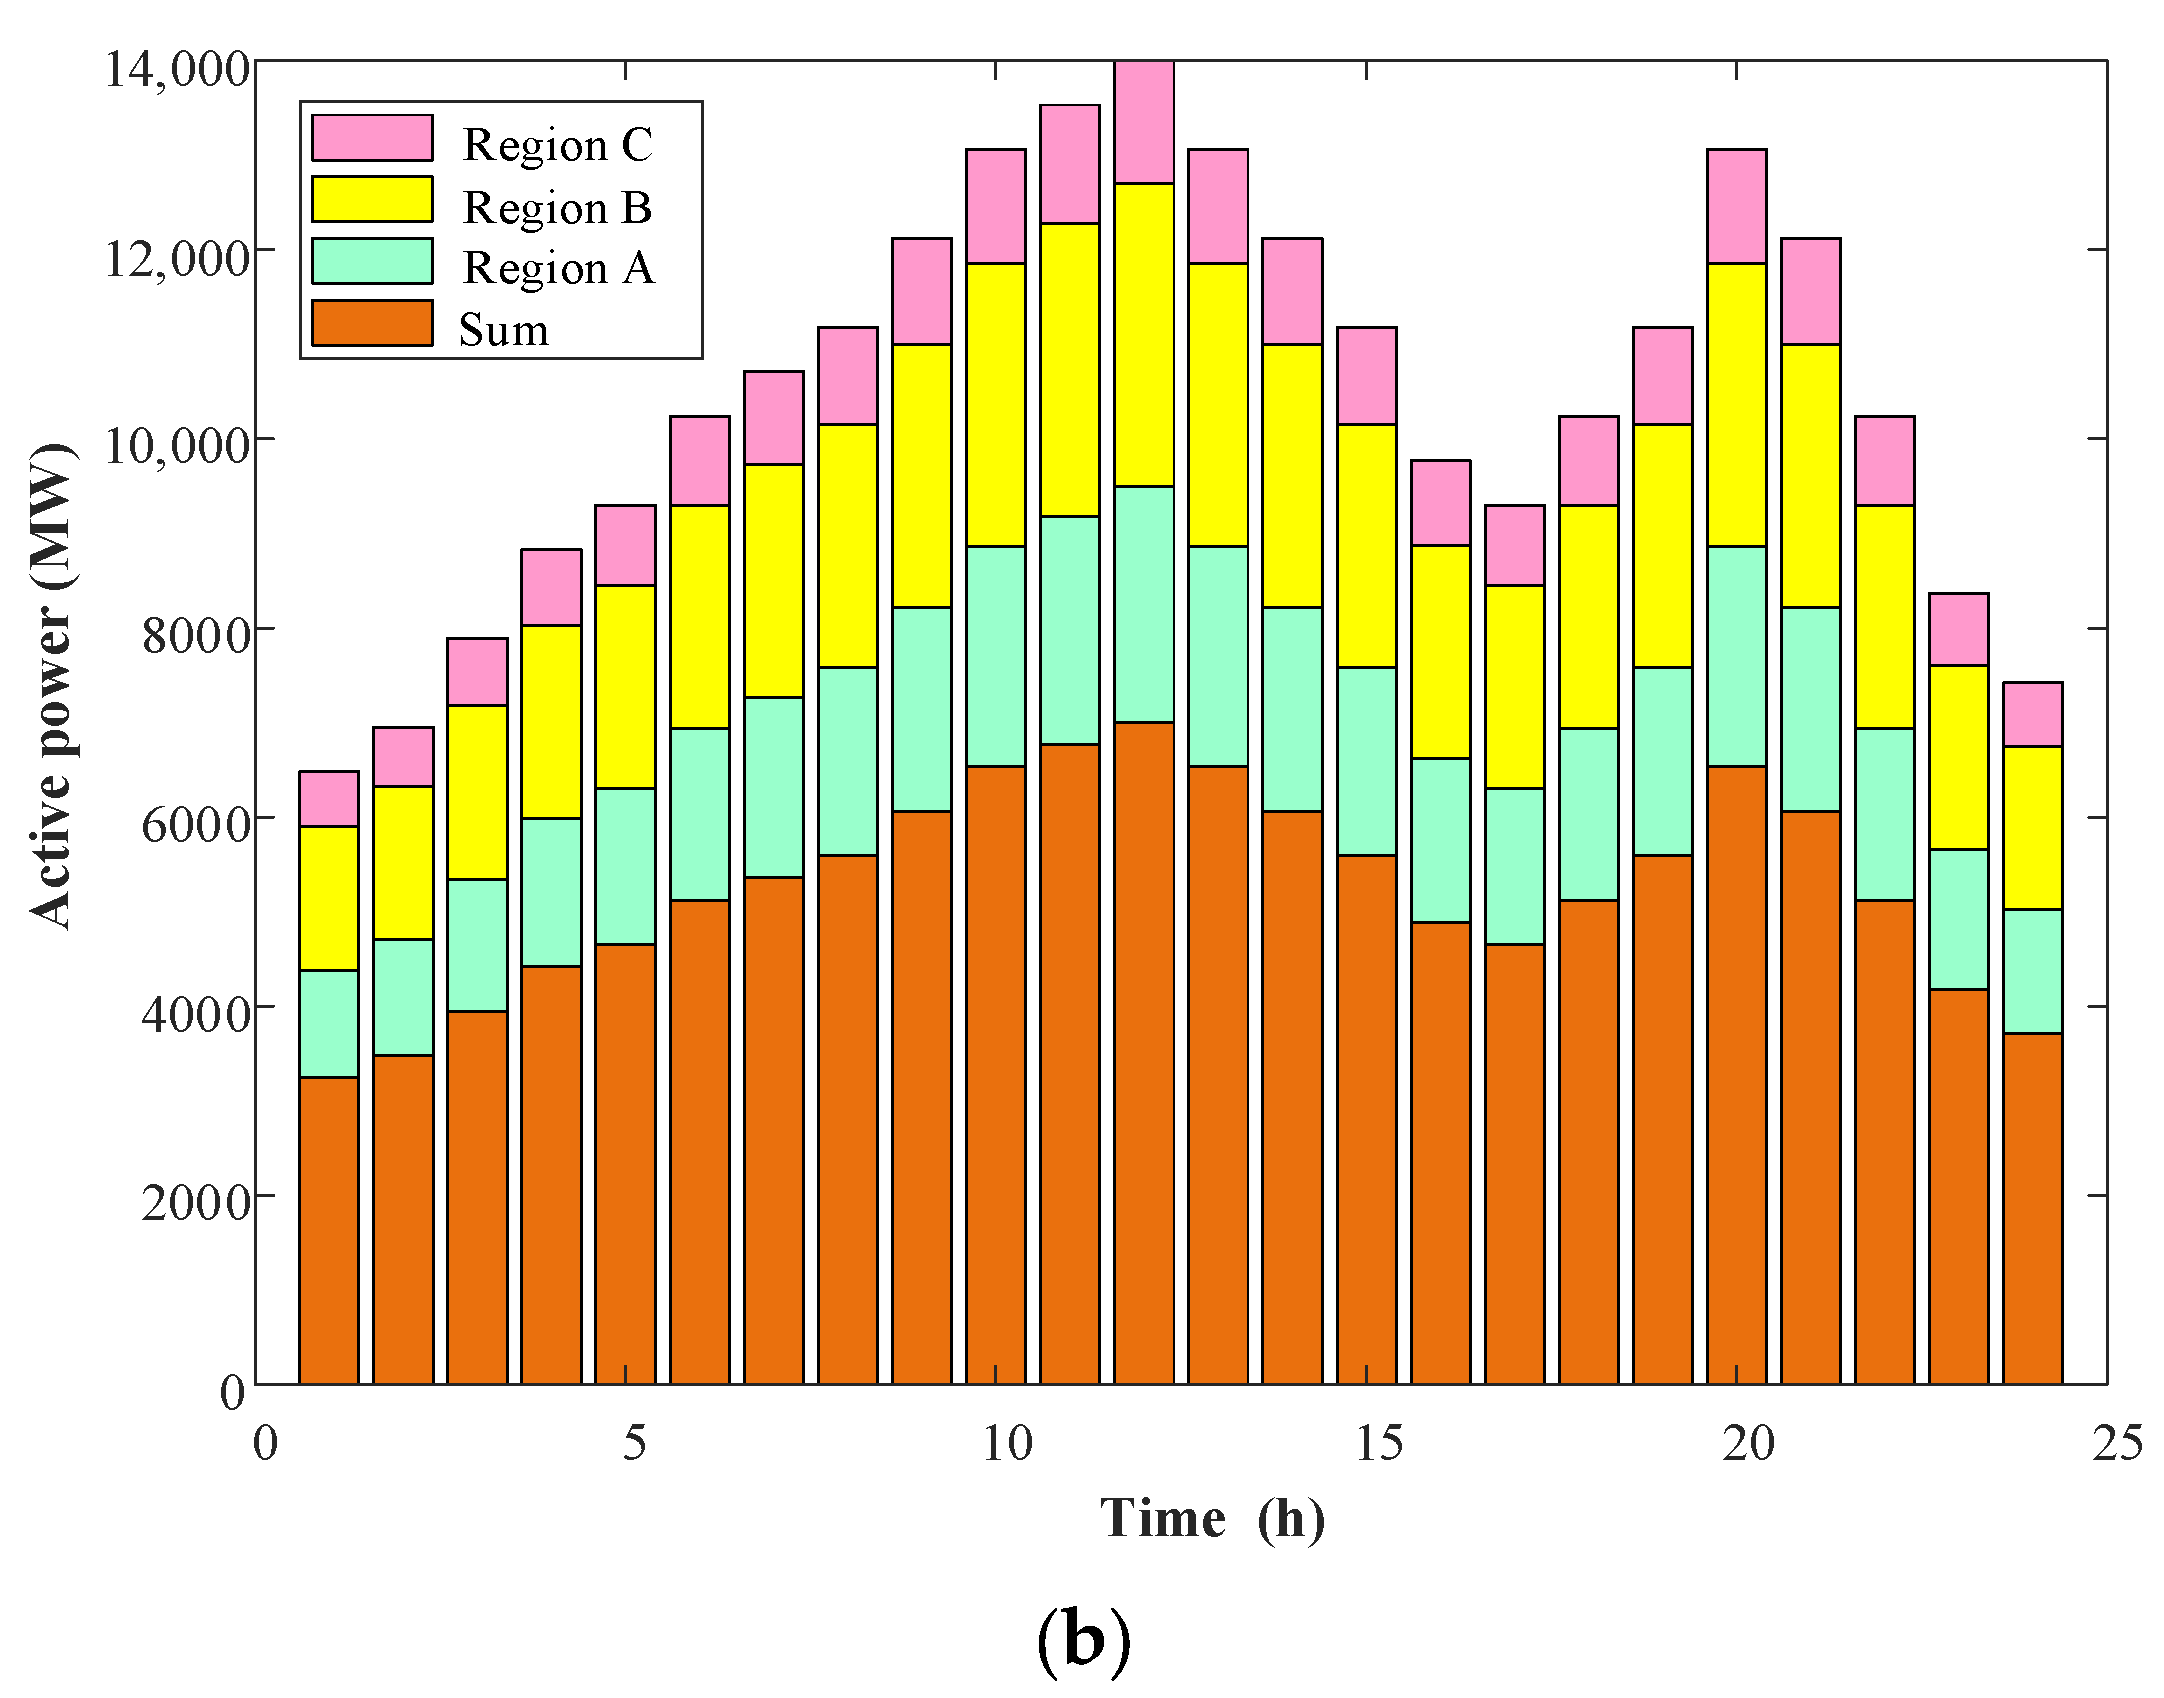
Figure 9 illustrates the active output of the units in the IEEE 39 system for the centralized optimization, the two-region distributed optimization, and the three-region distributed optimization in one day.
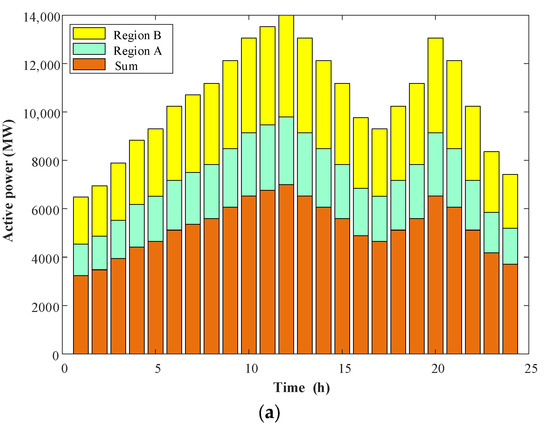
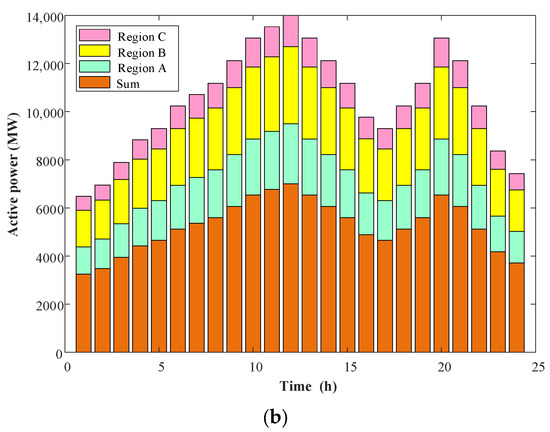
Figure 9.
(a). Active output of the units of the two-region distributed IEEE 39 system. (b). Active output of the units of the three-region distributed IEEE 39 system.
In the IEEE 39 system, the centralized optimization uses the centralized multi-gradient whale optimization algorithm (CMGWOA), and the two-region and three-region distributed optimizations both employ the MRDMGWOA. Table 3 demonstrates the parameter settings of the three optimization approaches. In this case, centralized optimization involves the use of CMGWOA to solve the IEEE 39 system without any regional division.

Table 3.
IEEE 39 simulation parameter settings.
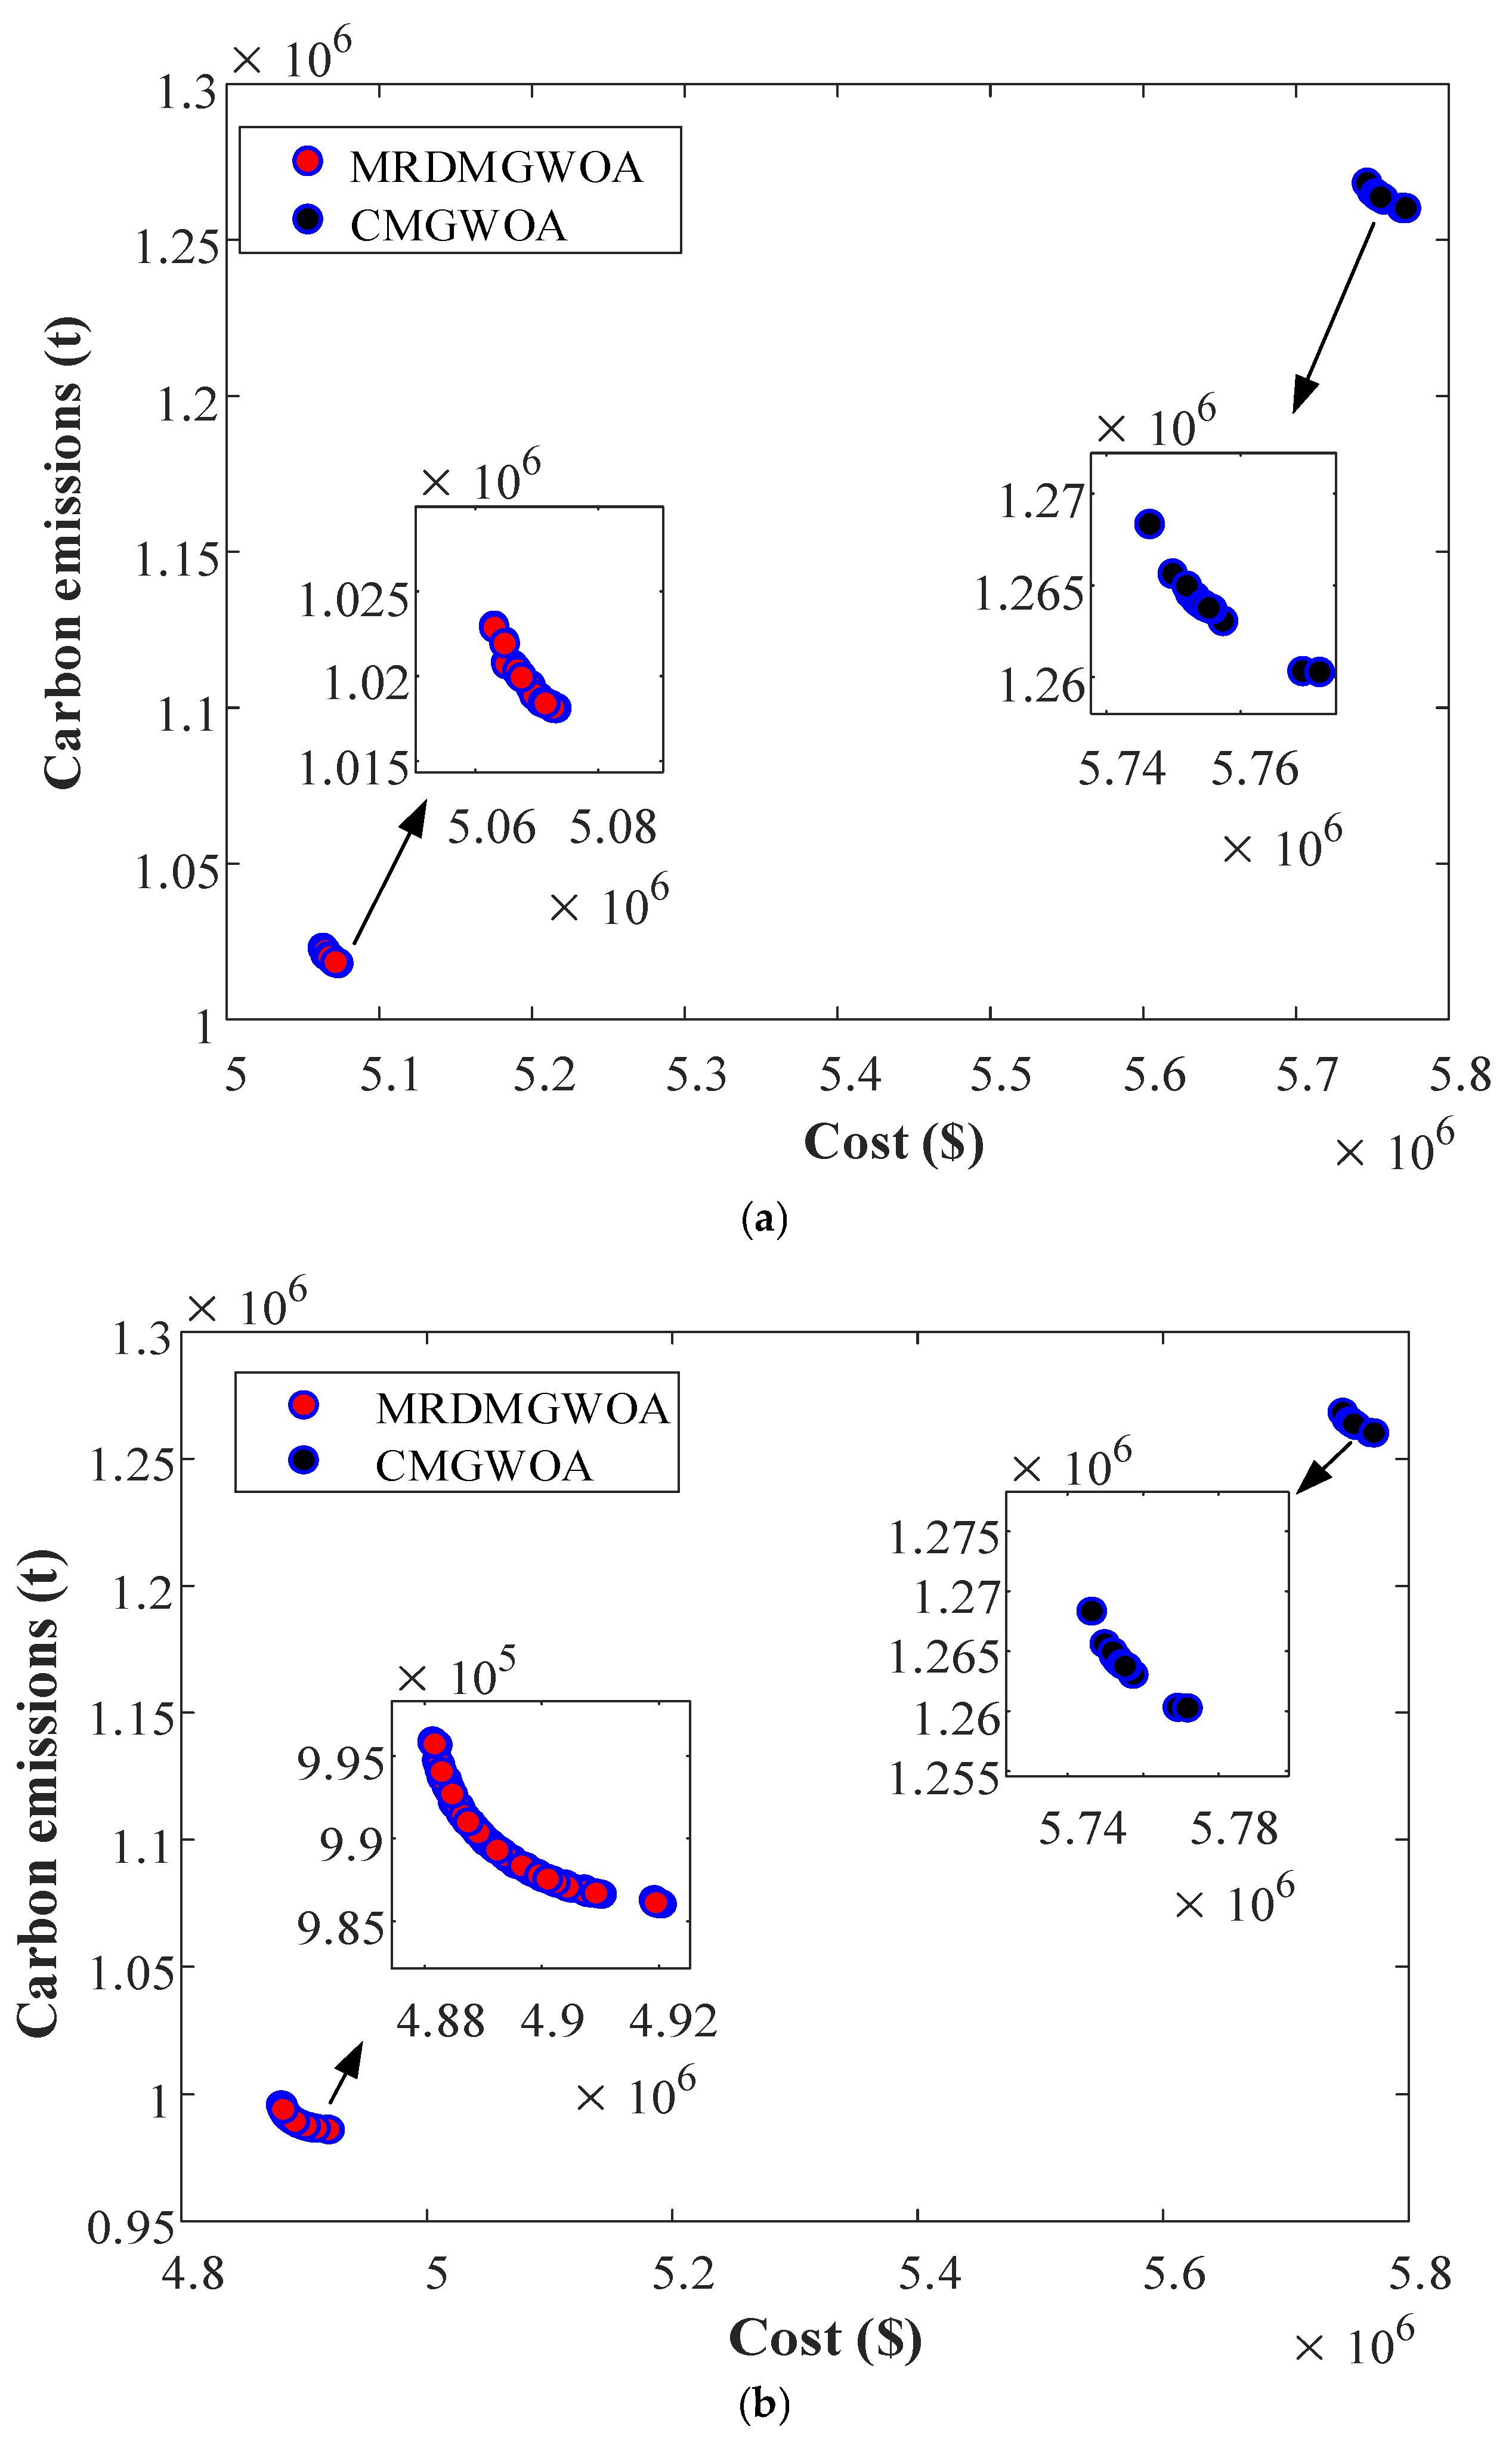
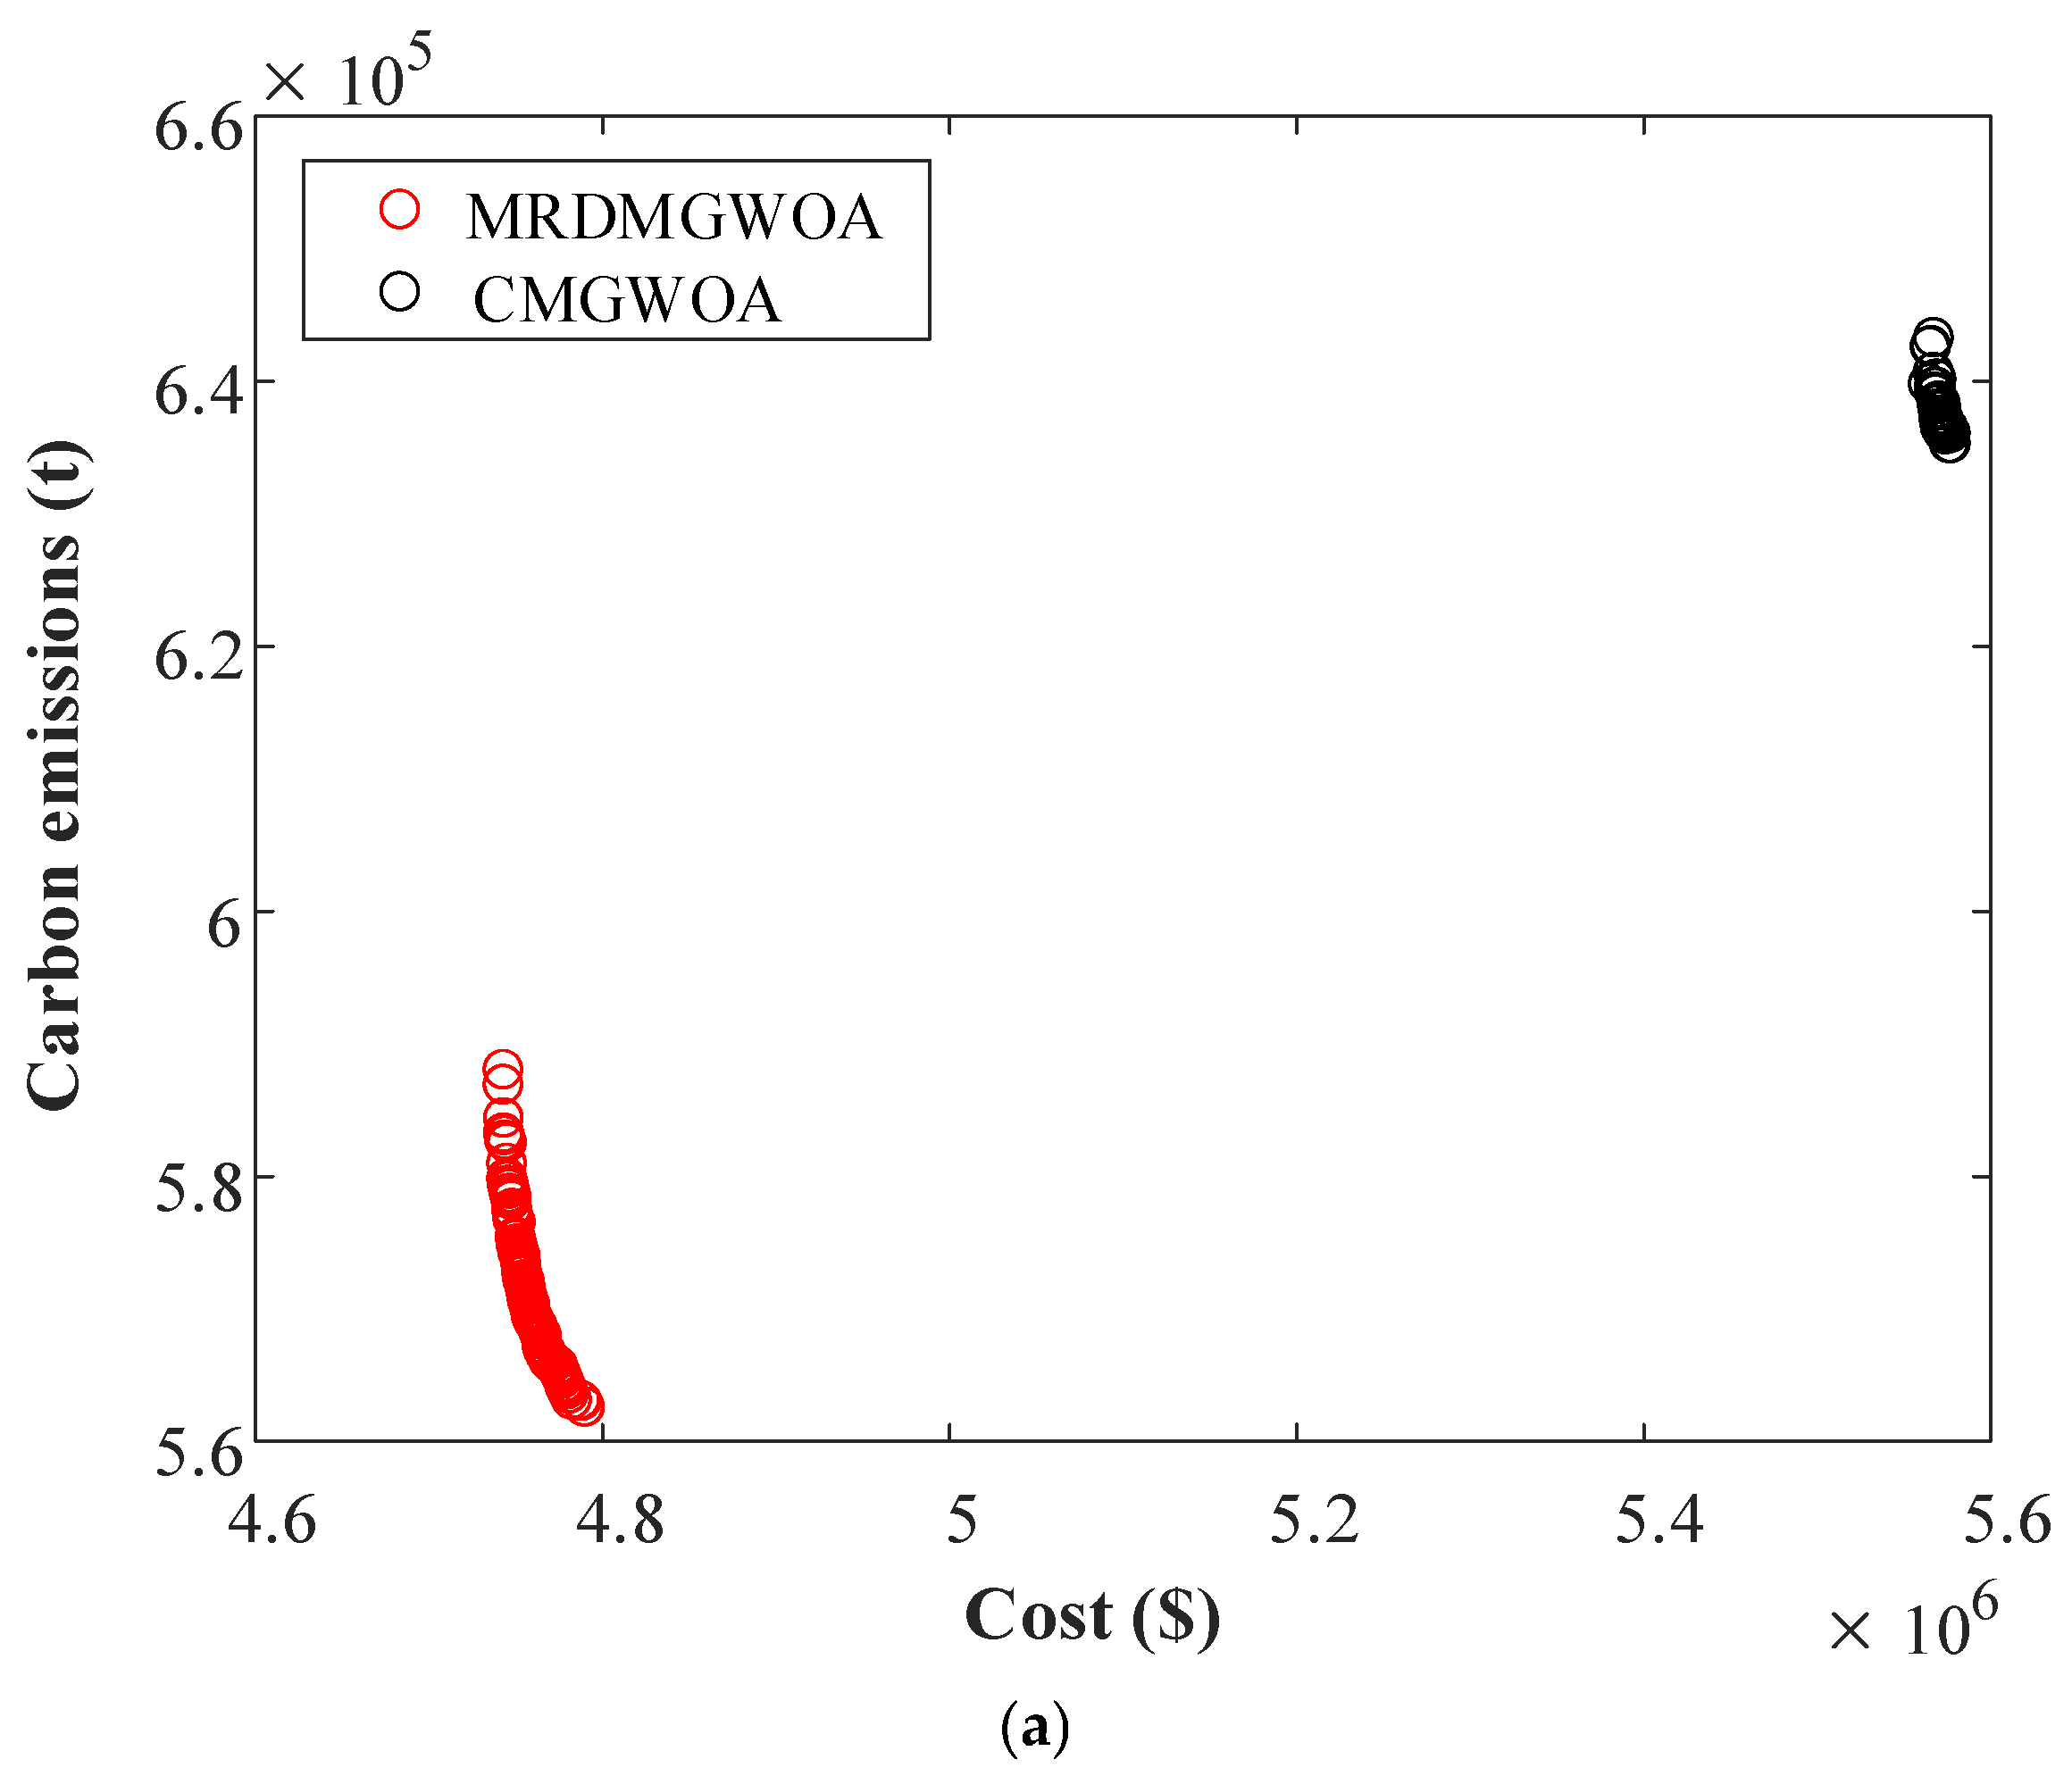
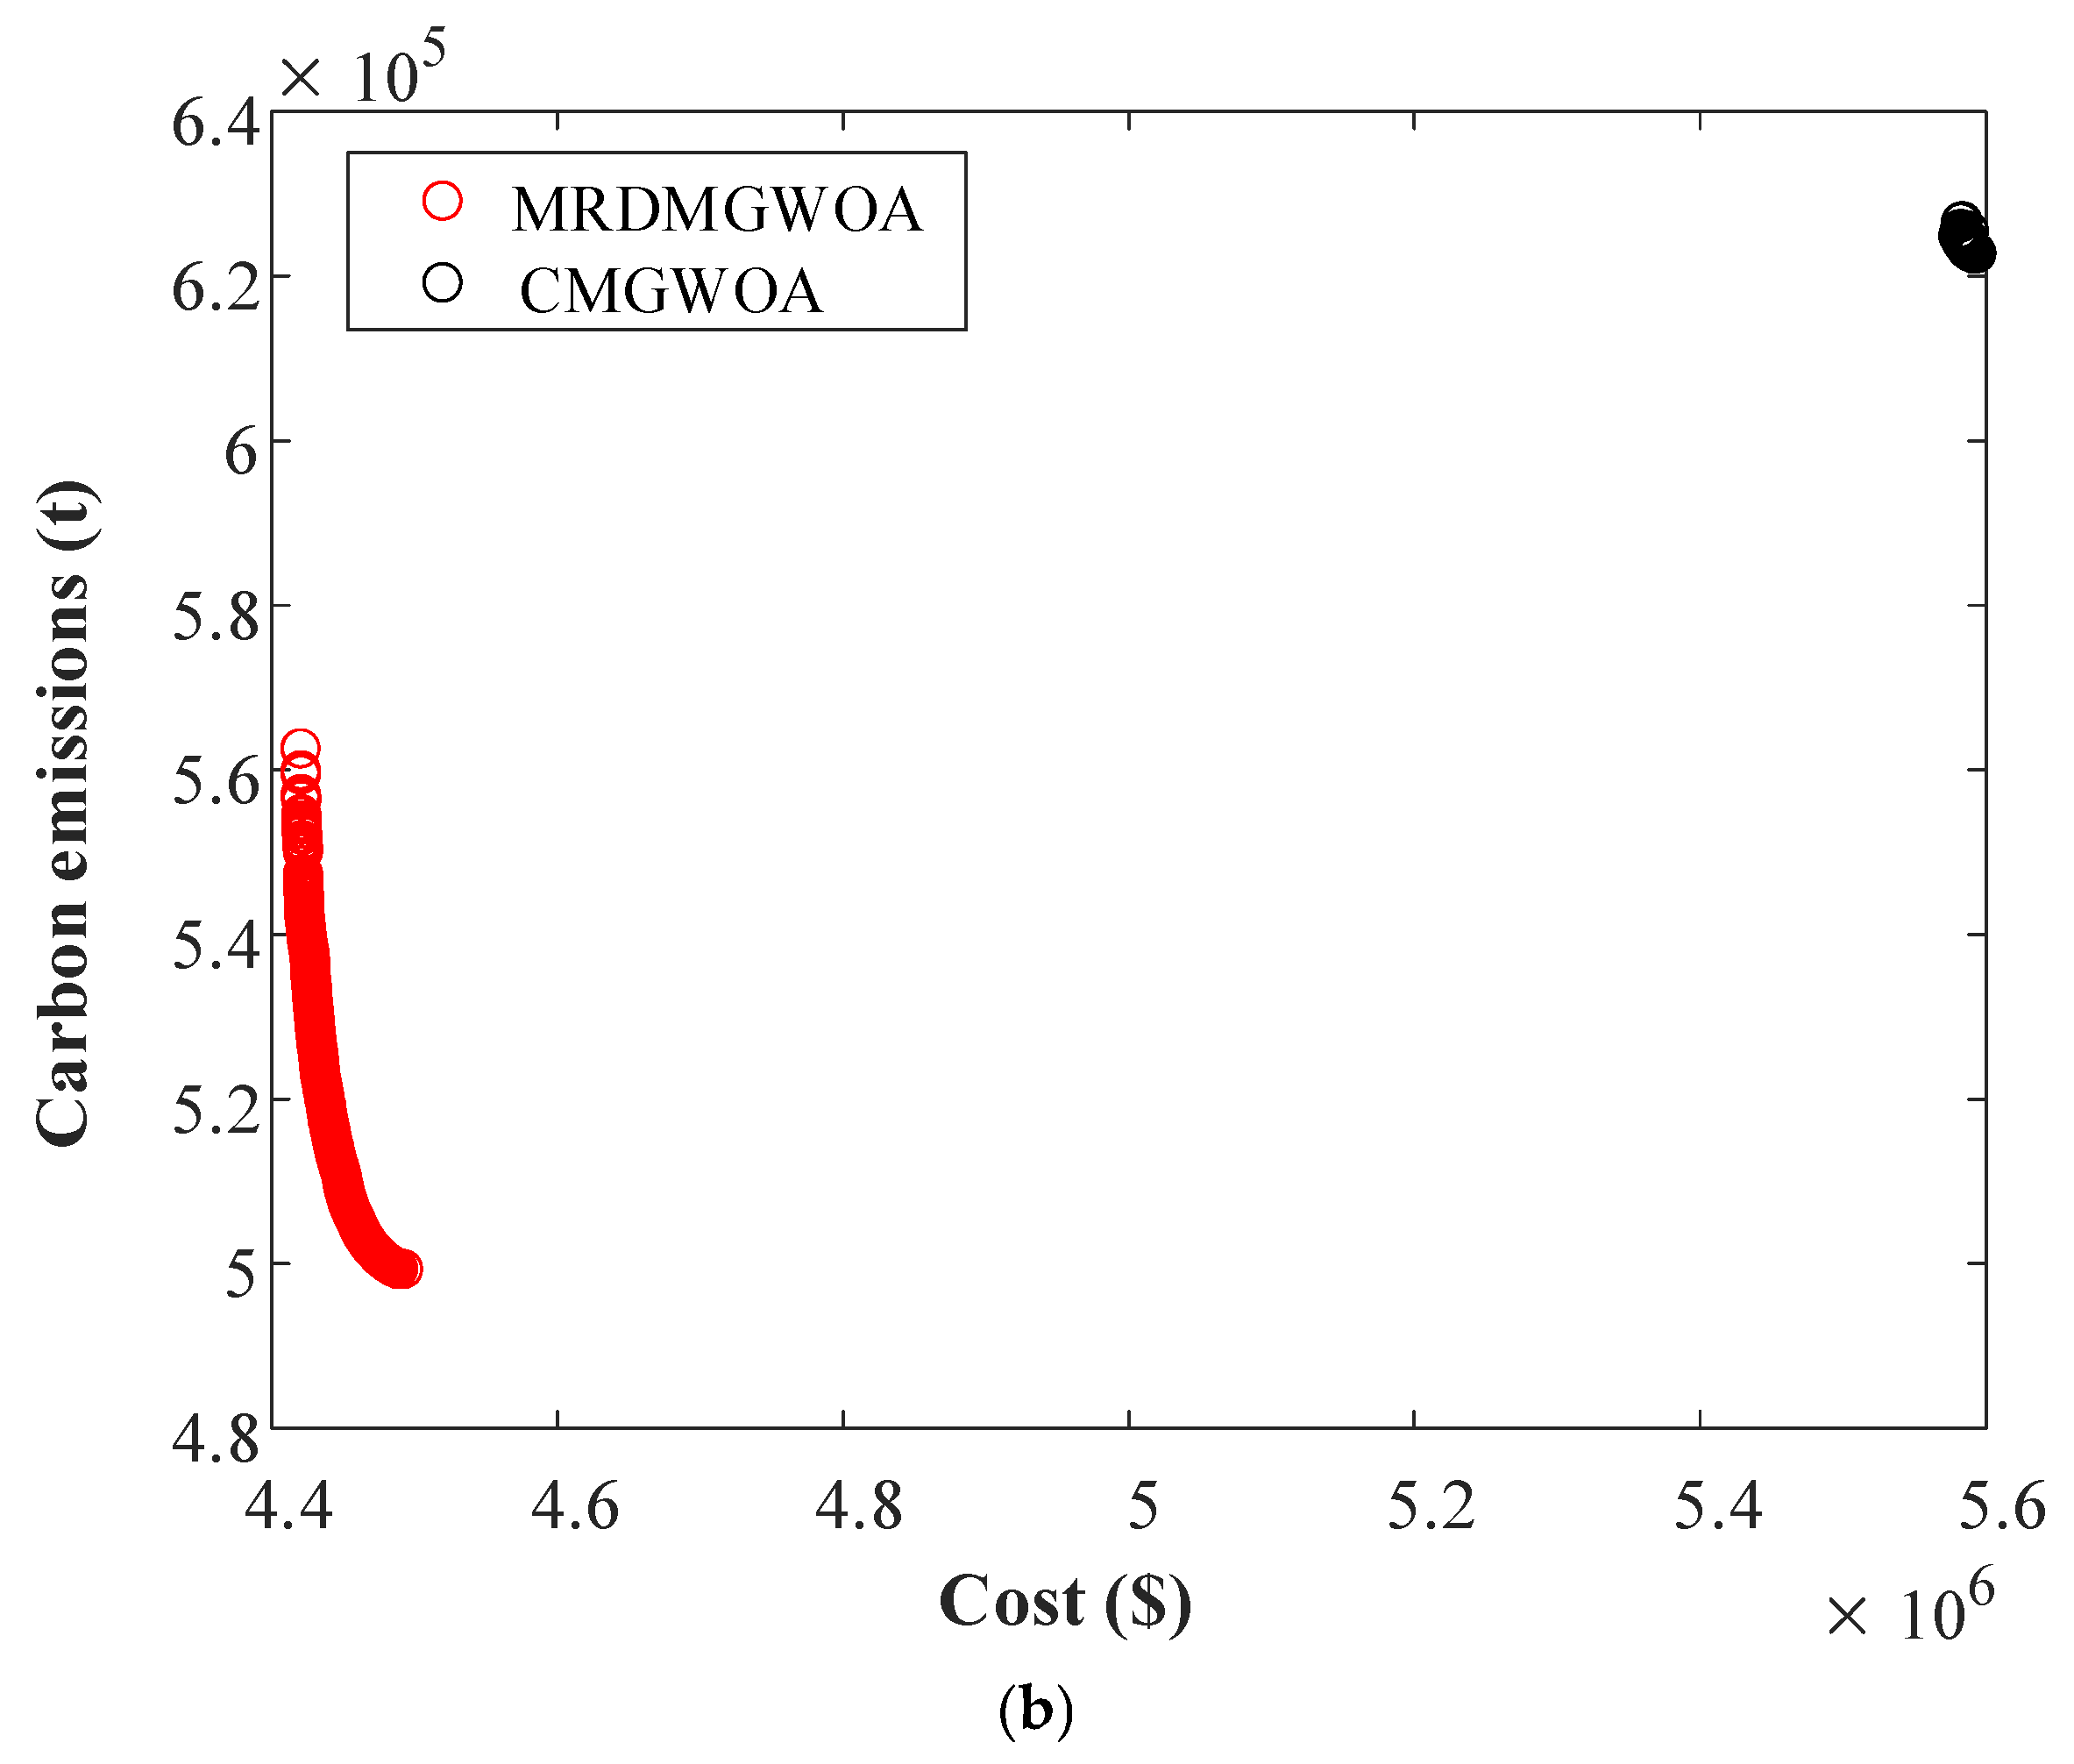
Figure 10 illustrates the comparison of Pareto curves for centralized optimization, two-zone MRDMGWOA, and three-zone MRDMGWOA after the 5th boundary exchange of information. Table 4 presents the optimal, worst, and average values of power generation cost and carbon emissions obtained after 20 experiments for the three optimization types, as well as the average running time for each optimization type. The analysis of Figure 10 and Table 4 shows that the average generation cost of the two-region system is reduced by 12% and the average CO2 emission is reduced by 19% after distributed optimization with MRDMGWOA compared to CMGWOA; in the three-region system, MRDMGWOA reduced average generation costs and CO2 emissions by 17% and 22%, respectively. In addition, the centralized optimization has the longest computation time, while the two-region and three-region distributed optimizations are close to each other and both are much lower than the centralized optimization.
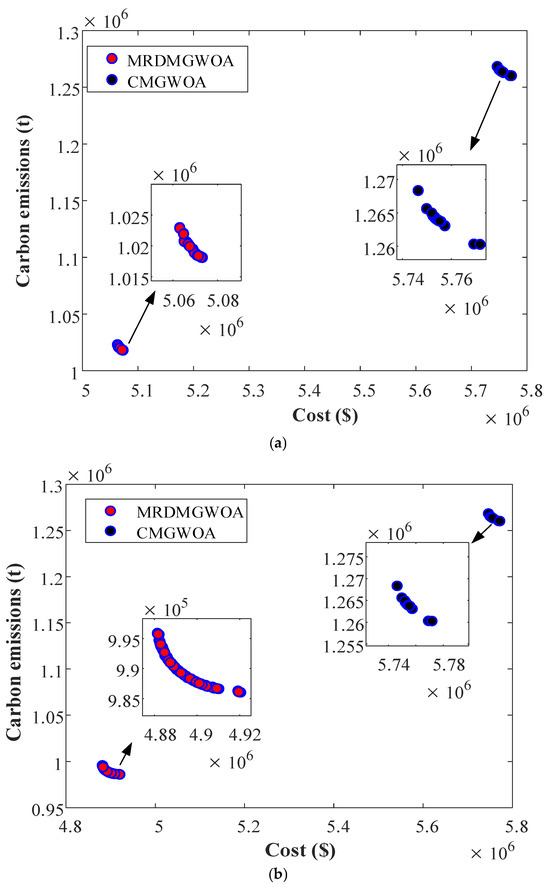
Figure 10.
(a). Centralized and two-region distributed Pareto curves for the IEEE 39 system. (b). Centralized and three-region distributed Pareto curves for the IEEE 39 system.

Table 4.
Computational results of different optimization types for the IEEE 39 system.
Table 5 shows the mean and standard deviation of performance indicators for three optimization types after 20 rounds of boundary exchange information. In the realm of multi-gradient optimization, spacing, hypervolume, and Euclidean distance serve as three prevalent metrics utilized for assessing the effectiveness of optimization algorithms. The spacing focuses on the uniformity of the distribution of solutions; the hypervolume evaluates the quality of the solution set; and the Euclidean distance assesses the closeness of the solution set to the ideal solution. These three metrics can comprehensively evaluate the performance of a multi-gradient optimization algorithm. From Table 5, the spacing and Euclidean metrics for both two- and three-region distributed optimization are smaller than those of the centralized optimization, while hypervolume is larger than that of the centralized optimization, indicating that the multi-region distributed optimization has a better performance and a more uniform distribution of the solution set of Pareto curves.

Table 5.
Comparison of three performance indicators for different optimization types of the IEEE 39 system.
To further validate the performance of MRDMGWOA, this research compares the Pareto curves of multi-objective gray wolf optimizer (MOGWO), multi-objective moth–flame optimizer (MOMFO), multi-objective flower pollination algorithm (MOFPA), multi-objective firefly algorithm (MOFA), and multi-objective atomic orbital search (MOAOS) on a two-region distributed IEEE 39 system. Table 6 lists the parameter settings of the six optimization algorithms.

Table 6.
Simulation parameter settings for six optimization algorithms.
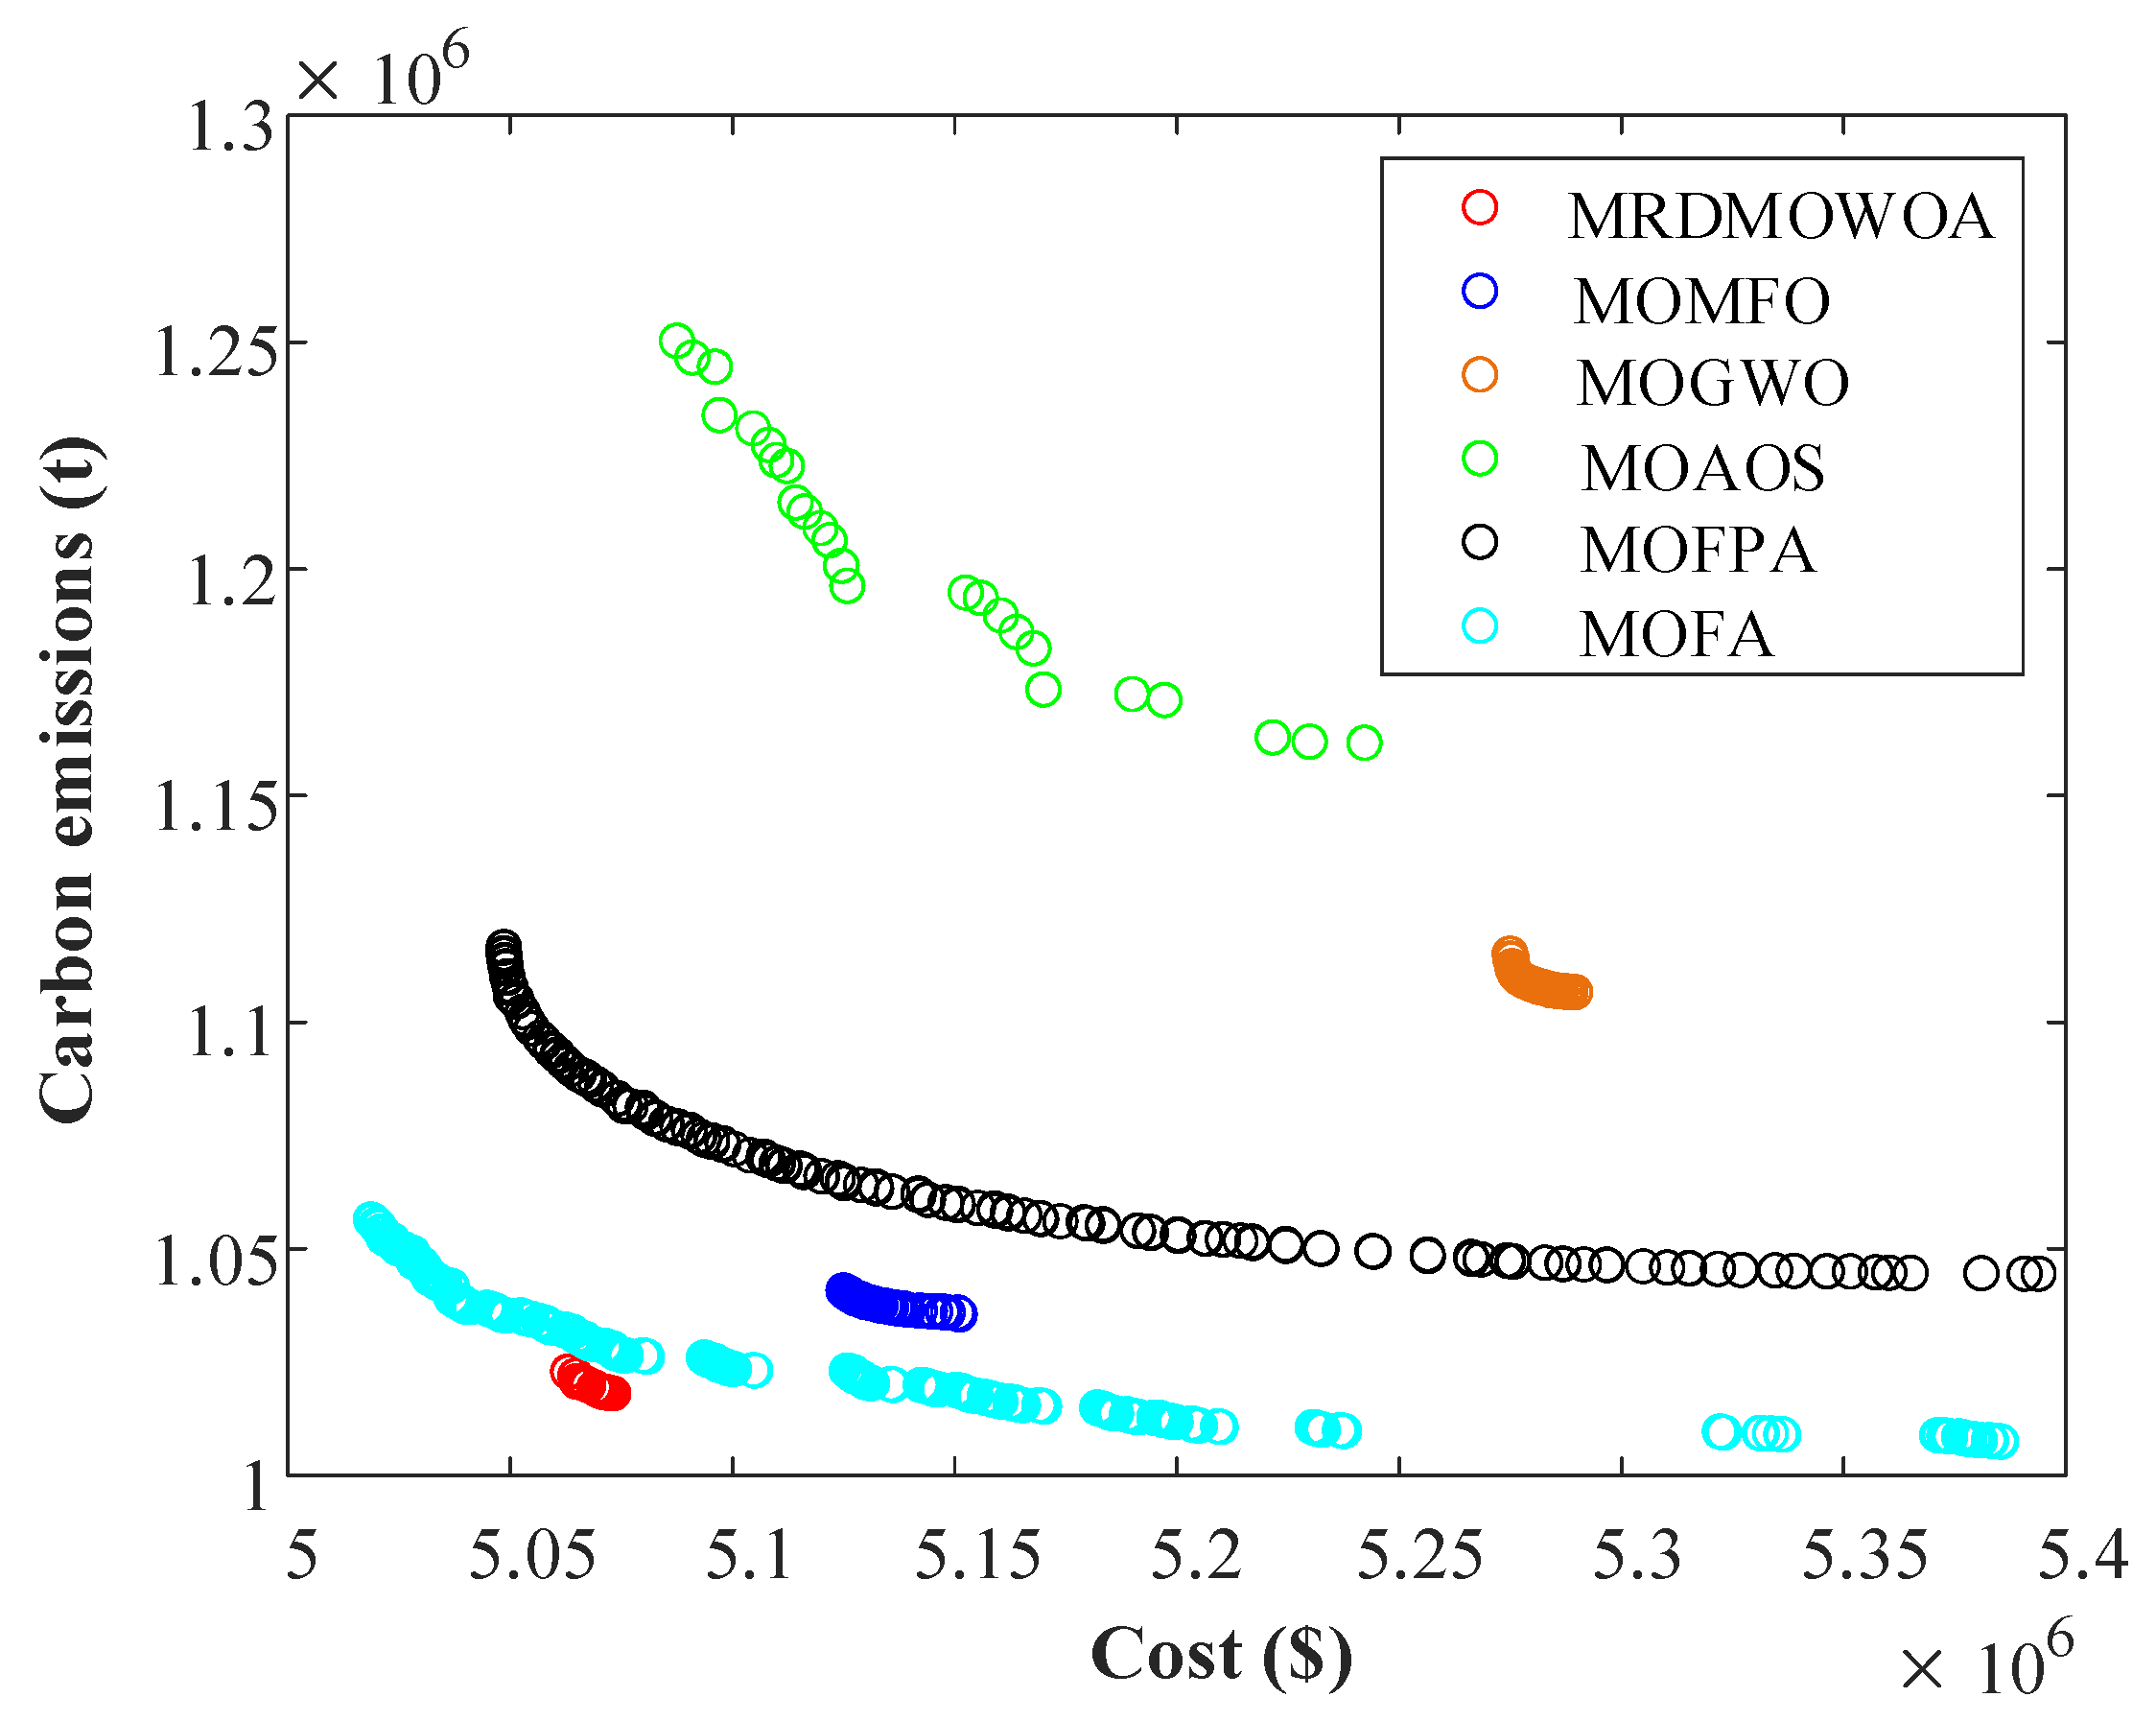
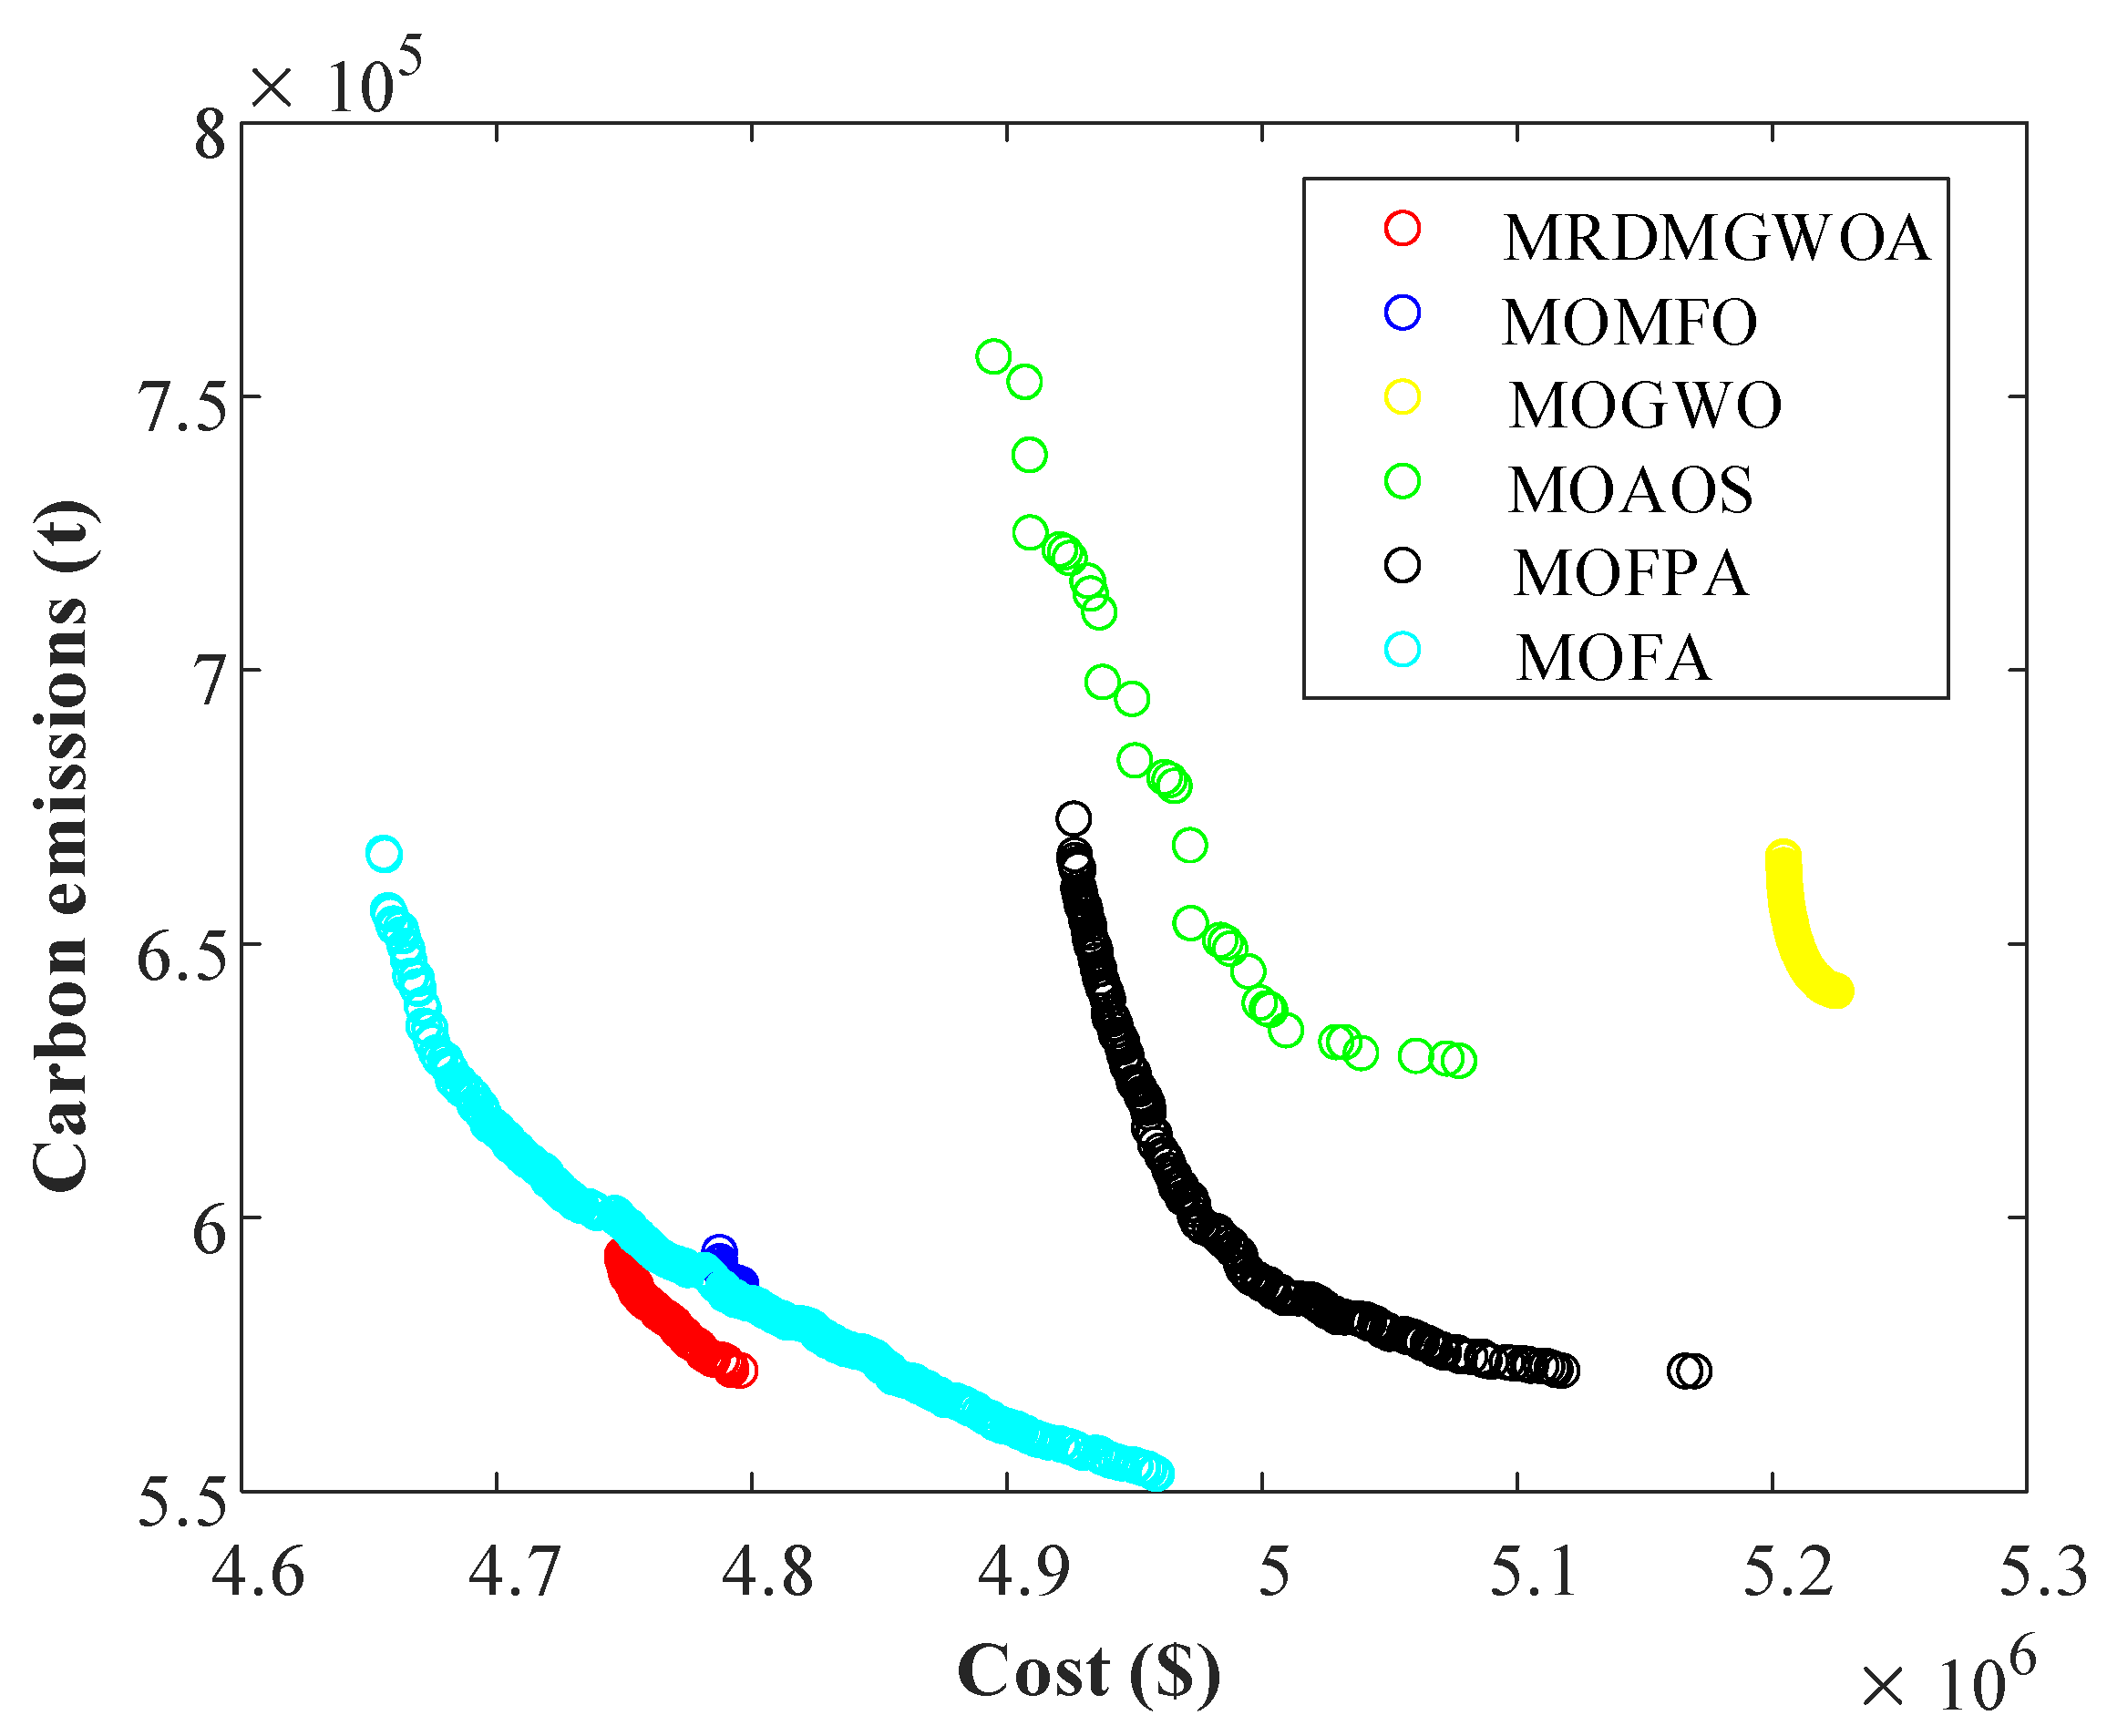
As can be seen in Figure 11 and Table 7, MRDMGWOA has lower costs and CO2 emissions. In addition, MRDMGWOA reduces the running time by 177.43 s, 124.15 s, 1.18 s, 235.81 s, and 110 s, respectively, compared to the other five optimization algorithms. Although the MRDMGWOA’s runtime is close to that of the MOFPA, the MRDMGWOA can achieve greater savings in generation costs and carbon emissions.
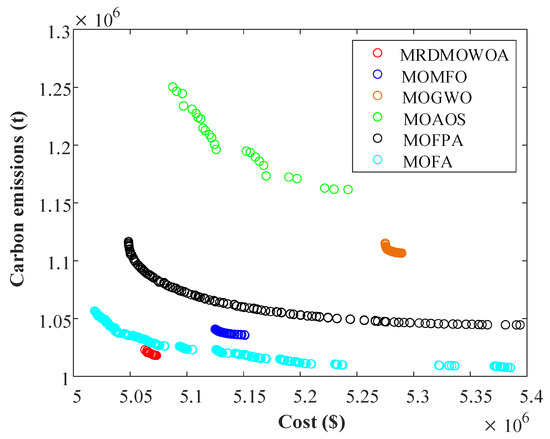
Figure 11.
Comparison of six optimization algorithms for solving the Pareto curve of the IEEE 39 system.

Table 7.
Computational results of different optimization algorithms for a two-region distributed IEEE 39 system.
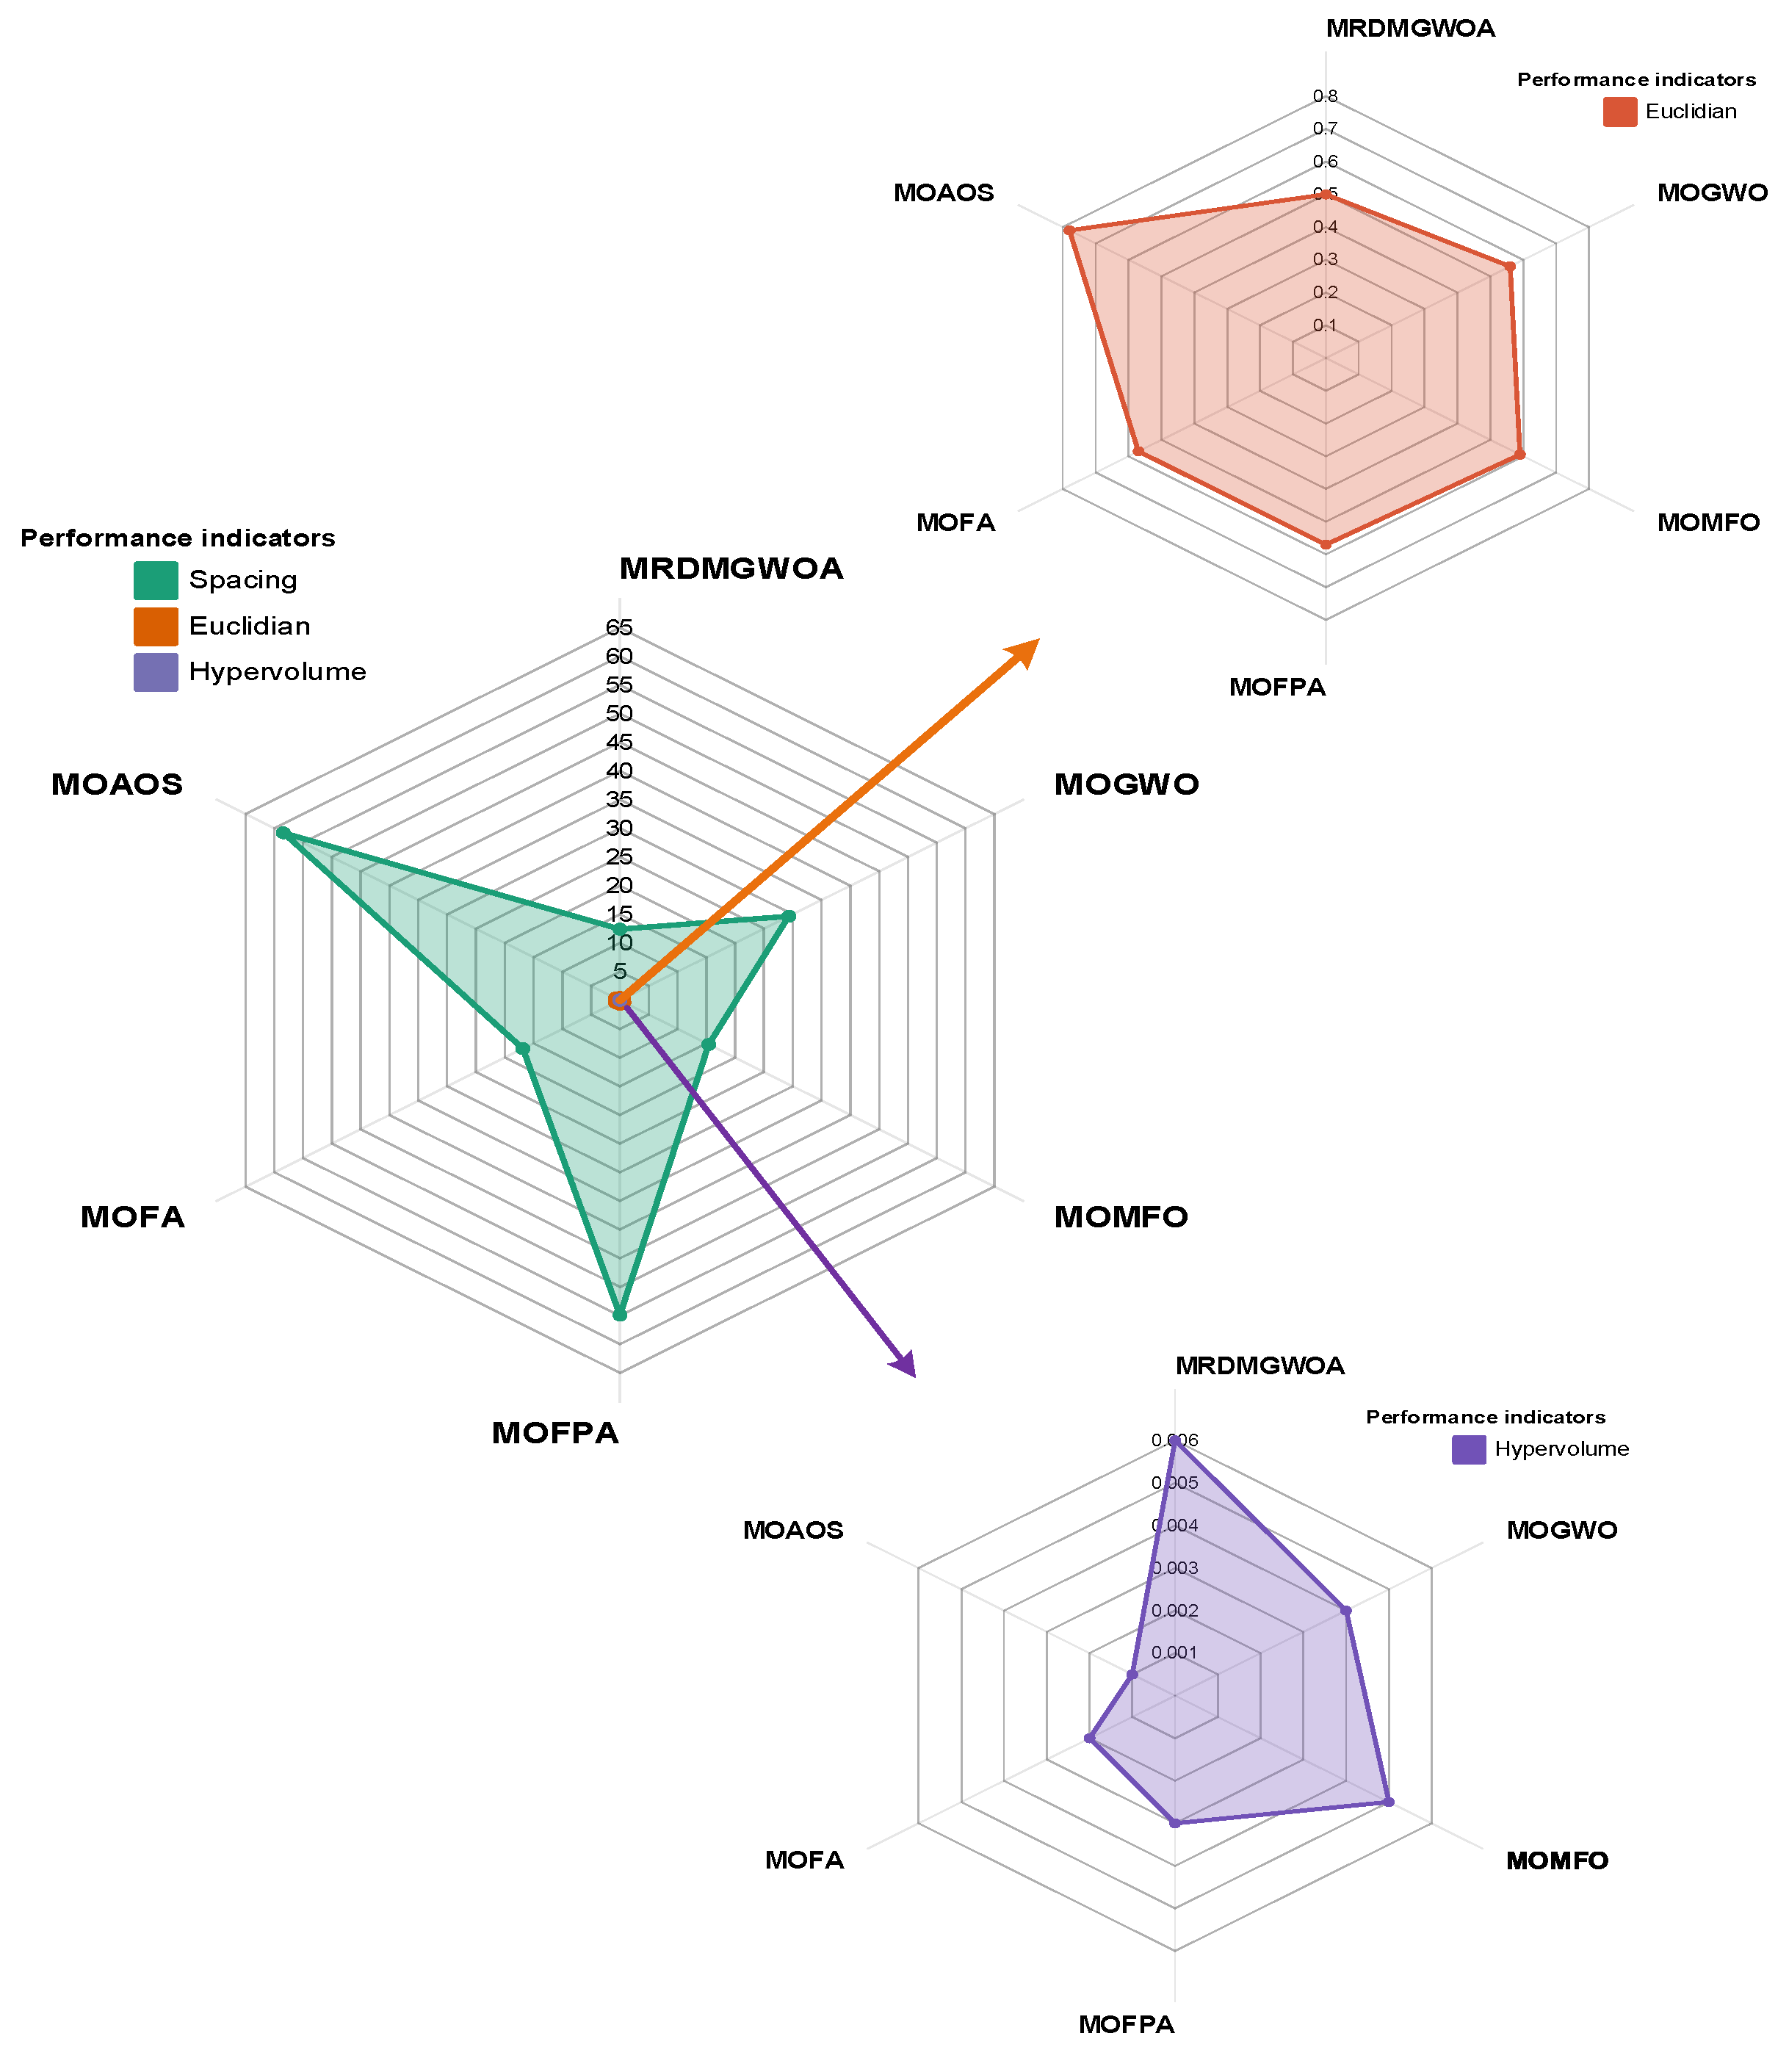
Figure 12 shows the comparison of the average values of spacing, hypervolume, and Euclidean distance among six optimization algorithms after 20 rounds of boundary exchange information. According to Figure 12, it can be seen that the average values of all three indicators of MRDMGWOA are significantly better than those of the comparison algorithms, indicating that its ability to cover the Pareto frontiers, its proximity to the optimal frontiers, and the uniformity of its distribution are more stable and less affected by stochastic factors in 20 runs.
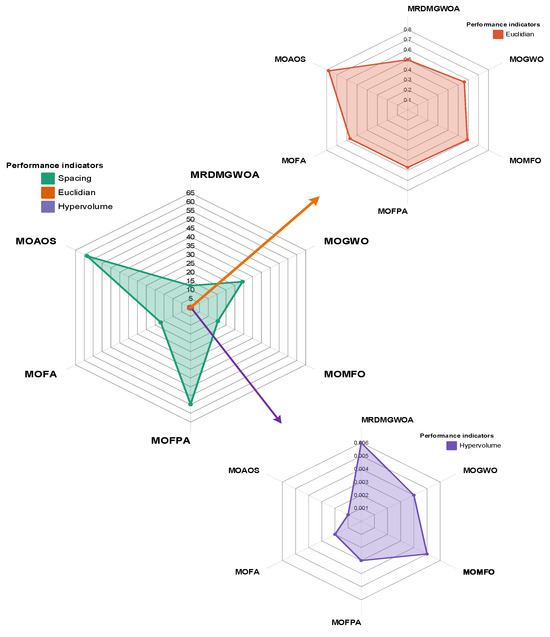
Figure 12.
Comparison of performance metrics of six optimization algorithms for solving the IEEE 39 system.
Consequently, the following inferences can be made in light of the simulation outcomes of MRDMGWOA applied to the IEEE 39 system:
- (1)
- Compared with the centralized optimization, the two- and three-area distributed optimization can shorten the system computation time while saving the generation cost and CO2 emission, showing that the MRDMGWOA has excellent performance characteristics.
- (2)
- Compared to MOGWO, MOMFO, MOFPA, MOFA, and MOAOS, MRDMGWOA is better in the optimization of generation cost and CO2 emission, demonstrating the better convergence of MRDMGWOA. In addition, MRDMGWOA outperforms other algorithms in the comparison of spacing, hypervolume, and Euclidian metrics, thus MRDMGWOA is more stable and suitable for solving power system scheduling problems.
4.2. IEEE 118 System (Case II)
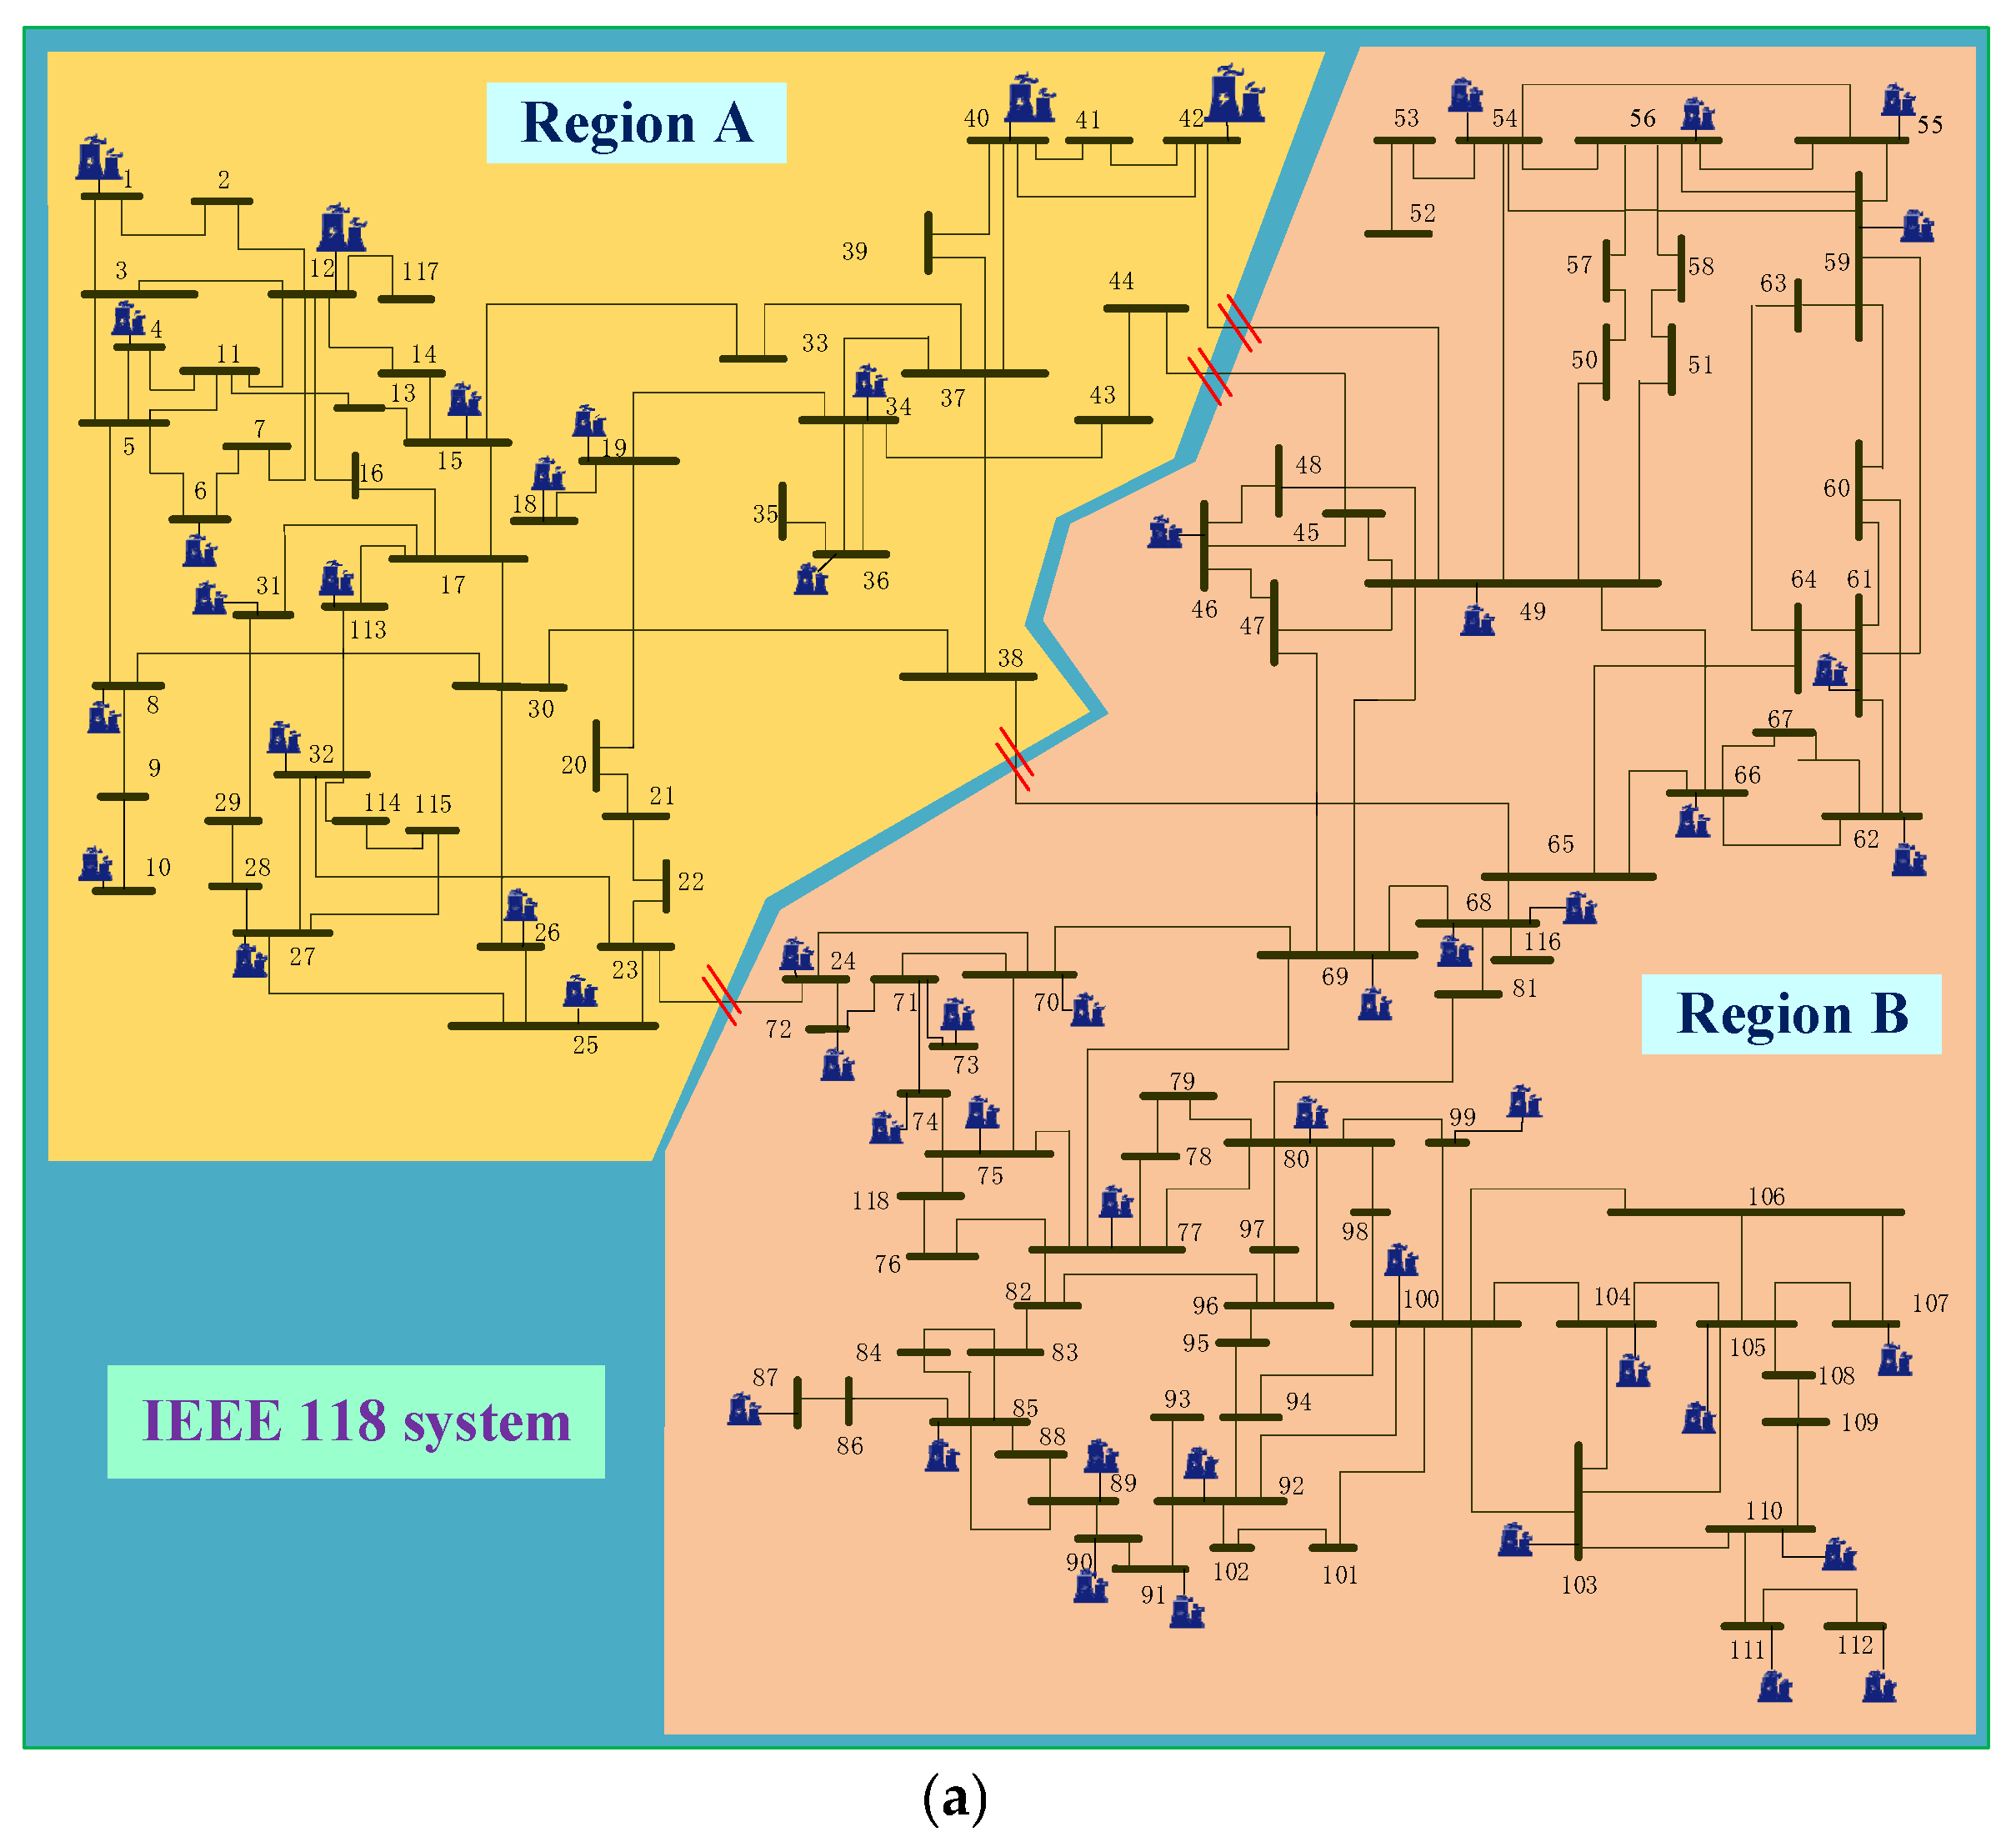
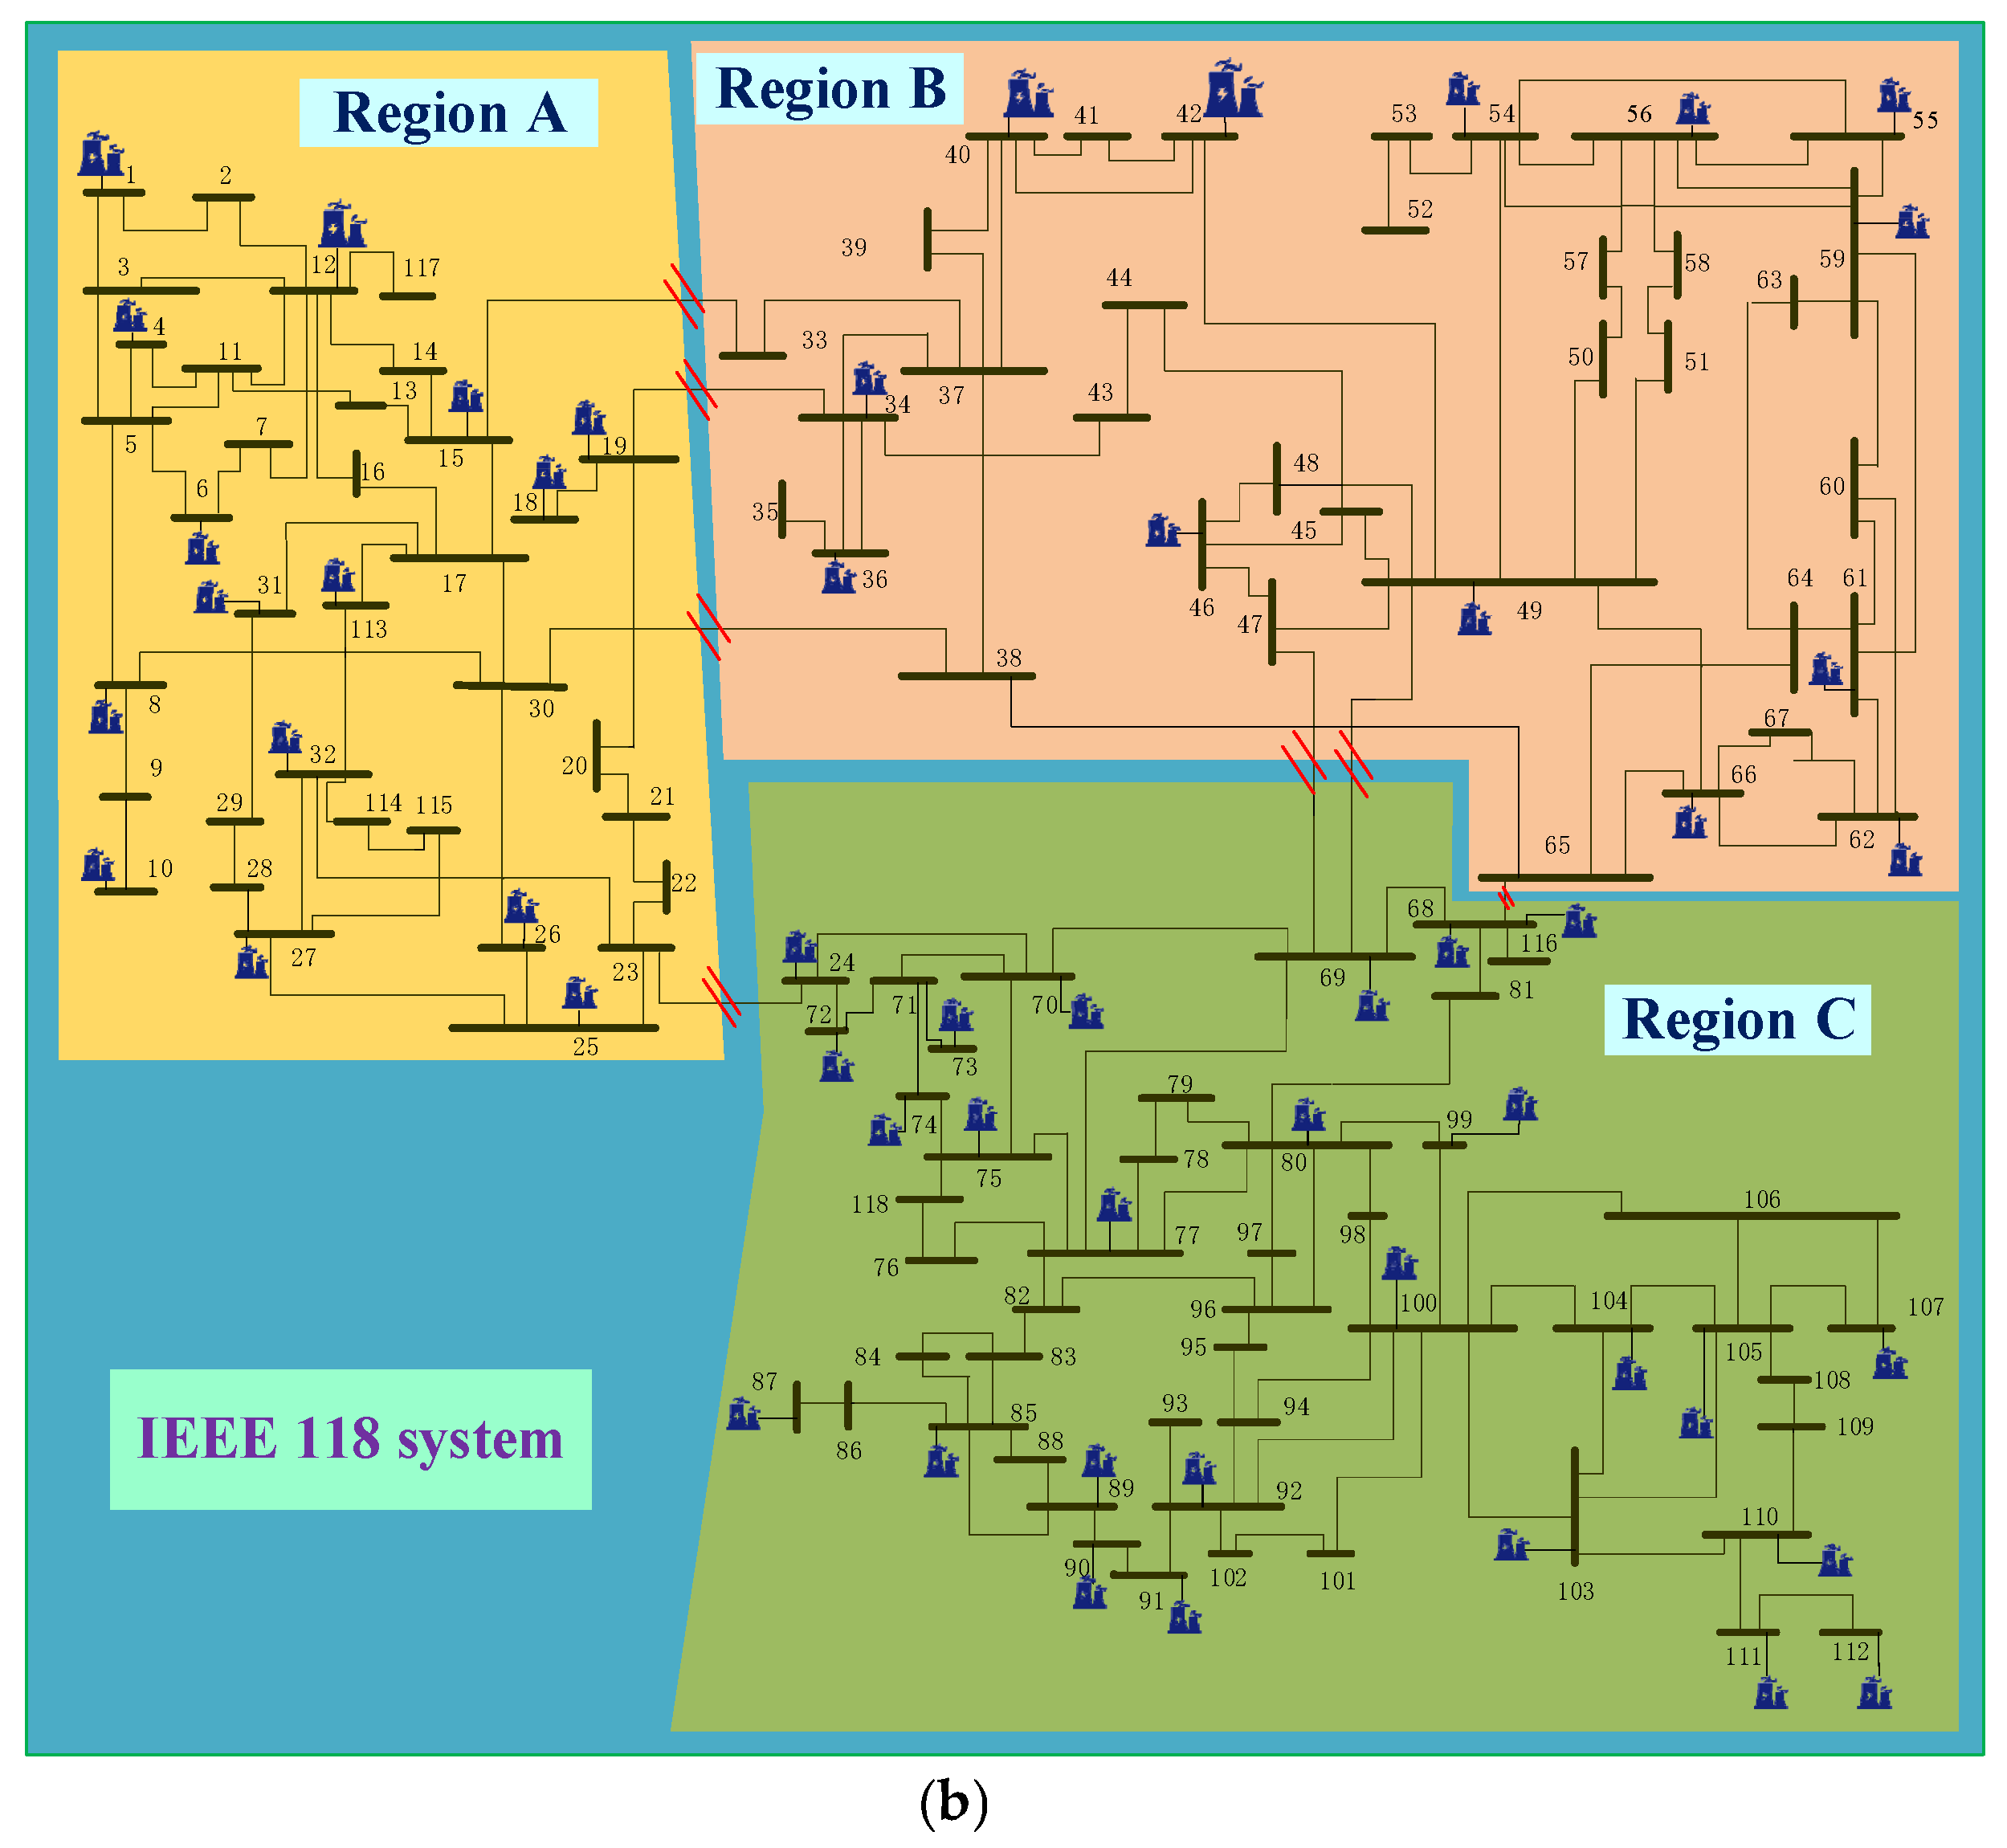
To verify the generalizability of MRDMGWOA on large-scale power systems, the IEEE 118 system is employed in this study for further validation. In this case, this study likewise partitions the IEEE 118 system into two and three regions for solving the problem, and the topological complementary structure of IEEE 118 after partitioning is shown in Figure 13. The number of units, number of buses, and contact line information between zones after zoning are shown in Table 8.
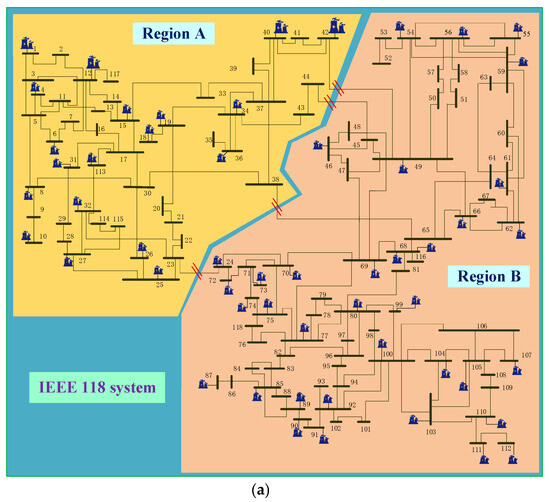
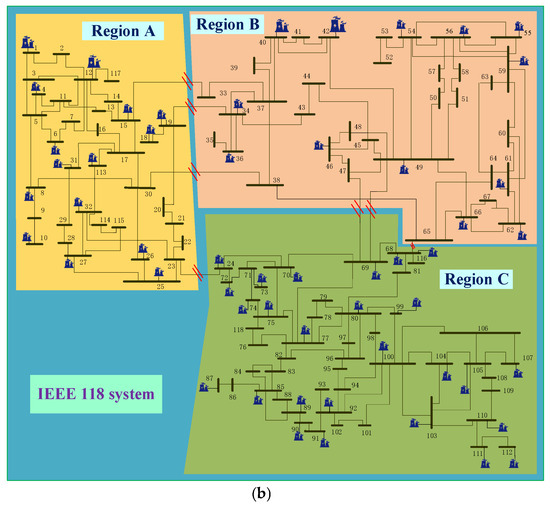
Figure 13.
(a). Topology of the two-region distributed IEEE 118 system. (b). Topology of the three-region distributed IEEE 118 system.

Table 8.
Number of buses and generators before and after IEEE 118 system zoning.
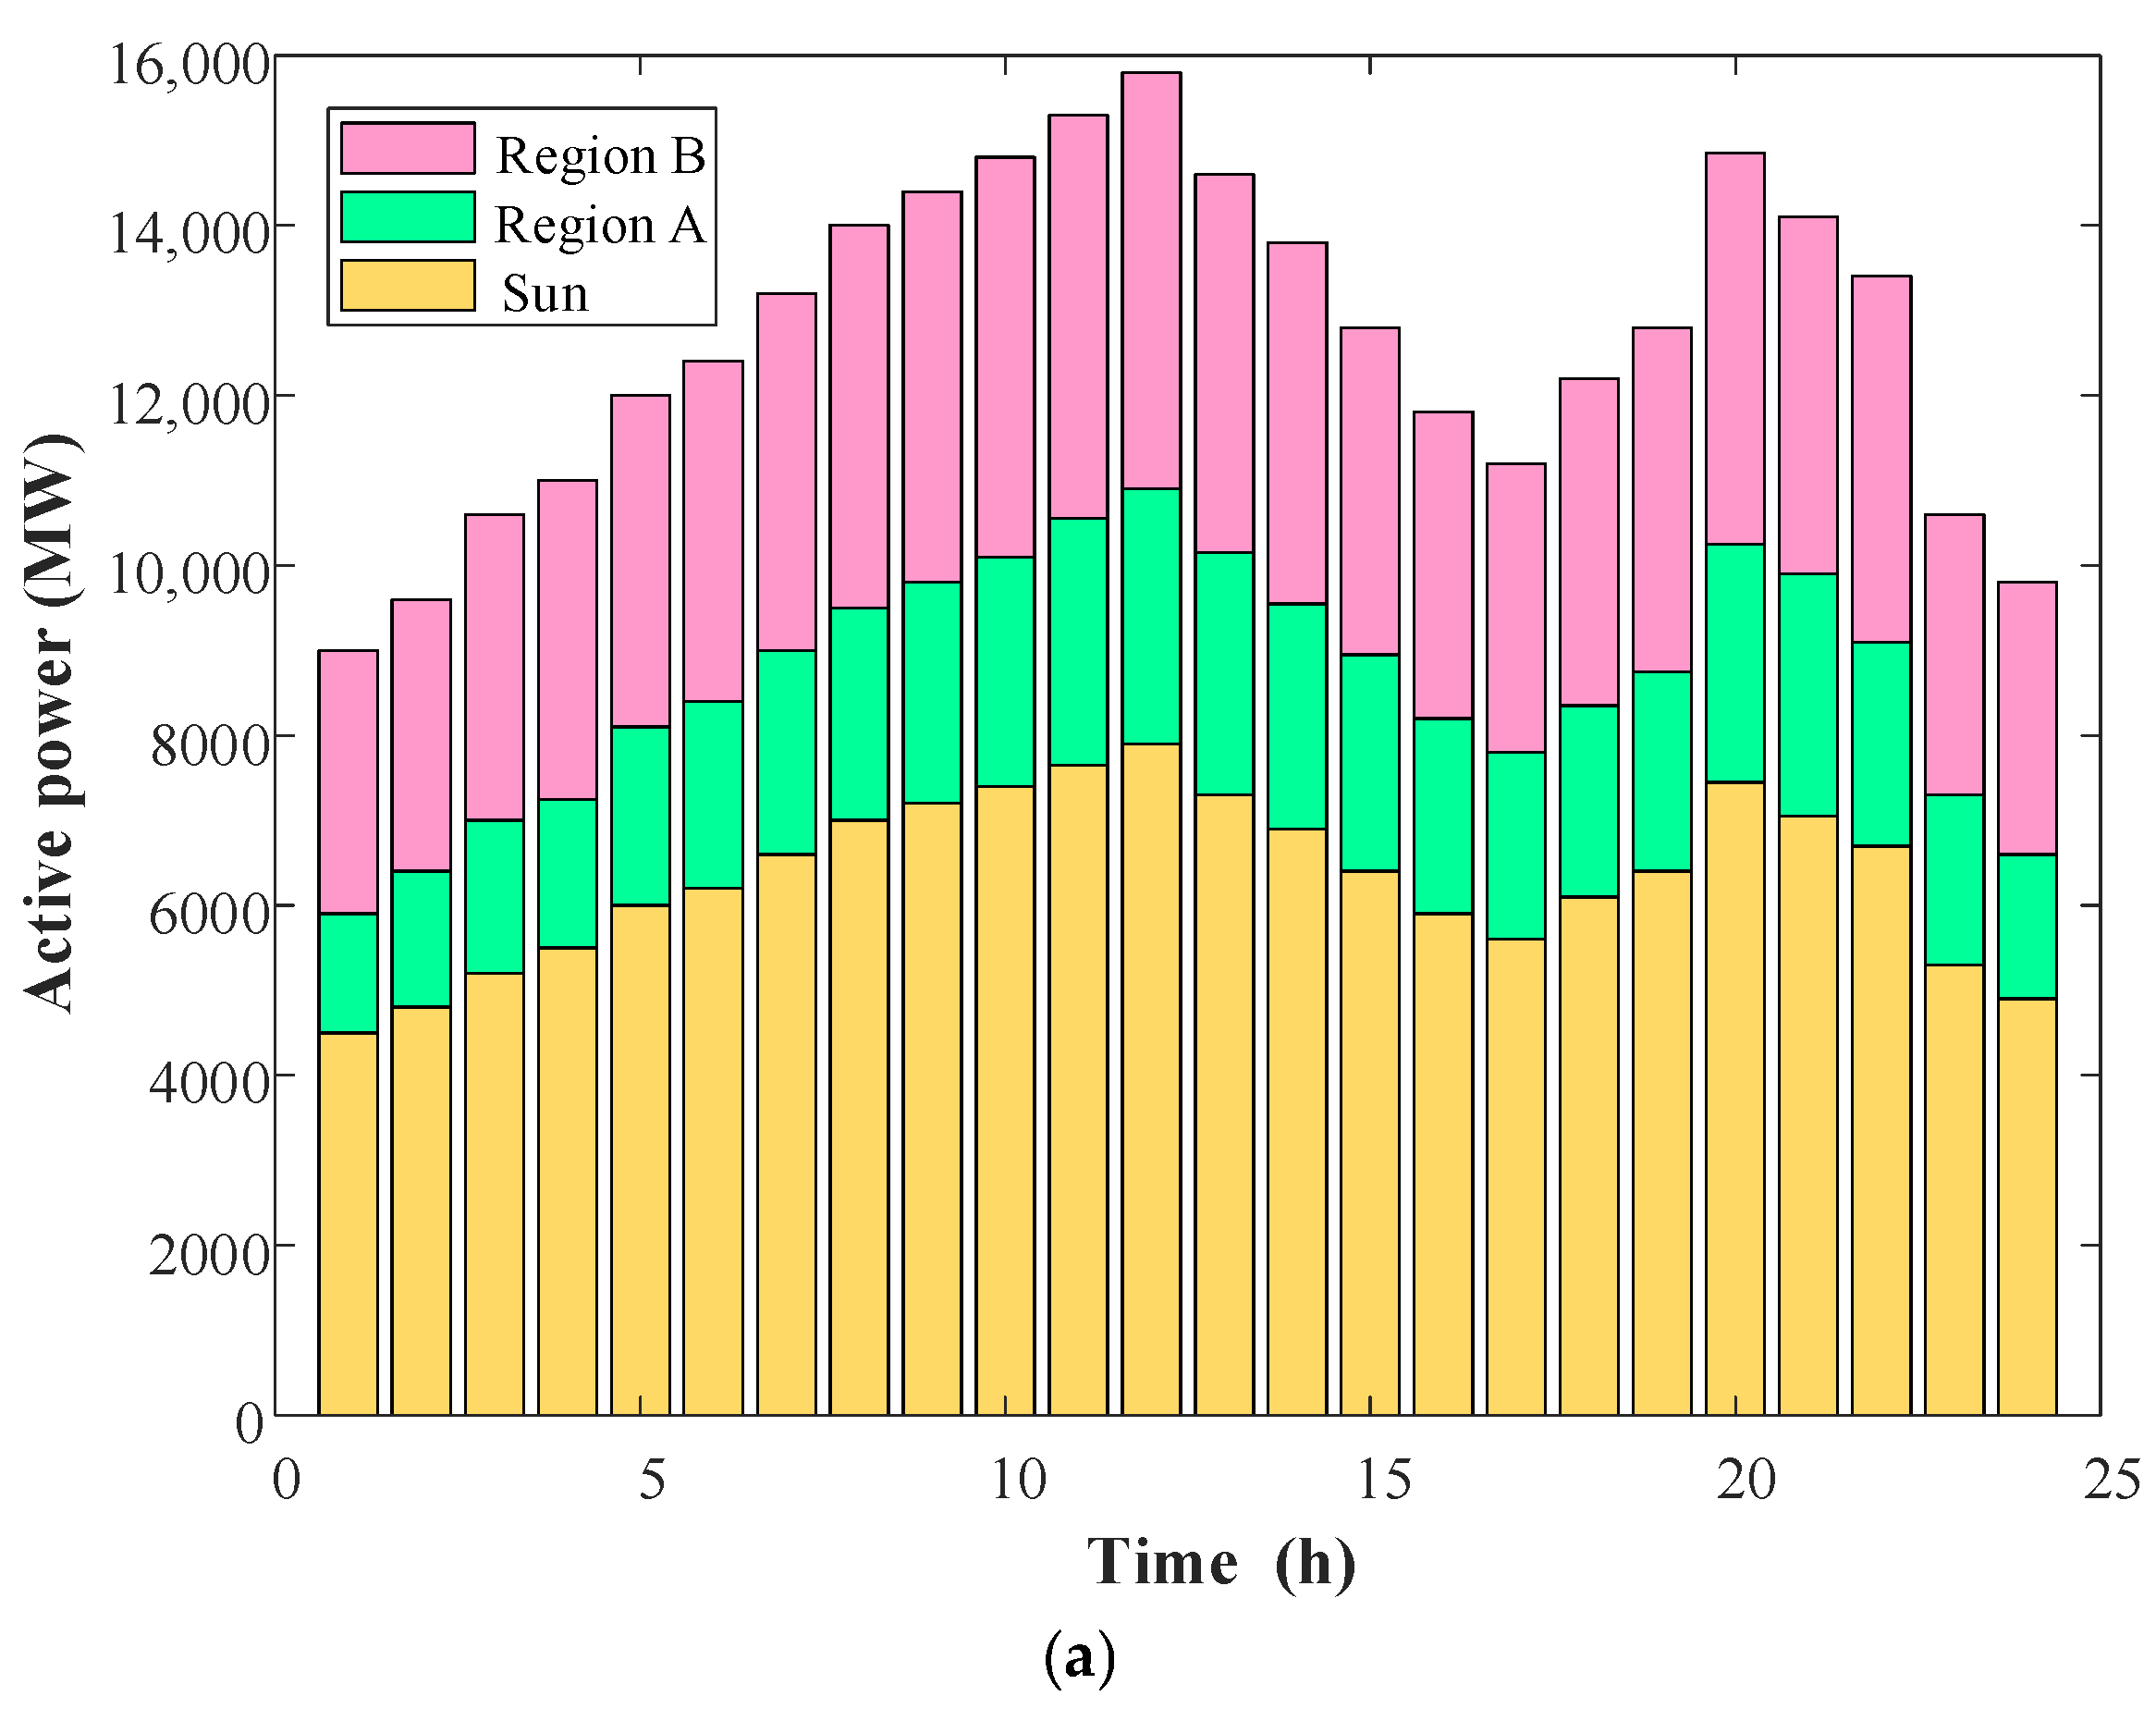
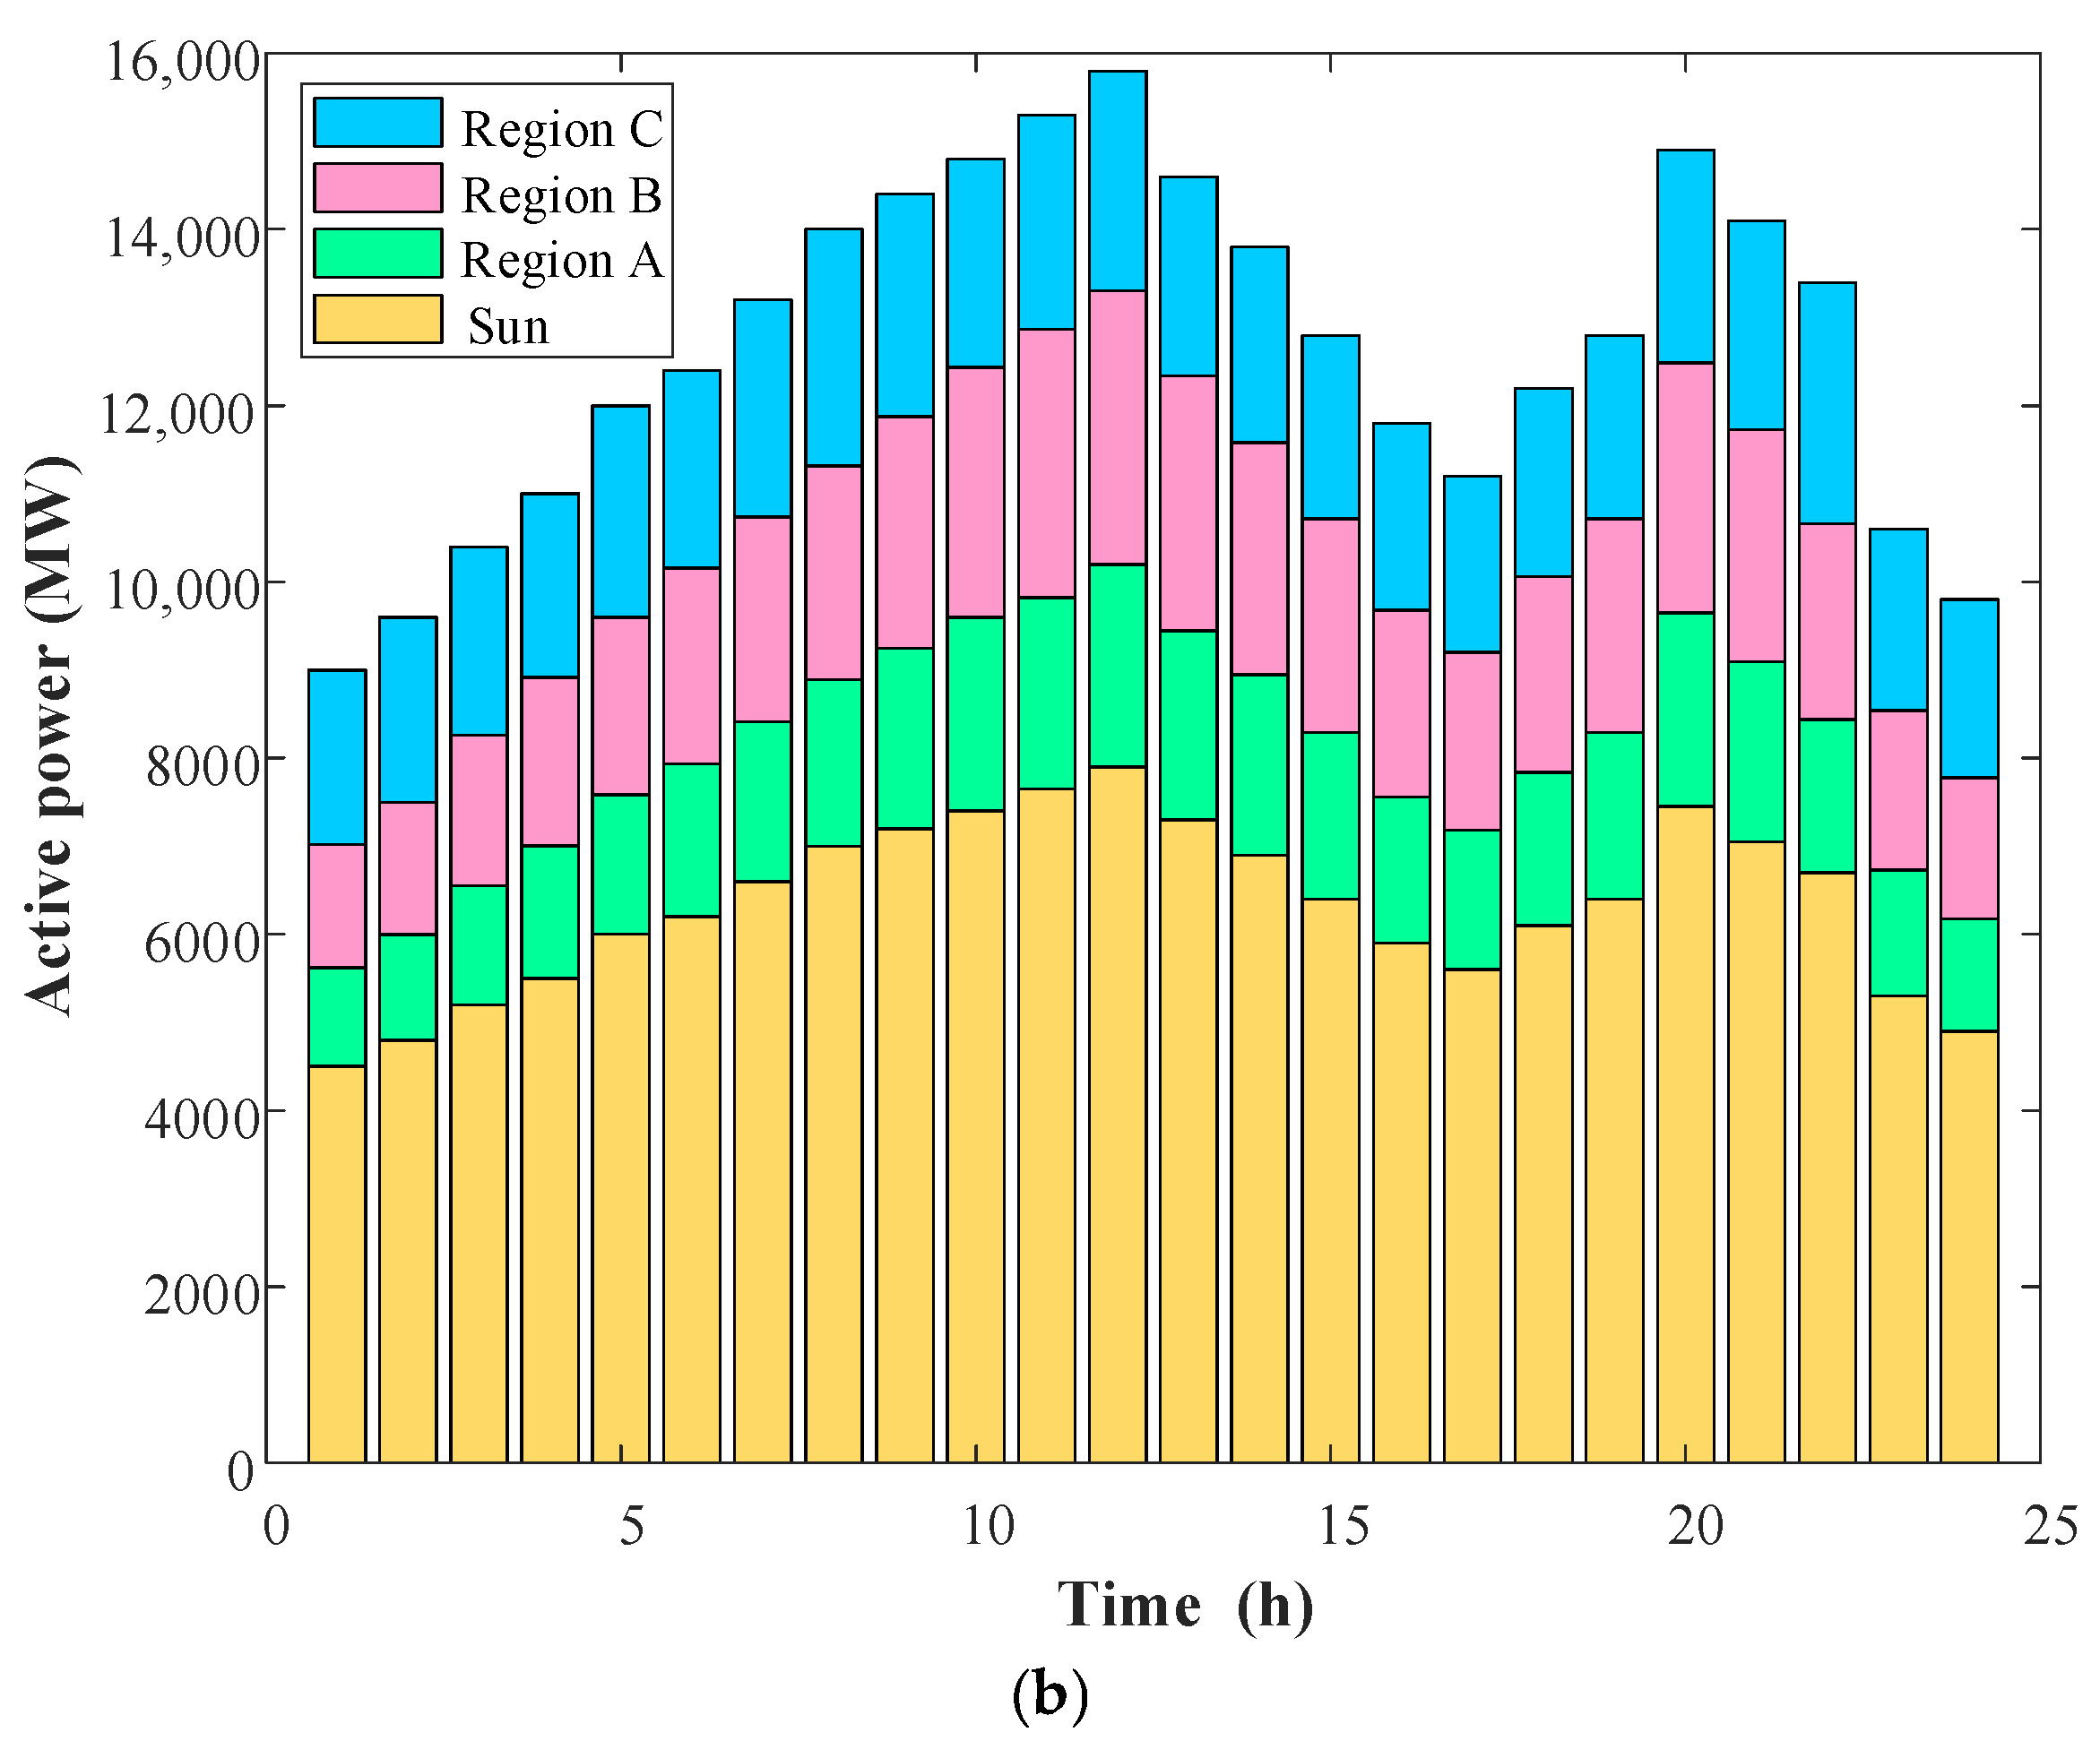
Figure 14 illustrates the active output versus load demand of the units in the IEEE 118 system for the centralized optimization, the two-region distributed optimization, and the three-region distributed optimization for one day. For the IEEE 118 system, the centralized optimization and two-region and three-region distributed optimization are also used in this study. The parameter settings for centralized optimization and two-region and three-region distributed optimization are kept consistent with Table 3. Similar to the IEEE 39 system, the centralized optimization also uses CMGWOA to solve the IEEE 118 system without any zoning.
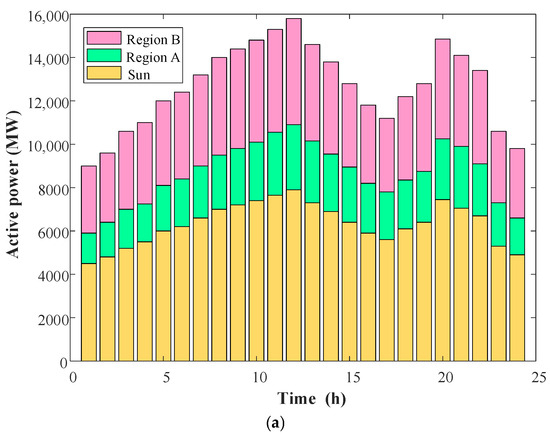
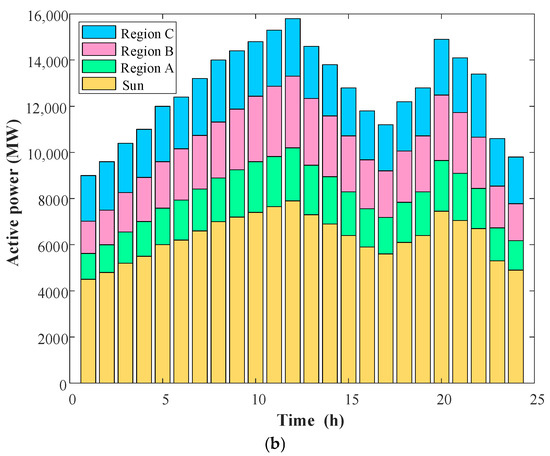
Figure 14.
(a). Active output of the units of the two-region distributed IEEE 118 system. (b). Active output of the units of the three-region distributed IEEE 118 system.
Figure 15 illustrates the comparison of Pareto curves for centralized optimization, two-zone MRDMGWOA, and three-zone MRDMGWOA after the 11th boundary exchange of information. Table 4 presents the optimal, worst, and average values of power generation cost and carbon emissions obtained after 20 experiments for the three optimization types, as well as the average running time for each optimization type. In Figure 15 and Table 9, the Pareto curves of both the two-region and three-region distributed optimizations can dominate the Pareto curves of the centralized optimization, and thus the MRDMGWOA proposed in this study can obtain a better dispatching scheme. In addition, MRDMGWOA has a shorter computational time.
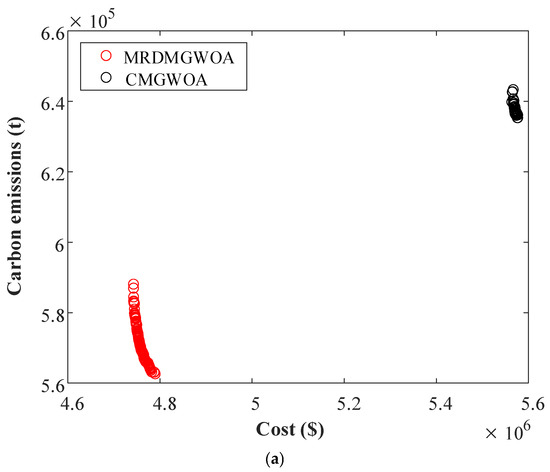
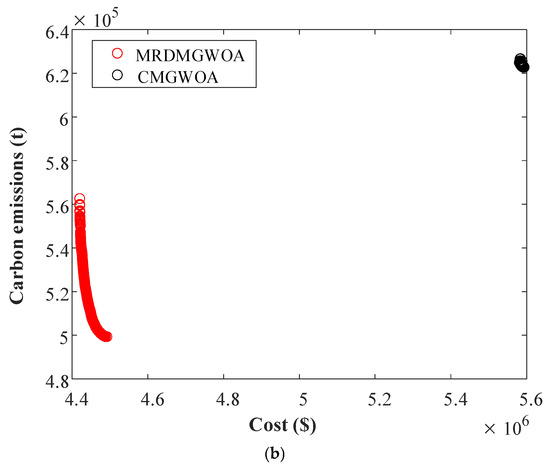
Figure 15.
(a). Centralized and two-region distributed Pareto curves in the IEEE118 system. (b). Centralized and three-region distributed Pareto curves in the IEEE118 system.

Table 9.
Calculated results for the three optimization types.
Table 10 shows the mean and standard deviation of spacing, Euclidian distance, and hypervolume for the three optimization methods after 20 boundary exchanges of information. From Table 10, it can be seen that after 20 boundary exchanges of information, the performance metrics of two-region and three-region MRDMGWOA are better than those of the centralized optimization. In addition, the standard deviation data show that the fluctuations of all three indicators of MRDMGWOA are significantly smaller than those of the comparison algorithms, which indicates that, in 20 runs, MRDMGWOA shows better stability in the ability of Pareto frontier coverage, proximity to the optimal frontier, and uniformity of distribution and is less interfered with by random factors.

Table 10.
Comparison of three performance metrics for different optimization types of IEEE 118 systems.
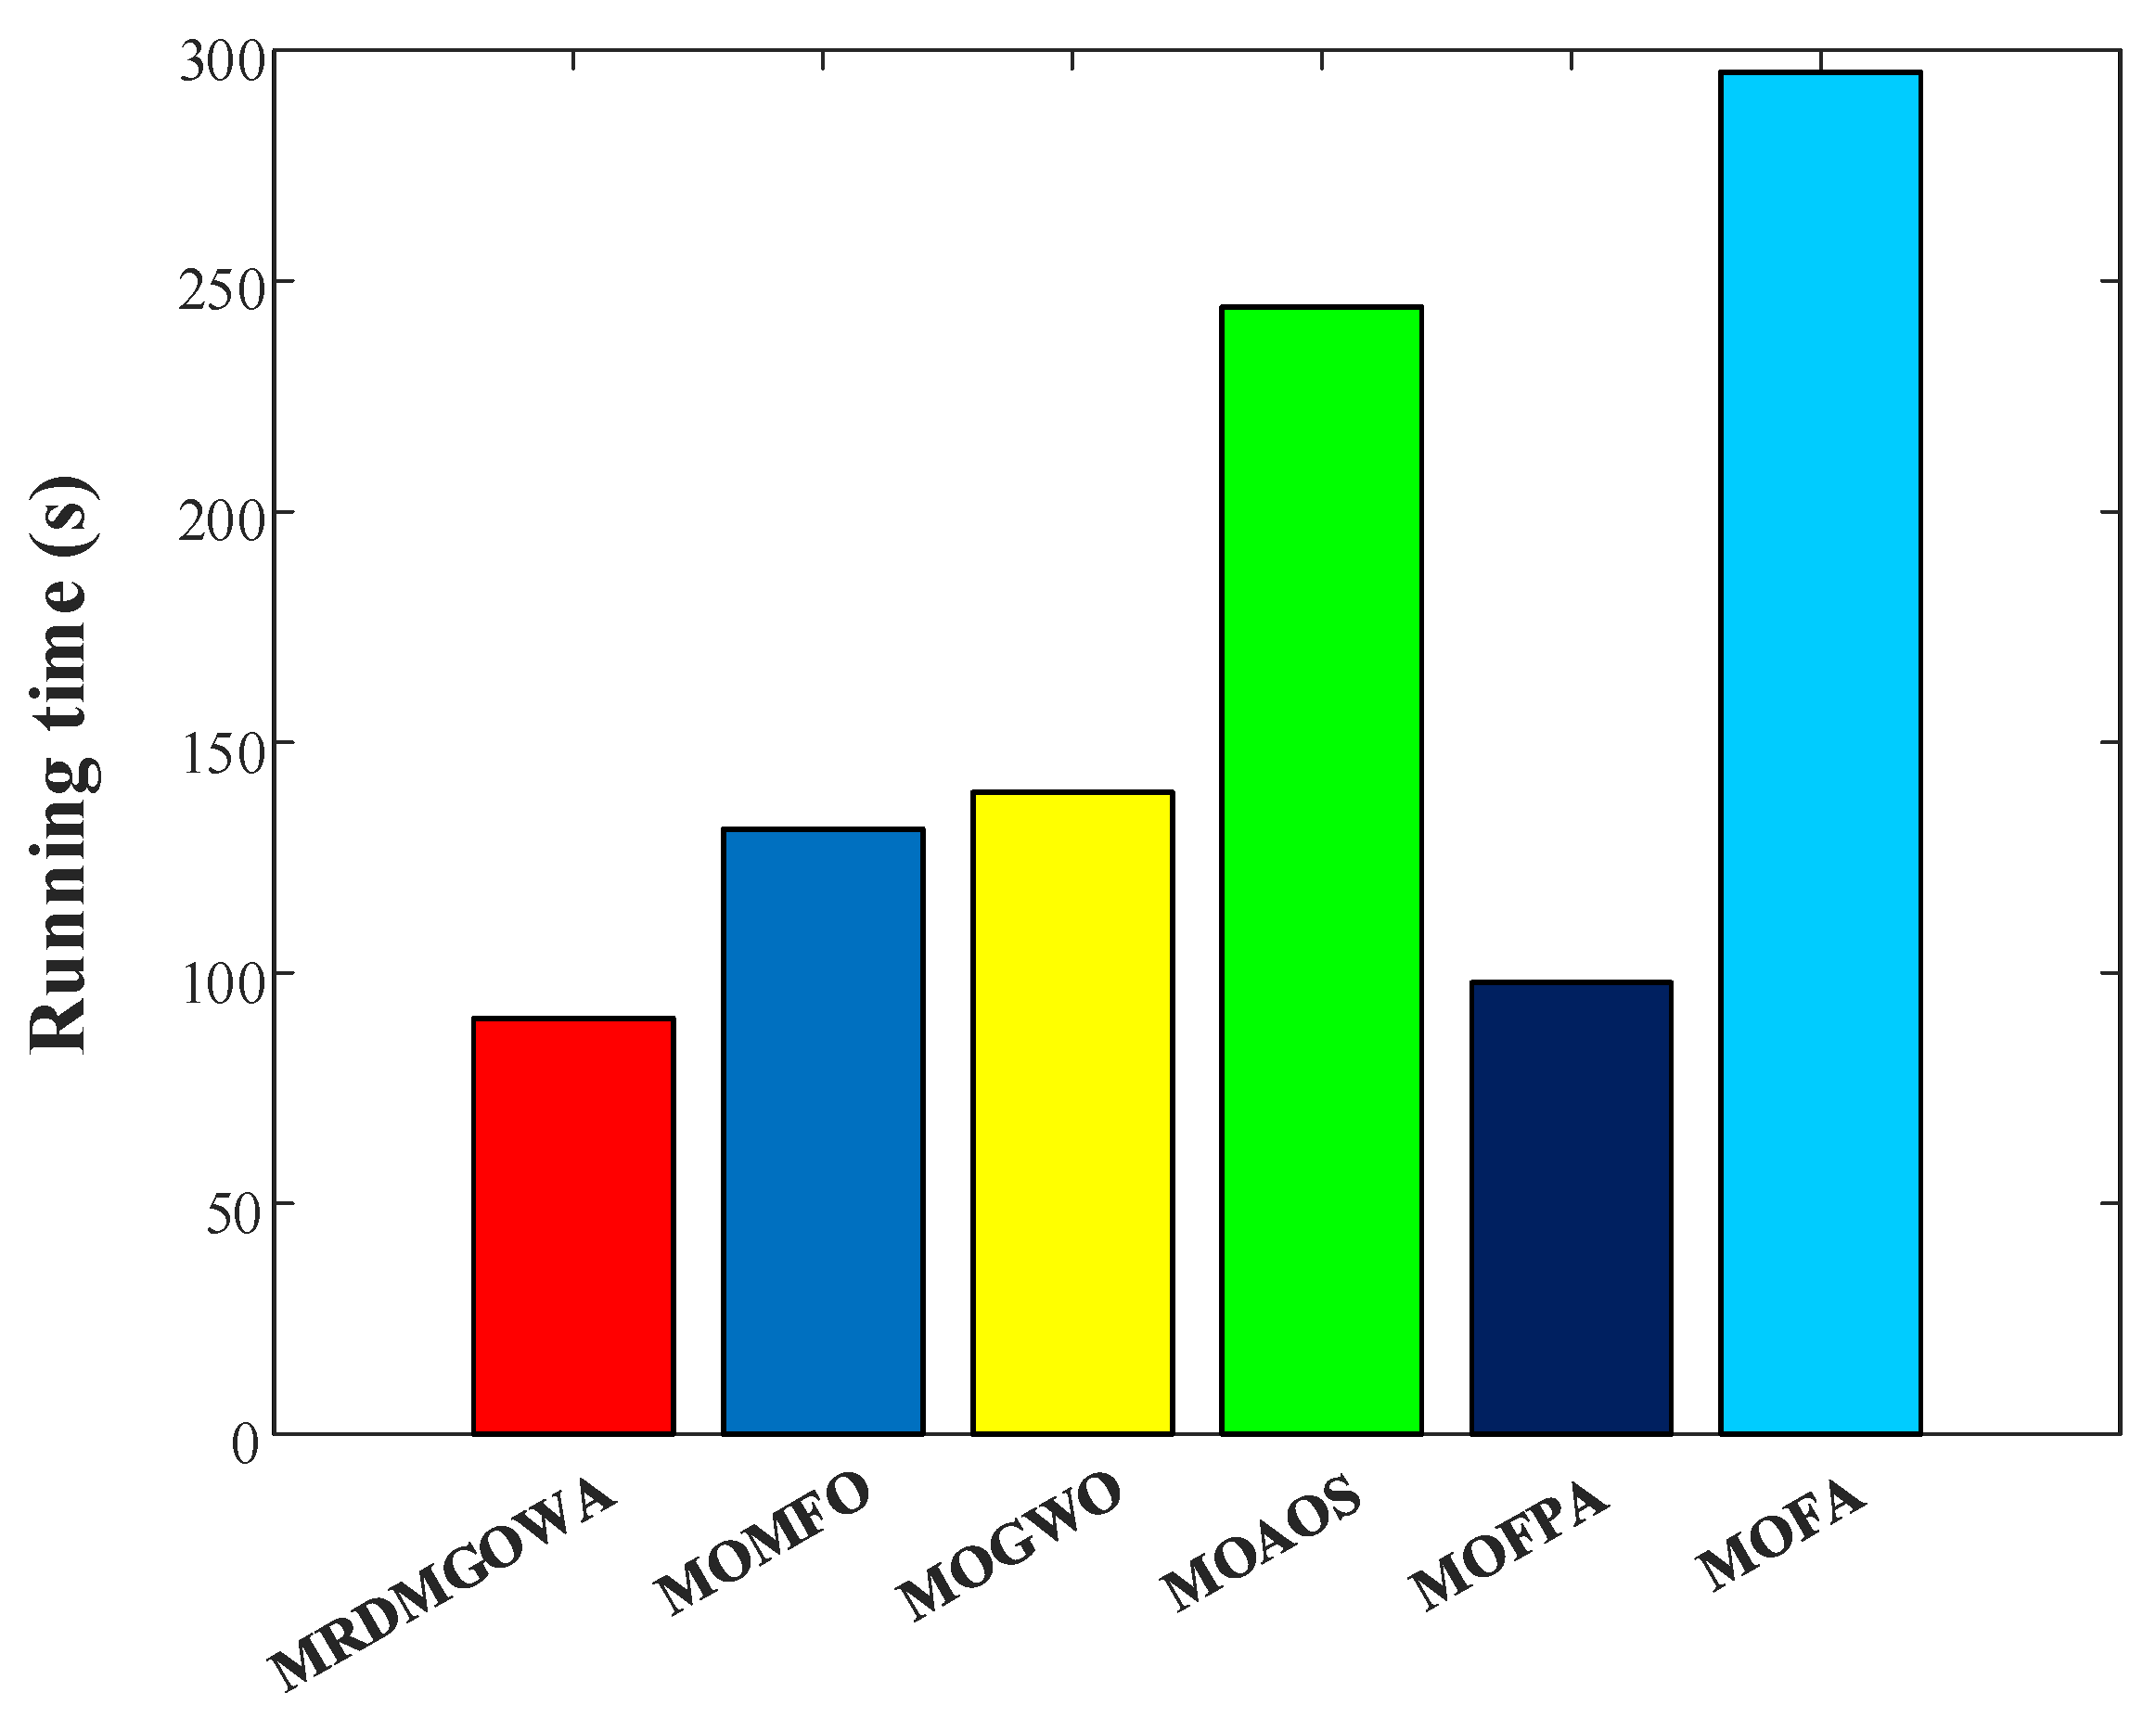
In the IEEE 118 system, this study continues the experimental design of the IEEE 39 node system by comparing MRDMGWOA with MOGWO, MOMFO, MOFPA, MOFA, and MOAOS in a two-region distributed system. The six optimization algorithms apply the same parameters as shown in Table 6. Figure 16 compares the Pareto curves of the six optimization algorithms; Figure 17 compares their running times; and Table 11 compares their performance metrics.
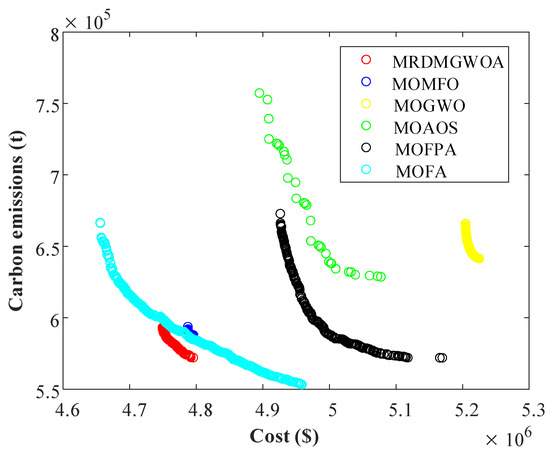
Figure 16.
Comparison of six optimization algorithms for solving the Pareto curve of a two-region distributed IEEE 118 system.
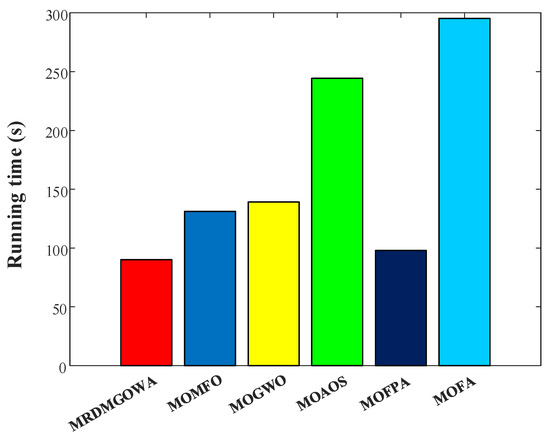
Figure 17.
Runtime comparison of six optimization algorithms for solving a two-region distributed IEEE 118 system.

Table 11.
Comparison of three performance metrics for different algorithms of IEEE 118 systems.
As can be seen in Figure 16 and Figure 17 and Table 11: (1) MRDMGWOA can have a Pareto curve closer to the lower left, which is more dominant among all the compared algorithms, and the computation time of MRDMGWOA is the shortest among all the compared algorithms; (2) compared to the other five algorithms, MRDMGWOA has lower mean and standard deviation of the three performance metrics after 20 boundary exchanges of information. Thus, it shows that MRDMGWOA has better convergence and stability in solving larger-scale power systems as well.
Based on the simulation results of MRDMGWOA in the IEEE 118 system the following conclusions can be drawn:
- (1)
- The MRDMGWOA continues the excellent performance on the IEEE 39 system and further demonstrates good stability and convergence in solving larger-scale power systems.
- (2)
- The MRDMGWOA effectively overcomes the shortcomings of centralized optimization with slow computation and poor optimization results. In the simulation of the IEEE 118 system, the two-area distributed optimization reduces the cost by 13% and CO2 emission by 6% compared to the centralized optimization, while the running time is shortened by 38.84 s. The three-area distributed optimization further improves the performance with a 20% cost cut, 17% CO2 emission reduction, and a 45.46 s shorter running time.
- (3)
- In comparison with other heuristic algorithms, MRDMGWOA can also obtain lower costs and CO2 emissions in a shorter time, which further indicates that MRDMGWOA is more adaptable and computationally efficient under complex conditions.
4.3. Benchmark Function Test
To verify the performance of MGWOA, this study compares MGWOA with MOMFO, MOGWO, MOAOS, MOFPA, and MOFA on the ZDT test function. The ZDT function is a standard test function in multi-objective optimization used to evaluate the performance of multi-objective optimization algorithms. Table 12 shows the performance index comparison of the six optimization algorithms on the ZDT1 test function. Figure 18 shows the Pareto curve comparison of the six optimization algorithms. According to Table 12 and Figure 18, it can be seen that:

Table 12.
Performance comparison of six optimization algorithms in ZDT1.

Figure 18.
Comparison of Pareto curves of six optimization algorithms for ZDT test function: (a) ZDT1; (b) ZDT2; (c) ZDT3.
- (1)
- Across all three performance metrics, MGWOA exhibits excellent convergence behavior and uniform solution quality, with its solution set displaying a markedly higher degree of distributional evenness.
- (2)
- The running time of MGWOA is the least among all the algorithms.
- (3)
- The Pareto curve obtained by MGWOA is more dominant.
4.4. Discussions
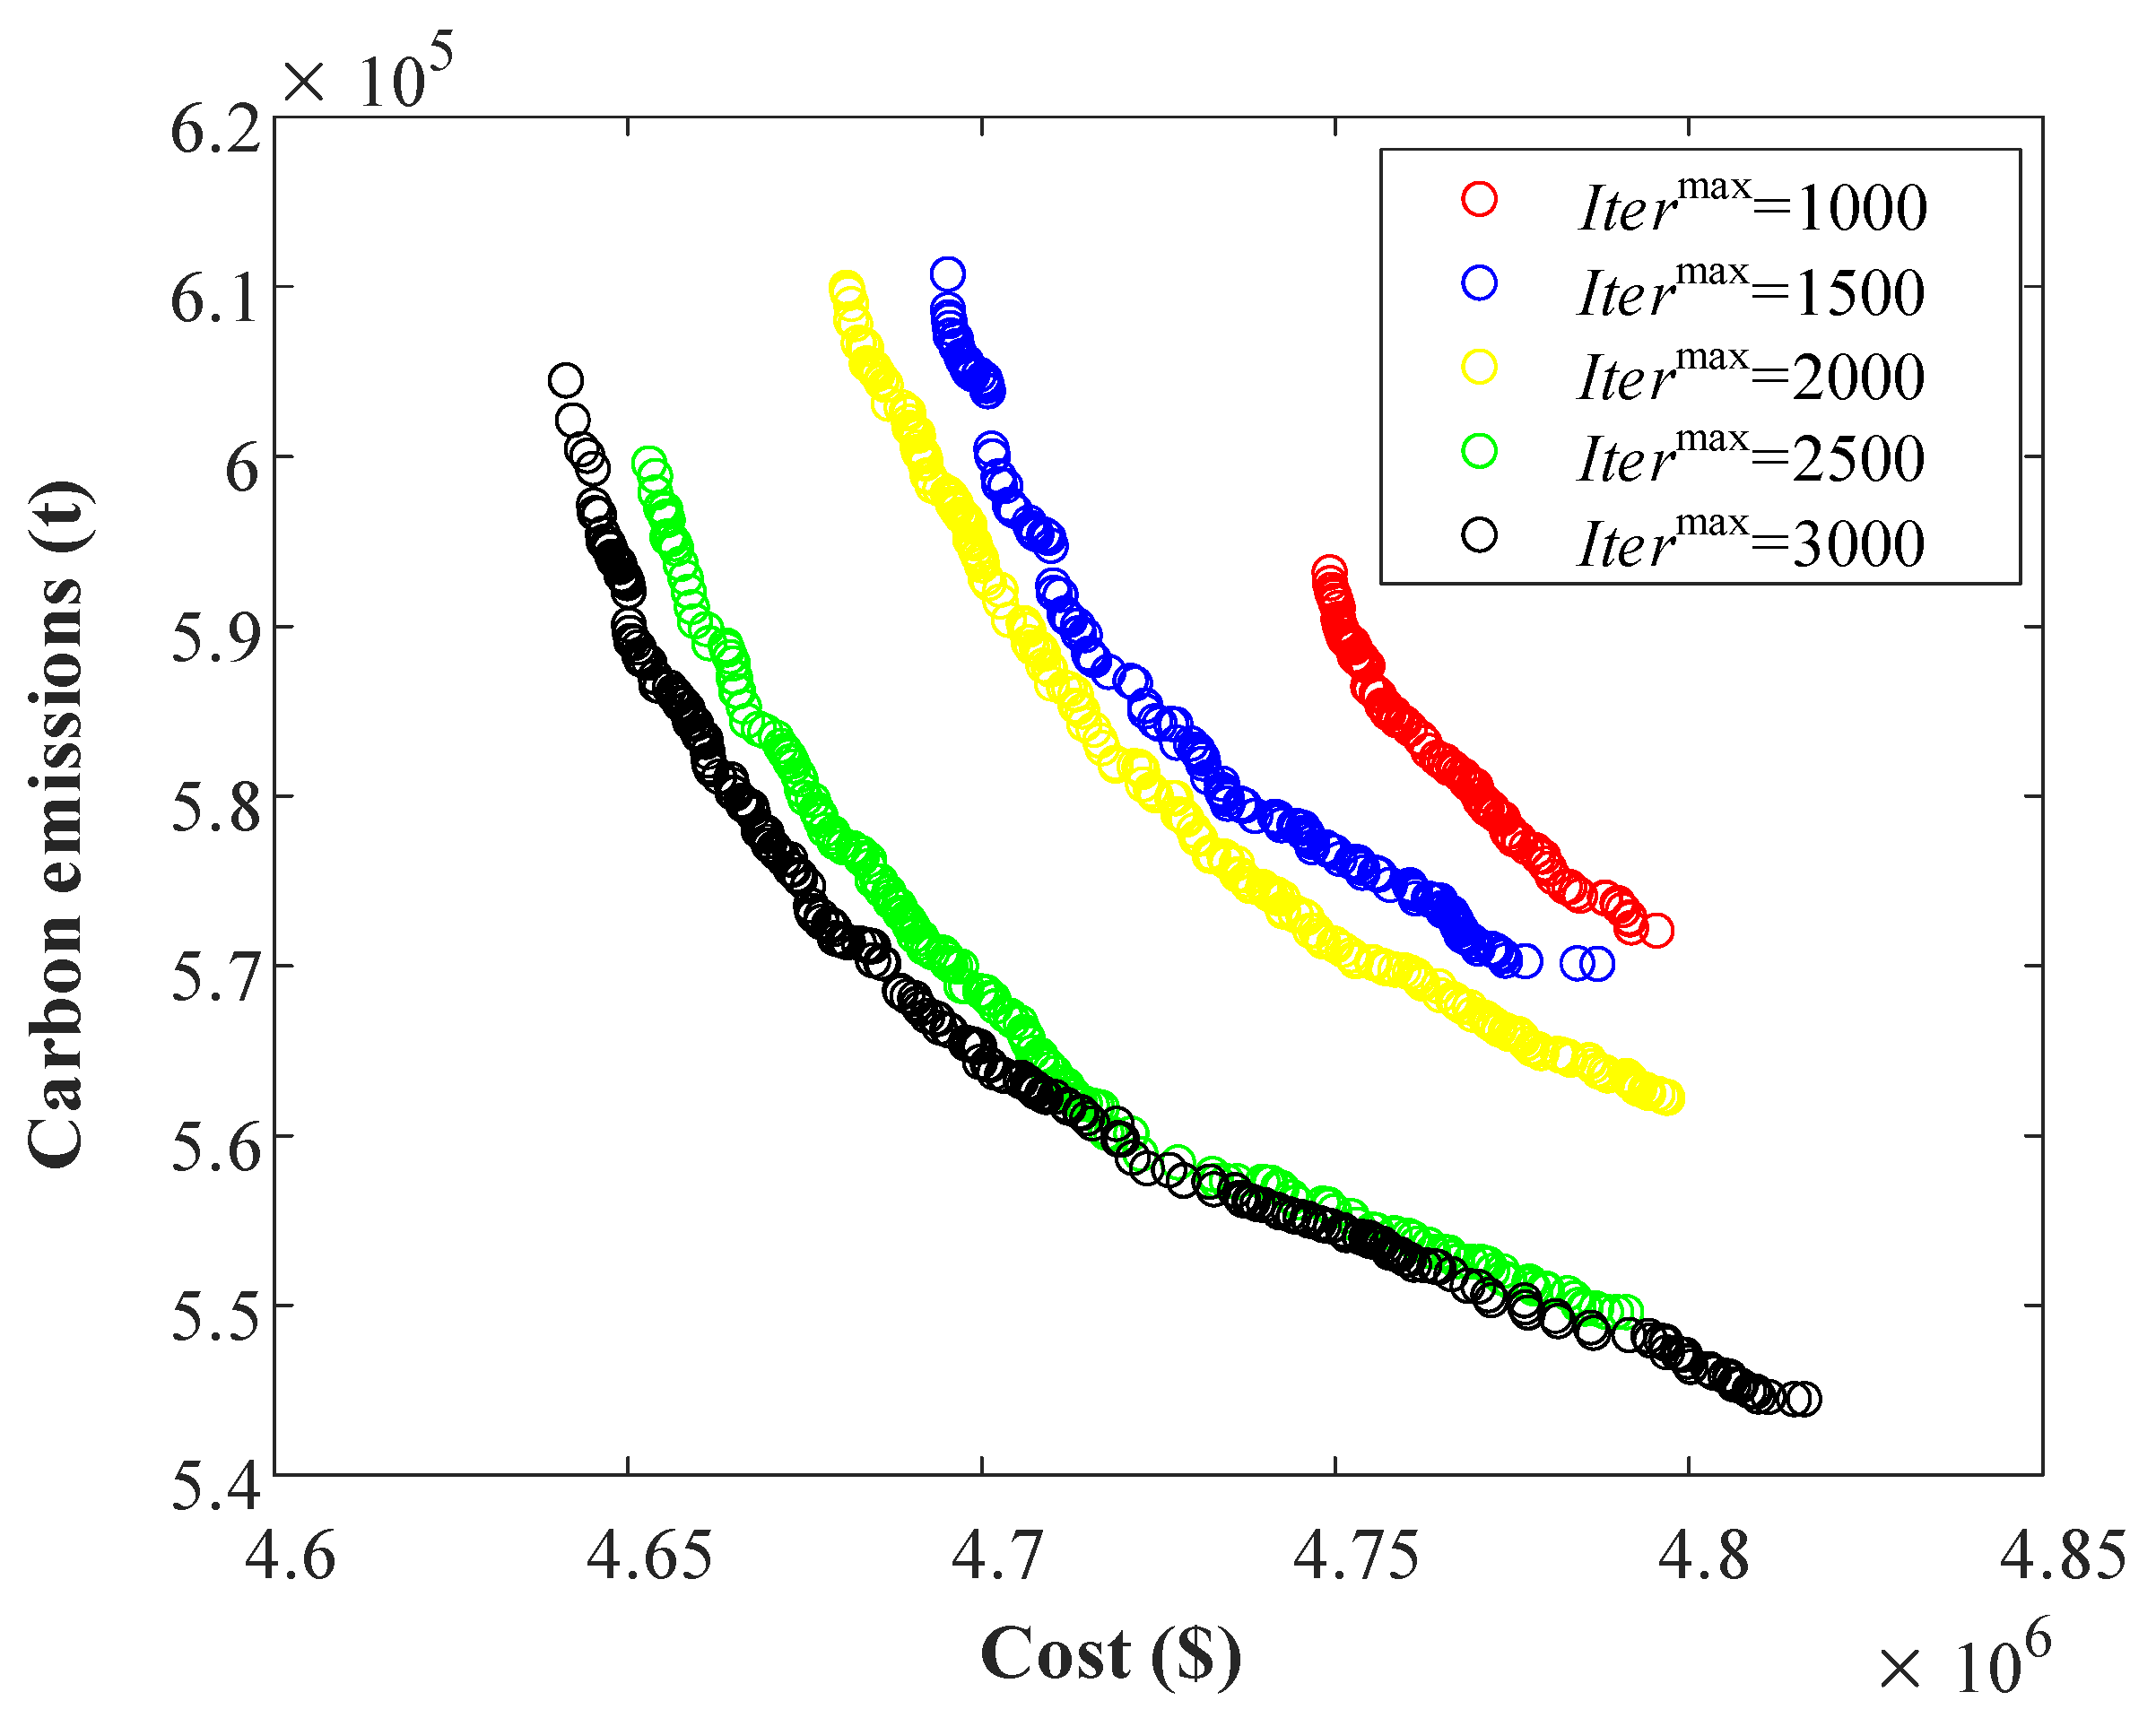
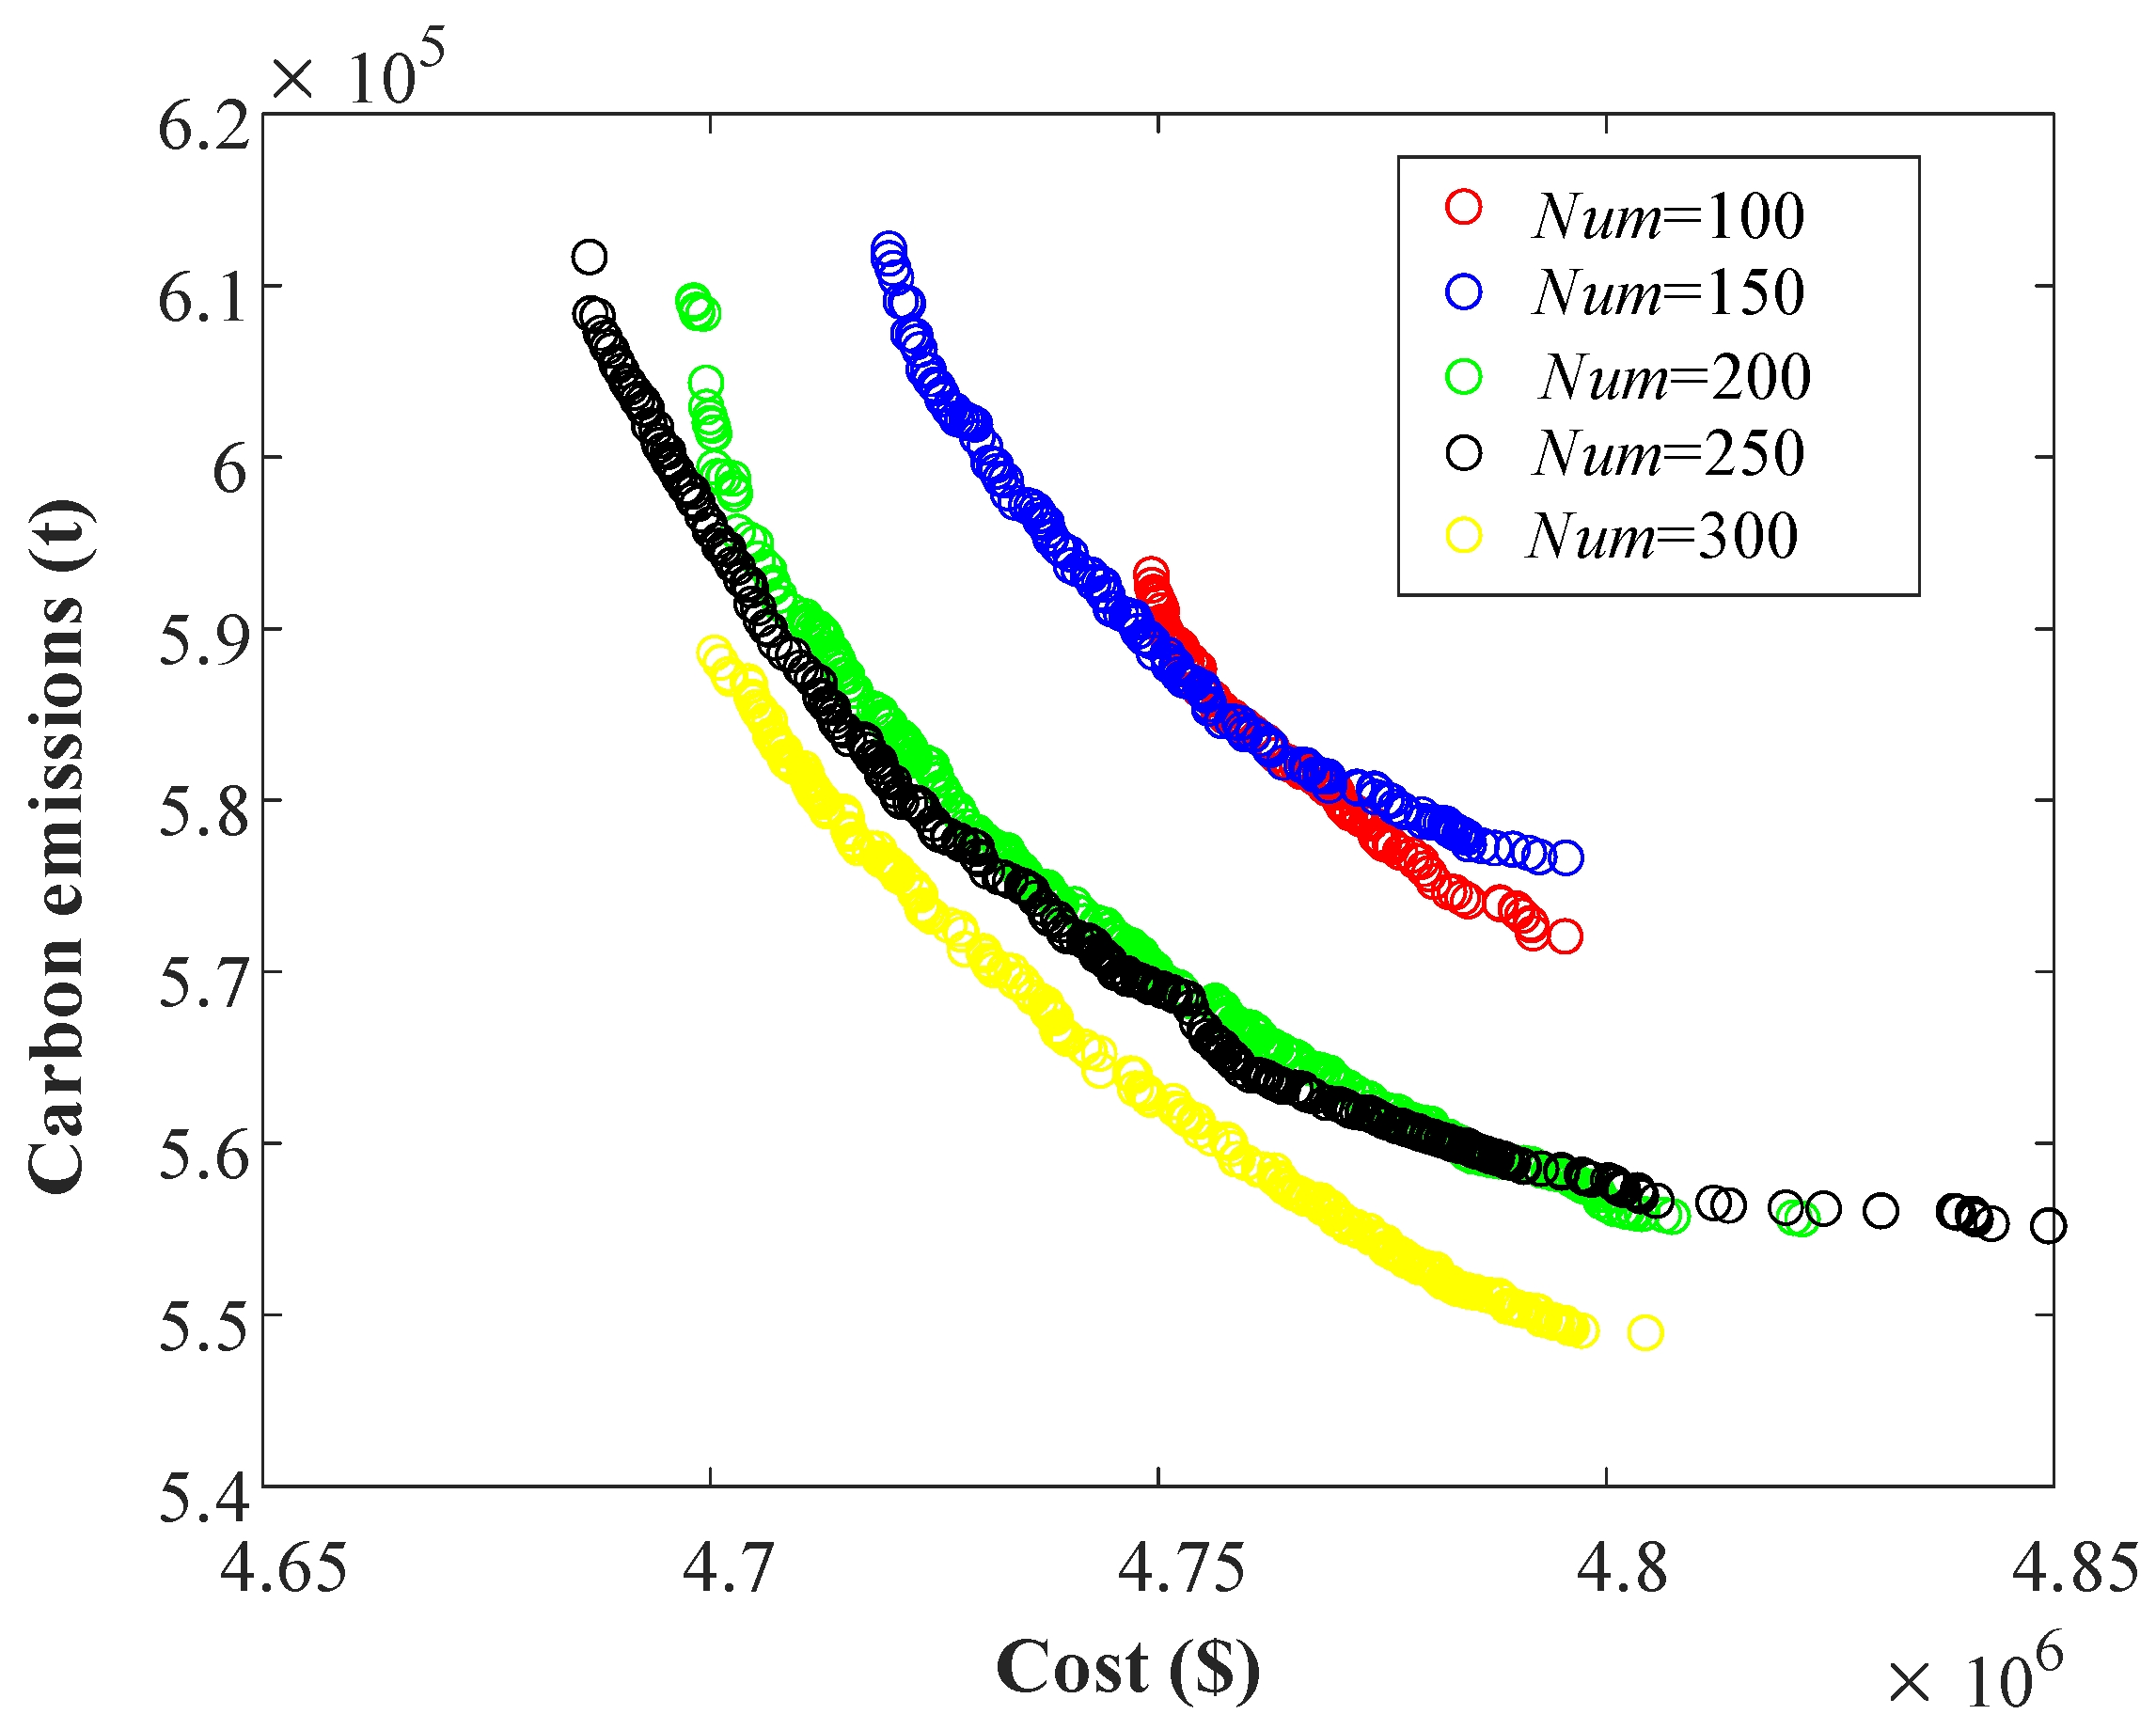
In this section, the effects of different Itermax and Num on the computational results of MRDMGWOA as well as the runtime are discussed taking the two-region distributed IEEE 118 system as an example.
- (1)
- Different Itermax
In this section, five different sets of Itermax are set to compare the cost, carbon dioxide emission, and operation time of MRDMGWOA with different Itermax (see Table 13). Figure 19 illustrates the variation of the Pareto curve for MRDMGWOA at different Itermax. As can be seen in Figure 19 and Table 13, as the number of Itermax increases, the MRDMGWOA obtains a more dominant Pareto curve and can also obtain a better ED scheme. However, an increase in Itermax also leads to a longer computation time for MRDMGWOA.

Table 13.
Computation of MRDMGWOA with different Itermax.
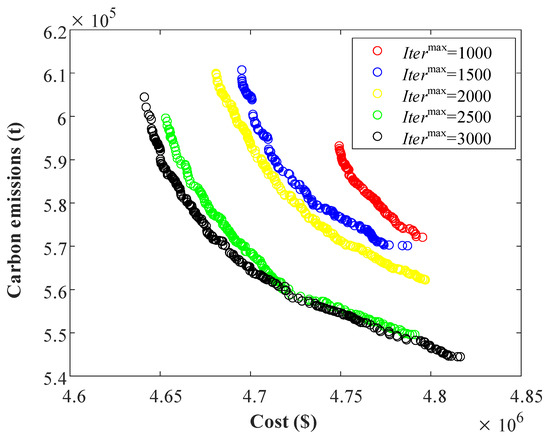
Figure 19.
Comparison of Pareto curves for MRDMGWOA with different Itermax.
- (2)
- Different Num
To assess the impact of Num, this section designs five sets of experiments to analyze the differences in power generation cost, CO2 emission, and operating time of MRDMGWOA (as shown in Table 14) and plots the change in Pareto curve for different Num (see Figure 20). As is discernible from Figure 20 and Table 14, the Pareto curve of MRDMGWOA gradually shifts to the lower left as the number of Num increases, and the average cost and CO2 emission continue to decrease, but the computational time also increases.

Table 14.
Computation of MRDMGWOA with different Num.
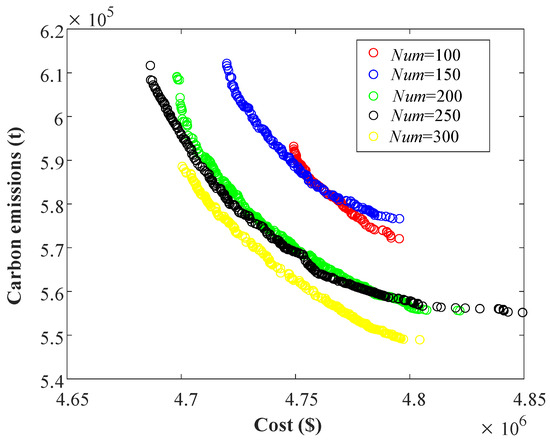
Figure 20.
Comparison of Pareto curves for MRDMGWOA with different Num.
After multiple repeated experiments on MRDMGWOA, the following conclusions were drawn:
- (1)
- A population size Num set to 100 gives a smooth Pareto curve, without the need to increase the population size any further.
- (2)
- The maximum number of iterations within each region, Itermax, should be set above 800 to fully utilize the performance of the algorithm. In this study, the Itermax is set to 1000, and the larger the Itermax setting is, the longer the computation time of the algorithm will be.
Therefore, in this study, Num = 100 and Itermax = 1000 are set in the simulation of the IEEE 39 and 118 systems. The above parameter settings not only can effectively balance the relationship between power generation cost and carbon emission but also can provide a better scheduling scheme for the system in a short period of time to satisfy the requirements of real-time operation of the power system.
Although MRDMGWOA has achieved good results, the following shortcomings remain:
- (1)
- The computational speed of the MRDMGWOA proposed in this study is not as fast as the analytic algorithm.
- (2)
- The MRDMGWOA proposed in this study has the common characteristic of all heuristic algorithms, i.e., the results obtained from each iteration are not consistent and have a certain degree of randomness.
- (3)
- The method proposed in this study has not yet been applied to clean energy systems containing wind power, photovoltaic, etc. with uncertainties.
- (4)
- MRDMGWOA has not been further verified on actual power systems.
5. Conclusions
Aiming at the MGED problem of the power system, this study proposes a new MRDMGWOA. The algorithm overcomes the weaknesses of centralized optimization in terms of low security, lagging computation velocity, high dispatch cost, and high CO2 emission. The feasibility and effectiveness of MRDMGWOA are verified by simulation results in IEEE 39 and IEEE 118 systems.
- (1)
- The proposal of MRDMGWOA fills the gap of the multi-region distributed optimization method. And MRDMGWOA can solve the problems of multi-region distributed optimization and multi-gradient optimization at the same time.
- (2)
- MRDMGWOA can improve ED efficiency while reducing power system computation time. In the IEEE 39 system experiment, MRDMGWOA not only reduced the average cost and CO2 emissions by 17% and 22%, respectively, but also reduced the computation time by 16.14 s. In the experiments on the IEEE 118 system, MRDMGWOA similarly decreases the cost and CO2 emissions by 20% and 17% and shortens the computation time by 45.46 s. In addition, in the comparison of spacing, hypervolume, and Euclidian distance, the performance metrics of multi-regional distributed optimization are significantly better than those of centralized optimization, suggesting that MRDMGWOA has excellent stability.
- (3)
- The Pareto curve generated by MRDMGWOA exhibits a higher degree of dominance compared to those obtained from MOGWO, MOMFO, MOFPA, MOFA, and MOAOS. This implies that MRDMGWOA is capable of achieving greater reductions in both power generation costs and CO2 emissions, thereby offering a more cost-effective operational scenario for the power system.
In future work, (1) consider applying the proposed MRDMGWOA to solve the multi-gradient economic dispatch problem for integrated energy systems; (2) consider more complex constraints to ensure the stability of the economic dispatch; (3) give full consideration to the impact of grid connection of renewable energy sources on the power system; (4) the robustness of the algorithm under uncertainty conditions should be further verified by considering the combination of real wind and PV output data from a provincial grid; (5) consider the application of MRDMGWOA to the solution of real power systems; (6) considering the actual load timing data of the regional grid, the algorithm’s sensitivity parameters to load uncertainty should be optimized to enhance the adaptability in real-world scenarios; (7) consider factors such as electrical distance, load balance, connection strength, etc. to fully ensure the scientific nature of power system zoning.
Author Contributions
L.Y.: Conceptualization, Funding acquisition, Project administration, Supervision, Methodology, Resources, Writing—review and editing. Y.Y.: Data curation, Formal analysis, Investigation, Software, Validation, Visualization, Writing—original draft. X.X.: Data curation, Formal analysis, Investigation, Software, Validation, Visualization, Writing—original draft. J.C.: Data curation, Formal analysis, Investigation, Software, Validation, Visualization, Writing—original draft. H.C.: Data curation, Formal analysis, Investigation, Software, Validation, Visualization, Writing—original draft. H.L.: Data curation, Formal analysis, Investigation, Software, Validation, Visualization, Writing—original draft. All authors have read and agreed to the published version of the manuscript.
Funding
Entrusted R&D service for optimizing operation strategy of Chunsun Energy Storage Power Station of China Resources New Energy (Teng County) Co., Ltd.: 7YQBH0-CPFW-20250500008.
Data Availability Statement
The original contributions presented in the study are included in the article, further inquiries can be directed to the corresponding author.
Conflicts of Interest
The authors declare that this study received funding from China Resources New Energy (Teng County) Co., Ltd. Authors Jiajia Chai, Hanzhong Cui and Haoyuan Li were employed by the China Resources New Energy (Teng County) Co., Ltd. The remaining authors declare that the research was conducted in the absence of any commercial or financial relationships that could be construed as a potential conflict of interest. The funder was not involved in the study design, collection, analysis, interpretation of data, the writing of this article or the decision to submit it for publication.
Abbreviations
| ED | Economic dispatch |
| MRDMGWOA | Multi-region distributed multi-gradient whale optimization algorithm |
| MGWOA | Multi-gradient whale optimization algorithm |
| MOGWO | Multi-objective gray wolf optimizer |
| MOAOS | Multi-objective atomic orbital search |
| MOMFO | Multi-objective moth–flame optimizer |
| MOFA | Multi-objective firefly algorithm |
| MOFDA | Multi-objective flow direction algorithm |
| MGED | Multi-gradient economic dispatch |
| WOA | Whale optimization algorithm |
References
- Yang, H.; Zhang, X.; Chu, Y.; Ma, Y.; Zhang, D.; Guerrero, J.M. Multi-objective based demand response strategy optimization considering differential demand on reliability of power system. Int. J. Electr. Power Energy Syst. 2023, 152, 109202. [Google Scholar] [CrossRef]
- Yin, L.; Liu, R. A normalized deep neural network with self-attention mechanisms based multi-objective multi-verse optimization algorithm for economic dispatch. Appl. Energy 2025, 383, 125414. [Google Scholar] [CrossRef]
- Zhang, Y.; Zhang, X.; Ji, X.; Han, X.; Yang, M. Optimization of integrated energy system considering transmission and distribution network interconnection and energy transmission dynamic characteristics. Int. J. Electr. Power Energy Syst. 2023, 153, 109357. [Google Scholar] [CrossRef]
- Wang, K.; Yang, J.; Zhang, C.; Wen, F.; Lu, G. Joint energy-frequency regulation electricity market design for the transition towards a renewable-rich power system. Int. J. Electr. Power Energy Syst. 2024, 155, 109504. [Google Scholar] [CrossRef]
- Andreev, M.; Bay, Y.; Kievets, A.; Rudnik, V.; Razzhivin, I. An advanced method for improving the reliability of power losses probabilistic characteristics calculation to determine the optimal wind power capacity and placement tasks. Int. J. Electr. Power Energy Syst. 2023, 147, 108846. [Google Scholar] [CrossRef]
- Yu, L.; Li, D.; Li, N. Offline economic dispatch for multi-area power system via hierarchical reinforcement learning. Int. J. Electr. Power Energy Syst. 2023, 152, 109195. [Google Scholar] [CrossRef]
- Sun, M.; Zou, S.; Guo, Y.; Nian, X. Projection-based distributed economic dispatch algorithm considering communication delays under switching topologies. Int. J. Electr. Power Energy Syst. 2023, 152, 109266. [Google Scholar] [CrossRef]
- Zafar, S.; Blavette, A.; Camilleri, G.; Ahmed, H.B.; Agbodjan, J.-J.P. Decentralized optimal management of a large-scale EV fleet: Optimality and computational complexity comparison between an adaptive MAS and MILP. Int. J. Electr. Power Energy Syst. 2023, 147, 108861. [Google Scholar] [CrossRef]
- Shin, H.; Kim, W. Comparison of the centralized and decentralized environmentally constrained economic dispatch methods of coal-fired generators: A case study for South Korea. Energy 2023, 275, 127364. [Google Scholar] [CrossRef]
- Prieto, C.; López-Román, A.; García-Rivero, G.; Bartolí, E.; Cabeza, L.F. Evaluation of cross-contamination in indirect thermal storage system in concentrated solar plants. Renew. Energy 2023, 212, 492–499. [Google Scholar] [CrossRef]
- Mehrjerdi, H.; Hemmati, R.; Mahdavi, S.; Shafie-Khah, M.; Catalão, J.P.S. Multicarrier Microgrid Operation Model Using Stochastic Mixed Integer Linear Programming. IEEE Trans. Ind. Inform. 2022, 18, 4674–4687. [Google Scholar] [CrossRef]
- Liu, M.; Kong, X.; Lian, J.; Wang, J.; Yang, B. Distributionally robust coordinated day-ahead scheduling of Cascade pumped hydro energy storage system and DC transmission. Appl. Energy 2025, 384, 125449. [Google Scholar] [CrossRef]
- Liu, W.; Gao, Y.; You, Y.; Jiang, C.; Hua, T.; Xia, B. Optimizing of selective catalytic reduction urea injection and NOx conversion analysis of diesel engine based on higher-order physical model and sequential quadratic programming algorithm. Energy 2024, 313, 134100. [Google Scholar] [CrossRef]
- Qian, J.; Sun, X.; Zhong, X.; Zeng, J.; Xu, F.; Zhou, T.; Shi, K.; Li, Q. Multi-objective optimization design of the wind-to-heat system blades based on the Particle Swarm Optimization algorithm. Appl. Energy 2024, 355, 122186. [Google Scholar] [CrossRef]
- Dong, H.; Fu, Y.; Jia, Q.; Wen, X. Optimal dispatch of integrated energy microgrid considering hybrid structured electric-thermal energy storage. Renew. Energy 2022, 199, 628–639. [Google Scholar] [CrossRef]
- Qiu, H.; Vinod, A.; Lu, S.; Gooi, H.B.; Pan, G.; Zhang, S.; Veerasamy, V. Decentralized mixed-integer optimization for robust integrated electricity and heat scheduling. Appl. Energy 2023, 350, 121693. [Google Scholar] [CrossRef]
- Zhao, P.; Li, Z.; Bai, X.; Su, J.; Chang, X. Stochastic real-time dispatch considering AGC and electric-gas dynamic interaction: Fine-grained modeling and noniterative decentralized solutions. Appl. Energy 2024, 375, 123976. [Google Scholar] [CrossRef]
- Yavari, M.; Mihankhah, S.; Jozani, S.M. Assessing cap-and-trade regulation’s impact on dual-channel green supply chains under disruption. J. Clean. Prod. 2024, 478, 143836. [Google Scholar] [CrossRef]
- Huang, L.; Sun, W.; Li, Q.; Li, W. Distributed real-time economic dispatch for islanded microgrids with dynamic power demand. Appl. Energy 2023, 342, 121156. [Google Scholar] [CrossRef]
- Chen, Y.; Niu, Y.; Qu, C.; Du, M.; Wang, J. Data-driven-based distributionally robust optimization approach for a virtual power plant considering the responsiveness of electric vehicles and Ladder-type carbon trading. Int. J. Electr. Power Energy Syst. 2024, 157, 109893. [Google Scholar] [CrossRef]
- Zhang, S.; Hu, W.; Du, J.; Cao, X.; Bai, C.; Liu, W.; Wang, D.; Chen, Z. Hierarchical distributionally robust scheduling strategy for distributed energy systems in the energy-sharing environment. Appl. Energy 2025, 388, 125639. [Google Scholar] [CrossRef]
- Wang, R.; Li, Q.; Liu, H. Distributed Economic Dispatch Under Random Time-Varying Digraph. IEEE Trans. Ind. Inform. 2024, 20, 11139–11148. [Google Scholar] [CrossRef]
- Yin, L.; Cai, Z. Multimodal multi-objective hierarchical distributed consensus method for multimodal multi-objective economic dispatch of hierarchical distributed power systems. Energy 2024, 295, 130996. [Google Scholar] [CrossRef]
- Pan, Z.; Wang, L.; Wang, J.; Zhang, Q. A Bi-Learning Evolutionary Algorithm for Transportation-Constrained and Distributed Energy-Efficient Flexible Scheduling. IEEE Trans. Evol. Comput. 2025, 29, 232–246. [Google Scholar] [CrossRef]
- Chen, G.; Yang, Q. An ADMM-Based Distributed Algorithm for Economic Dispatch in Islanded Microgrids. IEEE Trans. Ind. Inform. 2018, 14, 3892–3903. [Google Scholar] [CrossRef]
- Yan, X.; Gao, C.; Meng, J.; Abbes, D. An analytical target cascading method-based two-step distributed optimization strategy for energy sharing in a virtual power plant. Renew. Energy 2024, 222, 119917. [Google Scholar] [CrossRef]
- Tang, X.; Wang, J.; Zhang, X. Optimal combination weight interval-valued carbon price forecasting model based on adaptive decomposition method. J. Clean. Prod. 2023, 427, 139232. [Google Scholar] [CrossRef]
- Dalimi-Asl, A.; Javadi, S.; Ahmarinejad, A.; Rabbanifar, P. Optimal stochastic-probability management of resources and energy storage in energy hub considering demand response programs and uncertainties. Sustain. Cities Soc. 2023, 99, 104886. [Google Scholar] [CrossRef]
- Yin, L.; Cai, Z. Multimodal hierarchical distributed multi-objective moth intelligence algorithm for economic dispatch of power systems. J. Clean. Prod. 2024, 434, 140130. [Google Scholar] [CrossRef]
- Li, L.-L.; Fan, X.-D.; Wu, K.-J.; Sethanan, K.; Tseng, M.-L. Multi-objective distributed generation hierarchical optimal planning in distribution network: Improved beluga whale optimization algorithm. Expert Syst. Appl. 2024, 237, 121406. [Google Scholar] [CrossRef]
- Zhang, L.; He, Y.; Hatziargyriou, N.D.; Wu, H.; Han, P. An optimization scheduling strategy for hydrogen-based integrated energy systems using multi-agent deep reinforcement learning. Energy Convers. Manag. 2025, 326, 119483. [Google Scholar] [CrossRef]
- Yin, L.; Sun, Z. Distributed multi-objective grey wolf optimizer for distributed multi-objective economic dispatch of multi-area interconnected power systems. Appl. Soft Comput. 2022, 117, 108345. [Google Scholar] [CrossRef]
- Yin, L.; Ding, W. Dual deep neural networks-accelerated non-dominated sorting moth flame optimizer for distributed multi-objective economic dispatch. Expert Syst. Appl. 2025, 259, 125259. [Google Scholar] [CrossRef]
- Ali, F.; Sarwar, A.; Bakhsh, F.I.; Ahmad, S.; Shah, A.A.; Ahmed, H. Parameter extraction of photovoltaic models using atomic orbital search algorithm on a decent basis for novel accurate RMSE calculation. Energy Convers. Manag. 2023, 277, 116613. [Google Scholar] [CrossRef]
- Shaikh, A.; Tarafdar, A.; Majumder, P.; Bera, U.K.; Deb, M. Synergistic enhancement of performance and emission profiles in a single cylinder CI-engine: A fuzzy-tuned multi-objective whale optimization algorithm for diesel-hydrogen dual fuel augmentation. Energy Convers. Manag. 2024, 317, 118865. [Google Scholar] [CrossRef]
- Petrović, M.; Jokić, A.; Miljković, Z.; Kulesza, Z. Multi-objective scheduling of a single mobile robot based on the grey wolf optimization algorithm. Appl. Soft Comput. 2022, 131, 109784. [Google Scholar] [CrossRef]
- Zhu, Q.; Lin, Q.; Chen, W.; Wong, K.-C.; Coello Coello, C.A.; Li, J.; Chen, J.; Zhang, J. An External Archive-Guided Multiobjective Particle Swarm Optimization Algorithm. IEEE Trans. Cybern. 2017, 47, 2794–2808. [Google Scholar] [CrossRef]
- Savsani, V.; Tawhid, M.A. Non-dominated sorting moth flame optimization (NS-MFO) for multi-objective problems. Eng. Appl. Artif. Intell. 2017, 63, 20–32. [Google Scholar] [CrossRef]
- Chakraborty, A.; Ray, S. Multi-objective energy management using a smart charging technique of a microgrid with the charging impact of plug-in hybrid electric vehicles. Sustain. Cities Soc. 2024, 117, 105923. [Google Scholar] [CrossRef]
- Kaur, G.; Arora, S. Chaotic whale optimization algorithm. J. Comput. Des. Eng. 2018, 5, 275–284. [Google Scholar] [CrossRef]
- Deng, L.; Liu, S. Deficiencies of the whale optimization algorithm and its validation method. Expert Syst. Appl. 2024, 237, 121544. [Google Scholar] [CrossRef]
- Du, P.; Ye, Y.; Wu, H.; Wang, J. Study on deterministic and interval forecasting of electricity load based on multi-objective whale optimization algorithm and transformer model. Expert Syst. Appl. 2025, 268, 126361. [Google Scholar] [CrossRef]
- IEEE Circuits and Systems Society Information. IEEE Trans. Circuits Syst. Video Technol. 2024, 34, C3. [CrossRef]
- Peña, I.; Martinez-Anido, C.B.; Hodge, B.-M. An Extended IEEE 118-Bus Test System with High Renewable Penetration. IEEE Trans. Power Syst. 2018, 33, 281–289. [Google Scholar] [CrossRef]
Disclaimer/Publisher’s Note: The statements, opinions and data contained in all publications are solely those of the individual author(s) and contributor(s) and not of MDPI and/or the editor(s). MDPI and/or the editor(s) disclaim responsibility for any injury to people or property resulting from any ideas, methods, instructions or products referred to in the content. |
© 2025 by the authors. Licensee MDPI, Basel, Switzerland. This article is an open access article distributed under the terms and conditions of the Creative Commons Attribution (CC BY) license (https://creativecommons.org/licenses/by/4.0/).

