1. Introduction
In medium and low-voltage distribution systems, integrating large amounts of green energy can lead to significant voltage fluctuations, three-phase imbalance issues, and reverse power flow, all of which increase the complexity of system operation. Moreover, since many renewable energy sources are fed into the distribution system from the end of the feeders when a fault occurs on a feeder, the short-circuit current is supplied by the utility and various renewable energy plants within the system [
1,
2]. These fault currents may flow opposite to the short-circuit current provided by the utility, causing misjudgment in the existing protective relays or Feeder Terminal Units (FTUs). This results in the failure of traditional protection coordination mechanisms, making it challenging to identify fault locations and isolate the faulted areas accurately [
3].
The Supervisor Control and Data Acquisition (SCADA) system plays a critical monitoring role and is the core of the automation monitoring system. It provides real-time monitoring of various substation equipment, including bus voltage, line current, line active/reactive power flow, switch status, remote control switches, and the operational status of essential equipment such as substation transformers and circuit breakers [
3]. This information assists the on-duty operator in understanding the system status and enables them to take immediate control or emergency response actions when necessary. The current SCADA system interface is relatively basic, making it difficult for dispatch personnel to intuitively understand the geographical location of feeders and equipment from the system display device [
4]. Since power equipment and feeders can extend over tens or even hundreds of meters, the power system operator needs to consider geographical locations to grasp the power information detected by SCADA accurately. Geographic Information Systems (GISs) provide the optimal solution for managing the geographical information of transmission and distribution equipment. The GIS’s ability to combine spatial coordinates with equipment data is highly beneficial for operating and controlling distribution systems [
5]. Integrating GISs with SCADA in distribution systems, various equipment, and customer-related geographic information can be combined for design and planning purposes to enhance design efficiency significantly [
6,
7,
8,
9,
10]. The application of GIS technology in the electric power industry has proven valuable for asset management, outage management, and spatial analysis of electrical infrastructure. Rezaee et al. [
11] emphasized the role of GISs in distribution networks to enhance utilities’ spatial awareness and operational efficiency. Similarly, Datta and Mohanty [
12] demonstrated how integrating enterprise GISs into India’s smart grid framework improved system visualization and responsiveness. These studies affirm the relevance of GIS-based solutions in modernizing distribution network management.
Building upon these foundational works, a Distributed Network GIS platform with protective coordination functionality (DNGIS-PC) was developed and proposed in this paper, utilizing the existing distribution system database and the ArcGIS platform built by the Esri company. Esri is the global market leader in GIS software, location intelligence, and mapping. Since 1969, Esri has supported customers with geographic science and geospatial analytics. ArcGIS is a comprehensive geospatial platform for professionals and organizations. It is the leading GIS technology, which integrates and connects data through the context of geography. It provides world-leading capabilities for creating, managing, analyzing, mapping, and sharing all data types. In this work, the ArcGIS Enterprise 11.3 version platform connects to the PostgreSQL spatial database previously established by the power utility, retrieving the stored distribution system data such as power feeders, transformers, distributed generators (DGs), and relevant electrical parameters and spatial coordinates. The DNGIS-PC can generate model files for all feeder components through the connectivity analysis of each piece of equipment. These model files can be used directly with the power system analysis software, Open-Source Distribution System Simulator (OpenDSS), developed by EPRI, to perform load flow analysis and various fault current analyses for the distribution network. Users can choose the analysis function to conduct and display the load or fault current analysis results on the GIS platform or the feeder single-line diagram.
The DNGIS-PC platform proposed in this paper includes a web-based graphical interface with protection coordination design and simulation functions. Users can perform relay coordination analysis for selected feeders under pre-fault and post-fault conditions. This feature allows the visualization of Time Coordination Characteristics (TCCs) curves for overcurrent relays, FTUs, and power fuses on the distribution system. By leveraging interactive tools such as the Crosshair and Time Difference functions, users can measure the Coordination Time Interval (CTI) between protective devices directly on the interface, thus determining whether the coordination requirements are met.
The DNGIS-PC integrates SCADA data and a GIS spatial database to establish a graphical power monitoring and management platform. Furthermore, it incorporates an API-based automated optimization algorithm that adjusts relay parameters—such as Time Multiplier Settings (TMSs) and Pickup Current Settings (PCSs)—to restore protection coordination when miscoordination is detected. These features bridge the gap between offline protection design and practical application, making the platform highly applicable to smart grid operations. Compared with existing studies, such as Liu et al. [
13], who proposed fault ride-through control strategies using fault current limiters (FCLs) in LCC-type DC transmission systems, the DNGIS-PC targets medium-voltage AC distribution systems and provides a software-driven solution that combines simulation, optimization, and spatial analysis. In addition, prior research on relay coordination in DG-integrated systems—such as linear programming optimization [
14] or directional relay strategies in microgrids [
15,
16]—mainly focused on algorithmic simulations without full integration of real-time data and spatial platforms. In contrast, the DNGIS-PC offers a comprehensive and interactive environment combining fault current analysis, protection coordination, GIS visualization, and optimization functionalities, enabling real-world applicability and planning support for power utilities. The DNGIS-PC platform integrates spatial GIS data and fuses it with real-time SCADA information and analytical tools such as load flow analysis, fault current analysis, and protection coordination evaluation, offering a more comprehensive and operationally sound system for grid operators.
2. Hardware, Software, and Network Architecture of the DNGIS-PC
2.1. Hardware and Network Architecture
This paper establishes a DNGIS-PC system based on ArcGIS Enterprise 11.3 version with the hardware architecture shown in
Figure 1. The authors utilize the existing spatial database and distribution monitoring system database stored on the power company’s server. After converting and integrating various data formats, the GIS platform of DNGIS-PC is constructed using ArcGIS Enterprise software. The graphical information of the distribution system (such as power equipment parameters, feeder topology distribution, etc.) is published as map services, allowing users, including system operators and on-site maintenance personnel, to view this data via a web interface on desktop computers or mobile devices. In the planning outlined in this paper, the MySQL Database within the distribution monitoring system will continue to use the original data format of the power company. However, the data in the existing PostgreSQL spatial database will undergo preprocessing before software development to accommodate the data analysis needs.
Additionally, the API functionality developed in this paper is hosted on the API server, which is stored on the same server as the ArcGIS Server. The API and ArcGIS Servers are primarily responsible for building the GIS website and providing map services through the GIS software. On the user interface client side (i.e., GIS website users), users connect to the API and ArcGIS Servers via the network to access the GIS webpage and related functions. The server then sends the output results displayed on the map interface, showing the relevant queries and analysis results.
2.2. Software Development Architecture
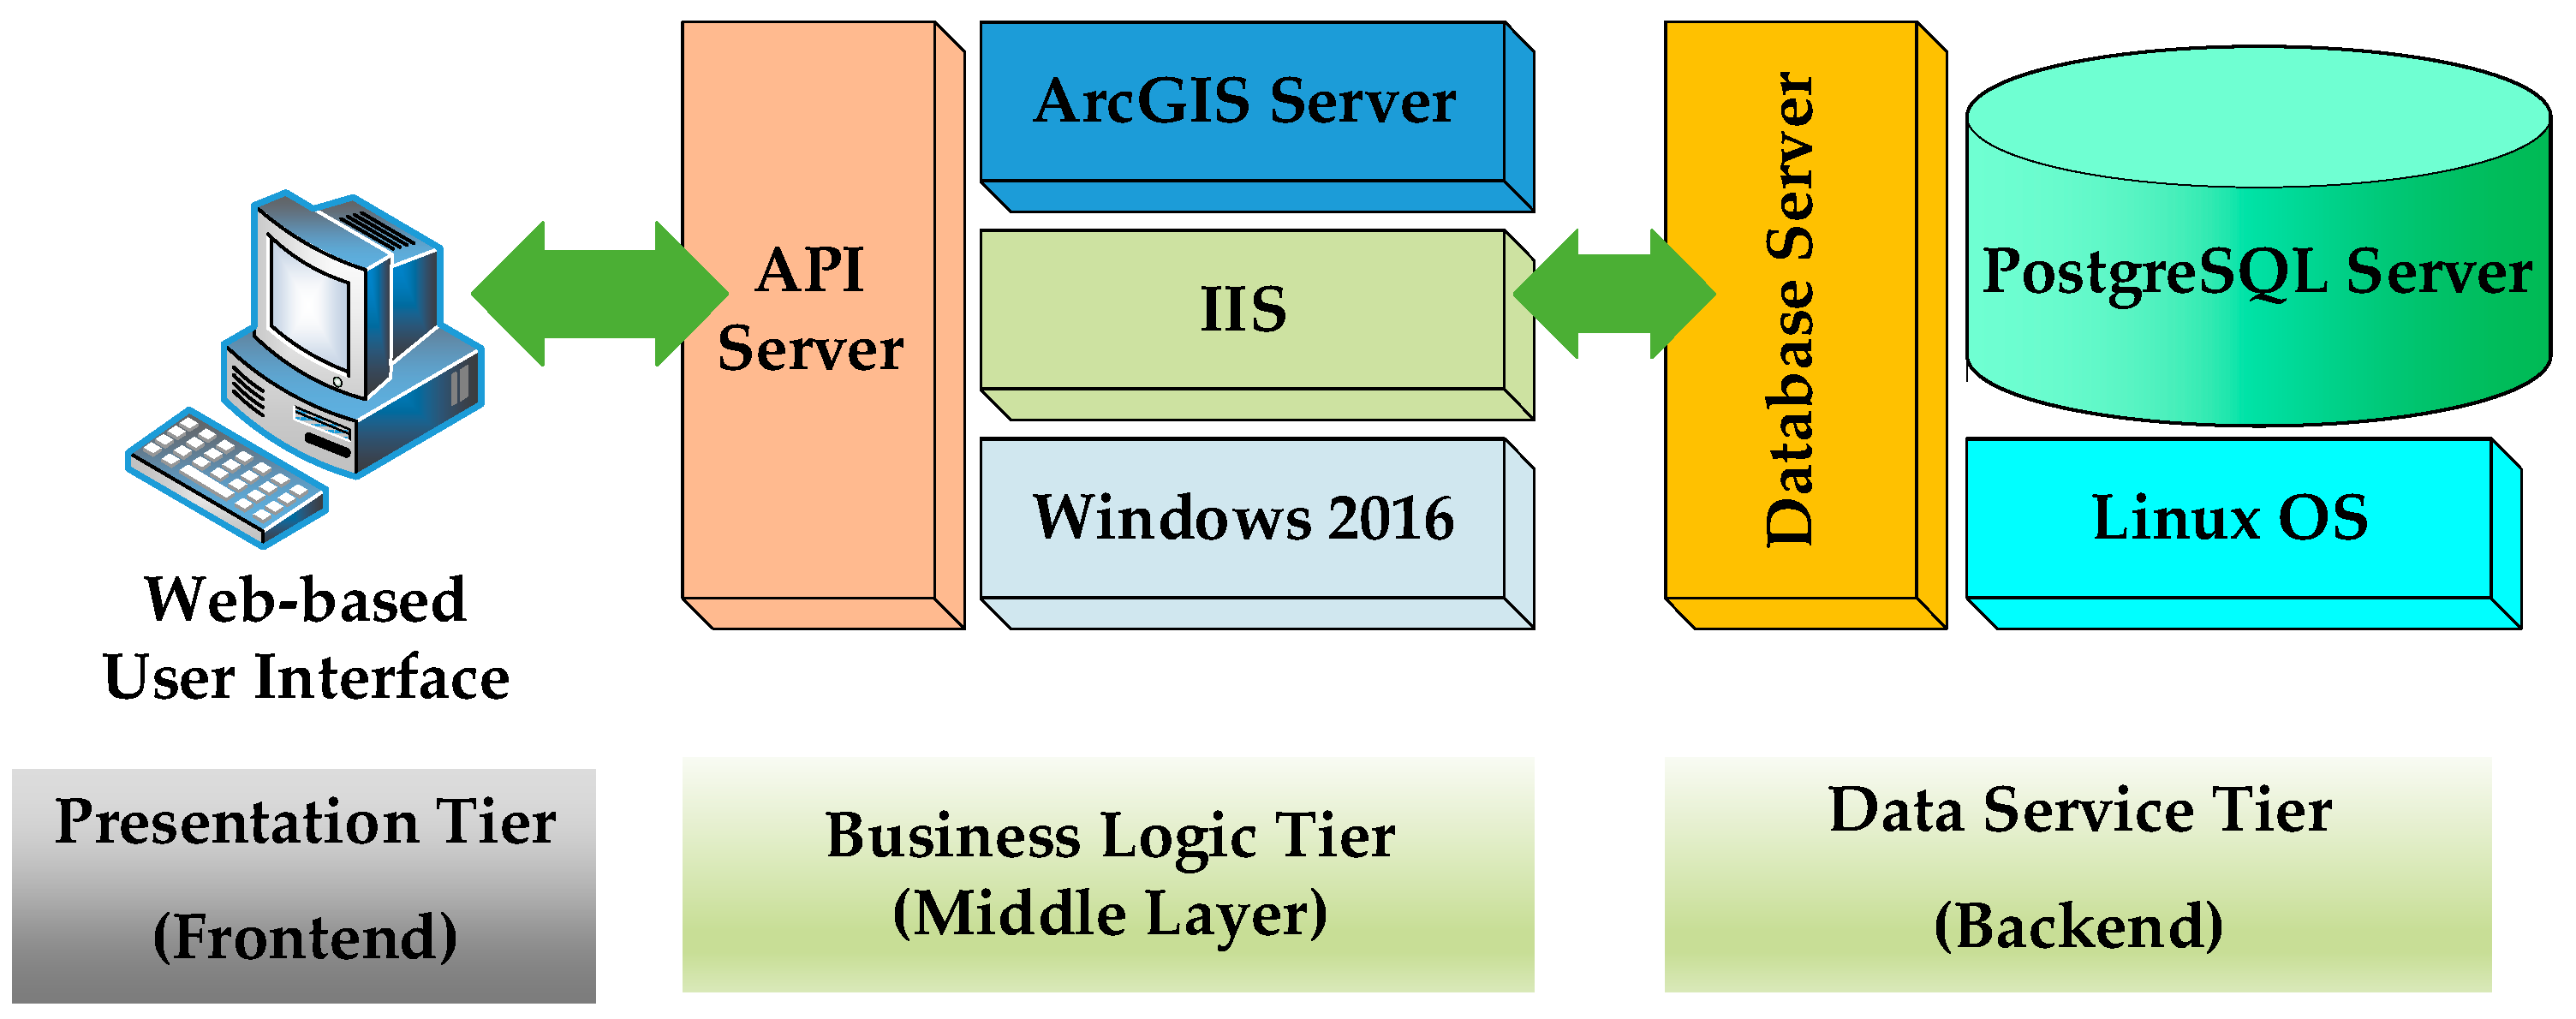
The DNGIS-PC analysis integration platform built in this paper adopts a three-tier architecture (3-Tier) for development, consisting of the Presentation Tier (Front-end), Business Logic Tier (Middle Layer), and Data Service Tier (Back-end). The system interface is developed in a web-based mode, as shown in
Figure 2. The back-end PostgreSQL database stores relevant map information and attribute data required by the application system. The middle layer consists of ArcGIS Server, running on Windows 2022 Server, which provides map services (websites) over the internet. The front end is a web browser on the user’s PC, which queries and manages relevant geographic information. The platform system developed in this paper utilizes ArcGIS API for JavaScript and HTML5 and Microsoft NET Framework 4.7.2 development technologies. The NET Framework 4.7.2 provides enhanced Service-Oriented Architecture (SOA) foundational technology, which provides an interactive and dynamic user interface, a more robust and secure network communication framework, and a business process engine for enterprise workflows. The NET framework is a programming platform that operates using a system virtual machine based on the Common Language Runtime (CLR) and supports multiple languages (such as C#, VB.NET, C++, Python, etc.). It features advanced object-oriented functionality, allowing for the rapid creation and deployment of Windows and Web applications, offering powerful data access capabilities, and facilitating cross-platform integration.
The DNGIS-PC analysis integration platform stores raw data retrieved from automated equipment within the distribution monitoring system in the SCADA MySQL Database. These raw data consist of real-time system dynamic data stored in the historical database. The complete operational workflow of the DNGIS-PC analysis integration platform, including database integration, OpenDSS-based analysis, and protection coordination modules, is illustrated in
Figure 3. The platform integrates multiple databases, simulation tools, and web services to support comprehensive analysis and visualization for distribution system operation and protection coordination.
As shown in
Figure 3, the platform periodically extracts real-time monitoring data from the SCADA MySQL database, including system voltages, currents, breaker status, and abnormal event logs. This data is preprocessed and stored in the DNGIS-PC database for use in analysis modules. Simultaneously, spatial information such as feeder topology, transformer location, distributed generator settings, and connectivity data is retrieved from the PostgreSQL spatial database. Based on the extracted data, the API server generates a system model file conforming to the OpenDSS format. This model file includes complete feeder configurations, load profiles, and protection device parameters, and is used to conduct three-phase load flow analysis and fault current simulations via OpenDSS.
Once the simulations are completed, the results—such as voltage levels, fault current magnitudes, and relay operation conditions—are returned to the DNGIS-PC platform. These results are then visualized on both the GIS interface and the single-line diagram through the ArcGIS Server and the web-based client interface.
In addition to fault analysis, the DNGIS-PC platform supports protection coordination simulation by generating TCC curves for protection devices, including overcurrent relays, FTUs, and power fuses. This function is implemented by using Python-based APIs that compute relay operating times based on IEEE Std 242-2001 [
17] equations. Users can interactively select fault locations, view the resulting fault currents, and verify whether the CTI between the upstream and downstream devices satisfies coordination requirements. This end-to-end workflow—from data acquisition to result visualization—not only facilitates accurate fault and coordination analysis but also enhances decision-making in distribution network operation and planning, especially in the context of increasing renewable energy penetration.
3. Relay Setting Theory and Coordination Evaluation
The configuration of CRs plays a crucial role in ensuring that circuit breakers can promptly disconnect the power supply under overload or short-circuit conditions. In the event of a short circuit, the system experiences a surge of fault current that greatly exceeds normal operating levels. To preserve the stability of the distribution system, OCRs must respond swiftly and accurately—isolating the faulted section, protecting downstream equipment, and minimizing disturbances to unaffected areas. An OCR’s time–current characteristic is primarily defined by two key settings: TMSs and PCSs. These parameters jointly determine how quickly the relay reacts to a fault current. According to the IEEE Std 242-2001 [
17], the mathematical expression of this characteristic curve is provided in Equation (1). The pick up current
for a relay is determined by multiplying the current transformer (CT) ratio by the relay’s PCS value, as expressed in Equation (2).
where
—Relay operation time.
—Time multiplier settings.
—Pick up current of the relay.
—Fault current passing through the relay.
—CT ratio choosing of the corresponding relay.
—Pick-up current setting.
—Characteristic parameters of the standard time–current curve.
Standard time–current characteristics are typically categorized into several types, including short-time, long-time, inverse, very inverse, and extremely inverse curves. Each type is defined by specific characteristic parameters that determine its response behavior under varying fault conditions. These parameters are summarized in
Table 1.
Achieving proper relay coordination hinges on maintaining an adequate operating time margin, the CTI, between the primary relay and its corresponding backup. Coordination is acceptable when the CTI between all primary–backup relay pairs in the system falls within a predefined tolerance range. Industry standards and previous studies commonly adopt a CTI setting between 0.2 and 0.5 s [
18,
19]. The method for calculating CTI is as follows:
where
—Coordination interval (s).
—Operation time of backup relay (s).
—Operation time of primary relay (s).
In the DNGIS-PC platform, the protection coordination analysis module supports planned coordination assessments under normal system conditions and post-fault coordination simulations based on the results of the fault current analysis. Users can specify the fault locations and compute the corresponding fault currents, enabling more accurate and location-specific protection coordination evaluations. Furthermore, the optimal protection coordination algorithm developed by the authors in previous works [
18,
19] has been implemented in Python 3.9.12 ver. and integrated into the platform as a coordination correction module. This algorithm dynamically adjusts relay settings (e.g., TMSs and PCSs) to ensure that coordination criteria, such as the minimum CTI, are satisfied across protection devices.
This feature is particularly advantageous in distribution networks with high penetration of renewable energy and distributed generation, where power flow and fault current contributions may vary significantly depending on the generation dispatch and system topology. The proposed coordination analysis function enhances the reliability and selectivity of protection schemes under these complex conditions.
4. DNGIS-PC Demonstration
In this chapter, the authors will demonstrate the functionalities of the proposed DNGIS-PC platform, explaining the various features built into the DNGIS-PC platform.
4.1. ArcGIS Platform Development of a DNGIS-PC
Before building the DNGIS-PC system, the preliminary task involved reading the equipment data from the power company’s original PostgreSQL spatial database. First, the graphical symbols used by the power company need to be replicated in the ArcGIS platform so that the symbols in ArcGIS match those familiar to the power company staff. These symbols allow users to interpret the map data based on their experience without adapting to new system symbols.
Table 2 lists several graphical symbols commonly used by the power utility.
Figure 4 shows the system interface of the DNGIS-PC. To help power system dispatchers clearly distinguish between different feeders, the system uses distinct colors to represent feeders with different identifiers. Users can further use the mouse to zoom in on the GIS map in the DNGIS-PC interface. After zooming in, they can view the current direction obtained through load flow analysis for each feeder, as shown in
Figure 5, where the DNGIS-PC system displays the current direction using arrows.
The DNGIS-PC references the records from the PostgreSQL spatial database and cross-references them with the symbol list numbers provided by the power company. All equipment symbols are incorporated into the ArcGIS project file.
Figure 6 shows the result of symbol creation for one of the substations in the system map.
Figure 7 and
Figure 8 show the interface when a power dispatcher operates the DNGIS-PC platform. By double-clicking on the equipment symbols in the GIS map, the system displays the property information of the selected equipment. This information includes the facility ID, voltage level, capacity, and other relevant details.
Figure 7 shows the property list for a circuit breaker, while
Figure 8 shows the property list for the main transformer in the substation.
Figure 9,
Figure 10 and
Figure 11 show the property query interfaces for a secondary substation, a line switch, and a capacitor, respectively. The displayed property data includes the facility ID, voltage level, and the X and Y coordinates of the facility.
Figure 9 presents a more comprehensive enlarged view of the secondary substation, featuring three sets of three-phase transformers and several feeder circuit breakers. The switch connection status, capacity, and voltage level are fundamental properties of the tie-line switch observed in
Figure 10.
Figure 11 demonstrates the property list of the capacitor bank. Each type of equipment recorded in the database has its own specific attribute data, and the attributes differ between various types of equipment.
4.2. Single-Line Platform Development of a DNGIS-PC
This section demonstrates the correlation between spatial information and connectivity data of various equipment in the PostgreSQL database through the DNGIS-PC platform. The DNGIS-PC platform allows for the successful overlay of power feeders, various types of power equipment, and related power facility layers on the GIS map. The platform developed in this paper features the ability to switch between GISs and single-line diagrams for power systems. Power dispatchers can click on any equipment or point on a feeder in the DNGIS-PC interface and choose to switch to the single-line diagram view. The API program developed in this thesis will open the single-line diagram display and vice versa.
Figure 12 shows the screen after switching from the GIS platform to the single-line diagram, displaying the single-line diagram of the “XA” substation, which includes two main transformers, TR750 and TR760. The white bars labeled M1 and M3 at the bottom of
Figure 11 represent icons for extending the single-line diagram display. Clicking on these icons will switch the screen to the view shown in
Figure 13. According to
Figure 13, the feeder after TR750 connects to five test feeders, XX21, XX22, XX23, XX24, and XX25, through “#1Bus”.
4.3. System Model File Generation and Layout
The DNGIS platform established in this thesis already has the function of exporting the selected feeder model file. This function must integrate the connectivity of the feeder and various equipment and the relevant data of distributed power sources, load into a file format required by OpenDSS, and set the characteristic parameters of various equipment components.
Figure 14 shows the OpenDSS code of the main program format generated by the DNGIS-PC platform, which also performs the three-phase short-circuit fault current analysis at the selected point.
Figure 15 and
Figure 16 are, respectively, the code segment of the file of the feeder connectivity and the transformer connectivity linked to the same feeder, XX21, as shown in
Figure 14. The DNGIS platform will access these two text files while executing the “XX_XX21_S.dss” file, in
Figure 14, on the OpenDSS.
4.4. Fault Current Analysis Platform
The DNGIS-PC platform has developed a fault current analysis application feature, allowing power system operators to set fault points on the GIS interface or single-line diagram. As shown in
Figure 17, the selected fault point is the switch DD99-F01, located on a feeder branch line, where a T-phase ground fault occurred before the switch (indicated by the red lightning symbol in the figure). As mentioned in the previous section, after generating the power system model file, the API will call OpenDSS to perform a fault current analysis. The analysis results will also be displayed on the screen. In
Figure 17, the R-phase and S-phase voltages at the fault point are 1.17 pu and 1.1735 pu, respectively, while the T-phase voltage is zero pu. The fault current is displayed on the screen, showing that both the R-phase and S-phase currents are 0 A, while the T-phase fault current reaches 1802 A.
Figure 18 shows the fault analysis results for the upstream switch HC68-S01 on the main feeder line of switch DD99-F01. The three-phase voltage values obtained from the fault analysis are displayed below each switch. Above each pair of switches, the three-phase fault currents and the neutral line current are presented.
4.5. Auxiliary Functions of Protection Coordination Design
The proposed DNGIS-PC platform directly accesses feeder-related information from various databases maintained by the power utility. This includes critical parameters such as the installation locations and settings of protective relays (e.g., tap and lever positions), current transformer (CT) ratios, FTU operating parameters, and selected ratings of power fuses. These data are essential for accurate offline protection coordination design.
Figure 19 illustrates an example of the TCC curves generated under non-fault conditions using the DNGIS-PC platform. The platform visualizes the coordination among multiple protection devices along a feeder, including an MCB relay (XA_1), FCB relay (XA21), FTUs (GE35-S01 and EB98-S01), and a power fuse (FC99-F01). This visualization helps system engineers evaluate the selectivity and coordination margins between upstream and downstream devices before a fault occurs.
In the example illustrated in
Figure 19, the protection devices are arranged sequentially along the feeder from the upstream to the downstream end in the following order: XA_1, XA21, GE35-S01, EB98-S01, and FC99-F01. Notably, the two Feeder Terminal Units (FTUs), GE35-S01 and EB98-S01, are configured with identical operating parameters. As a result, the TCC curves are completely overlapped in the diagram.
The DNGIS-PC platform includes a user-selectable feature called “Grid Line”, which can be toggled on or off as needed. When this function is enabled, the TCC diagram interface will display a logarithmic grid, as shown in
Figure 20. In this mode, both the current axis (X-axis) and the operating time axis (Y-axis) are overlaid with log-scale grid lines, allowing users to more easily interpret time–current relationships and evaluate the coordination intervals during protection design.
Additionally,
Figure 21 demonstrates the “Crosshair” function available on the DNGIS-PC platform. When this feature is activated, users can click on any point along a selected TCC curve to instantly display the corresponding fault current and the operating time of the associated protection device. This interactive tool greatly enhances the usability of the platform by enabling precise reading of coordination points and assisting in fine-tuning protection settings.
Figure 22 presents the “Time Difference” function implemented in the DNGIS-PC platform. When this feature is activated, users can select any two TCC curves on the diagram. The system then automatically locks onto the corresponding points on both curves at the same fault current level and calculates the difference in operating times between the two protection relays. This calculated value represents the CTI between the two devices. This function plays a critical role in protection coordination design, as it allows engineers to verify whether the CTI between primary and backup protection relays meets the required coordination margin. It also helps detect potential mis-operations or out-of-sequence tripping, thereby ensuring that selectivity and reliability are preserved in the final protection scheme.
4.6. Protection Coordination Simulation Platform
The DNGIS-PC platform proposed in this paper is equipped with the functionality to plot TCC curves for all or selected protection devices on a single feeder, using relevant data from the system database. Additionally, it enables the simulation and analysis of protection coordination timing.
Figure 19 illustrates the TCC drawn under non-fault conditions for the protection coordination function of the DNGIS-PC platform, showing the TCC curves for the MCB Relay, FCB Relay, FTU (EB98-S01), FTU (GE35-S01), and power fuse (FC99-F01) for the XA21 feeder. To evaluate the optimal protection coordination functionality of the DNGIS-PC platform, a test scenario was designed and is illustrated in
Figure 23.
In this case, the operating parameters of the two FTUs, GE35-S01 and EB98-S01, were deliberately adjusted to create a coordination failure. As shown in the figure, the TCC curve of EB98-S01 overlaps with that of the downstream power fuse, FC99-F01. Although the power fuse and EB98-S01 do not have a direct communication link for relay coordination, this overlap indicates a violation of the required tripping sequence. Specifically, the backup relay (EB98-S01) may operate before or simultaneously with the fuse, thereby compromising the selectivity of the protection scheme.
As highlighted in the top-right corner of
Figure 23, an “X” symbol is shown, indicating that the DNGIS-PC platform has identified a coordination violation between protection relays along Feeder XA21. This alert signals that a re-coordination process is necessary.
To address this issue, users can enable the Optimal Protection Coordination function. The DNGIS-PC platform will then execute its coordination suggestion algorithm, as illustrated in
Figure 3, by launching the Protection Coordination Optimization API. This API performs parameter tuning—such as adjusting the TMSs and PCSs—to determine suitable values for restoring proper coordination between relays.
Figure 24 displays the optimized TCC curves generated after the re-coordination process. In the top-right corner of the figure, a “✔” symbol is shown, indicating that the updated relay settings now satisfy the protection coordination requirements. Specifically, the time differences between each pair of curves meet the desired CTI range of 0.2 to 0.5 s, ensuring the selective and sequential operation of protective devices.
4.7. Issues of Practical Implementation and Cybersecurity Considerations
During the development and testing of the DNGIS-PC platform, several practical challenges emerged, particularly related to the quality and consistency of the source data from utility databases. One major issue was the inconsistency in feeder connectivity records, where topological relationships between nodes and branches were either incomplete or incorrect. Additionally, the registered relay parameters—including TMS values, PCS values, and CT ratios—were often missing or inaccurately recorded.
These data quality issues posed challenges to automated modeling and the accurate simulation of relay behavior. As a result, data cleansing and validation routines were incorporated into the system’s back-end to detect and correct such anomalies. This experience highlights the importance of establishing robust data governance and synchronization mechanisms when deploying smart grid analytics platforms in real-world environments.
While the DNGIS-PC platform presents a promising tool for protection coordination analysis, its current implementation remains in the developmental stage. As of July 2025, the system is scheduled to undergo field testing at a utility company; however, this testing will be conducted in a controlled environment, connected only to a mirror database server for offline planning and simulation purposes. Regarding cybersecurity, several preventive measures have been considered to mitigate common threats. The GIS server hosting the platform is equipped with anti-malware software and is subject to regular vulnerability assessments. Specific scans and hardening measures have been applied to protect the database systems against SQL injection and Cross-Site Scripting (XSS) attacks. These basic security protections aim to prevent unauthorized access and maintain data integrity during testing and evaluation.
5. Conclusions
This study presents the development of the DNGIS-PC platform, an integrated system that combines GISs with SCADA for distribution network protection coordination. The platform is designed to address the increasing complexity of distribution systems due to the widespread integration of renewable energy resources, which creates new challenges for protection coordination analysis and management.
DNGIS-PC integrates real-time SCADA monitoring data, spatial feeder topology, and device setting information into a centralized interface for protection analysis. It supports various functions, including load flow analysis, fault current estimation, and the visualization of TCC curves. Moreover, the platform includes interactive tools—such as the Grid Line, Crosshair, and Time Difference functions—that assist engineers in intuitively analyzing relay behavior and evaluating coordination performance.
A notable innovation is the incorporation of an automated protection coordination optimization API, which can detect miscoordination issues and adjust relay parameters. In the case study on the actual feeder, this function successfully restored protection selectivity and adjusted CTI values to meet the required range of 0.2 to 0.5 s, demonstrating the platform’s practical utility for both planning and operational use.
During implementation, several practical challenges were encountered, particularly concerning data quality in utility databases. These included incorrect feeder connectivity, missing or inconsistent relay configuration data, and non-standardized naming conventions. To address this, data validation and correction mechanisms were integrated into the system to ensure accurate model generation and simulation. These experiences underscore the importance of clean, well-maintained datasets for the successful deployment of smart grid platforms.
In terms of cybersecurity and system compatibility, the current platform is undergoing offline field testing on a mirror server as of July 2025. Although not yet connected to real-time SCADA systems, initial safeguards have been implemented, including anti-malware protection, periodic vulnerability scans, and database hardening against SQL injection and Cross-Site Scripting (XSS) threats. Future versions will further address compliance with utility-grade standards such as IEC 62443 and expand protocol support to enhance interoperability with industry-standard systems such as SCADA and GISs.
Overall, the DNGIS-PC platform provides a powerful decision-support tool for utility engineers engaged in protection design and fault simulation. Its open architecture, real data integration, and optimization capabilities offer a scalable foundation for the evolving smart grid landscape. Future work will focus on enhancing the optimization engine, incorporating AI-based analytics, and validating the platform under more diverse system topologies and real-time environments.
Author Contributions
J.-L.J. contributed to the material tools, conducted the experiments in simulations, and assisted in the project’s performance. T.-S.Z. was responsible for the overall system process planning and coordinated the software engineers in the program development process. He also modeled the protection coordination theory and analyzed and verified data. M.-T.T. generalized novel algorithms and project management and prepared the manuscript as the corresponding author. All authors have read and agreed to the published version of the manuscript.
Funding
This paper presents the research results of project contract numbers NL1130113 and NL1140120 conducted by the National Atomic Research Institute, Taiwan, R.O.C., in 2024 and 2025, respectively.
Data Availability Statement
The original contributions presented in this study are included in the article. Further inquiries can be directed to the corresponding author.
Acknowledgments
The DNGID-PC system was developed with the assistance of a technical team led by Vice G. M. De-Ruei Syu and D. M. Chung-Ming Tsai from the Kaohsiung branch of GeoIntelligence System Inc. in Taiwan, to whom we express our sincere gratitude.
Conflicts of Interest
The authors declare no conflicts of interest. All the authors were involved in exploring the system validation and results, and were permitted the benefits of the published document. All authors have read and agreed to the published version of the manuscript.
References
- Wang, D. Research and Development of Intelligent Decision Support System for Distribution Network Planning Based on GIS. In Proceedings of the 2023 IEEE 3rd International Conference on Data Science and Computer Application (ICDSCA), Dalian, China, 27–29 October 2023; pp. 786–791. [Google Scholar] [CrossRef]
- Bunme, P.; Shiota, A.; Mitani, Y.; Watanabe, M. Solar Power Assessment Using GIS for Residential Distribution Systems. In Proceedings of the 2022 IEEE International Conference on Environment and Electrical Engineering and IEEE Industrial and Commercial Power Systems Europe (EEEIC/I&CPS Europe), Prague, Czech Republic, 28 June–1 July 2022; pp. 1–6. [Google Scholar] [CrossRef]
- Albasri, F.A.; Al Zaki, Z.; Al Nainoon, E.; Alawi, H.; Ayyad, R. A Fault Location System Using GIS and Smart Meters for the LV Distribution System. In Proceedings of the 2019 International Conference on Innovation and Intelligence for Informatics, Computing, and Technologies (3ICT), Sakhier, Bahrain, 22–23 September 2019; pp. 1–6. [Google Scholar] [CrossRef]
- Song, Y.; Zhu, K. Web-Based Monitoring Alarm System for Low-Voltage Distribution Network. In Proceedings of the 2nd International Conference on Cloud Computing, Big Data Application and Software Engineering (CBASE), Chengdu, China, 17–19 November 2023; pp. 295–298. [Google Scholar] [CrossRef]
- Li, R.; Sun, T.; Li, G. Research on Three-Dimensional Water Resources Information System Based on ArcGIS. In Proceedings of the 2011 International Symposium on Water Resource and Environmental Protection (ISWREP), Xi’an, China, 20–22 May 2011; pp. 604–606. [Google Scholar] [CrossRef]
- Wang, Z.; Shen, X.; Sun, H.; Wu, Q. A Practical Urban Distribution Network Planning Method with Geographic Information System. IEEE Trans. Power Syst. 2024, 39, 7038–7049. [Google Scholar] [CrossRef]
- Chakravarty, P.; Gamini Wickramasekara, M. A Better GIS Leads to a Better DMS. In Proceedings of the 2014 Clemson University Power Systems Conference (PSC), Clemson, SC, USA, 11–14 March 2014; pp. 1–5. [Google Scholar] [CrossRef]
- Han, G.; Kim, J. Distribution Protection Coordination Program Using GIS. In Proceedings of the 20th International Conference and Exhibition on Electricity Distribution—Part 1 (CIRED), Prague, Czech Republic, 8–11 June 2009; pp. 1–4. [Google Scholar]
- Phayomhom, A.; Rugthaicharoencheep, N.; Chaitusaney, S. GIS Application to Distribution Substation Planning in MEA’s Power System. In Proceedings of the 2015 12th International Conference on Electrical Engineering/Electronics, Computer, Telecommunications and Information Technology (ECTI-CON), Hua Hin, Thailand, 24–27 June 2015; pp. 1–6. [Google Scholar] [CrossRef]
- Li, W.; Chen, H.; Xiang, B. The Study for GIS-Based Distribution Network Monitoring and Control Area Fault Location Methods. In Proceedings of the 2012 International Conference on Computer Science and Service System (CSSS), Nanjing, China, 11–13 August 2012; pp. 1758–1761. [Google Scholar] [CrossRef]
- Rezaee, N.; Nayeripour, M.; Roosta, A.; Niknam, T. Role of GIS in Distribution Power Systems. World Acad. Sci. Eng. Technol. 2009, 36, 494–497. [Google Scholar]
- Datta, A.; Mohanty, P. Enterprise GIS and Smart Electric Grid for India’s Power Sector. In Proceedings of the 2013 IEEE PES Innovative Smart Grid Technologies Conference (ISGT), Washington, DC, USA, 24–27 February 2013; pp. 1–7. [Google Scholar] [CrossRef]
- Liu, C.; Li, B.; Zhang, Y.; Huang, Y.; Wang, X. The LCC Type DC Grids Forming Method and Fault Ride-Through Strategy Based on Fault Current Limiters. Int. J. Electr. Power Energy Syst. 2024, 159, 108443. [Google Scholar] [CrossRef]
- Alcala-Gonzalez, V.M.; Salazar, H.; Palma-Behnke, R.; Vargas, L. Linear Programming Coordination for Overcurrent Relay in Electrical Distribution Systems with Distributed Generation. Appl. Sci. 2022, 12, 4279. [Google Scholar] [CrossRef]
- Singh, M. Protection coordination in distribution systems with and without distributed energy resources—A review. Prot. Control Mod. Power Syst. 2017, 2, 27. [Google Scholar] [CrossRef]
- Ralhan, S.; Ray, S. Directional Overcurrent Relays Coordination Using Linear Programming Intervals: A Comparative Analysis. In Proceedings of the 2013 Annual IEEE India Conference (INDICON), Mumbai, India, 13–15 December 2013; pp. 1–6. [Google Scholar] [CrossRef]
- IEEE Std 242-2001™; IEEE Recommended Practice for Protection and Coordination of Industrial and Commercial Power Systems. The Institute of Electrical and Electronics Engineers, Inc.: New York, NY, USA, 2001.
- Zhan, T.-S.; Su, C.-L.; Lee, Y.-D.; Jiang, J.-L.; Yu, J.-T. Adaptive OCR Coordination in Distribution System with Distributed Energy Resources Contribution. AIMS Energy 2023, 11, 1278–1305. [Google Scholar] [CrossRef]
- Zhan, T.-S.; Lee, Y.-D.; Jiang, J.-L. Optimal OCR Coordination in a High Penetration Distribution Power System Using a Refined Immune Algorithm with an Auto-Tuning Reproductive Mechanism. AIMS Energy 2024, 12, 1225–1263. [Google Scholar] [CrossRef]
Figure 1.
Hardware and network architecture of the DNGIS-PC.
Figure 1.
Hardware and network architecture of the DNGIS-PC.
Figure 2.
The 3-Tier development architecture of the DNGIS-PC.
Figure 2.
The 3-Tier development architecture of the DNGIS-PC.
Figure 3.
Software architecture and workflow of the DNGIS-PC platform.
Figure 3.
Software architecture and workflow of the DNGIS-PC platform.
Figure 4.
DNGIS-PC system interface—differentiating power feeders by color.
Figure 4.
DNGIS-PC system interface—differentiating power feeders by color.
Figure 5.
DNGIS-PC system interface displaying current direction using arrows.
Figure 5.
DNGIS-PC system interface displaying current direction using arrows.
Figure 6.
Visualization of substation equipment and feeders on the DNGIS-PC platform.
Figure 6.
Visualization of substation equipment and feeders on the DNGIS-PC platform.
Figure 7.
Property query function for feeder circuit breaker.
Figure 7.
Property query function for feeder circuit breaker.
Figure 8.
Property query function for substation main transformer.
Figure 8.
Property query function for substation main transformer.
Figure 9.
Property query function for secondary substation.
Figure 9.
Property query function for secondary substation.
Figure 10.
Facility query interface of tie-line switch.
Figure 10.
Facility query interface of tie-line switch.
Figure 11.
Facility query interface of capacitor.
Figure 11.
Facility query interface of capacitor.
Figure 12.
DNGIS-PC interface: internal single-line diagram of substation.
Figure 12.
DNGIS-PC interface: internal single-line diagram of substation.
Figure 13.
Substation extended single-line diagram of the downstream feeder connection.
Figure 13.
Substation extended single-line diagram of the downstream feeder connection.
Figure 14.
The OpenDSS main program file was generated by the DNGIS-PC platform for three-phase fault analysis.
Figure 14.
The OpenDSS main program file was generated by the DNGIS-PC platform for three-phase fault analysis.
Figure 15.
Feeder connection data file segments generated by the DNGIS-PC platform for OpenDSS.
Figure 15.
Feeder connection data file segments generated by the DNGIS-PC platform for OpenDSS.
Figure 16.
Transformer data file generated by the DNGIS-PC platform for OpenDSS.
Figure 16.
Transformer data file generated by the DNGIS-PC platform for OpenDSS.
Figure 17.
Fault current analysis results display—fault point located on feeder branch line.
Figure 17.
Fault current analysis results display—fault point located on feeder branch line.
Figure 18.
Fault current analysis results display—voltage and current readings on main feeder line after fault.
Figure 18.
Fault current analysis results display—voltage and current readings on main feeder line after fault.
Figure 19.
DNGIS-PC drawing of the TCC curve under non-fault conditions.
Figure 19.
DNGIS-PC drawing of the TCC curve under non-fault conditions.
Figure 20.
DNGIS-PC drawing of the TCC curve with the “Grid Line” auxiliary function.
Figure 20.
DNGIS-PC drawing of the TCC curve with the “Grid Line” auxiliary function.
Figure 21.
Utilization of the Crosshair function to evaluate the operation time for each equipment.
Figure 21.
Utilization of the Crosshair function to evaluate the operation time for each equipment.
Figure 22.
Utilization of the time difference function to evaluate CTI between two devices.
Figure 22.
Utilization of the time difference function to evaluate CTI between two devices.
Figure 23.
DNGIS-PC drawing of the TCC curve with miscoordination conditions.
Figure 23.
DNGIS-PC drawing of the TCC curve with miscoordination conditions.
Figure 24.
DNGIS-PC drawing of the TCC curve with well-coordinated conditions.
Figure 24.
DNGIS-PC drawing of the TCC curve with well-coordinated conditions.
Table 1.
OCR characteristic curve parameters [
17].
Table 1.
OCR characteristic curve parameters [
17].
| OCR Characteristics | | |
|---|
| Short Time | 0.04 | 0.05 |
| Long Time | 1.0 | 120 |
| Inverse Time | 0.02 | 0.14 |
| Very Inverse Time | 1.0 | 13.5 |
| Extremely Inverse Time | 2.0 | 80 |
| Disclaimer/Publisher’s Note: The statements, opinions and data contained in all publications are solely those of the individual author(s) and contributor(s) and not of MDPI and/or the editor(s). MDPI and/or the editor(s) disclaim responsibility for any injury to people or property resulting from any ideas, methods, instructions or products referred to in the content. |
© 2025 by the authors. Licensee MDPI, Basel, Switzerland. This article is an open access article distributed under the terms and conditions of the Creative Commons Attribution (CC BY) license (https://creativecommons.org/licenses/by/4.0/).


