1. Introduction
With the rapid penetration of distributed energy resources (DERs) and renewable generation, modern distribution networks face unprecedented challenges in balancing supply and demand, maintaining system stability, and maximizing the utilization of variable resources such as wind and solar [
1,
2,
3]. Conventional static retail tariff models—where end-user rates are set as fixed margins above wholesale prices—do not adapt to dynamic grid conditions, resulting in inefficient dispatch, frequent curtailment of renewables, and elevated system costs. Emerging industrial production technologies are characterized by high energy consumption and pronounced impact loads, which amplify the randomness and volatility on the supply side [
4]. Although the Virtual Power Plant (VPP) concept has emerged to aggregate DERs [
5], including micro gas turbines, battery storage, interruptible loads, and renewable generation—into coordinated market actors, the lack of dynamic, system-wide pricing signals often leaves VPPs to pursue short-term gains, inadvertently amplifying load variability rather than smoothing it [
6].
Centralized and distributed architectures represent the two principal paradigms for coordinating dynamic interactions between multiple virtual power plants (VPPs) and a distribution system operator (DSO) [
7,
8,
9,
10]. In the centralized approach, the DSO employs a single, system-level optimization module—integrated directly into the grid’s dispatch automation—to jointly determine time-varying tariffs and dispatch schedules for all downstream VPPs [
11,
12]. While this yields globally optimal cost minimization, it incurs significant computational overhead and suffers from limited scalability. In contrast, the distributed framework delegates pricing and dispatch decisions to each VPP, enabling faster response times and stronger data privacy guarantees [
13,
14]. However, this decentralized autonomy can undermine holistic system coordination, potentially leading to suboptimal network-wide performance. Reference [
15] introduced an operational model for a virtual power plant with technical constraints of distributed energy resources (DERs), optimizing the day-ahead market scheduling of DER portfolios. Reference [
16] developed a decentralized cooperative optimal power flow framework that integrates active distribution networks with virtual power plants, thereby enhancing both system operational efficiency and fuel economy. Reference [
17] proposed a two-level planning approach for the optimal operation and management of active distribution networks hosting multiple virtual power plants, leveraging a composite pricing strategy to simultaneously bolster system security and economic performance.
However, as the penetration of renewable DERs grows and network topologies become more complex, regional operational disparities emerge and centralized schemes struggle to exploit local flexibility fully. To address this, Reference [
18] presents a hybrid energy storage capacity optimization method that can guide the preliminary sizing of storage assets within VPPs. Reference [
19] formulated an adaptive two-layer distributed pricing mechanism, while Reference [
20] employed clustering with an improved evolutionary algorithm to boost photovoltaic consumption and computational efficiency.
Despite these advances, existing distributed approaches typically rely on fixed clustering or partitioning strategies, which are poorly adaptive to topological changes and the variable nature of distributed PV resources. Moreover, current schemes often overlook the comprehensive integration of flexible loads—such as data centers—when defining clusters or price regions. Refs. [
21,
22] demonstrate that the task scheduling flexibility of data centers can function as virtual storage, effectively smoothing net load fluctuations.
Recognizing these limitations, recent studies have shifted toward multi-agent and game-theoretic frameworks. While models like Cournot or Nash bargaining are effective for scenarios with symmetric players competing on quantity or negotiating shared surpluses, they do not fully capture the inherent hierarchical relationship in distribution systems. In contrast, the Stackelberg game, with its distinct leader–follower structure, is particularly well suited for modeling the interaction between a distribution system operator (DSO) and multiple virtual power plants (VPPs). The DSO, as the system operator, naturally acts as a leader by setting prices, while the VPPs act as followers, reacting to these price signals. It is worth noting that, in addition to price-based incentive mechanisms, demand-side management also includes various strategies such as Direct Load Control (DLC) [
23] and event-based Emergency Demand Response (EDR) [
24]. DLC grants the system operator the authority to directly curtail or regulate user loads, offering rapid response but facing lower user acceptance. EDR is typically triggered during system emergencies in exchange for high compensation. Compared to these methods, the dynamic price-based coordination mechanism proposed in this paper grants market entities like VPPs greater autonomy, guiding their spontaneous optimal behavior through market signals, and is considered a more economically efficient and sustainable advanced demand-side management model. This paper leverages this leader–follower dynamic to build its coordination framework. Regulating DER output via dynamic price signals is key to enhancing system stability under high renewable penetration. Reference [
25] proposed a decentralized voltage control scheme based on a multi-input multi-output (MIMO) model, while reference [
26] advanced a voltage–frequency joint response strategy. Reference [
27] introduced an incentive-based fair voltage control strategy, and reference [
28] developed a reactive power optimization method for distributed energy resources (DERs), which is efficiently solved using a distributed accelerated dual descent algorithm.
Nevertheless, these frameworks seldom integrate demand-side computing loads as active participants in price coordination. In particular, the potential of data centers to shift flexible workloads in response to renewable-linked incentives remains underexplored. This paper fills that gap by embedding a schedulable data center within one VPP and designing a wind-linked incentive tariff, thereby realizing a three-tier Stackelberg coordination mechanism that spans upstream grid, DSO–VPP interaction, and intra-VPP load scheduling.
Table 1 lists all the key variables used in this study.
Although substantial advances have been made in hierarchical and game-theoretic coordination between DSOs and VPPs, existing approaches rarely treat demand-side computing loads as strategic assets in price design. In particular, the ability of data centers to dynamically reallocate flexible workloads in response to renewable-driven price signals remains underexploited. Building on these insights, the principal contributions of this paper are as follows:
A Novel Tri-Level Response Mechanism: In contrast to traditional bi-level (DSO-VPP) optimization frameworks, we develop a novel tri-level response mechanism that integrates the upstream grid, the DSO, multiple VPPs, and the intra-VPP data center flexibility into a unified Stackelberg game. This structure not only models the pricing interactions at the market boundary but also enables fine-grained scheduling of controllable loads like data centers, bridging a critical gap in existing research.
Joint Optimization with Data Centers as a Schedulable Resource: A key innovation of this paper is the integration of a schedulable data center load as a controllable Distributed Energy Resource (DER) within a VPP, for which we design a wind-linked incentive tariff. By dynamically shifting computational tasks to periods of high wind availability, this scheme significantly enhances renewable energy utilization and transforms the data center from a passive consumer into an active contributor to grid stability, a role seldom considered in previous DSO-VPP coordination models.
An Efficient Solution Methodology: To solve the resulting high-dimensional bilevel optimization problem, we employ a Kriging-based surrogate optimization methodology. This approach combines the global search capabilities of Latin hypercube sampling, the decision-space partitioning of regional clustering, and the local refinement of a particle-swarm algorithm, ensuring near-optimal dynamic pricing strategies are found within a tractable computational time.
2. Dynamic Pricing Modeling of Distribution System Operator
Amid the rapid expansion of distributed energy resources, conventional static pricing schemes no longer satisfy a distribution network’s requirements for flexibility, renewable-energy integration, and overall economic efficiency. Static tariffs often prevent downstream virtual power plants (VPPs) from reacting promptly to fluctuations in the electricity market, leading to curtailment of renewable generation and persistently high system costs. To address these shortcomings, this work formulates a Stackelberg-game framework to coordinate a distribution system operator (DSO) with multiple VPPs. By allowing the DSO to adjust purchase and sale tariffs dynamically, each VPP is guided to determine its optimal dispatch decisions in every time interval. This hierarchical decision structure promotes efficient utilization of renewables while simultaneously reducing total system operating costs.
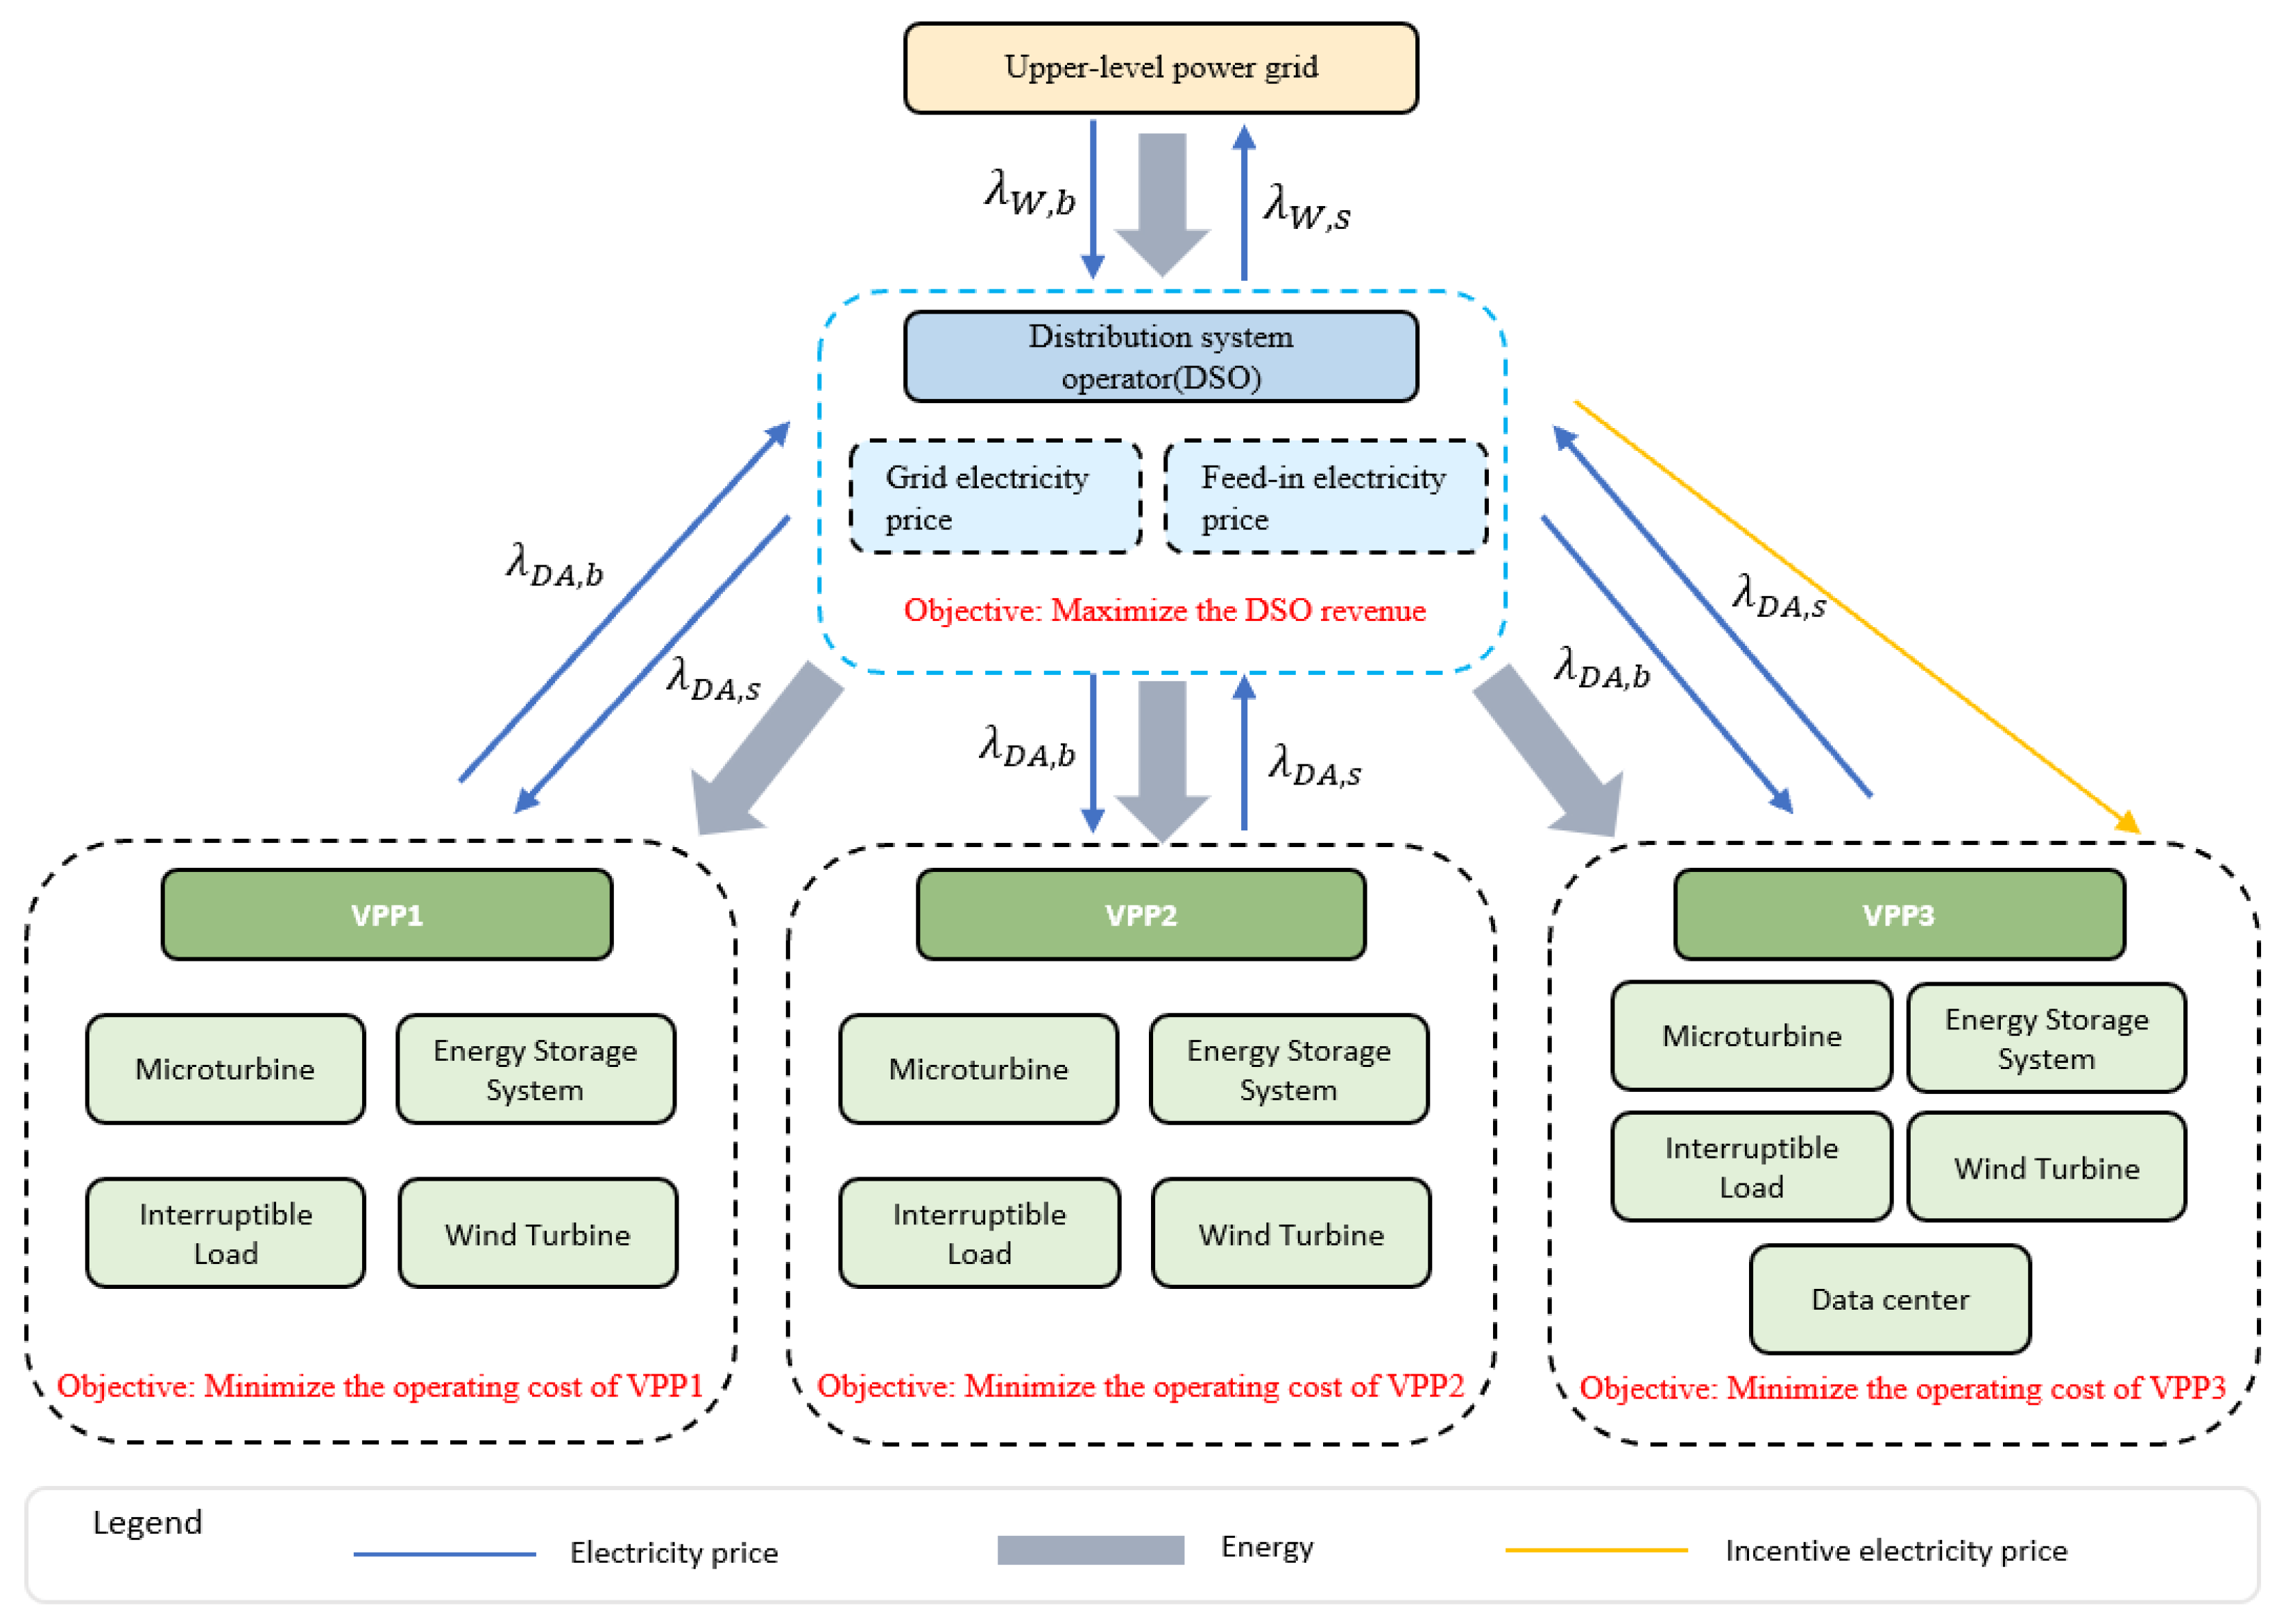
As illustrated in
Figure 1, within the Stackelberg framework, the DSO acts as the leader by announcing time-varying purchase and sale prices to its downstream VPPs; in turn, each VPP acts as a follower, optimizing its generating units, energy storage schedule, interruptible load, and—where applicable—data center workload to minimize operating costs under the given price signals. Hence, the DSO’s pricing strategy in each time slot not only dictates its economic returns but also exerts a profound influence on VPP behavior, thereby achieving the dual objectives of maximizing DSO profit and minimizing VPP costs.
This chapter proceeds as follows. We first introduce the DSO’s decision variables—the purchase tariff and sale tariff for each period t—and define their feasible ranges. Next, we construct the DSO’s revenue function, demonstrating how its returns arise from the price differentials in transactions with both the upstream grid and downstream VPPs. Finally, we present the explicit pricing constraints that ensure economic feasibility, and we briefly discuss the mathematical properties of this dynamic pricing model as well as the key challenges in solving it.
2.1. Electricity Price Strategy Structure and Constraints
At each scheduling interval t, the DSO announces a pair of prices: the purchase tariff
, at which a VPP buys energy from the DSO and the sale tariff
, at which a VPP sells energy to the DSO. To ensure economic feasibility and consistency with the wholesale market, these tariffs must satisfy the boundary conditions:
where
denotes the grid’s feed-in tariff during period
t, that is, the price DSO earns when selling power back to the upstream network, whereas
denotes the grid’s procurement tariff during period
t, i.e., the price DSO must pay when purchasing from the upstream network. The boundary constraint
carries two critical implications. First, if DSO were to set
, then any power bought from a VPP at
could immediately be resold at the higher grid feed-in price
, yielding risk-free arbitrage profit. Since this does not align with profit-maximization objectives, the DSO would never choose such a pricing scheme. Second, if DSO set
, VPPs would prefer to procure directly from the upstream grid rather than from the DSO, causing the DSO to lose downstream transaction volume. Therefore,
must not exceed
to maintain the DSO’s electricity supply as economically attractive.
2.2. Construction of the DSO Revenue Function
The revenue stream of the distribution system operator (DSO) consists of two primary components: (1) the net profit or cost associated with power exchanges between the DSO and the upstream transmission grid, and (2) the internal trading margins arising from energy transactions with downstream virtual power plants (VPPs). To systematically capture these interactions, we first define the DSO’s net trading power at time period
t across all
N VPPs as follows:
where
and
represent, respectively, the amount of electricity purchased from and sold to the DSO by VPP
j at time
t. A positive value of
indicates that the DSO is a net buyer from the grid during period
t, while a negative value indicates a net seller. To distinguish these two cases, the net exchange is decomposed as follows:
where
and
denote, respectively, the DSO’s net power purchase from and sale to the upstream grid.
The DSO’s cost or revenue from its interaction with the grid is then directly determined by the market boundary prices. When
, the DSO sells power to the grid at the feed-in tariff
, yielding revenue of
. Conversely, when
, the DSO purchases electricity at the grid’s buying price
, incurring a cost of
. Aggregating over the whole 24 h period, the DSO’s net revenue from grid interactions is given by the following:
In parallel, the DSO also engages in transactions with each VPP. Summing across all
N VPPs and all time periods, the total internal revenue from VPP trading is as follows:
Combining the external and internal trading contributions, the DSO’s total profit (the utility function) over the 24 h horizon is as follows:
The first term reflects the DSO’s ability to leverage price arbitrage opportunities with the transmission grid—buying during high-demand periods and selling during periods of surplus. The second term represents the DSO’s pricing leverage over downstream VPPs. By setting a time-varying spread between and , the DSO can effectively incentivize or disincentivize energy flow from specific VPPs. This interaction fundamentally shapes the dispatch decisions of VPPs, the aggregate power flow in the network, and ultimately, the overall system economics.
Through appropriate pricing strategies, the DSO thus acts as a market coordinator, dynamically balancing operational efficiency and financial optimization in a decentralized, multi-agent environment.
3. VPP Energy Management Model
In distributed power systems, virtual power plants (VPPs) are widely regarded as a promising organizational paradigm for enhancing the utilization of renewable energy and improving system flexibility. Both VPP1 and VPP2 adopt a typical multi-energy complementary structure, integrating micro gas turbines (MTs), battery energy storage systems (ESSs), interruptible loads (ILs), and wind turbines (WTs). When facing time-varying price signals issued by the distribution system operator (DSO), each VPP must intelligently coordinate its internally distributed energy resources and determine optimal buying/selling strategies to minimize operating costs.
This chapter presents a comprehensive energy dispatch model for VPP1 and VPP2, incorporating power balance constraints, device-level operational limits, and cost function design. The model spans a 24 h time horizon and is formulated as a mixed-integer quadratic programming (MIQP) problem, capturing the VPPs’ rational responses to dynamic pricing.
3.1. Power Balance and Trading Direction Constraints
To ensure physical feasibility, each VPP must satisfy the following energy balance constraint for every period
:
where
denotes the net energy traded with the DSO,
represents the local load demand that must be met using either internal generation or external procurement.
To avoid the economically irrational behavior of simultaneous buying and selling in the same time slot, a binary variable
is introduced to enforce unidirectional trading:
This structure ensures mutually exclusive transaction behaviors and provides operational flexibility for each VPP to respond adaptively to price signals under varying load or resource availability conditions.
3.2. Operational Constraints of Distributed Energy Resources
The feasible operation of VPPs must comply with physical limits of individual devices:
- (1)
Micro Gas Turbine (MT):
where
denotes the MT output at time
t,
is the maximum rated capacity, and
is the allowable ramp rate. These constraints ensure that the microturbine operates within its physical output limits and satisfies inter-temporal ramping constraints between successive periods.
- (2)
Energy Storage System (ESS):
where
denotes the state of charge (SoC) at time
t, and
E is the energy conversion factor. These constraints capture the intertemporal coupling inherent in energy storage systems, which play a critical role in demand shifting and wind power absorption.
- (3)
Interruptible Load and Wind Power Output:
where the IL offers flexible curtailment options under high-price conditions to reduce procurement costs, while wind generation is limited by time-indexed availability forecasts.
3.3. Cost Function Formulation
Under the price signals
and
issued by the DSO, the objective of each VPP is to minimize its total operating cost, which includes market trading costs, MT fuel costs, ESS usage costs, and IL compensation costs. The overall cost function is formulated as follows:
where
is the sum of the operating costs of each component unit of VPP in period
t.
are coefficients reflecting the nonlinear cost of MT generation,
denotes the quadratic cost associated with charging/discharging the ESS,
represents the penalty or incentive cost of invoking IL flexibility.
This cost function is convex and thus well suited for optimization by modern solvers such as CPLEX. By solving the resulting MIQP problem, the VPP can determine its optimal dispatch and trading schedule in response to the DSO’s pricing signals, forming a best-response strategy within the overall Stackelberg game framework.
5. Example Analysis
This paper proposes a Stackelberg-based dynamic pricing framework with data center incentives to coordinate multiple VPPs. At the upper level, the DSO’s optimization combines Latin hypercube sampling, regional clustering, and a particle-swarm algorithm; at the lower level, each VPP solves its mixed-integer dispatch problem (with VPP3 additionally modeling data center load scheduling). The remainder of this section is organized as follows:
Section 5.1 describes the overall simulation model structure, and
Section 5.2 presents a detailed analysis of the numerical results.
5.1. Simulation System Construction
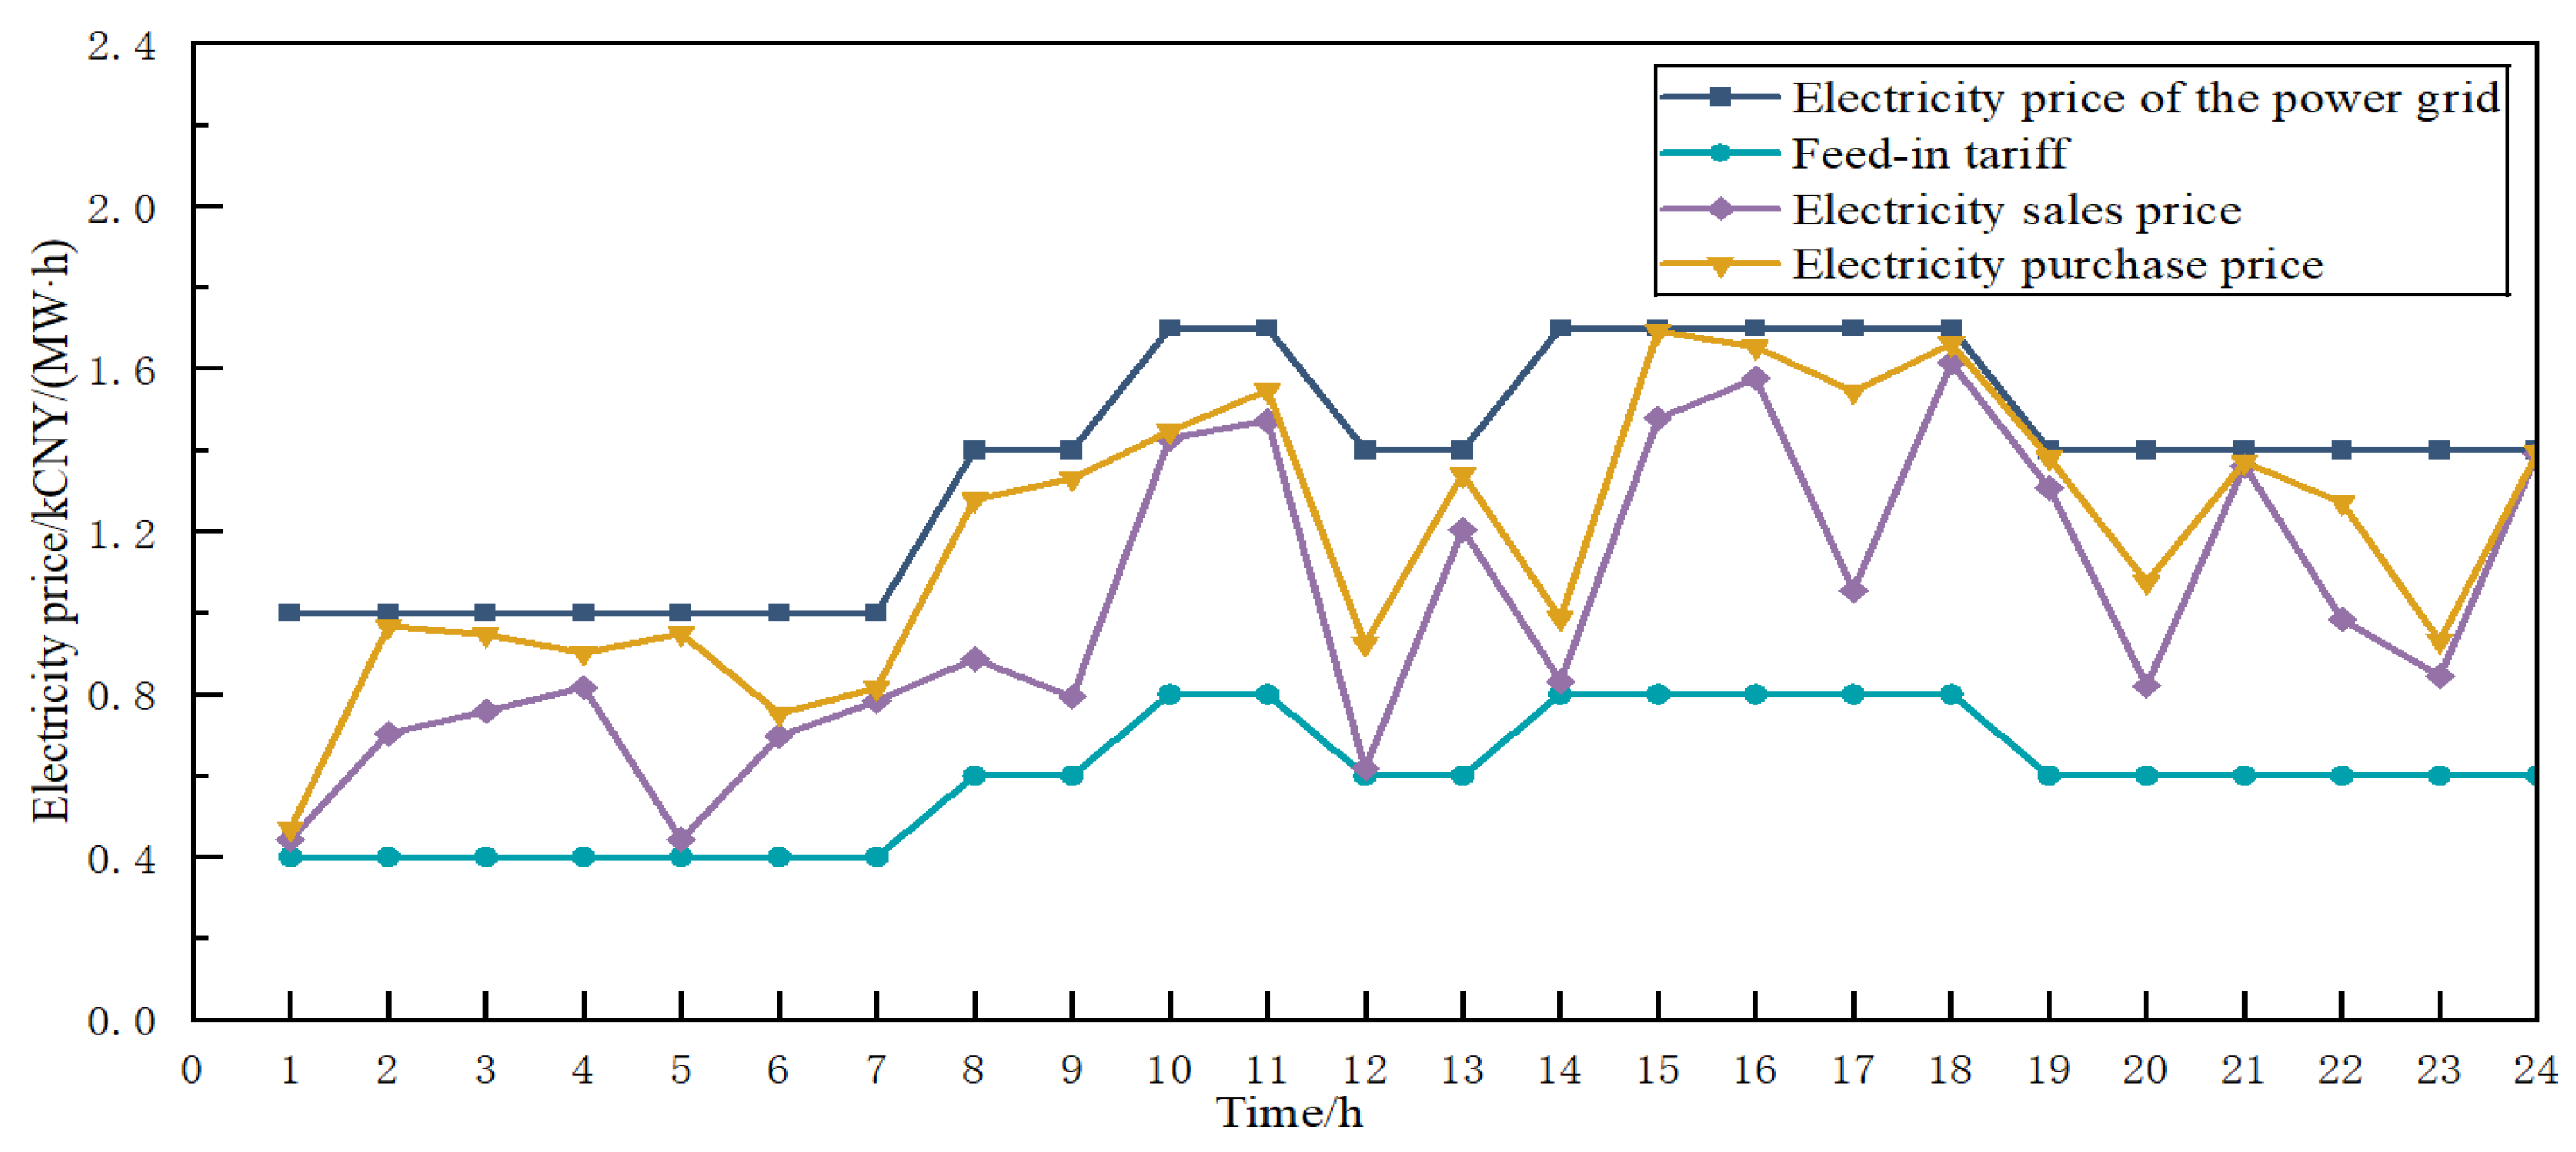
To evaluate the proposed Stackelberg-based dynamic pricing and data center incentive scheme, five initial samples were generated, and a 24 h simulation framework was constructed to capture the key characteristics of a medium-sized distribution network with three virtual power plants (VPPs). The DSO’s purchase and sale prices with the upstream grid follow Guangdong Province’s three-tier “flat/peak/off-peak” tariff structure;
Figure 2 illustrates the corresponding market feed-in and grid prices.
To illustrate the benefits of the proposed Stackelberg-based dynamic pricing with data center incentives, two operating scenarios are constructed and compared over the same 24 h horizon:
Scenario 1 (Baseline scenario): No dynamic pricing optimization. The DSO applies a fixed, time-invariant markup over the upstream “flat/peak/off-peak” grid tariffs, and each VPP dispatches its resources to minimize its own operating cost under these static rates.
Scenario 2 (Optimize the scenario): Dynamic pricing optimization as per the Stackelberg framework described in
Section 2, where the DSO seeks to maximize its total daily profit by posting time-varying buying and selling prices; each VPP (including VPP3 with its data center schedule) minimizes its own cost in response.
In the Stackelberg game, the distribution system operator (DSO) is modeled as the leader, while the three VPPs serve as followers that respond to time-varying buying and selling prices. Each VPP is equipped with a micro gas turbine (MT), a battery energy storage system (ESS), an interruptible load capable of shedding up to 10% of its base demand, and a wind farm whose output is constrained by a time-indexed forecast of maximum generation. In VPP 3, a data center load is integrated as an additional dispatchable component; its computing tasks can be scheduled across hours subject to a 95% maximum CPU utilization and predefined task durations.
Table 2 summarizes the CPU utilization for each computing task in the data center and its corresponding execution duration. All other model assumptions—such as wind and load profiles, MT size and ramp limits, ESS capacity, interruptible-load thresholds, and data center task parameters—remain identical between the two scenarios. The key performance metrics are the DSO’s total daily revenue, each VPP’s total operating cost, aggregate wind utilization, and hourly trading power between each VPP and the DSO.
5.2. Deterministic Scenario Analysis
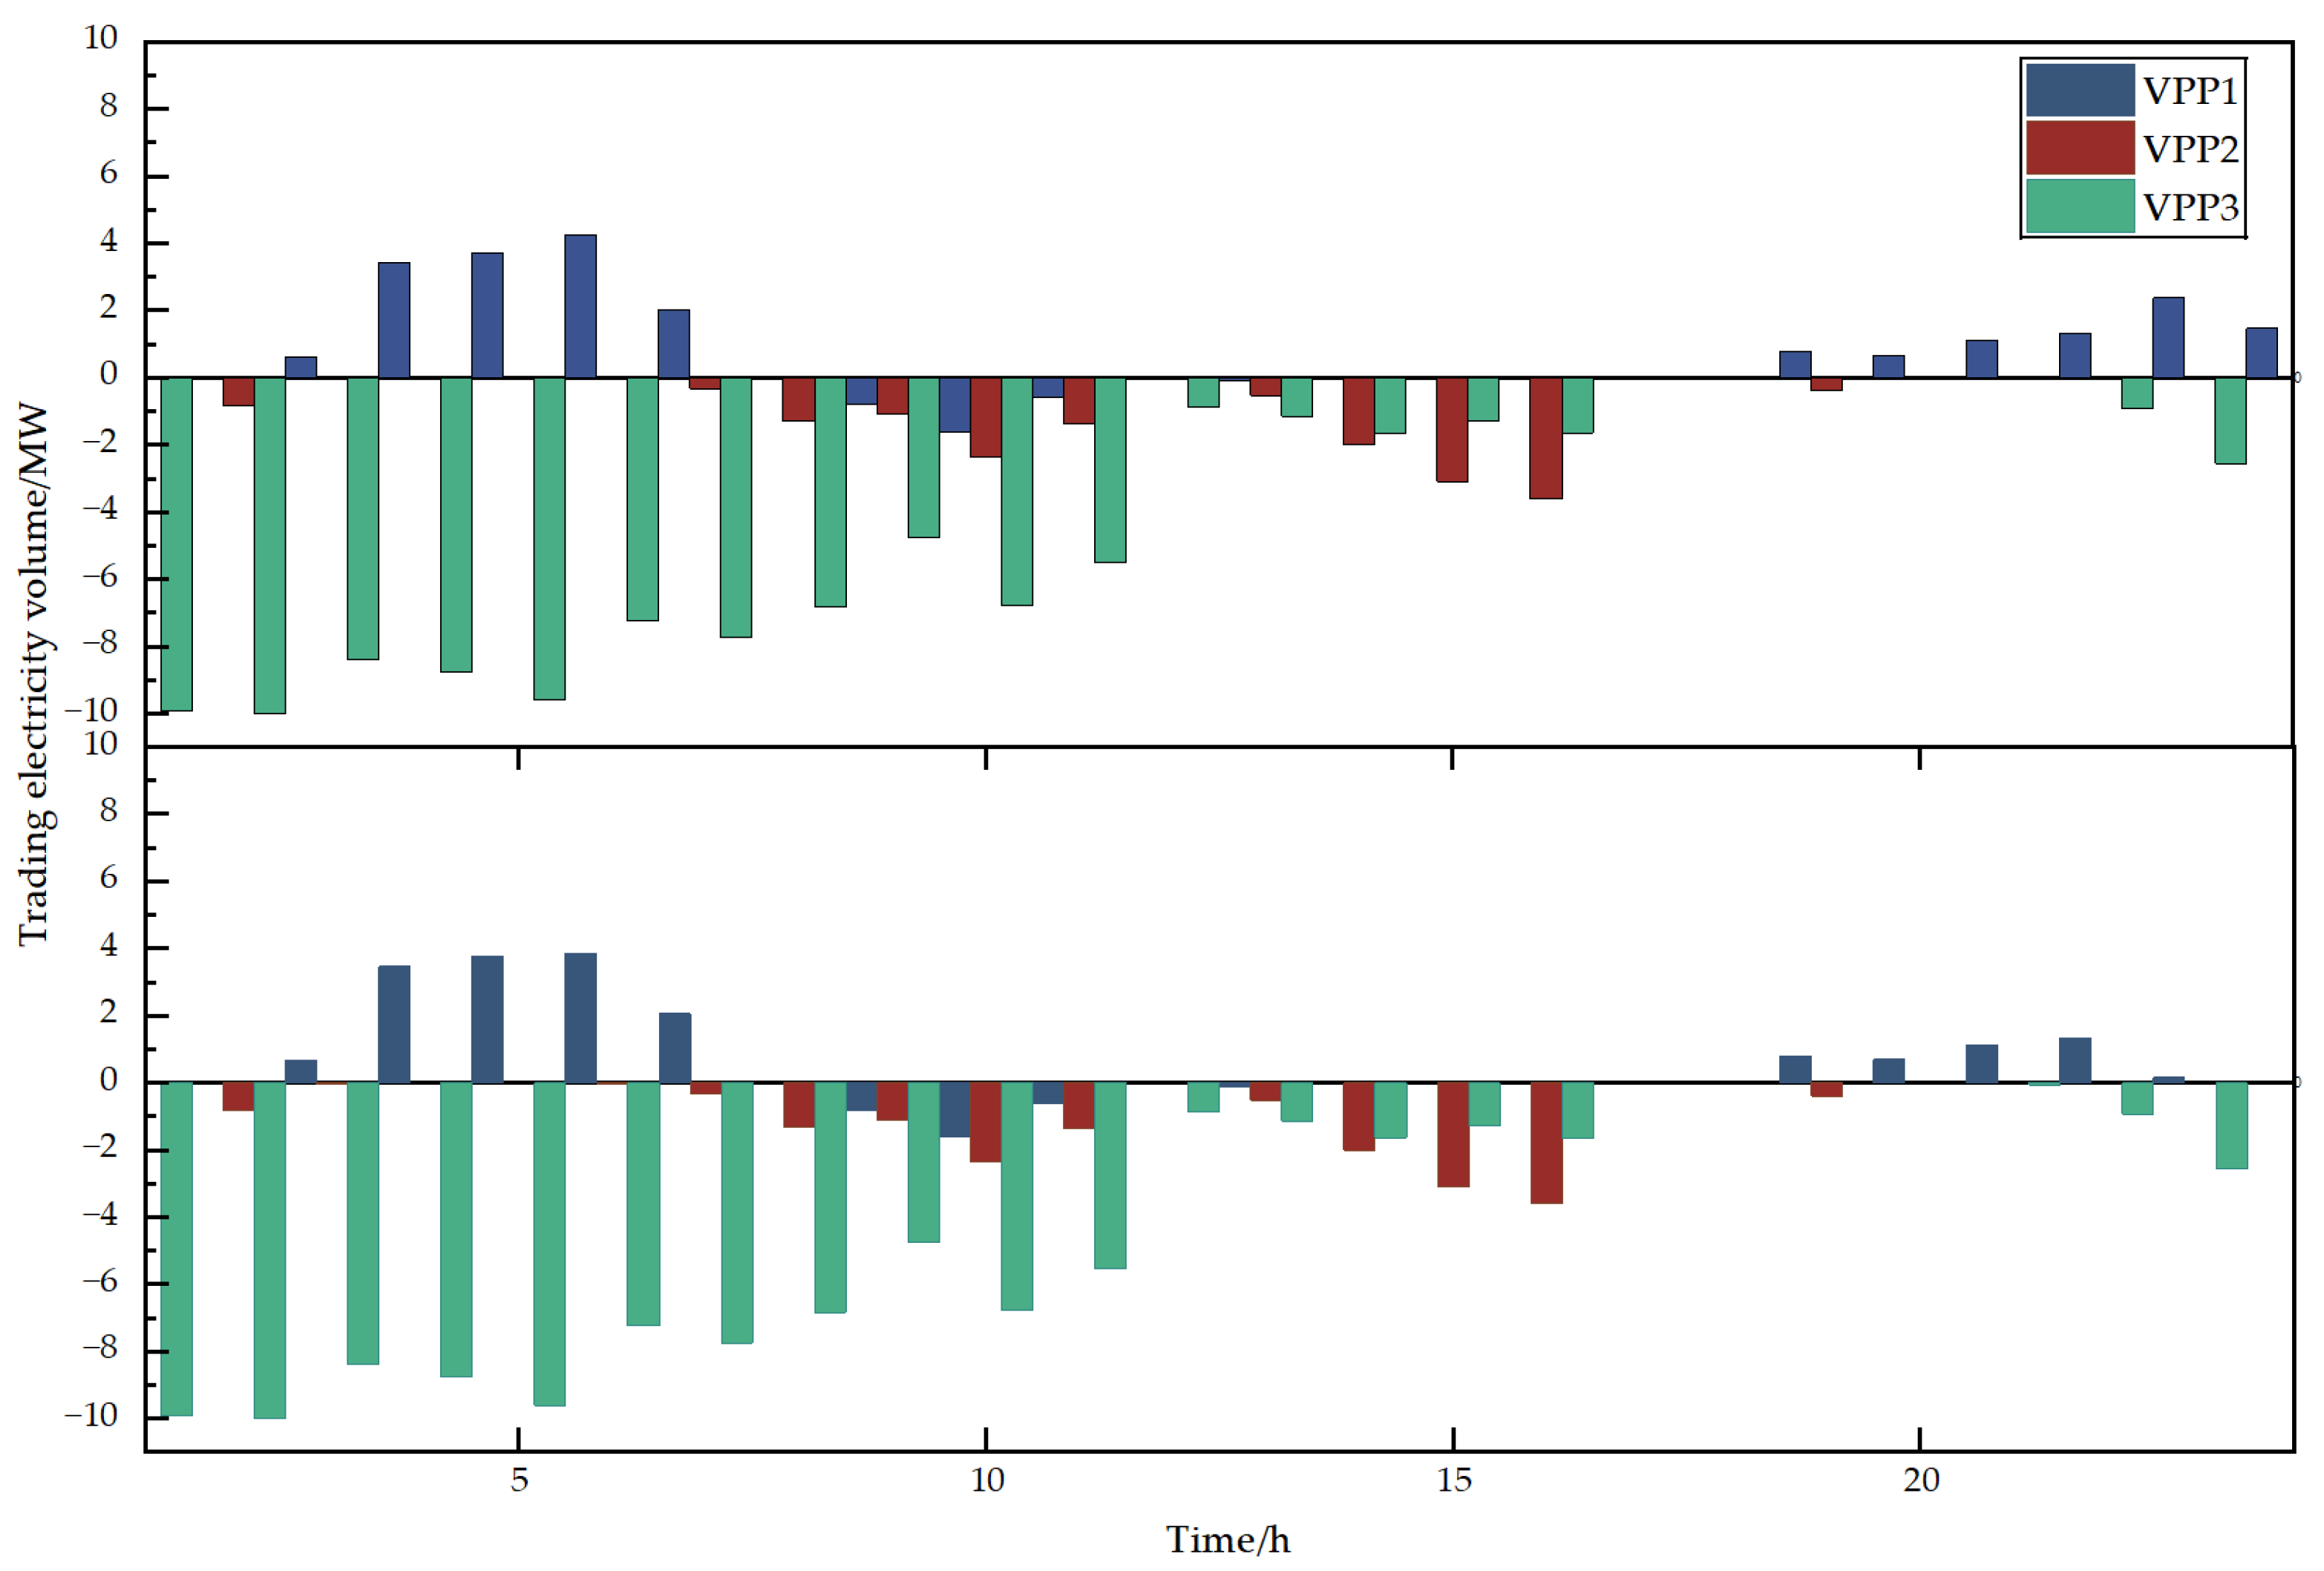
The VPP trading volumes and internal DER outputs under the different scenarios are shown in
Figure 3 and
Figure 4, and the VPP operating costs and DSO revenues for each scenario are listed in
Table 3. The task distribution of the data center in each period is shown in
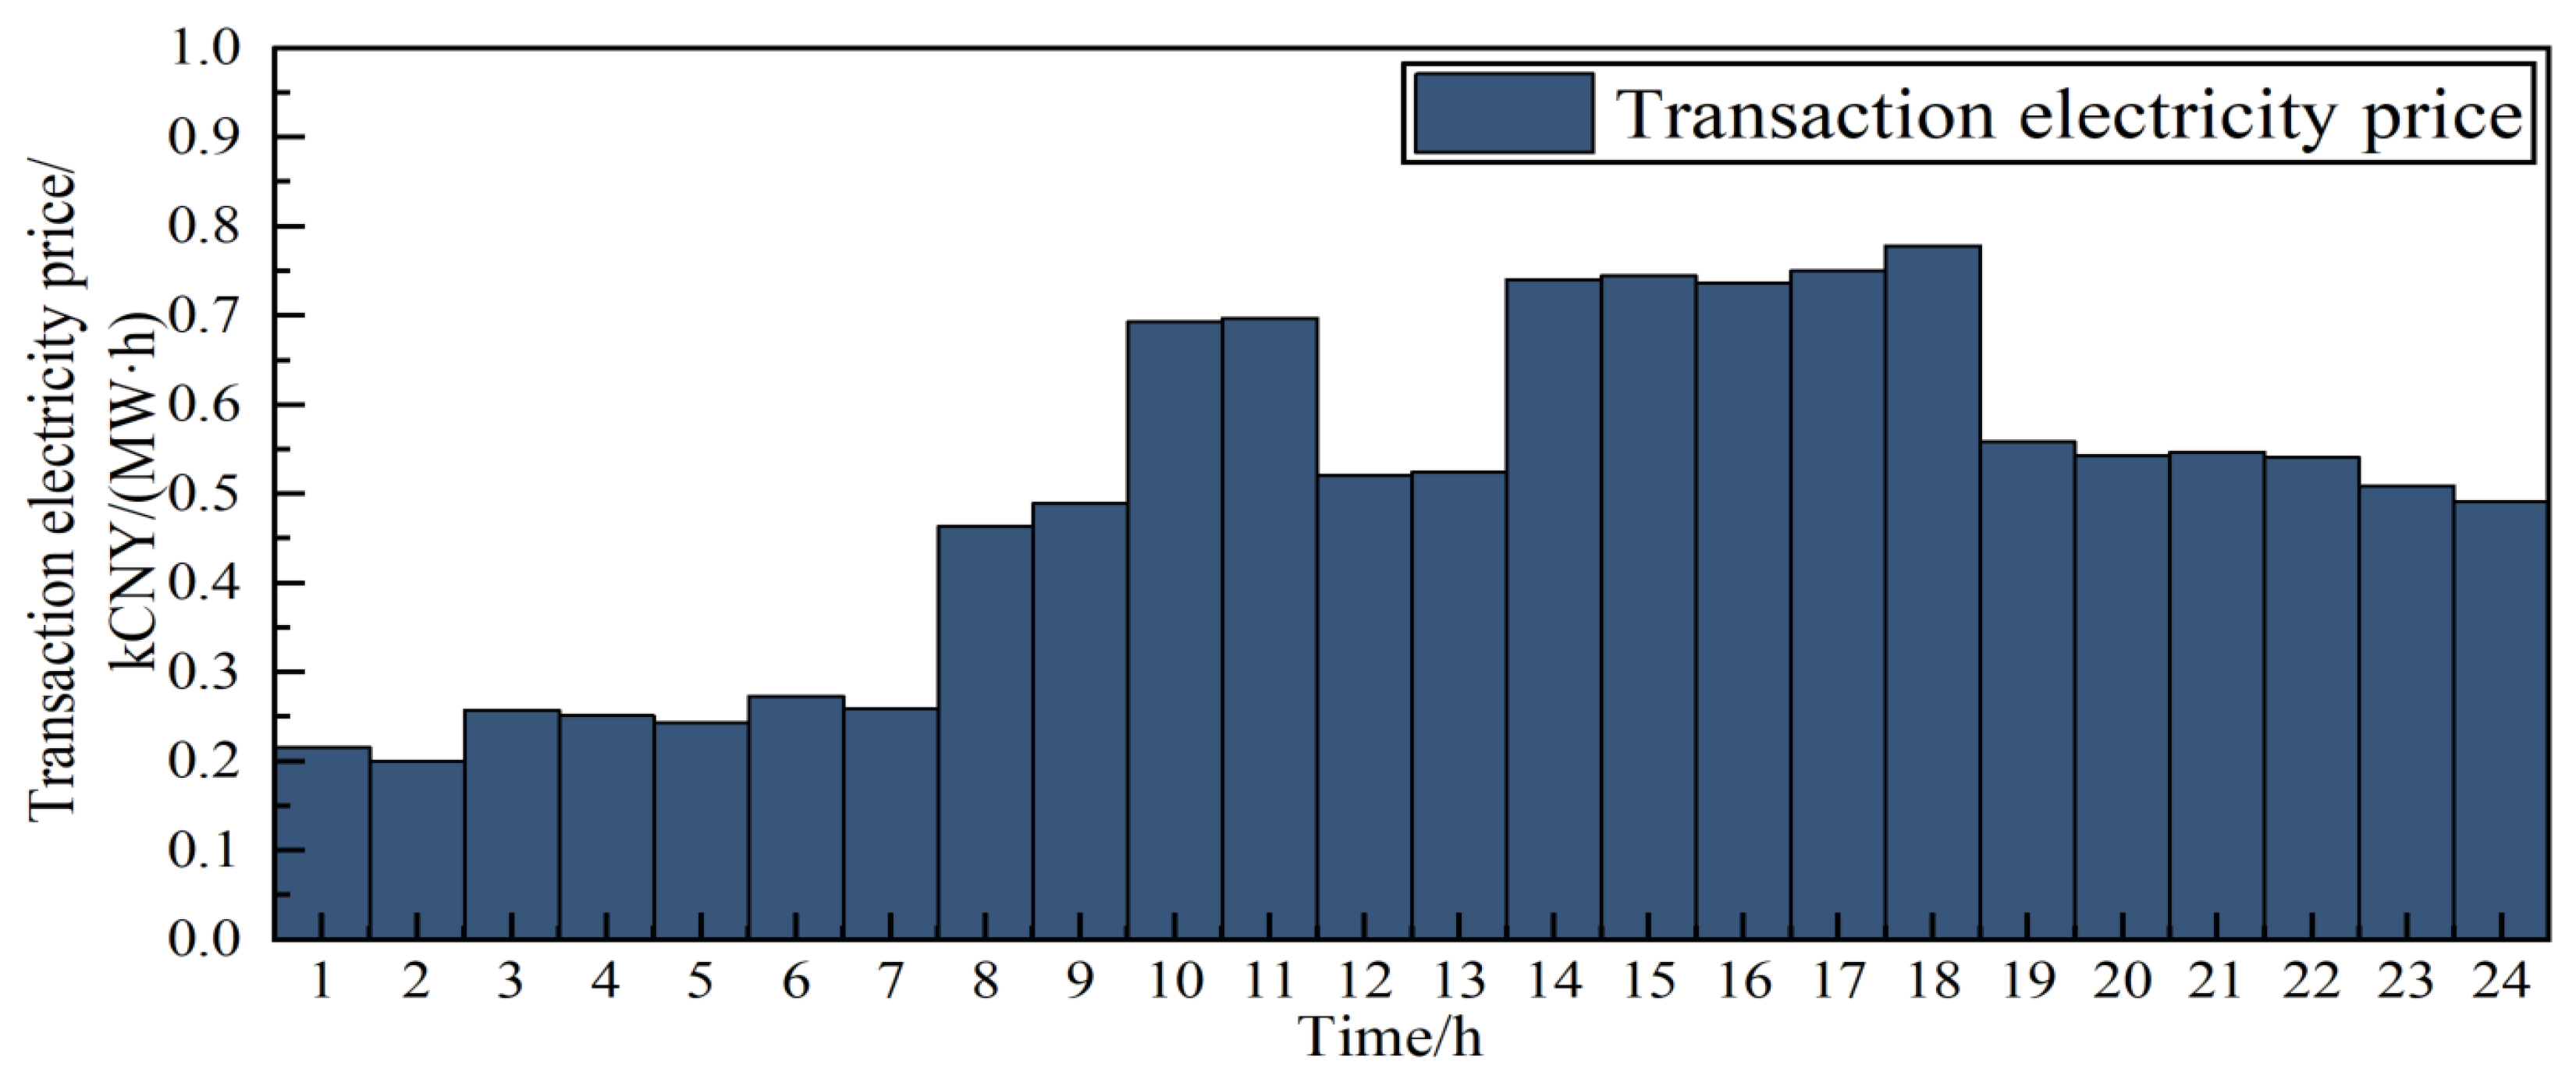
Figure 5. In the dynamic pricing optimization scenario, the incentive price for encouraging the data center in VPP3 to actively absorb power is shown in
Figure 6.
Figure 3 and
Figure 4 together reveal how dynamic pricing reshapes both external trading and internal dispatch across the three VPPs. In
Figure 3, the optimized scenario shows VPP1 exporting power primarily during the mid-day wind peak, VPP2 maintaining near-zero net trade, and VPP3 persistently injecting surplus wind into the DSO. Under static pricing, however, VPP3’s exports concentrate in early-morning and late-evening hours—when wind output is highest—while mid-day opportunities are overlooked, and VPP1’s exports remain limited.
Figure 4 drills down into each VPP’s resource mix. In the optimized case, microturbines and storage discharge are deferred to high-price or low-wind periods, whereas introduced electrical load and interruptible-load curtailment absorb renewable surpluses in mid-day hours. Notably, VPP3 under dynamic pricing schedules most of its data center load and interruptible-load activation into the 9–12 h and 15–18 h windows—precisely when wind farm output peaks—thereby minimizing reliance on thermal generation and storage cycling. In contrast, the baseline dispatches these flexible loads far more uniformly, forcing VPP3 to burn fuel or discharge storage even when abundant wind is available.
Figure 5 illustrates the temporal distribution of data center tasks under each scenario. In the baseline case, tasks are spread across the low-tariff overnight window and again late at night, leaving daytime hours under-utilized. With dynamic pricing, the majority of tasks still run in that same low-tariff window, but a few tasks are pulled forward into the adjacent mid-tariff period. This targeted migration indicates that even modest price differentials can induce the data center to reallocate workload into higher-value periods, thereby better aligning computational demand with renewable generation availability.
As shown in
Table 3, under the baseline scenario, VPP1, VPP2, and VPP3 incur relatively high operating expenses because each must rely on suboptimal combinations of gas-turbine dispatch, storage cycling, and intermittent-load curtailment when exposed to fixed retail tariffs. By contrast, when the proposed dynamic-pricing scheme is employed (Scenario 2), each VPP can significantly reshape its internal dispatch: gas-turbine output is more closely aligned with peak-wind periods, storage charging is concentrated when electricity prices are lowest, and interruptible loads and data center tasks are scheduled to absorb excess renewable energy. Consequently, VPP1 and VPP2 cut their daily costs roughly in half or better, while VPP3—owing largely to its ability to defer data center workloads into high-wind, low-price hours—achieves a substantial cost reduction. At the same time, the DSO realizes an increase in net revenue. In essence, the dynamic pricing framework not only lowers total VPP operating expenditure by over 28% but also improves the DSO’s profit margin by nearly 19%, reflecting more efficient coordination of internal DERs and a smoother alignment of aggregate load with upstream grid pricing.
As shown in
Figure 5, Scenario 2 introduces a time-varying incentive tariff for VPP 3’s data center, which rises in parallel with wind availability to encourage task scheduling during renewable-rich intervals. By shifting computational workloads into high-wind periods, the data center substantially increases its utilization of low-cost, zero-carbon generation, thereby reducing reliance on conventional gas-turbine dispatch and optimizing storage cycling. This dynamic incentive not only enhances overall wind absorption—allowing VPP 3 to capture otherwise curtailed energy—but also enables its MT and ESS to operate more efficiently outside peak-price windows. In turn, all three VPPs lower their operating expenditures by responding to the time-varying price signals, while the DSO benefits from smoother net demand profiles and increased revenue.
5.3. Robustness Analysis Under Uncertainty
To validate the practical applicability and robustness of the proposed strategy, Scenario 3 introduces stochasticity into the model. This scenario utilizes the optimal day-ahead tariffs derived from Scenario 2 but simulates real-time operation wherein the actual wind power output deviates from forecasts. The deviation is modeled following a normal distribution with a standard deviation of 15%, which represents a significant level of uncertainty. A two-stage settlement market is consequently modeled, wherein the DSO is responsible for managing and settling the real-time power imbalances that arise. The primary objective of this analysis is to ascertain whether the proposed dynamic pricing strategy, when coupled with a suitable risk management mechanism (i.e., imbalance pricing), can maintain its economic viability and superiority over the baseline static-tariff model.
The aggregated results from 100 Monte Carlo simulations are presented.
Figure 7 illustrates the statistical distribution of the DSO’s final revenue under uncertainty.
As depicted in the box plot in
Figure 7, the DSO’s revenue is no longer a deterministic value but rather a distribution, reflecting the financial risk exposure stemming from wind generation uncertainty. The median revenue is approximately 10.5 kCNY, with the interquartile range spanning from approximately 6 kCNY to 14 kCNY. The mean revenue across all simulations settles at 10.28 kCNY. This outcome is pivotal for two reasons. First, as anticipated, this average revenue is lower than the 11.32 kCNY achieved under the perfect-forecast conditions of Scenario 2; this 9.2% reduction quantifies the economic cost inherent in managing real-time uncertainty. Second, and more critically, the average revenue of 10.28 kCNY is still 8.1% higher than the 9.51 kCNY revenue obtained from the static-pricing baseline (Scenario 1). This result empirically confirms the robustness of the proposed framework, demonstrating its capacity to not only absorb the financial impact of significant uncertainty but also to secure a superior economic outcome compared to traditional, non-adaptive strategies.
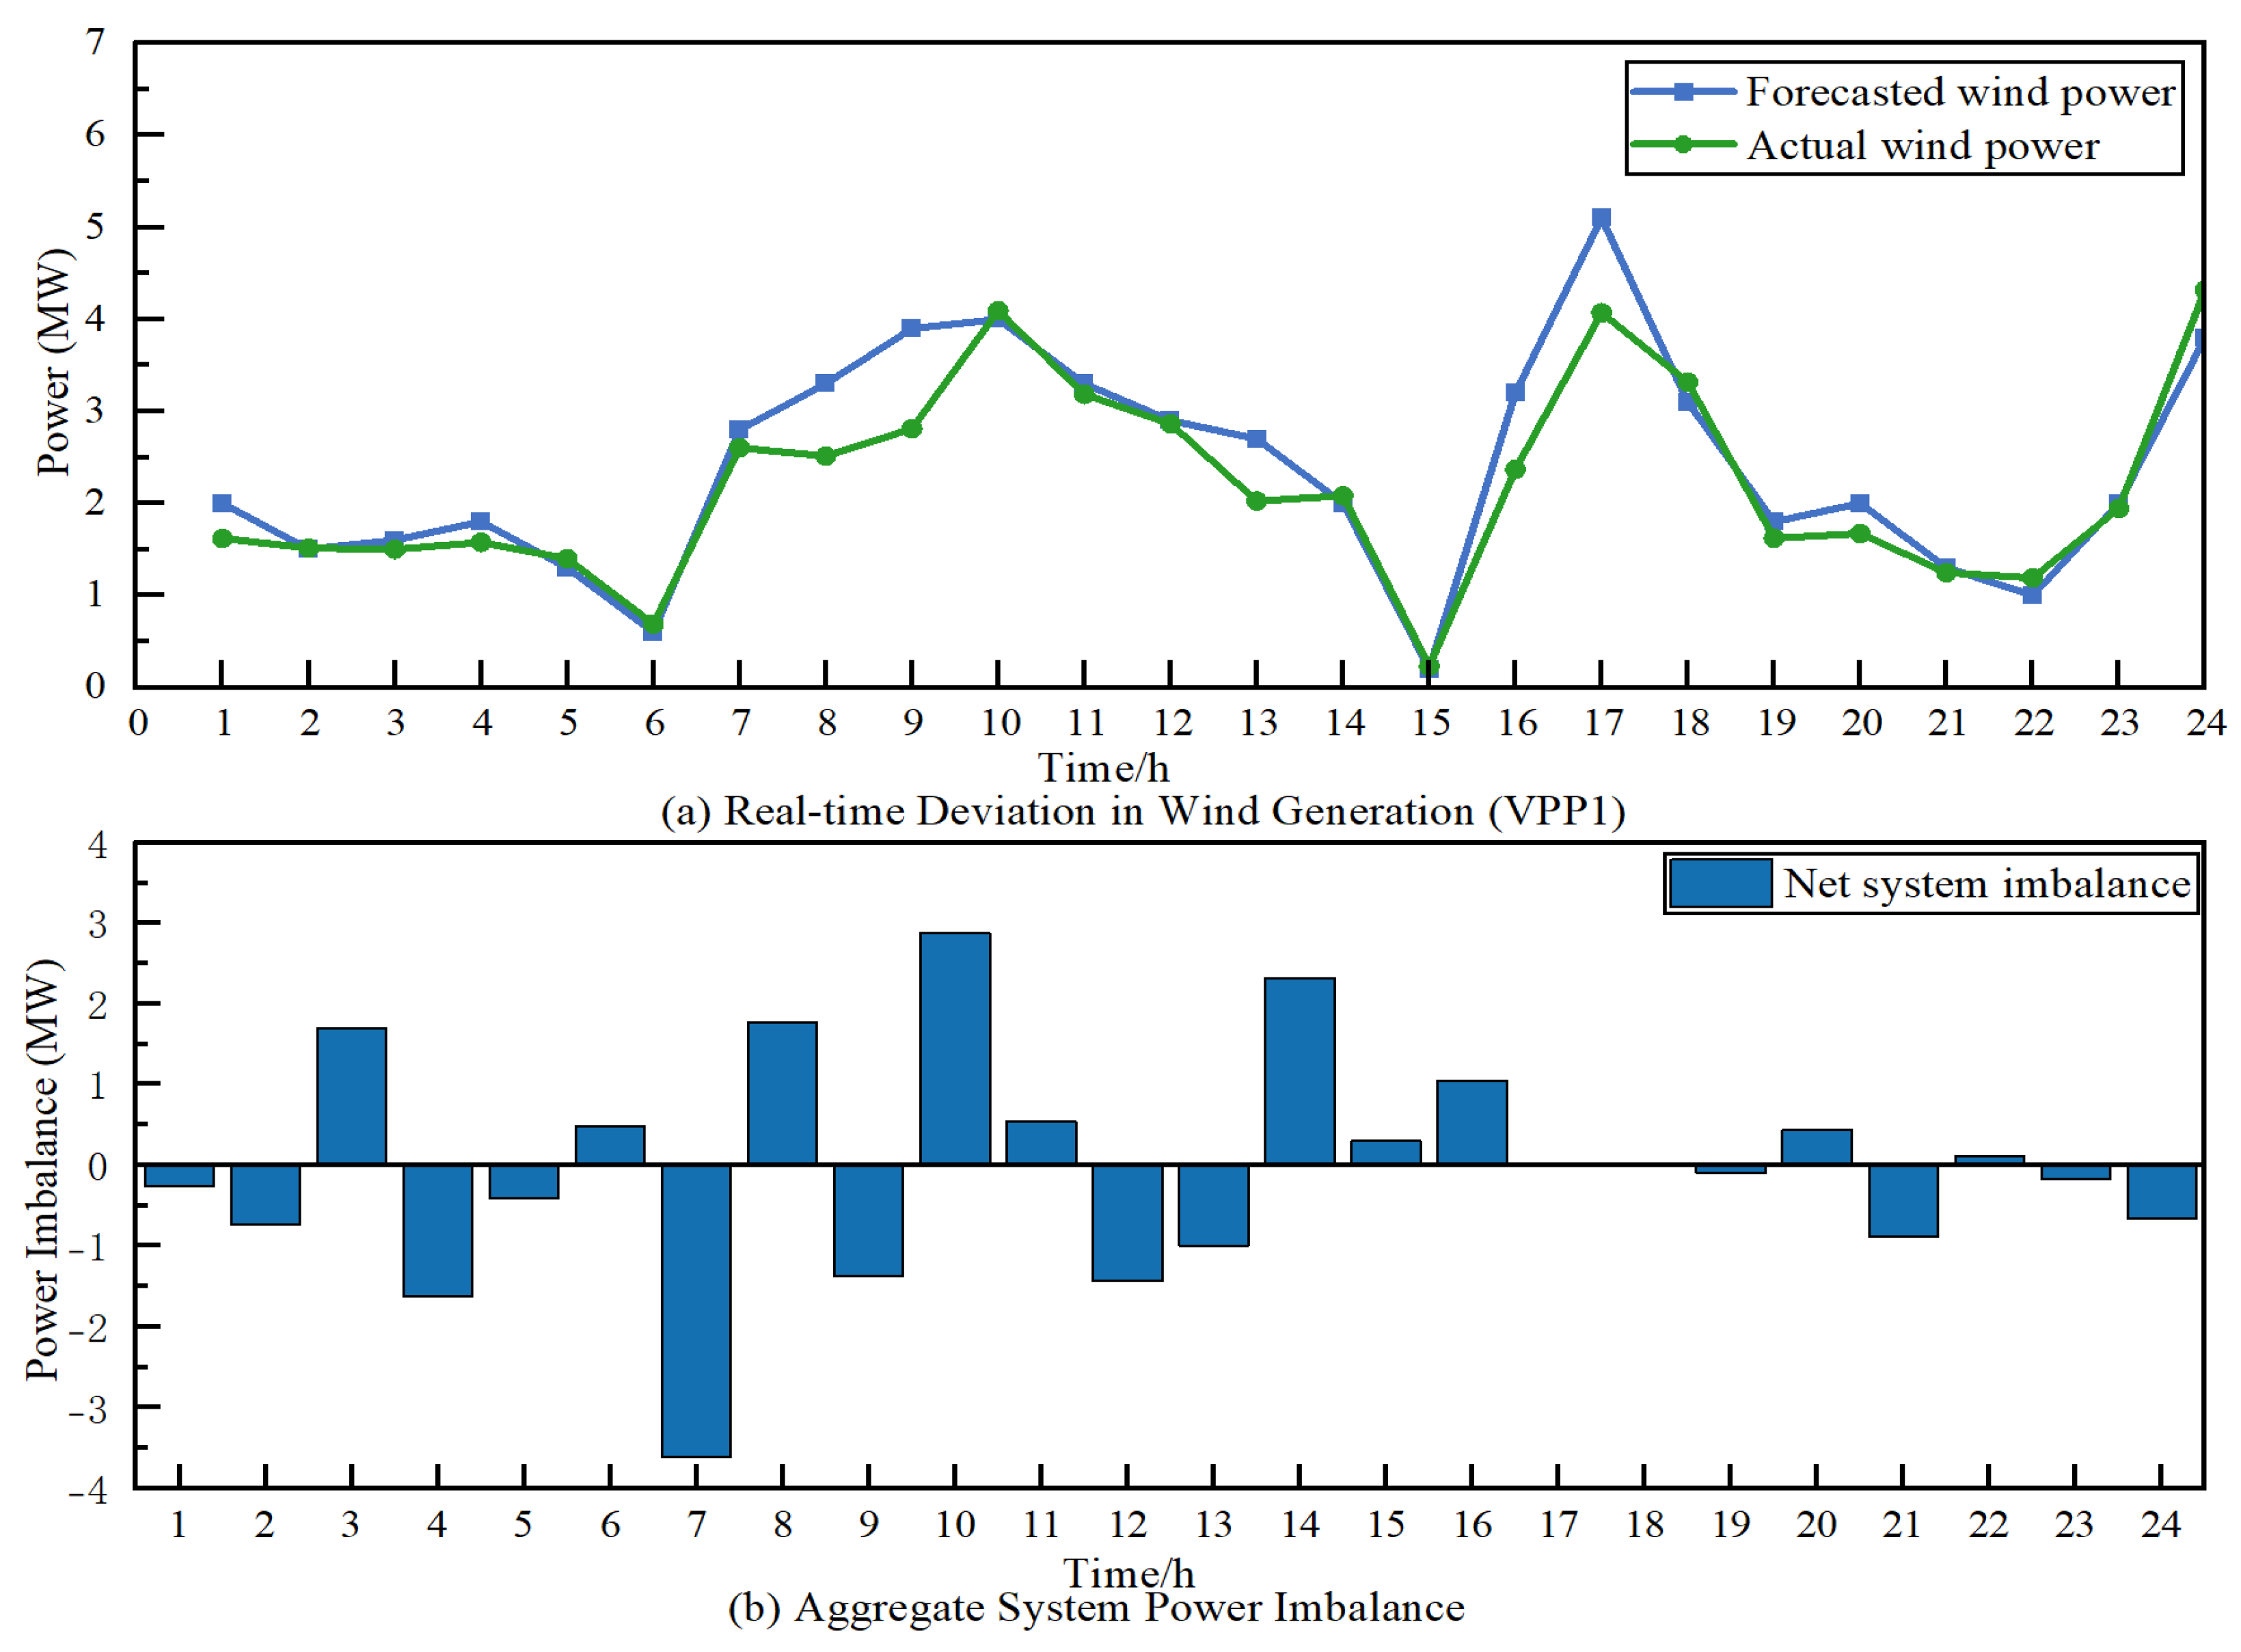
To deconstruct the physical origin of this financial risk,
Figure 8 provides a granular view of the uncertainty propagation within a single, representative simulation run.
Figure 8a visualizes the source of uncertainty by juxtaposing the forecasted wind power for VPP1 (blue line with square markers) against its stochastic real-time output (green line with circle markers). Significant deviations are observable; for instance, during hours 8–11, the actual generation was consistently below forecast, whereas at hour 15, an un-forecasted surge in wind power occurred. These discrepancies at the individual VPP level are the fundamental drivers of system-wide imbalance.
The aggregate physical consequence is illustrated in
Figure 8b, which displays the hourly net system imbalance—the algebraic sum of all VPPs’ deviations. A direct causal link is evident. The power deficit (positive bars) peaking at over 3 MW around hour 10 corresponds directly to the eriod of wind under-generation shown in
Figure 8a. This deficit necessitates the DSO to procure expensive balancing energy from the wholesale market. Conversely, the substantial system surplus (negative bar) of nearly −4 MW at hour 7 compels the DSO to sell this excess energy back to the grid, typically at a less favorable price. This figure provides a clear illustration of the mechanism through which uncertainty at the DER level translates into a tangible and costly balancing challenge for the system operator.
The financial architecture designed to manage this challenge is revealed through the decomposition of the DSO’s average revenue streams. The final average profit of 10.28 kCNY is a net result of three distinct financial flows: a planned day-ahead market revenue, the revenue from imbalance charges levied on VPPs, and the cost of physically settling the net system imbalance with the upstream grid. The profitability in this stochastic environment indicates that the implemented imbalance pricing scheme (with a penalty factor of 2.32 for shortages and a reward factor of 0.3 for surpluses) successfully establishes a risk premium that is sufficient to cover the costs of real-time balancing operations while preserving a positive profit margin for the DSO.
In summary, the comprehensive analysis of Scenario 3 validates that the proposed dynamic pricing framework, when integrated with a carefully calibrated, risk-aware imbalance settlement mechanism, is not only economically superior in deterministic environments but is also robust and profitable in the face of significant real-world uncertainty.
6. Conclusions
This paper proposed and validated a hierarchical coordination framework, modeled as a Stackelberg game, to optimize the economic and operational performance of a distribution system containing multiple VPPs and a uniquely integrated, flexible data center load. By formulating dynamic, time-varying tariffs, the DSO effectively guides the dispatch decisions of downstream VPPs, including the strategic scheduling of the data center’s computational workloads to align with renewable energy availability. The complex, high-dimensional bilevel optimization problem was rendered computationally tractable through a Kriging-based surrogate methodology.
The primary contributions of this work are substantiated by a comparative analysis across three distinct scenarios. The results confirm that the proposed dynamic pricing strategy is not only highly effective under ideal, deterministic conditions—increasing DSO revenue by 18.9% compared to a static-pricing baseline—but is also remarkably robust in the face of significant uncertainty. The introduction of a two-stage settlement market to handle a 15% standard deviation in wind power forecasts demonstrated that, with a carefully calibrated imbalance pricing mechanism, the DSO’s average revenue remains 8.1% higher than the baseline. This key finding underscores the framework’s practical value, proving its ability to manage the financial risks associated with renewable intermittency while delivering superior economic outcomes. Furthermore, the successful integration of the data center as a schedulable resource highlights a novel pathway for enhancing grid flexibility and renewable energy absorption.
While this study provides a robust validation of the proposed coordination framework, several avenues for future research are identified to enhance its practical applicability. The computational demands of the current solution method may present challenges to scalability for significantly larger networks, motivating the future exploration of more scalable, decentralized, or distributed algorithms. The analysis also concentrates on operational benefits; a comprehensive techno-economic assessment for real-world deployment would necessitate the inclusion of capital investment costs for the required advanced metering and control infrastructure. Moreover, the practical application of this framework would need to navigate the complexities of specific regional tariff policies and market rules, as the current model operates within a simplified regulatory context. Refinements to the behavioral models, such as incorporating more sophisticated agent-based simulations to capture a wider range of VPP bidding strategies or expanding the scope to include other types of flexible industrial loads, could offer deeper insights.
In conclusion, the framework established in this paper provides a solid foundation for coordinating distributed resources in modern power systems. Addressing the aforementioned research directions will further enhance its contribution to the development of efficient, resilient, and intelligent distribution networks.
