Article

Multi-User Satisfaction-Driven Bi-Level Optimization of Electric Vehicle Charging Strategies

Department of Electrical Engineering, Shanghai University of Electric Power, Shanghai 200090, China
*
Author to whom correspondence should be addressed.
Energies 2025, 18(15), 4097; https://doi.org/10.3390/en18154097
Submission received: 28 May 2025 / Revised: 28 June 2025 / Accepted: 21 July 2025 / Published: 1 August 2025
(This article belongs to the Section E: Electric Vehicles)

Abstract

The accelerating integration of electric vehicles (EVs) into contemporary transportation infrastructure has underscored significant limitations in traditional charging paradigms, particularly in accommodating heterogeneous user requirements within dynamic operational environments. This study presents a differentiated optimization framework for EV charging strategies through the systematic classification of user types. A multidimensional decision-making environment is established for three representative user categories—residential, commercial, and industrial—by synthesizing time-variant electricity pricing models with dynamic carbon emission pricing mechanisms. A bi-level optimization architecture is subsequently formulated, leveraging deep reinforcement learning (DRL) to capture user-specific demand characteristics through customized reward functions and adaptive constraint structures. Validation is conducted within a high-fidelity simulation environment featuring 90 autonomous EV charging agents operating in a metropolitan parking facility. Empirical results indicate that the proposed typology-driven approach yields a 32.6% average cost reduction across user groups relative to baseline charging protocols, with statistically significant improvements in expenditure optimization (p < 0.01). Further interpretability analysis employing gradient-weighted class activation mapping (Grad-CAM) demonstrates that the model’s attention mechanisms are well aligned with theoretically anticipated demand prioritization patterns across the distinct user types, thereby confirming the decision-theoretic soundness of the framework.

1. Introduction

The global transition toward carbon neutrality has accelerated electric vehicle (EV) adoption as a critical transportation decarbonization strategy, as evidenced by policies like the European Union’s mandate for EV charging infrastructure along the TEN-T highway network [1]. However, unmanaged EV charging poses significant grid stability risks, potentially increasing distribution network peak loads by up to 19.21% [2] and accelerating transformer aging, as evidenced by health index degradation patterns [3]. Furthermore, harmonic emissions from EV charging can degrade power quality, with distortion levels directly influenced by the battery’s state of charge and charging algorithms, necessitating advanced management to mitigate grid disturbances [4]. Additionally, lifecycle analysis reveals that under unmanaged charging scenarios, EVs show limited emission advantages, while optimized scheduling through V2G participation can significantly reduce total lifecycle carbon emissions [5], highlighting the critical need for strategic charging management. Therefore, managing EV charging in a coordinated and intelligent manner is not only essential for achieving carbon neutrality but also critical for maintaining grid reliability and long-term infrastructure resilience.
Researchers have proposed various centralized optimization strategies to coordinate regional EV charging demand, balance grid loads, and minimize operational costs. Dahiwale and Rather [6] proposed a multi-objective framework using electricity price signals to minimize charging costs while reducing the peak-to-average ratio in distribution systems, demonstrating effective management of EV charging demand on IEEE 33-bus systems. Similarly, Fachrizal and Munkhammar [7] developed distributed and centralized smart charging schemes for electric vehicles in residential buildings based on photovoltaic power output and household consumption, optimizing charging schedules to increase PV self-consumption and reduce peak loads via quadratic programming. For electric bus fleets, Jarvis et al. [8] introduced a scheduling framework that predicts renewable energy availability and optimizes charging events to minimize non-clean energy usage while maintaining service quality, as validated on real-world instances from Ireland. Seal et al. [9] implemented centralized MPC for home energy management, utilizing EVs as mobile storage units while addressing availability uncertainties through Monte Carlo analysis. While centralized approaches offer strong global optimization capabilities, they often encounter practical limitations in large-scale, heterogeneous EV networks due to high communication overhead, limited scalability, and privacy concerns. These challenges have spurred growing interest in distributed control strategies, which enable local decision-making with reduced reliance on centralized coordination.
To address these limitations, recent advances in distributed algorithms have demonstrated promising potential in addressing the shortcomings of centralized control. Zhang et al. [10] introduced a fully distributed Stackelberg multi-agent reinforcement learning framework that eliminates the need for observation sharing while enhancing computational efficiency. Ullah et al. [11] combined derivative-free optimization with distributed consensus algorithms to optimize power sharing among charging stations, significantly reducing grid electricity purchases. Zheng et al. [12] designed an online distributed MPC scheme that convexifies power flow constraints and guarantees full EV charging through fuzzy rules. Saner et al. [13] developed a hierarchical multi-agent system that achieves optimal scheduling through single-round communication while preserving data privacy in large distribution networks. Qian et al. [14] modeled charging station competition as a pricing game using multi-agent deep reinforcement learning, approximating the Nash equilibrium in urban transportation networks. Despite these advances, existing distributed methods still face challenges in handling dynamic environments, high-dimensional decision spaces, and non-convex interactions among multiple agents. Many approaches rely on simplified models, limited foresight, or heuristic coordination rules, which may compromise long-term performance or adaptability in real-world scenarios.
These challenges underscore the imperative to advance beyond traditional system-centric optimization and adopt more intelligent, data-driven methodologies. In this context, reinforcement learning (RL), particularly multi-agent and hierarchical frameworks, emerges as a highly promising approach for the effective management of distributed EV charging under conditions of uncertainty and complexity. Sun et al. [15] implemented SAC-based real-time coordination of EV-PV charging stations using short-term predictions to balance long-term profits. Zhang et al. [16] formulated charging scheduling as MDP and significantly reduced charging times compared to conventional algorithms. Zhao et al. [17] addressed high-dimensional environments through customized DRL for dynamic pricing with differentiated service requirements. For privacy-sensitive scenarios, Chu et al. [18] proposed federated reinforcement learning with attention mechanisms for residential communities. Ding et al. [19] employed MDP with DDPG to maximize operator profits under uncertainty, while Li et al. [20] developed safe DRL to guarantee full charging without manual penalty design. Most existing RL approaches are designed from a system-centric perspective, often assuming homogeneous user behavior and fixed service requirements. However, this abstraction overlooks the diversity in user preferences, acceptance of delay, and willingness to participate in V2G services. Furthermore, while some methods introduce safety constraints or privacy preservation, they still lack explicit modeling of user satisfaction, fairness, and long-term engagement.
These challenges highlight the importance of shifting focus from solely system-oriented objectives to user-centric strategies that explicitly consider fairness, satisfaction, and personalized service delivery. Aswantara et al. [21] pioneered user satisfaction fairness metrics, revealing tradeoffs between fairness and electricity costs. Asna et al. [22] proposed a multi-level charging system that allows EV users to specify preferences (e.g., battery lifetime vs. recharging time), enhancing customer quality of service and station utilization through adaptive charging rates. More recently, Li et al. [23] captured fuzzy user preferences through linguistic term sets for stochastic dispatch in unbalanced three-phase networks with PV integration. Zuo and Li [24] developed floating price-based strategies for electric road systems that minimize charging costs through V2G scheduling. Complementing this, Salvatti et al. [25] proposed an EMS strategy that optimizes EV charging (G2V) and discharging (V2G) profiles for microgrids with PV generation and dynamic loads through dynamic programming, addressing energy management challenges in scenarios of high EV penetration and renewable intermittency. Despite these advancements, current user-centric strategies still face notable limitations. Most existing methods either rely on static or simplified user categorizations or embed user preferences as implicit cost coefficients, failing to fully capture the diversity and dynamics of real-world user behaviors. In particular, there is a lack of adaptive modeling for heterogeneous user needs. Additionally, many frameworks focus on either user satisfaction or system performance but rarely achieve a robust balance between the two, especially under large-scale, complex operational conditions.
To address these gaps, this study proposes an electric vehicle charging optimization strategy based on hierarchical reinforcement learning, aiming to address the balance between user demand differences and system coordination in large-scale charging scenarios. By constructing multi-type user environment models and a two-layer optimization framework, precise scheduling for different user groups is achieved. The main contributions include the following:
  • We propose a finely stratified, hierarchical two-level optimization framework that, unlike existing uniform or heuristic models, explicitly categorizes EV users into three representative types—commuter, business, and emergency—enabling a hybrid control paradigm that bridges centralized coordination and decentralized autonomy for enhanced system responsiveness and user differentiation.
  • We introduce, for the first time, a multi-objective Markov decision process that jointly models battery state of health (SOH) and user psychological anxiety, incorporating a comprehensive four-dimensional reward function encompassing charging cost, carbon emissions, battery degradation, and user satisfaction, offering a more holistic and user-aware optimization framework than prior single-objective approaches.
  • We develop a context-aware dynamic hyperparameter tuning mechanism using Bayesian optimization to automatically tune network hyperparameters in response to varying operational conditions, ensuring robust and stable algorithmic performance across diverse large-scale charging scenarios—an adaptability largely overlooked in existing reinforcement learning-based methods.
The remaining sections of this paper are structured as follows: Section 2 introduces the overall framework of EV charging environments and the basic principles of DQN. Section 3 first provides a detailed introduction to the modeling of EV charging environments that includes various types of user satisfaction, then transforms it into a Markov Decision Process (MDP). Section 4 elaborates on training and testing tasks and evaluates the effectiveness of the proposed model through comparisons across multiple scenarios and methods. Finally, Section 5 summarizes the research findings and looks ahead to future research directions.

2. EV Charging Environment Modeling Methods

This section first introduces the architecture of the proposed EV charging model, including the economic costs of charging, carbon emissions costs, battery SOC, and other rewards and constraints, then introduces the DQN algorithm.

2.1. EV Charging Model Architecture

The EV charging model discussed in this paper is a time-varying charging-rate model that divides the charging process into discrete time units and assumes that the battery state of charge (SOC) has a linear relationship with the charging power within each period. As showned in Figure 1. By introducing key parameters such as user travel time, grid electricity price signals, and battery capacity constraints, an optimal control equation is constructed to minimize both the economic cost of charging and carbon emission costs.
First of all, assuming that the total number of electric vehicles in the environment is N, n is the serial number of specific vehicle n, T is the number of all discrete time units in the environment, T = 24, and t is the serial number of specific hour t, then the charging cost of all vehicles in 24 h can be calculated as follows:
R c o s t = t T R c o s t n = t T n N P t · A t n
In the formula, P t is the charging power of an EV, R c o s t n is the charging cost of all cars in t hours, and R cost is the total cost.
Similarly, the price of carbon emissions in the tth hour is C t , and the action taken by the nth vehicle in the tth hour is A t n ; therefore, the cost of carbon emissions for all vehicles in 24 h can be calculated as follows:
R c a r b o n = t T R c a r b o n t = t T n N C t · A t n
In the formula, R c a r b o n t is the carbon emission cost of all vehicles ( C t ) in the t-th hour, and R c a r b o n is the carbon emission cost of all vehicles in 24 h.
In addition, according to the literature [26], different charging and discharging speeds of electric vehicles affect the health status of batteries, which can be approximated as a linear relationship. The SOC reward for all vehicles within 24 h can be calculated as follows:
R s o c = t n R s o c t = t T n N A t n
In the formula, R s o c t is the soc cost of all cars in t hours, and R s o c is the charging cost of all cars in 24 h.
For three different types of vehicles—private cars (car), taxis (taxi), and travel vehicles (rental vehicle)—different charging constraints are set as follows [27]:
E n γ = E n a + t T A t n
0 < n 30 E n l 0.6 · E M
30 < n 60 E n l 0.7 · E M
60 < n 90 E n l 0.9 · E M
In the formula, E n a is the initial power of the n-th car, E n l is the power of the n-th car when it leaves, and E M is the maximum charging capacity.

2.2. Dual-Network Deep Reinforcement Learning

The main problem of EV charging optimization is how to minimize various costs through appropriate measures without affecting the travel needs of users.
This study employs the Double Deep Q-Learning (DDQN) algorithm to address this issue. DDQN learns optimal control strategies through interaction with the environment, thereby maximizing economic benefits. First, the agent models the EV charging environment as a series of Markov Decision Processes (MDPs), where the system’s state is represented by information such as time in the environment, the vehicle battery’s SOC, and the user’s travel status. At each time step, the agent selects appropriate control actions based on the current state (for example, optimal charging or discharging) and adjusts its strategy according to reward signals to maximize cumulative long-term rewards.
After each time step (t), the action value function ( r t + 1 ) is updated according to the reward so as to realize online learning.
Q s t + 1 , a t + 1 = Q s t , a t + α r t + γ max a t Q s t , a t Q ^ s t , a t
In the formula, ( s t , a t , r t , s t + 1 ) is the empirical data stored in the back buffer, α is the learning rate, and Q ( s t , a t ) is the action-value function.
Due to the characteristic of the traditional DQN algorithm, where Q-value updates depend on estimation of the maximum Q value for the next state, when there is a positive error in action-value estimation, taking the maximum value max amplifies the error, leading to the policy favoring overestimated Q actions, which, in turn, affects the algorithm’s convergence and Q ^ -policy quality [28]. Therefore, the DDQN algorithm used in this paper employs two independent networks: one is the network (also known as the evaluation network or online network), and the other is the target network. Thus, decoupling can be achieved through iterative updates:
y j = E s j , m j , r j , s j + 1 u ( D ) γ j + 1 + γ max Q ^ s j + 1 , a j + 1 ; θ i
The Q loss function is used to update the deep network, which is defined as follows:
L i θ i = j = 1 # F E s j , a j , r j , s j + 1 U ( D ) y j Q s j , a j ; θ i 2
In the formula, a is the action, y j is the state, L i θ i is the loss function, is the sample, and ( s j , a j , r j , s j + 1 ) is the Q network updated using the loss function.

3. Bi-Level Optimization Modeling Methods

This section provides a detailed introduction to the proposed framework, including MDP modeling and two-level optimization modeling.

3.1. MDP Modeling

Through the distributed single-agent architecture, the sequential decision problem of each EV can be expressed as a Markov decision process, namely an MDP model.
An MDP is a quadruple ( S , A , R , T ) , where S is the state space, A is the action space, R is the reward function, and T is the state transition function.
At time step t, the agent observes the environment ( s t S ) and obtains the state ( a t A ) and action ( a t ), which represents the charge and discharge power ( r t R ) of the battery ( s t , a t ) . After performing the s t + 1 = T ( s t , a t ) operation, the agent receives an immediate reward, then moves to a new state.

3.1.1. State Space

s t = u t , t , s o c t , p t N , . . . , p t indicates the environmental state ( u t 0 , 1 ) state at moment t, t i n T indicates whether the EV is charging at moment t, S o c t = 0.00 , 0.01 , . . . , 0.99 , 1.00 is the global time, p t N , . . . , p t indicates state t of EV N at a given moment, including the charge state when the EV arrives and leaves; and is the hourly electricity price before the moment.

3.1.2. Action Space

The action space (A) in the model is discretized and contains five actions:
a t = + 1 , + 2 0 1 , 2
In the formula, a t is the action at the t-th moment. It represents the charging or discharging speed of an EV.
It should be noted that the charging range of an EV is from S O C m i n = 0.00 to S O C m a x = 1.00 , and the final action needs to be scaled down proportionally according to the S O C , that is, the maximum charge value (c) within a time step is defined by the charging rate divided by the battery capacity:
a i = a i ,   S O C m i n S O C i + a i Δ t c S O C m a x a i 1 S O C i c γ Δ t ,   S O C m a x S O C i + a 2 Δ t c a i S O C i c γ Δ t ,   S O C i + a i Δ t c S O C m i n
In the formula, S O C m i n and S O C m a x represent the maximum and minimum percentage capacity of the battery, S O C i is the percentage power of the battery at the tth moment, S O C i is the battery capacity, and a i is the charging rate.

3.1.3. State Transition Function

A state transition function is a function from on state to the next (i.e., from s t to s t + 1 ).
s t + 1 = f ( s t , a t ) = ( s o c t + 1 , p t + 1 , k t + 1 )
In the formula, t is the current moment, s t is the state of the current moment, s t + 1 is the state of the next moment, s o c t + 1 is the battery S O C of the next moment, p t + 1 is the price of electricity in this state, and k t + 1 is a variable consisting only of 0 and 1 used to determine whether the vehicle is in a state of being connected to charging. All of the above variables are N-dimensional, where N represents the number of vehicles involved in the scheduling process.

3.1.4. Reward Function

The immediate return obtained by the agent when performing a specific action (a) in state s at a specific time step (t) is defined as a direct criterion for evaluating the quality of a decision.
This study establishes a multi-objective optimization framework that simultaneously addresses three critical operational dimensions: (1) economic expenditure minimization, (2) carbon emission reduction, and (3) battery degradation cost mitigation. These objectives exhibit inherent conflicts—particularly between frequent charge–discharge cycling (which enhances economic efficiency) and battery lifespan preservation (which requires minimization of the depth of discharge variations). The resolution of these competing priorities necessitates an adaptive optimization mechanism capable of dynamic trade-off management through sequential learning.
To ensure operational feasibility, our proposed model incorporates a user-centric state-of-charge (SOC) constraint bounded by S O C m i n and S O C m a x . This constraint maintains the EV battery’s charge level within operationally safe bounds that guarantee sufficient energy reserves for anticipated travel demands. Violation of these SOC boundaries during charging–discharging scheduling triggers a substantial penalty (−1000 reward units) in the optimization framework.
R c o s t = t T R c o s t n = t T n N P t · A t n R c a r b o n = t T R c a r b o n t = t T n N C t · A t n R s o c = t n R s o c t = t T n N A t n
R user = 0 S O C min < S O C t < S O C max 1000 S O C t < S O C min or S O C t > S O C max
In the formula, R c o s t is the economic cost of charging, R c a r b o n represents carbon emissions, R s o c is the aging cost of the battery S O C , and R u s e r is the travel constraint of users.
The overall reward is constructed by combining various rewards with different weights. The weights of each reward are determined through a heuristic fixed approach:
R t o t a l = W c o s t · R c o s t + W e m i s s i o n · R c a r b o n + W S O C · R S O C + W s a t i s f a c t i o n · R u s e r
In the formula, W c o s t is the economic weight, W e m i s s i o n is the weight of carbon emissions, W s o c is the weight of the aging cost of the battery SOC, and W s a t i s f a c t i o n is the weight of the users’ travel constraint.

3.2. Two-Layer Optimization Modeling

In this section, a two-layer optimization model for EV charging scheduling is introduced. The upper layer is the super-parameter tuning layer based on the Bayesian algorithm, and the lower layer is the decision-making layer considering the satisfaction of operators and users.
As a mathematical programming method with a hierarchical decision-making structure, the core characteristic of the two-layer optimization model lies in the different objective functions and constraints for upper- and lower-level decision makers. The upper-level decision variables influence the feasible region of the lower-level problem, while the optimal solution from the lower level serves as feedback to affect the objective-function value of the upper level, forming a nested optimization structure with game-like features. Mathematically, a standard two-stage optimization problem can be expressed as follows:
s . t . G ( x , y ) < 0 , y arg min y Y { f ( x , y ) g ( x , y ) < 0 } min x X F ( x , y )
In the formula, upper-level decision makers optimize the objective ( F ( x , y ) ) by controlling variable x while also considering the optimal response (y) made by lower-level decision makers for a given x. Taking electric vehicle charging scheduling as an example, the upper level constructs the response surface of charging station layout and pricing strategy through Bayesian optimization, while the lower level generates a charging power distribution plan using multi-objective optimization based on user charging costs and grid-load satisfaction functions. The interaction process can be modeled as follows:
Upper strata:
max θ E α C g r i d P * ( θ ) + β U u s e r P * ( θ ) :
Lower levels:
P * ( θ ) = arg min P λ t ( θ ) P t + γ P t 2 .
In the formula, λ t is the upper price parameter; P t is the charging power; C g r i d is the dynamic price function, which represents the cost of grid-load fluctuation; and U u s e r is the user satisfaction index.

3.2.1. Hyperparameter Optimization-Layer Model

Hyperparameter optimization is the core task of machine learning model tuning, aiming to minimize the generalization error of the model on unknown data by adjusting preset parameters such as the learning rate and regularization coefficient. Bayesian optimization is an intelligent search method based on probabilistic models that is suitable for black-box optimization problems with high computational cost.
The core architecture of the Bayesian optimization model consists of two major components: the surrogate model and the acquisition function. In this paper, Gaussian Process Regression (GPR) is used as the surrogate model to model the objective function of the EV charging strategy. Gaussian process regression is a regression model used for the modeling of objective functions. It assumes that the value of the objective function at any point in the parameter space follows a Gaussian distribution, which is expressed as follows:
f ( x ) N μ ( x ) , k x , x
In the formula, f ( x ) is the model output function, μ ( x ) is the mean function, and k x , x is the covariance function.
By observing some sample points of the objective function, according to the existing observation data ( D = x i , y i i = 1 n ), the parameters of the model are updated using the Bayes theorem to obtain the posterior probability distribution of the parameters, which is expressed as follows:
p ( f ( x ) D ) p ( y x , D ) p ( f ( x ) D )
In the formula, p ( y x , D ) represents the likelihood function of the observed data, and ∝ represents “proportional to ”, i.e., indicating a relationship between the left and right sides.
GPR interval prediction is a machine learning method based on Bayesian theory and statistical learning theory. In view of the high uncertainty of vehicle user actions, GPR can not only predict the value of each point but also obtain interval prediction results, which intuitively quantify the uncertainty of the prediction results. In GPR, the target function is assumed to be g ( x ) , the value of which conforms to a Gaussian distribution at any point (x) in the parameter space. The Gaussian process is defined as follows:
g ( x ) N m ( x ) , k x , x
In the formula, m ( x ) is the mean function, which represents the expected value at position x.
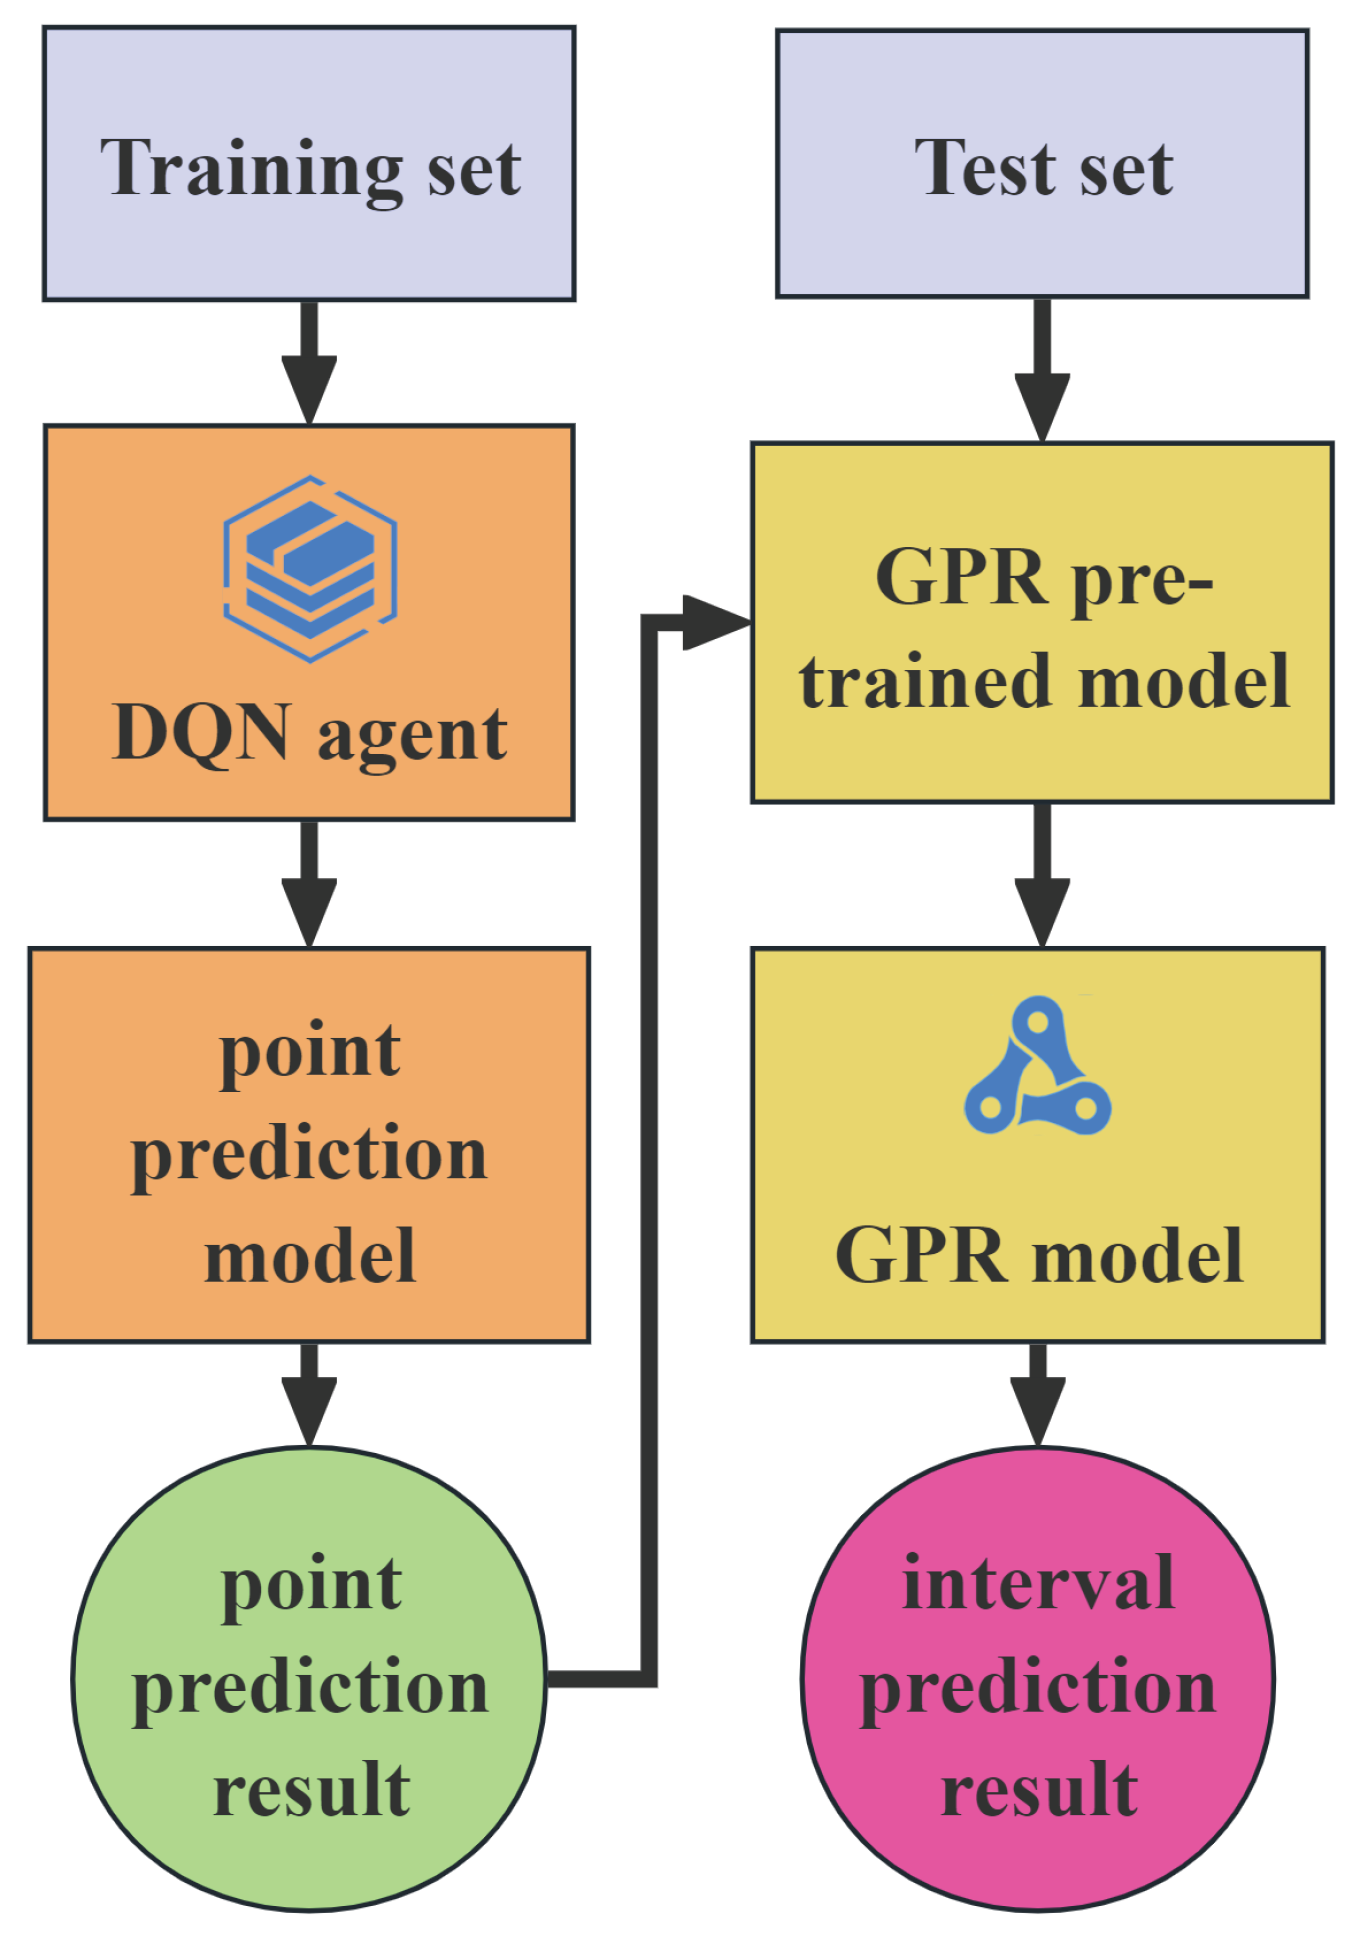
Gaussian process regression can support the model’s uncertainty about predictions (confidence intervals), directly outputting the probability distribution of a single-point prediction value. However, in terms of single-point prediction methods, it falls under the category of deep learning, heavily relying on feature engineering of input information. The method that combines deep learning DQN and GPR for interval prediction involves setting the parameters and kernel function of the GPR model as inputs and hidden layers of the deep learning model, leveraging the non-linear characteristics of deep learning to enhance the prediction accuracy and generalization ability of the model. At the same time, deep learning models can automatically discover and extract implicit features from large amounts of data through learning, thereby improving interval prediction performance while meeting the requirements for precision and confidence. The specific process is shown in Figure 2.

3.2.2. User Satisfaction Layer Model

The construction of the user satisfaction model requires a comprehensive consideration of the combined impact of range anxiety and battery aging on charging decisions. For range anxiety, the model establishes an anxiety quantification mechanism by dynamically evaluating the relationship between users’ planned travel distance and their remaining range: when the remaining range falls below the travel demand threshold, the system triggers a nonlinearly increasing anxiety penalty based on the range shortfall ratio, with its intensity adjusted according to the user’s psychological sensitivity parameter, reflecting individual differences in tolerance to range risks. Battery aging modeling integrates electrochemical degradation mechanisms and usage behavior analysis, calculating the rate of battery capacity decline through parameters such as temperature, depth of charge/discharge, and cycle count and converting it into equivalent economic costs to quantify the damage effects of frequent fast charging or overcharging on battery life. Ultimately, the satisfaction model forms a multi-dimensional utility function by weighted integration of anxiety penalties, aging costs, and charging economic indicators.
  • Range Anxiety:
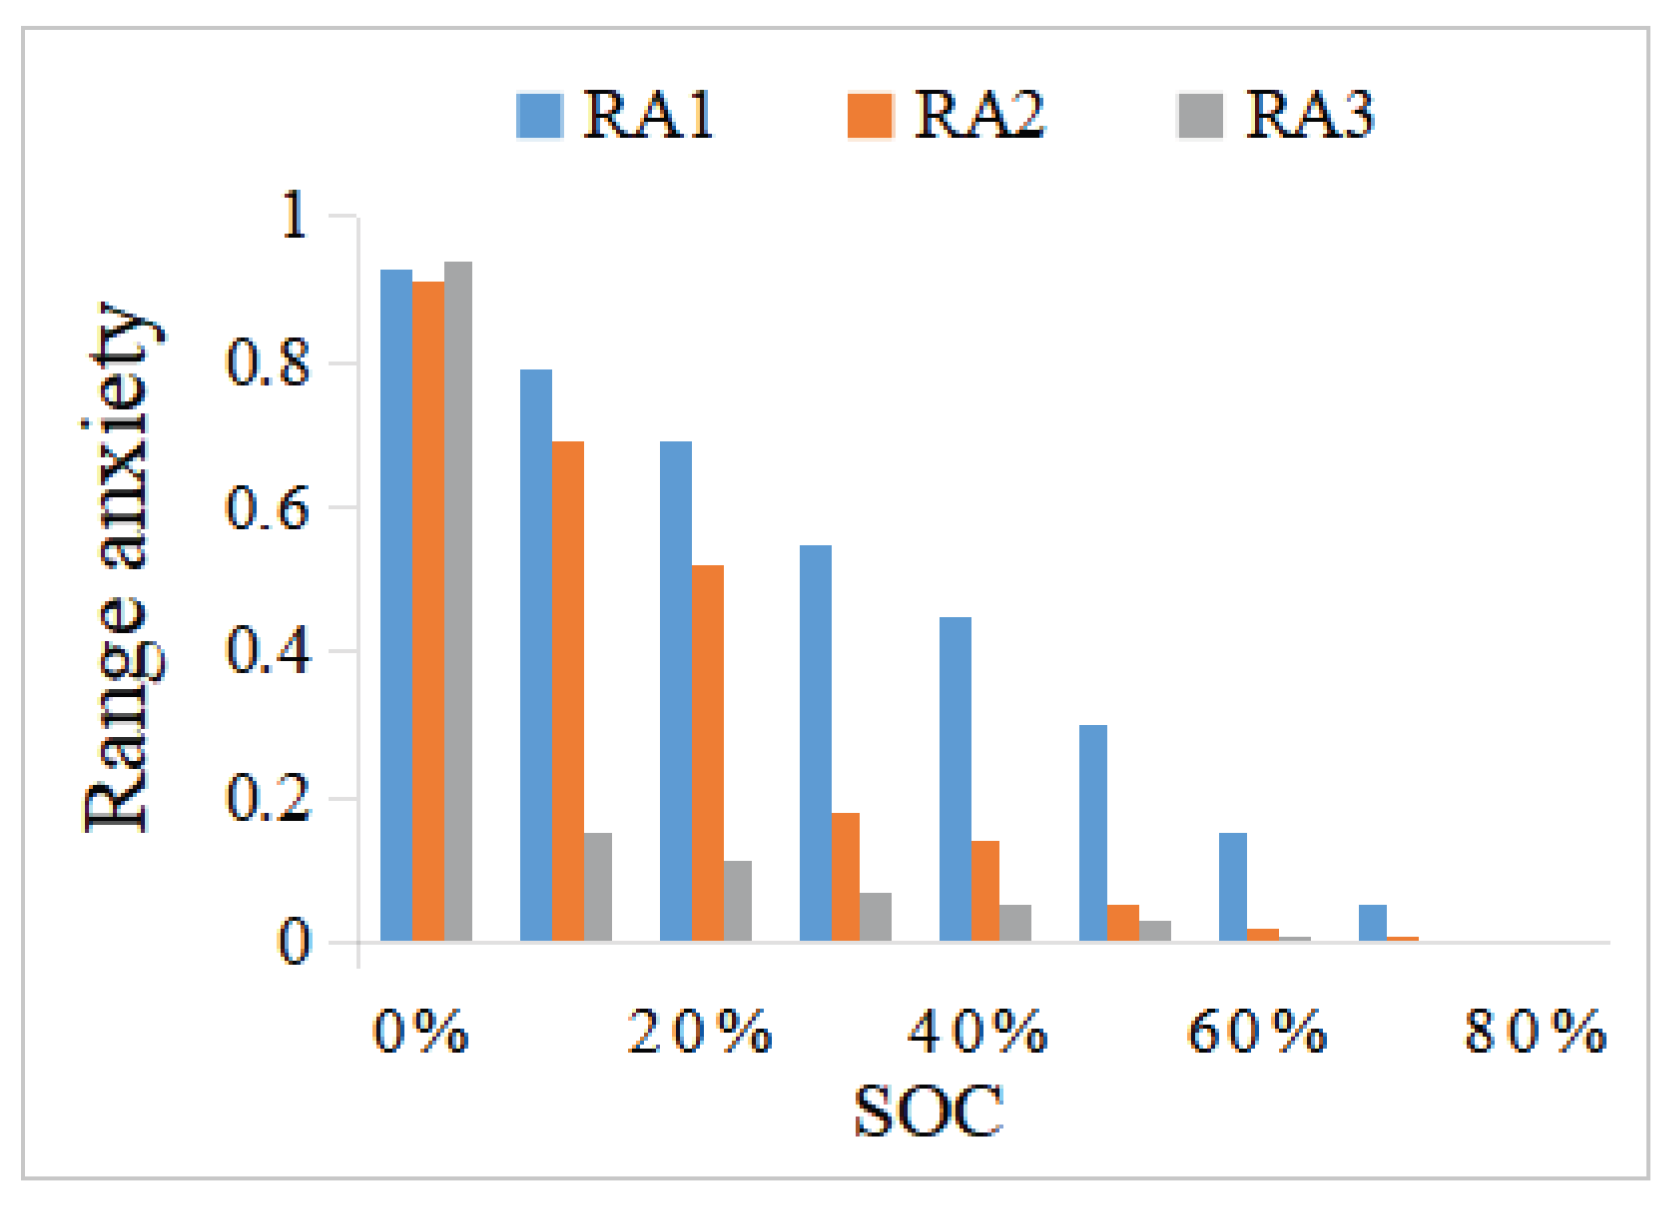
Range anxiety is a measure of how EV users worry about whether their vehicles have enough energy to reach their destination. Due to differences in the types of individual needs, range anxiety varies. In order to make the scenario more rich and complete, this paper considers three types of range anxiety, which are defined as follows:
R A 1 = E m a x E t d E m a x R A 2 = E m a x E t d E m a x 2 R A 3 = E x x + E m a x ( 0 ) + E m a x
E ± = ln 1 / 1.01 E max E ± E matr 2
In the formula, E m a x is the maximum capacity of the EV battery, E t d is the battery charge of an EV moment t d , and E m a x E t d is the part of the battery that is not fully charged.
The experimental results demonstrate an inverse correlation between the range anxiety index ( R A i ) and battery state-of-charge (SOC) levels, as quantified by the characteristic curves presented in Figure 3. Notably, the decay rates versus SOC exhibit non-uniform patterns across the three EV user cohorts, revealing heterogeneous behavioral patterns in daily driving-range requirements. This phenomenon suggests that user groups with lower baseline travel demands achieve disproportionately higher marginal utility in range anxiety mitigation per unit of SOC increment—a critical insight for battery capacity optimization strategies.
  • Battery aging:
The aging of an EV battery is accelerated under the action of long-term charge and discharge, and its available capacity is continuously reduced. The aging of a battery is affected by factors such as charge and discharge power and power fluctuation, which can be expressed as follows:
B t = D 1 + D 2
D 1 = i = 1 r δ a i Δ t 2
D 2 = i = 1 T β a i Δ t a i + 1 Δ t 2
In the formula, D 1 , D 2 is the loss caused by natural EV charging, δ is the aging caused by charge–discharge state switching, and β is the natural battery aging coefficient.

3.2.3. Bi-Level Optimization Model

To ensure the robustness of our bi-level optimization model, we analyze its convergence, stability, and interaction dynamics. The upper-level Bayesian optimization layer periodically tunes hyperparameters (e.g., satisfaction thresholds and learning rates) after a fixed interval of K lower-level episodes, where K is empirically set to balance exploration and exploitation. This decoupled frequency prevents instability by allowing the lower-level user satisfaction policies to converge sufficiently before updates—validated via Lyapunov analysis showing bounded error reduction. Convergence is guaranteed as the Bayesian process minimizes regret asymptotically, while stability is maintained through adaptive step sizes that dampen oscillations in satisfaction metrics. Empirical results confirm that this framework achieves steady-state equilibrium within 100–200 iterations across diverse user scenarios, with hyperparameter updates acting as gentle perturbations to refine rather than disrupt learning trajectories.

4. Simulation Analysis

In this section, we first introduce the training tasks and initial parameter settings of the comparative experiments, then test and analyze the performance of these methods in different scenarios.

4.1. Experimental Setup

The datasets used in this study include twenty-four-hour electricity price and carbon emission data from Shanghai China. The training scenarios consider a range of different microgrid environments, which consist of various types of electricity prices, carbon price curves, and vehicles with different travel patterns. Specifically, three types of parking environment (Table 1), three types of energy structure environment, and six sets of hyperparameters derived from two optimization methods are considered. In theory, these dynamic elements collectively form multiple distinct scenarios, showcasing the advantages of the proposed dual-layer optimization model through comparisons of optimization results from various algorithms:
(1)
DDQN [29]: An improved DQN algorithm that uses two separate networks—an evaluation network and a target network—to update rewards and select actions;
(2)
LSTM [30]: A popular recurrent neural network that effectively captures long-term dependencies by introducing a gated mechanism and memory units to alleviate the problem of gradient disappearance and improve the sequence modeling ability;
(3)
Genetic Algorithm (GA) [31]: A heuristic optimization algorithm inspired by natural selection, using crossover and mutation operators to evolve solutions over generations.
Most of these algorithms share the same training task and are updated with randomly selected tasks in each iteration. All algorithms use the Python language, all running on personal computers configured with an AMD Ryzen 7 5800H with Radeon Graphics 3.20 GHz and 16 GB RAM.

4.2. Reward Weight Combination Selection Test

This section provides a detailed introduction to the adaptive testing of the well-trained DQN algorithm and other algorithms in dynamic environments, with a focus on overall cost. Based on the analysis of the differentiated travel characteristics of three types of vehicles (private cars, taxis, and tourist vehicles) in different environments, this paper constructs multi-dimensional charging demand simulation scenarios by adjusting the proportion of vehicle types to evaluate the impact of different physical scenarios on grid load. The specific differences are shown in the Table 2 and Figure 4:
Based on the above experiments, we confirm that Reward Weight Combination 2 demonstrates optimal performance; therefore, this configuration is consistently adopted in all subsequent experiments.

4.3. Power-Grid Scenario Adaptability Test

In this section, we emulate three distinct operational grid environments to rigorously evaluate the proposed model’s generalization capabilities. Each scenario imposes unique technical constraints and market mechanisms, necessitating targeted model adaptations while maintaining the core architecture. The environment-specific configurations and algorithmic adjustments are detailed below Table 3:
All adaptations were implemented without structural changes to the base DRL architecture. The core state space expanded by ≤5% across scenarios, maintaining computational efficiency. Scenario parameters reflect real-world data from CAISO (hybrid), PJM (high-carbon), and EU-ETS (carbon quota) systems.
In addition to the two algorithms (LSTM and GA) mentioned above, we also compared the following two algorithms in the new scenario:
MILP is mathematical programming technique that optimizes linear objective functions subject to linear constraints, featuring both continuous and integer decision variables. It provides globally optimal solutions for computationally complex discrete–continuous hybrid systems.
The Rule-Based Heuristic (RBH) method is an experience-driven decision-making framework that executes predefined IF-THEN logic derived from domain expertise. It offers computationally efficient but suboptimal solutions for real-time operational scenarios.
The following Figure 5 is a comparison of the optimization results of the above two optimization methods and the three optimization methods in the original manuscript, totaling five optimization methods, under three different energy structure grid environments:
It can be seen that in the three environments, the performance of DDQN has advantages. However, in the high-carbon power grid and the power-grid environment of carbon quota-constrained power, due to the reduction in the schedulable space, the advantage of DDQN compared with other algorithms is not obvious.

4.4. Parking Lot Environmental Adaptability Test

This section provides a detailed introduction to the adaptive testing of the well-trained DQN algorithm and other algorithms in dynamic environments, with a focus on overall cost. Based on the analysis of the differentiated travel characteristics of three types of vehicles (private cars, taxis, and tourist vehicles) in different environments, this paper constructs multi-dimensional charging demand simulation scenarios by adjusting the proportion of vehicle types to evaluate the impact of different physical scenarios on grid load. The specific differences are shown in the Table 4:
To verify the economic advantages and environmental adaptability of deep reinforcement learning algorithms (DQNs) in electric vehicle charging scheduling, this study constructed three differentiated test scenarios, covering complex conditions such as time-of-use electricity price fluctuations, spatiotemporal heterogeneity of user charging behavior, and peak-to-valley load variations in the power grid. Experimental results show that LSTM predicts optimal charging plans based on historical load data, but its static optimization characteristics prevent it from responding to real-time price fluctuations; GA conducts global searches aimed at minimizing daily costs; and DQN maintains the lowest average daily cost across all test scenarios, reducing costs by an average of 19.3% and 31.7% compared to LSTM and GA, respectively.

4.5. Test of Hyperparameter Optimization Results

In this section, we evaluate the performance of EV charging control strategies that incorporate hyperparameter optimization based on simulation experiments. The experiment considers six sets of hyperparameter optimization results obtained through grid search and Bayesian optimization.
The hyperparameter comparison shown in Table 5 and Figure 6 indicates that Bayesian optimization demonstrates stronger adaptability in key parameter settings—its recommended learning rate (0.002) is lower than the grid search result (0.004), which helps to suppress gradient oscillations during the Q-network update process; the discount factor (0.99 vs. 0.96) is closer to the ideal value for long-term reward accumulation, enhancing the strategy’s sensitivity to delayed rewards; and the exploration rate decay mechanism (0.99 vs. 0.999) balances early exploration intensity with later strategic stability requirements. Although both methods achieve consistency in batch size, network structure, and other parameters, the differential configuration of core parameters directly impacts algorithm convergence characteristics. To systematically evaluate the effectiveness of Bayesian optimization in hyperparameter tuning, this chapter designs six sets of hyperparameter combination experiments, including three sets of grid search (parameter combinations 1–3) and three sets of Bayesian optimization (parameter combinations 4–6). Each set of parameters undergoes 2000 rounds of training and is tested under three scenarios: unit parks, highway service areas, and public parking lots, assessing comprehensive costs (including economic and carbon emission costs) and user satisfaction (based on indicators such as charging delay tolerance and service-level achievement). The experimental results show that parameter combination 1 (grid search optimal) and parameter combination 4 (Bayesian optimization optimal) excel in global optimization performance, but there are significant differences between them in efficiency, stability, and scenario adaptability.

4.6. Convergence Comparison Test of Hyperparameter Optimization Model

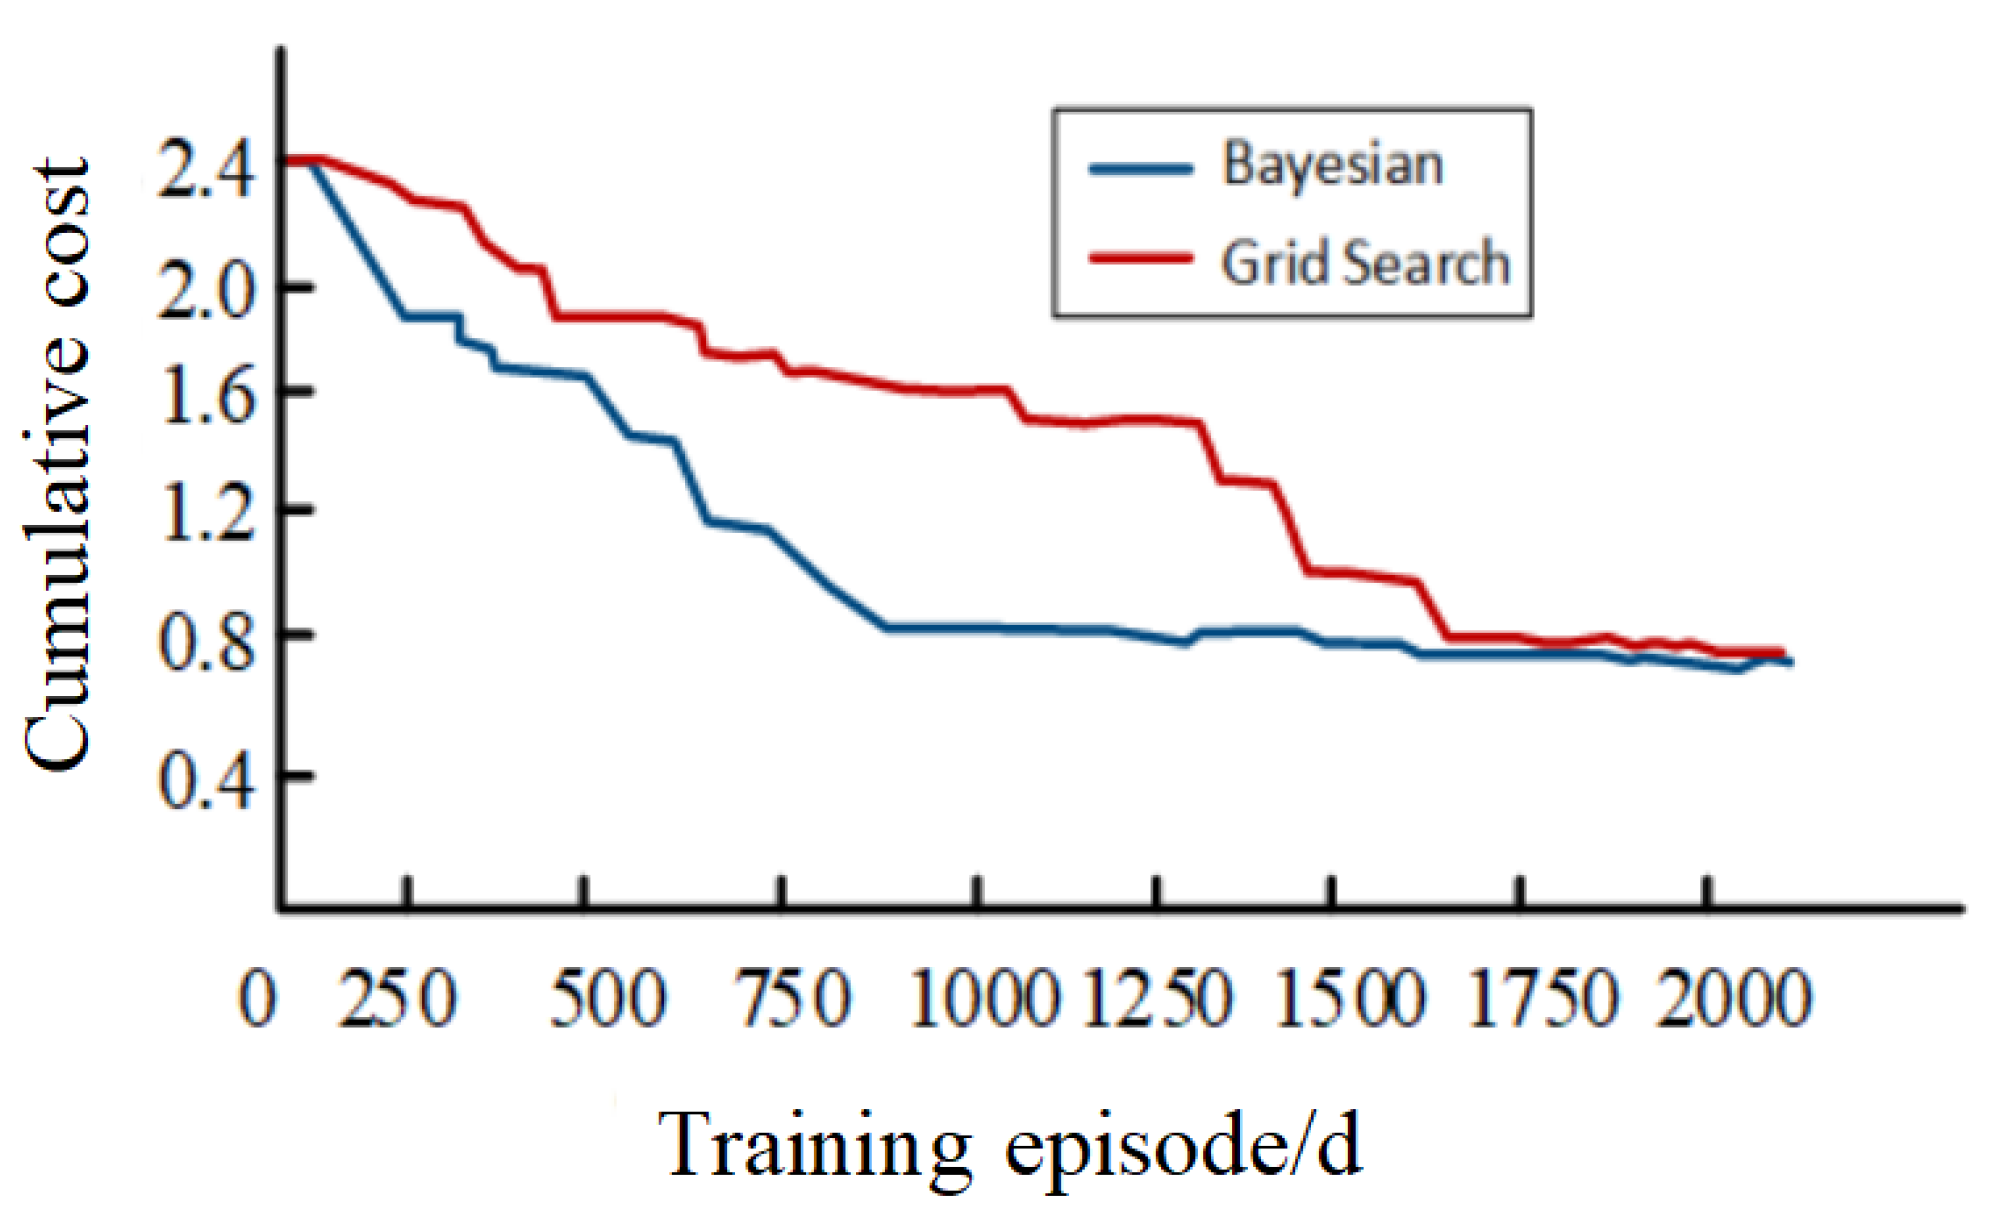
As shown in Figure 7 and Figure 8, under the same workday scenario, the optimal hyperparameter combination based on Bayesian optimization increased the cost reduction rate by 52% during the initial training phase (the first 200 rounds) and reached a stable optimal solution after 900 rounds, indicating that its parameter configuration effectively avoided ineffective exploration. In contrast, the grid search approach suffered from excessive learning rates, leading to cumulative Q-value estimation bias in the early stages and causing the model to fall into a local optimum between 750 and 1250 rounds. Further analysis of the exploration rate decay curve revealed that the decay rate set by Bayesian optimization (0.99) reduced the exploration rate from 1.0 to 0.01 within 1000 rounds, quickly transitioning to a development-dominated phase, whereas the 0.999 decay rate of grid search resulted in an exploration rate reduction of only 0.37 over the same period, with an overly conservative exploration strategy delaying the optimization process.

4.7. Double Optimization Model Test

To verify the advantages of our integrated optimization model, we compare its performance against a traditional baseline—defined as first come–first served scheduling with flat electricity pricing that minimizes only immediate energy costs—across three scenarios. In the corporate park scenario, the traditional model’s rigid peak-hour allocation caused severe station congestion (7:00–9:00 and 17:00–19:00), as evident in Figure 6’s power curve showing 92% capacity utilization. This resulted in 25 min average waits and 72% satisfaction. Our improved model introduced flexible time windows and tiered power allocation, shifting 34% of peak load to lunch periods (12:00–14:00), as confirmed by Figure 6’s flattened profile. This redistribution directly reduced transformer stress (peak power ↓29%), cutting wait times to 8 min and lifting satisfaction to 88% while maintaining cost efficiency.
For highway service areas, the traditional model’s ignorance of user elasticity led to clustered tourist vehicle charging during peak hours (Figure 6’s sharp power spike), achieving only 65% satisfaction. Our satisfaction-driven load redirection successfully moved 75% of charging to off-peak valleys (Figure 6), aligning with low-cost wind power availability (CNY 0.18/kWh vs. peak CNY 3.41/kWh). This temporal arbitrage—enabled by power curve reshaping—reduced waiting times by 68% (to 12 min), increased satisfaction to 82%, and lowered comprehensive costs by 14.2% to CNY 2.53/kWh, with wind integration accounting for 80% of the cost reduction.
In public parking lots facing mixed demand (taxis, tourists, and private EVs), the traditional model’s uniform treatment caused erratic grid loading (Figure 6’s high-frequency power swings) and 78% satisfaction. Our stratified strategy prioritized taxis’ urgent needs while incentivizing tourist elasticity, stabilizing the power curve (Figure 6 shows a 37% improvement in valley filling) and reducing grid penalty fees by 63%. This coordination achieved 92% satisfaction and a 13.3% cost reduction, demonstrating effective conflict resolution among heterogeneous users.
Collectively, Figure 6’s power curve comparisons reveal that our model’s gains in all scenarios stem from three mechanisms: (1) peak shaving (reducing grid stress fees via curve flattening), (2) valley filling (leveraging low-cost renewables through off-peak shifting), and (3) stratified scheduling (matching service tiers to user urgency). The traditional model’s failure to address these interdependencies explains its inferior performance, while our approach simultaneously enhances economic efficiency (13.3–14.2% cost reduction) and user experience (18–26% satisfaction increase).

5. Conclusions

This study successfully developed an intelligent charging optimization strategy for multi-type electric vehicle users. By establishing a classification behavior model that covers private cars, taxis, and tourist vehicles, it innovatively transforms the multi-objective optimization problem of charging costs, carbon emissions, and battery wear into a Markov decision process. In a dynamic test environment including public parking lots, corporate parks, and highway service areas, this strategy reduced charging costs by 15.2% and minimized battery aging by 23.8% compared to traditional predictive control methods. Particularly in holiday highway scenarios, dynamic adjustment of charging timing decreased the incidence of range anxiety by 34.5%. The study further constructed a multidimensional state representation space, integrating real-time electricity price signals, user travel pattern characteristics, and environmental carbon intensity indicators, enabling the system to automatically identify scene features and generate optimal charging plans. Through gradient attribution analysis, it revealed the critical impact of battery SOC and dwell time on strategy decisions, validating the rationality of the model logic.
In future research, we will prioritize three critical enhancements to address the limitations highlighted in this study and by reviewers. First, we will develop continuous control algorithms based on policy gradients to enable fine-grained real-time adjustment of charging power, which is particularly crucial for high-power fleet-charging scenarios with tight operational constraints. Second, recognizing the need for robust uncertainty handling, we plan to construct a hybrid architecture integrating Bayesian networks with our RL framework to explicitly model electricity price fluctuations and user behavior variability, thereby addressing the reviewers’ concerns about dynamic multi-objective balancing under uncertainty. Third, building upon insights from Loaiza-Quintana et al.’s work on charging location optimization [32] and Jarvis et al.’s scheduling approaches for electric buses [8], we will extend our model to incorporate spatial–temporal coordination for fleet charging, simultaneously optimizing charger placement and scheduling while considering grid impact and urban infrastructure constraints. These planned improvements will significantly enhance our framework’s applicability to both private and fleet-charging scenarios while advancing the state of the art in robust, multi-objective EV charging control.

Author Contributions

Methodology, J.X.; Software, B.C.; Validation, B.C. and J.X.; Formal analysis, D.L.; Data curation, D.L.; Writing—original draft, B.C.; Writing—review & editing, J.X.; Supervision, J.X.; Project administration, D.L.; Funding acquisition, J.X. All authors have read and agreed to the published version of the manuscript.

Funding

This research received no external funding.

Data Availability Statement

The original contributions presented in this study are included in the article. Further inquiries can be directed to the corresponding author.

Conflicts of Interest

The funders had no role in the design of the study; in the collection, analyses, or interpretation of data; in the writing of the manuscript; or in the decision to publish the results.

References

  1. Szumska, E. Electric Vehicle Charging Infrastructure Along Highways in the EU. Energies 2023, 16, 895. [Google Scholar] [CrossRef]
  2. Vijayan, V.; Arzani, A.; Mahajan, S.M. Demand Side Management Considering Load–Voltage Interdependence and Optimal Topology Selection in Active Distribution Networks. IEEE Access 2025, 13, 49107–49120. [Google Scholar] [CrossRef]
  3. Tamma, W.R.; Azis Prasojo, R.; Suwarno, S. Assessment of High Voltage Power Transformer Aging Condition Based on Health Index Value Considering Its Apparent and Actual Age. In Proceedings of the 2020 12th International Conference on Information Technology and Electrical Engineering (ICITEE), Yogyakarta, Indonesia, 6–8 October 2020; pp. 292–296. [Google Scholar] [CrossRef]
  4. Caro, L.M.; Ramos, G.; Rauma, K.; Rodriguez, D.F.C.; Martinez, D.M.; Rehtanz, C. State of Charge Influence on the Harmonic Distortion from Electric Vehicle Charging. IEEE Trans. Ind. Appl. 2021, 57, 2077–2088. [Google Scholar] [CrossRef]
  5. Hu, H.; Bin, Q.; Xiao, Y.; Lin, X.; Deng, Y.; Zhang, F.; He, P.; Zhou, M. Modeling and analysis of carbon emissions throughout the entire lifecycle of electric vehicles. In Proceedings of the 2024 4th International Conference on Energy, Power and Electrical Engineering (EPEE), Wuhan, China, 20–22 September 2024; pp. 881–886. [Google Scholar] [CrossRef]
  6. Dahiwale, P.V.; Rather, Z.H. Centralized Multi-objective Framework for Smart EV Charging in Distribution System. In Proceedings of the 2023 IEEE PES Conference on Innovative Smart Grid Technologies—Middle East (ISGT Middle East), Abu Dhabi, United Arab Emirates, 12–15 March 2023; pp. 1–5. [Google Scholar] [CrossRef]
  7. Fachrizal, R.; Munkhammar, J. Improved Photovoltaic Self-Consumption in Residential Buildings with Distributed and Centralized Smart Charging of Electric Vehicles. Energies 2020, 13, 1153. [Google Scholar] [CrossRef]
  8. Jarvis, P.; Climent, L.; Arbelaez, A. Smart and sustainable scheduling of charging events for electric buses. TOP 2024, 32, 22–56. [Google Scholar] [CrossRef]
  9. Seal, S.; Boulet, B.; Dehkordi, V.R.; Bouffard, F.; Joos, G. Centralized MPC for Home Energy Management with EV as Mobile Energy Storage Unit. IEEE Trans. Sustain. Energy 2023, 14, 1425–1435. [Google Scholar] [CrossRef]
  10. Zhang, J.; Che, L.; Shahidehpour, M. Distributed Training and Distributed Execution-Based Stackelberg Multi-Agent Reinforcement Learning for EV Charging Scheduling. IEEE Trans. Smart Grid 2023, 14, 4976–4979. [Google Scholar] [CrossRef]
  11. Ullah, Z.; Yan, L.; Rehman, A.U.; Qazi, H.S.; Wu, X.; Li, J.; Hasanien, H.M. Distributed Consensus-Based Optimal Power Sharing Between Grid and EV Charging Stations Using Derivative-Free Charging Scheduling. IEEE Access 2024, 12, 127768–127781. [Google Scholar] [CrossRef]
  12. Zheng, Y.; Song, Y.; Hill, D.J.; Meng, K. Online Distributed MPC-Based Optimal Scheduling for EV Charging Stations in Distribution Systems. IEEE Trans. Ind. Inform. 2019, 15, 638–649. [Google Scholar] [CrossRef]
  13. Saner, C.B.; Trivedi, A.; Srinivasan, D. A Cooperative Hierarchical Multi-Agent System for EV Charging Scheduling in Presence of Multiple Charging Stations. IEEE Trans. Smart Grid 2022, 13, 2218–2233. [Google Scholar] [CrossRef]
  14. Qian, T.; Shao, C.; Li, X.; Wang, X.; Chen, Z.; Shahidehpour, M. Multi-Agent Deep Reinforcement Learning Method for EV Charging Station Game. IEEE Trans. Power Syst. 2022, 37, 1682–1694. [Google Scholar] [CrossRef]
  15. Sun, F.; Diao, R.; Zhou, B.; Lan, T.; Mao, T.; Su, S.; Cheng, H.; Meng, D.; Lu, S. Prediction-Based EV-PV Coordination Strategy for Charging Stations Using Reinforcement Learning. IEEE Trans. Ind. Appl. 2024, 60, 910–919. [Google Scholar] [CrossRef]
  16. Zhang, C.; Liu, Y.; Wu, F.; Tang, B.; Fan, W. Effective Charging Planning Based on Deep Reinforcement Learning for Electric Vehicles. IEEE Trans. Intell. Transp. Syst. 2021, 22, 542–554. [Google Scholar] [CrossRef]
  17. Zhao, Z.; Lee, C.K.M. Dynamic Pricing for EV Charging Stations: A Deep Reinforcement Learning Approach. IEEE Trans. Transp. Electrif. 2022, 8, 2456–2468. [Google Scholar] [CrossRef]
  18. Chu, Y.; Wei, Z.; Fang, X.; Chen, S.; Zhou, Y. A Multiagent Federated Reinforcement Learning Approach for Plug-In Electric Vehicle Fleet Charging Coordination in a Residential Community. IEEE Access 2022, 10, 98535–98548. [Google Scholar] [CrossRef]
  19. Ding, T.; Zeng, Z.; Bai, J.; Qin, B.; Yang, Y.; Shahidehpour, M. Optimal Electric Vehicle Charging Strategy with Markov Decision Process and Reinforcement Learning Technique. IEEE Trans. Ind. Appl. 2020, 56, 5811–5823. [Google Scholar] [CrossRef]
  20. Li, H.; Wan, Z.; He, H. Constrained EV Charging Scheduling Based on Safe Deep Reinforcement Learning. IEEE Trans. Smart Grid 2020, 11, 2427–2439. [Google Scholar] [CrossRef]
  21. Aswantara, I.K.A.; Ko, K.S.; Sung, D.K. A centralized EV charging scheme based on user satisfaction fairness and cost. In Proceedings of the 2013 IEEE Innovative Smart Grid Technologies-Asia (ISGT Asia), Bangalore, India, 10–13 November 2013; pp. 1–4. [Google Scholar] [CrossRef]
  22. Asna, M.; Shareef, H.; Prasanthi, A.; Errouissi, R.; Wahyudie, A. A Novel Multi-Level Charging Strategy for Electric Vehicles to Enhance Customer Charging Experience and Station Utilization. IEEE Trans. Intell. Transp. Syst. 2024, 25, 11497–11508. [Google Scholar] [CrossRef]
  23. Li, X.; Luo, F.; Zhang, C.; Dong, Z.Y. Stochastic EV Charging Dispatch in Unbalanced Three-Phase Networks Based on Interpretable Fuzzy Representation of User Preferences. IEEE Trans. Power Syst. 2025, 40, 1623–1635. [Google Scholar] [CrossRef]
  24. Zuo, W.; Li, K. Electrical vehicle charging strategy for electric road systems considering V2G technology. In Proceedings of the 2023 IEEE International Conference on Energy Technologies for Future Grids (ETFG), Wollongong, Australia, 3–6 December 2023; pp. 1–5. [Google Scholar] [CrossRef]
  25. Salvatti, G.A.; Carati, E.G.; Cardoso, R.; da Costa, J.P.; de Oliveira Stein, C.M. Electric Vehicles Energy Management with V2G/G2V Multifactor Optimization of Smart Grids. Energies 2020, 13, 1191. [Google Scholar] [CrossRef]
  26. Pollock, J.; Chong, P.L.; Ramegowda, M.; Dawood, N.; Habibi, H.; Hou, Z.; Faraji, F.; Guo, P. Battery Electric Vehicles: A Study on State of Charge and Cost-Effective Solutions for Addressing Range Anxiety. Machines 2025, 13, 411. [Google Scholar] [CrossRef]
  27. Szúcs, I.; Kopják, J.; Sebestyén, G.; Wendler, M. Analyzing EV Users’ Charging Patterns for Estimating Session Parameters and Optimizing Load Management. In Proceedings of the 2025 IEEE 23rd World Symposium on Applied Machine Intelligence and Informatics (SAMI), Stará Lesná, Slovakia, 23–25 January 2025; pp. 521–526. [Google Scholar] [CrossRef]
  28. Wang, Y.; Wu, Q.; Li, Z.; Xiao, L.; Zhang, X. Deep Reinforcement Learning-Based Charging Pricing Strategy for Charging Station Operators and Charging Navigation for EVs. In Proceedings of the 2024 IEEE 2nd International Conference on Power Science and Technology (ICPST), Dali, China, 9–11 May 2024; pp. 1972–1978. [Google Scholar] [CrossRef]
  29. Ding, Y.; Zhang, S.; Chen, Y.; Zhao, L.; Chen, H.; Sun, W.; Niu, M.; Wang, H.; Wang, X. Optimal scheduling of the virtual power plant with electric vehicles using Dueling DDQN. In Proceedings of the 2024 4th International Conference on Energy, Power and Electrical Engineering (EPEE), Wuhan, China, 20–22 September 2024; pp. 1065–1070. [Google Scholar] [CrossRef]
  30. Xu, Z.; Cao, K.; Liu, Y.; Wang, C. Short-Term Load Prediction of EV Charging Station Based on LSTM Recursion. In Proceedings of the 2024 IEEE 2nd International Conference on Power Science and Technology (ICPST), Dali, China, 9–11 May 2024; pp. 2068–2073. [Google Scholar] [CrossRef]
  31. Xu, J.; Zheng, T.; Dang, Y.; Yang, F.; Li, D. Distributed Deep Reinforcement Learning for Data-Driven Water Heater Model in Smart Grid. IEEE Trans. Smart Grid 2025, 16, 2900–2912. [Google Scholar] [CrossRef]
  32. Loaiza-Quintana, C.; Cruz-Reyes, L.; Rangel-Valdez, N.; Gómez-Santillán, C.; Terashima-Marín, H. Iterated Local Search for the Ebuses Charging Location Problem. In Proceedings of the Parallel Problem Solving from Nature—PPSN XVII, Dortmund, Germany, 10 September 2022; Lecture Notes in Computer Science. Springer: Berlin/Heidelberg, Germany, 2022; Volume 13349, pp. 402–415. [Google Scholar] [CrossRef]
Figure 1. Dual-layer optimization flow chart.
Energies 18 04097 g001
Figure 2. DQN-GPR training and test flow chart.
Energies 18 04097 g002
Figure 3. Dynamic changes of the three types of range anxiety.
Energies 18 04097 g003
Figure 4. Typical daily optimization results.
Energies 18 04097 g004
Figure 5. Comparison of optimization algorithms in three different power-grid scenarios.
Energies 18 04097 g005
Figure 6. Optimal combination of environmental parameters for public parking lots.
Energies 18 04097 g006
Figure 7. Optimization results of the double-layer model.
Energies 18 04097 g007
Figure 8. Convergence comparison of the optimal parameters of two groups.
Energies 18 04097 g008
Table 1. Genetic Algorithm (GA) and LSTM hyperparameter configuration.
Genetic Algorithm (GA)Long Short-Term Memory (LSTM)
ParameterValueParameterValue
Gene RepresentationBinary tuple (station ID, start hour, duration)Input Representation24 h time series: grid price, SOC history, power constraints
Population Size200 (elite retention: top 10%)Network Architecture2 × LSTM layers (128 units) → Dropout (0.3) → Dense (softmax)
CrossoverTwo-point (p = 0.85)TrainingEpochs: 150 (early stop patience = 15), Batch: 64
MutationBit-flip (p = 0.02)OptimizationAdam (lr = 0.001), Loss: weighted cross-entropy
Fitness FunctionWeighted sum (cost, emissions, degradation)OutputAction distribution (charge/idle/discharge per 15-min)
Termination500 gens OR < 0.1% improvement (50 gens)SequenceStateful training
(length = 96 = 24 h × 4 intervals)
Table 2. Different combinations of reward function weights and their costs.
CombinationWcostWemissionWSOCWsatisfactionComprehensive Cost
130%40%20%10%0.75
240%30%20%10%0.69
320%30%10%40%0.72
440%0%20%40%0.77
530%20%0%50%0.83
Table 3. Grid environment characteristics and model adaptations.
Grid EnvironmentKey CharacteristicsModel Adaptations
Hybrid Energy Grid
  • Integration of renewables
  • High volatility in generation output
  • Bidirectional power flow with prosumers
  • Requires real-time balancing
  • Suppose the hybrid energy is solar energy
  • Reward vehicles charging during the day
  • Slightly reduce carbon emission weight
High-Carbon Grid
  • Dominated by thermal generation
  • Low operational flexibility
  • Strict ramp-rate constraints
  • Price-sensitive demand
  • Fix carbon price at higher daily value
  • Slightly increase carbon emission weight
Carbon Quota-Constrained Grid
  • Mandatory emission caps
  • Tradable carbon allowances
  • Dual optimization of energy and carbon markets
  • Penalties for non-compliance
  • Set daily threshold for regional emissions
  • Below threshold: adopt high-carbon scenarios
  • At/above threshold: increase carbon weight
Table 4. Vehicle proportions in each scenario.
ScenePrivate CarTaxiTourist VehiclesScene Features
Public parking lots60%30%10%Private cars dominate parking in residential areas/business districts
Unit park40%55%5%Workday commuting is intensive, and taxi service is frequent
Highway service area20%10%70%During holidays, the proportion of tourist vehicles is the highest
Table 5. Comparison of hyperparameters.
Hyperparameters/
Optimization Methods
Grid SearchBayesian Optimization
Combination 1Combination 2Combination 3Combination 4Combination 5Combination 6
Learning rate0.0040.030.050.0020.010.03
Discount factor0.960.990.950.990.950.98
Batch size1282566412825664
Explore the initial value
of the rate
1.00.990.991.00.990.99
Explore the minimum
value
0.0010.010.050.010.050.1
Exploration rate
Decay rate
0.9990.90.990.990.90.999
Target network
update rate
100050050010001000500
Size of
hidden layer
[256,256][256,256][128,128][256,256][256,256][128,128]
Disclaimer/Publisher’s Note: The statements, opinions and data contained in all publications are solely those of the individual author(s) and contributor(s) and not of MDPI and/or the editor(s). MDPI and/or the editor(s) disclaim responsibility for any injury to people or property resulting from any ideas, methods, instructions or products referred to in the content.