The methodology employed in this study follows an LCA approach, which is a systematic tool for evaluating the environmental impacts of products, processes, or systems across their entire life cycle. In this study, we evaluate the environmental implications of hydrogen production pathways with a focus on the water feed supply processes, including desalination, freshwater purification, and the management of brine and reject water.
3.1. LCA Framework
LCA is a standardized approach for evaluating the environmental impacts of products, services, or systems over their life cycle. It follows the ISO 14040 and ISO 14044 frameworks [
27,
28] and consists of four main steps:
This step outlines the purpose of the study, the system boundaries, and the functional unit used for analysis. In this work, the goal is to assess the environmental impacts of water supply strategies, namely seawater desalination with and without BT, and freshwater purification, used for hydrogen production via electrolysis or SMR. The system boundary is defined as cradle-to-gate, capturing upstream stages such as water sourcing, purification, and brine or reject water management. The functional unit (FU) is defined as 1 kg of hydrogen produced. This step is described in
Section 3.3.1 and
Section 3.3.2.
The LCI phase involves compiling all relevant inputs and outputs of energy, water, and emissions for each process in the modeled system. In this study, inventory data included recovery rates, energy demands for desalination and freshwater purification, BT energy intensity, and regional electricity mix compositions. These data were obtained from peer-reviewed literature, industrial reports, and the Ecoinvent 3.10 background database [
29]. The details of this phase are presented in
Section 3.3,
Section 3.4,
Section 3.5,
Section 3.6 and
Section 3.7.
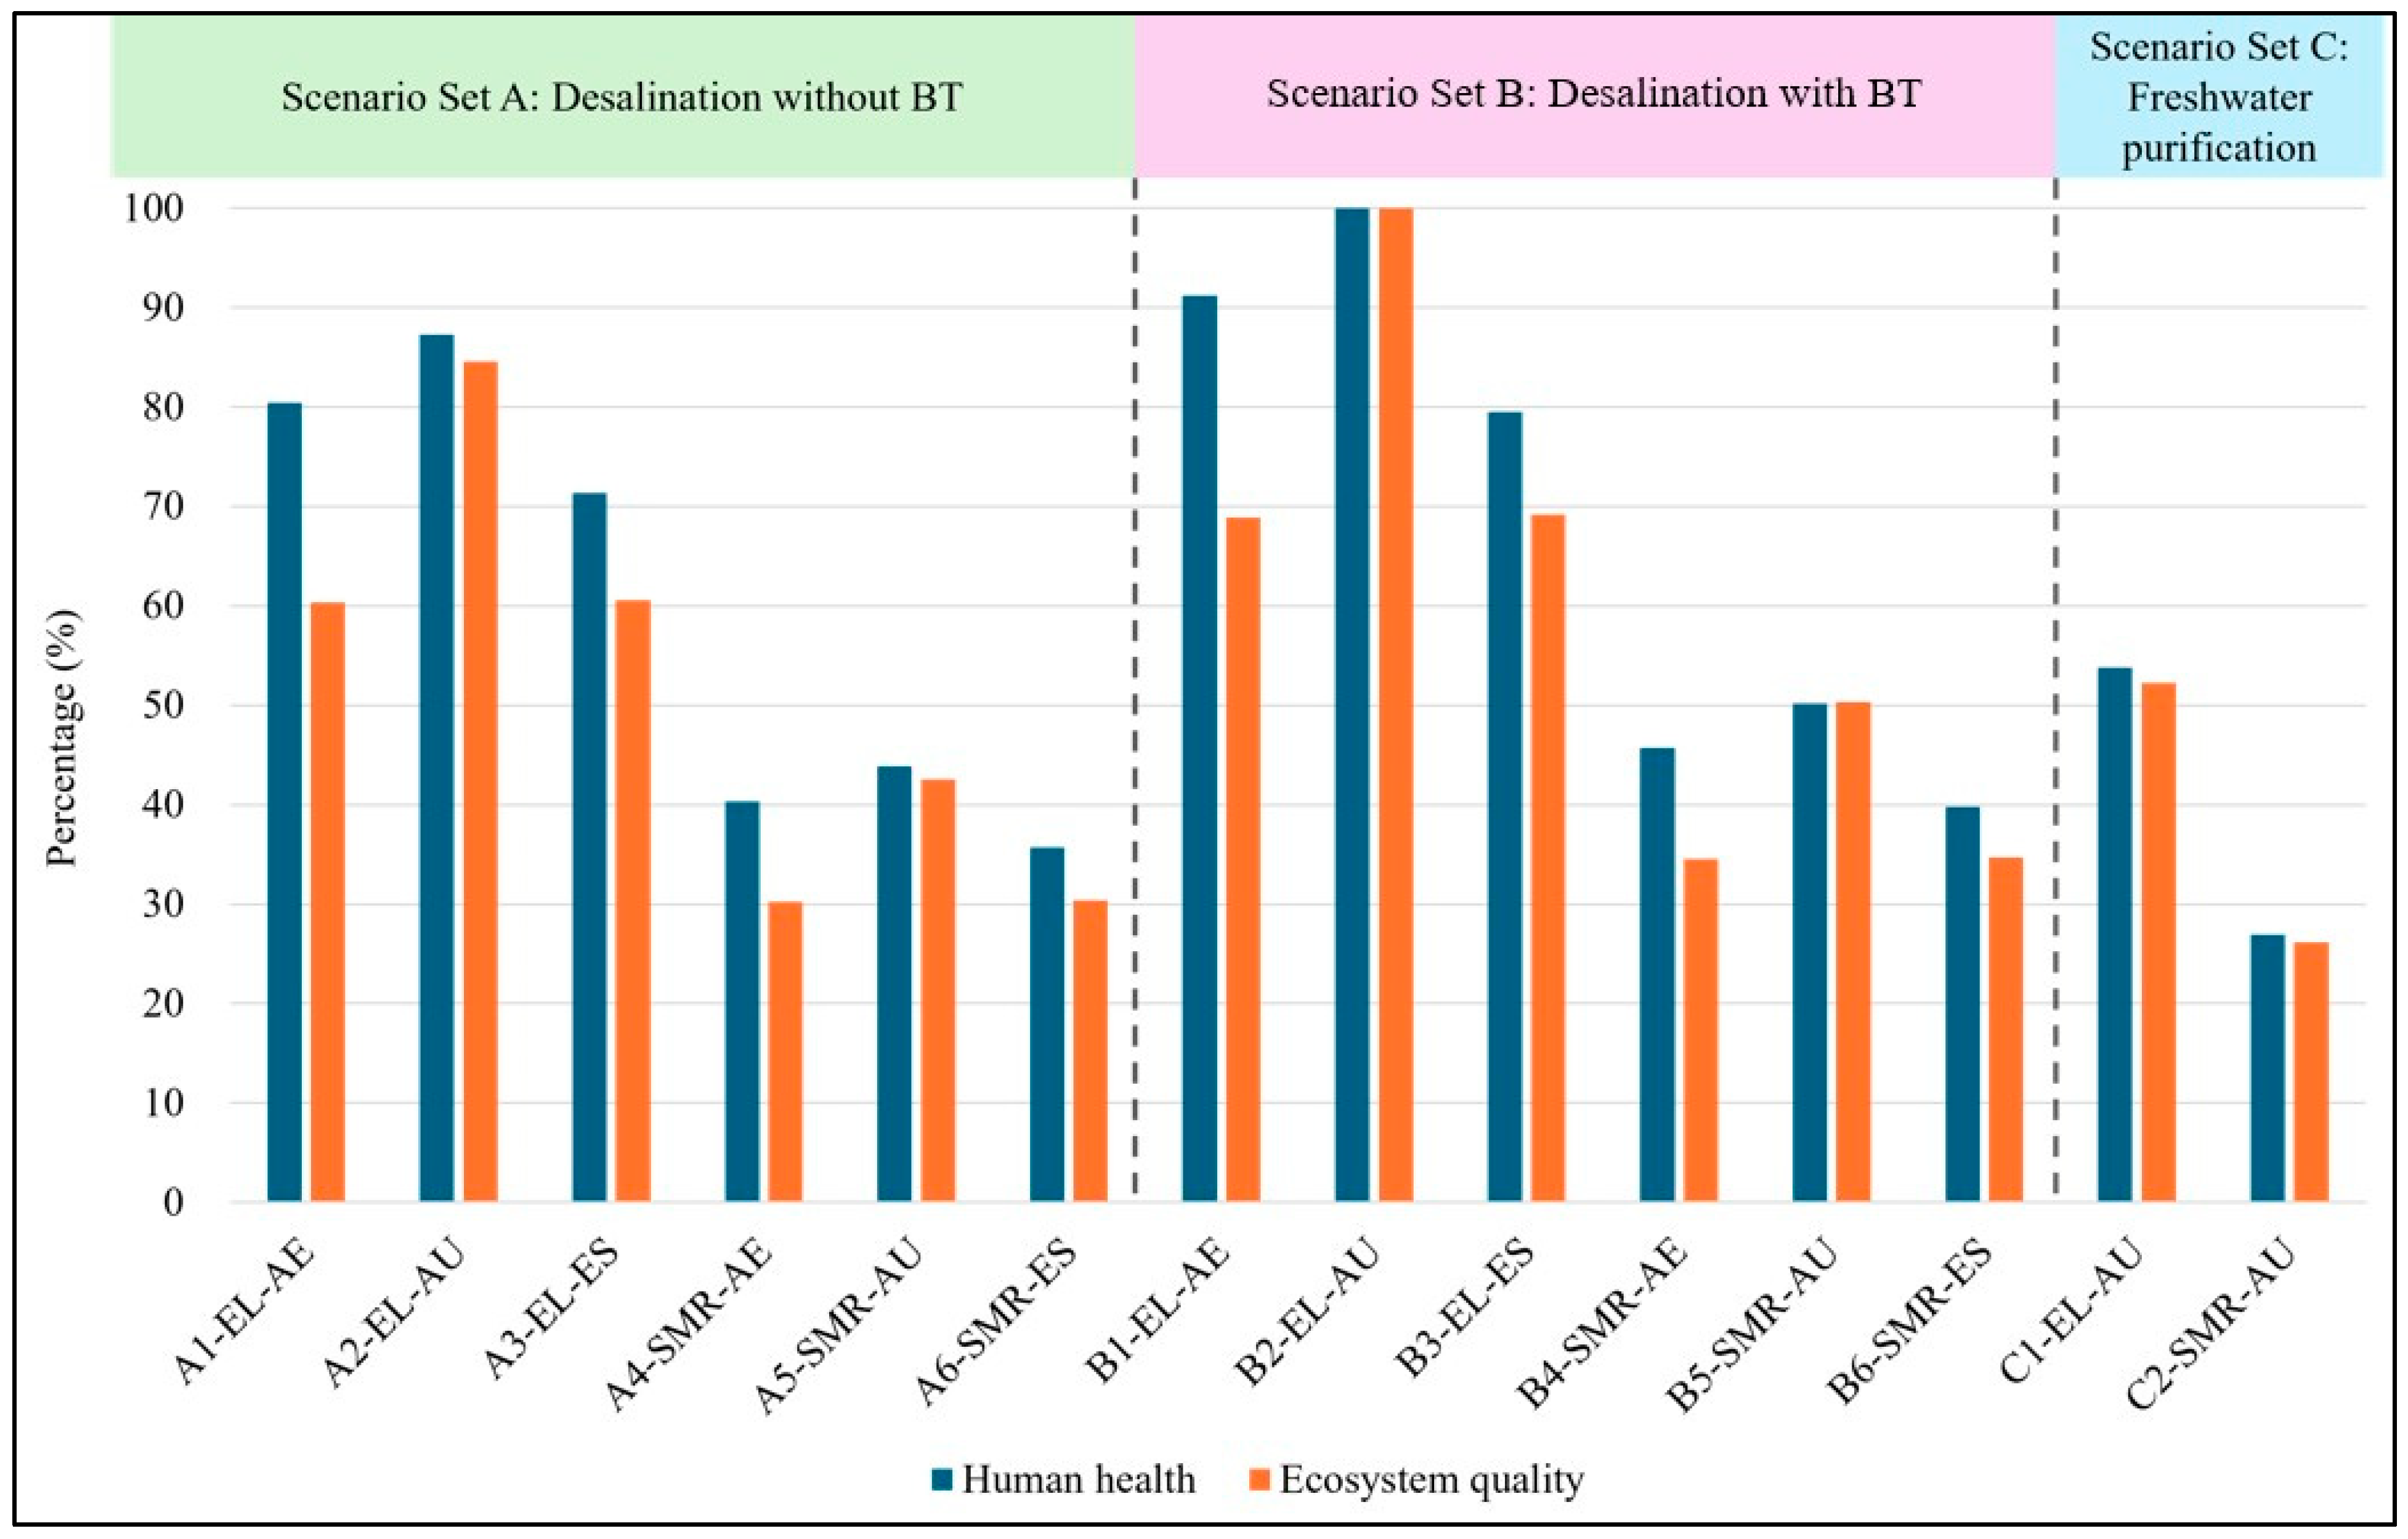
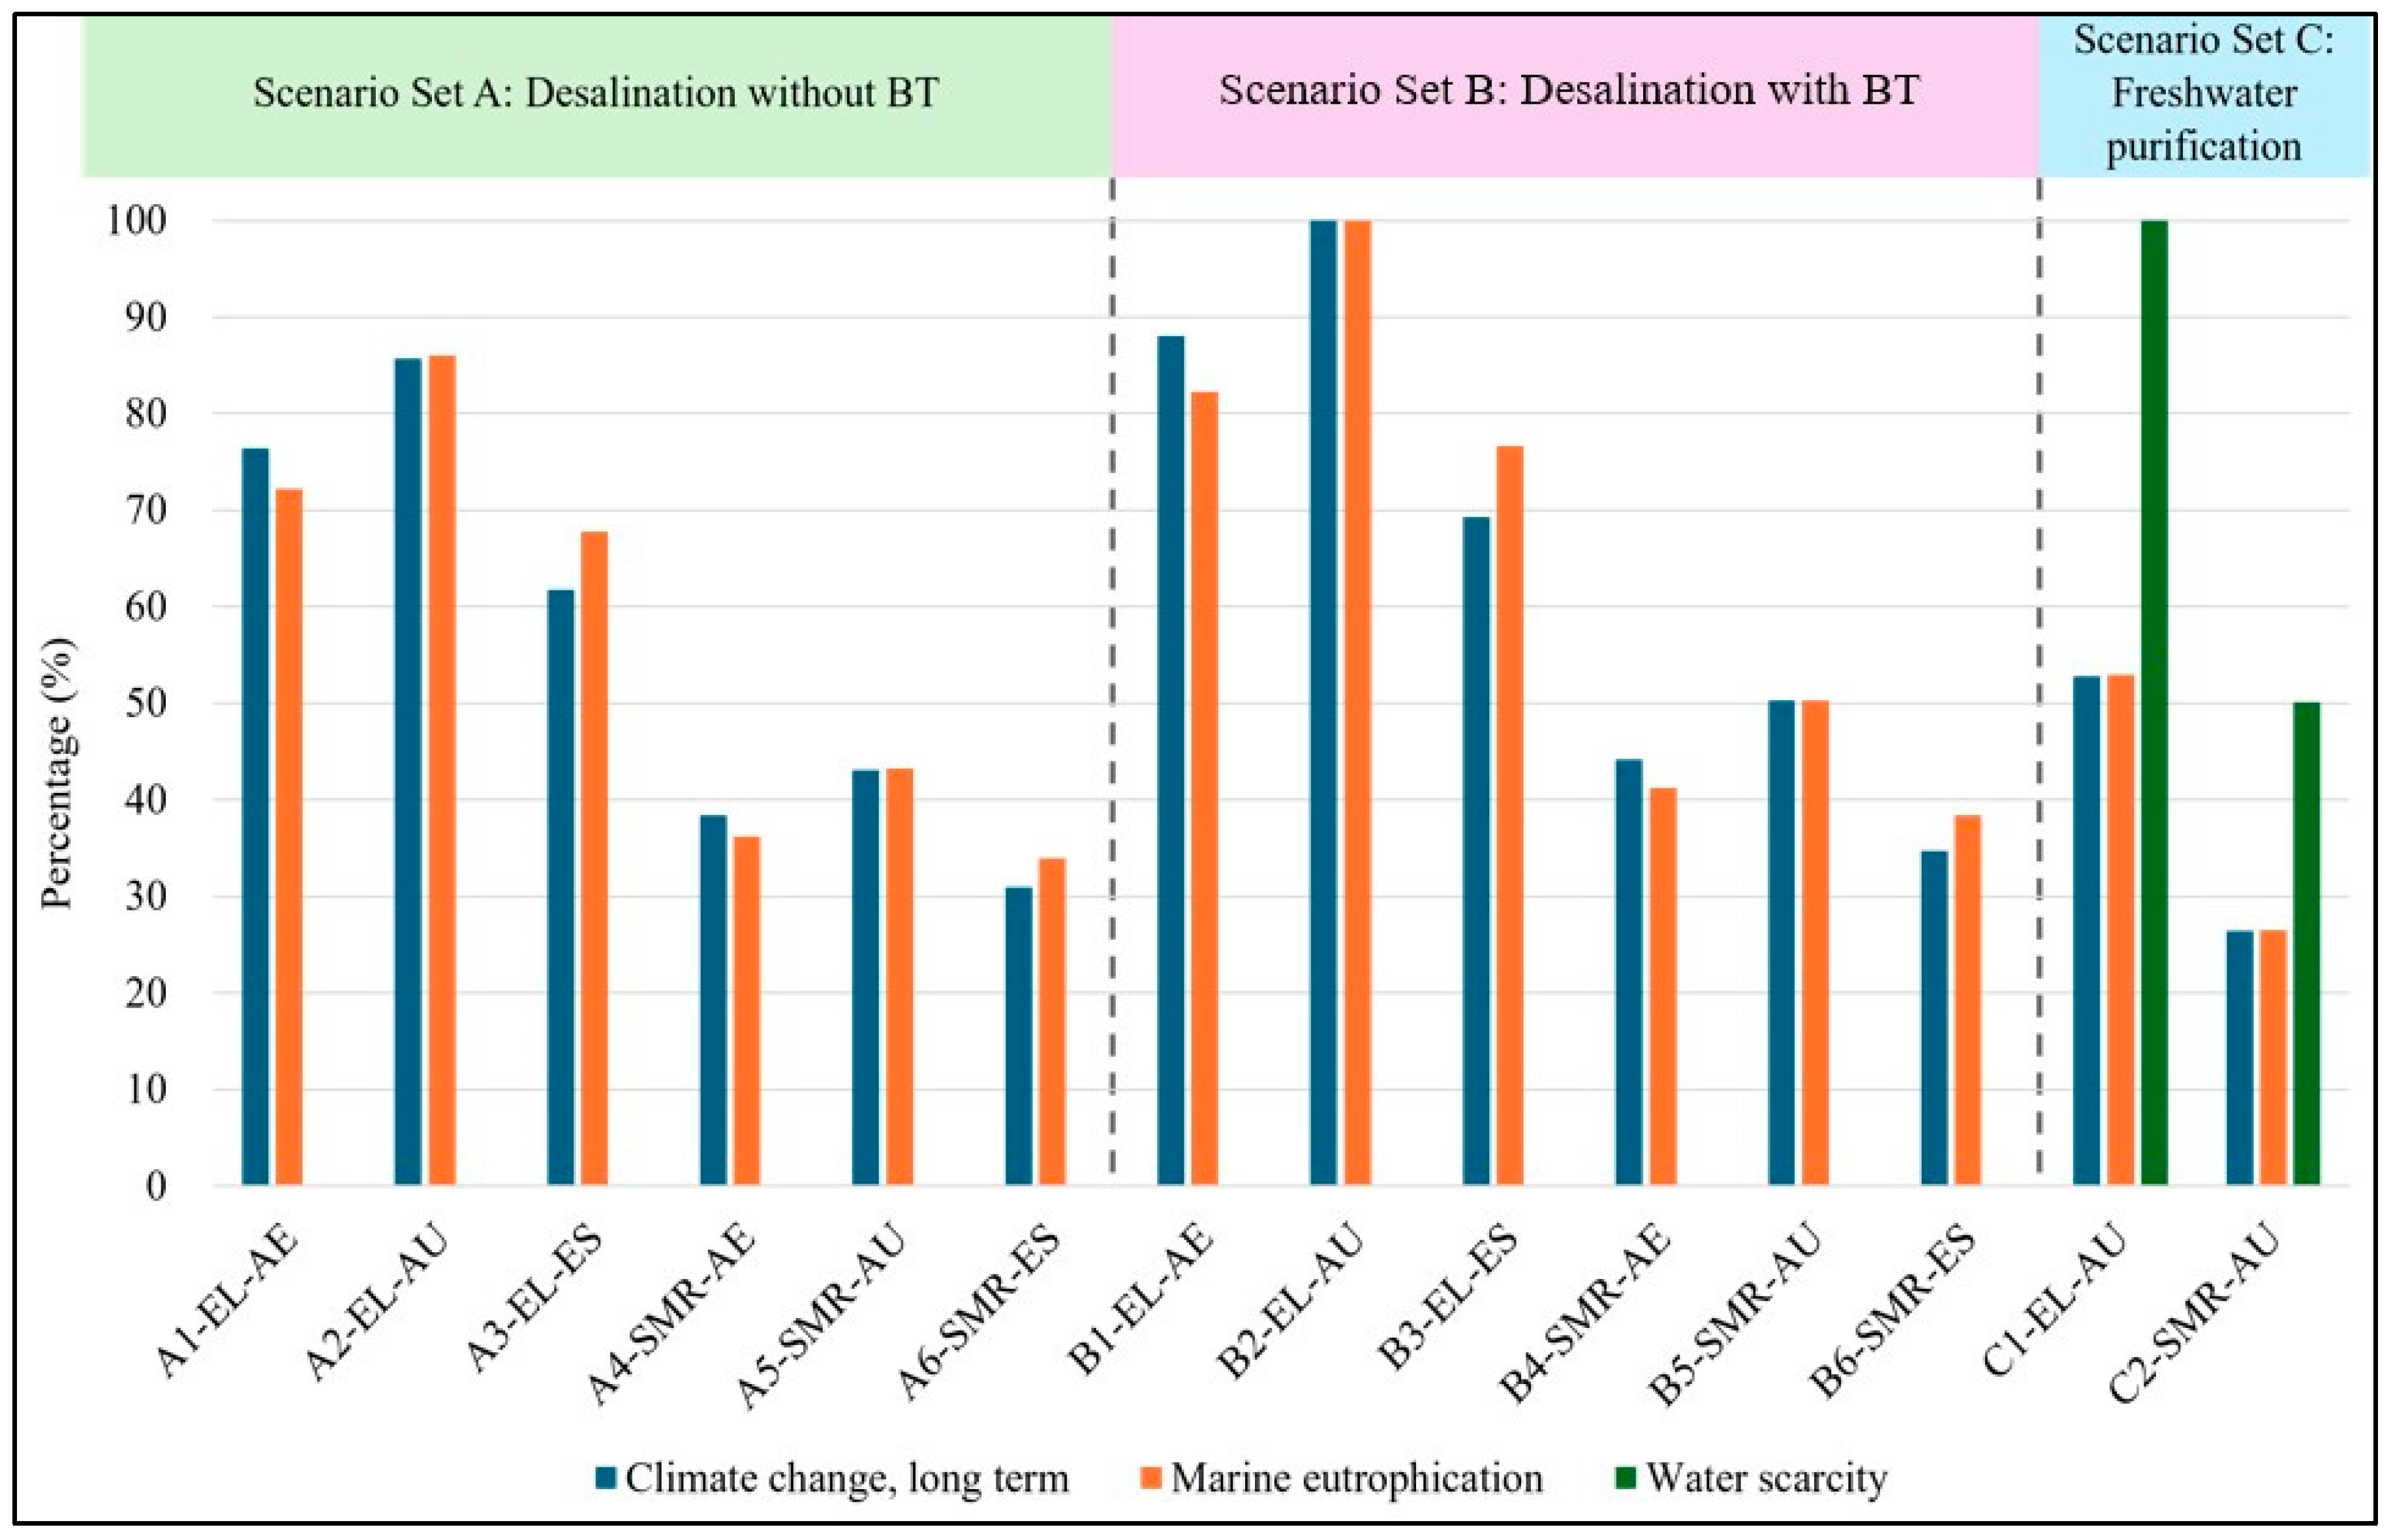
This step translates the inventory data into environmental impact indicators. The IMPACT World+ (version 1.04) method was used to assess both midpoint and endpoint impacts. The midpoint indicators include climate change (expressed in kg CO
2-equivalent), marine eutrophication (kg N-equivalent), and water scarcity (m
3 water-equivalent), while the endpoint indicators focus on human health (measured in disability-adjusted life years, DALYs) and ecosystem quality (expressed as potentially disappeared fraction, PDF·m
2·yr). This phase is described in
Section 3.8.
This final phase involves the analysis and interpretation of the results in order to identify key contributors to environmental impacts, compare trade-offs, and draw conclusions regarding system sustainability. In this study, interpretation was carried out through comparison of 14 scenarios across three countries and two hydrogen production pathways. The results of this interpretation are presented in
Section 4,
Section 5 and
Section 6.
3.2. Application of SimaPro Software for Scenario Modeling and Impact Assessment
The LCA was conducted using SimaPro software version 9.6.0.1 PhD and the IMPACT World+ impact assessment method (version 1.4), incorporating both midpoint and endpoint indicators to provide comprehensive insights. The Ecoinvent (version 3.10) system database was utilized for the LCA in SimaPro. Below is a summary of the steps used to apply SimaPro for this study.
Each of the fourteen scenarios analyzed in this study was modeled as a distinct process within SimaPro, representing a unique combination of hydrogen production method that the water source supports (electrolysis or SMR), water source (e.g., desalinated water, freshwater), BT configuration (with or without partial treatment), and regional electricity mix (UAE, Australia, or Spain). For each scenario, input flows from nature and the technosphere were entered manually based on region-specific assumptions and published literature.
Each scenario’s input was calculated or inserted manually in an Excel sheet arrangement for data keeping, which was based on assumptions inferred from literature findings or industry reports. Then, these inputs were used in the SimaPro scenario process inputs. For example, in the B2-EL-AU scenario (electrolysis using desalinated water with BT in Australia), inputs included 18 kg of seawater, 1.8 kg of tap water (RO), and 0.081 kWh of electricity—segregated for the electrolysis and BT subsystems. In contrast, the C2-SMR-AU scenario (SMR with freshwater purification) included 5.56 m3 of river water and 5.56 kg of RO-treated water as key material inputs, along with 0.012 kWh of electricity (from Australia’s electricity grid dataset) for the purification process. Background flows were linked to the Ecoinvent 3.10 database using region-appropriate electricity markets (e.g., “Electricity, low voltage [AU]”). No co-products or avoided burdens were modeled, for model simplification reasons. All processes were standardized to a functional unit of 1 kg of hydrogen.
All scenarios were then selected within SimaPro’s comparison interface. The IMPACT World+ (version 1.04) method was applied to evaluate both midpoint and endpoint indicators. The software executed the impact calculations for each scenario based on the complete inventory, generating absolute environmental burdens per functional unit (e.g., kg CO2-eq, DALYs, PDF·m2·yr). For visualization and relative comparison purposes, normalized results were also generated automatically by the software, scaling impacts so that the highest value in each category was set to 100%.
Upon completion of the impact assessment, results were exported as both tables (with absolute values) and charts (normalized comparisons). These outputs were used for post-processing, including the creation of comparative bar graphs shown in
Section 4 and
Section 5. Results were interpreted across regions and scenarios to examine trade-offs between water sourcing strategies and hydrogen production methods.
This structured use of SimaPro allowed for transparent, repeatable modeling of environmental impacts, aligning with the ISO 14040/14044 standards and consistent with best practices in published LCA literature [
9,
16,
30].
3.4. System Boundaries
As illustrated in
Figure 1, the system boundaries of this study include several critical processes. First, the water feed values where water supply processes include seawater desalination for all regions, namely the UAE, Spain, and Australia, as well as freshwater intake and purification specifically for Australia. These processes form the foundation for ensuring an adequate water supply for hydrogen production.
Second, specific energy consumption (SEC) for water supply is considered, focusing on the energy required for desalination, measured in kilowatt-hours per kg of water (kWh/kg water), which varies across regions. Additionally, the energy needed for freshwater purification is included, capturing the variations in energy demand based on water source and treatment requirements.
Third, the system includes brine and reject water management in terms of energy use. This incorporates the energy required for brine discharge into seawater for scenarios involving desalinated seawater. For freshwater scenarios, the energy required for managing reject water through marine discharge into seawater is accounted for, and it ensures a comprehensive understanding of the environmental impacts of water management. In addition to that, the BT is included in one of the scenario sets. The BT dataset models the treatment activities from the point of brine availability at the treatment plant to its treatment and the release of emissions.
Certain processes are excluded from the system boundaries, such as direct emissions or energy consumption associated with electrolysis and SMR hydrogen production technologies, as well as the transportation, storage, and distribution of hydrogen. Moreover, the water requirements for cooling and water losses from evaporation are not considered for this study for both SMR and electrolysis. The energy for the extraction of freshwater and intake of seawater is also outside the scope of this study. These exclusions allow for a focused assessment of water supply processes and their associated environmental impacts.
This study is limited to a cradle-to-gate assessment of water sourcing and pre-treatment for hydrogen production and does not include the hydrogen production stage itself, such as SMR or electrolysis. As such, it does not represent a full LCA of hydrogen production pathways. While the environmental burdens of water provision are important, especially in water-stressed regions, they must be interpreted in the broader context of the total environmental impacts from hydrogen generation. To support this perspective,
Section 5.5 provides a comparative overview between the climate change impacts of water sourcing (as modeled in this study) and those associated with hydrogen production based on recent literature. This comparison demonstrates that although the global warming potential (GWP) values from water sourcing are smaller in absolute terms, their relative contribution is more pronounced in low-carbon production pathways such as solar-powered electrolysis. Future research should aim to integrate both water provision and hydrogen generation within a full cradle-to-gate LCA to guide more holistic sustainability decisions.
3.5. Scenarios Analyzed
This study evaluates the environmental impacts of water supply processes for hydrogen production under three distinct scenario sets:
Scenario Set A. Desalinated seawater for hydrogen production water supply without BT.
Scenario Set B. Desalinated seawater for hydrogen production water supply with BT of 20% of rejected brine from the desalination process.
Scenario Set C. Freshwater for hydrogen production water supply as a feedwater source (only analyzed for Australia).
Each scenario is regionally differentiated across the UAE, Australia, and Spain (except the third set of scenarios, which is only studied for Australia’s case) based on certain assumptions on recovery rates, energy requirements for desalination and purification, hydrogen production method, and water management practices. The use of different parameter settings may result in varying impacts, particularly due to differences in impacts on energy consumption. A sensitivity analysis could help understand these impacts from varying parameter settings, so it is planned to be addressed in future work. Due to constraints imposed by the length of this study, sensitivity analysis is excluded from the present study. This study will serve as the foundation for understanding the associated impacts.
The UAE, Australia, and Spain have been chosen in this study for a strategic understanding of water-energy dynamics associated with hydrogen production in varying geographical and socio-economic perspectives. These three countries were chosen because their selection ensures the representation of a few distinguishable sets of scenarios on water resource availability, energy usage, and hydrogen production potential.
The UAE is a leading example of a water-scarce, arid region highly dependent on desalination for its freshwater supplies. The UAE has the second-largest desalination capacity in the world [
8,
31]. It has a well-developed desalination infrastructure and invests significantly in hydrogen production, making it an ideal case study in the assessment of environmental impacts of integrating desalination into the supply chain of hydrogen. Salinity levels along the UAE coast on the Arabian Gulf have been recorded to range from 36.5 practical salinity unit (psu) to 46 psu, with elevated salinity levels observed in the Ruwais coastal area, which is characterized by a concentration of industrial facilities, including petrochemical refineries [
32,
33]. Moreover, ongoing efforts in the UAE to switch to renewable energy provide a relevant context within which the compatibility of desalination-powered hydrogen production with sustainable energy objectives can be evaluated. Recently, the UAE electricity mix has been highly dominated by natural gas as an energy source for power generation, standing at around 81% of the total electricity mix [
34]. On the other hand, nuclear energy accounts for approximately 13%, solar power at almost 5% and oil at less than 1% [
34].
Meanwhile, with Australia making significant investments in renewable energy [
35], its electricity mix in 2023 still relied heavily on coal (46.5%), while renewables accounted for nearly 33%, natural gas for 17.8%, and oil for 1.8%. [
36]. Despite its available freshwater resources in certain regions, the country faces localized freshwater scarcity, making both desalination and freshwater purification relevant for hydrogen production. Australia maintains a position within the top 10 nations globally in terms of installed seawater desalination capacity [
8,
31]. Most of the desalination plants in Australia are operating in Western Australia [
31]. Typical salinity levels in Western Australia coasts can range between 34.5 and 37 psu [
37,
38]. Moreover, Australia’s focus on exporting green hydrogen underscores the importance of evaluating the life cycle impacts of water inputs in its hydrogen production processes. Australia is the seventh region with the highest desalination capacity in the world [
8], making it important to understand the impacts of desalination use in the country. The scenario of freshwater for hydrogen production water supply as a feedwater source was only analyzed for Australia’s case. This is due to more water scarcity issues present in the other two regions, especially for the case of the UAE, and hence, it means there will be more reliance on desalination.
Spain is also among the top 10 countries globally in desalination capacity [
8,
31]. The average salinity in the Spanish Mediterranean Sea is 37.7 psu, with fluctuations ranging from below 37 psu to above 38.2 psu [
39]. For Spain’s case, around 70% of freshwater is utilized for agricultural use [
40]. Increasing freshwater allocation for industrial use could intensify resource competition and exacerbate water scarcity in the region. Therefore, seawater desalination presents a viable alternative to reduce dependence on freshwater resources. Nevertheless, Spain policymakers could still utilize the freshwater scenarios’ results to understand the possible scale of impacts between freshwater and desalination for hydrogen production.
Contrary to the UAE and Australia, Spain’s electricity mix is largely renewable, accounting for 48.5% (of which 15.1% is by solar photovoltaic, 22.5% is by wind, and 10.9% is by hydropower), nuclear energy at about 20%, natural gas at 22.5%, and a small share from oil and coal [
41]. Spain’s large and growing renewable energy sector and sustainable energy practices are another aspect that provides a different insight into the impact of different electricity mixes on the environmental impacts of water in hydrogen production.
Freshwater scenarios were not modeled for the UAE and Spain due to severe water scarcity. In these regions, limited freshwater resources are prioritized for domestic and agricultural use, making large-scale allocation for hydrogen production impractical [
40,
42].
While other countries, such as the United States, China, or Saudi Arabia, are highly relevant in the study context, they were excluded from this study for the purpose of minimizing complexity. Expanding the study to include additional countries would increase the complexity of data analysis and interpretation. The selection of the UAE, Australia, and Spain thus enables a focused analysis of three distinct yet complementary scenarios, thereby assuring that methodological consistency is realized and enabling actionable insights that could guide sustainable practices in hydrogen production across contexts.
3.5.1. Understanding Water Management in Hydrogen Systems
Desalination for Hydrogen Production
Desalination has emerged as a crucial technology for providing water inputs required for industry in arid and water-scarce regions such as the Middle East, North Africa, and parts of Australia [
8]. This makes desalination a vital technology for supplying water inputs required for hydrogen production. Of all desalination technologies, RO is the most adopted so far due to its lower energy consumption and technological availability compared with thermal processes such as multi-stage flash distillation (MSF) and multiple effect distillation (MED). The SEC in seawater desalination depends on the level of technology, salinity of seawater, and regional efficiencies, hence ranging between 3.5 and 5.5 kWh/m
3 [
2,
43]. Recovery rates from the desalination process are around 42% if RO is the technology used for desalinating seawater [
8], where the rejected water is a highly saline brine that needs to be managed sustainably. According to Kim et al. [
44], single-stage seawater reverse osmosis (SWRO) typically operates best at 40–50% recovery, while two-stage systems achieve an optimal 60% recovery, but the additional stage leads to a higher overall SEC compared with single-stage SWRO. For this study, a value of 50% recovery rate among all the seawater desalination scenarios is assumed [
44].
Kim et al. [
44] also reported that the SEC for SWRO desalination falls between 2.5 and 4.0 kWh/m
3, while full-scale SWRO plants, accounting for both pre-treatment and post-treatment, typically require around 3.5 to 4.5 kWh/m
3 in most cases for single-stage SWRO. For two-stage SWRO configurations, the SEC can be up to 6.7 kWh/m
3 [
43]. Martínez-Medina et al. [
45] reported that SWRO desalination plants typically consume around 3.5 kWh/m
3 of energy, though highly efficient facilities can reduce this to 3 kWh/m
3 in certain cases. Park et al. [
46] suggest that increasing the recovery rate in SWRO desalination is constrained by the maximum durable pressure that membranes can withstand. Higher recovery rates require elevated operating pressures, which can lead to excessive mechanical stress on membranes and increase the likelihood of scaling, particularly from divalent ions like calcium and magnesium, affecting system efficiency and longevity [
46].
Desalination Brine Management
Brine is the highly concentrated saline by-product of desalination processes [
47]. Brine discharge is one of the serious issues related to seawater desalination [
48]. Brine, accounting for more than half of the feedwater volume based on the recovery rates, is often disposed of by marine discharge with dilution. Marine disposal into the sea is currently the most common disposal practice [
2,
43,
47].
However, marine discharge, besides being practical, is posing environmental risks which include increased salinity, changing chemistry of the water, and even destruction of marine ecosystems. It can have localized impacts, breaking up biodiversity, especially in sensitive coastal environments [
49]. The SEC for brine discharge pumping systems in desalination plants ranges from 0.01 to 0.03 kWh per m
3 of water produced [
50]. For this study, it is assumed that both brine from seawater desalination and freshwater purification are managed by marine discharge into the sea. The brine discharge SEC is assumed to be 0.03 kWh/m
3 among all the scenarios with seawater desalination and 0.02 kWh/m
3 for freshwater scenarios [
50].
BT technologies are classified into membrane brine concentration (MBC) and evaporative brine concentration (EBC) methods. MBC technologies include ultra-high-pressure RO, osmotically assisted RO, low-salt rejection RO, forward osmosis, electrodeionization (EDI), and electrodialysis (ED), which use pressure, osmotic gradients, or electrical potential to separate water from brine [
8,
51]. On the other hand, EBC technologies, such as membrane distillation, rely on thermal energy to evaporate water and leave behind concentrated brine, but they are typically more energy-intensive and have higher operational costs compared to membrane-based methods [
51].
In this study, the brine concentration method to treat part of the reject brine in scenario set B is assumed to be ED, as it is an innovative technology that has high recovery rates and can manage high inlet salinity [
47]. The study by Tong and Elimelech [
26] discusses ED as a salt-concentrating technology used in ZLD systems and highlights that the SEC of ED for treating high-salinity feedwater (above 15,000 mg/L) ranges from 7 to 15 kWh per cubic meter of feedwater [
26]. For this study, a middle value of 10 kWh/m
3 is assumed for SEC for BT for all the scenarios with BT [
26]. While a value of 10 kWh/m
3 was selected as a scenario-based assumption, it is important to note that this does not generalize all BT technologies. Other options, such as advanced oxidation processes or chemical softening, may involve different energy intensities and environmental outcomes. These alternatives could be considered in future comparative analyses.
While BT can increase costs and energy consumption, it is essential to mitigate the severe environmental impacts associated with untreated brine discharge, such as harm to marine ecosystems through increased salinity, habitat degradation, and biodiversity loss [
49].
Freshwater Purification
A substitute for desalination, when there are suitable freshwater supplies in the region, is freshwater purification. The major inputs from sources would be rivers, lakes, and municipal water supplies.
There are many treatment methods that could help reach the desired purity of water for hydrogen production. These include processes such as RO, MSF, MED, nanofiltration, ED, EDI, and electrodialysis reversal, which are used for desalination and water purification through membrane filtration, thermal distillation, and electrochemical separation [
8].
Freshwater treatment processes, such as RO or deionization, achieve recovery rates ranging from 70% to 81% depending on the feedwater quality and treatment technology [
2,
8]. Unlike seawater desalination, which faces higher salinity challenges and lower recovery rates, freshwater typically contains fewer dissolved solids, enabling higher recovery efficiencies.
Unlike desalination, freshwater purification is less power-intensive, using from 0.1 to 2.5 kWh/m
3 as the minimum energy requirement for conventional water supplies [
2]. Recovery rates for freshwater purification systems are about 81% if RO is used for purification, while they can reach up to 97% if we use EDI and 90% if ED is used [
8]. For this study, RO is assumed to be used for the freshwater purification process as it requires significantly less energy consumption than the other methods [
51].
3.9. Assumptions and Limitations
The following assumptions were made for the LCA inventory for this study:
Electricity Mix: The regional electricity mixes for the UAE, Australia, and Spain were assumed based on IEA reports [
52]. This is due to it being the data available in the latest update of SimaPro 9.6.0.1.
Technological Uniformity: RO technology was assumed for all seawater desalination scenarios and freshwater purification scenarios.
Brine Management: Marine discharge with dilution was considered standard for desalination scenarios.
Freshwater Reject Management: Marine discharge was also assumed for freshwater purification scenarios.
The study does not account for technological variability within desalination and purification plants, and regional variability in brine management infrastructure is not included. It also does not include the impacts from electrolysis and SMR processes themselves. Moreover, it does not include the downstream impacts, like hydrogen transport or storage. This study considers only the stoichiometric water requirement for hydrogen production (9 L/kg for electrolysis and 4.5 L/kg for SMR [
5,
6]) as feedwater. Auxiliary water uses, such as cooling, are excluded from the system boundary. However, literature indicates that cooling can account for the majority of total water consumption. For electrolysis, cooling water demand is approximately 14.4 L/kg H
2 for PEM systems and 18 L/kg H
2 for alkaline systems, representing about 60–70% of total water use [
3,
50]. For SMR, cooling can add approximately 38 L/kg H
2, contributing more than 85% of total water requirements [
3,
50]. If desalination were required to supply this additional demand, the associated environmental burdens would significantly increase. Future research should expand system boundaries to include these auxiliary uses for a more comprehensive assessment.


