1. Introduction
Worldwide climate change, energy availability, and energy expenses are gradually turning into common challenges confronting the world [
1]. During the past few decades, countries have consistently focused on reducing carbon dioxide and other greenhouse gas emissions. With the global energy transition and the rapid growth of clean energy, renewable resources like wind power, solar energy, and tidal energy have received attention from various countries. Among them, wind power, as an important part of renewable energy, is receiving growing attention and has been widely applied [
2]. In the field of wind energy, offshore wind power has experienced significant expansion and growth over the past 30 years [
3], and due to the richer and more stable advantages of sea winds compared to land winds [
4], the advancement and deployment of offshore wind power is considered a blue ocean for future energy development. In order to reach the “30 · 60” dual carbon targets and encourage clean energy adoption, the Chinese government has implemented a range of new production frameworks [
5]. The benefits offered by policy subsidies have significantly advanced the growth of China’s offshore wind power sector [
6].
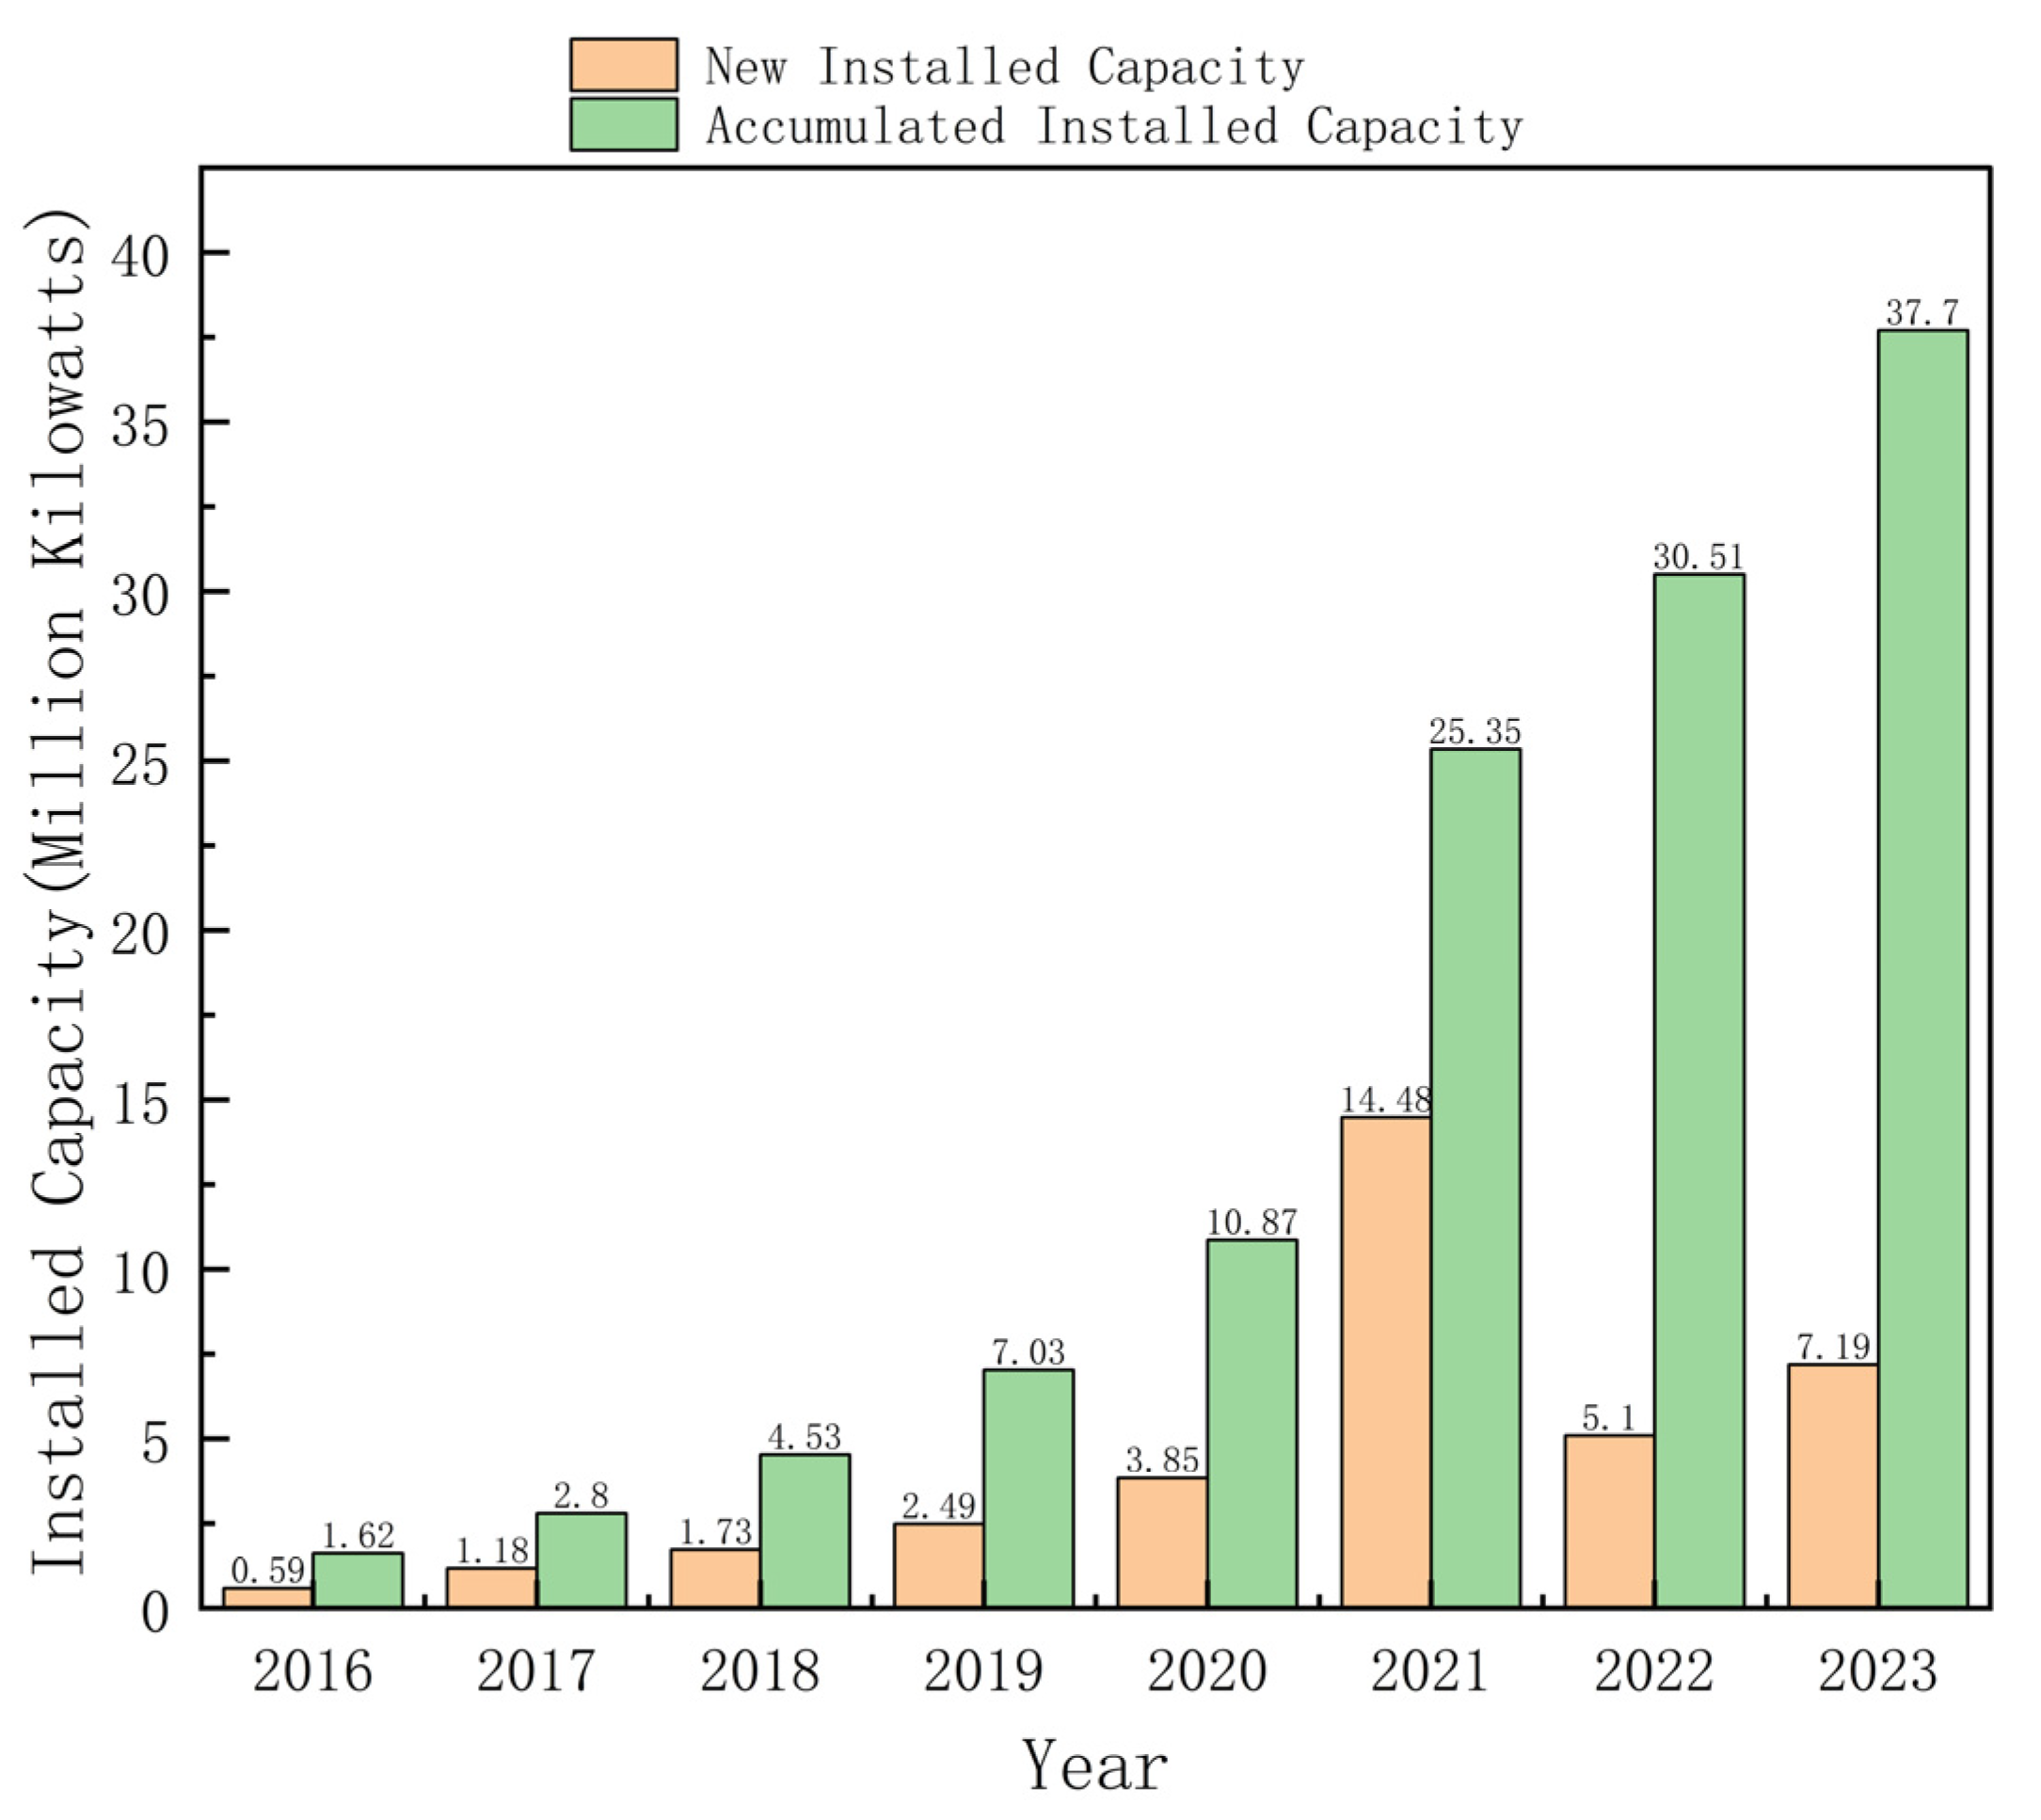
Figure 1 illustrates the commissioned offshore wind power volume in China from 2016 to 2023. As of late 2023, the cumulative offshore wind power capacity in China had attained 37.7 million kilowatts, placing it first worldwide [
7]. Advancing new energy growth serves as a fundamental and efficient approach for accomplishing low-carbon emission reduction targets while satisfying the demands of energy transition and consumption. Offshore wind energy has become a key pillar in global efforts to decarbonize the power sector due to its high capacity factors, scalability, and proximity to coastal demand centers. Compared with onshore wind, offshore wind farms typically offer more stable wind resources and support large-scale deployment. However, the integration of offshore wind into power systems poses challenges due to its intermittency and volatility. To address this, coupling offshore wind with energy storage has emerged as a promising approach to enhance dispatchability and grid stability. Several recent studies have explored offshore wind-storage coordination under different market mechanisms, yet there remains a need for integrated modeling frameworks that consider multi-market participation. Our study contributes to this area by developing a coupled optimization model for offshore wind and storage units across electricity, carbon, and green certificate markets.
However, offshore wind power is characterized by significant intermittency and volatility. Large-scale development can result in severe grid integration challenges. To resolve the imbalance between wind power production and grid demand, battery storage technology has been implemented. Energy storage systems are capable of retaining surplus electricity produced in times of strong wind availability, reducing the intermittency and variability in wind energy and improving the flexibility and dispatch potential within the power grid. Amid continuous progress in energy storage technology and falling costs, integrating offshore wind power with storage systems has emerged as a highly promising clean energy approach. Additionally, the annual financial subsidies often exceed the initial budget, placing a significant fiscal burden on the government. The core conflict between declining subsidies and industry growth lies in identifying ways to unlock the profit potential of offshore wind power, thereby managing investment risks and realizing production-side grid parity between wind and coal power at the earliest opportunity [
8]. Policy and market mechanisms are vital tools for advancing the widespread integration of new resources and reducing state fiscal pressure. To facilitate the incorporation of new sources and enhance the electricity mix, the Chinese government has enacted measures such as the updated quota mechanism, carbon trading scheme, and green certificate program. Unlike previous quota systems, the new quota system imposes mandatory constraints on the minimum integration responsibilities of various regions with “integration responsibility weights,” while attempting to introduce market trading mechanisms to promote the implementation of integration responsibilities and align with the electricity market. The new quota system stipulates that if market entities responsible for integration fail to fulfill their integration responsibilities corresponding to the integration responsibility weight in electricity market transactions, they may choose to either purchase from entities exceeding the integration quantity in the integration quantity market or participate through the green certificate trading platform for subscription. The clean power linked to the green certificate is documented as integration quantity. A newly implemented quota mechanism has resulted in stronger connections linking the power market with the green certificate trading system. As a key policy instrument, the carbon trading system supports China’s advancement of the “dual carbon” initiative. The basic principle of carbon market operation is based on the fact that different enterprises have varying costs for reducing carbon emissions. It motivates companies having low carbon abatement expenses to surpass the reduction targets and sell the excess quotas or emission credits obtained through trading to firms facing high carbon abatement expenses. This helps high-cost enterprises achieve their set emission reduction targets with the lowest social total emission reduction cost, thus controlling the total carbon emissions.
The interaction framework among the power market, carbon trading market, and green certificate system has gradually become an important research topic within energy economics. The interactions within these markets exhibit significant dynamic complexity, which is manifested in the nonlinear relationships among multi-agent decision-making behaviors, the feedback effects of policy parameters and time-varying supply and demand, as well as the long-term evolution of cross-market arbitrage activities. Traditional static or partial equilibrium models are inadequate to comprehensively capture such dynamic interaction processes. In contrast, system dynamics, with its unique strengths in simulating feedback loops, delay effects, and multi-scenario evolution in complex systems, has become an effective method to analyze the evolving dynamics of multi-market coupling. Ref. [
9] incorporates the seasonal variability of hydropower generation and develops a system dynamics framework based on an evolutionary game approach to explore optimal strategies regarding green power and green certificate transactions under seasonal influences. Ref. [
10] develops a system dynamics framework and conducts a case-based scenario analysis to capture the intricate causal relationships between key variables, thereby clarifying the strategic choices made by green certificate electricity generators. Ref. [
11] utilizes a system dynamics approach for exploring the evolving interconnections among carbon trading, tradable green certificates, and power markets. By means of simulation experiments, this study clarifies the temporal evolution and behavioral dynamics of these interconnected market systems. Ref. [
12] proposes an integrated system dynamics model to explore endogenous interactions within the electricity market, highlighting the underlying structural links that drive the behavior of the system. The connection among multiple markets is formed by the investment actions taken by market players along with the mechanisms of price formation. Drawing on the ongoing transformation within China’s power sector, dynamic equilibrium processes among these linked markets have been examined. Although system dynamics (SD) offers notable advantages in simulating feedback mechanisms, time-varying behaviors, and multi-scenario evolution within complex systems, it still presents certain limitations when used to address the integration among power, carbon, and green certificate markets. SD models typically rely on historical data and assumed parameters, making it difficult to accurately capture the real-time decision-making behaviors of market participants. For example, real-time price fluctuations in electricity markets, quota trading dynamics in carbon markets, and supply–demand shifts in green certificate markets are often characterized by high uncertainty and strong non-linearity. These short-term dynamics are challenging to simulate precisely using SD models alone. Therefore, further exploration is needed from the perspectives of market structure design, benefit allocation mechanisms, and strategic game theory.
As illustrated in
Figure 1, China’s cumulative offshore wind capacity has grown significantly in recent years. Integrating electricity, carbon, and green certificate markets not only enables the government to ease fiscal burdens but additionally boosts revenues from renewable power plants and enhances the penetration level of renewables. Therefore, it has long been highly regarded by all parties.
At present, extensive studies have explored how carbon trading schemes and green certificate exchanges influence the power market. In terms of electricity–carbon market coupling, Ref. [
13] constructs a balanced framework targeting the joint operation of electricity and carbon markets. Electricity markets comprise day-ahead and real-time transaction systems, whereas carbon markets function via ongoing exchange systems driven by competitive bidding mechanisms. Ref. [
14] has modeled the decision-making patterns of electricity producers by taking into account the power and carbon trading markets. Firstly, variable carbon emission intensity (CEI) is proposed to quantify the correlation between power generation and associated carbon discharge, demonstrating that power generation companies act as producers and consumers in the carbon market. Subsequently, a two-tiered structure is developed. At the upper level, the objective is to optimize power producers’ returns across multiple markets by identifying the most effective bidding strategy. The lower level comprises a pair of market-clearing mechanisms, including a day-ahead electricity market designed for cost-effective power allocation and a dual-direction carbon market enabling trading between producers and consumers. This model demonstrates that the dynamic CEI significantly affects cross-market arbitrage for power generation companies by influencing their transaction quantities and stance within the carbon market. Ref. [
15] utilized a speculative equilibrium framework to analyze the balance within the electricity, carbon trade market, and natural gas sectors. The results show that carbon emissions trading and carbon emissions transfer constraints have an impact on the three-market equilibrium. Ref. [
16] introduced a two-phase scheduling framework that thoroughly evaluates the ecological advantages for consumers concurrently engaged in electricity and carbon trading platforms via proactive demand-side control. Case analyses demonstrate that the suggested model can substantially aid in reducing carbon dioxide emissions. Within the framework of coupling the electricity–green certificate markets, Ref. [
17] presents a collaborative trading framework that assesses the expense of achieving provincial Renewable Portfolio Standard (RPS) goals from a dual-market viewpoint—covering both renewable electricity sales and renewable certificate exchanges. This study demonstrates that, compared to provinces independently fulfilling their targets, a cooperative approach can effectively reduce generation costs and enhance the total volume of green electricity production. Ref. [
18] proposes a bilateral trading model that accounts for the uncertainty inherent in clean energy production. By applying collaborative game theory, the research examines the intricate interactions among multiple stakeholders involved in cross-regional transactions and establishes a green certificate-based cooperative game framework to assess how uncertainty factors influence collaborative strategies. Ref. [
19] investigates the negotiation and cooperative operation of tradable green certificates (TGCs) among multiple entities within an integrated energy system. The study develops a multi-player collaborative game framework utilizing TGC bargaining pricing, which effectively optimizes the operational strategies of trading agents. Although existing studies that couple the carbon trading system with the power market or the renewable certificate market with the power grid offer useful insights into decarbonization costs, clean energy revenues, as well as the impacts of government subsidies, such “binary” coupling analyses remain limited in scope. On the one hand, models focusing solely on the electricity–carbon nexus fail to capture the additional incentives provided by green certificates to renewable energy producers, as well as the potential revenues and quota compliance mechanisms introduced by the green certificate market. On the other hand, analyses limited to electricity–green certificate coupling cannot precisely evaluate the influence of carbon pricing upon generation portfolios and power market settlement outcomes, potentially underestimating the role of emission reduction strategies in generation decision-making. Therefore, relying solely on dual-market coupling frameworks—either electricity–carbon or electricity–green certificates—falls short of fully capturing the synergistic effects under multi-market coordination. A more integrated multi-market coupling framework is urgently needed to address these deficiencies and offer enhanced insights into the interrelationships among power, carbon emission trading, and renewable certificate markets.
With the accelerating pace of the global energy transition, the multi-dimensional coupling mechanisms among the interrelationships among power, carbon emission trading, and renewable certificate markets have become a prominent research focus in the field of energy economics. Ref. [
20] incorporates demand-side flexibility into the design of an integrated trading framework that simultaneously considers local renewable energy credits, carbon emission permits, and power markets. A joint transaction model involving representative market participants is developed to explore the dynamics of such integration. Ref. [
21] proposes an integrated approach to pricing across energy, carbon, and green certificate markets, harnessing the climate-change alleviation potential of green certificates and the clean-power promotion function of carbon allowances. By incorporating carbon taxation mechanisms and a series of interaction strength metrics, the study demonstrates that the proposed method lowers system costs and curbs carbon emissions while enhancing renewable energy uptake. Ref. [
22] designs an integrated market mechanism for electricity, carbon emission allowances, and renewable energy certificates, leveraging multi-agent deep RL with adaptive incentive schemes. The results indicate that diversified incentives boost trading volumes and prices in both carbon emission rights and renewable energy certificate markets, enhancing decarbonization and clean energy adoption. Ref. [
23] addresses renewable generation uncertainty through a stochastic dispatch model that integrates Stackelberg game theory with cross-regional carbon emission trading (CET) and tradable green certificate (TGC) mechanisms. This framework formalizes intricate stakeholder interdependencies, generating dispatch solutions that equitably allocate benefits across entities. Ref. [
24] simulated market-clearing processes across electricity, carbon emission, and renewable certificate sectors, investigating producer–market interactions and equilibrium states. Employing non-cooperative game principles, this work establishes a market-alignment gauge for multi-player cross-platform scenarios, evaluating strategic offsets against Pareto-efficient outcomes. PSO (particle swarm optimization) implementation resolved market equilibrium, using Nash equilibrium proximity as the terminal condition. This work substantiates the coherence of the synthesized market construct and its equilibrium convergence mechanism. Ref. [
11] leveraged system dynamics modeling to examine cross-market couplings in CO
2 allowance, renewable credit, and electricity trading systems. The experimental analysis revealed emergent patterns in system couplings across temporal scales. Ref. [
25] characterized decision archetypes and equilibrium solutions in tripartite market co-dynamics (carbon–electricity–REC). Specifically, mathematical optimization techniques were applied to examine market equilibrium across various market configurations and policy settings, and an optimal decision model for market participants in a multi-market coupling scenario was established. A simulation case study was conducted, featuring three distinct policy scenarios (power market, power market with tradable renewable energy certificates, and power market with tradable renewable energy certificates and an emissions trading scheme). The computational simulation demonstrated the interdependent dynamics among the electricity trading system, renewable energy certificate market, and carbon trading scheme. Conclusively, the research offers policy recommendations for coordinated REC–carbon market integration, mitigating price volatility, asymmetric participation, and emission reduction challenges. Ref. [
12] built a dynamic simulation architecture capturing network interdependencies in wholesale electricity markets. Through the integration of different markets via market actors and pricing dynamics, the study examined the evolving equilibrium dynamics across multiple markets, taking into account China’s current electricity market liberalization status. Ref. [
26] conducted a simulation analysis to examine the interdependent effects of tradable green certificate and carbon emission trading schemes on electricity markets (2020–2026). A strategic coordination framework was established to decode synergistic optimization pathways for TGC and CET convergence. Empirical analysis demonstrates that implementing renewable certificate and carbon markets refines generation portfolios, mitigating fossil-based carbon trajectory in electricity systems and expediting sectoral peak carbon attainment. Finally, policy suggestions were proposed to enhance the effectiveness of TGC and CET and to jointly implement and optimize various emission reduction policies. Ref. [
27] presented an optimization model to facilitate the participation of fossil and renewable energy generator alliances in the joint electricity–carbon–green certificate market. The findings revealed that coordinated participation of renewable and fossil energy units in the electricity–carbon–green certificate market can boost renewable energy utilization and mitigate clearing imbalances in the electricity spot market. Ref. [
28] developed a multi-regional, multi-market equilibrium framework to assess the feasibility and benefits of integrating the carbon emission trading market with the renewable energy certificate market. The model showed that as long as the government simultaneously targets the two key objectives of cutting carbon emissions and expanding renewable energy, coordinating these markets can result in higher economic efficiency. Ref. [
29] examines the optimal pricing of tradable green certificates for renewable electricity across two market paradigms: separated versus unified green power and certificate markets, alongside the equilibrium demand for both green and conventional power. Ref. [
30] performed an empirical analysis using a Vector Autoregressive (VAR) model to investigate the interrelationships among the carbon, TGC, and electricity markets, aiming to examine price spillovers across these distinct markets. The VAR-BEK-GARCH model based on wavelet-based multi-resolution analysis reveals the multi-scale spillover effects between carbon, TGC, and electricity markets.
Despite the rich body of literature on dual-market coupling models, limited attention has been paid to the joint optimization of offshore wind-storage systems across electricity, carbon, and green certificate markets. Most prior works focus on either electricity–carbon or electricity–green certificate interactions, failing to fully capture the synergies and trade-offs inherent in multi-market participation. This reveals a critical research gap in designing integrated frameworks that enable coordinated market scheduling and strategic participation by offshore wind operators.
Building upon the existing research, this study develops a coupled trading model of offshore wind power with energy storage in large node networks, participating in multi-market coupling transactions involving electricity, carbon, and green certificates. Firstly, offshore wind farms provide forecasts of electricity generation and electricity market quotations. Then, through an electricity market optimization model, the offshore wind power generation, conventional power plants, energy storage system operation, and day-ahead market earnings are determined. Finally, the financial returns from participation in the carbon and green certificate markets are calculated separately. The main contribution of this paper is divided into three parts:
A multi-market coupling trading mechanism integrating electricity, carbon, and green certificate markets is proposed, incorporating energy storage systems to optimize the scheduling and revenue of offshore wind power.
A mathematical model tailored to large-scale nodal networks is developed to simultaneously optimize revenues from electricity, carbon, and green certificate markets.
Simulations show improved wind power revenue and reduced government fiscal burden.
The study is organized as follows:
Section 2 develops the mathematical formulation, details the integrated electricity–carbon–REC trading mechanism, and designs the day-ahead power, REC, and carbon emission market framework.
Section 3 presents the result analysis, which first introduces the simulation settings and then examines the clearing outcomes and market profitability of offshore wind energy configurations with energy storage solutions in the multi-market setting.
Section 4 is a summary that outlines the main conclusions of the research.
2. Experimental Principle and Methods
2.1. The Integrated Trading Mechanism Across Electricity, Carbon, and Green Markets
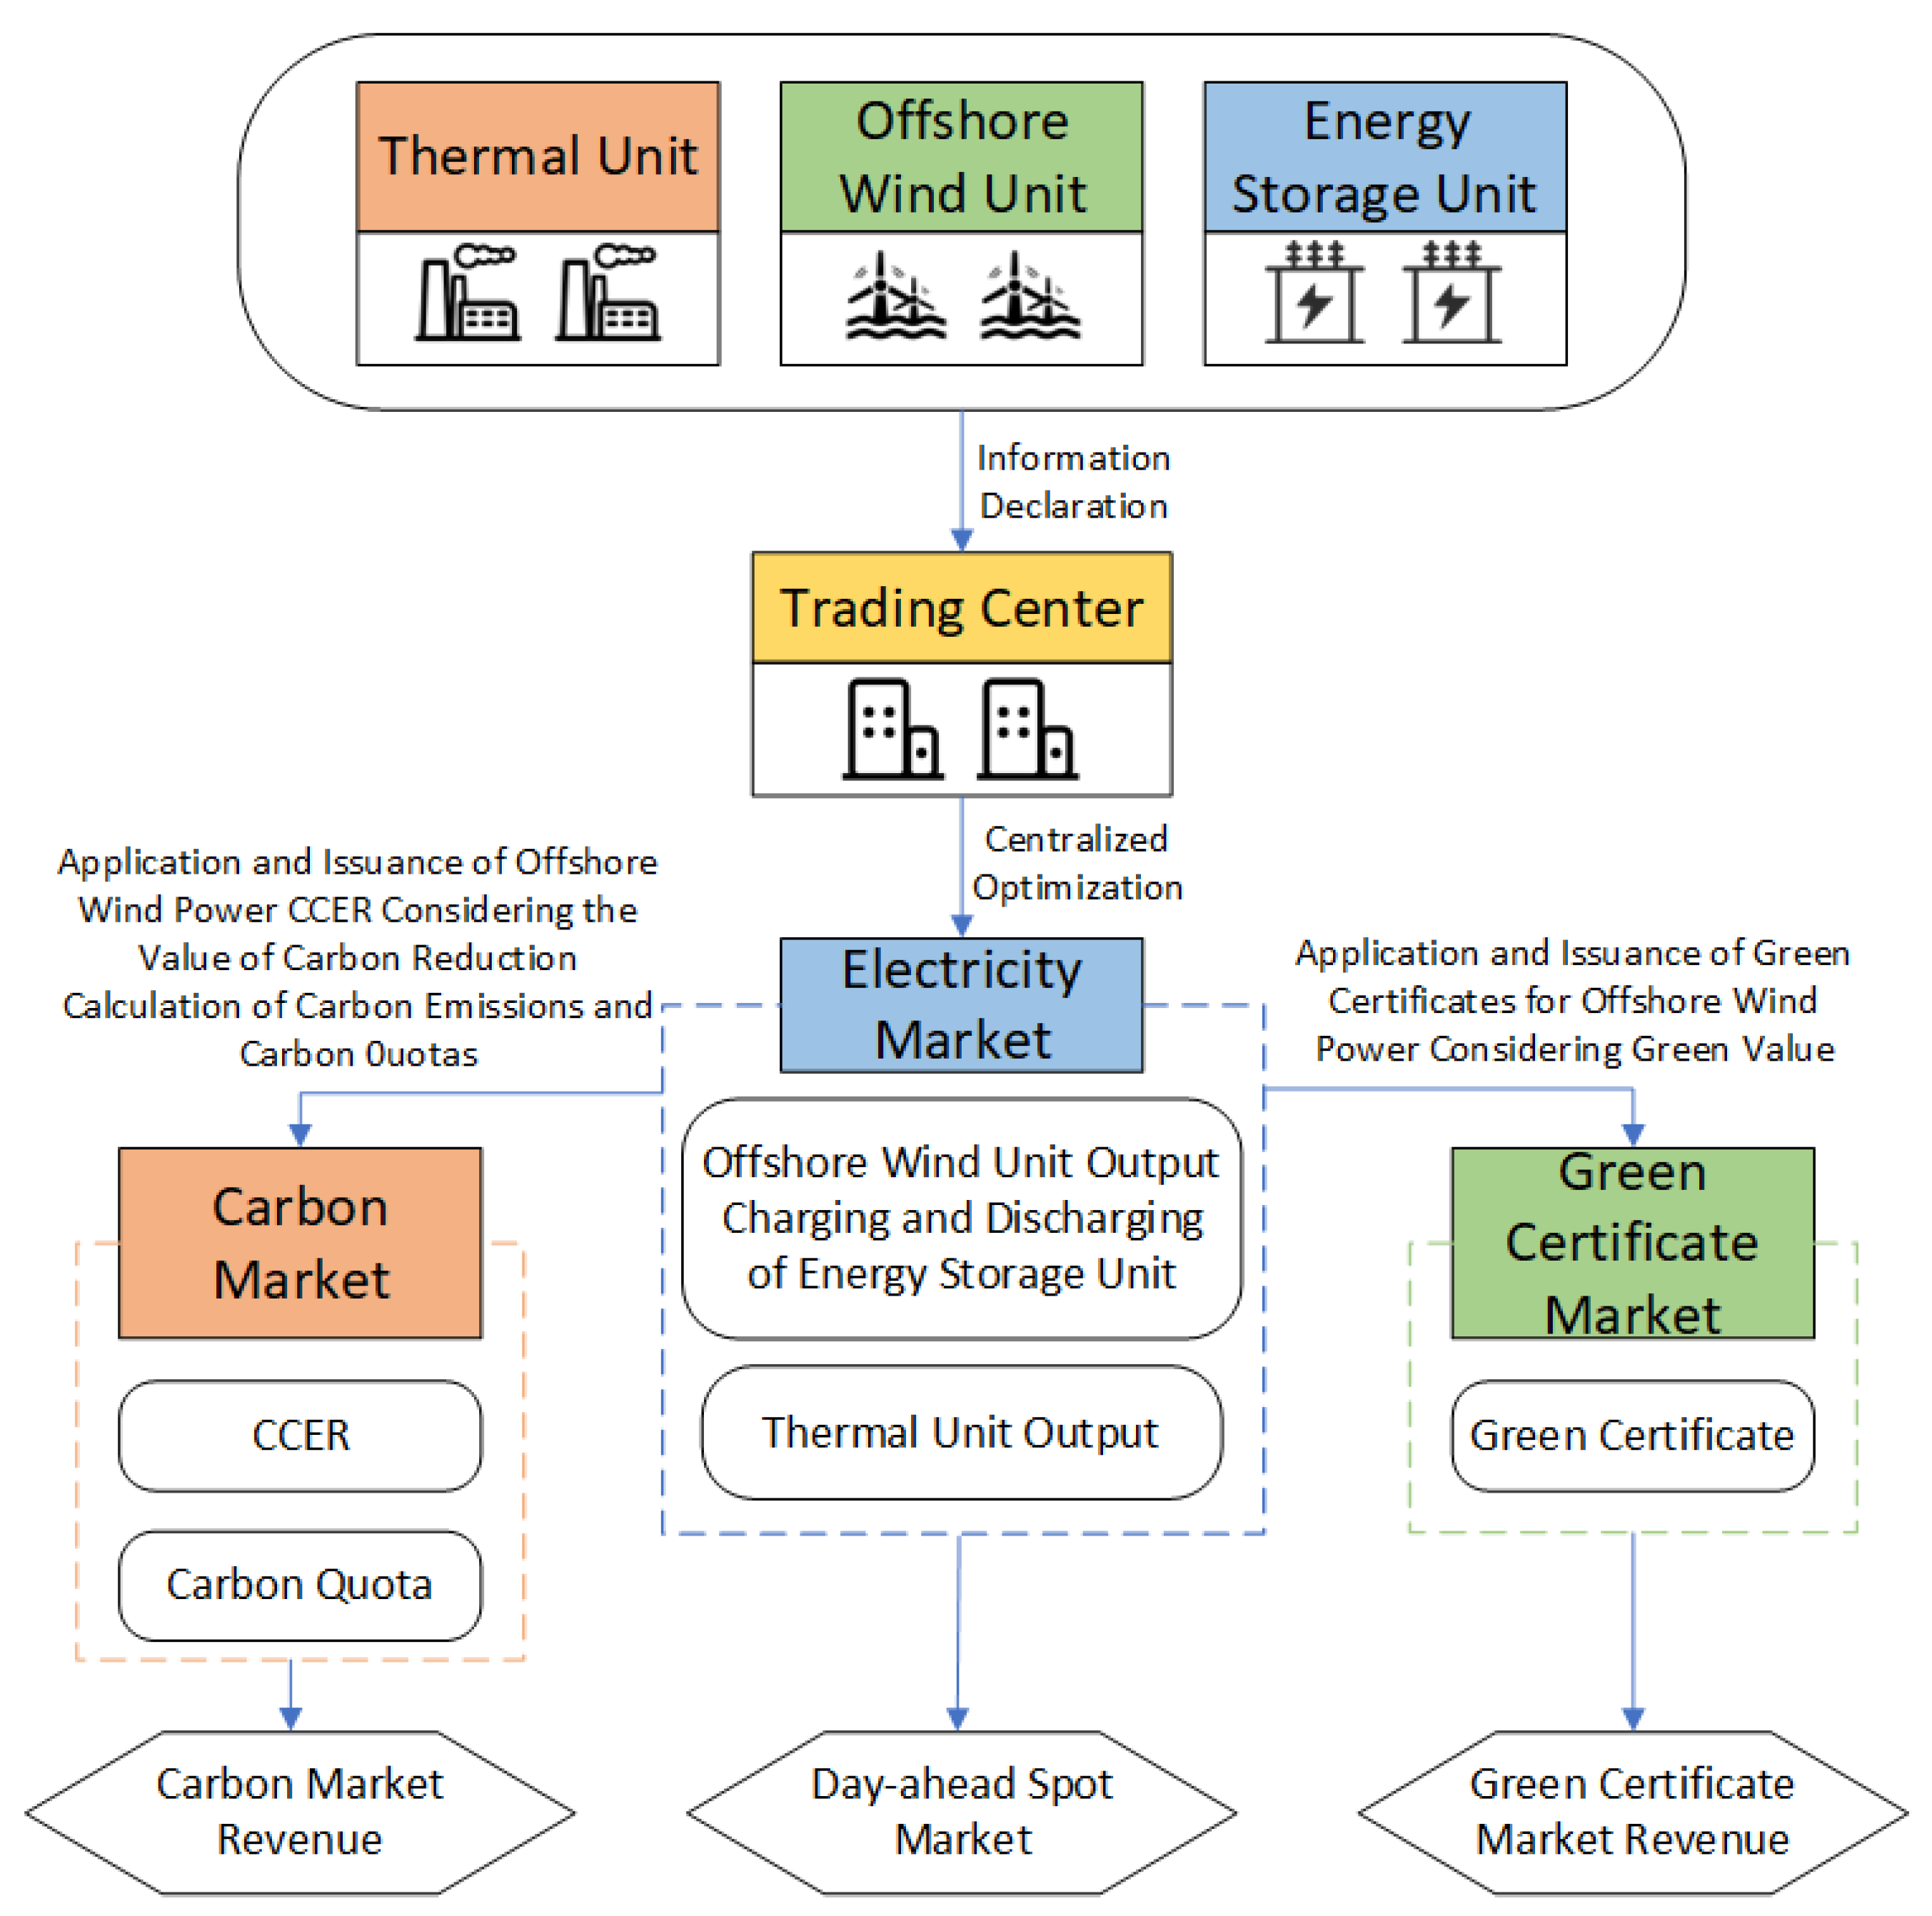
To accelerate renewable energy adoption, China launched the RPS policy in 2020, establishing responsibility weights for market entities involved in integration. The RPS mechanism stipulates that market entities use a specified percentage of renewable electricity. Therefore, TGCs are introduced to quantify renewable energy generation. The coupled trading mechanism across the electricity, carbon, and green markets proposed herein is illustrated in
Figure 2. Firstly, offshore wind power companies submit their electricity quantity and pricing to the trading center. Centralized clearing is performed based on the submitted information, followed by safety verification by the dispatch center. The day-ahead market clearing results then govern thermal unit commitment, generation outputs (thermal/offshore wind), and energy storage operation. Based on day-ahead clearing results, offshore wind power companies simultaneously apply for green certificates (reflecting green value) and CCERs (reflecting carbon reduction value). This process determines green certificate volumes, CCERs, and allowances for offshore wind power. These companies then participate in green certificate and carbon market clearing, calculating revenues from these markets. The green certificate market’s functioning mechanism: Firstly, qualified offshore wind power companies need to apply for RECs issued by the national renewable energy registry. After verification, the center issues the green certificates to the offshore wind power companies. Then, these companies can offer their RECs either to quota entities that have not met the green electricity usage quota set by the NEA and MOF or to voluntary buyers of green certificates. In this process, offshore wind power companies can earn profits by selling green certificates, while quota entities can fulfill their quotas by purchasing green certificates. The carbon market operates through the following steps: Carbon markets are split between voluntary and compliance reduction systems. Within voluntary markets, offshore wind power companies apply for CCERs via new energy projects. After calibration, MEE issues CCERs to offshore wind power companies, enabling revenue generation through their sale.
In the mandatory carbon reduction market, the Ministry of Ecology and Environment conducts annual audits and carbon verification reports for emission control enterprises and issues initial quotas to these enterprises based on the audit results. If emission control enterprises have a surplus of initial quotas, they can earn revenue by selling the surplus quotas. If their initial quotas are insufficient, they need to purchase additional quotas or CCERs to offset the excess carbon emissions beyond their allocated quotas.
2.2. Framework of Day-Ahead Energy Market
This article’s designed optimization model for the electricity market aims to minimize the operating costs of the power system. The objective function is shown in Equation (1):
The equation incorporates several cost components: for the operating cost of the system’s conventional generators, reflecting offshore wind power generation costs, and and representing the combined costs of charge/discharge operations and frequency control services at energy storage sites. stands for the revenue of the power system.
This model’s essential constraint conditions are as follows:
Unit generation output upper and lower limits constraint:
Charging and discharging constraints for energy storage devices:
Energy storage capacity constraint:
Locational marginal price calculation:
In Equation (2), represent the day-ahead power output of thermal units, wind units, and the charging and discharging power of energy storage systems, respectively. The number of thermal power units is denoted by , while the number of offshore wind power units is represented by , and represent the numbers of energy storage devices and load nodes, respectively. denotes the load at the node. represents the power transfer distribution factor. , respectively, denote the network topology structures of thermal power units, offshore wind power units, and energy storage devices. stands for the maximum power flow limit of the network lines. indicates the operational status (start-up or shut-down) of thermal generating units. The symbols and specify the minimum and maximum allowable power generation from thermal generating units. represents the rated power capacity (charge/discharge) of the energy storage system. represent the charging and discharging efficiencies of energy storage devices. is the maximum capacity of energy storage devices. The expression Equation (12) formulates the LMP under the direct current power flow framework. Here, corresponds to the marginal energy component, while , f signifies the marginal congestion component of the LMP.
This model optimizes the unit commitment schedule for thermal generators in the day-ahead stage, determining their start-up and shut-down transitions, as well as the output schedules of each unit and the charging/discharging plans of energy storage devices. All constraints of this model include load balance constraints, network flow constraints, upper and lower bounds on unit power output, energy storage charging/discharging constraints, energy storage capacity constraints, and system frequency regulation constraints.
After running the electricity energy optimization model, market clearing for both the green certificate and carbon markets must be performed, followed by revenue calculation.
2.3. Framework of Green Certificate Market
Within the green certificate market, each green certificate represents 1 MWh of accredited renewable electricity generation. Thus, the number of green certificates
issued during the period is given by:
In Equation (13), denotes the wind power generation during time period .
This paper assumes that the clearing price model in the green certificate market is based on quantity competition, following the Cournot model [
31]. The calculation formula is as follows:
Within Equation (14),
and
denote parameters of the green certificate market’s price–yield model. These parameters are derived from the market’s characteristics. According to Equation (14), we can see that the green certificate price and yield are linear functions that decrease over time. When the green certificate yield is zero, the green certificate price is set to the penalty price
, the maximum allowable price. When the green certificate yield reaches its maximum, the green certificate price represents consumers’ willingness to pay, calculated as follows:
At this point, the green certificate yield equals the RPS-mandated renewable energy quota, calculated as follows:
In Equation (16), represents the day-ahead load demand for time period .
in Equation (15) can be calculated using historical data, while in Equation (16) represents the consumer responsibility weight.
Once the quantities and prices of green certificates are obtained, the revenue from the green certificate market can be calculated as follows:
2.4. Framework of Carbon Market
Within the carbon market, the initial step involves quantifying the carbon emissions
from thermal power generation during period
. According to the emission factor method, this paper adopts the approximation that a unit’s actual carbon emissions scale linearly with its output power. The calculation formula is as follows:
In Equation (18), represents the carbon emission factor. Next, the free carbon quota allocated to the power plant for period must be established.
In this paper, it is assumed that the free carbon quota obtained by the power plant is directly proportional to the total electricity generation. The calculation formula is as follows:
In Equation (19), is the control coefficient for emissions.
The final step is to determine the supply quantity of CCER. The calculation formula for CCER is as follows:
In Equation (20), represents the quantity of CCER obtained by offshore wind farm operators, denotes the average composite marginal carbon dioxide emission factor over the entire lifecycle of offshore wind farms, represents the parameter reflecting the impact of wind power output prediction, denotes the weight of the impact of wind power output prediction, represents the accuracy of the previous period’s wind power output prediction, and represents the established benchmark for wind power forecasting accuracy. represents the average marginal emissions factor of electricity over the entire lifecycle of new energy projects, denotes the weight of the electricity marginal emissions factor, represents the average marginal emissions factor of capacity over the entire lifecycle of new energy projects, and denotes the weight of the capacity marginal emissions factor.
The carbon market revenue can ultimately be obtained by the following equation:
In Equation (23), represents the carbon price. It is worth noting that the electricity price variable in the model is not restricted to be positive. Therefore, the market-clearing framework is fully compatible with negative pricing scenarios, which may arise in high-renewables systems during periods of low demand. This flexibility enables the model to reflect real-world pricing behavior under surplus generation conditions.
3. Results Analysis and Discussion
3.1. Emulation Settings
To verify the efficacy of the proposed methodology, we performed a system simulation on the enhanced case2383wp node network. This network comprises 2383 nodes and 2896 branches. It includes 200 thermal power unit nodes, 123 offshore wind turbine nodes, 200 energy storage nodes, and 1882 load nodes. Historical wind speed data near the coast of Guangdong Province were utilized for offshore wind power output. As for carbon prices, historical carbon prices from the Shanghai Energy and Environment Exchange were utilized. The electricity price reflects real-time market-clearing outcomes. The baseline power for the improved case2383wp node network is 100 MW, and the model parameters are as shown in
Table 1. The market-clearing model was mathematically formulated in MATLAB R2021b, using YALMIP (version 20230622) for optimization modeling and IBM ILOG CPLEX (version 12.10.0.0) as the numerical solver.
In this study, the installed capacity of offshore wind farms is set to 100 p.u., and the battery energy storage system is configured with a capacity of 30 p.u. These values represent a high-renewables scenario commonly adopted in integrated planning studies and serve as baseline inputs for evaluating system coordination and market performance.
The installed capacities of offshore wind power and energy storage systems are set to 100 p.u. and 30 p.u., respectively. These settings reflect a high-renewables scenario in large-scale networks and are consistent with capacity ratios. The ratio of energy storage to wind power (30%) is chosen to balance cost-effectiveness with flexibility and reliability. These assumptions serve as baseline values for the subsequent simulation and sensitivity analysis.
3.2. Participation of Offshore Wind Power with Energy Storage System in Joint Market Clearing Results
The market-clearing outcomes for offshore wind-storage integrated systems are derived through iterative optimization of the stochastic programming-based electricity market model, incorporating both day-ahead dispatch and real-time balancing constraints.
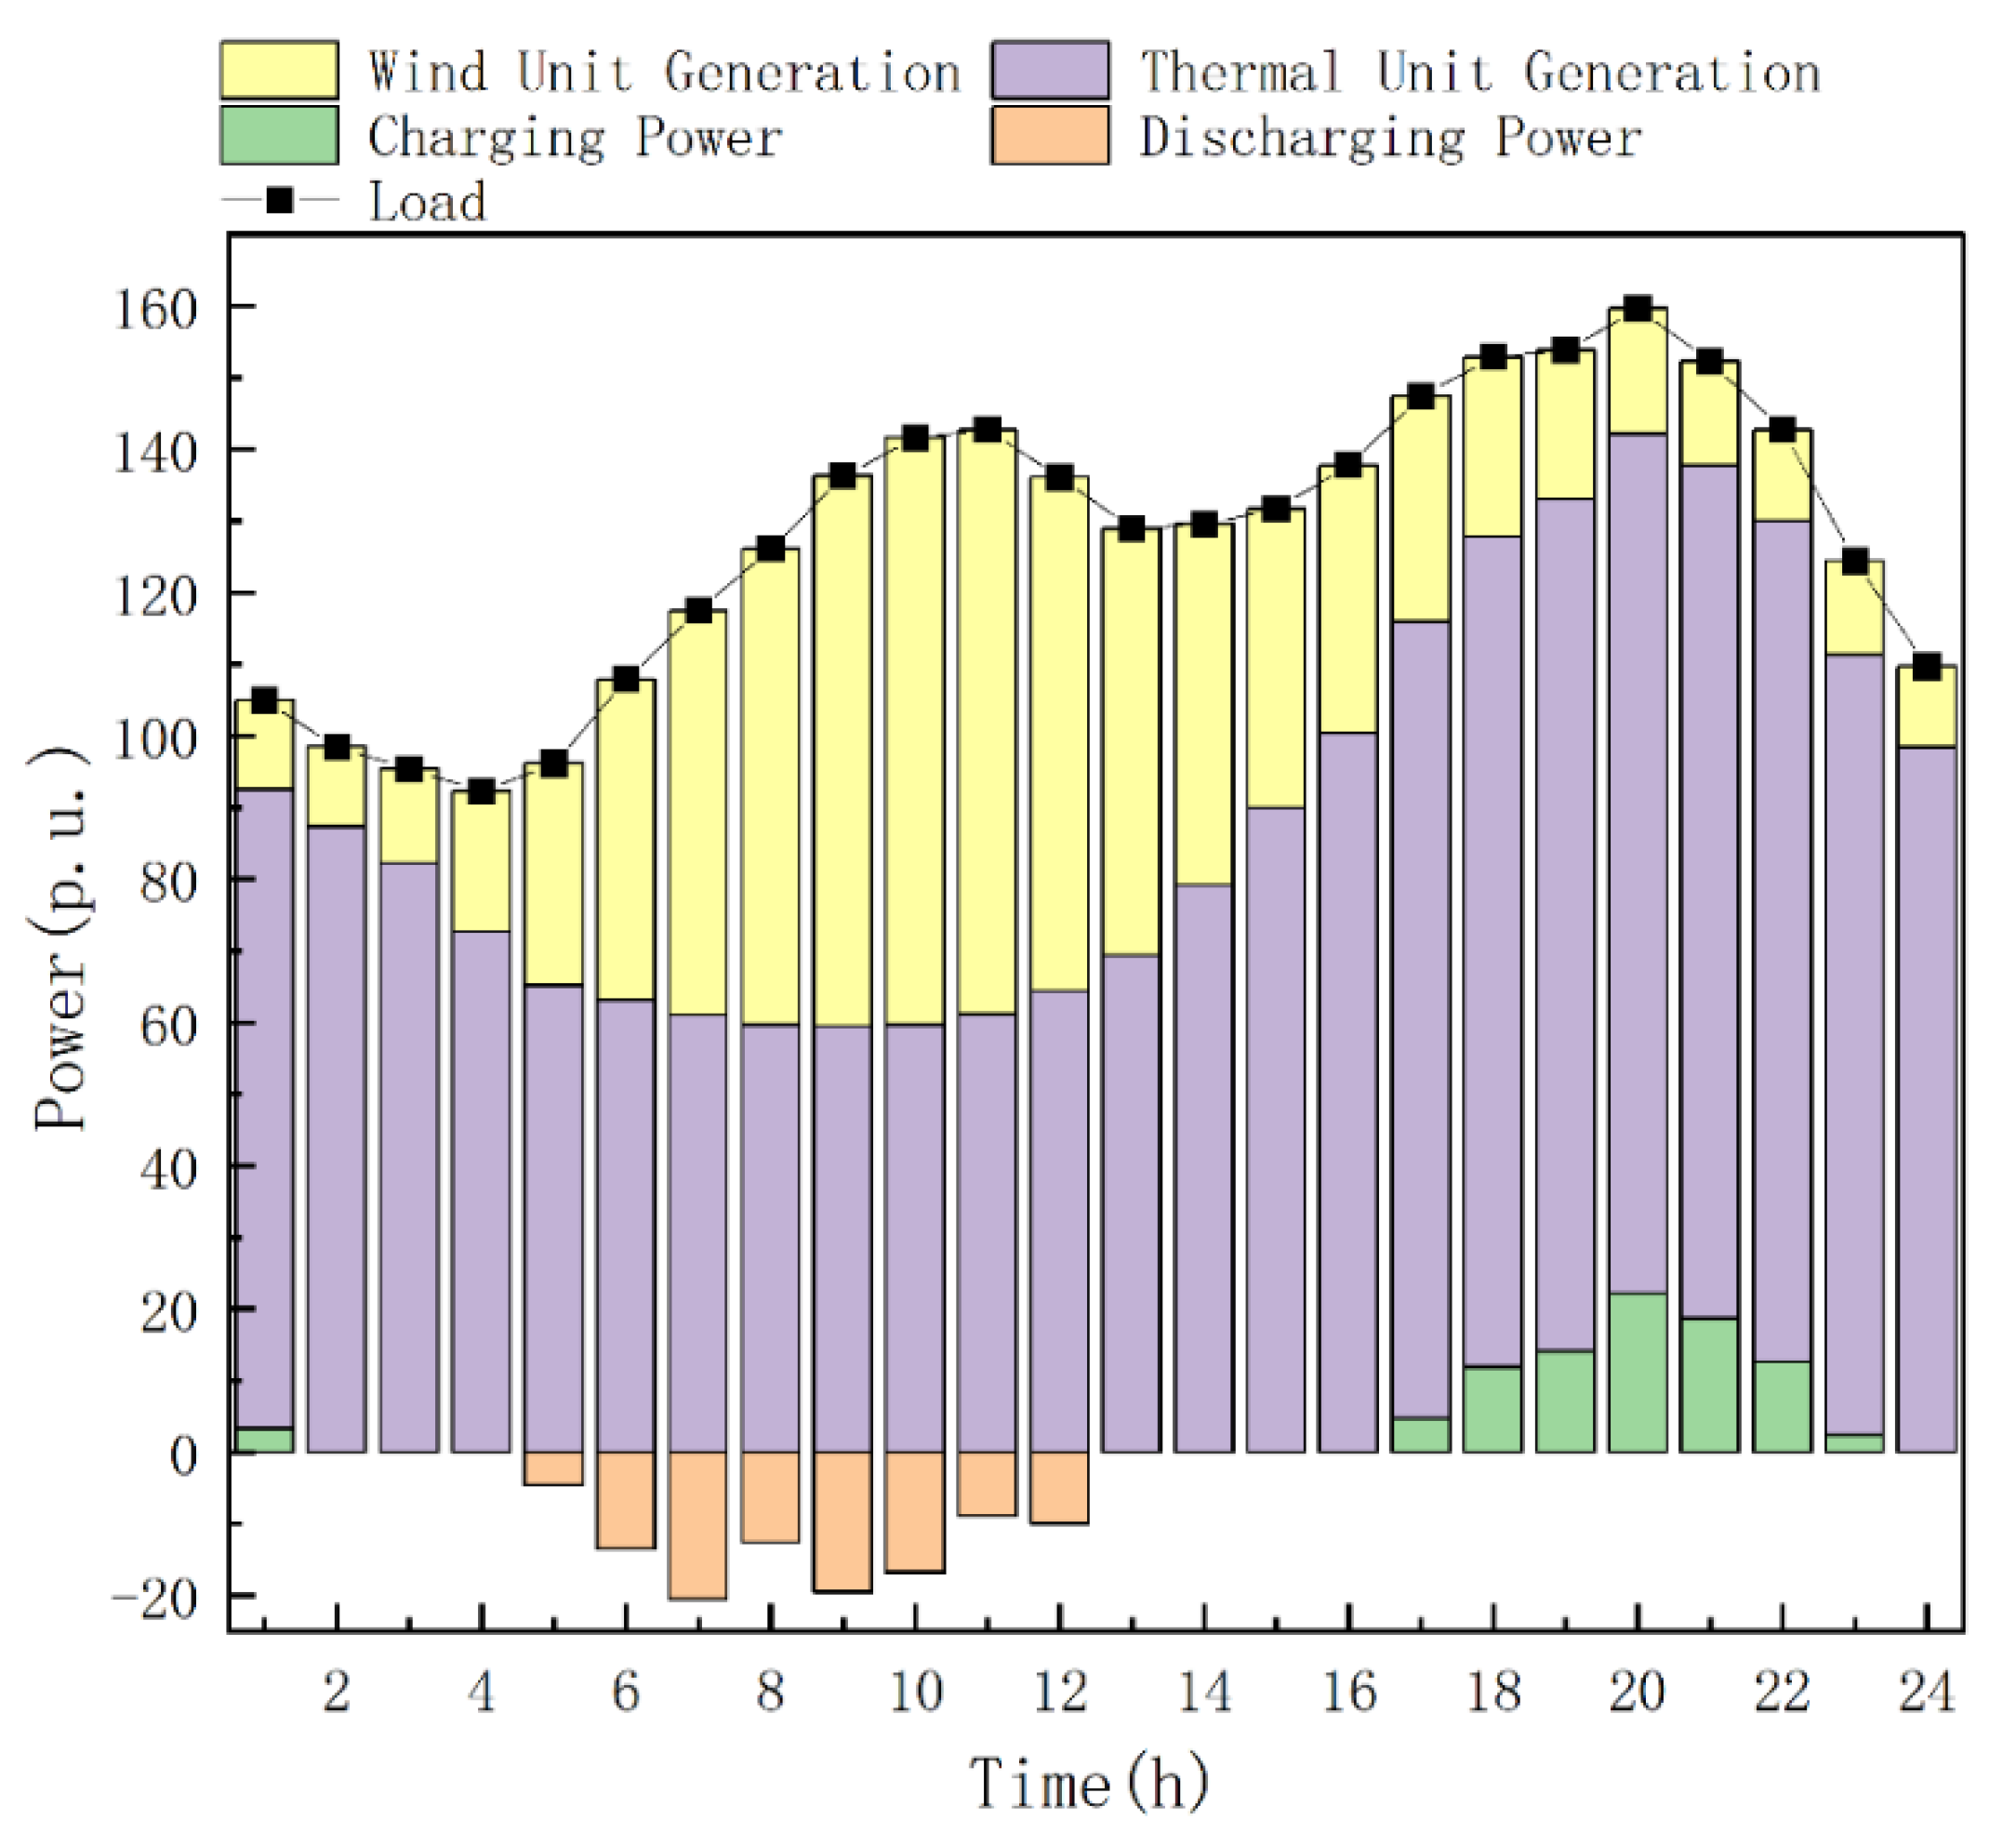
Figure 3 depicts the market-clearing outcomes for the integrated offshore wind-storage system under active power balance constraints.
Figure 3 shows the energy storage system charging during offshore wind power peaks when electricity prices are low (approximately 260 CNY/MWh). Conversely, during periods of high demand and low output from offshore wind turbines, the energy storage system discharges when the electricity market price is higher (720 CNY/MWh) to supplement the power deficit. Taking all factors into consideration, during periods of higher demand, the electricity market tends to be more active, resulting in higher electricity market prices and a tighter supply–demand balance. Under these conditions, the power system prioritizes ramping up thermal and storage output to mitigate market volatility and price swings, while ensuring system security and stability.
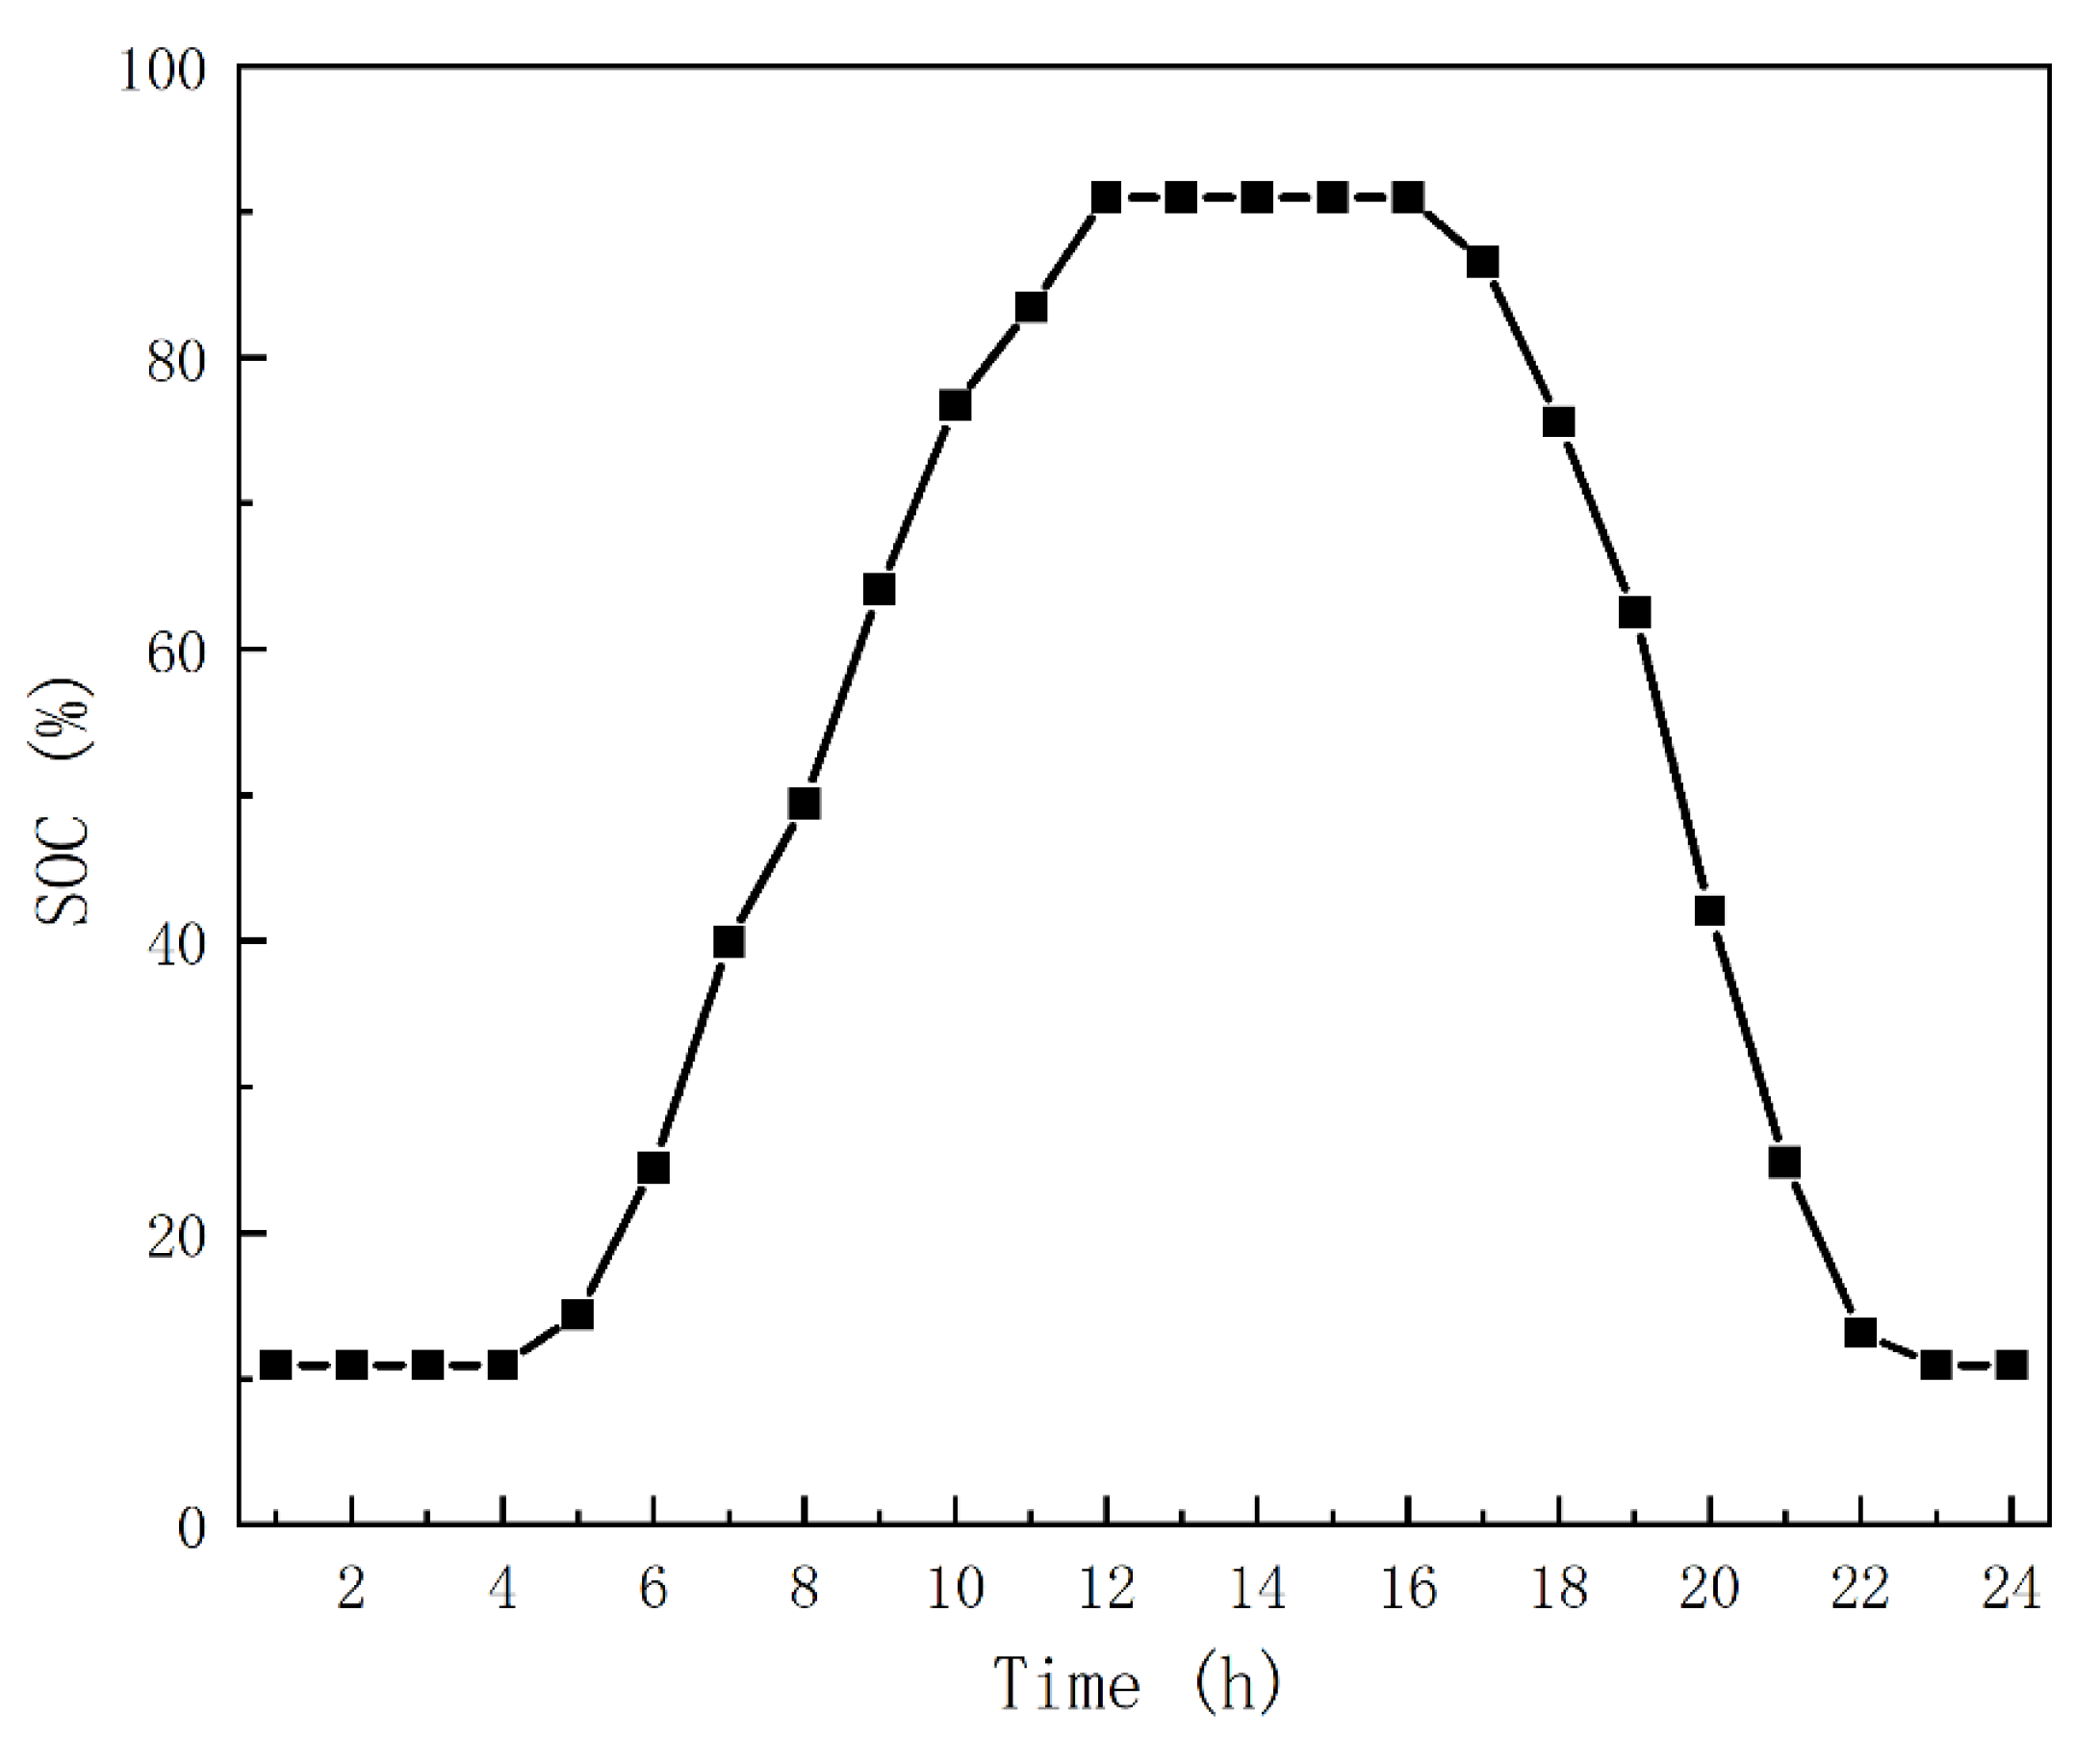
Figure 4 shows the energy storage SOC evolution over a typical scheduling horizon. The SOC curve exhibits a clear cyclical pattern, characterized by a gradual increase during daytime hours and a subsequent decrease at night. This indicates that the system predominantly charges when there is abundant wind energy and discharges during periods of higher demand or lower generation. The SOC reaches a maximum of 90%, indicating that the storage system is appropriately sized and capable of effectively absorbing surplus electricity. The minimum SOC is approximately 10%, suggesting that a safety margin is maintained to avoid deep discharge and therefore extend the lifespan of the storage device. In addition, the SOC curve is smooth and free of significant fluctuations, reflecting good stability and continuity in the charging and discharging processes. This operational characteristic helps improve the integration of wind power, mitigates grid load fluctuations, and achieves both revenue maximization and responsive scheduling when coordinated with multi-markets.
To analyze the trading dynamics and economic performance of offshore wind-storage systems in green certificate and CCER markets, this study enhances the traditional electricity market framework. We incorporate a double auction mechanism and game-theoretic modeling to simulate green certificate and CCER market clearing.
In the double auction mechanism, buyers submit their bid prices
and corresponding demand quantities
. Sellers provide their offer prices
and supply quantities
. The system sorts all buyer bids in descending order and constructs a set of candidate clearing prices by combining buyer and seller quotes. For each candidate price
, the system calculates the total demand from buyers whose bids are not lower than λt, as shown in Equation (24), and compares it with the seller’s supply
to determine the matched quantity, as described in Equation (25). The system traverses all candidate prices and selects the price that results in the maximum transaction volume as the market-clearing price, as shown in Equation (26). Specifically,
represents the maximum matched volume, and the final cleared quantity is denoted as
.
In the above process, and represent the bid price and demand quantity of buyer at time , respectively, while and denote the offer price and supply quantity of the seller at time . is a candidate clearing price at time ; denotes the total demand from all buyers whose bid prices are greater than or equal to ; is the maximum transaction volume achievable between buyers and sellers when the clearing price is ; represents the maximum transaction volume at time ; is the clearing price at time ; and is the final transaction volume at time .
In the game-theoretic mechanism, during each time period, the wind power producer acts as the leader and determines the quantities of green certificates and CCERs available for sale based on wind power output, while setting the corresponding selling price
. Buyers, as followers, make actual purchasing decisions according to their baseline demand and price sensitivity, as described in Equation (27). The model optimizes the profit of the wind power producer by iteratively adjusting the price in response to buyer behavior, where the profit is defined in Equation (28). The optimization utilizes gradient ascent to iteratively update prices until convergence or the iteration limit is met. The update procedure is detailed in Equations (29)–(31).
In the above process, denotes the actual purchasing decision of buyer at time ; represents the penalty price; is the seller’s revenue at time ; is the price elasticity coefficient of buyer at time ; and denotes the -th iteration price at time . represents the learning rate.
Figure 5,
Figure 6,
Figure 7 and
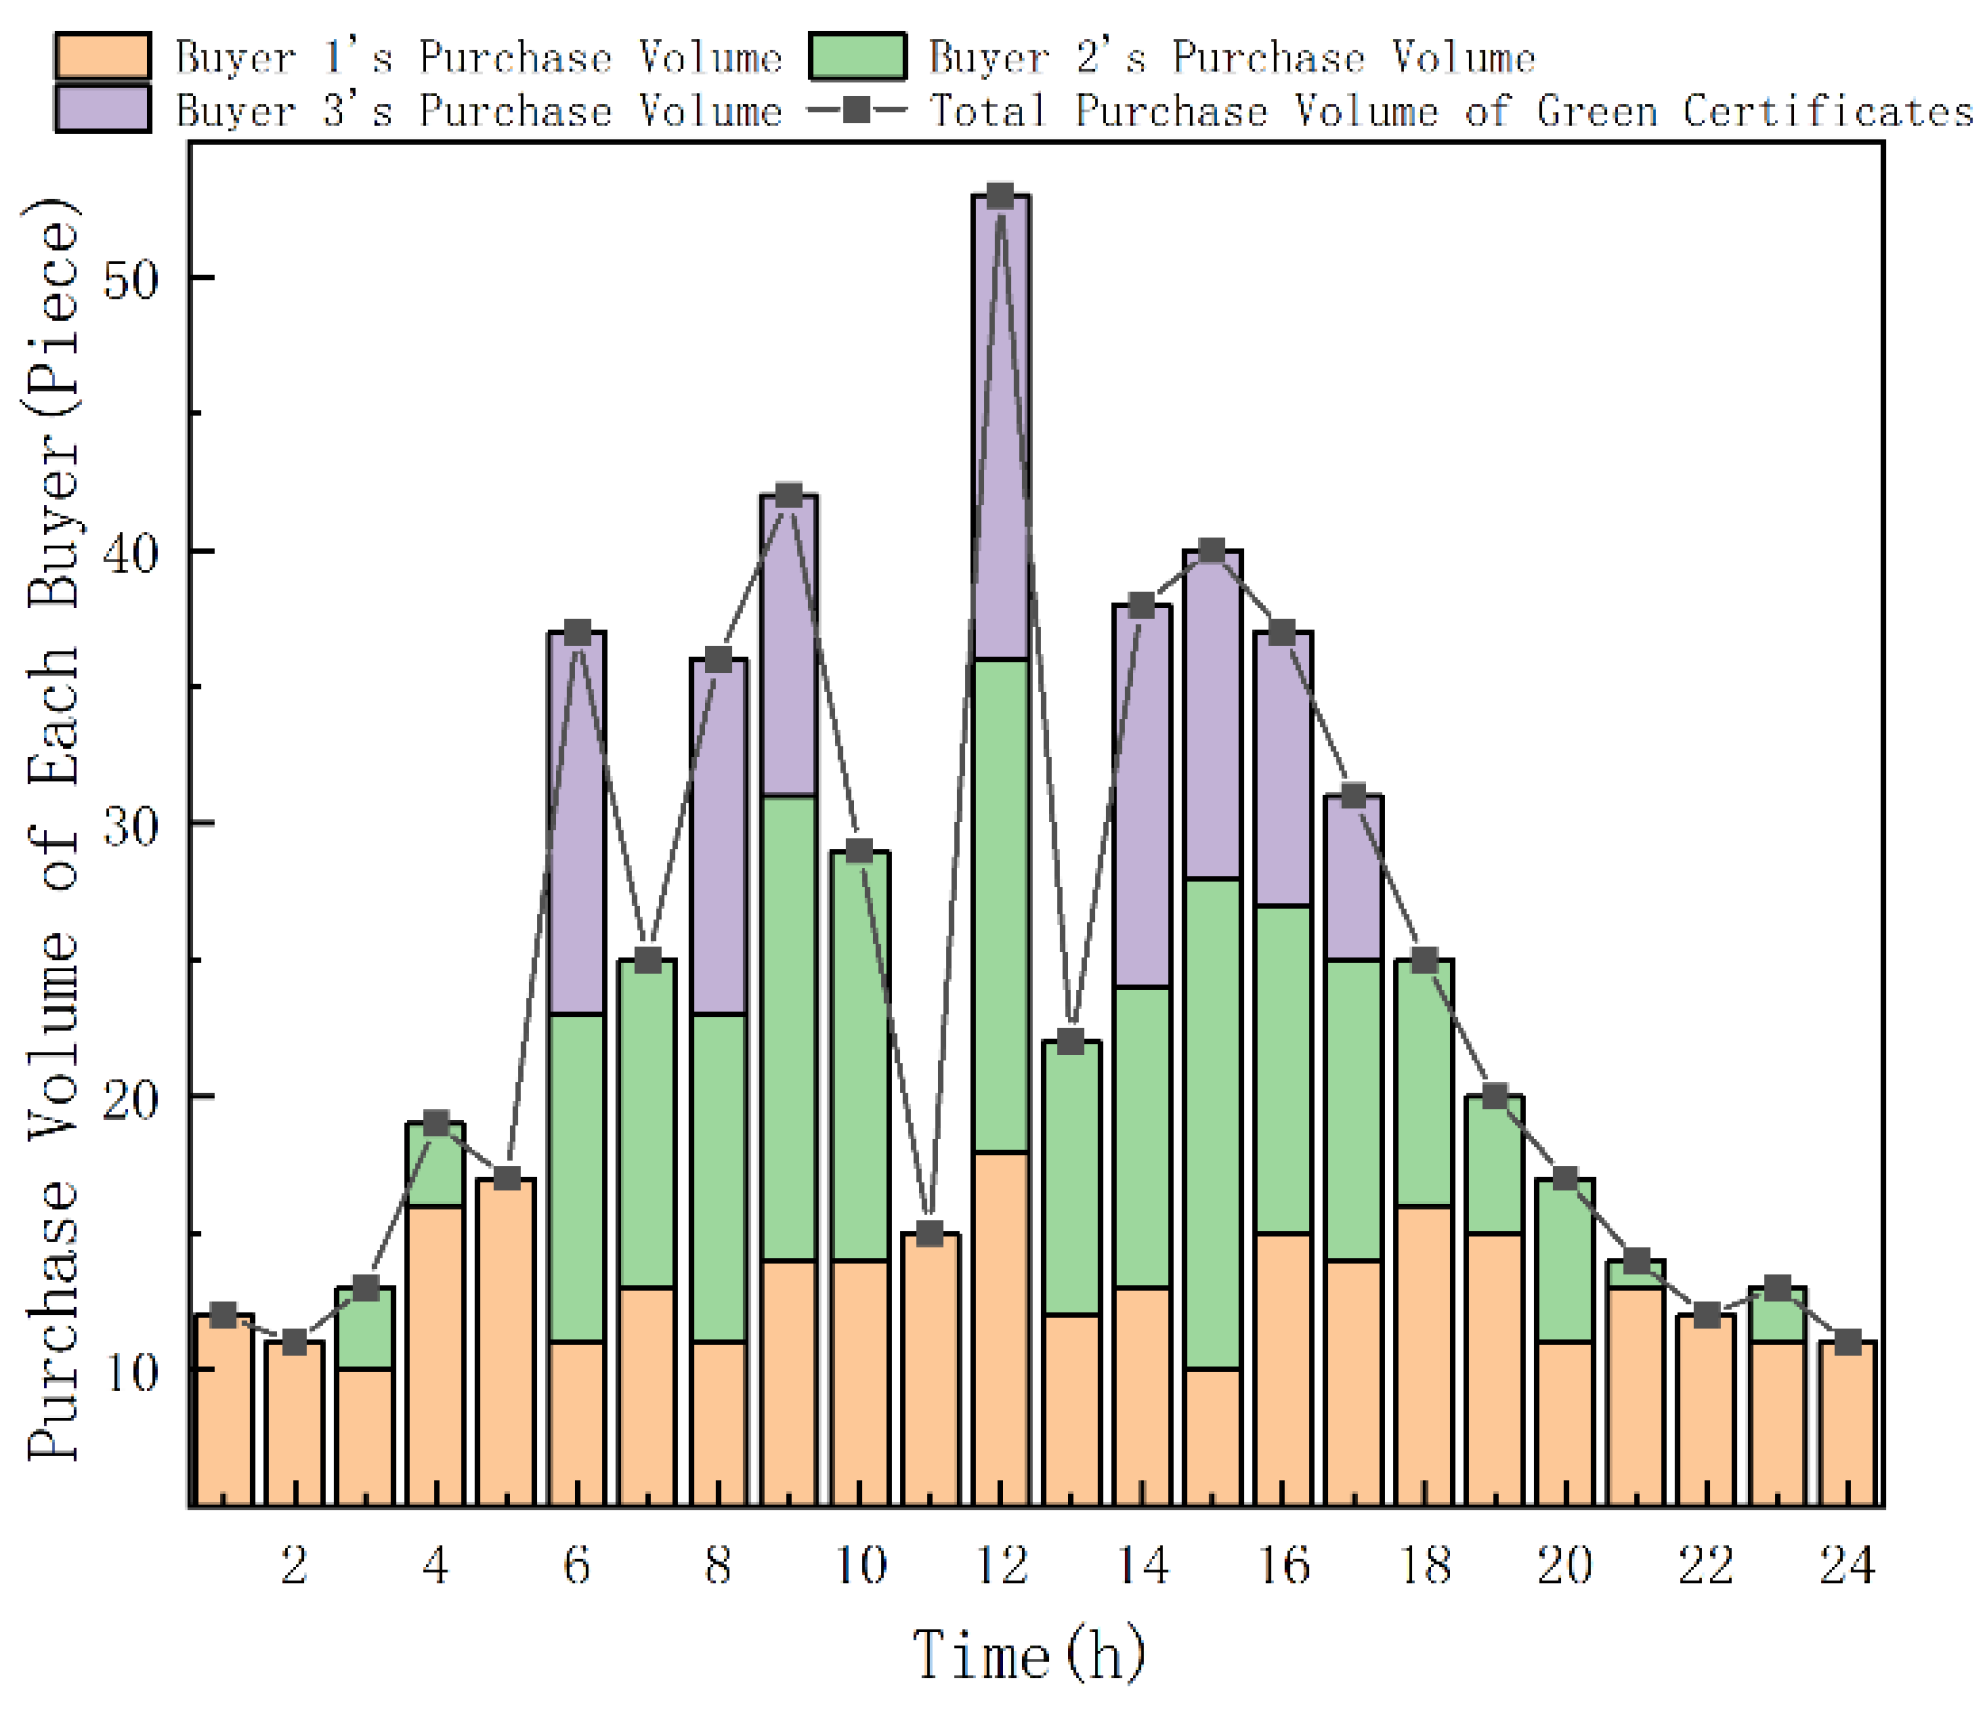
Figure 8 illustrate the hourly transaction volumes of three representative buyers in the green certificate and carbon markets under the double auction and game-theoretic mechanisms. As shown in
Figure 5, the total transaction volume in the green certificate market exhibits an overall upward trend from hour 6 to hour 16, reaching its peak at hour 12, where the trading volume exceeds 50. This pattern is primarily attributed to the high wind power output during the midday period, resulting in ample green certificate supply. Simultaneously, peak demand for renewable energy intensifies market activity on both sides, resulting in substantially higher transaction volumes. In addition, Buyer 1 generally submits the highest bid, and thus the market consistently prioritizes satisfying Buyer 1’s demand. As illustrated in
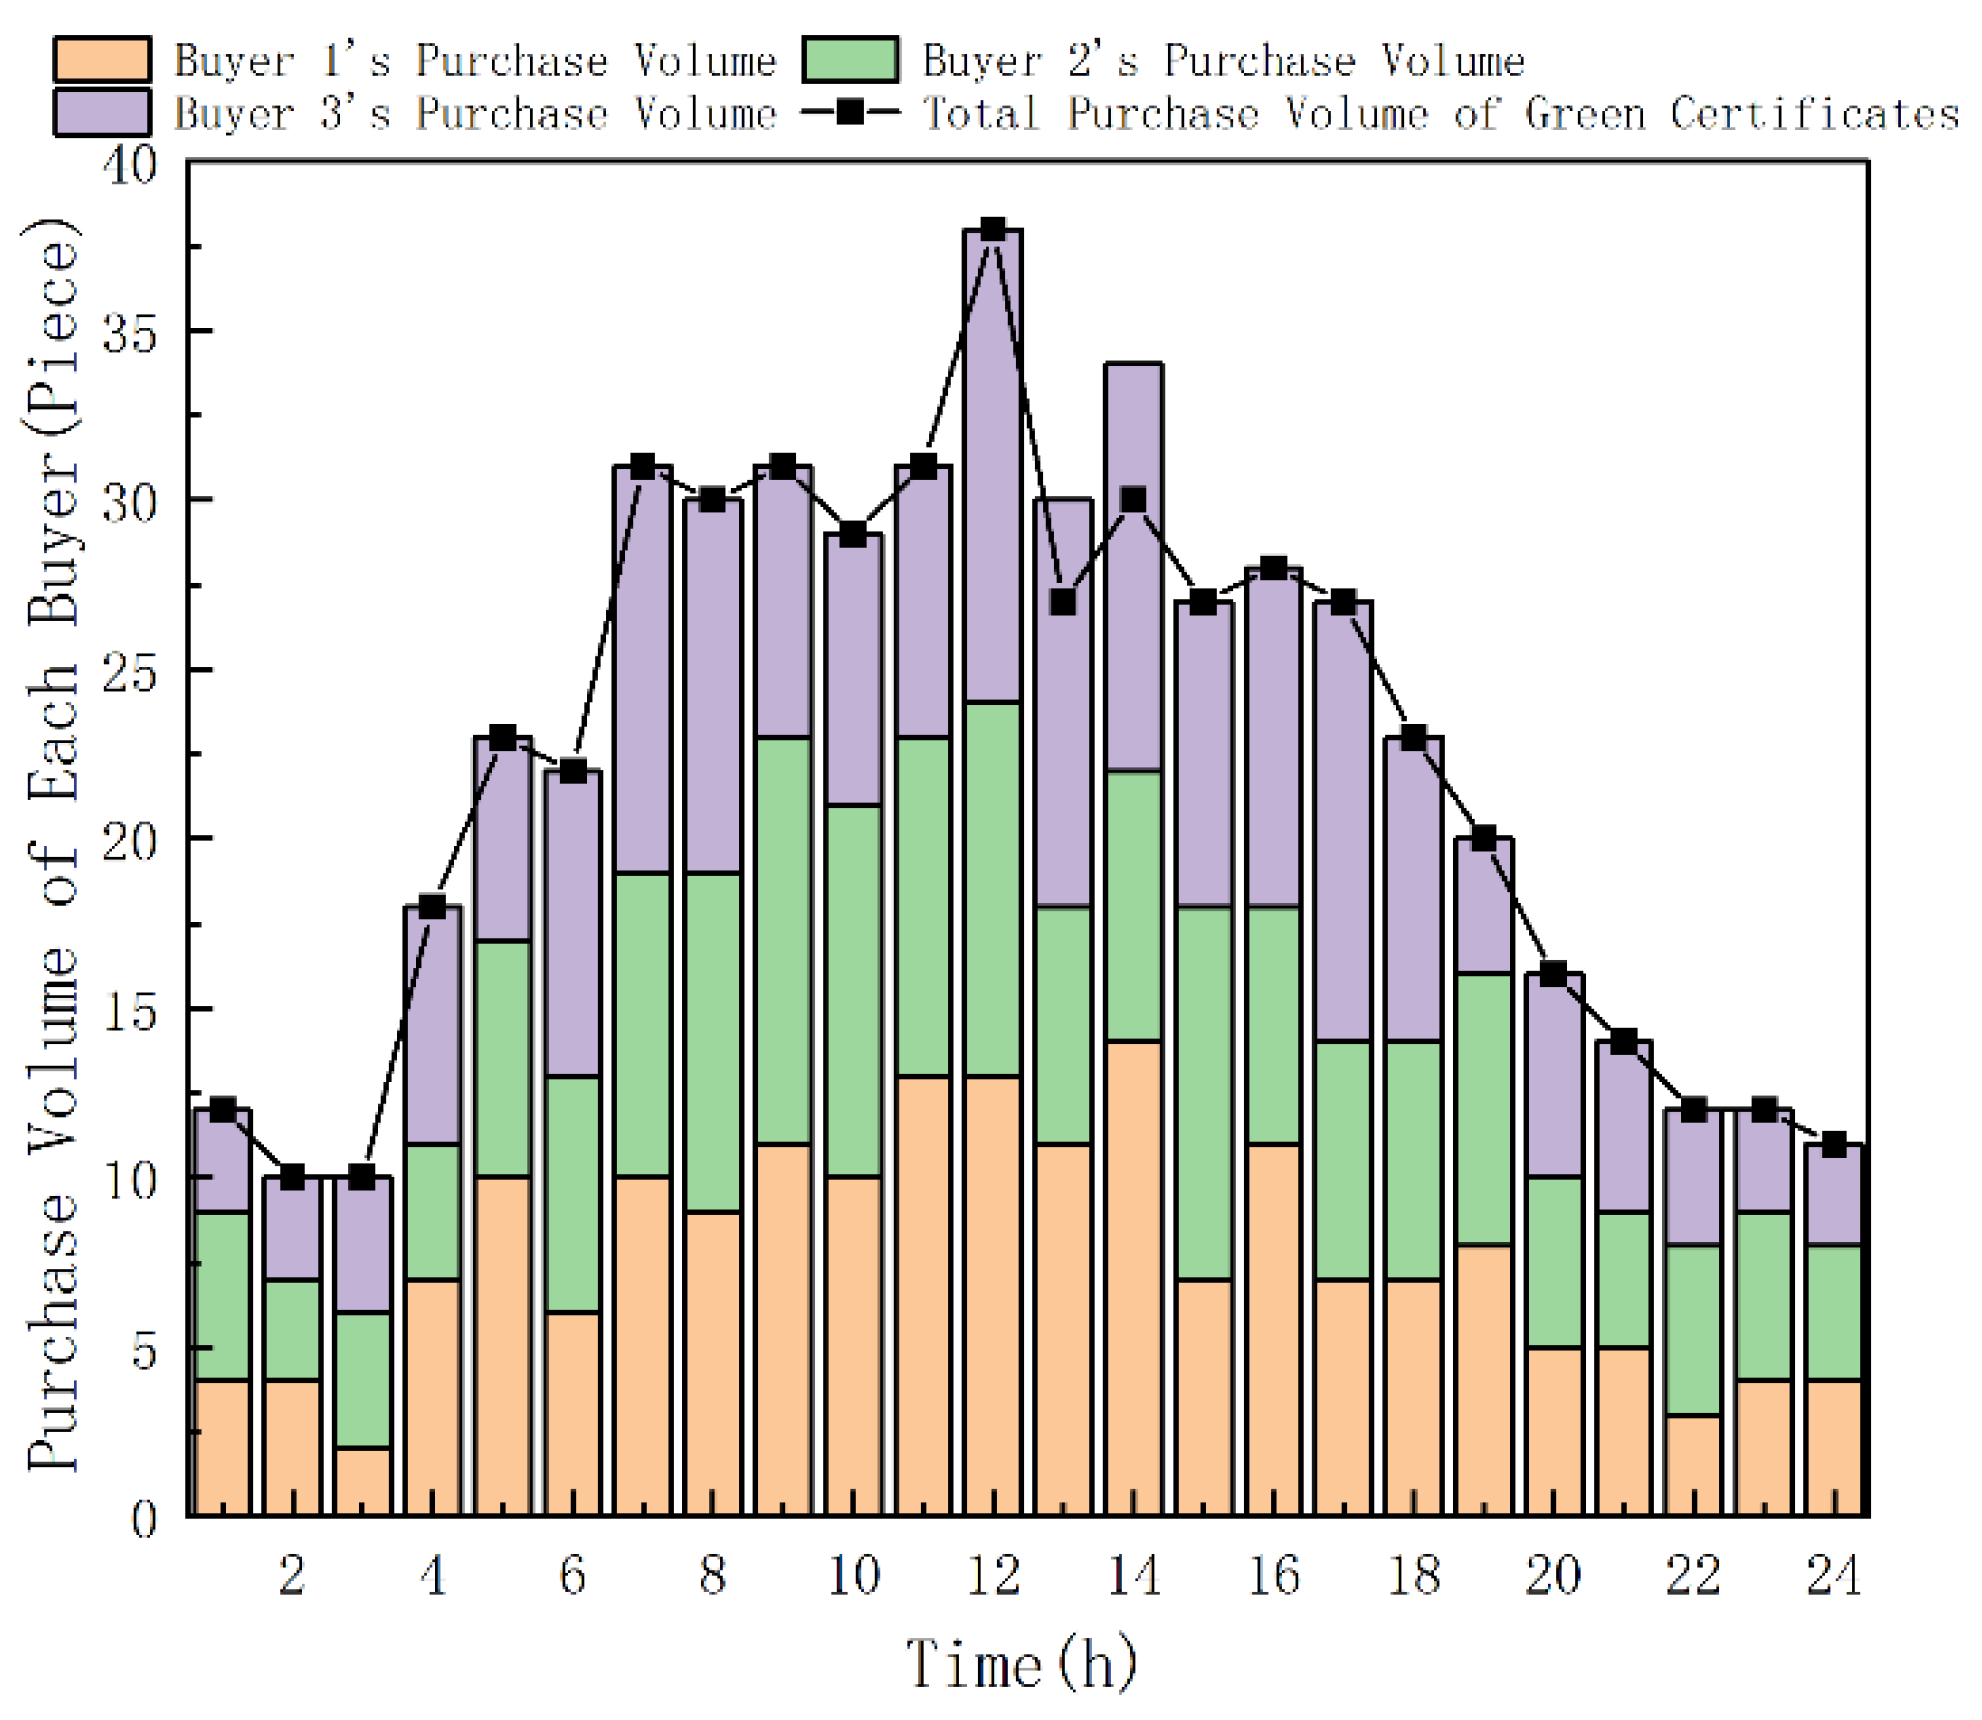
Figure 6, the total green certificate purchase volume during the daytime period (hours 6 to 18) is significantly higher than that during the nighttime, exhibiting a typical peak-load energy consumption pattern. The peak demand occurs at hour 12, indicating that enterprises or institutions show the strongest demand for renewable electricity absorption during this time, with the total purchase volume reaching 30. Under the game-theoretic mechanism, although the transaction volume in certain hours is slightly lower than the peak values observed under the auction mechanism, the overall trading pattern is more balanced. The fluctuation range of each buyer’s purchase volume is reduced, and the market demonstrates enhanced stability. As shown in
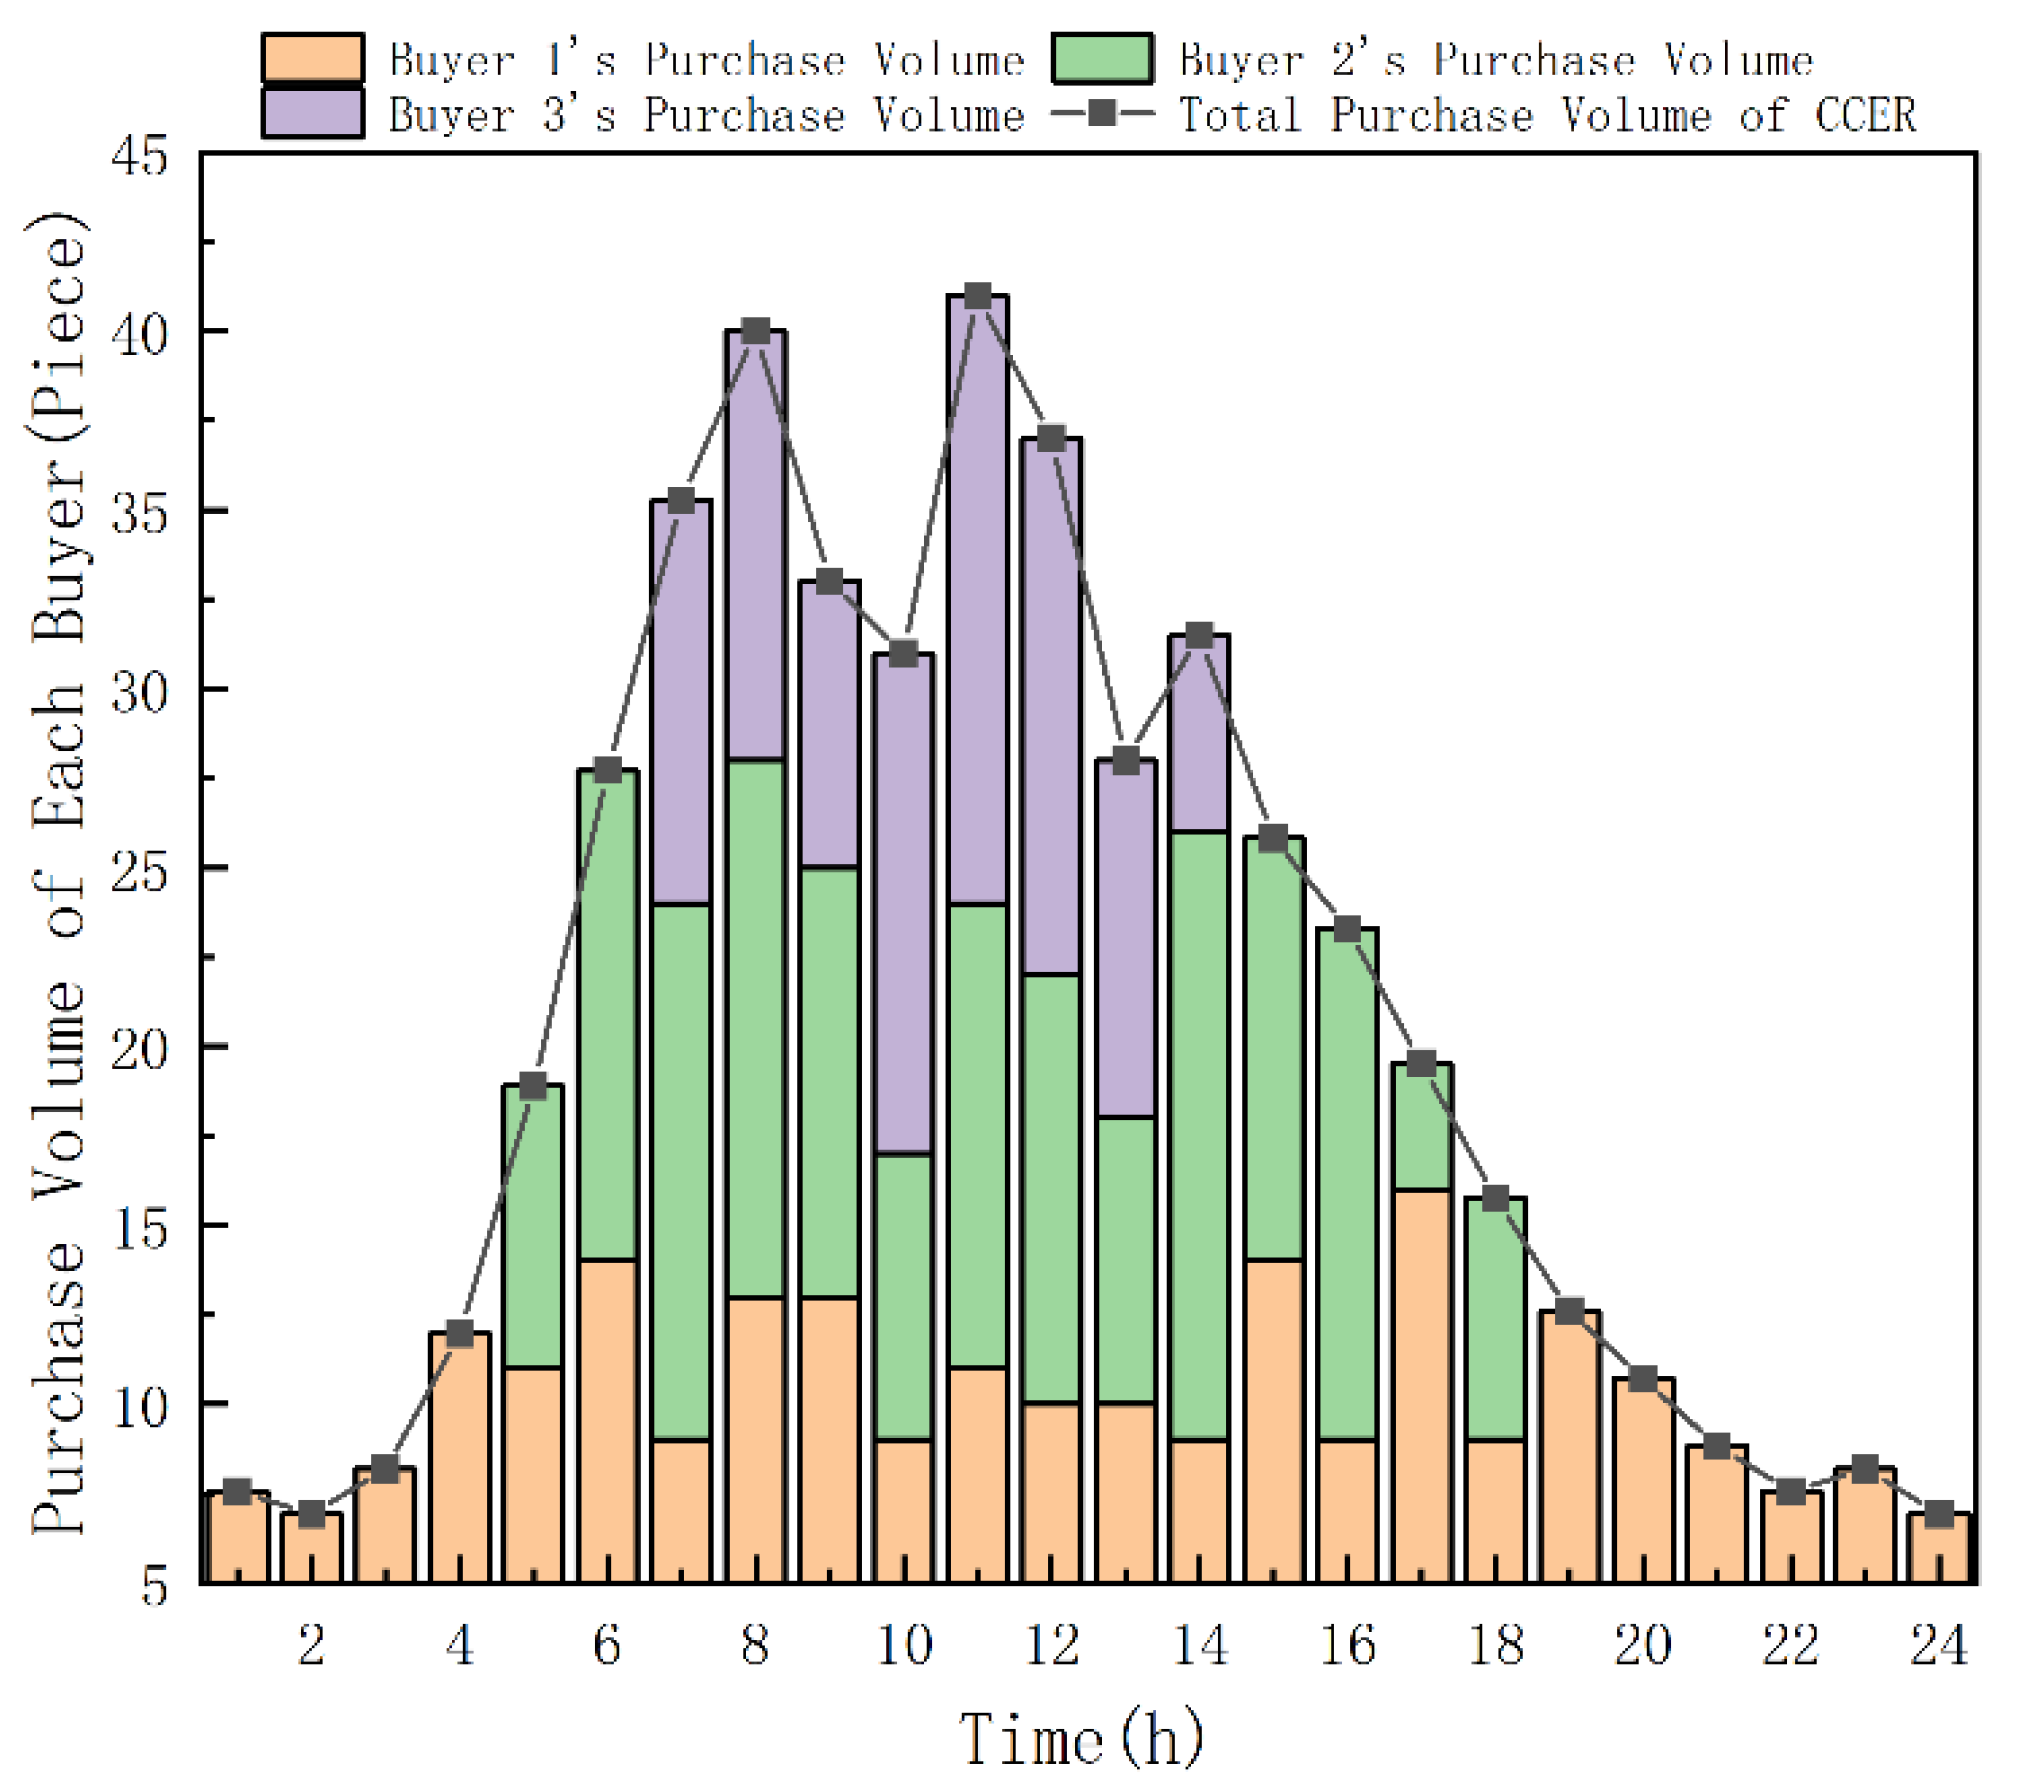
Figure 7, transaction volumes in the CCER market exhibit significant fluctuations. The period from hour 6 to hour 14 represents the peak phase, during which the transaction volume generally exceeds 40 tons. This indicates that during periods of high wind power output and sufficient carbon reduction potential, market activity intensifies considerably. Under this mechanism, notable disparities are observed among buyers. Since Buyer 1 tends to submit higher bids, their demand is usually prioritized. While this price-first mechanism enhances trading efficiency, it also leads to an imbalance in market resource allocation. As illustrated in
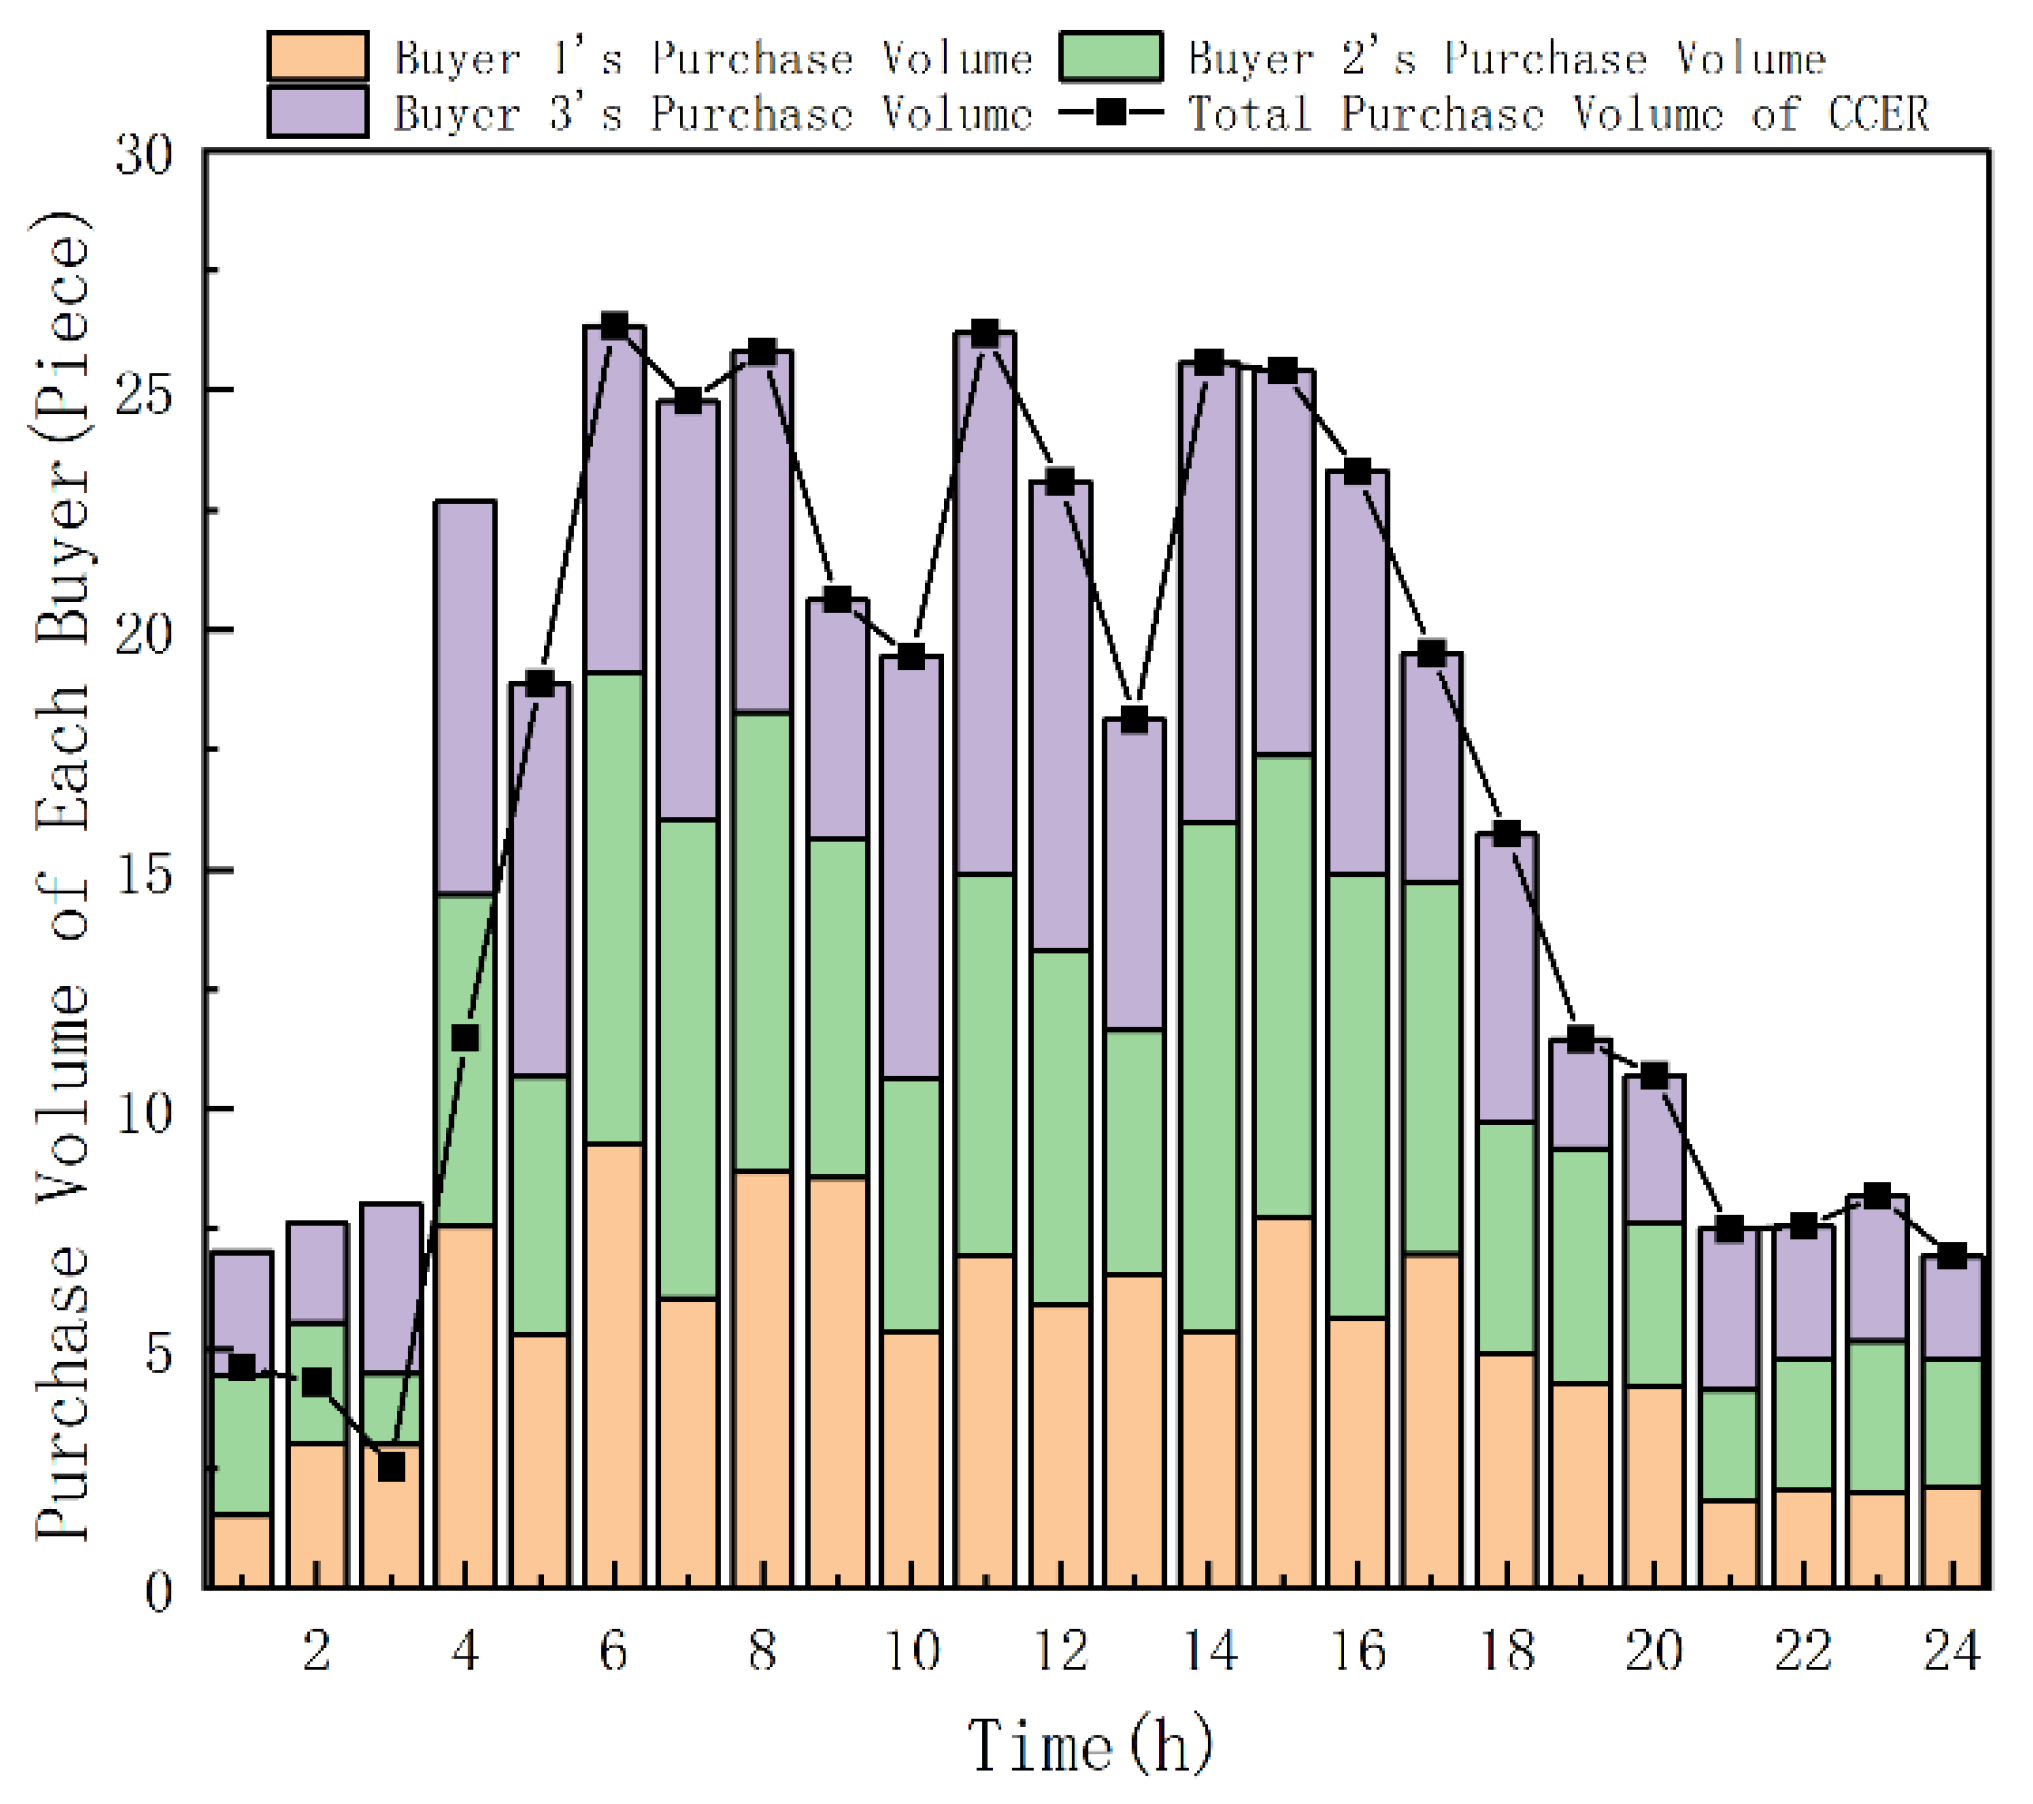
Figure 8, under the game-theoretic mechanism, the total CCER transaction volume is relatively evenly distributed across time periods. The purchasing shares among the three buyers are more balanced, which enhances market fairness and helps suppress extreme competitive behaviors.
3.3. Market Profit Analysis
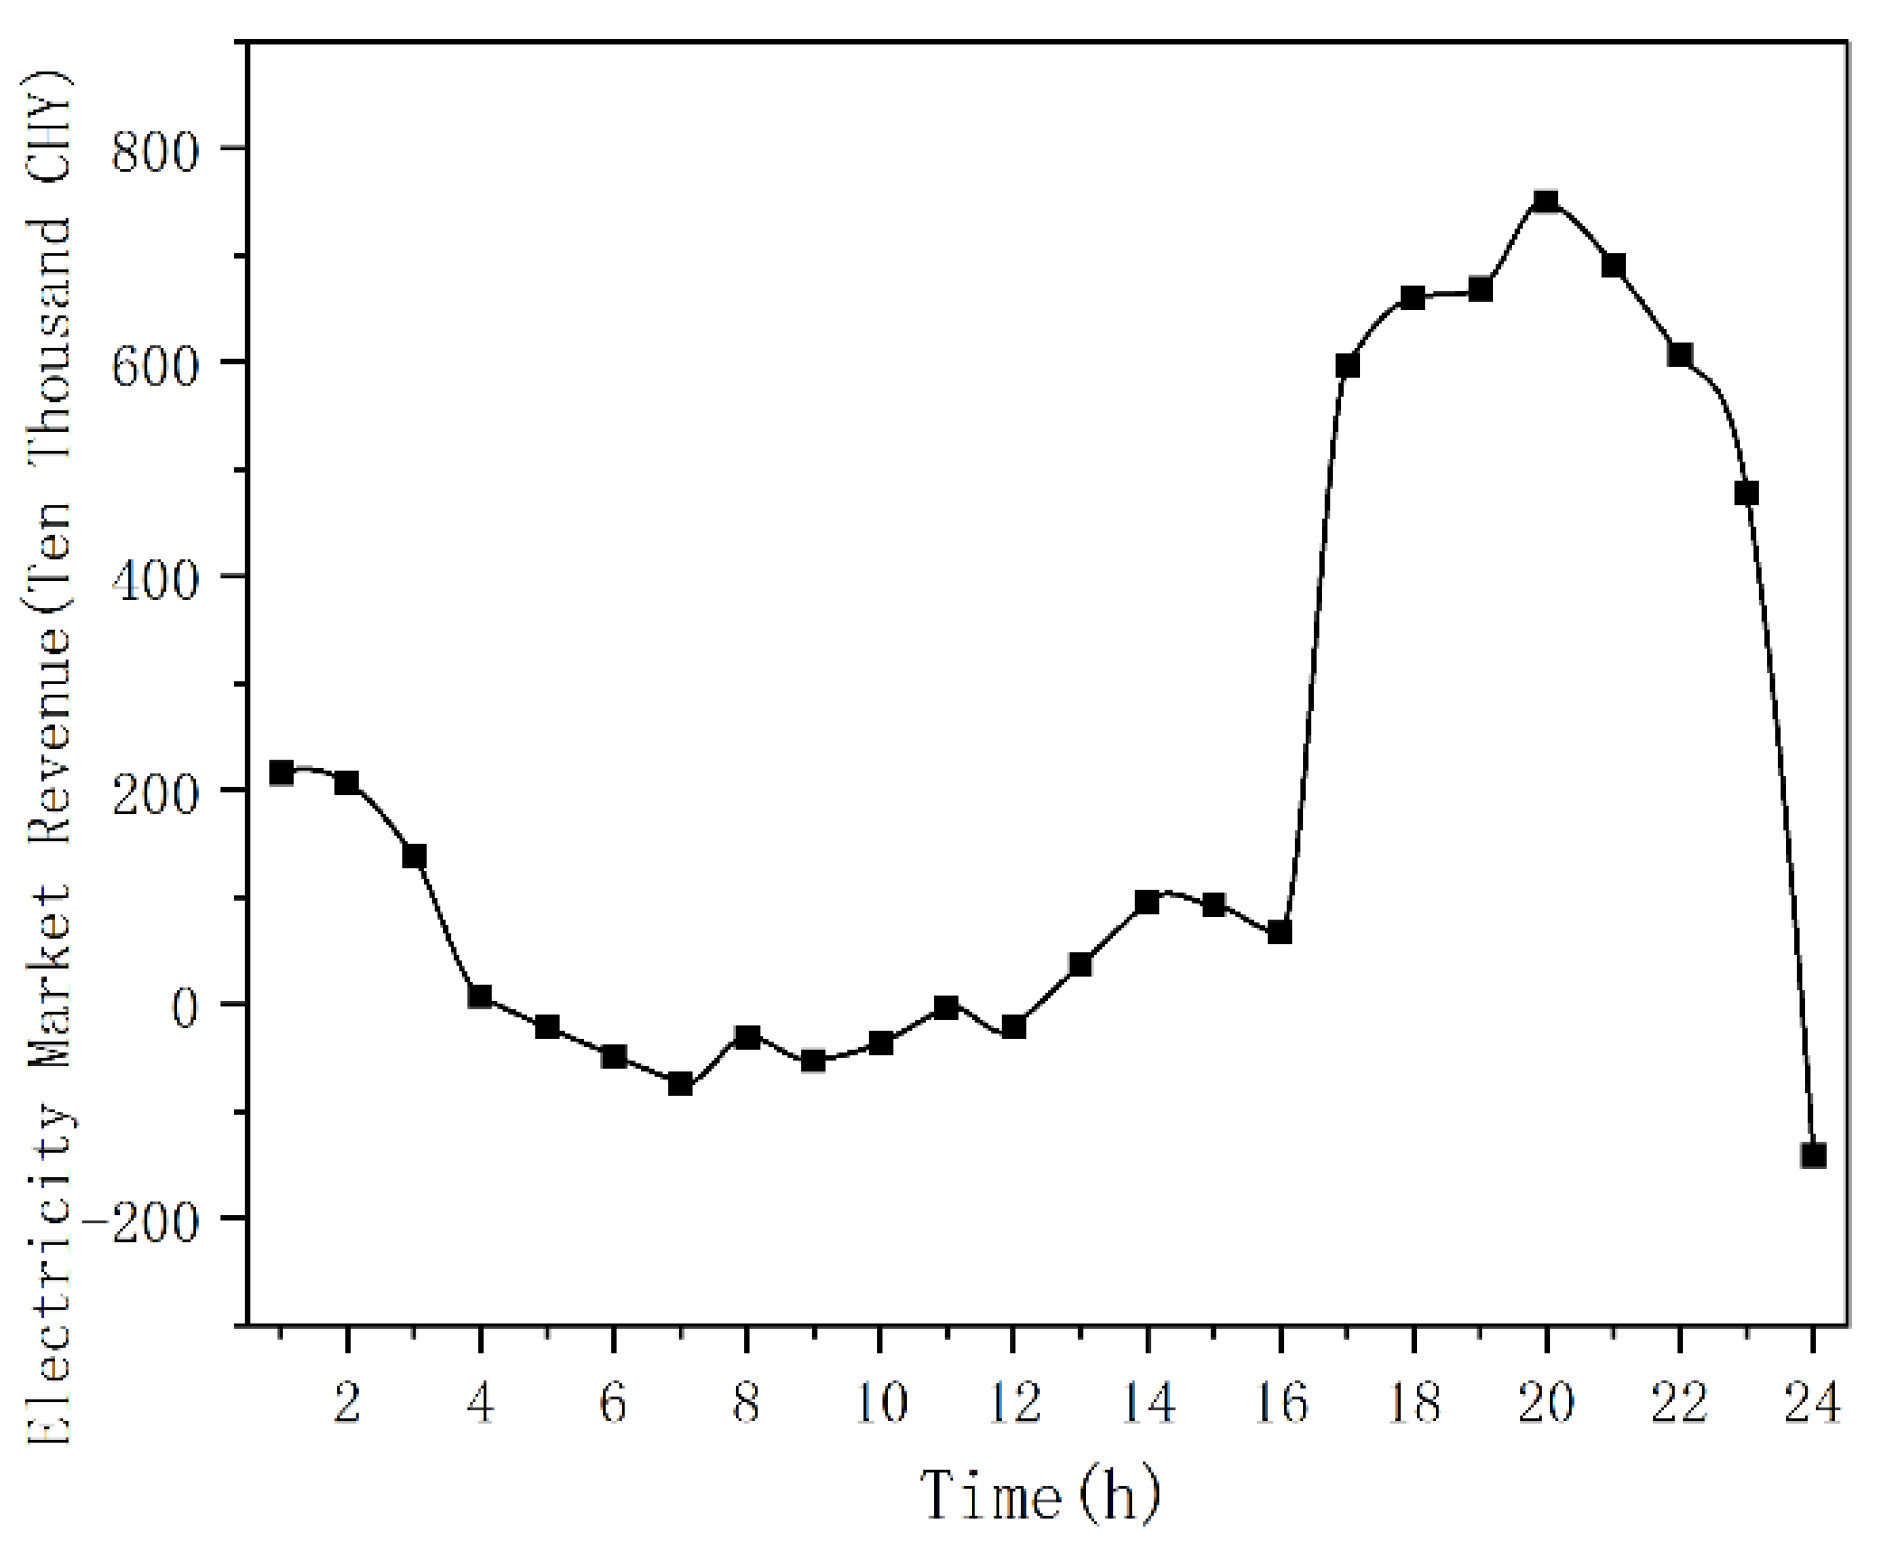
Figure 9 indicates that offshore wind farm profits in the electricity market peak between 17:00 and 23:00, during which the profit reaches 44.502 million CNY, accounting for the majority of the total electricity market profit of 48.796 million CNY. This occurs because the high-load, high-consumption peak period elevates system electricity prices, averaging 721 CNY/MWh. As depicted in
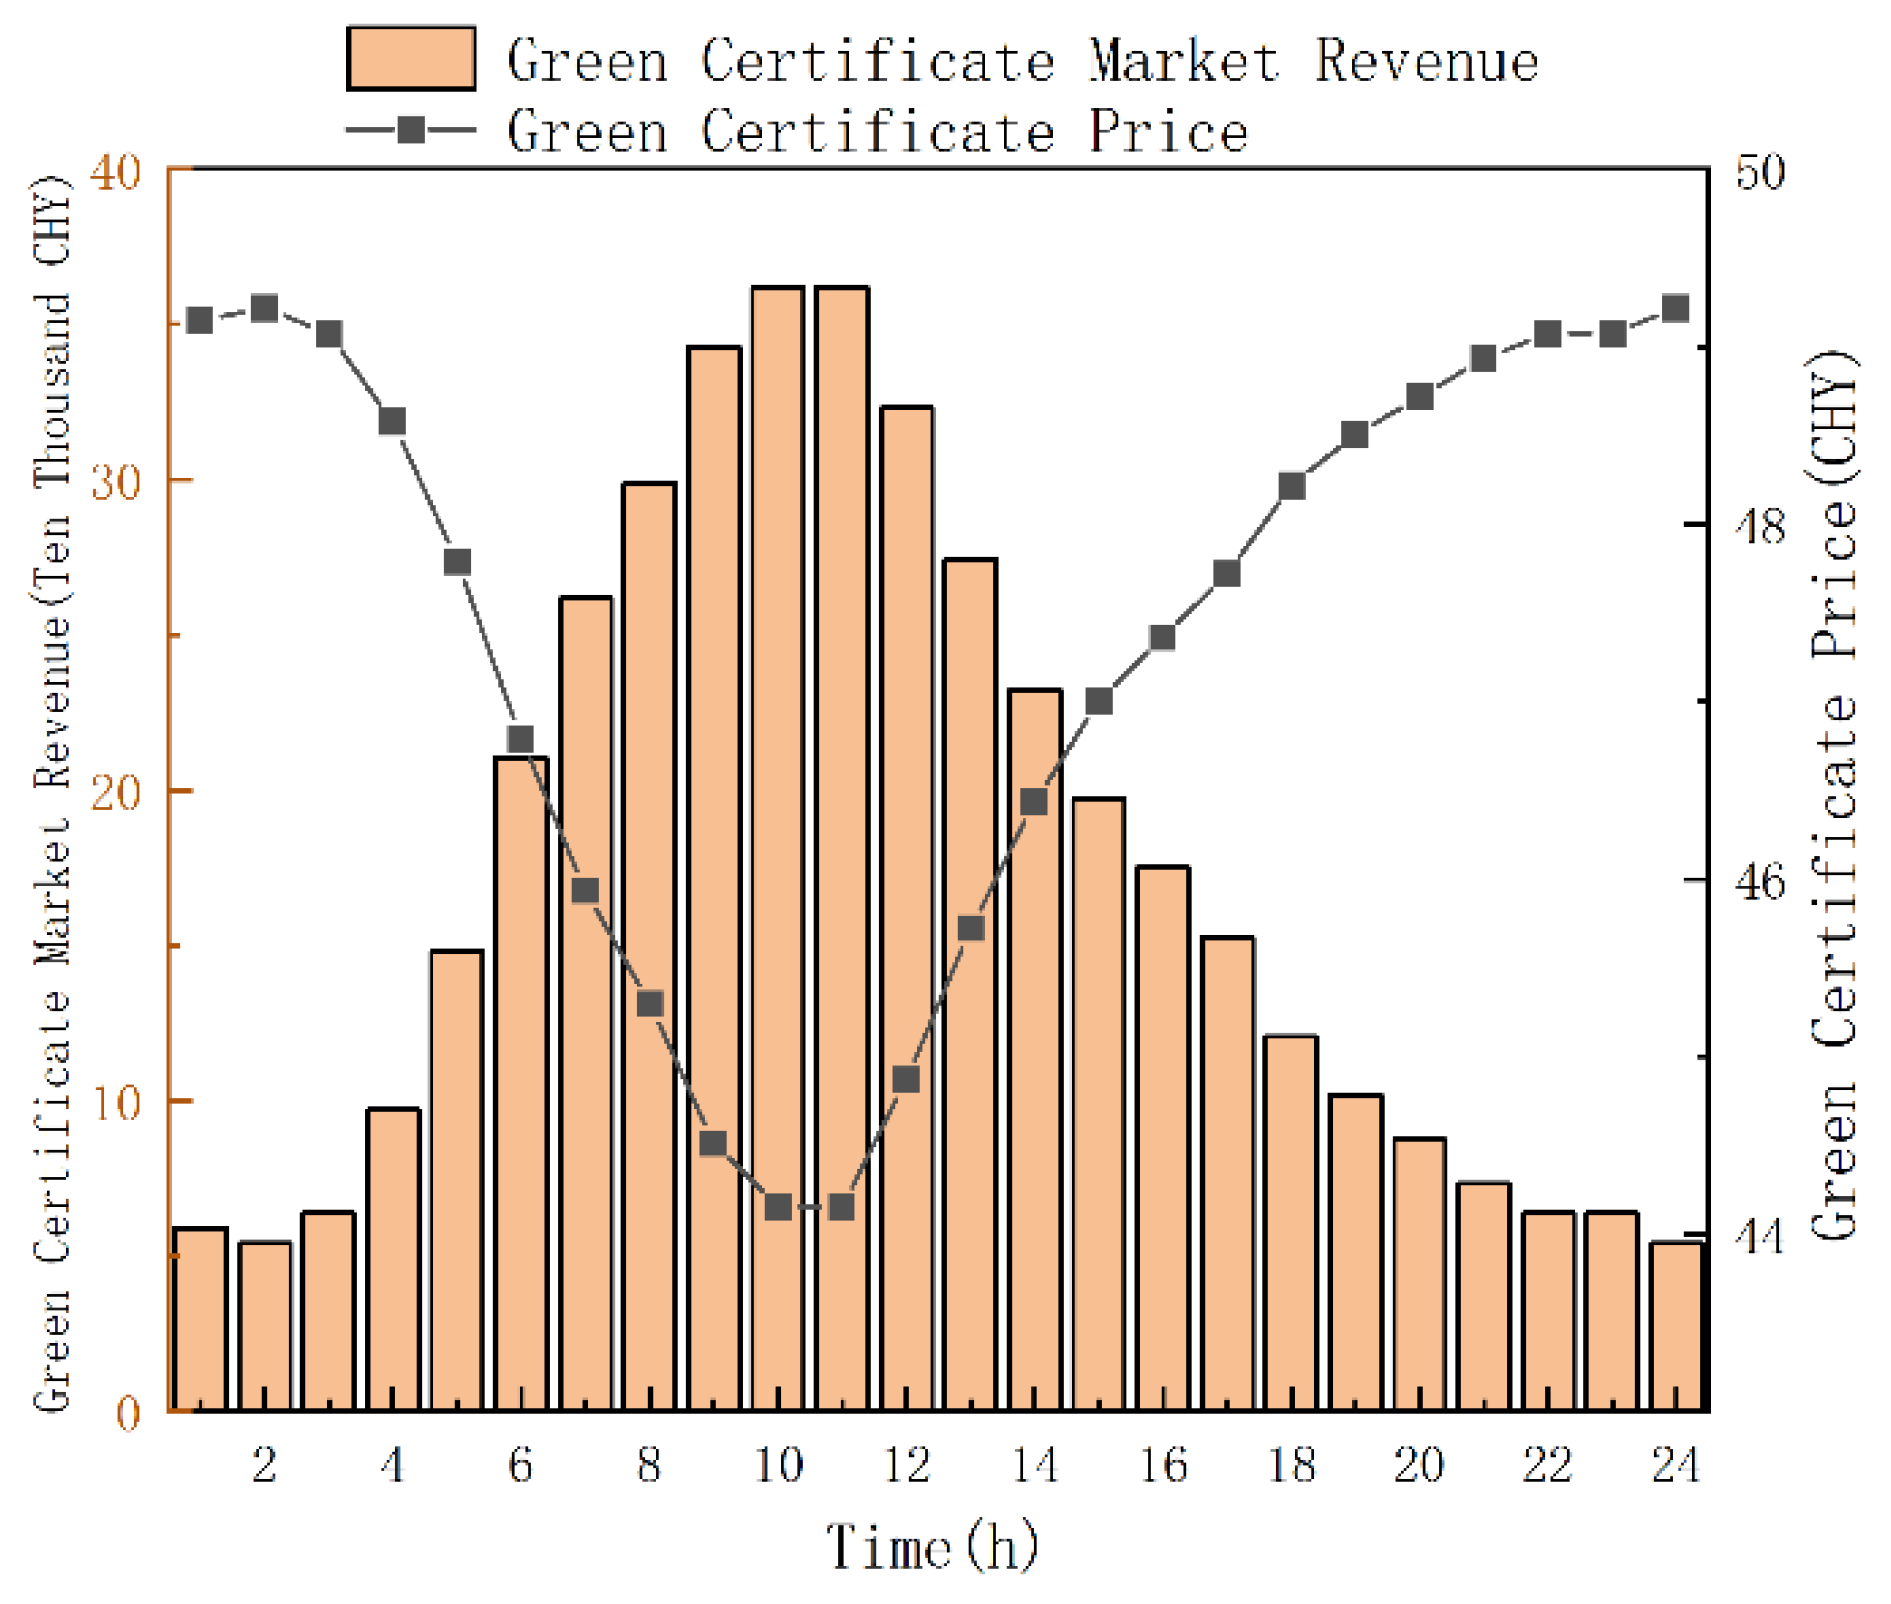
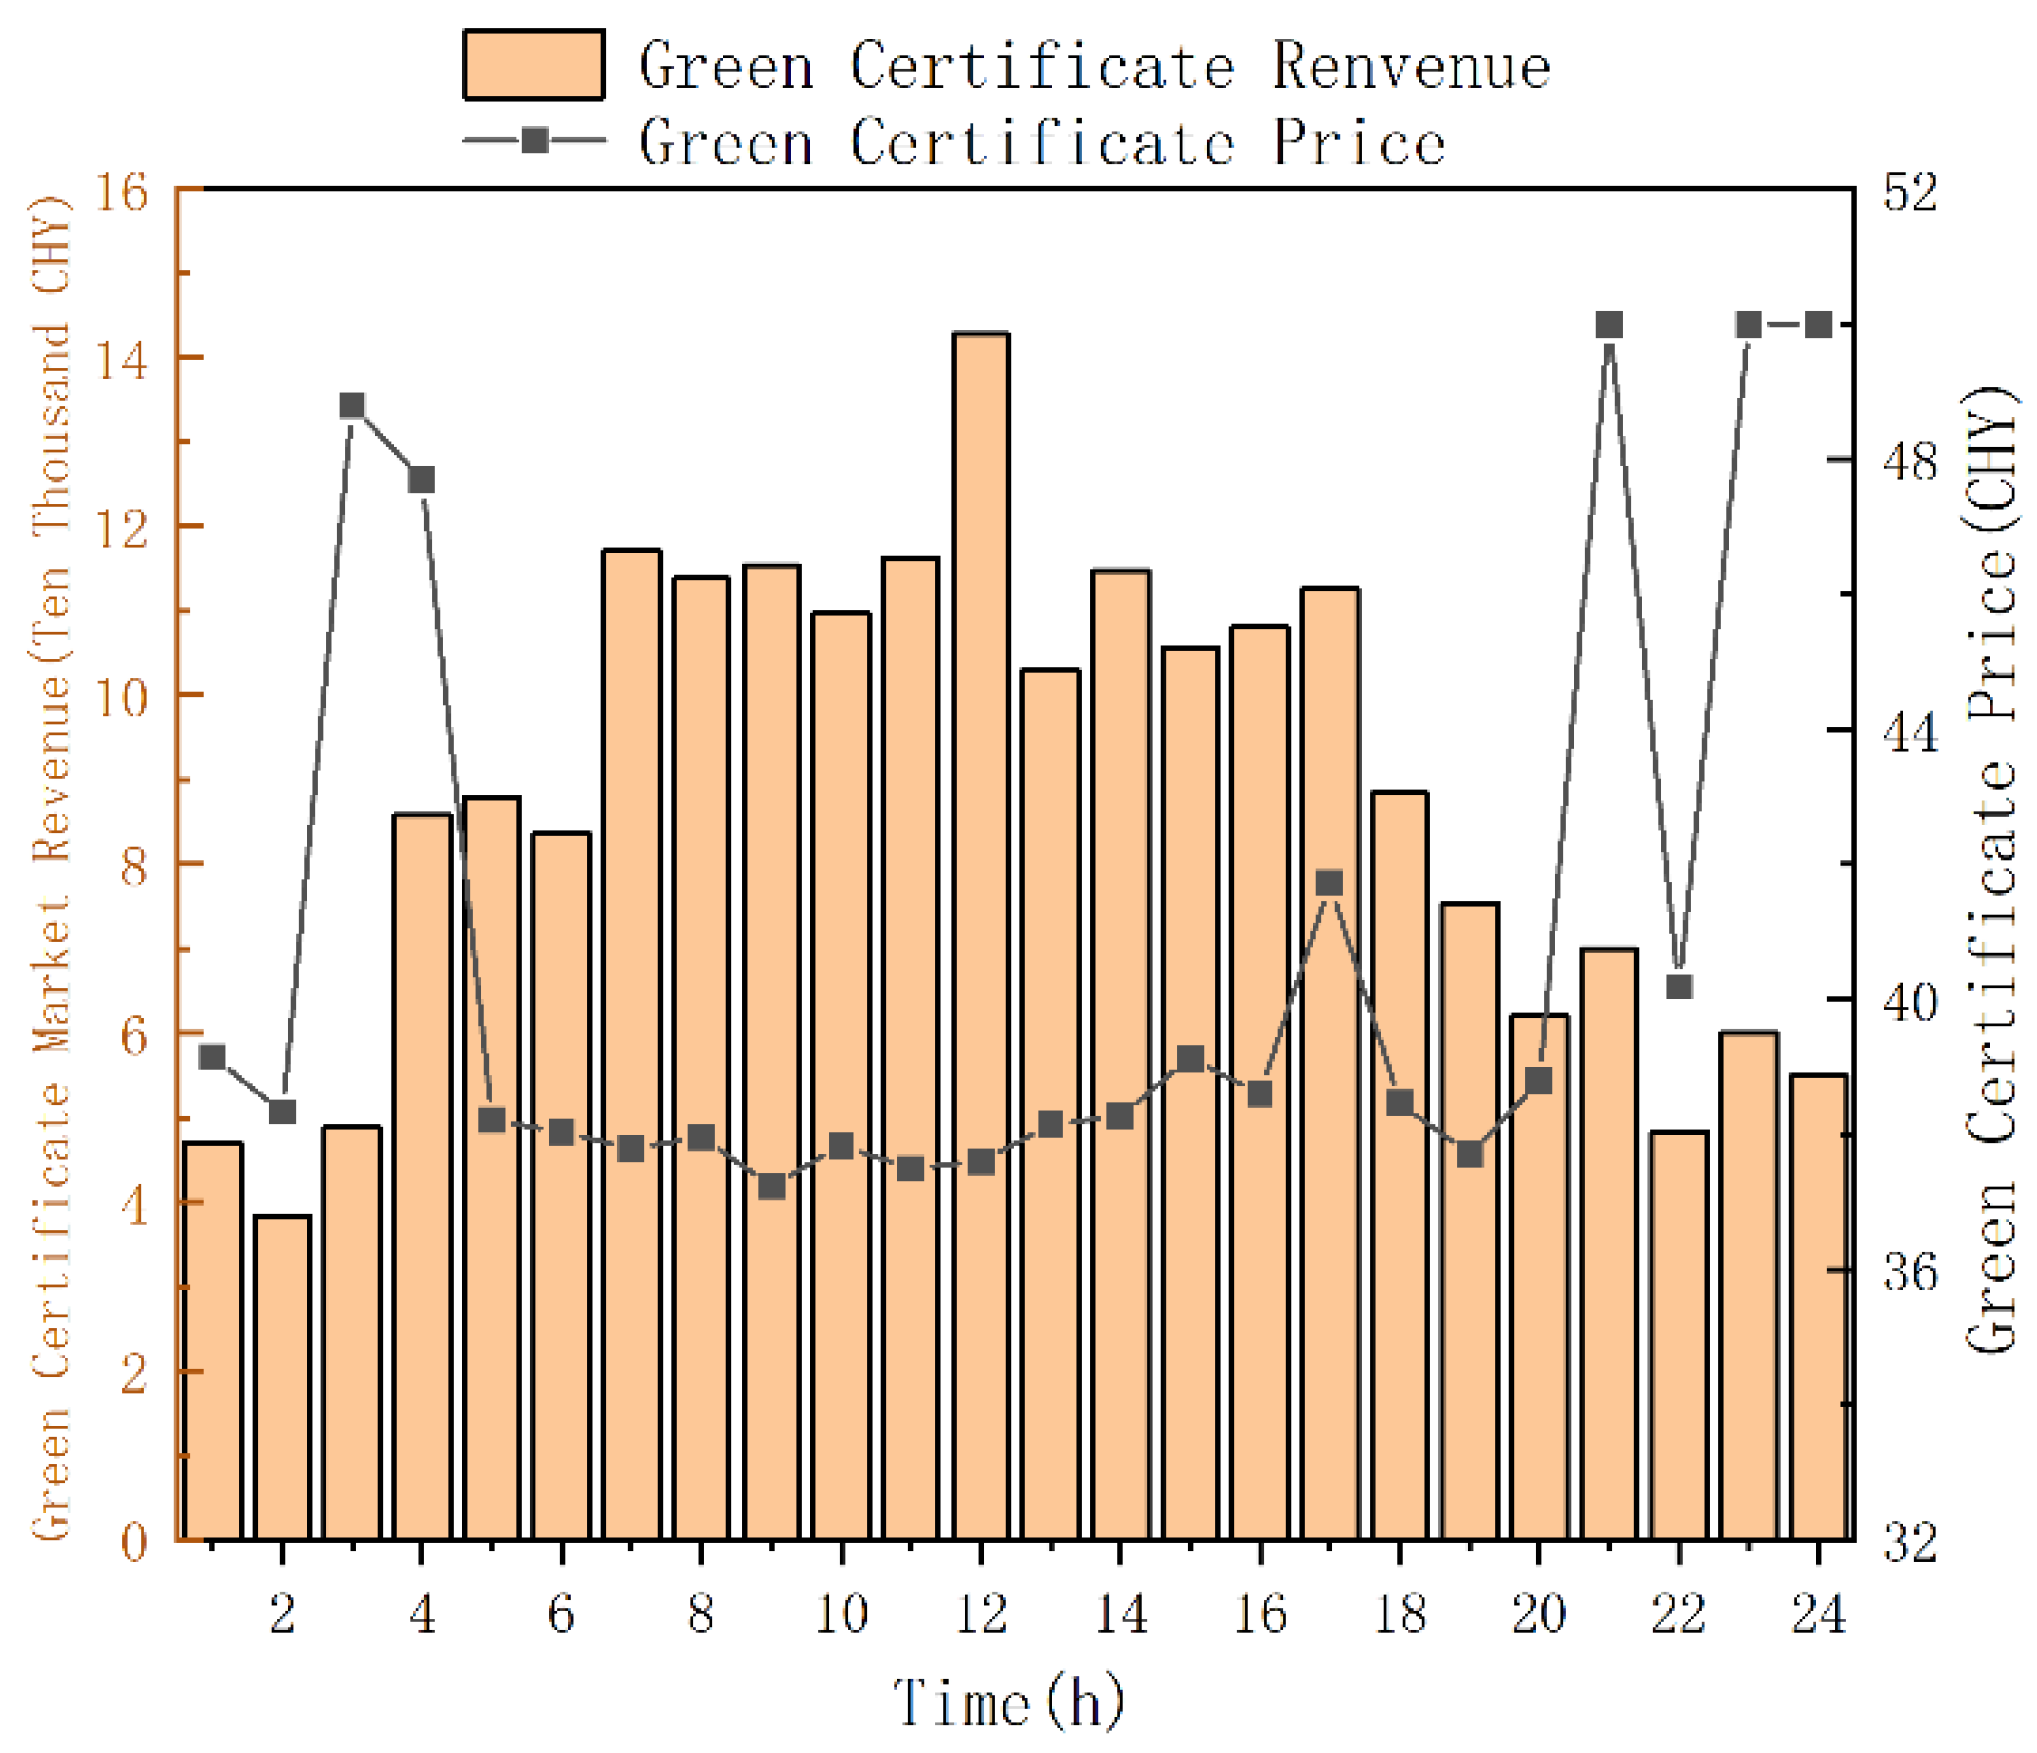
Figure 10, the profit of the offshore wind power storage participating in the green certificate market mainly concentrates from 6:00 to 16:00. This is because the wind power output is primarily concentrated during this period, resulting in more green certificates being produced. The total profit in the green certificate market is 41,805 yuan. The green certificate price fluctuates mainly around 45 yuan, and the green certificate revenue is basically linearly related to the quantity of green certificates. As shown in
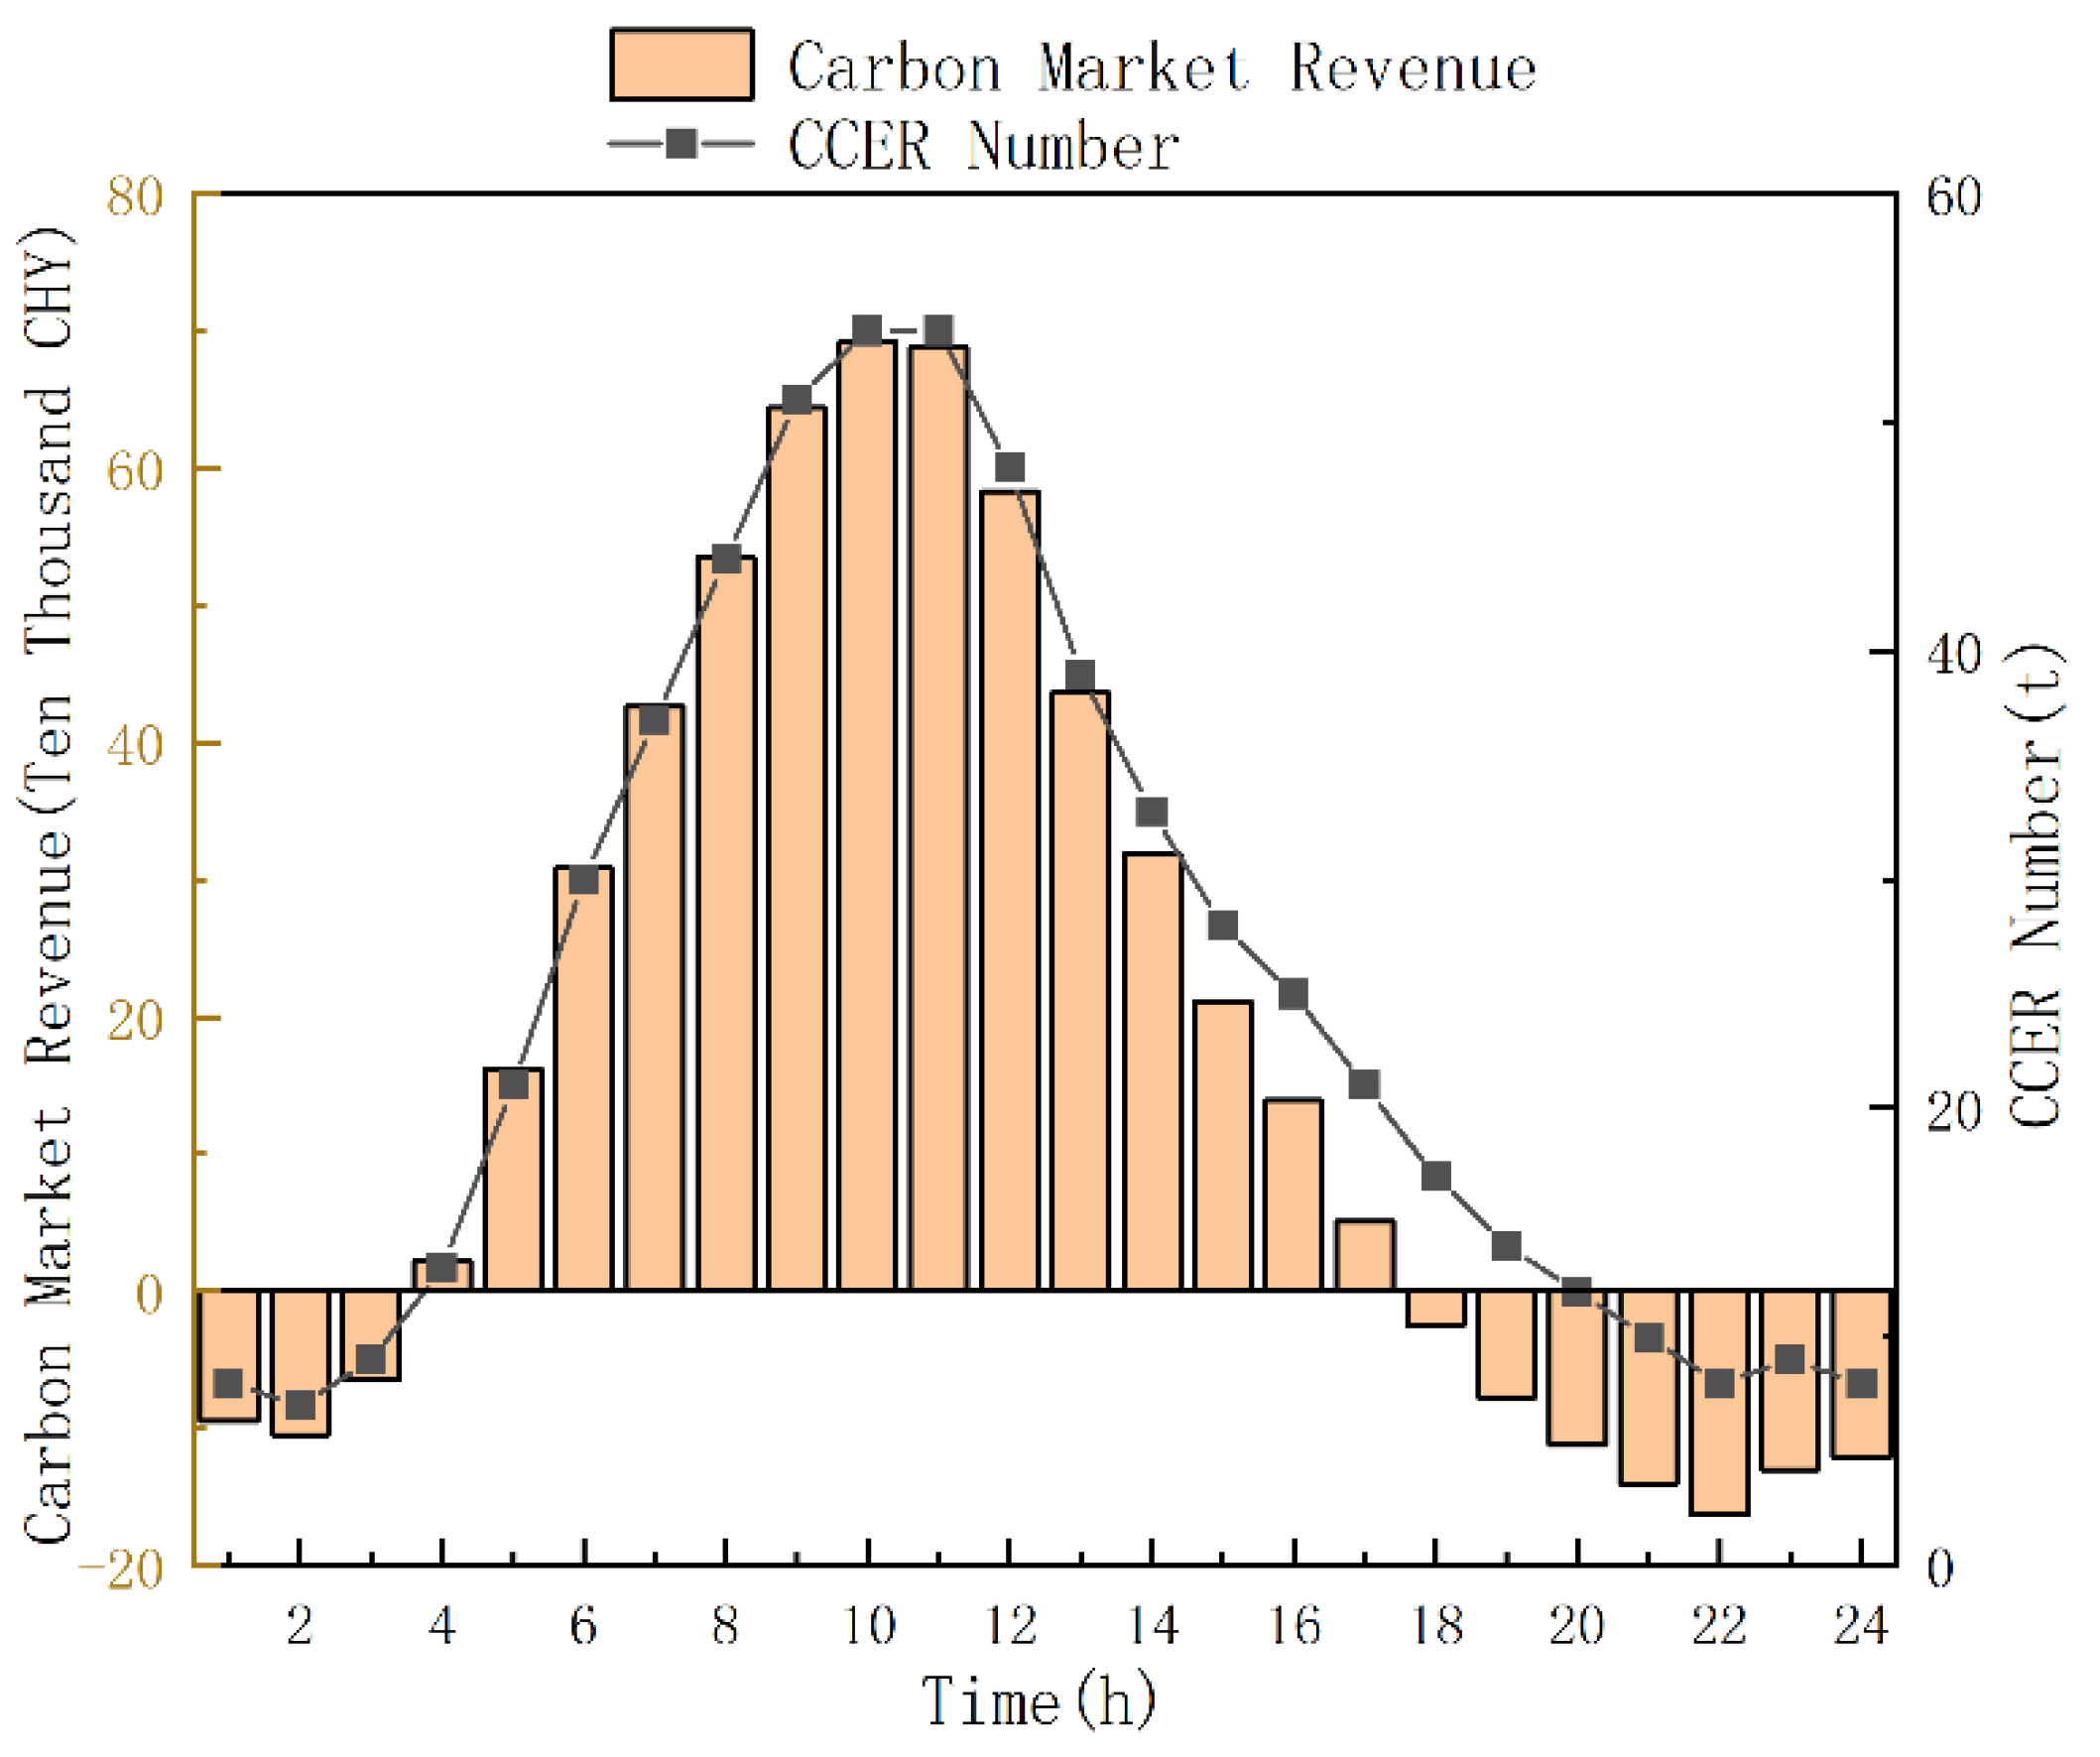
Figure 11, the profit of the offshore wind power storage participating in the carbon market mainly concentrates from 6:00 to 16:00. The total market profit during this period is 32,468 yuan. The reason for the negative profits during the periods of 1:00–3:00 and 18:00–24:00 is due to the higher carbon emissions and the relatively low quantity of CCERs available during these times.
Figure 12,
Figure 13,
Figure 14 and
Figure 15 present the green certificate and CCER prices, as well as the market revenues obtained by the offshore wind farm in the green certificate and carbon markets under the double auction and game-theoretic mechanisms.
As shown in
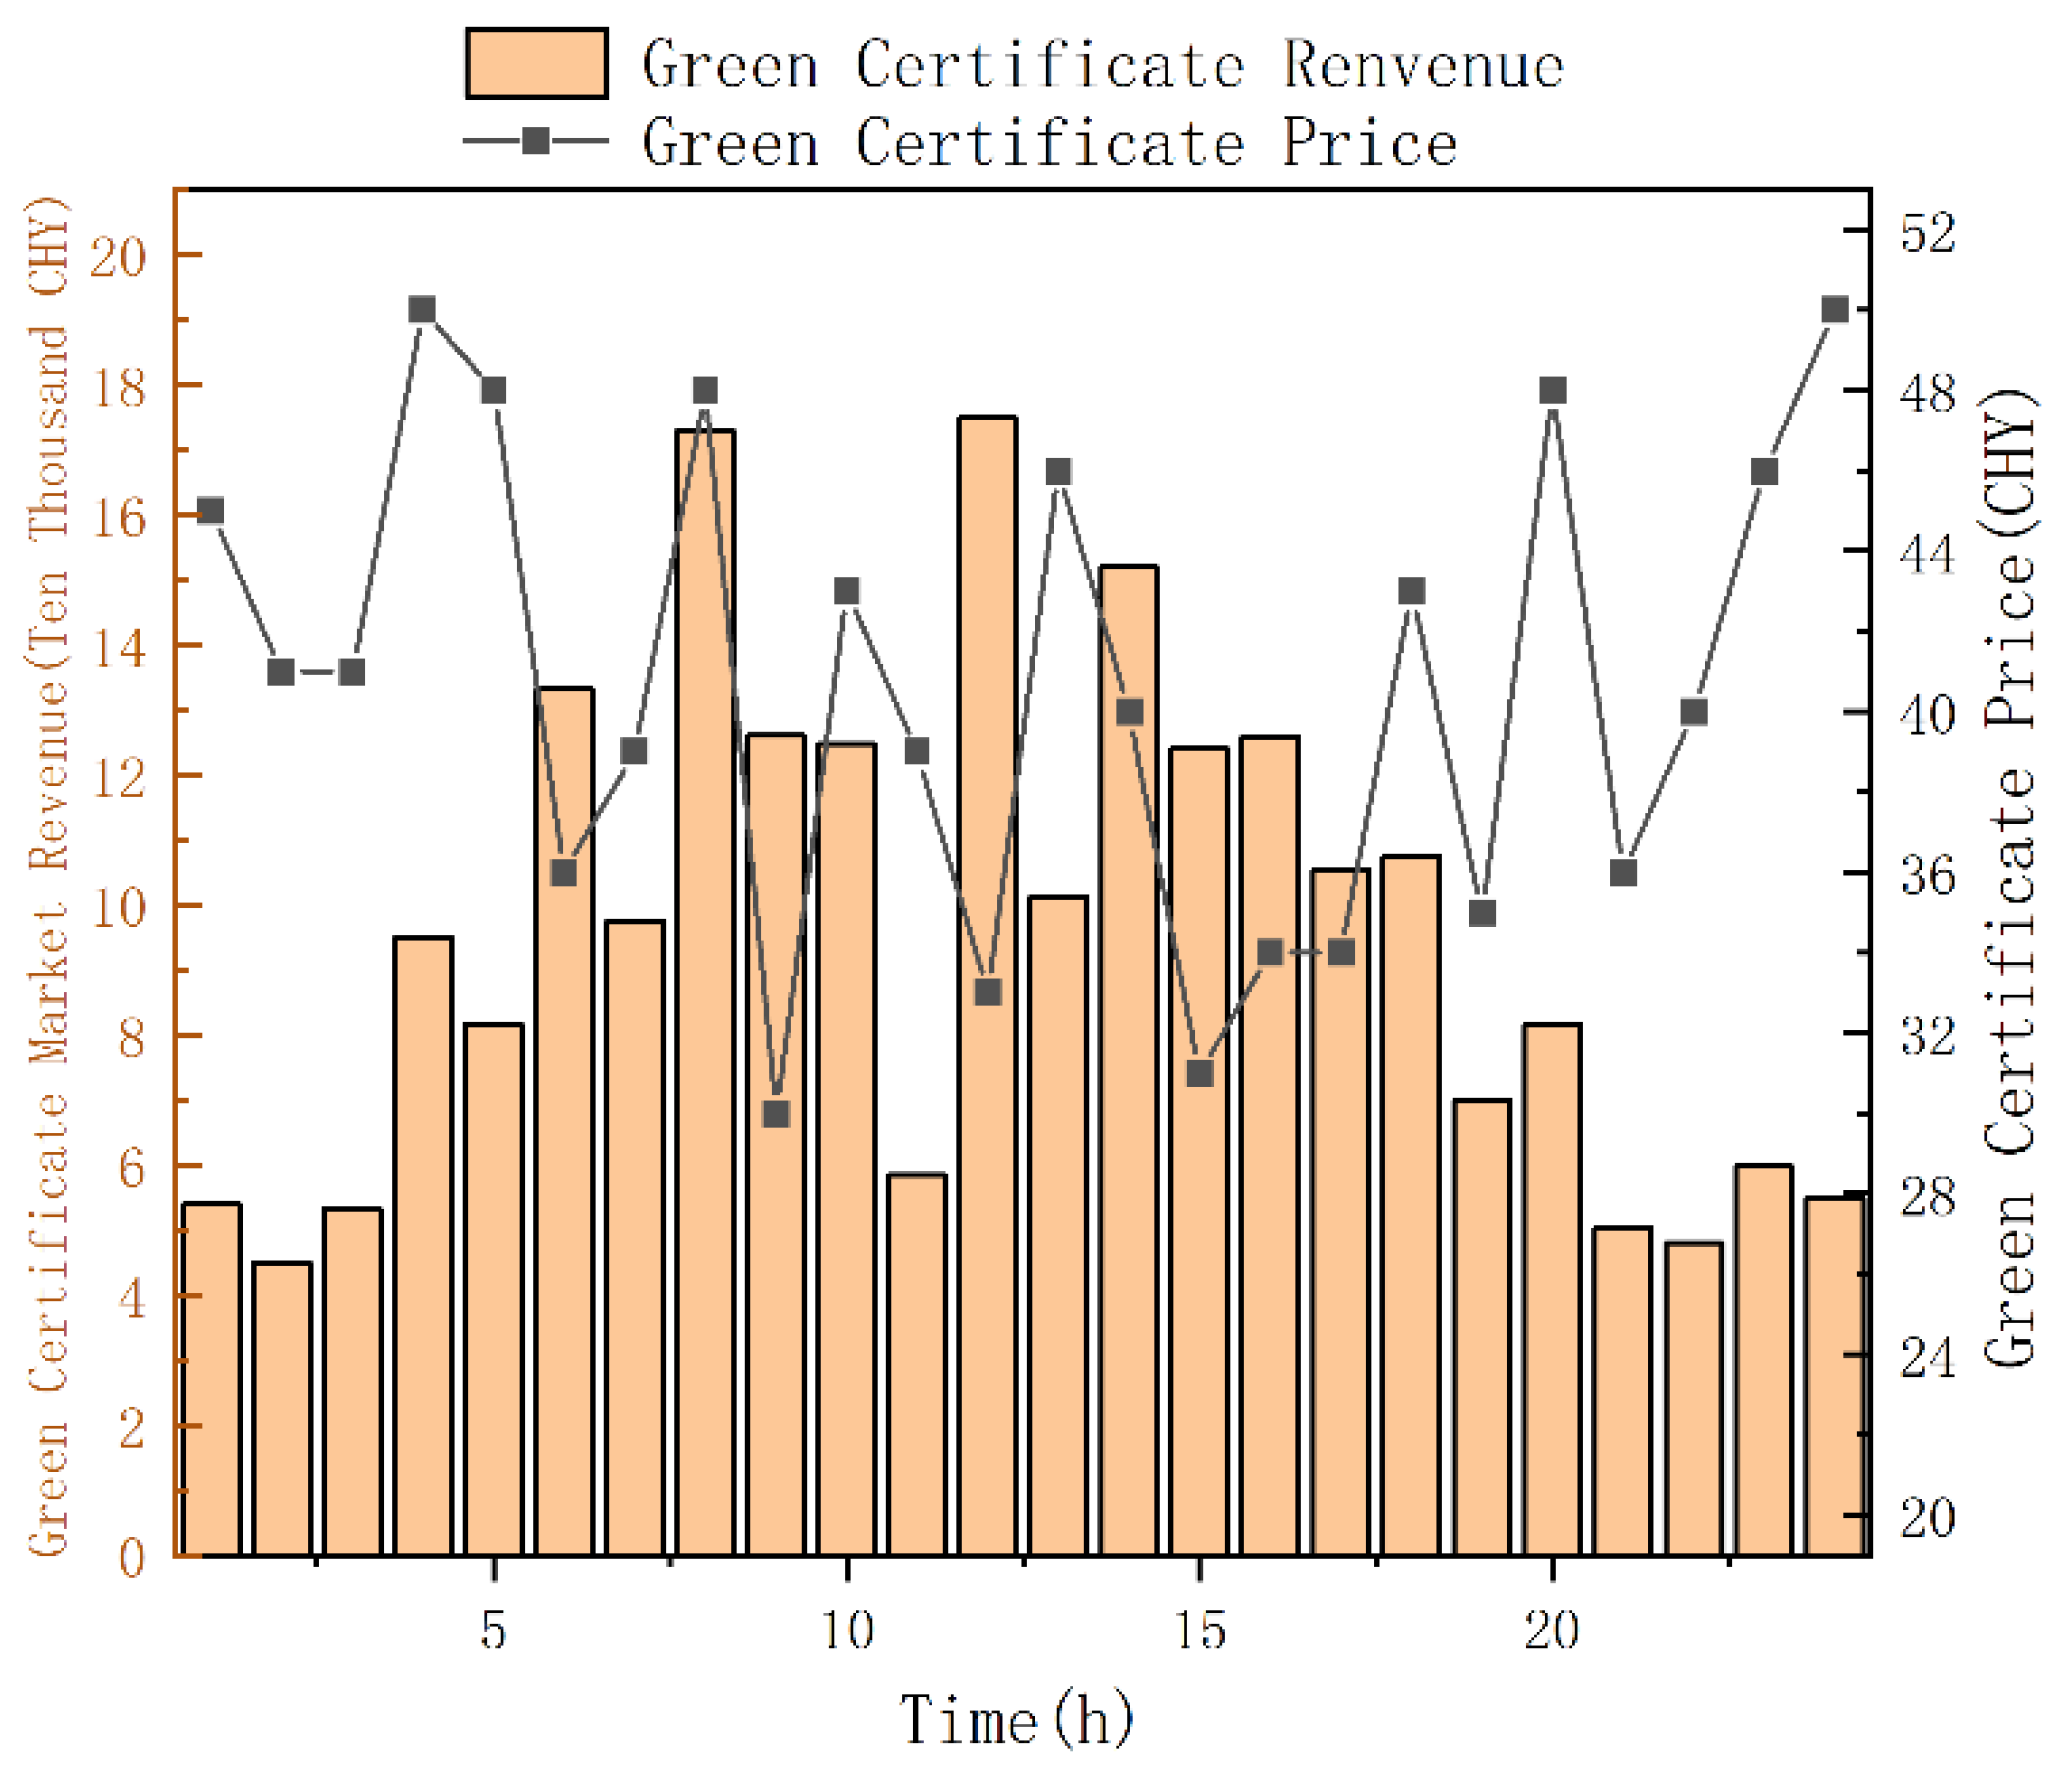
Figure 12, the green certificate price curve exhibits significant volatility, fluctuating roughly between 30 and 50 CNY throughout the 24 h period, with prices occasionally dropping below 30 CNY or exceeding 50 CNY during certain hours. Correspondingly, market revenue also fluctuates, reaching local peaks at hours 8 and 12. This instability is primarily attributed to the inherent uncertainty in buyer and seller bids under the double auction mechanism, which is highly sensitive to changes in individual expectations, leading to fluctuations in both price and revenue. In contrast, the green certificate prices in
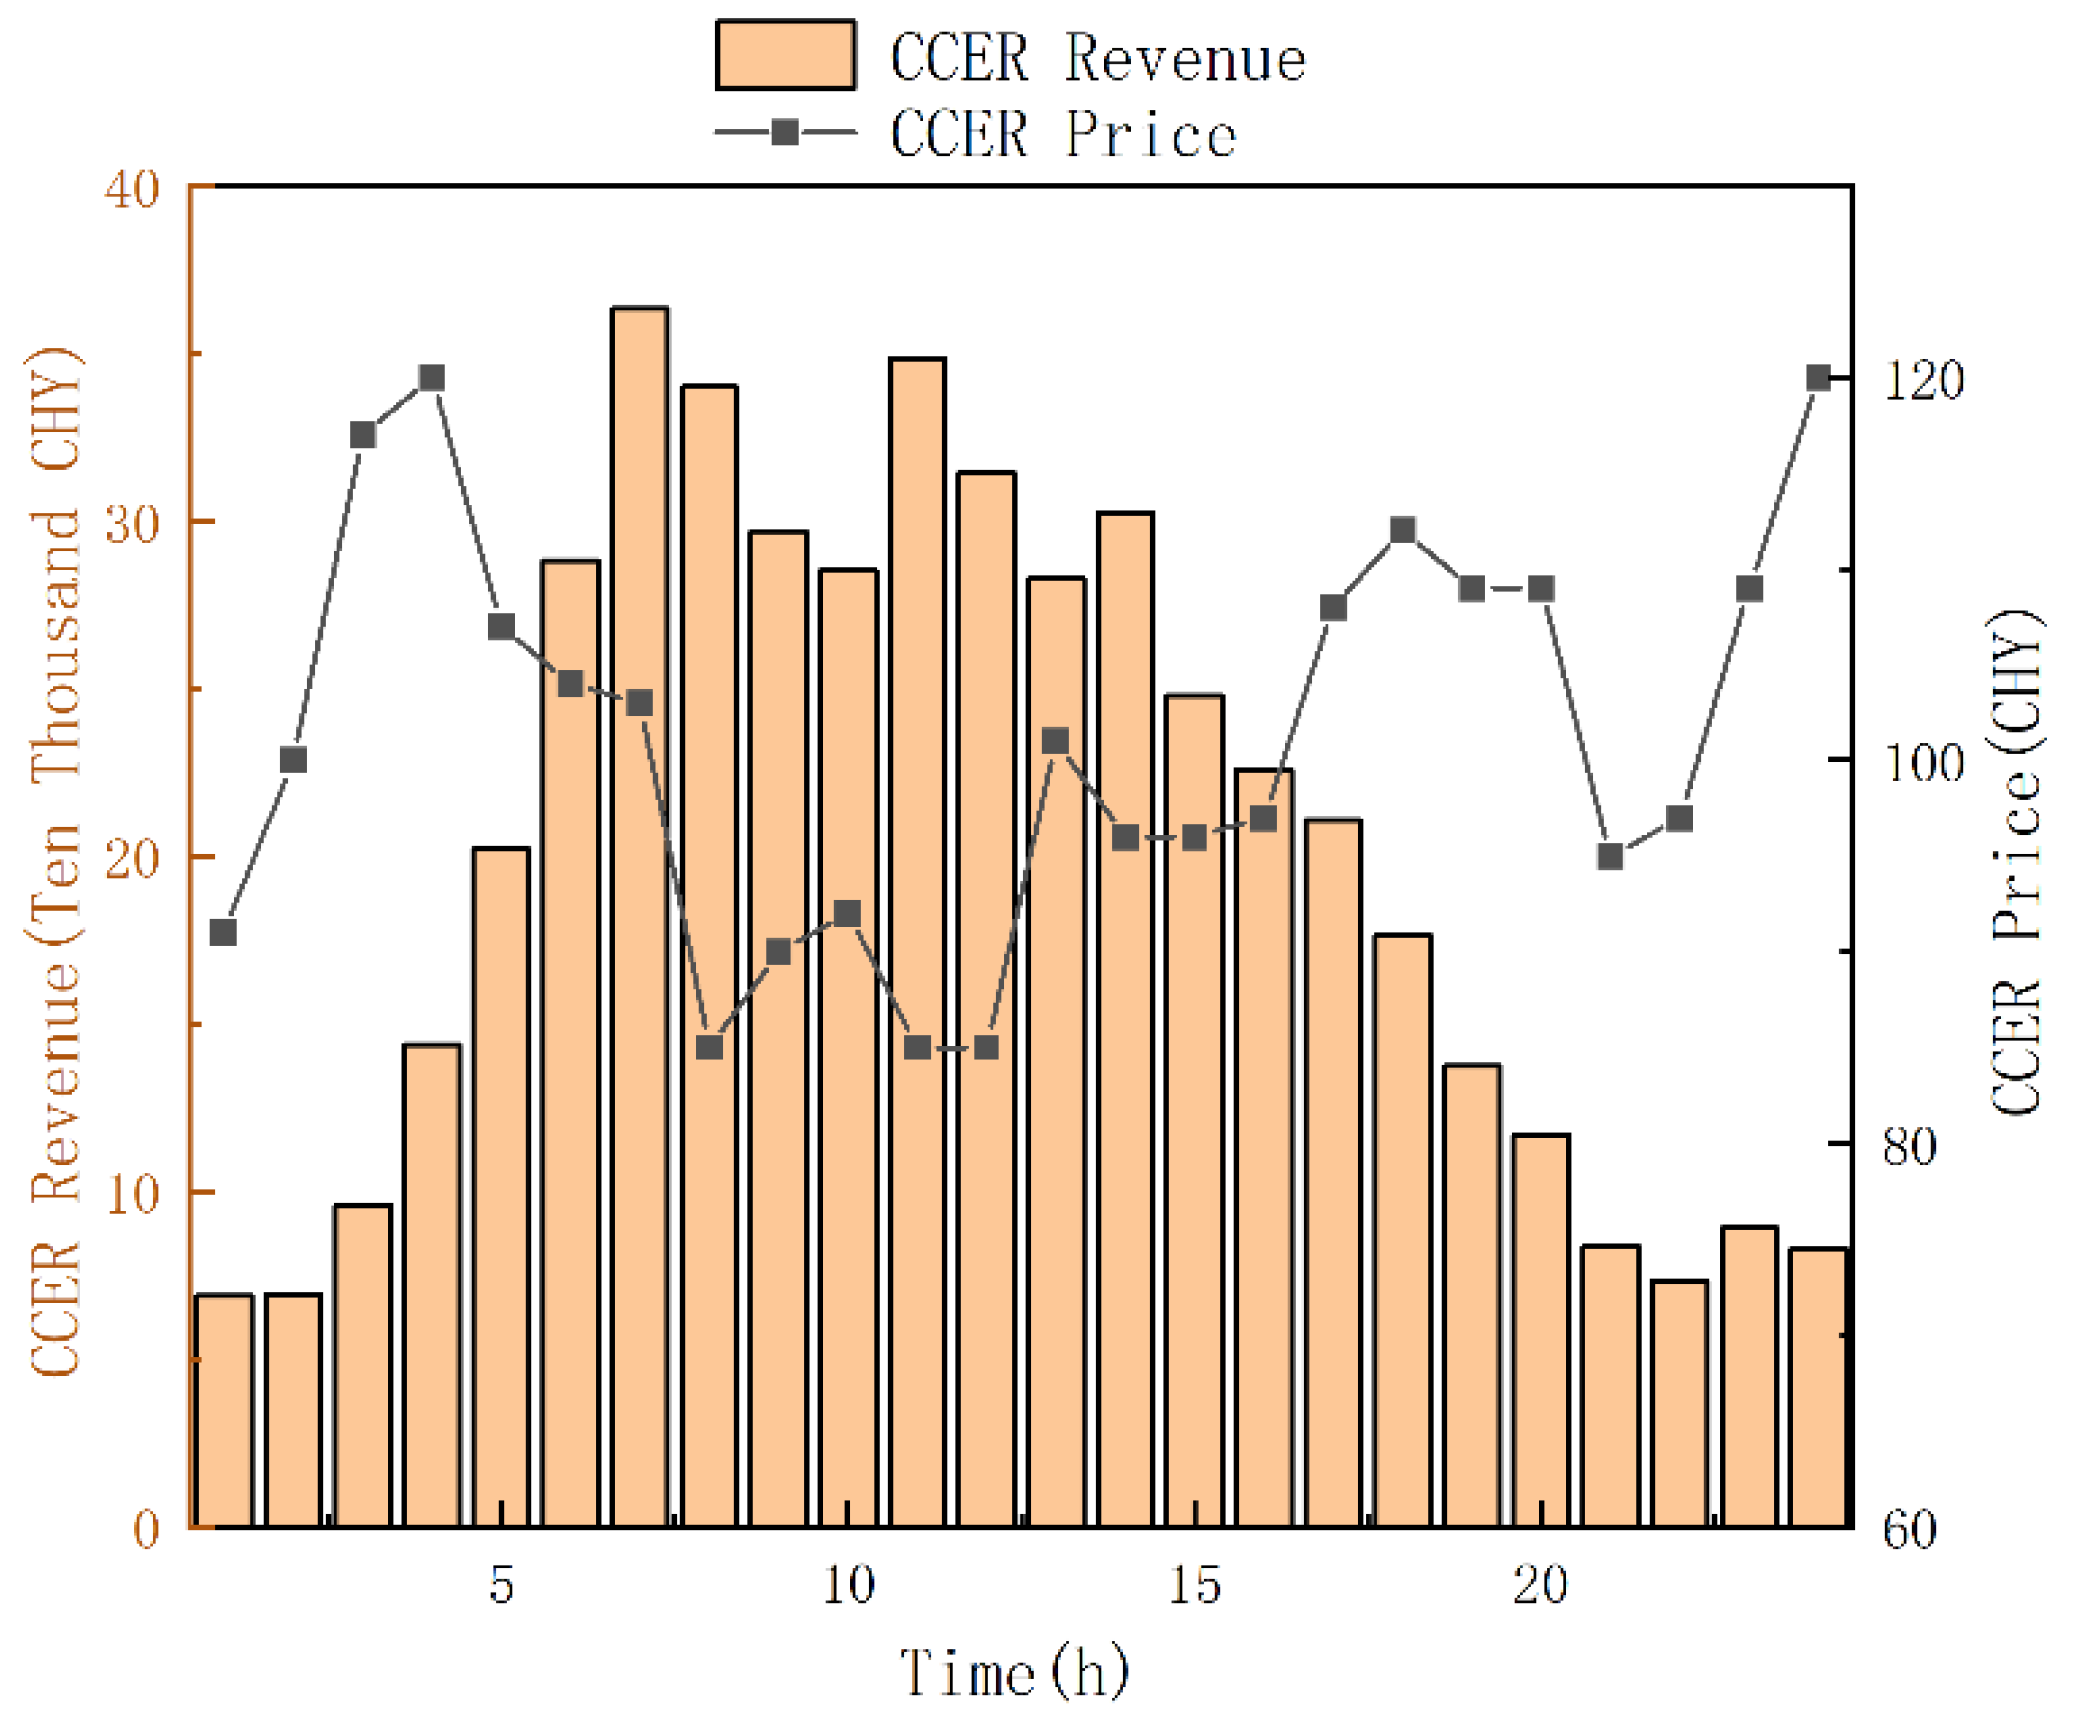
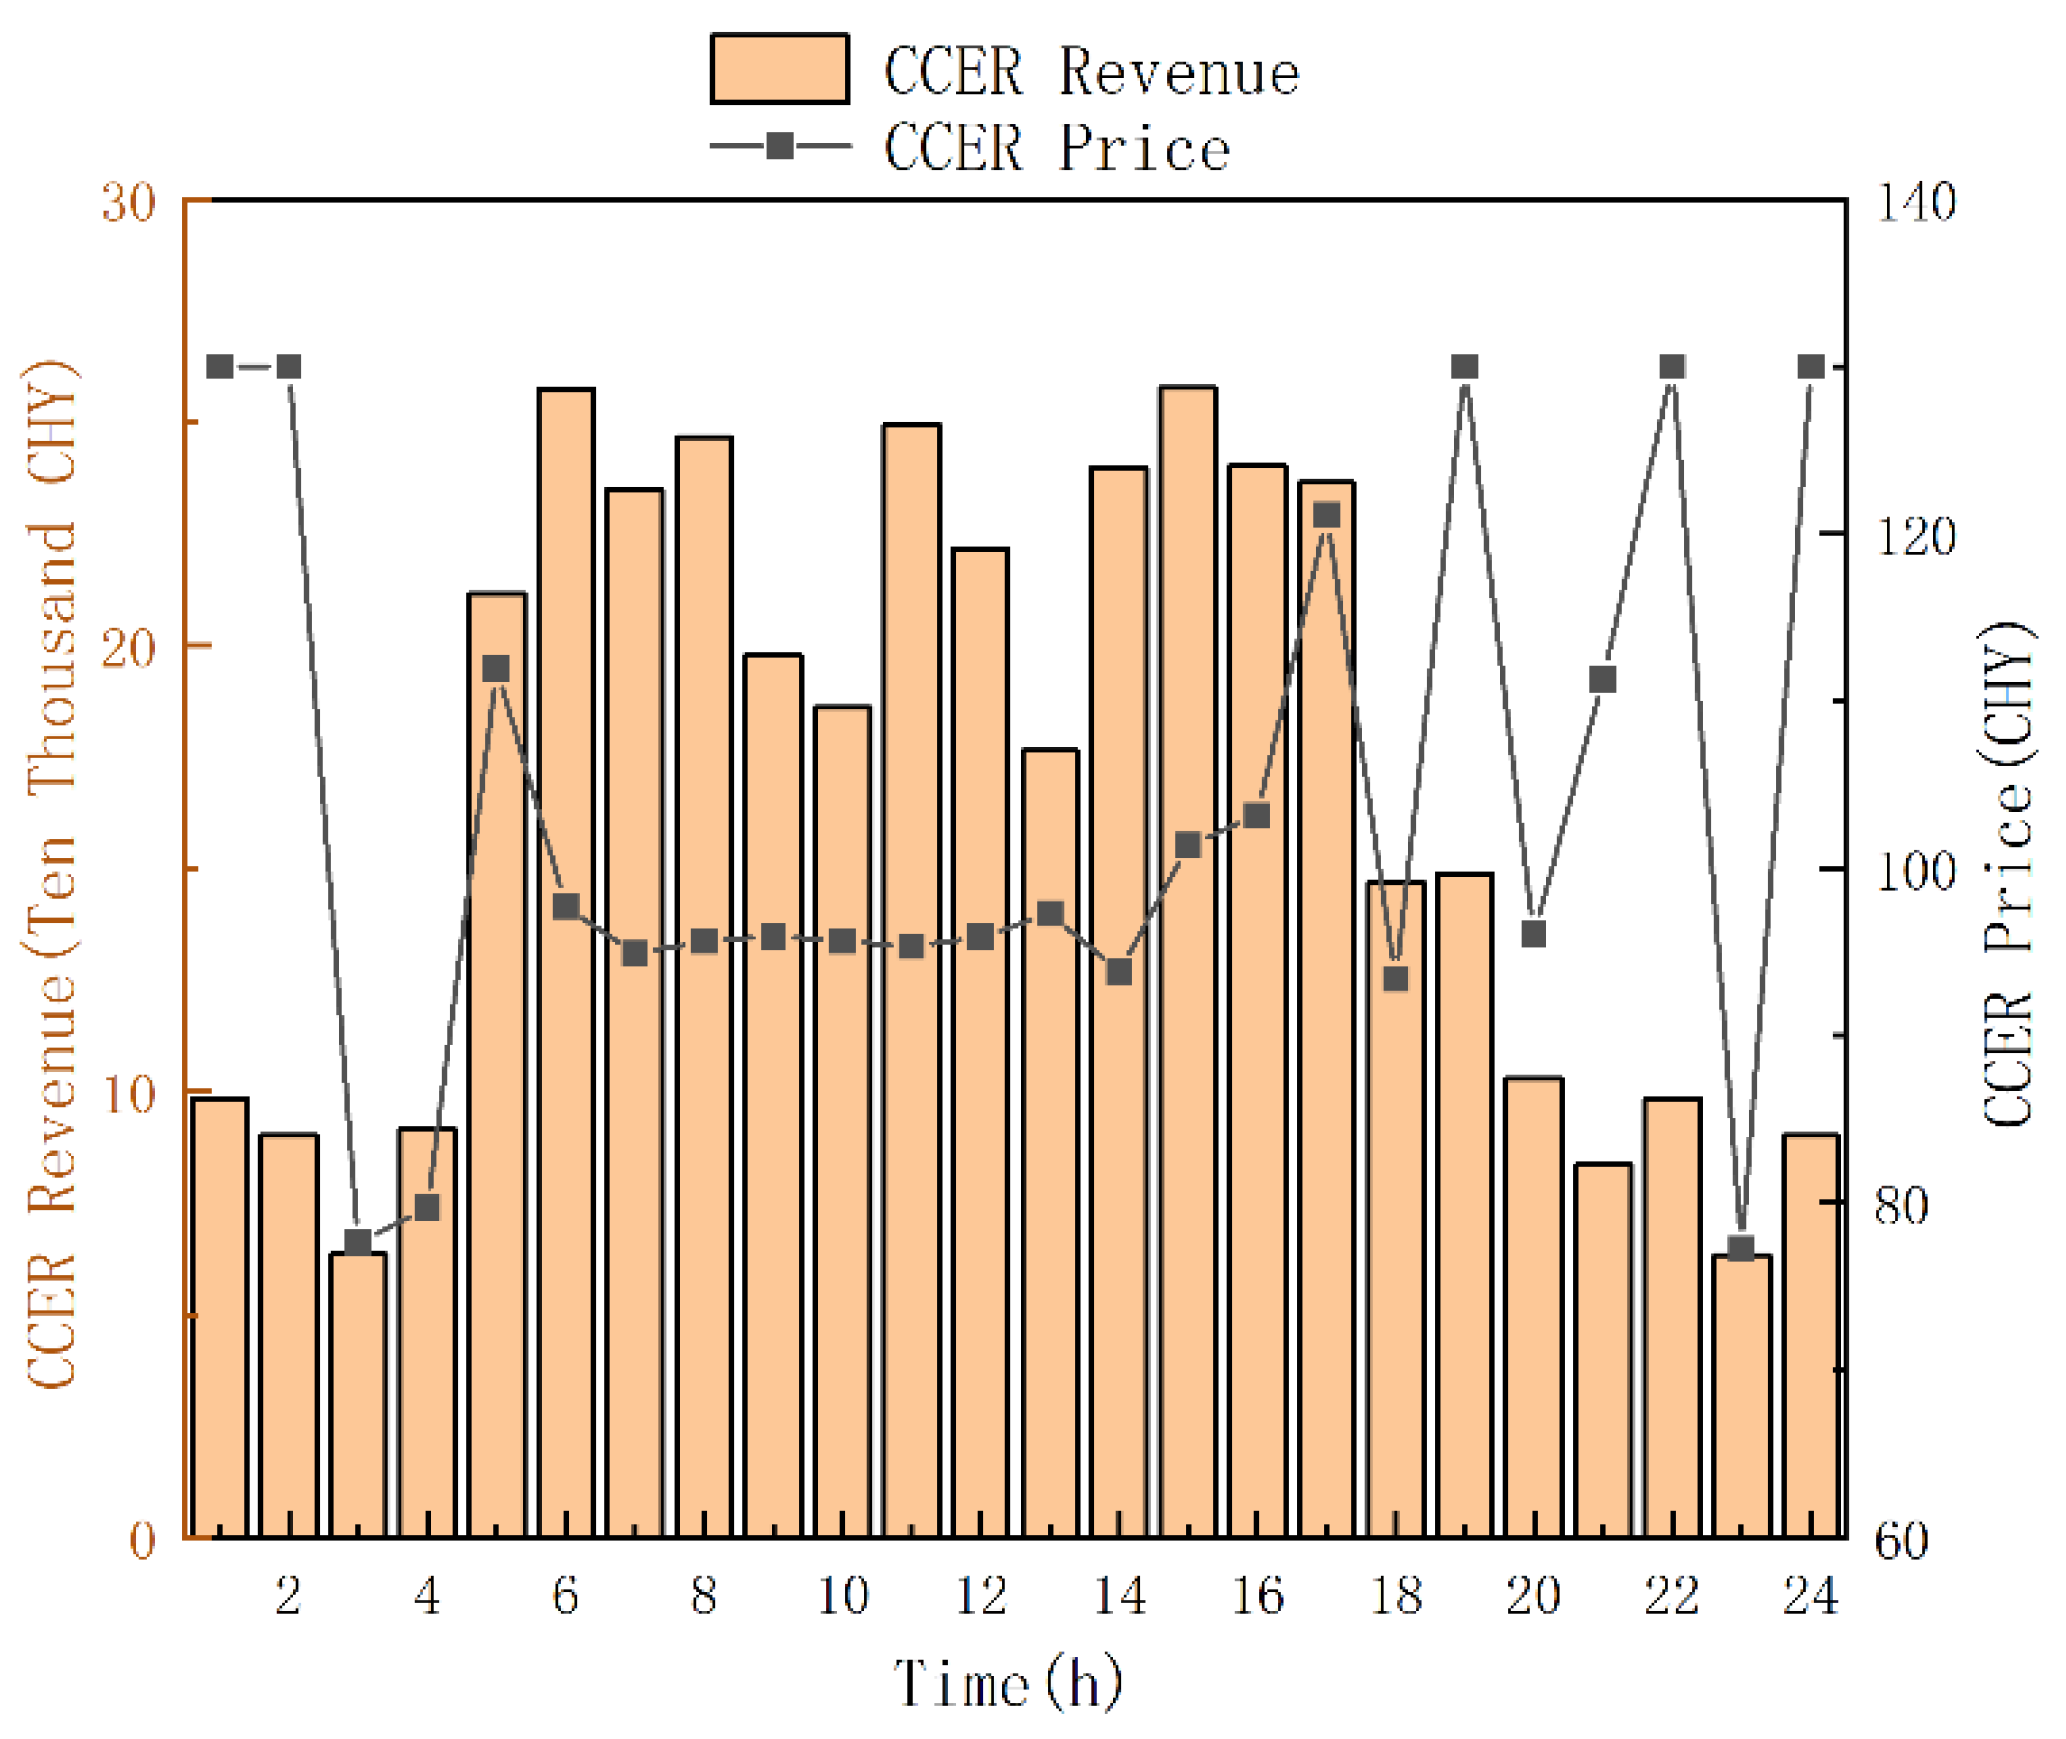
Figure 13 exhibit notable stability, with most values remaining within the range of 36 to 40 CNY across the majority of time periods, and only minor fluctuations are observed in a few instances. This stability results from the dynamic strategic adjustments made by market participants under the game-theoretic mechanism, where rational interactions contribute to price convergence. Moreover, the market revenue curve is relatively smooth, indicating that the game-theoretic approach is effective in suppressing market volatility and enhancing trading stability. Notably, during hours 6 to 18, revenue remains at a relatively high level with minimal fluctuation, further demonstrating the mechanism’s capacity to optimize mid- to long-term market performance. CCER prices fluctuate significantly within the range of 80 to 120 CNY. During the period from hour 6 to hour 14, market revenue remains relatively high, with the peak approaching 400,000 CNY per hour. This trend indicates that during periods of highly active supply and demand, market revenues increase substantially. As illustrated in
Figure 15, CCER prices demonstrate greater stability, with most values remaining around 100 CNY and only brief fluctuations occurring in a few time periods. The overall price curve is noticeably smoother. As a result, market revenue fluctuates within a narrower range of 200,000 to 300,000 CNY. Although the peak revenue is slightly lower than the extreme high observed under the auction mechanism, the overall volatility is reduced, and the market performance appears more robust and stable.
3.4. Sensitivity Analysis
The sensitivity results indicate that increasing wind capacity from 100 p.u. to 120 p.u. leads to a 6.4% improvement in total revenue, while further increasing storage capacity beyond 30 p.u. yields diminishing returns in balancing efficiency. This demonstrates the robustness of the proposed model under varying capacity scenarios.
3.5. Supplementary Case: Impact of Negative Electricity Prices
To verify the model’s applicability under negative price conditions, we simulated a scenario where offshore wind capacity was increased by 50% while load demand remained unchanged. This configuration caused significant oversupply during off-peak hours (03:00–05:00), resulting in negative clearing prices.
The results indicate that the proposed model produces valid dispatch and bidding outcomes, with storage units charging more aggressively during negative-price intervals and wind farms adjusting their offered quantities accordingly. Despite temporary revenue reductions for some participants, the overall welfare-maximizing objective was preserved. These findings confirm the model’s robustness in handling real-world price volatility, including price inversions.
The simulation results further underscore the critical role of offshore wind and energy storage in multi-market coordination. Offshore wind generation—characterized by its intermittency and time-varying output—significantly influences electricity market clearing prices and participant revenues. In high-output periods, the resulting oversupply exerts downward pressure on prices, while in low-output intervals, the system relies more heavily on dispatchable sources.
Energy storage systems, by contrast, play a stabilizing role across all markets. Their ability to arbitrage between peak and off-peak hours smooths out price fluctuations, enhances renewable utilization, and buffers participants from revenue volatility. Additionally, storage flexibility helps mitigate carbon trading penalties by avoiding high-emission dispatch during price spikes. These findings confirm that joint participation of offshore wind and storage in electricity, carbon, and green certificate markets enhances both economic and environmental performance.
Overall, the results highlight the strategic importance of co-optimizing offshore wind and storage assets, especially as grid systems integrate higher shares of variable renewable energy.


