
Assessment of the Energy Efficiency of Individual Means of Transport in the Process of Optimizing Transport Environments in Urban Areas in Line with the Smart City Idea


Abstract
1. Introduction
2. Review of the Literature in the Context of the Research Problem: Smart City—Sustainable Transport Development in Urban Areas
- Intelligent economy—cities should be characterized by high productivity, an innovative atmosphere, and flexibility of the labour market.
- Intelligent mobility—thanks to the ICT sector, the city is a network of quick connections connecting all city resources.
- Intelligent environment—an intelligent city optimizes energy consumption, including the use of renewable energy sources, undertakes actions to reduce emissions to the environment, and also manages resources by the principle of sustainable development.
- Wise people—the initiators of changes in cities should be their inhabitants, who, with appropriate technical support, can avoid excessive energy and pollution consumption and strive to improve the quality of life.
- Smart Living—the city should provide its residents with a friendly environment, in particular by guaranteeing them wide access to public services, technical and social infrastructure, high-level safety and protection, appropriate cultural and recreational facilities, as well as care for the environment and green areas.
- Intelligent management—the development of this aspect requires the creation of an appropriate city management system, developing procedures that require cooperation between local authorities and other city users, as well as the use of modern technologies in the functioning of the city.
3. Materials and Methods
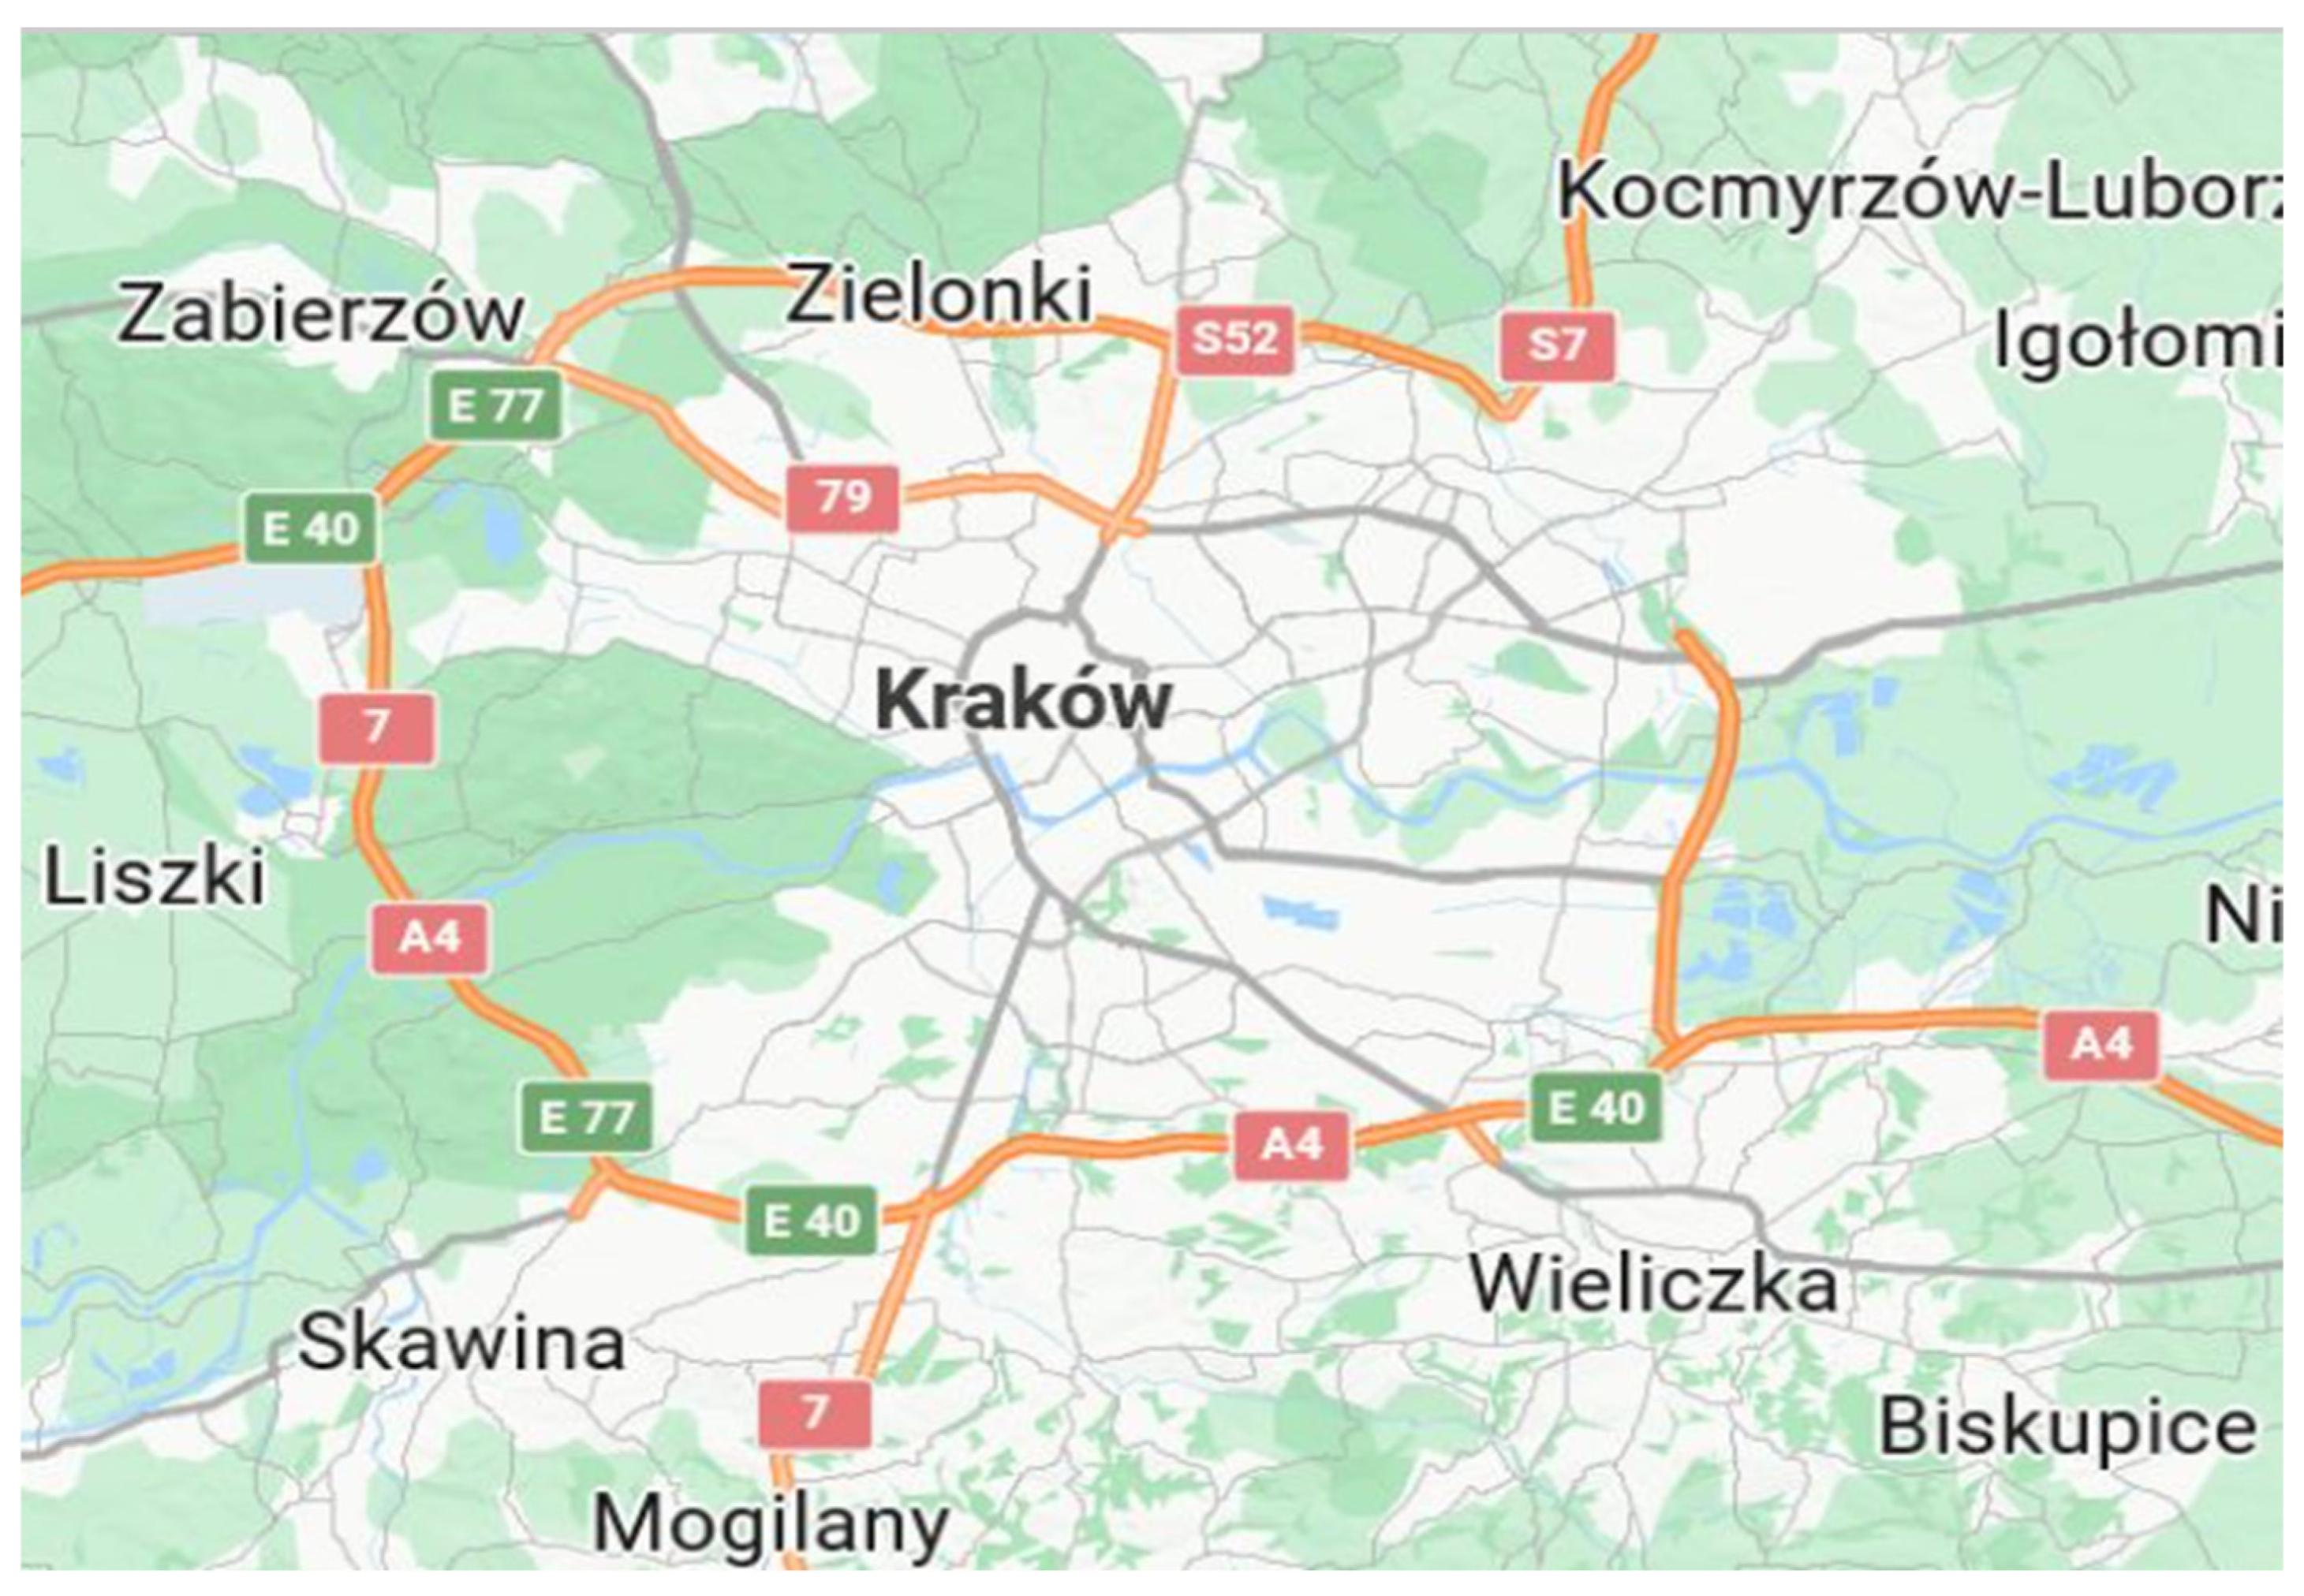
3.1. Justification for the Selection of the Place of Analysis—Selection of the City’s Transport System
3.2. Challenges of Sustainable Transport in the Selected Urban Agglomeration
- -
- combustion and electric passenger cars,
- -
- public transport,
- -
- suburban railway,
- -
- bicycles (private),
- -
- shared transport (car-sharing, scooter, and bicycle operators).
3.3. Basic Analysis Conditions
3.4. Justification for the Selection of Individual Criteria for Analysis of Mobility
3.5. Available Means of Transport
4. Results and Discussion
Multi-Criteria Analysis
- (a)
- time criterion
- weight for the center, ,
- speed for the centre, ,
- weight on the outskirts of the city, ,
- —speed on the outskirts of the city, .
- (b)
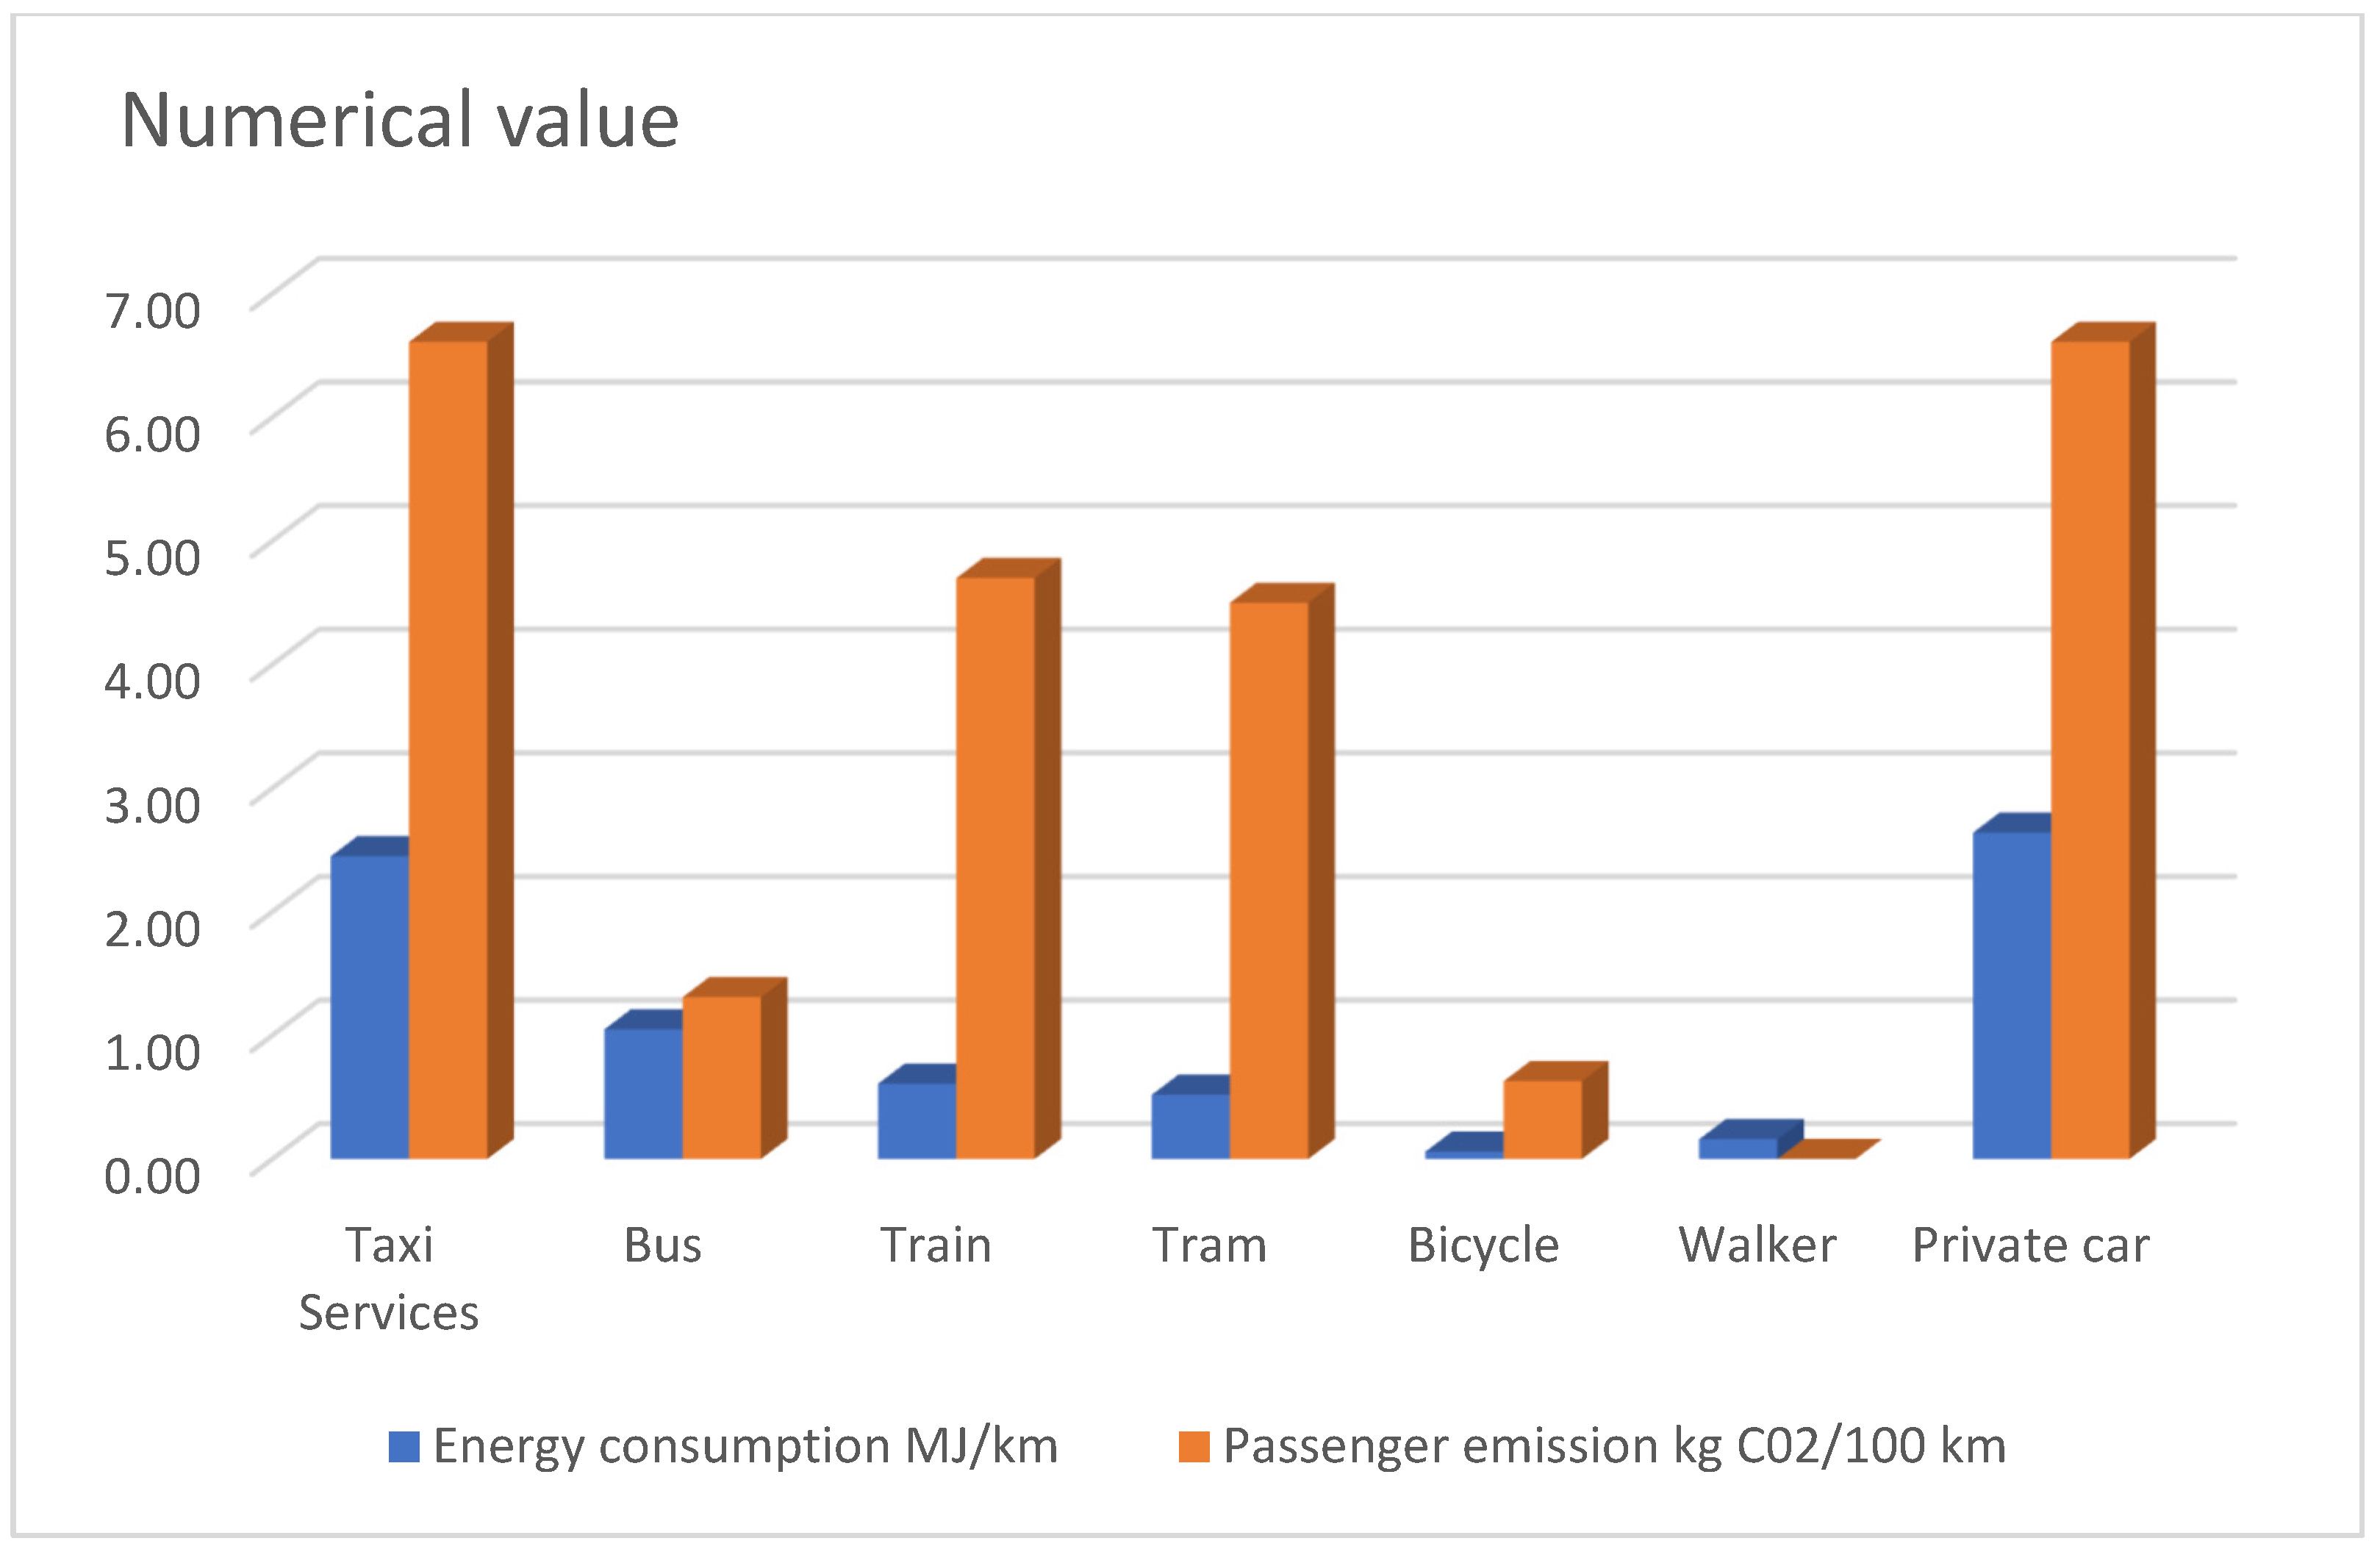
- The energy consumption of individual means of transport
- (c)
- Ecological criterion
- emissions into the atmosphere per person, kg CO2/100 km,
- —CO2 emissions into the atmosphere per 1 litre of gasoline/1 kWh of current, [kg CO2/L]/Current [kg CO2/KWh].
- L—number of people in the vehicle,
- —average fuel/electricity consumption [l/100 km]/[kwh/100 km].
- (d)
- Comfort criterion
- -
- congestion of means of transport,
- -
- transport availability,
- -
- the impact of weather conditions on travel comfort.
- (e)
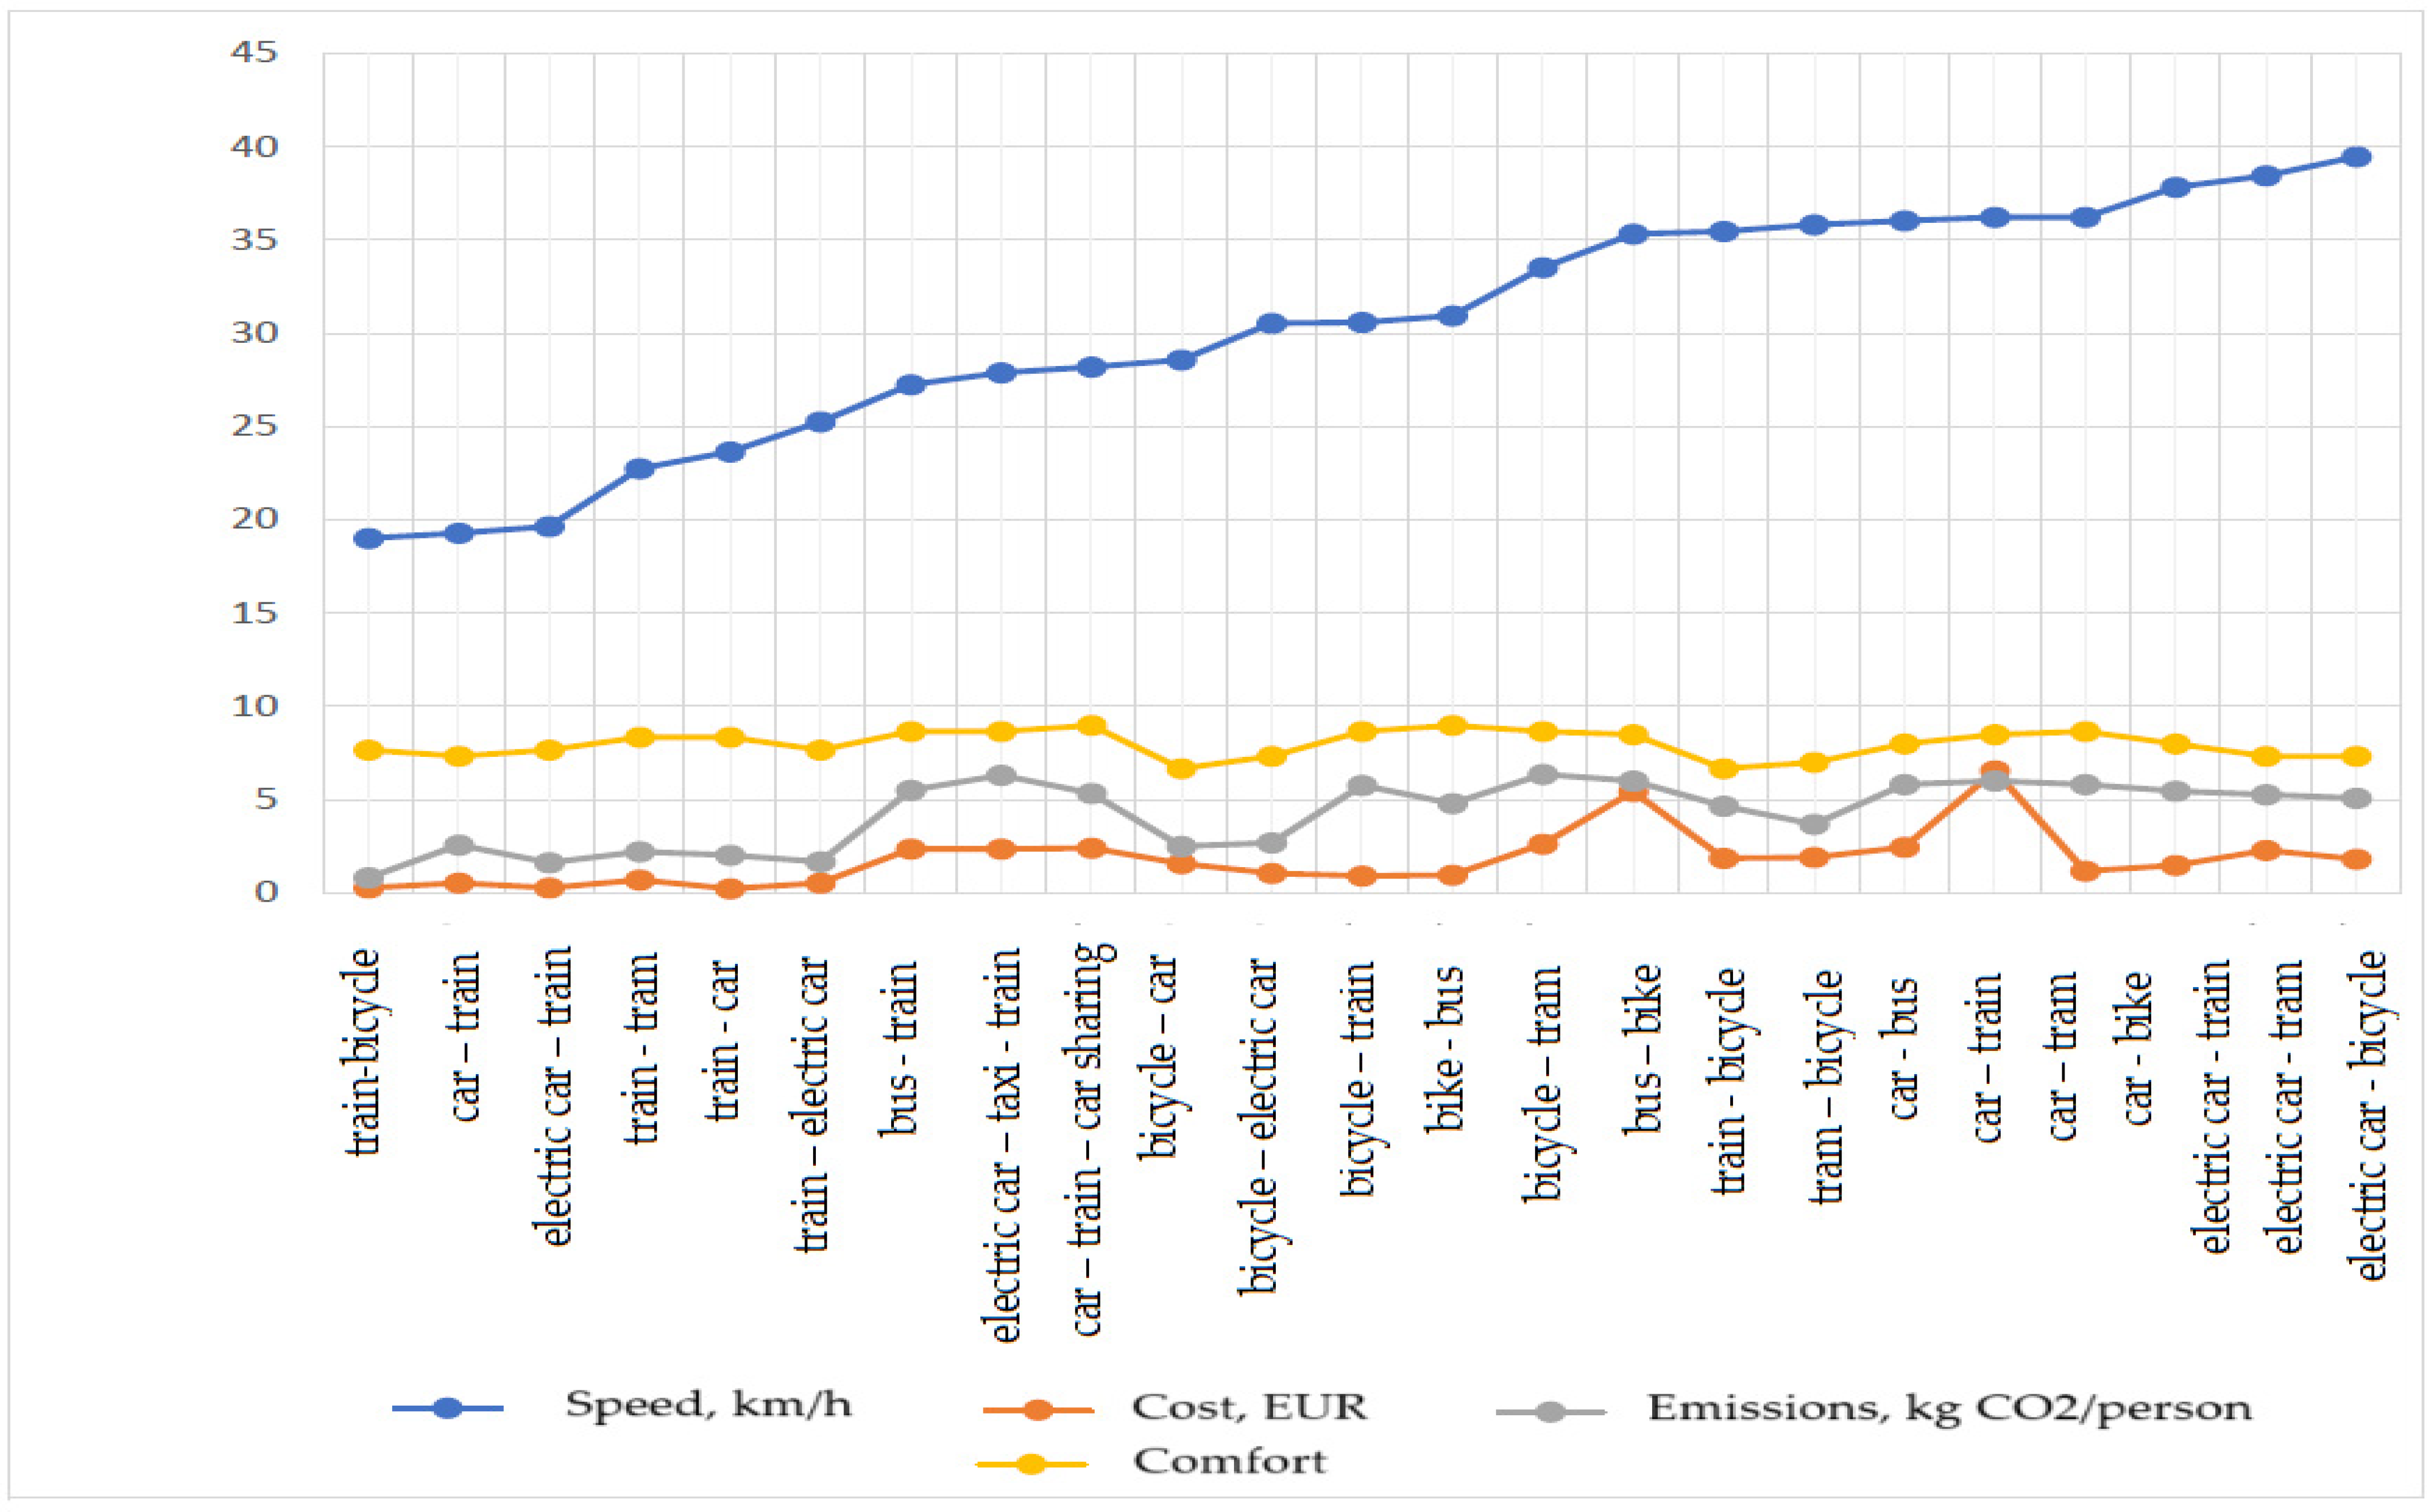
- Assessment of the use of several means of transport under the idea of sustainable transport
- -
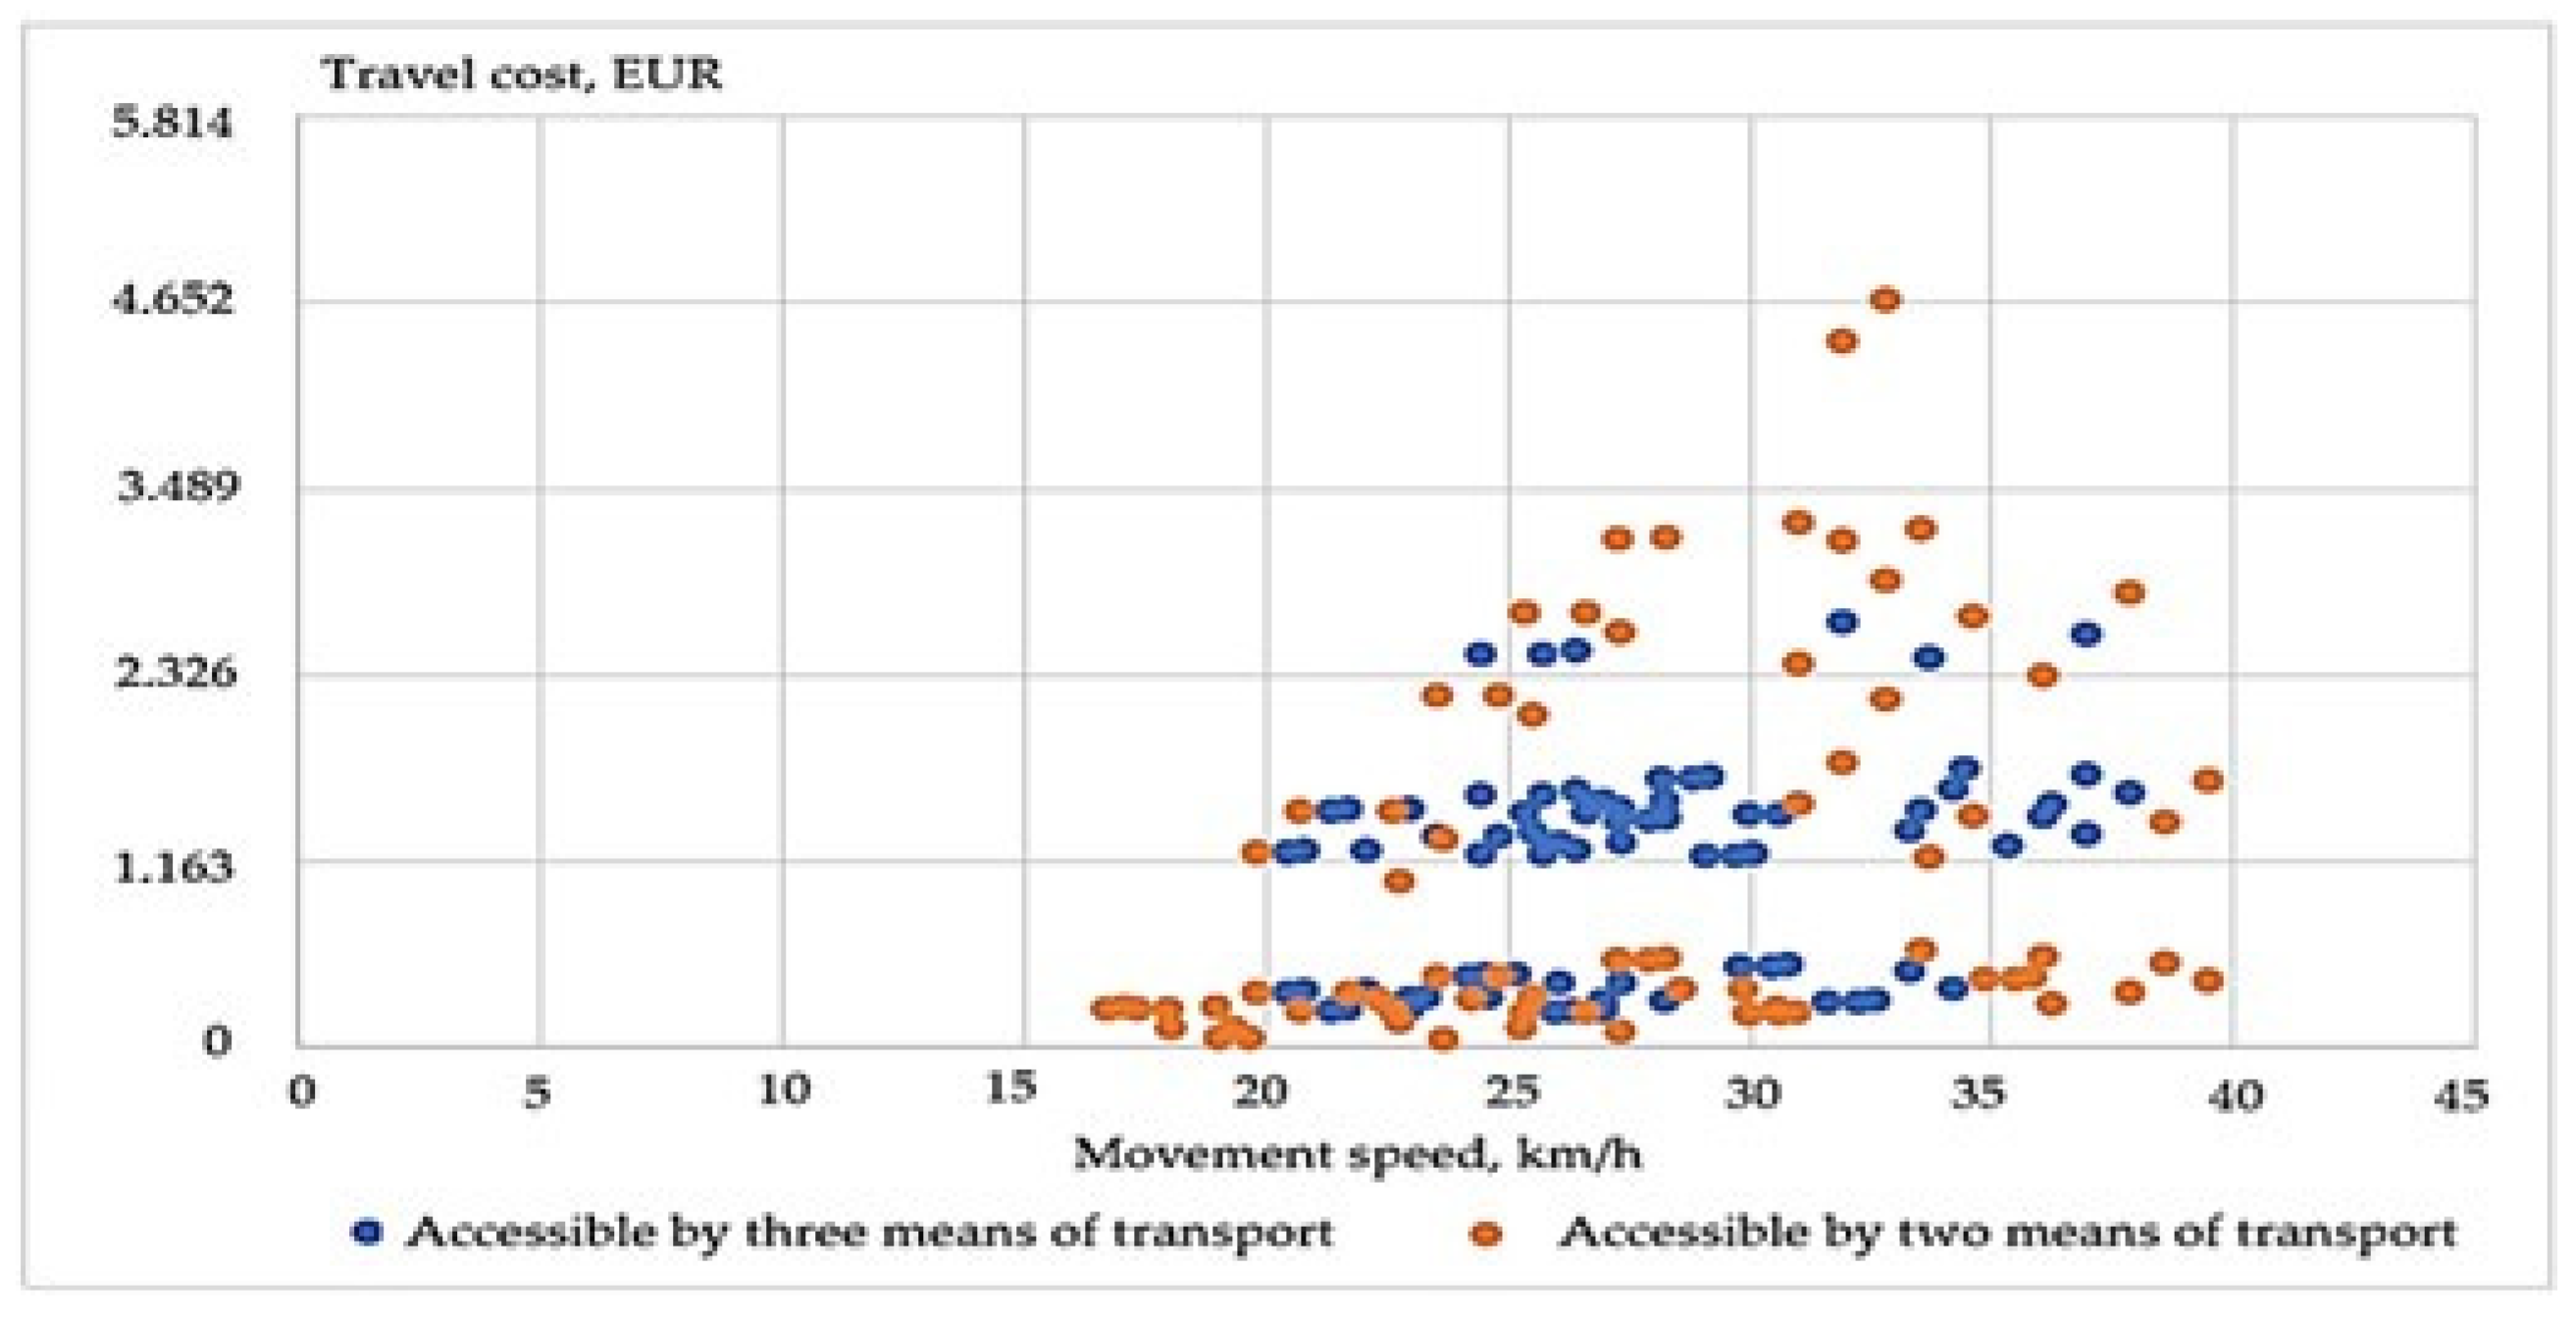
- in Figure 7, the lower speed limit is 35 km/h, and the maximum travel cost is EUR 1628 per year,
- -
- in Figure 8, the lower speed limit is 25 km/h, and the emission level is a maximum of 3 kg/CO2 per year,
- -
- in Figure 9, the lower speed limit is 35 km/h, and the comfort of commuting is not less than 8.33,
- -
- in Figure 10, the upper cost limit is EUR 1628 per year, and the emission intensity is a maximum of 3 kg/CO2 per year,
- -
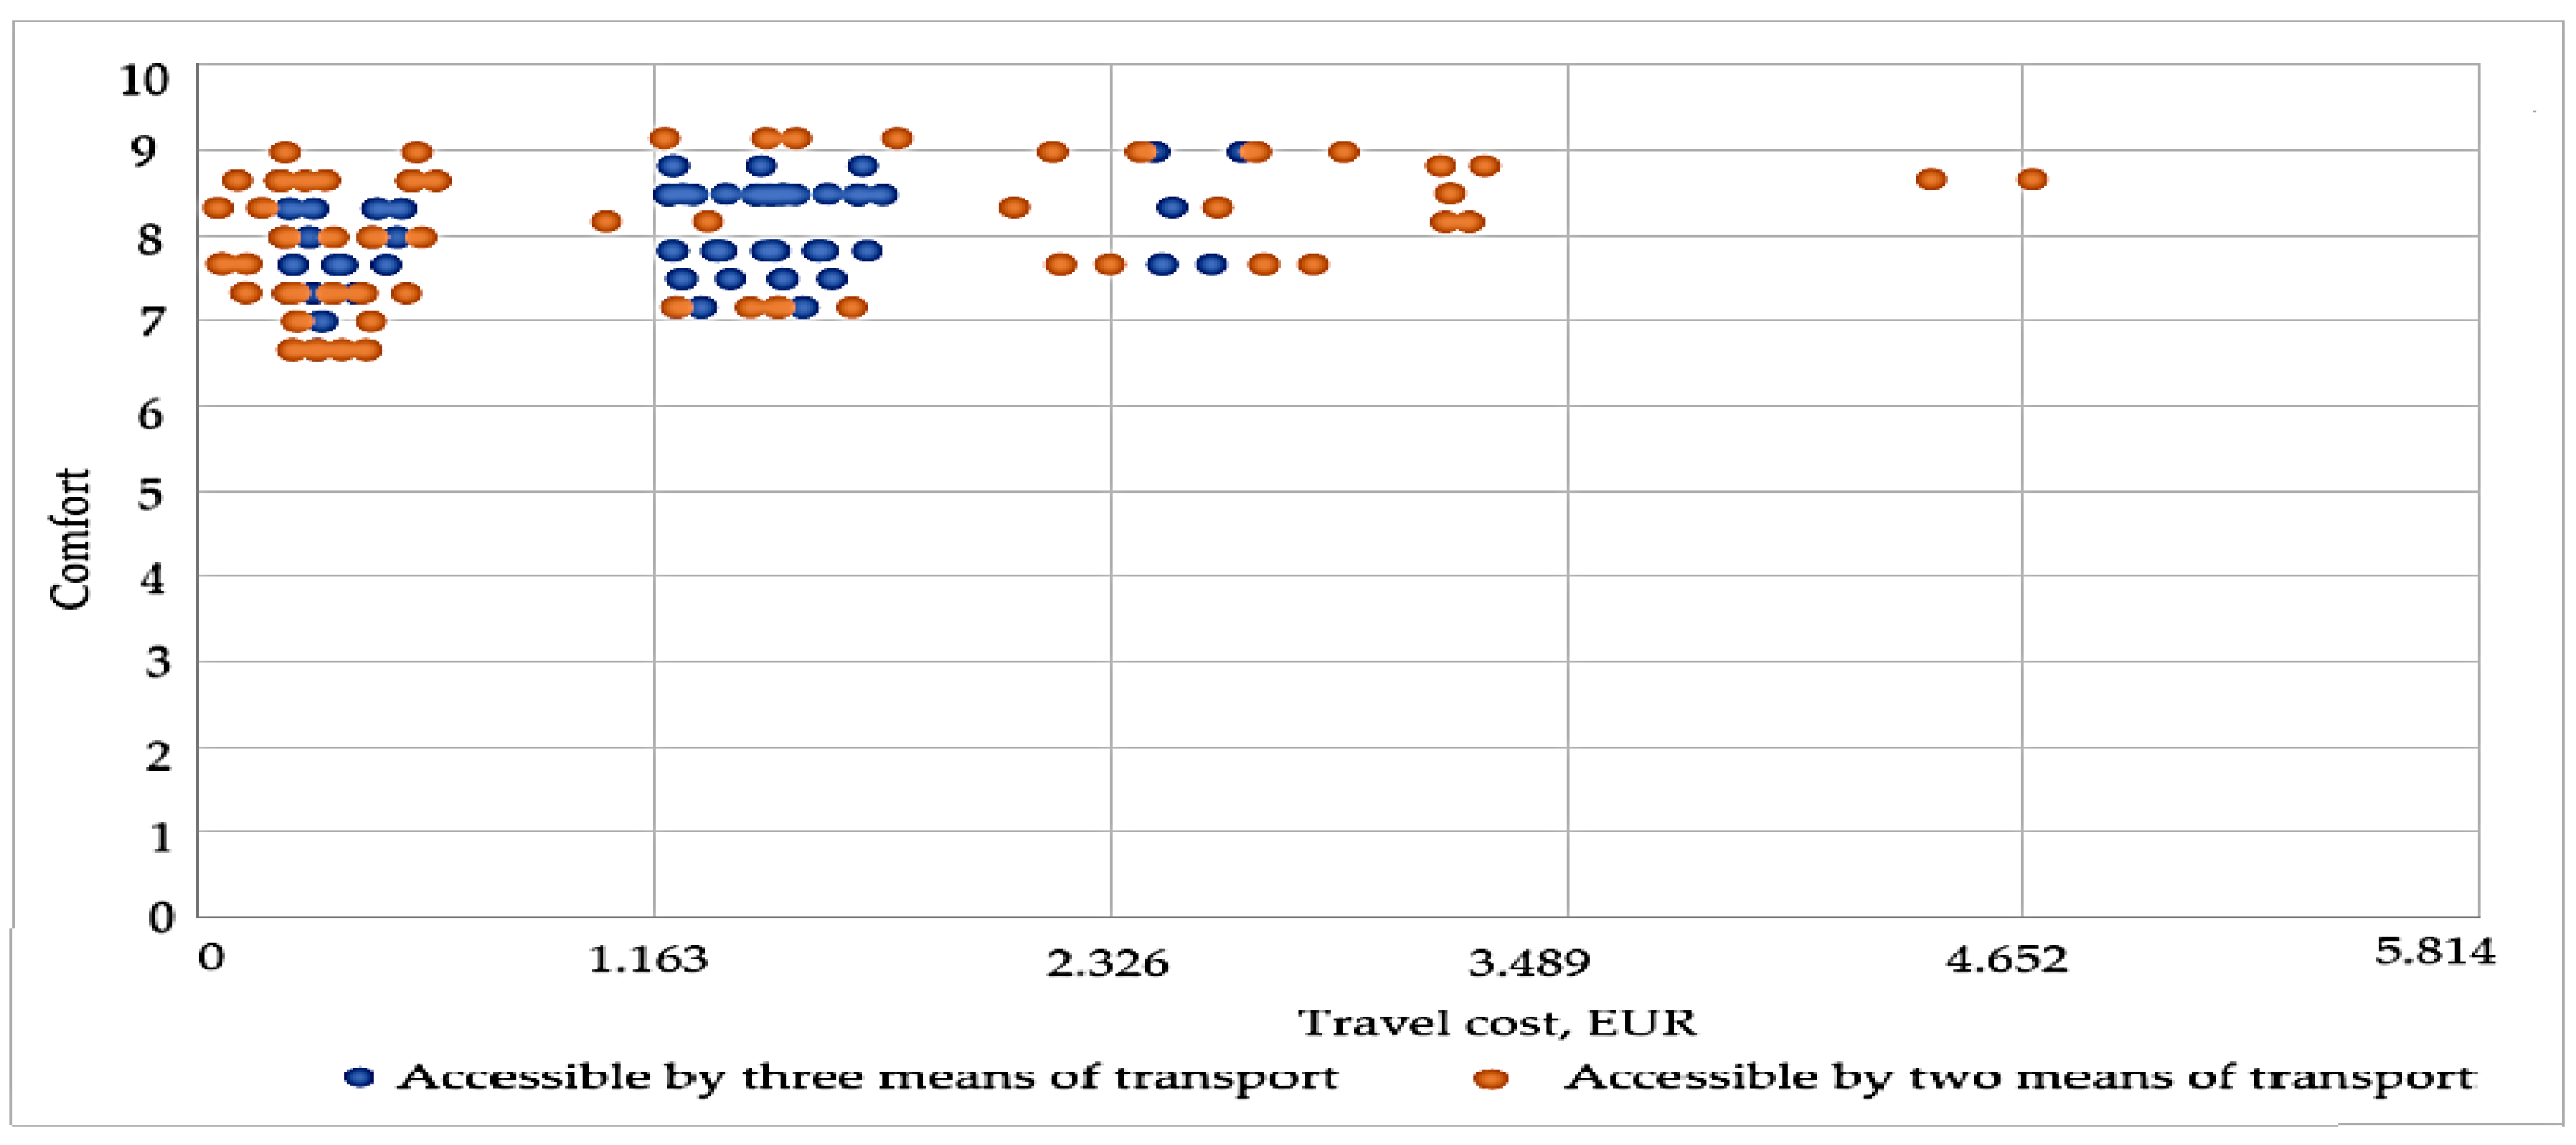
- in Figure 11, the upper cost limit is EUR 1628 per year, and the comfort of commuting is a score not lower than 8.33,
- -
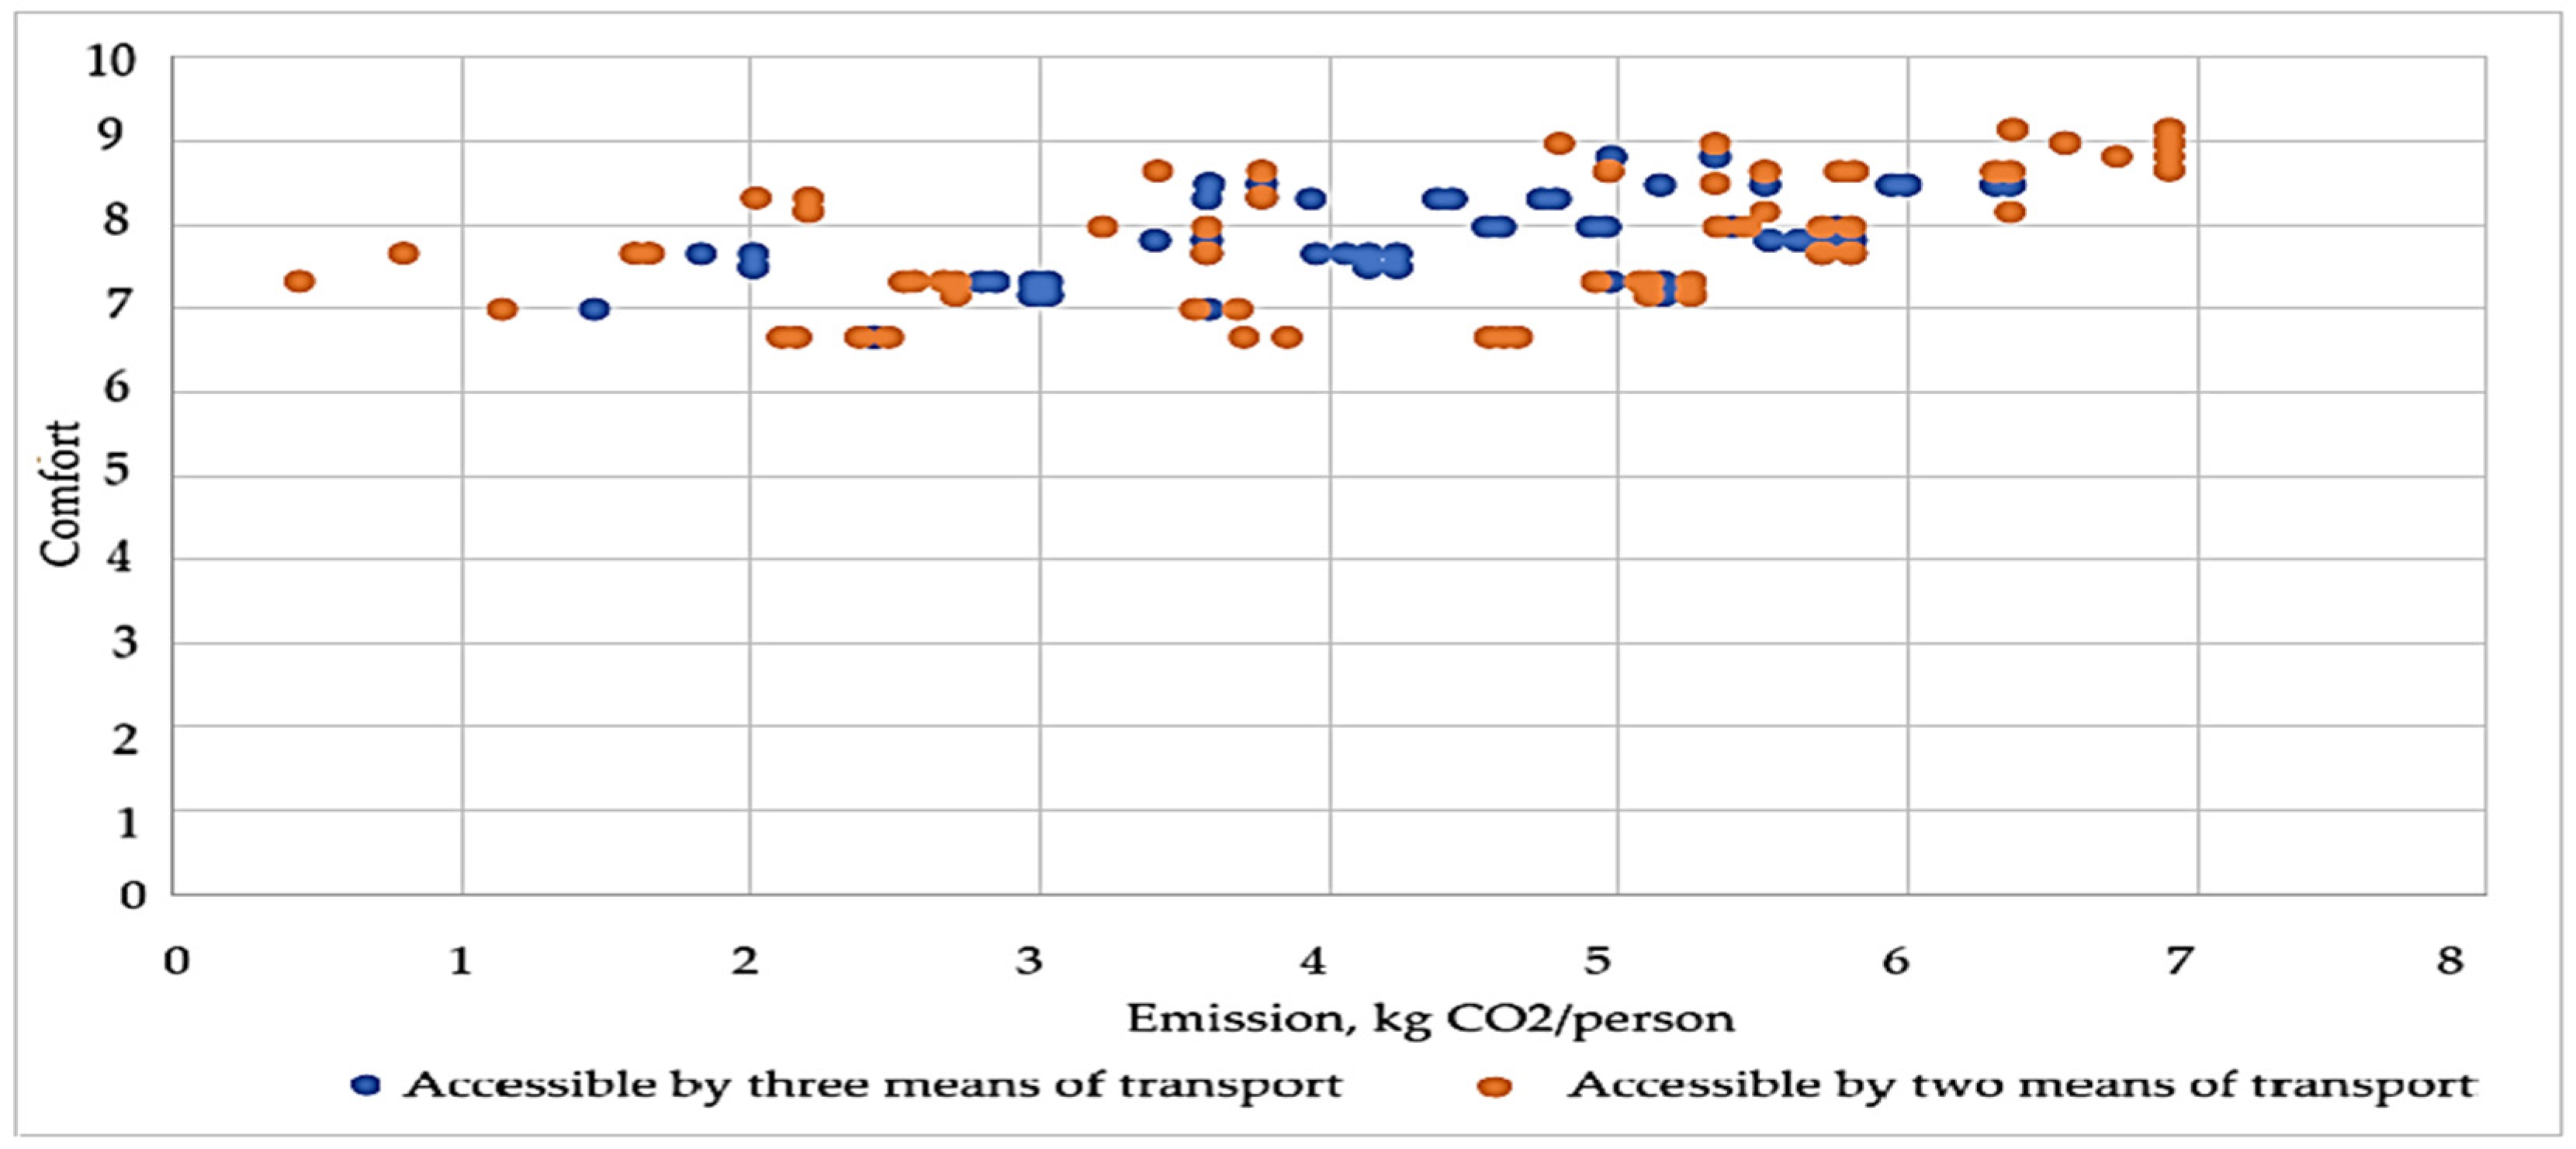
- in Figure 12, the emission is a maximum of 3 kg/CO2 per year, and the commuting comfort is a score not lower than 8.33,
- -
- in Figure 13, the highest emission indicators of over 6 kg/100 km are associated with the highest energy consumption of 2 MJ/km.
- -
- bicycle–train,
- -
- train–car/electric car,
- -
- train–tram.
- -
- electric car–bike/train/tram/bus,
- -
- car–bike/train/tram/bus.
5. Conclusions
- The assessment of energy consumption of individual means of transport may play an important role in the optimization processes of existing transport systems in cities. This is conducted to demonstrate the need to transform individual transport towards electromobility and to increase the role of transport processes based on the combination of two or three means of transport in the process of meeting transport needs in urban areas.
- The implementation of the fastest urban mobility process is associated with the highest level of CO2 emissions. The exception is the use of bicycles and city trains in the transport process. This allows for maintaining high-cost efficiency with reasonable travel speed and appropriate comfort.
- Analyses of selected variants of transport connections involving two or three means of transport indicate that high CO2 emissions are not always associated with high energy intensity–energy consumption (MJ/km). However, studies clearly indicate high energy consumption by means of individual transport, such as a passenger car equipped with a combustion engine. This is the basis for a discussion on the broader implications of solutions based on the idea of electromobility in the area of urban transport systems.
- In most variants, bikes and trains are perceived as the most effective means of transport. The combination of these two means of transport provides daily access to the city centre, which can be indicated as meeting most transport expectations of city residents. This connection seems to be the optimal solution in the context of the transport process, in line with the idea of sustainable transport.
- The analyzed variants of using individual means of transport are not able to guarantee the highest standards in each of the criteria studied. High values in one criterion usually lead to worse parameters in other categories. However, it is possible to identify several types of variants of using two means of transport, which can be assessed satisfactorily in terms of the four analyzed criteria.
- Services provided by public transport are part of a wide range of favourable transport options, mainly due to their low environmental impact. They can complement a smaller number of journeys due to lower speeds and comfort. However, taxi services and car rentals are very low in financial terms. Compared to other means of transport, the cost of using these services is relatively higher than in the case of public transport. The authors put forth the thesis that these two means of transport may be complementary to meet everyday transport needs.
- Due to the high complexity and scope of the problems presented, it is also not possible to indicate the most effective variant used for individual means of transport. Nevertheless, transport connections have been identified, which are an interesting alternative and can be a large exchange for the use of private cars, which is one of the demands of implementing sustainable transport solutions in many cities as part of shaping and planning sustainable mobility.
- The presented results indicate that individual transport is not the best solution for specific selection criteria. In turn, the use of an electric bike as one of the elements of the transport process is a direction that is worth promoting as an alternative, of course, provided that you have an appropriate link and point infrastructure. In addition, the development of railway connections within the urban agglomeration may constitute one of the main strategies for the development of sustainable transport. If it is not possible to give up individual transport as one of the means of transport, the analysis shows that the use of several other means of transport, depending on our priorities, can partially reduce problems related to environmental pollution while maintaining travel comfort and speed, which is one of the main goals of developing solutions within the philosophy of sustainable development and the Smart City concept.
Author Contributions
Funding
Data Availability Statement
Conflicts of Interest
Appendix A
| Driving speed during commuting and returning hours [24] Driving speed [km/h] based on data from | |||||
| Hour | 11.05 | 12.05 | 15.05 | 16.05 | 17.05 |
| 6–7 | 29.5 | 31 | 26.6 | 28 | 25.8 |
| 7–8 | 26.8 | 28.8 | 23.2 | 25.4 | 22.8 |
| 8–9 | 26.9 | 29.8 | 23.2 | 25.8 | 23.1 |
| 14–15 | 21 | 23 | 23.6 | 24.1 | 20.1 |
| 15–16 | 19.9 | 22.8 | 20.5 | 21.8 | 17.5 |
| 16–17 | 20 | 25.7 | 21.5 | 22.5 | 17.8 |
| 17–18 | 23 | 30.1 | 25.7 | 24.4 | 21.2 |
Appendix B
| Vehicle Model | Average Consumption for Unleaded Petrol [L/100 km] |
| Toyota Yaris | 5.2 |
| Peugeot 208 | 5.7 |
| Skoda Fabia | 6.0 |
| Average Fuel Consumption | 5.63 |
References
- Gams, M.; Kolenik, T. Relations between electronics, artificial intelligence and information society through information society rules. Electronics 2021, 10, 514. [Google Scholar] [CrossRef]
- Bjørner, T. The advantages of and barriers to being smart in a smart city: The perceptions of project managers within a smart city cluster project in Greater Copenhagen. Cities 2021, 114, 103187. [Google Scholar] [CrossRef]
- Canitez, F.; Çelebi, D.; Beyazit, E. Establishing a metropolitan transport authority in Istanbul: A new institutional economics framework for institutional change in urban transport. Case Stud. Transp. Policy 2019, 7, 562–573. [Google Scholar] [CrossRef]
- Russell, S.; Norvig, P. Artificial Intelligence: A Modern Approach; Pearson: Hoboken, NJ, USA, 2020. [Google Scholar]
- Mirzahossein, H.; Mohghaddam, S.A.A. Increasing Citizen’s Livability in the Future City: Responsive City, a Remarkable Solution. Theor. Empir. Res. Urban Manag. 2021, 16, 23–41. [Google Scholar]
- Mittal, S.; Chadchan, J.; Mishra, S.K. Review of Concepts, Tools and Indices for the Assessment of Urban Quality of Life. Soc. Indic. Res. 2020, 149, 187–214. [Google Scholar] [CrossRef]
- Lewicki, W.; Bera, M.; Śpiewak-Szyjka, M. The Correlation of the Smart City Concept with the Costs of Toxic Exhaust Gas Emissions Based on the Analysis of a Selected Population of Motor Vehicles in Urban Traffic. Energies 2024, 17, 5375. [Google Scholar] [CrossRef]
- Piszak, J. Smart Urban Mobility for the City of Krakow. Master’s Thesis, AGH University of Krakow, Krakow, Poland, 2023. [Google Scholar]
- Quiroga, E.; Gutiérrez, K. Smart mobility: Opportunities and challenges for Colombian cities. Adv. Sci. Technol. Eng. Syst. J. 2021, 6, 332–338. [Google Scholar] [CrossRef]
- Ogrodnik, K. Multi-criteria analysis of smart cities in Poland. Geogr. Pol. 2020, 93, 163–181. [Google Scholar] [CrossRef]
- Allam, Z.; Sharifi, A. Research Structure and Trends of Smart Urban Mobility. Smart Cities 2022, 5, 539–561. [Google Scholar] [CrossRef]
- Wimbadi, R.W.; Djalante, R.; Mori, A. Urban experiments with public transport for low carbon mobility transitions in cities: A systematic literature review (1990–2020). Sustain. Cities Soc. 2021, 72, 103023. [Google Scholar] [CrossRef]
- Jagiełło, A. Elektromobilność w Kształtowaniu Rozwoju Drogowego Transportu Miejskiego w Polsce; Wydawnictwa Uniwersytetu Gdańskiego: Gdańsk, Poland, 2021. [Google Scholar]
- Carneiro, D.; Amaral, A.; Carvalho, M.; Barreto, L. An Anthropocentric and Enhanced Predictive Approach to Smart City Management. Smart Cities 2021, 4, 1366–1390. [Google Scholar] [CrossRef]
- Gazzeh, K. Ranking Sustainable Smart City Indicators Using Combined Content Analysis and Analytic Hierarchy Process Techniques. Smart Cities 2023, 6, 2883–2909. [Google Scholar] [CrossRef]
- Broniewicz, E.; Ogrodnik, K. Multi-criteria analysis of transport infrastructure projects. Transp. Res. Part D Transp. Environ. 2020, 83, 102351. [Google Scholar] [CrossRef]
- Wołek, M.; Wolański, M.; Bartłomiejczyk, M.; Wyszomirski, O.; Grzelec, K.; Hebel, K. Ensuring sustainable development of urban public transport: A case study of the trolleybus system in Gdynia and Sopot (Poland). J. Clean. Prod. 2021, 279, 123807. [Google Scholar] [CrossRef]
- Szarata, A.; Ostaszewski, P.; Mirzahossein, H. Simulating the impact of autonomous vehicles (AVs) on intersections traffic conditions using TRANSYT and PTV Vissim. Innov. Infrastruct. Solut. 2023, 8, 164. [Google Scholar] [CrossRef]
- Bibri, S.E. The Social Shaping of the Metaverse as an Alternative to the Imaginaries of Data-Driven Smart Cities: A Study in Science, Technology, and Society. Smart Cities 2022, 5, 832–874. [Google Scholar] [CrossRef]
- Šemanjski, I.; Bellens, R.; Gautama, S.; Witlox, F. Integrating Big Data into a Sustainable Mobility Policy 2.0 Planning Support System. Sustainability 2016, 8, 1142. [Google Scholar] [CrossRef]
- Ryzhkov, A.; Sarzhan, Y. Market initiative and central planning: A study of the Moscow bus network. Res. Transp. Econ. 2020, 83, 100919. [Google Scholar] [CrossRef]
- Pereira, R.C.; Branchi, B.A.; Ferreira, D.H.L. Sustainable urban mobility diagnosis: Applicability of a composite index. RISUS J. Innov. Sustain. 2021, 12, 16–29. [Google Scholar]
- Zapolskytė, S.; Burinskienė, M.; Trépanier, M. Evaluation criteria of smart city mobility system using MCDM method. Balt. J. Road Bridg. Eng. 2020, 15, 196–224. [Google Scholar] [CrossRef]
- Bartłomiejczyk, M.; Połom, M. Sustainable use of the catenary by trolleybuses with auxiliary power sources on the example of gdynia. Infrastructures 2021, 6, 61. [Google Scholar] [CrossRef]
- Fontes, T.; Arantes, M.; Figueiredo, P.V.; Novais, P. A Cluster-Based Approach Using Smartphone Data for Bike-Sharing Docking Stations Identification: Lisbon Case Study. Smart Cities 2022, 5, 251–275. [Google Scholar] [CrossRef]
- Shulajkovska, M.; Smerkol, M.; Dovgan, E.; Gams, M. A machine-learning approach to a mobility policy proposal. Heliyon 2023, 9, e20393. [Google Scholar] [CrossRef] [PubMed]
- He, Y.; Liu, Z.; Song, Z. Optimal charging scheduling and management for a fast-charging battery electric bus system. Transp. Res. Part E Logist. Transp. Rev. 2020, 142, 102056. [Google Scholar] [CrossRef]
- Bartłomiejczyk, M.; Kołacz, R. The reduction of auxiliaries power demand: The challenge for electromobility in public transportation. J. Clean. Prod. 2020, 252, 119776. [Google Scholar] [CrossRef]
- Wolniak, R.; Stecuła, K. Artificial Intelligence in Smart Cities—Applications, Barriers, and Future Directions: A Review. Smart Cities 2024, 7, 1346–1389. [Google Scholar] [CrossRef]
- Belaïd, F.; Amine, R.; Massie, C. Smart cities initiatives and perspectives in the MENA region and Saudi Arabia. In Smart Cities: Social and Environmental Challenges and Opportunities for Local Authorities; Springer International Publishing: Cham, Switzerland, 2023; pp. 295–313. [Google Scholar]
- Nagy, S.; Csiszár, C. The quality of smart mobility: A systematic review. Sci. J. Silesian Univ. Technol. Ser. Transp. 2020, 109, 117–127. [Google Scholar] [CrossRef]
- Bıyık, C.; Abareshi, A.; Paz, A.; Ruiz, R.; Battarra, R.; Rogers, C.; Lizarraga, C. Smart mobility adoption: A review of the literature. J. Open Innov. Technol. Mark. Complex. 2021, 7, 146. [Google Scholar] [CrossRef]
- Fitzová, H.; Matulová, M. Comparison of urban public transport systems in the Czech Republic and Slovakia: Factors underpinning efficiency. Res. Transp. Econ. 2020, 81, 100824. [Google Scholar] [CrossRef]
- Petkov, D. The uneven development path of Bulgarian trolleybus transport—Leading back to the future? Case Stud. Transp. Policy 2020, 8, 1383–1392. [Google Scholar] [CrossRef]
- Jacques, E.d.A.; Júnior, A.N.; de Paris, S.; Francescatto, M.B.; Nunes, R.F.B. Smart City Actions Integrated into Urban Planning: Management of Urban Environments by Thematic Areas. Appl. Sci. 2024, 14, 3351. [Google Scholar] [CrossRef]
- Lewicki, W.; Stankiewicz, B.; Olejarz-Wahba, A.A. The Role of Intelligent Transport Systems in the Development of the Idea of Smart City. In Smart and Green Solutions for Transport Systems; Sierpiński, G., Ed.; TSTP 2019; Advances in Intelligent Systems and Computing; Springer: Cham, Switzerland, 2020; Volume 1091. [Google Scholar] [CrossRef]
- Müller, J.; Straub, M.; Richter, G.; Rudloff, C. Integration of different mobility behaviours and intermodal trips in MATSim. Sustainability 2021, 14, 428. [Google Scholar] [CrossRef]
- da Silva Lima, L.; Quartier, M.; Buchmayr, A.; Sanjuan-Delmás, D.; Laget, H.; Corbisier, D.; Mertens, J.; Dewulf, J. Life cycle assessment of lithium-ion batteries and vanadium redox flow batteries-based renewable energy storage systems. Sustain. Energy Technol. Assess. 2021, 46, 101286. [Google Scholar] [CrossRef]
- Silvestri, L.; Forcina, A.; Silvestri, C.; Traverso, M. Circularity potential of rare earth for sustainable mobility: Recent developments, challenges and prospects. J. Clean. Prod. 2021, 292, 126089. [Google Scholar] [CrossRef]
- Damidavičius, J.; Burinskienċ, M.; Antuchevičienċ, J. Assessing Sustainable Mobility Measures Applying Multicriteria Decision Making Methods. Sustainability 2020, 12, 6067. [Google Scholar] [CrossRef]
- Ali, N. Evaluating sustainable urban transport systems: A Review study for the identification of smart mobility indicators. Trans. Transp. Sci. 2021, 12, 16–23. [Google Scholar] [CrossRef]
- Paiva, S.; Ahad, M.A.; Tripathi, G.; Feroz, N.; Casalino, G. Enabling technologies for urban smart mobility: Recent trends, opportunities and challenges. Sensors 2021, 21, 2143. [Google Scholar] [CrossRef]
- Kiba-Janiak, M.; Witkowski, J. Sustainable Urban Mobility Plans: How Do They Work? Sustainability 2019, 11, 4605. [Google Scholar] [CrossRef]
- Mancini, L.; Eslava, N.A.; Traverso, M.; Mathieux, F. Assessing impacts of responsible sourcing initiatives for cobalt: Insights from a case study. Resour. Policy 2021, 71, 102015. [Google Scholar] [CrossRef]
- Jelti, F.; Allouhi, A.; Al-Ghamdi, S.G.; Saadani, R.; Jamil, A.; Rahmoune, M. Environmental life cycle assessment of alternative fuels for city buses: A case study in Oujda city, Morocco. Int. J. Hydrog. Energy 2021, 6, 25308–25319. [Google Scholar] [CrossRef]
- Mukundan, A.; Karmakar, R.; Jouhar, J.; Valappil, M.A.E.; Wang, H.C. Advancing Urban Development: Applications of Hyperspectral Imaging in Smart City Innovations and Sustainable Solutions. Smart Cities 2025, 8, 51. [Google Scholar] [CrossRef]
- Martella, F.; Fazio, M.; Ciulla, G.; Bernardo, R.D.; Celesti, A.; Lukaj, V.; Colosi, M.; Gangi, M.D.; Villari, M. An Edge System for the Safety of Cyclists in the Urban Area. In Proceedings of the 2022 IEEE International Smart Cities Conference (ISC2), Pafos, Cyprus, 26–29 September 2022; pp. 1–7. [Google Scholar]
- Inac, H.; Oztemel, E. An assessment framework for the transformation of mobility 4.0 in smart cities. Systems 2021, 10, 1. [Google Scholar] [CrossRef]
- Sojda, A. Smart city index based on topsis method. Sci. Pap. Silesian Univ. Technol. Organ. Manag. Ser. 2020, 148, 709–718. [Google Scholar] [CrossRef]
- Regmi, M.B. Measuring the sustainability of urban mobility: A pilot study of Asian cities. Case Stud. Transp. Policy 2020, 8, 1224–1232. [Google Scholar]
- Kulkarni, A.J. Multiple Criteria Decision Making: Techniques, Analysis and Applications. In Studies in Systems, Decision and Control; Springer: Singapore, 2022; Volume 407. [Google Scholar]
- Azhar, N.A.; Radzi, N.A.; Wan Ahmad, W.S.H.M. Multi-criteria decision making: A systematic review. Recent Adv. Electr. Electron. Eng. (Former. Recent Patents Electr. Electron. Eng.) 2021, 14, 779–801. [Google Scholar] [CrossRef]
- Chiaramonti, D.; Talluri, G.; Scarlat, N.; Prussi, M. The challenge of forecasting the role of biofuel in EU transport decarbonisation in 2050: A meta-analysis review of published scenarios. Renew. Sustain. Energy Rev. 2021, 139, 110715. [Google Scholar] [CrossRef]
- Sówka, I.; Bezyk, Y. Greenhouse gas emission accounting at urban level: A case study of the city of Wroclaw (Poland). Atmos. Pollut. Res. 2018, 9, 289–298. [Google Scholar] [CrossRef]
- Pozoukidou, G.; Angelidou, M. Urban planning in the 15-minute city: Revisited under sustainable and smart city developments until 2030. Smart Cities 2022, 5, 1356–1375. [Google Scholar] [CrossRef]
- Ruggieri, R.; Ruggeri, M.; Vinci, G.; Poponi, S. Electric mobility in a smart city: European overview. Energies 2021, 14, 315. [Google Scholar] [CrossRef]
- Karpenko, M.; Prentkovskis, O.; Skačkauskas, P. Analysing the impact of electric kick-scooters on drivers: Vibration and frequency transmission during the ride on different types of urban pavements. Eksploat. Niezawodn. Maint. Reliab. 2025, 27, 199893. [Google Scholar] [CrossRef]
- Stępniak, C.; Jelonek, D.; Wyrwicka, M.; Chomiak-Orsa, I. Integration of the Infrastructure of Systems Used in Smart Cities for the Planning of Transport and Communication Systems in Cities. Energies 2021, 14, 3069. [Google Scholar] [CrossRef]
- Puzio, E.; Drożdż, W.; Kolon, M. The Role of Intelligent Transport Systems and Smart Technologies in Urban Traffic Management in Polish Smart Cities. Energies 2025, 18, 2580. [Google Scholar] [CrossRef]
- Reyes-Rubiano, L.; Serrano-Hernandez, A.; Montoya-Torres, J.R.; Faulin, J. The Sustainability Dimensions in Intelligent Urban Transportation: A Paradigm for Smart Cities. Sustainability 2021, 13, 10653. [Google Scholar] [CrossRef]
- Maskeliūnaitė, L.; Sivilevičius, H. The Model for Evaluating the Criteria Describing the Quality of the Trip by International Train. Technol. Econ. Dev. Econ. 2014, 20, 484–506. [Google Scholar] [CrossRef]


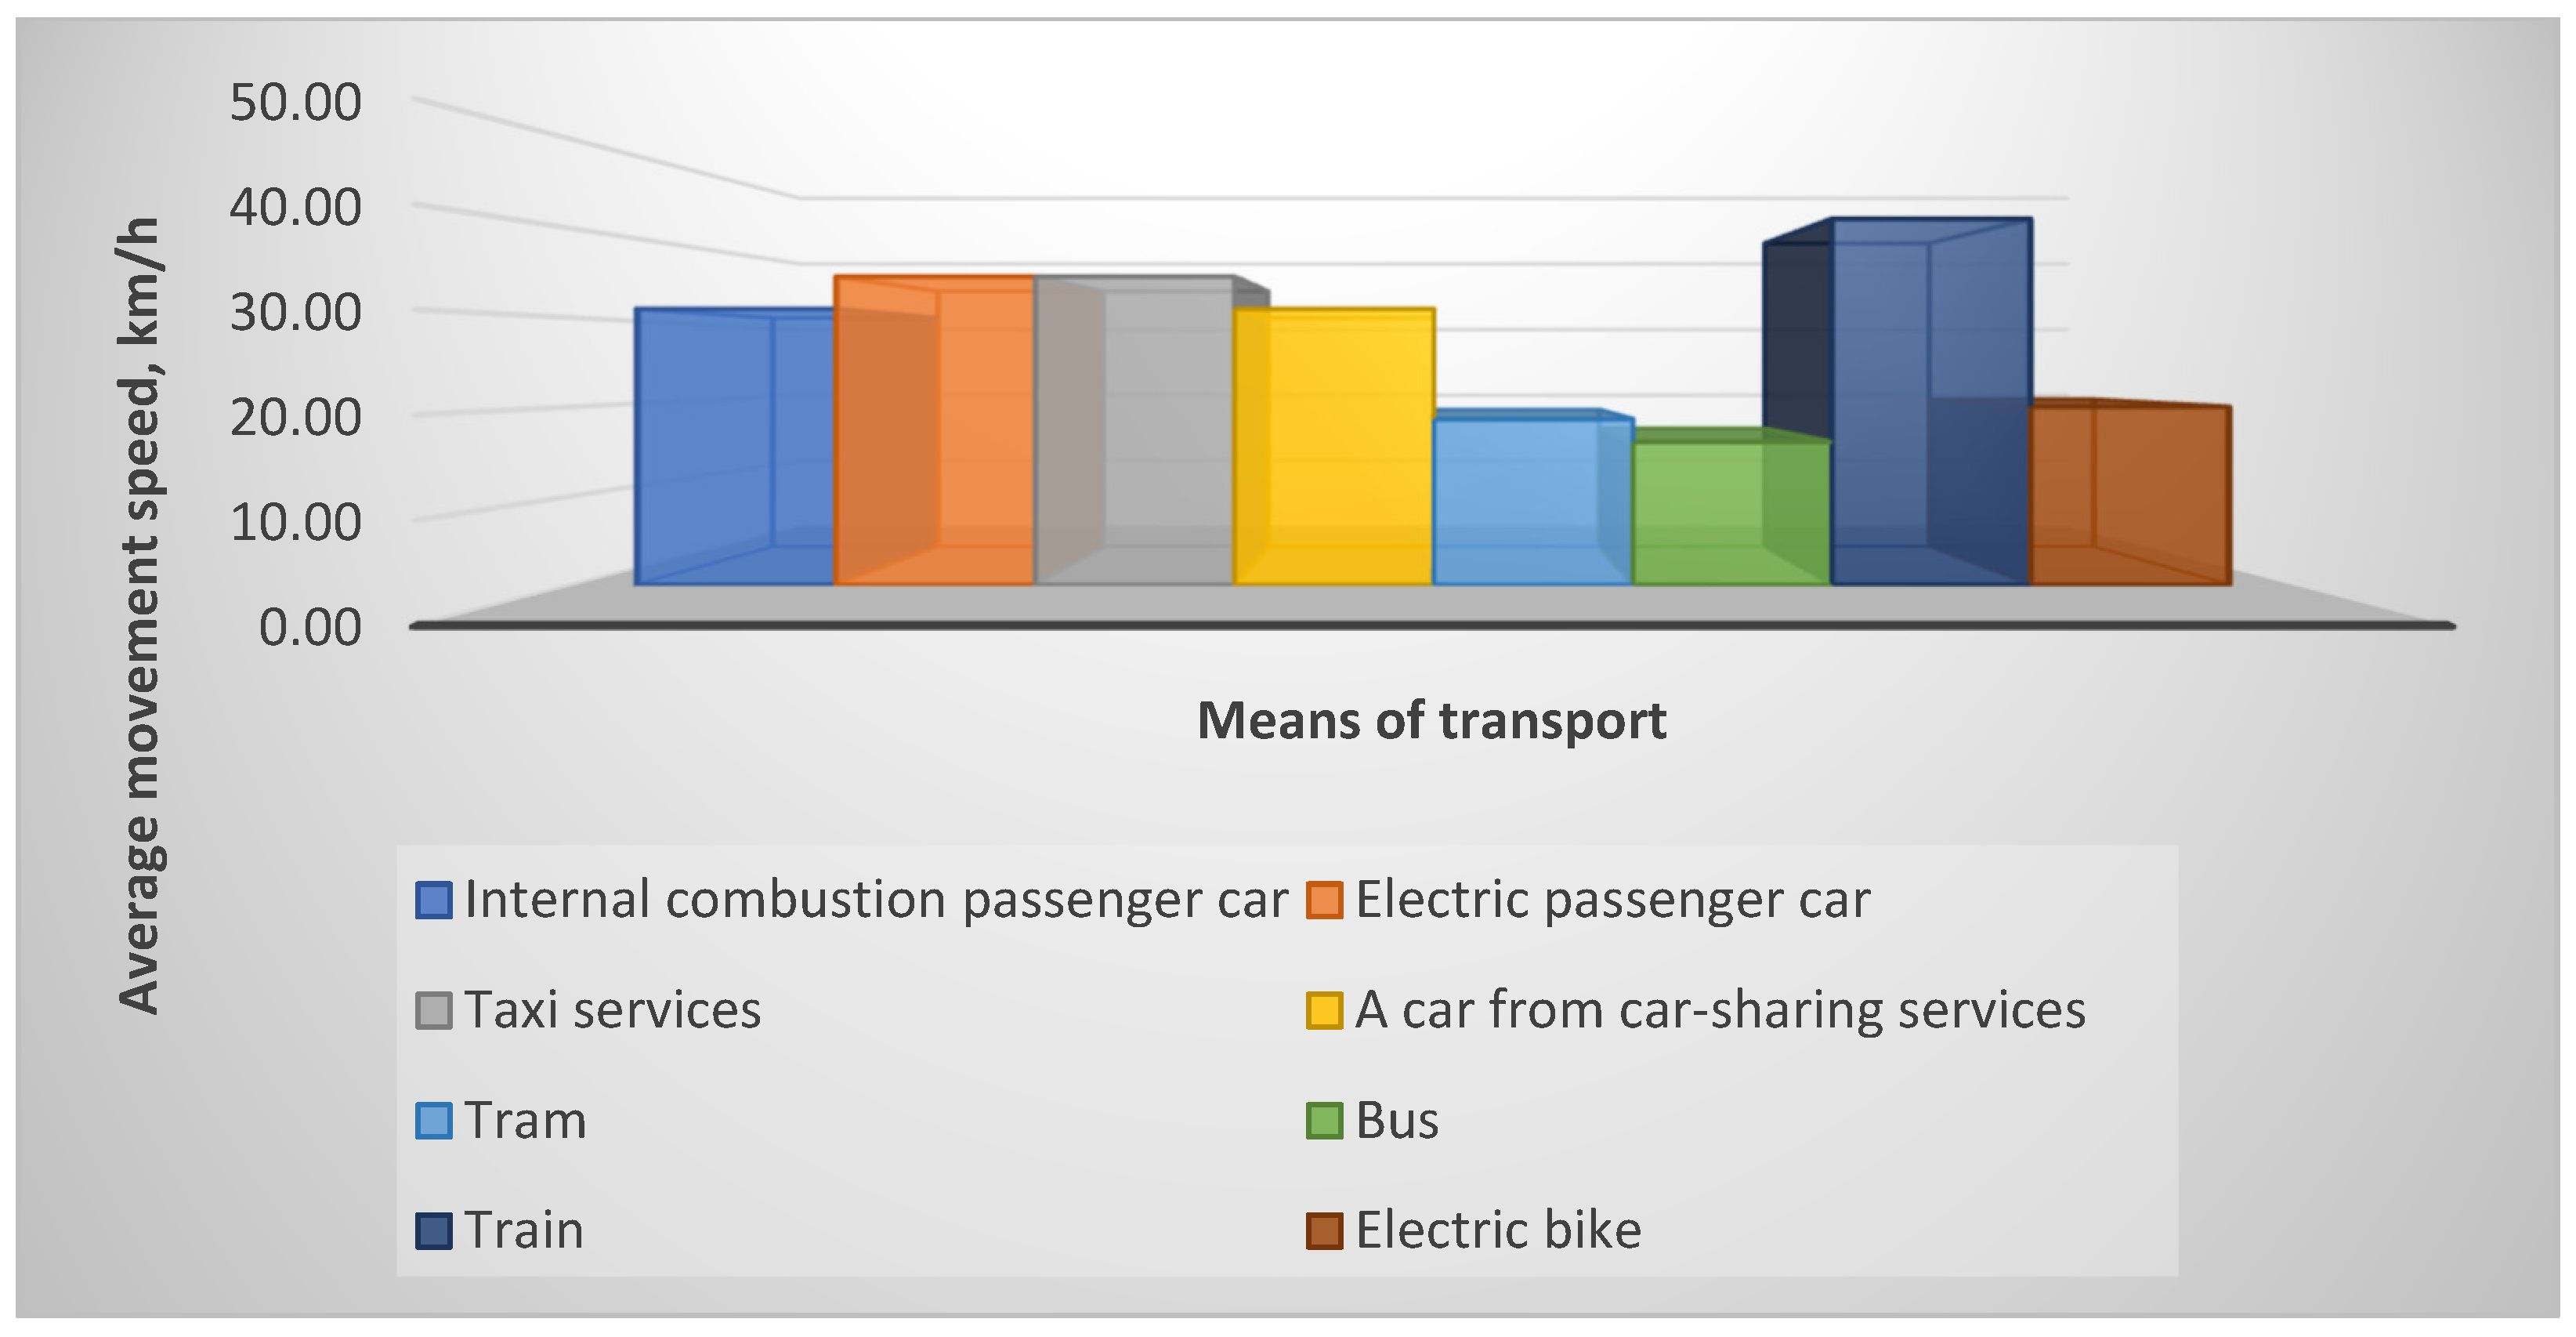
| Means of Transport | Average Movement Speed, km/h |
|---|---|
| Internal combustion passenger car | 31 |
| Electric passenger car | 34.60 |
| Taxi services | 34.60 |
| A car from a car-sharing service | 31/34.6 |
| Tram | 18.61 |
| Bus | 16.06 |
| Train | 41.09 |
| Electric bike | 20 |
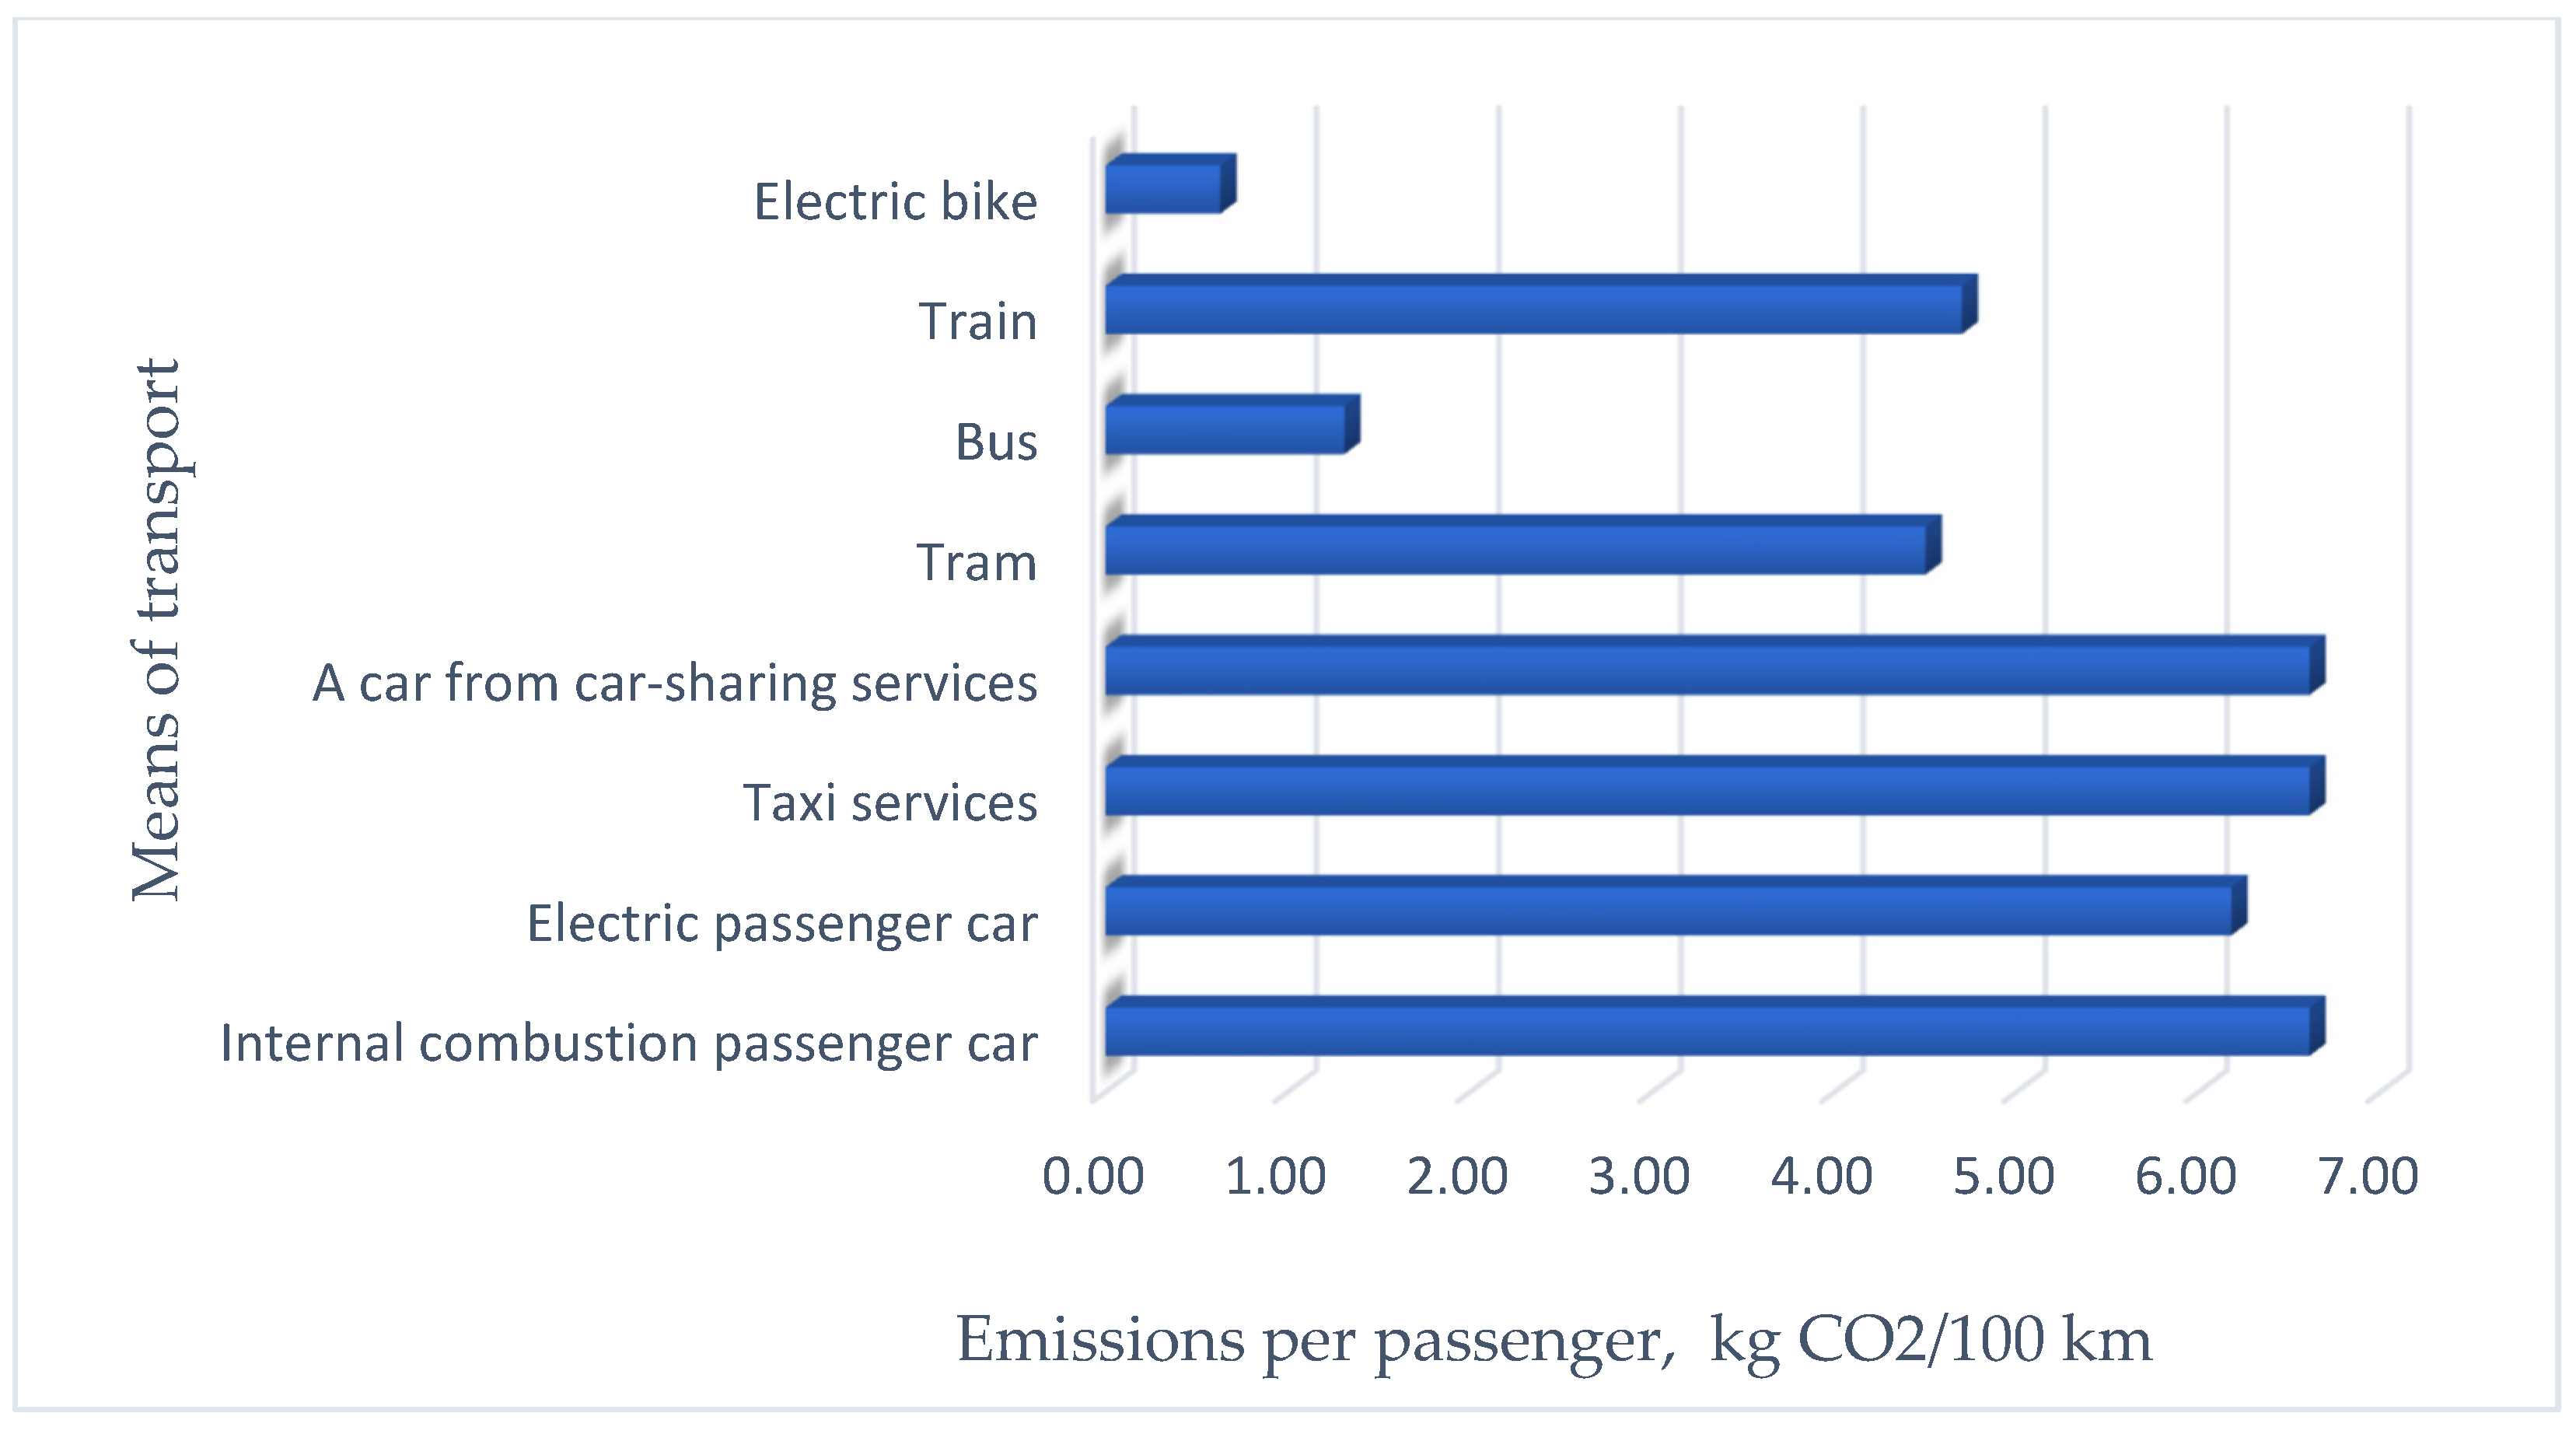
| Means of Transport | Emissions per Passenger, kg CO2/100 km |
|---|---|
| Internal combustion passenger car | 6.61 |
| Electric passenger car | 6.18 |
| Taxi services | 6.61/6.18 |
| A car from a car-sharing service | 6.61/6.18 |
| Tram | 4.50 |
| Bus | 1.31 |
| Train | 4.70 |
| Electric bike | 0.63 |
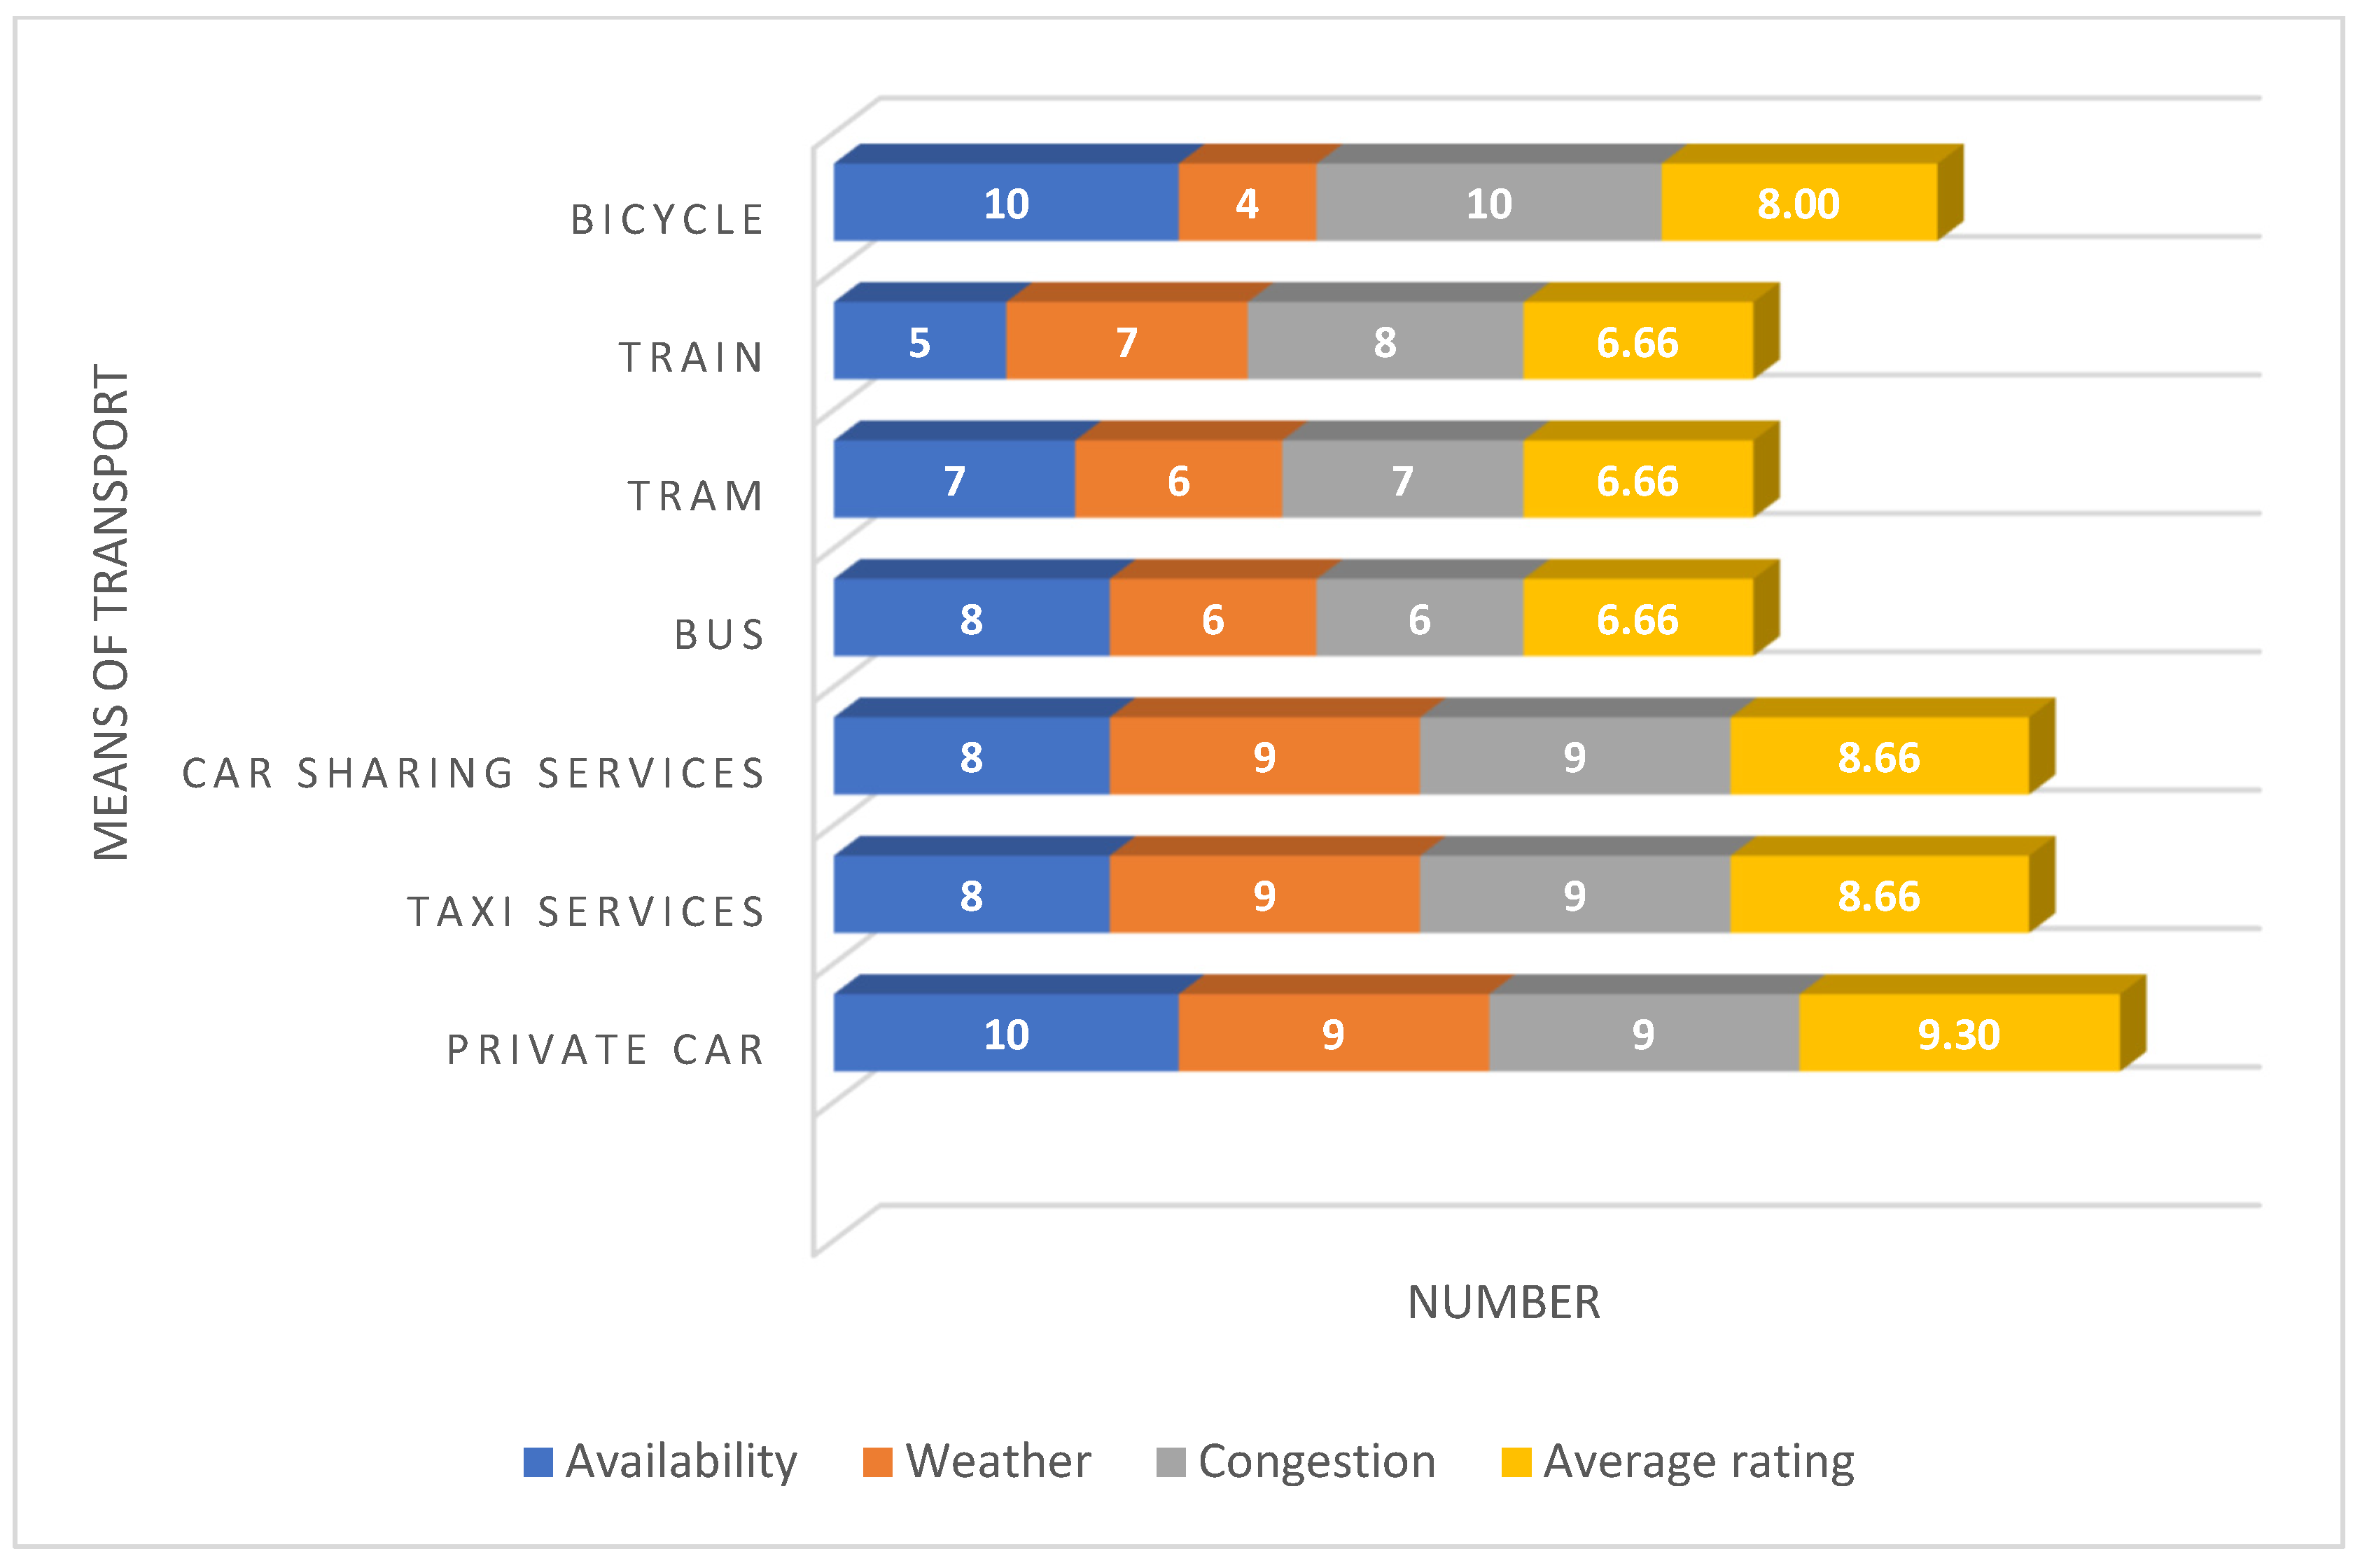
| Means of Transport | Availability | Weather | Congestion | Average Rating |
|---|---|---|---|---|
| Private car | 10 | 9 | 9 | 9.30 |
| Taxi services | 8 | 9 | 9 | 8.66 |
| Car-sharing services | 8 | 9 | 9 | 8.66 |
| Bus | 8 | 6 | 6 | 6.66 |
| Tram | 7 | 6 | 7 | 6.66 |
| Train | 5 | 7 | 8 | 6.66 |
| Bicycle | 10 | 4 | 10 | 8 |
| Type of Transport | Trip Division, % | Speed, km/h | Cost, EURO | Emission, kg CO2/Person | Comfort | Energy Consumption, MJ/km |
|---|---|---|---|---|---|---|
| train–car sharing–car | 50–25–25 | 36.05 | 1446 | 5.80 | 7.80 | 1.530 |
| electric car–train–car sharing | 50–25–25 | 35.32 | 1261 | 5.99 | 8.48 | 0.772 |
| electric car–train–taxi | 50–25–25 | 36.22 | 1520 | 5.99 | 8.48 | 0.772 |
| train–car sharing–electric car | 50–25–25 | 36.90 | 1334 | 5.62 | 7.82 | 0.772 |
| train–electric car–taxi | 50–25–25 | 37.85 | 1593 | 5.62 | 7.82 | 0.921 |
| car–train | 50–50 | 36.05 | 567 | 5.80 | 7.98 | 1.530 |
| electric car–train | 50–50 | 37.85 | 345 | 5.44 | 7.98 | 0.312 |
| train–car sharing | 75–25 | 38.68 | 1407 | 5.25 | 7.16 | 1.232 |
| train–bicycle | 75–25 | 35.82 | 440 | 3.68 | 6.99 | 0.473 |
| train–tram | 75–25 | 35.47 | 428 | 4.65 | 6.66 | 0.588 |
| train–car | 75–25 | 38.57 | 529 | 5.25 | 7.32 | 1.070 |
| train–electric car | 75–25 | 39.47 | 417 | 5.07 | 7.32 | 0.461 |
| electric car–train | 75–25 | 36.22 | 271 | 5.81 | 8.64 | 0.258 |
| Type of Transport | Trip Division, % | Speed, km/h | Cost, EUR | Emission, kg CO2/Person | Comfort |
|---|---|---|---|---|---|
| bus–tram–electric car | 50–25–25 | 26.95 | 292 | 2.85 | 7.32 |
| bus–train | 50–50 | 28.57 | 365 | 2.48 | 6.66 |
| train–bicycle | 50–50 | 30.54 | 245 | 2.67 | 7.33 |
| bicycle–train | 72–25 | 25.28 | 123 | 1.65 | 7.65 |
| Type of Transport | Trip Division, % | Speed, km/h | Cost, EUR | Emission, kg CO2/Person | Comfort |
|---|---|---|---|---|---|
| bus–tram–electric car | 50–25–25 | 36.22 | 1520 | 5.99 | 8.48 |
| bus–train | 50–25–25 | 35.32 | 1261 | 5.99 | 8.48 |
| train–bicycle | 75–25 | 36.22 | 271 | 5.81 | 8.64 |
| Type of Transport | Trip Division, % | Speed, km/h | Cost, EUR | Emission, kg CO2/Person | Comfort |
|---|---|---|---|---|---|
| bus–tram–electric car | 50–25–25 | 26.95 | 292 | 2.85 | 7.32 |
| bus–tram–train | 50–25–25 | 22.95 | 303 | 2.42 | 6.66 |
| bus–tram–bicycle | 50–25–25 | 17.68 | 252 | 1.41 | 6.99 |
| bus–tram–electric car | 50–25–25 | 21.33 | 985 | 2.80 | 7.32 |
| bus–train–car | 50–25–25 | 26.95 | 230 | 2.84 | 7.32 |
| bus–train–bike | 50–25–25 | 23.30 | 315 | 1.46 | 6.99 |
| bus–bike–car sharing | 50–25–25 | 20.78 | 1231 | 2 | 7.49 |
| bus–bike–taxi | 50–25–25 | 21.68 | 1490 | 2 | 7.49 |
| bus–bike–car | 50–25–25 | 20.78 | 353 | 2 | 7.65 |
| bus–bicycle–electric car | 50–25–25 | 21.68 | 242 | 1.83 | 7.65 |
| bus–train | 50–50 | 28.57 | 365 | 2.48 | 6.66 |
| bus–tram | 50–50 | 17.33 | 240 | 2.37 | 6.66 |
| bus–bike | 50–50 | 18.03 | 515 | 0.44 | 7.33 |
| train–bicycle | 50–50 | 30.54 | 1053 | 2.67 | 7.33 |
| tram–bicycle | 50–50 | 19.30 | 120 | 2.56 | 7.33 |
| bicycle–train | 50–50 | 30.54 | 245 | 2.66 | 7.35 |
| bus–tram | 75–25 | 16.69 | 240 | 2.11 | 6.66 |
| bus–car sharing | 75–25 | 19.80 | 1219 | 2.71 | 7.16 |
| bus–train | 75–25 | 22.32 | 303 | 2.15 | 6.66 |
| bus–taxi | 75–25 | 20.70 | 1478 | 2.71 | 7.16 |
| bus–bike | 75–25 | 17.05 | 252 | 1.14 | 6.99 |
| bus–car | 75–25 | 19.80 | 341 | 2.71 | 7.32 |
| bus–electric car | 75–25 | 20.70 | 230 | 2.71 | 7.32 |
| train–bike | 75–25 | 25.28 | 123 | 1.65 | 7.65 |
| bicycle–car sharing | 75–25 | 22.75 | 1040 | 2.20 | 8.16 |
| bicycle–taxi | 75–25 | 23.65 | 1299 | 2.20 | 8.16 |
| bicycle–train | 75–25 | 25.27 | 123 | 1.65 | 7.66 |
| bike–bus | 75–25 | 19.01 | 60 | 0.80 | 7.66 |
| bicycle–tram | 75–25 | 19.65 | 60 | 1.60 | 7.66 |
| bicycle–car | 75–25 | 22.75 | 161 | 2.20 | 8.32 |
| Type of Transport | Trip Division, % | Speed, km/h | Cost, EUR | Emission, kg CO2/Person | Comfort |
|---|---|---|---|---|---|
| electric car–bus–car sharing | 50–25–25 | 29.06 | 1198 | 5.14 | 8.48 |
| electric car–bus–taxi | 50–25–25 | 29.96 | 1457 | 5.14 | 8.48 |
| electric car–tram–car sharing | 50–25–25 | 29.70 | 1198 | 5.94 | 8.48 |
| electric car–tram–taxi | 50–25–25 | 30.60 | 1457 | 5.94 | 8.48 |
| electric car–train–car sharing | 50–25–25 | 35.32 | 1261 | 5.99 | 8.48 |
| electric car–train–taxi | 50–25–25 | 36.22 | 1520 | 5.99 | 8.48 |
| electric car–bicycle –car sharing | 50–25–25 | 30 | 1212 | 4.97 | 8.81 |
| electric car–bicycle–taxi | 50–25–25 | 30.90 | 1470 | 4.97 | 8.81 |
| bicycle–car sharing–car | 50–25–25 | 25.50 | 1345 | 3.76 | 8.49 |
| bicycle–car sharing–electric car | 50–25–25 | 26.40 | 1280 | 3.58 | 8.49 |
| car–bus | 75–25 | 27.26 | 544 | 5.50 | 8.64 |
| car–train | 75–25 | 33.52 | 606 | 6.35 | 8.64 |
| car–tram | 75–25 | 27.90 | 544 | 6.30 | 8.64 |
| car–bike | 75–25 | 28.20 | 556 | 5.33 | 8.97 |
| electric car–train | 75–25 | 36.22 | 271 | 5.81 | 8.64 |
| Type of Transport | Trip Division, % | Speed, km/h | Cost, EUR | Emission, kg CO2/Person | Comfort |
|---|---|---|---|---|---|
| bicycle–car | 75–25 | 22.75 | 161 | 2.20 | 8.33 |
| bicycle–electric car | 75–25 | 23.65 | 50 | 2.02 | 8.33 |
| Type of Transport | Trip Division, % | Speed, km/h | Cost, EUR | Emission, kg CO2/Person | Comfort | Energy Consumption, MJ/km |
|---|---|---|---|---|---|---|
| train–bicycle | 75–25 | 35.82 | 440 | 3.68 | 6.99 | 0.472 |
| car–train | 50–50 | 36.05 | 567 | 5.80 | 7.98 | 1.530 |
| electric car–train | 50–50 | 37.85 | 345 | 5.44 | 7.98 | 0.312 |
| train–tram | 75–25 | 35.47 | 428 | 4.65 | 6.66 | 0.587 |
| train–car | 75–25 | 38.47 | 529 | 5.25 | 7.32 | 1.070 |
| train–electric car | 75–25 | 39.47 | 417 | 5.07 | 7.32 | 0.461 |
| bus–train | 50–50 | 28.57 | 365 | 2.48 | 6.66 | 0.830 |
| electric car–taxi–train | 50–25–25 | 36.22 | 1520 | 5.99 | 8.48 | 0.772 |
| car–train–car sharing | 50–25–25 | 35.32 | 1261 | 5.99 | 8.48 | 1.990 |
| bicycle–car | 75–25 | 22.75 | 161 | 2.20 | 8.33 | 0.705 |
| bicycle–electric car | 75–25 | 23.65 | 50 | 2.02 | 8.33 | 0.048 |
| bicycle–train | 75–25 | 25.27 | 123 | 1.65 | 7.66 | 0.197 |
| bike–bus | 75–25 | 19.01 | 60 | 0.80 | 7.66 | 0.307 |
| bicycle–tram | 75–25 | 19.65 | 60 | 1.60 | 7.66 | 0.175 |
| bus–bike | 50–50 | 18.03 | 120 | 0.44 | 7.33 | 0.555 |
| train–bicycle | 50–50 | 30.54 | 245 | 2.67 | 7.33 | 0.335 |
| tram–bicycle | 50–50 | 19.30 | 120 | 2.56 | 7.33 | 0.290 |
| car–bus | 75–25 | 27.26 | 544 | 5.50 | 8.64 | 2.242 |
| car–train | 75–25 | 33.52 | 606 | 6.35 | 8.64 | 2.132 |
| car–tram | 75–25 | 27.90 | 544 | 6.30 | 8.64 | 2.110 |
| car–bike | 75–25 | 28.20 | 556 | 5.33 | 8.97 | 1.995 |
| electric car–train | 75–25 | 36.22 | 271 | 5.81 | 8.64 | 0.163 |
| electric car–tram | 75–25 | 30.60 | 209 | 5.76 | 8.64 | 0.140 |
| electric car–bicycle | 75–25 | 30.95 | 221 | 4.79 | 8.97 | 0.025 |
Disclaimer/Publisher’s Note: The statements, opinions and data contained in all publications are solely those of the individual author(s) and contributor(s) and not of MDPI and/or the editor(s). MDPI and/or the editor(s) disclaim responsibility for any injury to people or property resulting from any ideas, methods, instructions or products referred to in the content. |
© 2025 by the authors. Licensee MDPI, Basel, Switzerland. This article is an open access article distributed under the terms and conditions of the Creative Commons Attribution (CC BY) license (https://creativecommons.org/licenses/by/4.0/).
Share and Cite
Augustyn, G.; Mikulik, J.; Lewicki, W.; Niekurzak, M. Assessment of the Energy Efficiency of Individual Means of Transport in the Process of Optimizing Transport Environments in Urban Areas in Line with the Smart City Idea. Energies 2025, 18, 4079. https://doi.org/10.3390/en18154079
Augustyn G, Mikulik J, Lewicki W, Niekurzak M. Assessment of the Energy Efficiency of Individual Means of Transport in the Process of Optimizing Transport Environments in Urban Areas in Line with the Smart City Idea. Energies. 2025; 18(15):4079. https://doi.org/10.3390/en18154079
Chicago/Turabian StyleAugustyn, Grzegorz, Jerzy Mikulik, Wojciech Lewicki, and Mariusz Niekurzak. 2025. "Assessment of the Energy Efficiency of Individual Means of Transport in the Process of Optimizing Transport Environments in Urban Areas in Line with the Smart City Idea" Energies 18, no. 15: 4079. https://doi.org/10.3390/en18154079
APA StyleAugustyn, G., Mikulik, J., Lewicki, W., & Niekurzak, M. (2025). Assessment of the Energy Efficiency of Individual Means of Transport in the Process of Optimizing Transport Environments in Urban Areas in Line with the Smart City Idea. Energies, 18(15), 4079. https://doi.org/10.3390/en18154079