Abstract
Cylinder-to-cylinder variation (CTCV) is a prevalent issue for natural gas (NG) premixed engines with port fuel injection (PFI), which significantly impacts the engine’s power performance, fuel economy, and reliability. Focusing on this issue, this study established a three-dimensional simulation platform based on a six-cylinder natural gas premixed engine. Quantitative analysis was conducted to discuss the differences in the main boundaries, combustion process, and engine power between cylinders. Additionally, influencing factors of CTCV were explored in terms of mixture uniformity and distribution uniformity. The results indicate that, for the NG premixed engine, many parameters vary significantly between cylinders even under the economical operating condition of 1200 rpm. For example, the difference rate in the peak cylinder pressure and peak phase between cylinder 3 and cylinder 2 can reach 23.5% and 24.3%, respectively. Through the design of simulation cases, it was found that improving the mixture uniformity had a more significant impact on CTCV than improving the distribution uniformity. For example, the relative standard deviation (RSD) of peak pressure decreased by 2.15% through mixture uniformity improvement, while it only decreased by 0.39% through distribution uniformity improvement. At a high speed of 1800 rpm, the influence of distribution uniformity on CTCV increased notably, but the influence of mixture uniformity still remained greater than that of distribution uniformity.
1. Introduction
Faced with the severe challenges of environmental issues and energy shortages, the internal combustion (IC) engine industry is in dire need of clean alternative fuels and research on efficient combustion technologies to achieve new breakthroughs [1,2,3,4]. This is of significant importance in mitigating environmental pollution and addressing the scarcity of petroleum resources [5]. In recent years, NG, with its advantages of low pollution, abundant reserves, and low prices, has emerged as the most competitive low-carbon fuel in the ICE market, especially for heavy-duty ICEs [6,7,8,9]. Currently, NG engines primarily adopt port fuel injection [10,11,12]. For this type of externally premixed NG engine, significant variations often exist among cylinders due to various factors [13,14,15]. Even if the control parameters of the engine are consistent, CTCV causes not all cylinders to operate in the unified optimal state, leading to inconsistent combustion and power output among cylinders. CTCV increases the risks of misfire and knocking, and it severely impacts the engine’s emissions, fuel economy, and reliability [16,17,18].
The adoption of PFI causes NG to mix with air and exhaust gas within the intake manifold. The mixture uniformity of NG or exhaust gas with air, along with the structural symmetry of the intake and exhaust manifolds, significantly influences the mass, composition, velocity, and turbulent flow state of the working fluid entering each cylinder [19,20,21,22]. Furthermore, the exchange process of the engine is dynamic and intermittent, and pressure fluctuations and interactions between the intake and exhaust ports can also lead to differences in intake charge and in-cylinder flow state among cylinders, resulting in CTCV [23,24,25]. All in all, the differences in engine performance and boundary parameters are primarily due to the uneven mixture and the uneven distribution. The former is mainly influenced by the injection parameters and working fluid introduction devices, while the latter is mainly affected by the structure of the intake and exhaust manifolds, valve timing, and pressure fluctuations within manifolds [26,27,28].
To address the issue of CTCV in premixed multi-cylinder NG engines, scholars have conducted extensive research efforts. Alain Maiboom et al. [29] experimentally investigated the impact of different exhaust gas recirculation (EGR) distributions on engine emission performance, comparing and analyzing the effects with and without a mixer for air and EGR. The study revealed that in the absence of a mixer, nitrogen oxide (NOx) and particulate matter emissions from the engine significantly increased, primarily due to the differences in gas composition and intake temperature among cylinders. Pavlos Dimitriou et al. [30] employed three-dimensional simulations to analyze the influence of the intake manifold structure and EGR supply configuration on the uniformity among engine cylinders. They found that the EGR supply configuration plays a key role in the intake charge uniformity, which, in turn, affects the EGR cylinder-to-cylinder distribution and combustion stability. Reifart et al. [31] studied the flow of EGR and air within the intake manifold, and they discovered that adjusting the mixing length at the rear end of the intake duct and the timing of intake valve opening could effectively improve the mixing effect of EGR, thereby enhancing the uniformity of EGR within the cylinders. Samir Anant Dhatka et al. [32] conducted optimized design simulations of the intake manifold and EGR mixer, and they achieved a uniform distribution of EGR within the cylinders while meeting the design requirements for intake manifold pressure drop. Mateos Kass et al. [33] utilized an inline six-cylinder heavy-duty dual-fuel engine to analyze potential factors influencing fuel distribution uniformity and its correlation with the combustion process through experimental and simulation studies. They quantified the CTCV in indicated mean effective pressure (IMEP), peak pressure, and combustion phase. The results indicated that when the intake valve’s closure timing was changed from 570 °CA ATDC to 610 °CA ATDC, the uniformity of the IMEP and fuel distribution among cylinders deteriorated.
In summary, previous extensive research primarily focused on directly evaluating the effectiveness of specific measures—such as intake manifold structure optimization, EGR mixer design, and valve timing optimization—for improving the uniformity among cylinders of a multi-cylinder engine. Meanwhile, we found that applying variable systems (e.g., variable compression ratio, fuel injection timing) in engines also has a certain effect on reducing CTCV [34]. However, there is still a lack of quantitative description of CTCV phenomena and exploration of the primary causes of the observed variations among cylinders. This paper takes a six-cylinder, four-stroke, turbocharged, stoichiometric spark-ignition premixed heavy-duty NG engine as the research engine. Based on the established simulation platform for the multi-cylinder engine and the design of the calculation scheme, a quantitative analysis is conducted to evaluate variations in the combustion process, power output, and key boundary conditions among cylinders. Absolute deviation (AD) and relative standard deviation (RSD) are used as the indicators to evaluate the uniformity of a given parameter among different cylinders and different calculation schemes, respectively. Focusing on mixture uniformity and distribution uniformity, this study discusses the sensitive factors influencing CTCV. This research will have practical significance for further enhancing the performance of NG engines and improving product competitiveness.
2. Establishment of Simulation Platform and Design of Calculation Scheme
2.1. Establishment of Simulation Platform
The engine used in this study was a 13 L six-cylinder heavy-duty NG engine. The main technical parameters of the engine are listed in Table 1.

Table 1.
The main parameters of the test engine.
To analyze and optimize CTCV, this study established a six-cylinder engine computational fluid dynamics (CFD) simulation model with complete intake and exhaust manifolds using CONVERGE 4.0 software, a next-generation CFD simulation platform developed by Convergent Science. The 4.0 version employed in this study features automated mesh generation technology. This advanced capability enables real-time dynamic meshing during engine piston and valve movements, ensuring computational accuracy while significantly improving the workflow efficiency. Figure 1 presents the geometric model of the overall structure of the NG engine. For better presentation of microscopic field data, the cross-sectional plane positioned axially across the spark plug was employed. Figure 2 provides a schematic diagram illustrating the specific location of the cross-sectional plane.

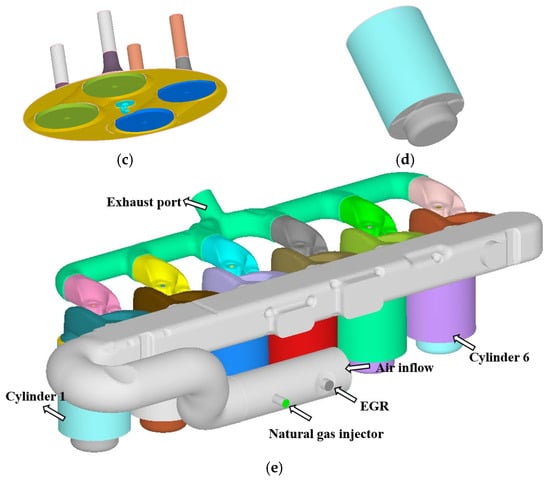
Figure 1.
Three-dimensional model of the natural gas engine: (a) Exhaust ports. (b) Intake ports. (c) Cylinder head, spark plug, and valves. (d) Piston and cylinder. (e) Overall structure of engine model.
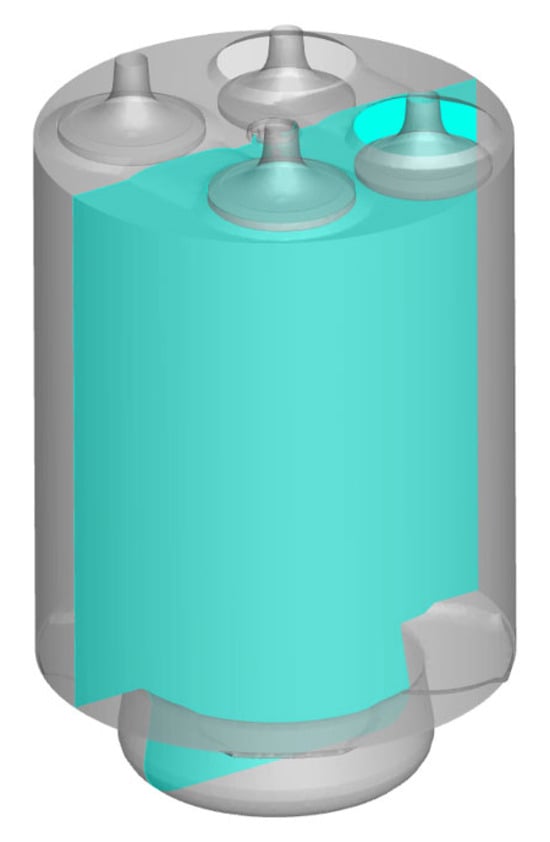
Figure 2.
Diagram of the cross-section position.
In this study, a mesh sensitivity analysis was conducted using three distinct grid resolutions (2 mm, 4 mm, and 6 mm) in the simulation model. The comparative results demonstrated negligible differences (<1.5%) in the simulated cylinder pressure curves across all mesh sizes. Through systematic evaluation of computational accuracy (within 2% error versus experimental validation data) and processing efficiency (40% faster than 2 mm mesh), the 4 mm grid resolution was selected as the optimal configuration. To balance computational accuracy and time, some special meshing schemes were adopted. The specific mesh encryption scheme is presented in Table 2. The Adaptive Mesh Refinement (AMR) technique was used to capture temperature variations on the flame propagation surface within the cylinders, and the crank angle range for Adaptive Mesh Refinement was −20 °CA ATDC to 60 °CA ATDC. Additionally, for the intake port region, the AMR technique was also used to capture velocity variations during the period of fuel and EGR injection. To ensure high precision during the ignition process, fixed embedding technology was applied to refine the spark plug ignition area according to the L-shaped ignition energy release pattern. The total mesh number of the model can be changed by adjusting the meshing schemes or the base mesh size, and it has been found that the computational results are independent of the total mesh number.
Table 2.
Mesh encryption schemes.
In the study, the RNG k-ε turbulence model was selected, because this model is less prone to divergence during computation, exhibits better convergence and stability, and provides more accurate simulations of in-cylinder combustion. For the combustion modeling, the G-Equation model coupled with the SAGE detailed chemical solver was used to simulate the flame front during combustion; this approach enables faster and more accurate calculation of in-cylinder combustion in engines. Additionally, the PISO algorithm was employed to implicitly solve for pressure and velocity.
In this study, the compression top dead center (TDC) of cylinder 1 was set as 0 °CA, and the TDC for each cylinder was sequentially set at intervals of 120 °CA following the firing order of 1-5-3-6-2-4. The crank angle range for each calculation cycle spanned from −1100 to 1780 °CA. To better investigate the non-uniformity among the cylinders, it was necessary to obtain the complete exchange process for each cylinder. Initially, the intake manifold was filled with a homogeneous mixture of pre-set gas components. Therefore, the calculation had to proceed until the gas entering each cylinder was entirely injected from the injection inlet, not the initially set mixture, and then the analysis could be conducted. At the beginning of the study, it had been verified that the mass of working fluid in each cylinder could reach a steady state until the third cycle, so the calculation period in this study was three cycles.
2.2. Model Validation
The engine test data used in this study were provided to facilitate the selection of operating conditions, the setting of computational boundaries and initial conditions, and the calibration of the simulation model. The detailed information about the measuring equipment that collected the data used in this work can be found in Ref. [35]. In this study, the economical operating condition at the speed of 1200 rpm with the full load was selected as the primary analysis condition, and the calculation results at 1200 rpm were primarily used to analyze CTCV and identify sensitivity factors related to CTCV. Moreover, the full load condition at the maximum speed of 1800 rpm was chosen as the auxiliary condition for further research, and the results at 1800 rpm were mainly compared with those at 1200 rpm to demonstrate the adaptability of the study’s conclusions.
Due to the inherent characteristics of premixed NG engines, from the experimental date, it can be seen that there are significant differences in combustion among the cylinders. Furthermore, due to theoretical assumptions in simulation and measurement errors in experimentation, it is impossible to ensure completely matching simulation data with experimental data across all six cylinders. Therefore, this study selected the average in-cylinder pressure of the six cylinders for simulation and experimental validation, as shown in Figure 3. It can be observed that, under the calculated operating conditions, the in-cylinder pressure data from the simulation model matched well with the experimental data, with peak pressure errors and peak phase errors within 5% for both operating conditions at 1200 rpm and 1800 rpm. The validation demonstrates the reliability of the simulation platform established in this study, which could provide support for subsequent simulation research.
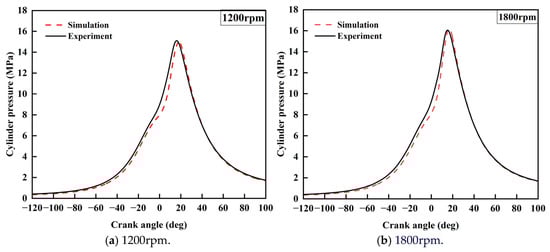
Figure 3.
Comparison of average in-cylinder pressure of simulations and experiments.
2.3. Calculation Schemes
The calculation schemes are listed in Table 3. Case 1 fully corresponds to the original engine, including a complete intake injection process as well as the mixing and distribution processes of the combustible mixture. This case can effectively simulate the uneven mixing and distribution of the combustible mixture, which are influenced by the injection system design, the injection parameters of the working medium, and the intake manifold structure [36]. Case 2 represents an improved engine model with a uniform mixture of working fluid, and it does not contain the mixing process. Therefore, by comparing the results of case 1 and case 2, the impact of mixture uniformity on CTCV can be revealed. Case 3 is also an improved engine model with a uniform mixture and lacking the intake manifold structure, which eliminates both the mixing and distribution processes of the working fluid. Hence, by comparing the results of case 3 and case 2, the influence of distribution uniformity on CTCV can be revealed. Through comparative analysis of the simulation results of cases 1, 2, and 3, the influence weights of mixture uniformity and distribution uniformity on CTCV can be clarified.
Table 3.
The computational schemes.
2.4. Evaluation Parameters for CTCV
To facilitate analysis of CTCV in the multi-cylinder engine, AD and RSD were used as evaluation parameters.
2.4.1. Absolute Deviation
AD is an indicator for evaluating the uniformity of a certain parameter among different cylinders. A smaller AD of a certain parameter of a cylinder indicates that the parameter is closer to the average values of the entire engine. When the AD of all cylinders is closer, it means that the variability among cylinders decreases. The AD of parameter of cylinder can be calculated using the formula shown in Equation (1) [23]:
where represents the AD of the evaluated parameter, represents the value of the analyzed parameter of cylinder , and represents the average value of the analyzed parameter for all cylinders.
2.4.2. Relative Standard Deviation
RSD is an indicator used to compare the uniformity of a certain parameter among all cylinders for different simulation cases. A smaller RSD indicates a higher degree of overall uniformity across the cylinders. It is defined as the ratio of the standard deviation (STD) to the average value of a parameter for cylinders within one working cycle. The calculation formulae are shown in Equations (2) and (3) [36] below:
where σ represents the RSD of the evaluated parameter, denotes the STD of the evaluated parameter, and n is the number of cylinders.
3. Results and Discussion
3.1. Quantitative Analysis of CTCV Phenomena
Figure 4 compares the in-cylinder pressure curves of the six cylinders. Figure 5 compares the peak pressures and the peak phases of the six cylinders. As shown in the figures, before the ignition timing of 20 °CA BTDC, the pressure values of each cylinder have minor differences during the intake and compression strokes. However, during the combustion process from 20 °CA BTDC to 40 °CA ATDC, the cylinder pressures differ significantly. Cylinder 3 has the highest peak cylinder pressure of 16.3 MPa and the earliest peak phase of 16.5 °CA ATDC, while cylinder 2 shows a significant decrease in peak cylinder pressure to 13.2 MPa, and a delayed combustion, with the peak phase of 21.8 °CA ATDC. The difference rate in peak pressure between cylinder 3 and cylinder 2 is as high as 23.5%, and the difference rate in peak phase is as high as 24.3%.
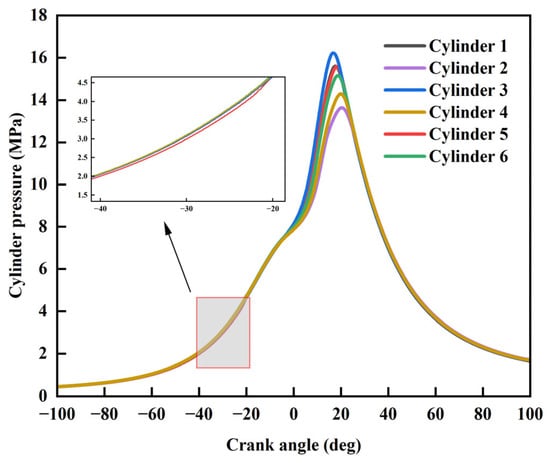
Figure 4.
Comparison of in-cylinder pressure curves among 6 cylinders.
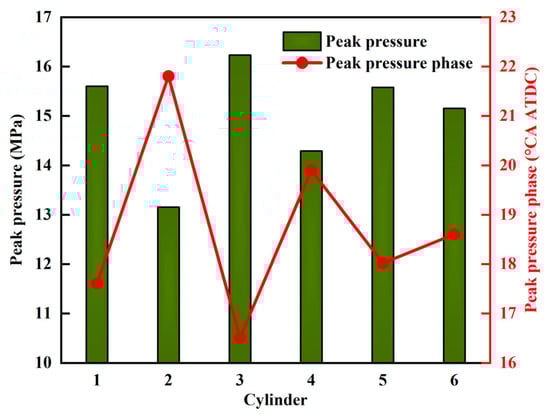
Figure 5.
Comparison of peak pressure and peak pressure phase among 6 cylinders.
Figure 6 and Figure 7 compare the ignition delay time (IDT), combustion duration (CD), and indicated mean effective pressure (IMEP) among cylinders. IDT refers to the crank angle interval from the ignition timing to CA10; CA10 denotes the crank angle at which 10% of the cumulative heat release has been achieved. CD represents the crank angle interval from CA10 to CA90; CA90 indicates the crank angle at which 90% of the cumulative heat release has been reached. It can be observed that cylinder 3 had the shortest IDT and CD, indicating the fastest combustion speed and the best power performance, and the IMEP of cylinder 3 was up to 26.62 bar. In contrast, cylinder 2 had the longest IDT and CD, indicating the slowest combustion speed and the worst power performance, and the IMEP of cylinder 2 was 25.54 bar. The difference rate of IMEP between cylinder 3 and 2 was 4.23%. The variation trends of the combustion phase and IMEP between different cylinders are in correspondence with the cylinder pressure variation trends.
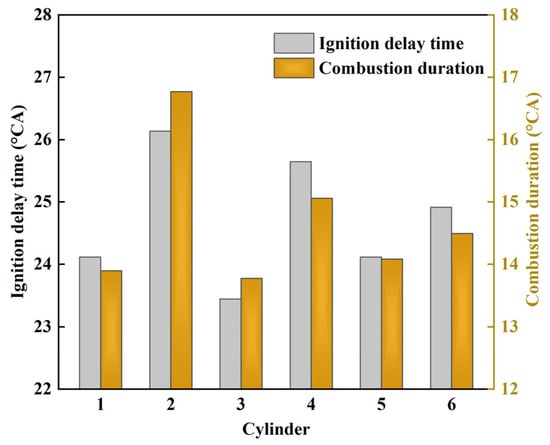
Figure 6.
Comparison of combustion phases among 6 cylinders.
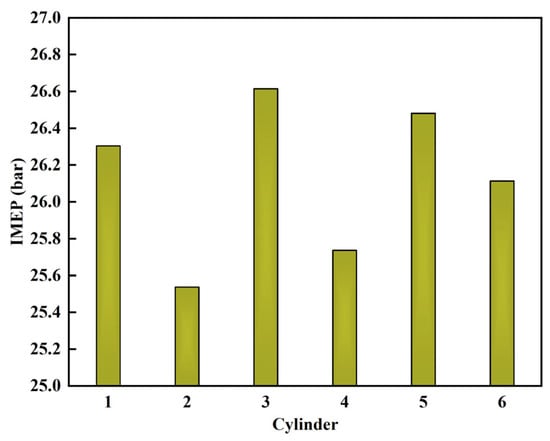
Figure 7.
Comparison of IMEP among 6 cylinders.
The above section presents the primary analysis of the power performance and combustion process among the six cylinders, which could obviously reveal the existence of CTCV. The following section will further quantify the main boundary conditions among the cylinders to better understand the details of these variations within the power performance and combustion process. Figure 8 compares the intake charge mass per cycle and the proportion of the intake composition among the six cylinders. It can be observed that the greatest difference in intake charge mass is between cylinder 1 and cylinder 6, which are located on opposite sides of the intake manifold. The intake charge of cylinder 1 is 5.56 g per cycle, while that of cylinder 6 is 5.63 g per cycle; the difference rate is about 1.3% relative to cylinder 1. The reason why cylinder 6 has a higher intake charge compared to the other cylinders is that cylinder 6 is the farthest from the inlet and, thus, is most affected by the pressure fluctuations within the intake port. The intake charge entering the cylinders is composed of air, natural gas, and exhaust gas. For these three components, the unevenness of air among the cylinders is primarily due to uneven distribution, while the unevenness of NG and exhaust gas (injected at a single point in the intake manifold) among the cylinders is the combined effect of uneven mixing and uneven distribution. The maximum and minimum proportions of air were 82.95% for cylinder 3 and 81.79% for cylinder 6, respectively, with a maximum difference rate of 1.4% relative to cylinder 6. The maximum and minimum proportions of NG were 5.08% for cylinder 1 and 4.82% for cylinder 3, respectively, with a maximum difference rate of 5.4% relative to cylinder 3. The maximum and minimum proportions of exhaust gas were 12.23% for cylinder 3 and 13.36% for cylinder 6, respectively, with a maximum difference rate of 9.2% relative to cylinder 3. Although the NG and exhaust gas had relatively small proportions of the intake charge, the degree of variation between the cylinders is relatively large.
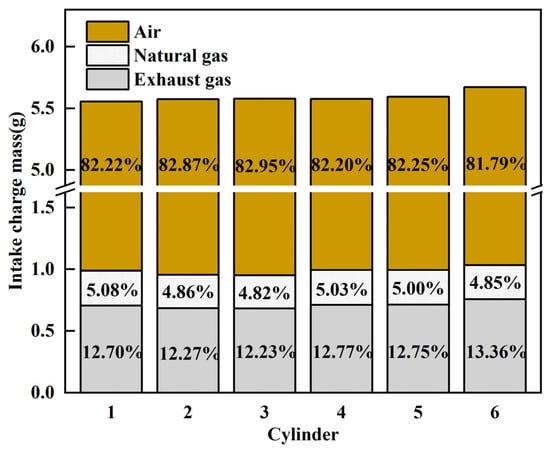
Figure 8.
Comparison of intake charge mass among 6 cylinders.
Figure 9 compares the concentration of fuel–air mixture within the six cylinders. As shown in the figure, due to the variability in the mass of air, fuel, and exhaust gas entering each cylinder, the equivalence ratios among the cylinders also exhibit variations. Cylinder 1 has the highest equivalence ratio, with the richest mixture, while cylinder 3 has the lowest equivalence ratio, with the leanest mixture. The mixture in cylinder 2 is slightly richer compared to that in cylinder 3. Figure 10 presents contour plots of the equivalence ratio for each cylinder. As shown in the figure, the CTCV of mixture concentration distribution was obvious. For cylinder 1, which is located closer to the inlet, the fuel–air mixture entering the cylinder is not well mixed yet due to the short distance for mixing, while for cylinder 6, the longer distance makes the mixing better. In addition to the influence of mixing uniformity, the structure of the intake manifold itself can also cause a certain degree of uneven distribution of NG. From cylinder 1 to cylinder 6, the stratified distribution degree of mixture concentration gradually decreased from high to low. A high stratified distribution degree of mixture concentration means a wide mixture concentration gradient in the cylinder. Moreover, for the first four cylinders, the concentration shows a remarkable distribution of rich at the top and lean at the bottom. As shown in Figure 1e, cylinder 1, being closer to the intake manifold, exhibits a shorter fuel–air mixing time and, consequently, more distinct concentration gradients. In comparison, cylinders 5 and 6, located farther from the intake manifold, benefit from a prolonged mixing duration, resulting in a more homogeneous in-cylinder mixture concentration.
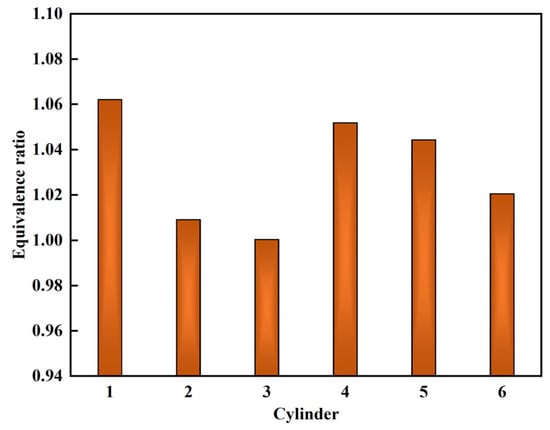
Figure 9.
Comparison of equivalence ratio among 6 cylinders.
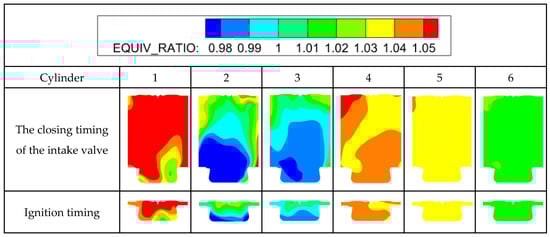
Figure 10.
Equivalence ratio distribution of intake stroke end timing and ignition timing.
In this paper, the EGR is calculated through the following formula [37]:
where represents the EGR rate, is the mass of fresh air, and is the mass of exhaust gas. Figure 11 compares the EGR rate among the six cylinders. It is evident that there is a significant unevenness in the EGR rate among the cylinders. Specifically, cylinder 3 exhibits the lowest EGR rate of 12.23%, while cylinder 6 shows the highest, at 13.36%. The difference rate of EGR rate between cylinder 3 and cylinder 6 is up to 9.23% relative to cylinder 3.
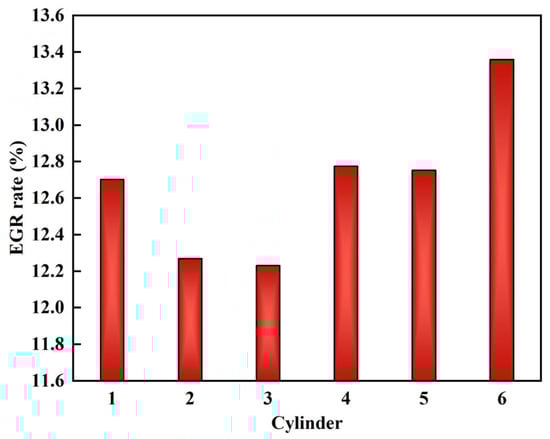
Figure 11.
Comparison of EGR rates among 6 cylinders.
Figure 12 and Figure 13 present a comparison of the turbulent kinetic energy (TKE) curves and TKE distribution among the six cylinders, respectively. It is evident from the figures that significant differences in TKE existed during the whole cycle. Cylinders 1, 3, and 5 had higher TKE than cylinders 2, 4, and 6 near the ignition timing and the top dead center. Moreover, at the ignition timing, cylinder 3 exhibited the highest TKE, with a large high-TKE region around the spark plug, while cylinder 2 had the lowest TKE, with a small high-TKE region. During the combustion process, due to the mutual interaction between flow and combustion, the differences in flow intensity during combustion became larger compared to those during the cold flow. These differences are related not only to the inherent variations in flow states prior to ignition but also to the difference in the combustion process.
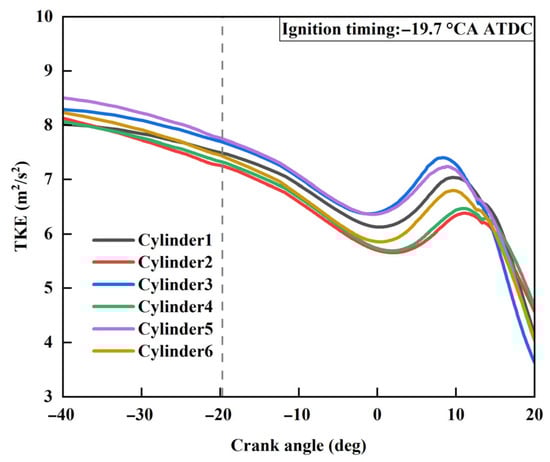
Figure 12.
TKE curves for 6 cylinders.
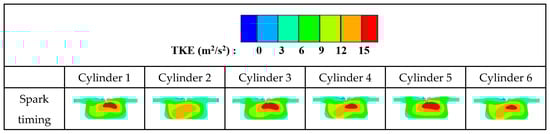
Figure 13.
TKE distribution at ignition timing.
As shown in Figure 4, Figure 5, Figure 6 and Figure 7, cylinders 3 and 2 have the most obvious differences in combustion process and power performance. By comprehensively comparing the differences in many boundary parameters between cylinder 3 and cylinder 2, it can be found that the factors contributing to the significant variation between the two cylinders are not single. Cylinder 3 exhibited higher initial TKE, a slightly richer mixture concentration near stoichiometric combustion mode, and lower EGR, providing better combustion conditions and, thus, achieving the best combustion process and power performance. Conversely, cylinder 2 had a lower initial TKE, a relatively leaner combustible mixture, and a lower intake charge mass, resulting in the worst combustion process and power performance.
3.2. Sensitivity Analysis of the Influencing Factors of CTCV
Figure 14 compares the intake charge mass per cycle and the AD of intake charge mass among the six cylinders under three cases. When case 2 is compared to case 1, case 2 uses the premixed air–NG–exhaust gas mixture; except for cylinder 3, the AD of the intake charge mass of all of the other cylinders is decreased, and cylinder 6 still has significantly higher intake charge mass and AD of intake charge mass. When case 3 is compared to case 2, in addition to improving the mixture uniformity, case 3 also achieves distribution uniformity among cylinders. In case 3, the intake charge is directly injected into each cylinder through its respective intake port without uneven mixing or uneven distribution caused by the structure of the intake manifold. This results in reduced intake resistance, leading to an increase in the uniformity of intake charge among cylinders with lower AD of the six cylinders. In addition, the total intake charge mass of the engine is also increased.
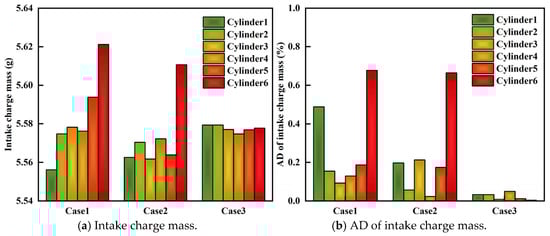
Figure 14.
Comparison of intake charge mass and AD of intake charge mass among cylinders.
Figure 8 and Figure 15 compare the intake composition of the six cylinders under three cases. When the intake compositions of case 1 and case 2 are compared, it is clear that improved mixture uniformity results in a more uniform intake composition among cylinders. When case 3 is compared to case 2, it is evident that the uniformity of the intake composition in case 3 is further enhanced compared to case 2.
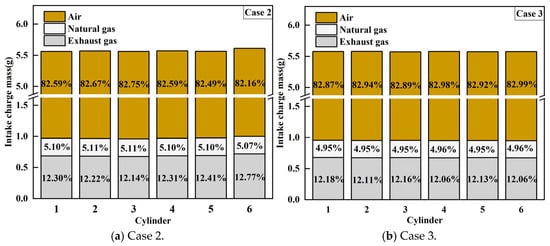
Figure 15.
Comparison of intake composition among cylinders under case 2 and case 3.
Figure 16 compares the equivalence ratio distribution of each cylinder at the ignition timing. Compared with case 2 and 3, case 1 exhibits poorer mixing of the combustible mixture, with a wider mixture concentration gradient due to the single-point introduction of NG into the intake manifold. At the ignition timing, the distribution of NG and air concentrations in each cylinder of case 1 is significantly uneven.
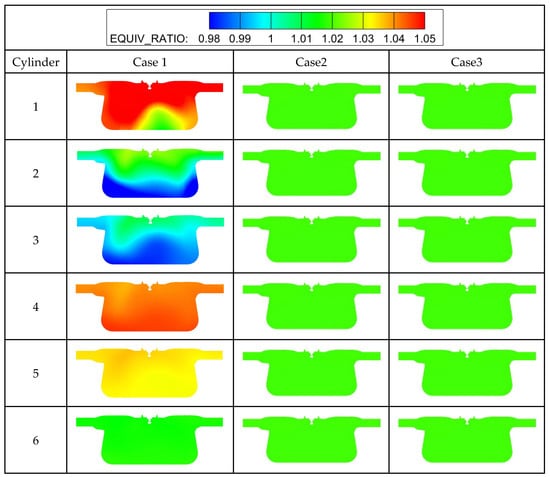
Figure 16.
Equivalence ratio distribution of 6 cylinders at ignition timing under three cases.
Figure 17 compares the EGR rate and AD of the EGR rate among the six cylinders under three cases. Due to the single-point introduction of EGR into the intake manifold, case 1 results in significant variations in the EGR rate among cylinders, with the maximum AD above 5% for cylinder 6. For case 2, because of the uniform introduction of premixed exhaust gas, the AD of all six cylinders is decreased, and the AD of cylinder 6 drops sharply to 1.5%. However, due to differences in intake manifold structures and the instability of airflow in the intake and exhaust manifold, there are still variations in the EGR introduction capacity among cylinders, and the maximum achievable EGR rate is decreased. Based on case 2, case 3 further enhances the distribution uniformity of the intake charge. This results in a significant improvement in the uniformity of EGR rates among cylinders. It is also noteworthy that, as the uniformity of EGR among cylinders improves, the ability to introduce EGR is decreased.
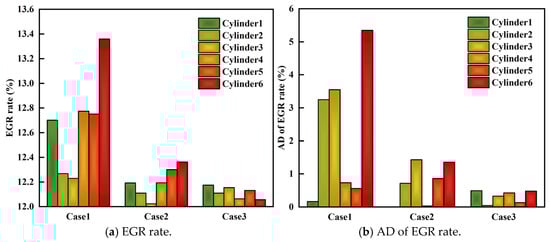
Figure 17.
Comparison of EGR rate and AD of EGR rate among cylinders.
Figure 18 compares the turbulent kinetic energy contours of each cylinder at ignition timing under three cases. It can be observed that the uniformity of the initial turbulent kinetic energy among cylinders in case 3 is significantly better than that in case 1 and case 2. Furthermore, for all three cases, the TKE distribution of cylinders 1, 3, and 5 is similar while that of cylinders 2, 4, and 6 is also similar, and the similarity in TKE distribution is not strongly correlated with the uniformity of mixing or distribution.
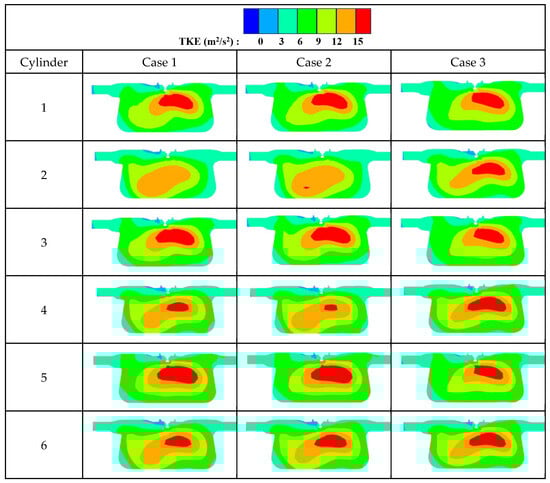
Figure 18.
TKE of 6 cylinders at ignition timing under three cases.
Figure 19 compares the peak pressure and AD of peak pressure among the six cylinders under three cases. It is evident that with the improvement in mixture uniformity and distribution uniformity, the peak cylinder pressure of each cylinder increases. Of course, this may also be related to the reduction in EGR rates observed in case 2 and case 3. Meanwhile, it can be observed that cylinders 1, 3, and 5 exhibit higher peak pressures than those of cylinders 2, 4 and 6 under all three cases. As the mixture uniformity and distribution uniformity improve, the AD of the peak pressure decreases gradually, meaning that the peak cylinder pressure of each cylinder is closer to the average.
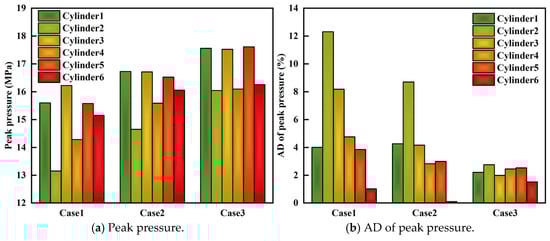
Figure 19.
Comparison of peak pressure and AD of peak pressure.
Figure 20 compares the ignition delay time and combustion duration under three cases. It is apparent that compared to case 1, the improvement in mixture uniformity of case 2 results in significant shortening of both the IDT and CD for each cylinder. Based on case 2, further enhancement in the distribution uniformity of case 3 leads to further shortened IDT and CD for each cylinder. However, the relative relationships of the combustion phases among all six cylinders remain unchanged for all three cases.
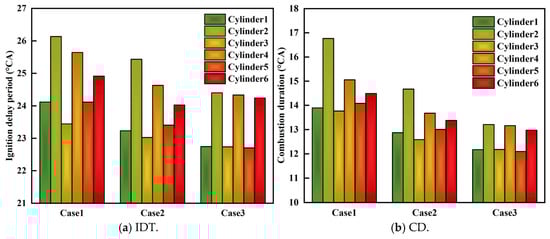
Figure 20.
Comparison of ignition delay time and combustion duration.
Figure 21 compares the IMEP and AD of IMEP under three cases. It is observable that compared to case 1, the improvement in mixture uniformity in case 2 significantly increases the IMEP of each cylinder. Based on case 2, continued improvement in distribution uniformity results in a continued increase in the IMEP of each cylinder, and the variability among cylinders gradually improves. The AD of IMEP of all six cylinders decreases as uniformity improvement measures are applied.
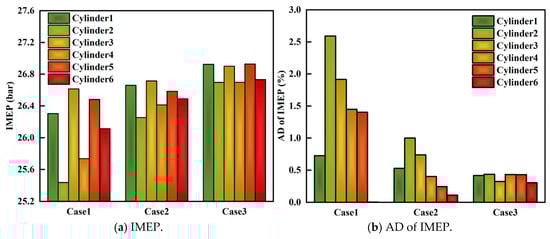
Figure 21.
Comparison of IMEP and AD of IMEP.
The RSD of peak pressure, IDT, CA, IMEP, intake charge, and equivalence ratio for each case was calculated. As shown in Figure 22, when comparing case 1 with case 2, the RSD of various parameters is decreased for case 2, with the condition of uniform mixing of fuel, air, and exhaust gas. For example, the RSD of peak pressure is decreased by 2.15%, and the RSD of combustion duration is decreased by 2.06%. When comparing case 3 with case 2, the RSD of the parameters for case 3, with the condition of uniform mixing and uniform distribution, shows a continued decreasing trend. The RSD of peak cylinder pressure is decreased by 0.39%, and the RSD of combustion duration is decreased by 1.35%. However, relatively speaking, the decrease in RSD from case 2 to case 3 is less pronounced compared to that from case 1 to case 2. This indicates that, compared to the impact of mixing uniformity, the distribution uniformity has a relatively smaller weight in affecting the CTCV. Therefore, subsequent research aimed at improving CTCV could focus on enhancing the mixing uniformity of the combustible mixture.
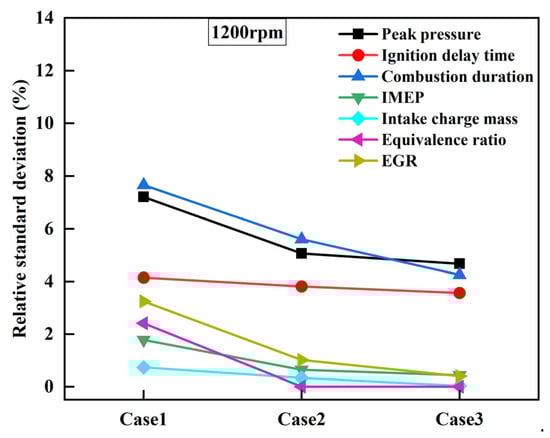
Figure 22.
Comparison of RSD under three cases at 1200 rpm.
3.3. Comparative Analysis of CTCV at Two Engine Speeds
To verify the reliability of the aforementioned analytical conclusions, an analysis of the non-uniformity phenomenon and its primary influencing factors was conducted under full-load conditions at high speed (1800 rpm). Figure 23 compares the RSD of the main analyzed parameters that affect engine non-uniformity at two test speeds. Compared to the condition of 1200 rpm, the RSD of various parameters under the condition of 1800 rpm increased significantly, which indicates an increase in the non-uniformity among cylinders. For the high-speed condition, due to the increased demand for fuel and air, the boundary parameters of the equivalence ratio and intake charge become more obvious, which would amplify the CTCV in engine power and combustion process.
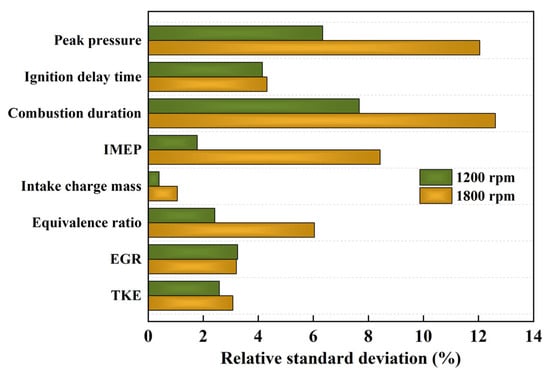
Figure 23.
Comparison of RSD at two test speeds under case 1.
Further investigation on the influencing factors of CTCV under the high-speed operating condition was conducted using the aforementioned calculation schemes, as shown in Table. 3. As shown in Figure 24, the RSD of all analytical parameters decreases with the enhancement of mixture uniformity and distribution uniformity. From case 1 to case 2, the RSD of peak cylinder pressure decreased by 3.39%, and the RSD of CD decreased by 3.96%. From case 2 to case 3, the RSD of peak cylinder pressure decreased by 2.41%, and the RSD of CD decreased by 2.62%. Comparing the reductions in the RSD between case 1 and case 2, and between case 2 and case 3, it can be observed that the decrease from case 1 to case 2 is slightly more pronounced. This suggests that mixing uniformity is still the main influencing factor under high-speed operating conditions. Furthermore, comparing the reduction extent of RSD from case 2 to case 3, as shown in Figure 22 and Figure 24, it could be found that, for the high-speed operating condition, the effect of distribution uniformity on CTCV becomes greater than that for the low-speed operating condition.
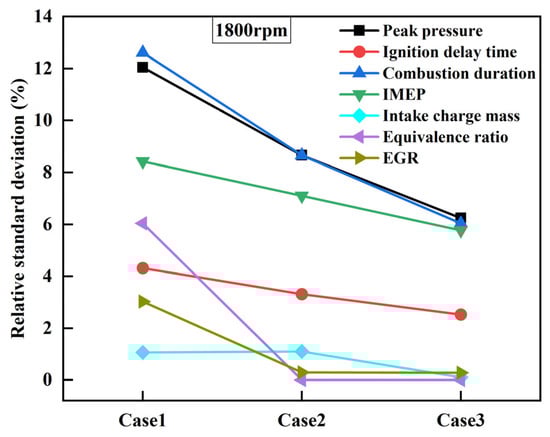
Figure 24.
Comparison of RSDs among three cases at 1800 rpm.
4. Conclusions and Outlook
Based on a premixed NG engine with stoichiometric combustion mode and spark ignition, this paper focuses on the effect factors influencing CTCV and their respective influence degree. The main findings of this study can be summarized as follows:
- (1)
- For the test engine, the quantitative analysis of CTCV among cylinders was conducted by comparing various parameters, such as cylinder pressure, combustion phase, IMEP, intake charge mass, intake composition, the equivalence ratios, and TKE. There are obvious differences in the combustion process and performance parameters, which can be attributed to the comprehensive effects of the differences in many main boundary parameters between cylinders. Take cylinder 3 as an example: cylinder 3 exhibits higher initial TKE, a slightly richer mixture concentration, lower EGR, and the concentration distribution of rich at the top and lean at the bottom, leading to better combustion, with the shortest IDT and CA, and achieving the best power performance, with the highest peak pressure and IMEP.
- (2)
- By improving the mixture uniformity or distribution uniformity, the AD of intake charge mass, EGR rate, peak pressure, IMEP for all six cylinders decreased; meanwhile, the intake composition, the distribution of the equivalence ratio, and the turbulent kinetic energy of all six cylinders became more uniform. Comparing the influencing weight of mixture uniformity and distribution uniformity on the CTCV phenomenon, it was found that the RSD of all analyzed parameters decreases more significantly from case 1 to case 2 than from case 2 to case 3, which means that improving the mixture uniformity has a greater impact compared to improving the distribution uniformity. Take peak pressure as an example: the RSD of peak pressure is decreased by 2.15% by improving the mixture uniformity in case 2, while the RSD of peak pressure is decreased by 0.39% by improving the distribution uniformity in case 3.
- (3)
- The conclusions obtained at the 1800 rpm operating condition are in good agreement with those at the 1200 rpm operating condition. However, the high-speed condition shows an increase in the non-uniformity among cylinders. In addition, the improvement in distribution uniformity does enhance the mitigation of the CTCV phenomenon under the high-speed condition, but the influence of mixture uniformity remains the more significant factor affecting CTCV.
- (4)
- In this research, the mixture uniformity proved to be a more critical factor in improving the CTCV phenomenon. Subsequently, further studies on the influence of EGR mixture uniformity and NG mixture uniformity on CTCV will be compared.
Author Contributions
Date curation, D.J. and D.W.; Funding acquisition, D.J. and Q.C.; Formal analysis, Q.C.; Project administration, X.X.; Methodology, X.X.; Investigation, Z.W.; Project administration, Z.W.; Writing-original draft, D.W.; Writing—review & editing, H.W.; Software, H.W. All authors have read and agreed to the published version of the manuscript.
Funding
This research was supported by the Science Fund of State Key Laboratory of Engine and Powertrain System (skleps-sq-2023-141), and by the Jilin Science and Technology Development Plan project (20220508015RC).
Data Availability Statement
The original contributions presented in the study are included in the article, further inquiries can be directed to the corresponding authors.
Conflicts of Interest
Authors Demin Jia, Qi Cao, Xiaoying Xu, Zhenlin Wang were emplyed by Sinopec Zhongyuan Oilfield Company. The remaining authors declare that the research was conducted in the absence of any commercial or financial relationships that could be construed as a potential conflict of interest.
Abbreviations
The following abbreviations are used in this manuscript:
| AMR | Adaptive Mesh Refinement |
| AD | Absolute deviation |
| BSFC | Brake-specific fuel consumption |
| CFD | Computational fluid dynamics |
| CTCV | Cylinder-to-cylinder variation |
| CD | Combustion duration |
| EGR | Exhaust gas recirculation |
| IDT | Ignition delay time |
| IMEP | Indicated mean effective pressure |
| NG | Natural gas |
| NOx | Nitrogen oxide |
| PFI | Port fuel injection |
| RSD | Relative standard deviation |
| TKE | Turbulent kinetic energy |
| TDC | Top dead center |
| IC | Internal combustion |
References
- Gong, C.; Li, Z.; Yi, L.; Liu, F. Comparative study on combustion and emissions between methanol port-injection engine and methanol direct-injection engine with H2-enriched port-injection under lean-burn conditions. Energy Convers. Manag. 2019, 200, 112096. [Google Scholar] [CrossRef]
- Teoh, Y.H.; How, H.G.; Le, T.D.; Nguyen, H.T.; Loo, D.L.; Rashid, T.; Sher, F. A review on production and implementation of hydrogen as a green fuel in internal combustion engines. Fuel 2022, 333, 126525. [Google Scholar] [CrossRef]
- Tamilselvan, P.; Nallusamy, N.; Rajkumar, S. A comprehensive review on performance, combustion and emission characteristics of biodiesel fuelled diesel engines. Renew. Sustain. Energy Rev. 2017, 79, 1134–1159. [Google Scholar] [CrossRef]
- Chiong, M.-C.; Chong, C.T.; Ng, J.-H.; Mashruk, S.; Chong, W.W.F.; Samiran, N.A.; Mong, G.R.; Valera-Medina, A. Advancements of combustion technologies in the ammonia-fuelled engines. Energy Convers. Manag. 2021, 244, 114460. [Google Scholar] [CrossRef]
- Chai, W.S.; Bao, Y.; Jin, P.; Tang, G.; Zhou, L. A review on ammonia, ammonia-hydrogen and ammonia-methane fuels. Renew. Sustain. Energy Rev. 2021, 147, 111254. [Google Scholar] [CrossRef]
- Li, W.; Liu, Z.; Wang, Z. Experimental and theoretical analysis of the combustion process at low loads of a diesel natural gas dual-fuel engine. Energy 2016, 94, 728–741. [Google Scholar] [CrossRef]
- Wang, Z.; Su, X.; Wang, X.; Jia, D.; Wang, D.; Li, J. Impact of ignition energy on the combustion performance of an SI heavy-duty stoichiometric operation natural gas engine. Fuel 2022, 313, 122857. [Google Scholar] [CrossRef]
- Thiruvengadam, A.; Besch, M.; Padmanaban, V.; Pradhan, S.; Demirgok, B. Natural gas vehicles in heavy-duty transportation-A review. Energy Policy 2018, 122, 253–259. [Google Scholar] [CrossRef]
- Li, F.; Wang, Z.; Wang, Y.; Wang, B. High-Efficiency and Clean Combustion Natural Gas Engines for Vehicles. Automot. Innov. 2019, 2, 284–304. [Google Scholar] [CrossRef]
- Ding, S.-L.; Guo, B.; Liu, Z.-T.; Liu, J.-J.; Tunestål, P.; Song, E.-Z.; Cui, C. Analysis of the fractal characteristics for combustion instability in a premixed natural gas engine. Appl. Therm. Eng. 2023, 233, 121177. [Google Scholar] [CrossRef]
- You, J.; Liu, Z.; Wang, Z.; Wang, D.; Xu, Y. Impact of natural gas injection strategies on combustion and emissions of a dual fuel natural gas engine ignited with diesel at low loads. Fuel 2020, 260, 116414. [Google Scholar] [CrossRef]
- Tang, Q.; Fu, J.; Liu, J.; Zhou, F.; Yuan, Z.; Xu, Z. Performance improvement of liquefied natural gas (LNG) engine through intake air supply. Appl. Therm. Eng. 2016, 103, 1351–1361. [Google Scholar] [CrossRef]
- Shin, J.; Kim, D.; Son, Y.; Park, S. Effect of intake manifold geometry on cylinder-to-cylinder variation and tumble enhancement in gasoline direct injection engine. Sci. Rep. 2022, 12, 19862. [Google Scholar] [CrossRef] [PubMed]
- Kim, T.; Song, J.; Park, S. Effects of turbulence enhancement on combustion process using a double injection strategy in direct-injection spark-ignition (DISI) gasoline engines. Int. J. Heat Fluid Flow 2015, 56, 124–136. [Google Scholar] [CrossRef]
- Song, E.; Liu, Z.; Yang, L.; Yao, C.; Sun, J.; Dong, Q. Effects of nozzle structure on the gas mixture uniformity of marine gas engine. Ocean Eng. 2017, 142, 507–520. [Google Scholar] [CrossRef]
- Zhou, F.; Fu, J.; Shu, J.; Liu, J.; Wang, S.; Feng, R. Numerical simulation coupling with experimental study on the non-uniform of each cylinder gas exchange and working processes of a multi-cylinder gasoline engine under transient conditions. Energy Convers. Manag. 2016, 123, 104–115. [Google Scholar] [CrossRef]
- Yin, C.; Zhang, Z.; Sun, Y.; Sun, T.; Zhang, R. Effect of the piston top contour on the tumble flow and combustion features of a GDI engine with a CMCV: A CFD study. Eng. Appl. Comput. Fluid Mech. 2016, 10, 311–329. [Google Scholar] [CrossRef]
- Zhu, Z.; Mu, Z.; Wei, Y.; Du, R.; Guan, W.; Liu, S. Cylinder-to-cylinder variation of knock and effects of mixture formation on knock tendency for a heavy-duty spark ignition methanol engine. Energy 2022, 254, 124197. [Google Scholar] [CrossRef]
- Talati, H.; Aliakbari, K.; Ebrahimi-Moghadam, A.; Farokhad, H.K.; Nasrabad, A.E. Optimal design and analysis of a novel variable-length intake manifold on a four-cylinder gasoline engine. Appl. Therm. Eng. 2022, 200, 117631. [Google Scholar] [CrossRef]
- Babadi, M.N.; Kheradmand, S. The Effect of Using the Flow Separator Blade to Increase the Uniformity of Flow in the Intake Manifold. J. Mech. 2019, 35, 875–885. [Google Scholar] [CrossRef]
- Huang, C.-H.; Wang, C.-H.; Kim, S. A manifold design problem for a plate-fin microdevice to maximize the flow uniformity of system. Int. J. Heat Mass Transf. 2016, 95, 22–34. [Google Scholar] [CrossRef]
- Chen, Z.; Yao, C.; Wang, Q.; Han, G.; Dou, Z.; Wei, H.; Wang, B.; Liu, M.; Wu, T. Study of cylinder-to-cylinder variation in a diesel engine fueled with diesel/methanol dual fuel. Fuel 2016, 170, 67–76. [Google Scholar] [CrossRef]
- Czarnigowski, J. Analysis of cycle-to-cycle variation and non-uniformity of energy production: Tests on individual cylinders of a radial piston engine. Appl. Therm. Eng. 2011, 31, 1816–1824. [Google Scholar] [CrossRef]
- Chauvin, J.; Moulin, P.; Corde, G.; Petit, N.; Rouchon, P. Real-time nonlinear individual cylinder air-fuel ratio observer on a diesel engine test bench. IFAC Proc. Vol. (IFAC-Pap.) 2005, 38, 194–199. [Google Scholar] [CrossRef]
- Shi, M.; Jin, S.; Wang, J.; Zi, Z.; Chen, T.; Wu, B. Structural optimization study of ammonia-diesel dual-fuel engine based on reactivity turbulent jet disturbance coupled aerodynamics under high load conditions. Appl. Therm. Eng. 2024, 256, 124133. [Google Scholar] [CrossRef]
- Alrbai, M.I.; Qawasmeh, B.R. Evaluating the in-cylinder gas mixture homogeneity in natural gas HCCI free piston engine under different engine parameters using 3D-CFD analysis. Energy Sources, Part A: Recover. Util. Environ. Eff. 2018, 40, 1097–1113. [Google Scholar] [CrossRef]
- Muckova, P.; Kalabza, O.; Famfulik, J.; Smiraus, J.; Siroky, J.; Mikova, J. Engine intake airbox CFD optimisation and experimental validation tests. MM Sci. J. 2023, 03, 6364–6367. [Google Scholar] [CrossRef]
- Sakowitz, A.; Mihaescu, M.; Fuchs, L. Flow decomposition methods applied to the flow in an IC engine manifold. Appl. Therm. Eng. 2014, 65, 57–65. [Google Scholar] [CrossRef]
- Maiboom, A.; Tauzia, X.; Hétet, J.-F. Influence of EGR unequal distribution from cylinder to cylinder on NOx–PM trade-off of a HSDI automotive Diesel engine. Appl. Therm. Eng. 2009, 29, 2043–2050. [Google Scholar] [CrossRef]
- Dimitriou, P.; Burke, R.; Copeland, C.D.; Akehurst, S. Study on the Effects of EGR Supply Configuration on Cylin-der-to-Cylinder Dispersion and Engine Performance Using 1D-3D Co-Simulation; SAE Technical Paper; SAE International: Warrendale, PA, USA, 2015; Volume 32, pp. 816–827. [Google Scholar] [CrossRef]
- Reifarth, S.; Kristensson, E.; Borggren, J.; Sakowitz, A.; Angstrom, H.E. Analysis of EGR/Air Mixing by 1-D Simulation, 3-D Simulation and Experiments; SAE Technical Paper; SAE International: Warrendale, PA, USA, 2014; Volume 1, pp. 2647–2659. [Google Scholar] [CrossRef]
- Dhatkar, S.A.; Rajesh, S.K.; Garg, S.; Emran, A.; Sharma, V. EGR Mixer Optimization for Achieving Uniform Cylinder EGR Distribution Using 1D-3D CFD Coupled Simulation Approach to Meet Future Stage v Emission Legislation in India; SAE Technical Paper; SAE International: Warrendale, PA, USA, 2020; Volume 28, pp. 390–400. [Google Scholar] [CrossRef]
- Kassa, M.; Hall, C.; Ickes, A.; Wallner, T. Modeling and control of fuel distribution in a dual-fuel internal combustion engine leveraging late intake valve closings. Int. J. Engine Res. 2016, 18, 797–809. [Google Scholar] [CrossRef]
- Milojevic, S.; Savic, S.; Maric, D.; Stopka, O.; Krstic, B.; Stojanovic, B. Correlation between Emission and Combustion Characteristics with the Compression Ratio and Fuel Injection Timing in Tribologically Optimized Diesel Engine. Teh. Vjesn.-Tech. Gaz. 2022, 29, 1210–1219. [Google Scholar] [CrossRef]
- You, J.; Liu, Z.; Wang, Z.; Wang, D.; Xu, Y.; Du, G.; Fu, X. The exhausted gas recirculation improved brake thermal efficiency and combustion characteristics under different intake throttling conditions of a diesel/natural gas dual fuel engine at low loads. Fuel 2020, 266, 117035. [Google Scholar] [CrossRef]
- Wang, Y.; Xiao, F.; Zhao, Y.; Li, D.; Lei, X. Study on cycle-by-cycle variations in a diesel engine with dimethyl ether as port premixing fuel. Appl. Energy 2015, 143, 58–70. [Google Scholar] [CrossRef]
- Wu, G.; Ge, J.C.; Kim, M.S.; Choi, N.J. NOx–Smoke Trade-off Characteristics in a Palm Oil-Fueled CRDI Diesel Engine under Various Injection Pressures and EGR Rates. Appl. Sci. 2022, 12, 1069. [Google Scholar] [CrossRef]


Disclaimer/Publisher’s Note: The statements, opinions and data contained in all publications are solely those of the individual author(s) and contributor(s) and not of MDPI and/or the editor(s). MDPI and/or the editor(s) disclaim responsibility for any injury to people or property resulting from any ideas, methods, instructions or products referred to in the content. |
© 2025 by the authors. Licensee MDPI, Basel, Switzerland. This article is an open access article distributed under the terms and conditions of the Creative Commons Attribution (CC BY) license (https://creativecommons.org/licenses/by/4.0/).