Article

Study on the Influence of Inducer Structure Change on Pump Cavitation Characteristics

State Key Laboratory of Hydro-Science and Engineering, Department of Energy and Power Engineering, Tsinghua University, Beijing 100084, China
*
Author to whom correspondence should be addressed.
Energies 2025, 18(15), 4059; https://doi.org/10.3390/en18154059 (registering DOI)
Submission received: 26 May 2025 / Revised: 23 July 2025 / Accepted: 25 July 2025 / Published: 31 July 2025

Abstract

Given that cryogenic pumps on liquefied natural gas (LNG) carriers are prone to cavitation under complex operating conditions, this paper examines the inducer of an LNG centrifugal pump to uncover how the inducer geometry affects both the cavitation behavior and internal flow-induced excitation at −163 °C. Through detailed numerical simulations, we evaluate the cavitation performance and flow excitation characteristics across a range of inducer designs, systematically varying the blade count, inlet and outlet angles, and blade wrap angle. Our results show that reducing the number of blades, together with properly optimized inlet/outlet and wrap angles, significantly enhances the cavitation resistance. These findings provide a solid theoretical basis and practical guidance for the engineering optimization of LNG ship pumps.

1. Introduction

In recent years, liquefied natural gas (LNG) has gradually become an important part of the global energy system due to its odorless and non-toxic physical properties and significant low-carbon emissions advantages [1]. As a strategic resource that combines eco-friendliness, operational safety, and economic feasibility, China has included its use in the key development areas of energy structure adjustment. Within the storage, transportation, and terminal applications of an LNG industry chain, cryogenic centrifugal pumps, as the core power equipment, undertake the task of pressurizing and transporting ultra-low-temperature media at −163 °C [2]. However, the fluid phase change effect caused by extreme working conditions can easily lead to cavitation in a pump, which in turn causes the performance of the equipment to deteriorate. In engineering practice, by adding an inducer device to the front end of a centrifugal pump, the pump body’s anti-cavitation ability and internal flow stability can be significantly improved. This technology has become a key method to ensure the reliable operation of an LNG transportation system [3].
Over the past two decades, domestic scholars have increased their research attention to inducers. In 2000, Pan Zhongyong et al. analyzed the influence of the inducer flow coefficient and head in the design process and summarized the calculation method for the important geometric parameters of an inducer [4]. In 2002, Zhang Tao et al. used Visual C++ to call AutoCAD (2002) to perform parametric hydraulic design of an inducer [5]. In 2005, Wang Jian et al. designed a variable pitch inducer by combining two inducers with different placement angles, thereby improving the cavitation performance of the centrifugal pump [6]. Between 2007 and 2012, Kong Fanyu et al. simulated the internal flow field of a variable pitch inducer; developed a variable pitch inducer design method; and tested different types of pumps, such as electromagnetic pumps, submersible pumps, and cryogenic pumps, with variable pitch inducers. It was found that a variable pitch inducer led to a significant improvement in the cavitation performance of the pumps [7]. In 2013, Wang Xiaobo et al. modified the Kubota cavitation model considering the influence of thermal effects and simulated the cavitation flow field of an inducer under liquid hydrogen and water media [8]. In 2015, Wang Wenting et al. studied the relative circumferential position of an inducer and the centrifugal wheel, and combined inducers with different pitches. The results showed that the inducer with a variable pitch at the inlet and equal pitch at the outlet had the best matching performance with the centrifugal wheel [9]. In 2016, Li Xin et al. added spiral stators to an inducer and found that the head and cavitation performance of the inducer with spiral stators were improved, but the efficiency of the inducer was reduced [10]. In 2017, Sun Qiangqiang et al. simulated the cavitation of variable pitch inducers with different structures. The results showed that when the blade diameter was constant, the cavitation performance of the high-speed centrifugal pump was significantly improved [11]. In 2021, J. Doe et al., based on a CFD-coupled multi-objective genetic algorithm and support vector regression agent model, used the blade number, helix angle, and angle of attack as the design variables to simultaneously optimize the performance of an inducer under three flow conditions of 80%, 100%, and 150%. The results showed that the efficiency was improved by 5–8% and the smoothness of the pressure head curve was significantly improved [12]. In the same year, Y. Zhang et al., through high-magnification high-speed photography combined with PIV technology, visualized the evolution of the cavitation zone of the inducer of a high-speed centrifugal pump with different blade cross-sections and guide angles, providing an intuitive basis for the optimization of blade leading edge and flow channel geometry [13]. In 2024, E. Dehnavi et al. first proposed an independent speed control strategy for the inducer and the centrifugal impeller, and studied the effects of different speed ratios on the cavitation starting position and pump efficiency in the co-rotating and counter-rotating modes, and found that a specific speed ratio combination could improve both the cavitation performance and energy efficiency [14]. In the same year, B. Cui et al. quantitatively analyzed the energy loss and efficiency changes under various matching sizes by adjusting the axial matching clearance between the inducer and the main impeller (0–0.5 D), and found that the optimal clearance was about 0.2 D, which minimized the energy loss and improved the pump performance [15].
Coutier-Delgosha et al. [16] studied the effect of the number of blades on the performance of the inducer of a rocket engine turbopump and conducted experimental tests on three-blade and five-blade inducers. Coutier-Delgosha et al. [17] proposed a computational model for three-dimensional cavitation flow, which can be applied to the analysis of the cavitation performance of turbopump inducers under non-cavitation and cavitation conditions and was verified experimentally. Pasini et al. [18] obtained pressure signals by opening pressure-measuring holes along the flow passage of the inducer blades, thereby analyzing the causes of the instability of the inducer cavitation flow.
This paper orthogonally adjusts the inducer structure, optimizes the hydraulic performance and cavitation performance of the inducer, and improves the anti-cavitation performance of the whole pump. Using liquefied natural gas as the medium, the cavitation numerical calculation of an LNG marine pump inducer is carried out to reveal the internal flow field of the inducer under a low-temperature environment, and predict and improve the low-temperature cavitation performance of the inducer.

2. Numerical Simulation Methods
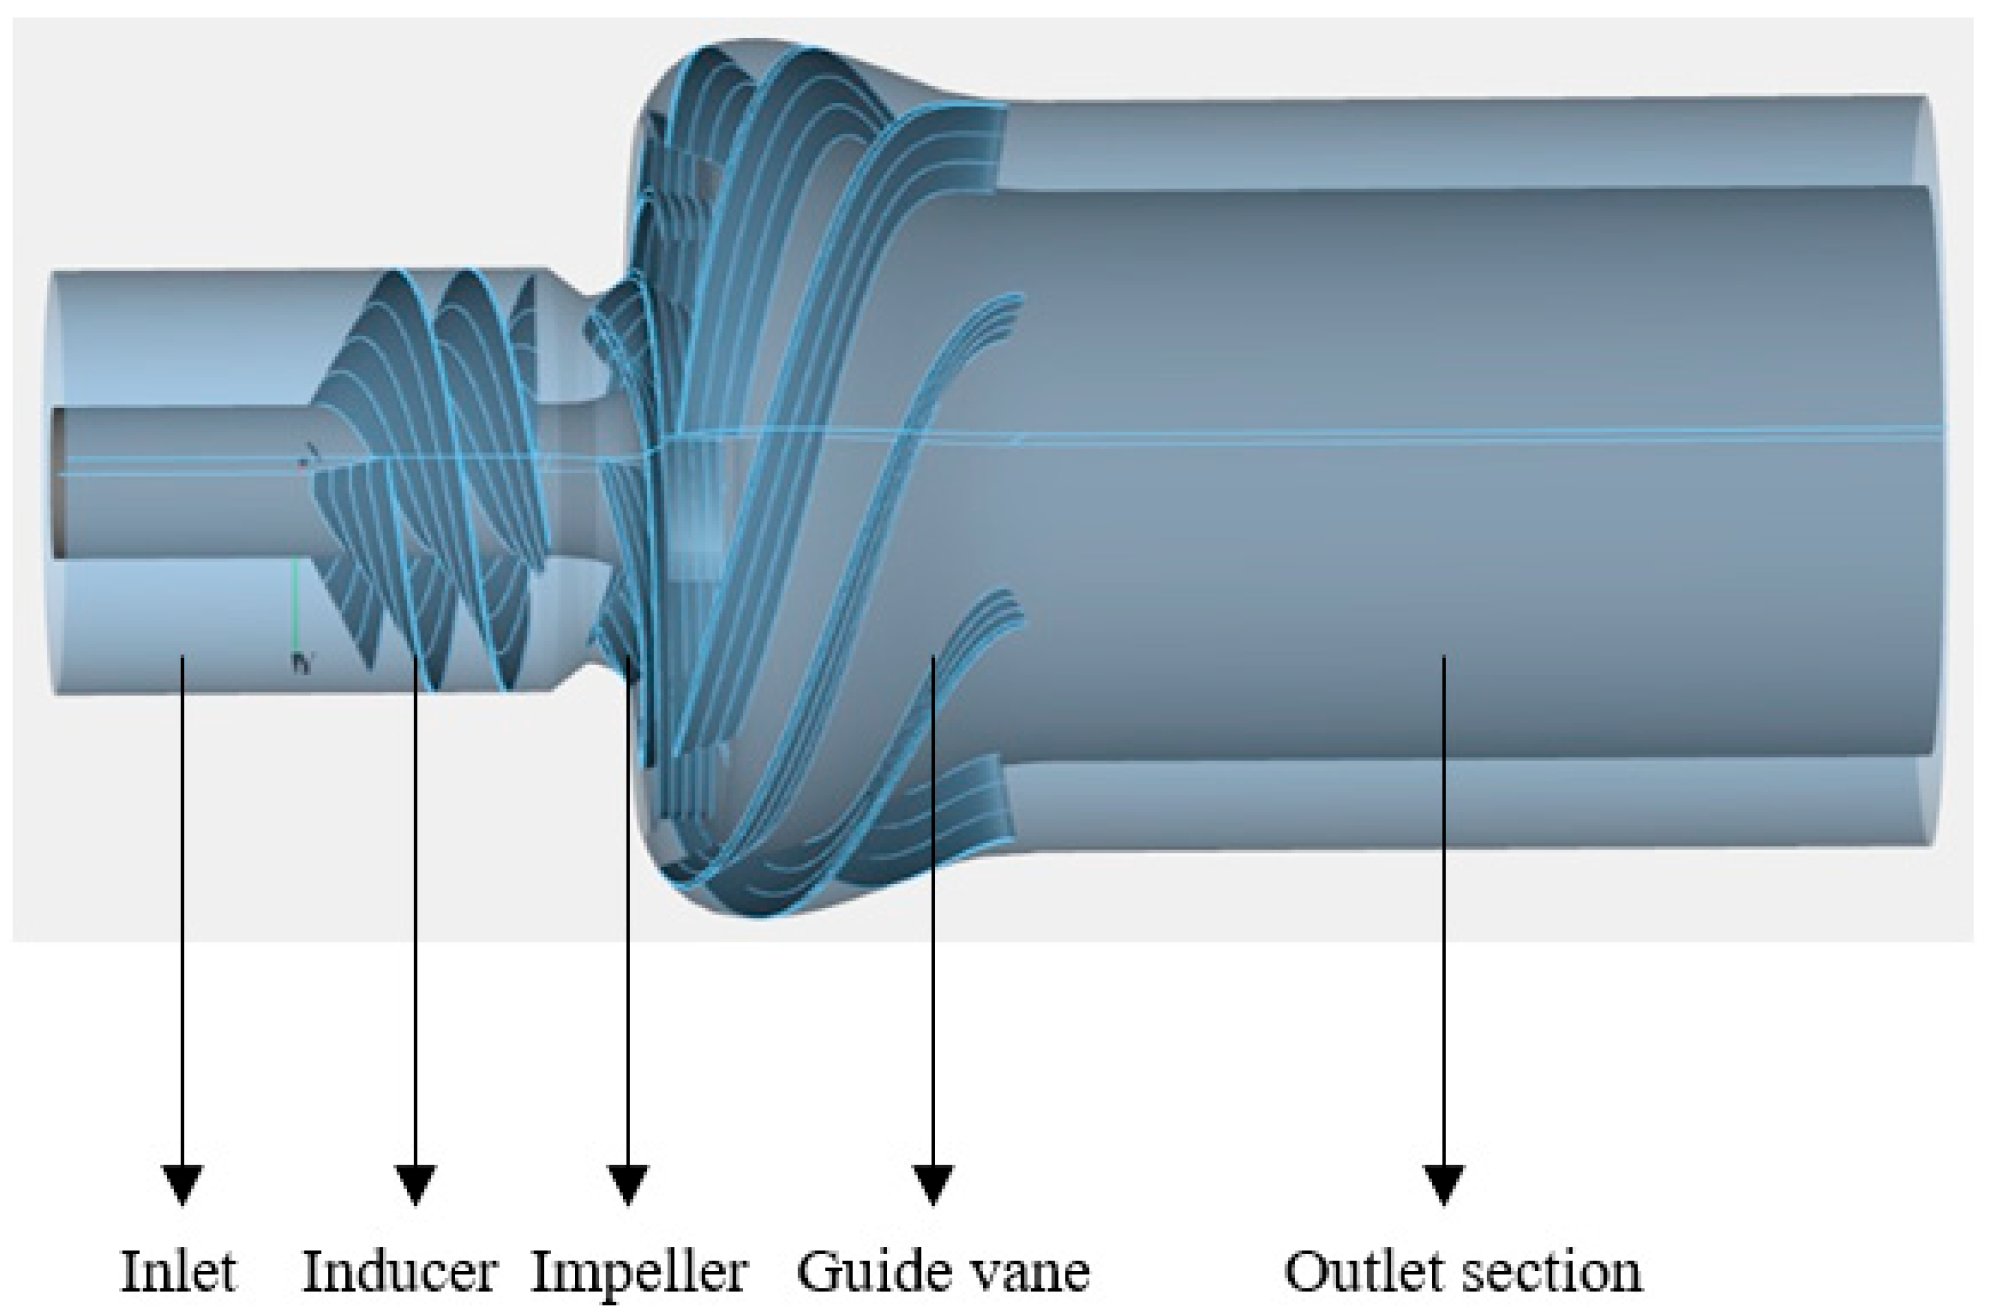
2.1. Study Subjects

The main structure of the pump system is the inlet section, inducer, impeller, guide vane, and outlet section, as shown in Figure 1. The impeller has 6 blades and the guide vane has 7 blades. Based on the existing research, this paper uses numerical calculation methods to adjust the inducer structure of LNG ships and conduct cavitation simulations, aiming to reveal the influence of the inducer structure on the internal flow and cavitation performance of the flow field under low temperature. First, the meshes of each flow-passing component are imported into CFX-Pre for pre-processing, and the fluid domain is defined, in which the inducer and impeller are set as rotating domains, and the rest are stationary domains. The basic conditions include the following: LNG and LNG steam are used as the calculation mediums, and the physical properties are detailed in Table 1. The inlet boundary condition adopts the total pressure inlet, and the total pressure of the non-cavitation pump inlet is 200 kPa. The outlet boundary condition is set as the mass flow outlet, and the outlet flow rate is 200 kg/s. In terms of the wall and interface conditions, a no-slip wall is set. In the cavitation numerical simulations, the head value under different cavitation states is obtained by continuously reducing the inlet pressure, and the saturated LNG vapor pressure is set to 84 kPa [19], and the residual value less than 10−5 is used as the criterion for calculation convergence.
The turbulence equation in this study uses the k-ε model wall function [20]. The k-ε model wall function is a technique used in turbulence models to improve the prediction of turbulent behavior near the wall.
t ρ k + x j ρ k u j = x j μ + μ t σ k k x j + G k + G b ρ ε Y M + S k  
Turbulent   kinetic   energy   ( k )   transport   equation : t ρ ε + x j ρ ε u j = x j μ + μ t σ ε ε x j                    + ρ C 1 S ε ρ C 2 ε 2 k + ν ε + C 1 ε ε k C 3 ε G b + S ε Transport   equation   for   dissipation   rate   ( ε )
The cavitation model used is the Schnerr–Sauer cavitation model [21]. The Schnerr–Sauer cavitation model is a cavitation prediction method based on the assumption of a homogeneous mixture. It mainly describes the cavitation phenomenon by calculating the generation and collapse process of the bubbles in a liquid. The model uses source terms to describe the mass transfer between liquid and vapor states [22]. Its core idea is to use parameters, such as the bubble volume fraction and bubble number density, to predict the generation and disappearance process of cavitation bubbles under the given flow field conditions. The model parameters are empirically adjusted to better capture the dynamic characteristics of the fluid under different cavitation states [23].

2.2. Orthogonal Experimental Design

The combination strategy of inducer geometric parameters directly affects the head, efficiency, and cavitation margin [24]. Therefore, an orthogonal adjustment is required in the configuration design stage, focusing on analyzing the influence of the key parameters, such as the blade wrap angle and inlet and outlet angle, on the flow loss and cavitation characteristics [25]. Through orthogonal optimization experiments, on the one hand, we can explore the influence of some of the geometric parameters of inducer on cavitation, head, and efficiency, and on the other hand, we can obtain a better parameter combination scheme for the centrifugal pump inducer, so that it can improve the cavitation performance of the pump while taking into account the efficiency and head [26,27].
In this paper, the effective cavitation margin NPSHa, when the head drops by about 3%, is set as the critical cavitation margin NPSHr, and NPSHa is defined as follows:
N P S H a = P i n P v ρ g
In the orthogonal optimization tests in this paper, the lift H, efficiency η, and critical cavitation margin NPSHr are used as the indicators to optimize the four factors of the number of inducer blades n, inlet angle β y 1 , outlet angle β y 2 , and blade wrap angle φ. The number of blades is 2–3, and the blade wrap angle, inlet angle, and outlet angle factors are set at three levels. The initial value of the inlet angle is 10°~24.5°; the initial value of the outlet angle is 12°~28.5°; and the initial value of the blade wrap angle is 245°~325°. The levels for each factor are shown in Table 2.
Based on the basic principles of orthogonal experiments, this paper determines the orthogonal optimization scheme of the four factors and three levels of the induction wheel and produces an orthogonal table, as shown in Table 3. There is a total of 9 groups of experimental schemes. The number of simulations is 1, with no error analysis.

2.3. Mesh Model

The mesh generation method uses Workbench Meshing to generate unstructured meshes. The grid size is 0.1 mm. The total number of meshes is 3,145,581, and the total number of nodes is 600,747. The minimum mesh quality is 0.17872, the maximum mesh quality is 0.99994, and the average mesh quality is 0.83504. The mesh details of each component are shown in Table 4. No grid independence test is performed in this simulation. The boundary conditions are the pressure inlet and flow outlet; the flow rate is uniformly set to 200 kg/s. To ensure that our simulation results are not unduly influenced by the mesh resolution, we conduct a mesh independence study, in which the nominal cell size is systematically varied by ±0.01 mm. Three separate meshes are generated—one for the baseline grid spacing, one refined by 0.01 mm, and one coarsened by 0.01 mm—and the corresponding pump efficiencies are evaluated under identical operating conditions. The recorded efficiencies are 73.2%, 73.0%, and 73.4%, respectively, indicating that the efficiency fluctuation due to the grid variation is less than 1%. This confirms that our chosen mesh provides sufficiently converged results for reliable performance prediction. The mesh details are shown in Figure 2.

3. Results and Analysis

3.1. Comparison of Cavitation Results of Inducers with Different Structures

By using CFX software (2023R1) to perform numerical simulation calculations on the above nine test schemes, the calculation results for the head, efficiency, shaft power, and critical cavitation margin under the corresponding nine design conditions are obtained. The head, efficiency, shaft power, and NPSHr of the nine schemes are listed in Table 5.
According to the data shown in Table 5, the head of scheme 9 is 184.224 m, the critical cavitation margin is 46.335 m, and the cavitation performance is poor. The critical cavitation margin of group 2 is 29.042 m, the cavitation performance is better, the efficiency is 83.4738%, and the head is 184.873 m, which is a good performance. The parameters of the remaining schemes (1, 3–7, and 9) are between these two. Therefore, group 2 is the best choice.
Through calculating the nine groups of schemes, it is found that the cavitation performance of the two-blade inducer is significantly better than that of the three-blade inducer. Figure 3 shows the distribution of the isosurface of the inlet pressure of group 1 and group 7 at 250 kPa. It can be clearly seen from Figure 3 that the three-blade inducer has more cavitation and poor cavitation performance. Through the complete calculations, it is found that the NPSHr of the three-blade group is greater than 40 m, and the NPSHr of the two-blade group is less than 40 m.
Next, the cavitation performance of the six groups with two blades is compared, and the inlet pressure of the six groups is set to be the same, at 230 kPa. The isosurface distribution diagram of the inlet pressure of group 1 to group 6 at 230 kPa is obtained, and is shown in Figure 4.
As shown in Figure 4, under the same inlet pressure, the cavitation distribution of groups 2, 5, and 6 is significantly less, and their cavitation performance is better; the cavitation generation of groups 1, 3, and 4 is greater, indicating that their cavitation performance is poor. The change in the inducer structure of groups 2, 5, and 6 is conducive to an improvement in the cavitation performance of the pump.
We continue to reduce the inlet pressure of groups 2, 5, and 6 to 210 kPa, and obtain their isosurface distribution diagram, as shown in Figure 5.
From the analysis of Figure 5, it can be seen that when the inlet pressure is the same at 210 kPa, group 2 has the least cavitation distribution, groups 5 and 6 have more cavitation in the two impeller blades, and only one blade in group 2 produces cavitation, and group 2 has the better cavitation performance.

3.2. Effect of Inducer Blade Number on Cavitation Performance

Groups 7, 8, and 9 have three blades, and the remaining six groups have two blades. By analyzing Table 5 and Figure 6, compared with the three-blade inducer, the pump head and efficiency are slightly improved when the two-blade inducer is used. This is mainly because the increase in the number of blades leads to a decrease in the flow area of the inducer flow channel, a narrow flow space for the fluid in the inducer, large flow fluctuations, and even blockage, which prevents the fluid from entering the impeller normally, causing the pump performance to decline. According to the analysis of Figure 6, the critical cavitation margin of the three-blade group is significantly higher than that of the two-blade group. This is because with the increase in the number of blades, the displacement of the inducer blades increases, causing the local flow velocity to accelerate, thereby causing the local static pressure to decrease, making it easier to produce cavitation. When the inlet pressure is the same, at 250 kPa, compared with the cavitation distribution of group 7, the cavitation distribution of group 1 is significantly less, the cavitation intensity is weaker, and a small amount of cavitation occurs; when the inlet pressure of group 7 is 250 kPa, the cavitation fills most of the flow channel, the head is significantly reduced, and the cavitation is serious.
According to Figure 7, the three-blade suction surface inducer forms a low pressure. The two-blade design has a wider flow channel, less fluid flow resistance, low friction loss, and reduced energy loss. The three-blade design has a narrow flow channel and a reduced flow area, which leads to increased flow fluctuations and cavitation initiation.
It can be seen from these four figures that, with respect to the flow position, the pressures on the pressure surfaces of group 1 and group 7 are basically the same, while the suction surface pressure of group 7 is lower overall due to cavitation. Group 1 does not cavitate and the suction surface pressure remains basically unchanged. As for the speed, group 1 has a higher speed over most of the flow range, while the speed of group 7 is relatively low. This may be because the cavitation bubbles hinder the flow of liquid. The gas volume fraction of group 7 shows an obvious upward trend with the flow position, and the gas content of group 7 gradually increases, while group 1 always maintains a low gas volume fraction. The LNG volume fraction diagram verifies the generation of gas in group 7. Figure 8 shows the Curve distribution diagram for inducer blades of group 1 and group 7.
The use of a double-blade inducer structure can significantly weaken the formation of large-scale vortex cores in the flow channel and make the turbulent kinetic energy more evenly distributed at the blade gap, thereby suppressing the appearance of local low-speed areas and recirculation areas. Specifically, the double-blade layout forms two rows of small-scale vortex streets with staggered phases on the blades’ front surfaces. These vortex streets are quickly broken and exchanged with the mainstream energy, making the turbulent kinetic energy more evenly distributed across the entire flow channel section, and the local energy accumulation is dissipated in time, avoiding the retention and blockage of particles and microbubbles caused by accumulation in low-speed areas or recirculation areas. At the same time, due to the large spacing between the two blades, the streamline deflection angle is reduced, and the fluid shear stress is dispersed, further reducing the risk of wall attachment and floating impurities settling. In summary, through the refinement of the vortex structure and the redistribution of turbulent kinetic energy, the double-blade design effectively alleviates the microscopic mechanism of flow channel blockage while maintaining the overall hydraulic performance.
Although the efficiency of the two-blade design is generally higher than that of the three-blade design, its head is slightly lower. For example, the head of scheme 6 is 185.226 m, which is close to the highest value of the three-blade group, but its NPSHr is still lower than that of the three-blade group. This shows that the two-blade design achieves a better balance between the head and cavitation suppression. The two-blade design reduces the flow velocity gradient through a wide flow channel, effectively suppresses the initiation of cavitation, and reduces the friction loss at the same time. It is the preferred solution for LNG cryogenic pumps. Increasing the number of inducer blades enhances the flow guidance effect of the fluid, but at the same time it reduces the cross-sectional area of the flow channel, increases the local flow velocity, and significantly reduces the local static pressure. The numerical simulation results show that the critical cavitation margin of the three-blade design group is generally higher than that of the two-blade group, indicating that under the same working conditions an increase in the number of blades will aggravate the cavitation phenomenon. In other words, although some three-blade solutions have a slight advantage in term of the head, from the perspective of cavitation risk and energy loss, the two-blade design is more reasonable.

3.3. Study on the Influence of Inducer Geometric Parameters on Cavitation Performance and Cavitation Process

The inlet angle affects the smoothness of the fluid entering the blade: if it is too small, the fluid will hit the leading edge of the blade to form a local high pressure, and then the speed will increase suddenly to generate a low pressure, causing cavitation; if it is too large, it will easily cause the fluid to separate prematurely, forming a low-pressure vortex on the back of the blade, accelerating cavitation. A reasonable inlet angle can maintain the smooth transition of the fluid, reduce flow separation and turbulence, and delay the initiation of cavitation. The outlet angle determines the kinetic energy and pressure distribution of the fluid when it leaves the inducer: if it is too small, the kinetic energy will be reduced and the pressure recovery will be insufficient; if it is too large, the fluid speed will be too high, and the deceleration will cause violent pressure fluctuations at the inlet of the main impeller, which will cause cavitation collapse. The outlet angle should match the inlet angle of the main impeller, otherwise it may cause fluid impact or backflow, exacerbating cavitation.
Compared with group 1, group 2 has a 2° reduced inlet angle and a 2° increased outlet angle; group 3 has a 2° reduced outlet angle and a 2° increased inlet angle. From the analysis of Figure 9 and Figure 10, it can be seen that group 2 has the least cavitation generation at an inlet pressure of 230 kPa, indicating that its cavitation degree is the smallest and its cavitation performance is the best. Comparing group 2 and group 3, the cavitation degree is completely different at the same inlet pressure, and the cavitation performance of group 2 is better; that is, appropriately reducing the inlet angle and increasing the outlet angle are beneficial to the cavitation performance of the inducer.
The combination of inlet and outlet angles determines the flow path and pressure gradient inside the inducer. A large inlet angle and a small outlet angle may form a low-pressure area in the front of the flow channel and a high-pressure area in the rear, aggravating the initiation of cavitation. A small inlet angle and a large outlet angle may lead to a high-pressure shock in the front of the flow channel, excess kinetic energy in the rear, and significant pressure fluctuations in the main impeller inlet. Therefore, it is necessary to reasonably combine the inlet and outlet angles to maintain a stable pressure gradient through a smooth flow channel transition and effectively suppress cavitation.
Groups 1, 4, and 6 control the inlet and outlet angles at the same level. Group 4 increases the wrap angle by 5° compared to group 1; group 6 decreases the wrap angle by 5° compared to group 1. From the analysis of Figure 11 and Figure 12, it can be seen that group 6 generates the least cavitation at an inlet pressure of 230 kPa, indicating that its cavitation degree is the smallest and its cavitation performance is the best. Comparing group 4 and group 6, the cavitation degree is completely different under the same inlet pressure. The cavitation performance of group 6 is better; that is, appropriately reducing the wrap angle is beneficial to the cavitation performance of the inducer. It can be seen from Table 3 that Group 2 Table 3 also reduces the wrap angle, and its cavitation performance is also excellent.
An increase in the wrap angle significantly extends the flow path of the fluid on the blade surface, reduces the risk of sudden changes in flow velocity, and makes the pressure gradient distribution smoother, thereby weakening the intensity of the local low-pressure area caused by flow separation or secondary flow near the inlet edge of the blade. A larger wrap angle can enhance the fit between the fluid and the blade, reduce the formation of flow separation and vortex structure, and further reduce the transient low-pressure peak caused by turbulent pulsation. However, an excessively large wrap angle may induce additional friction loss and boundary layer separation due to an increased curvature of the flow channel, and form a new low-pressure vortex zone at the trailing edge of the blade, exacerbating the impact damage of cavitation collapse on the blade. At the same time, an excessively small wrap angle may shorten the effective length of the flow channel, causing the fluid to accelerate rapidly in the blade inlet area, causing a sudden drop in pressure near the inlet edge, and bringing the cavitation initiation point forward. This effect is more significant under low-flow conditions.
The inlet angle and outlet angle of the inducer blade directly determine the smoothness of the fluid entering the flow channel and the kinetic energy distribution at the outlet. Appropriately increasing the inlet angle can make the fluid enter the flow channel more smoothly and reduce the impact of the leading edge, but if it is too large, it can easily form a separation vortex on the back of the blade. In addition, too large an outlet angle may cause the flow velocity at the outlet to be too high, resulting in an increase in the pressure fluctuation at the main impeller inlet. The test data show that for scheme 2, the NPSHr is the lowest when the inlet angle is reduced and the outlet angle is increased, thereby effectively suppressing the initiation of cavitation. The wrap angle is an important parameter that affects the length of the flow path of the fluid on the blade surface. Appropriately increasing the wrap angle can prolong the residence time of the fluid on the blade surface, smooth the local pressure gradient, and reduce the low-pressure area caused by flow acceleration; however, too large an angle may cause additional friction loss and the formation of a tail vortex. The numerical simulation shows that a moderate adjustment of the wrap angle has a positive effect on the cavitation performance, which can not only suppress the expansion of the local low-pressure area, but also will not significantly increase the friction loss.
The NPSHas of groups Ⅰ to VI are 38, 33, 29, 26, 17, and 8, respectively. Figure 12 shows the cavitation distribution of group 1 under different NPSHas. As can be seen from Figure 12, bubbles initially appear on the suction surface of the inducer blade near the inlet. As the degree of cavitation decreases, bubbles develop along the suction surface toward the outlet of the inducer, and gradually diffuse along the pressure surface, eventually filling the entire flow channel. In the initial cavitation stage, bubbles are not formed directly at the tip of the blade, but first appear at the outer edge of the inlet, and then expand to the root and tip of the blade. This is because the tip radius is small and fails to produce a sufficient work capacity, and its pressure change is not obvious, so it is not easy to generate bubbles; when the blade radius increases and begins to exert a greater effect on the liquid, the pressure on the suction surface begins to decrease, forming a low-pressure area at the outer edge of the inlet. When the pressure drops to the critical vaporization pressure, bubbles precipitate. After that, although the inducer continues to perform work on the liquid, causing the pressure in some areas to increase and cavitation to no longer occur, the backflow at the root of the blade may still form a local low-pressure area. In addition, in the primary cavitation and critical cavitation stages, the cavitation on the suction side of the inducer is more serious than that on the pressure side. This is because the suction-side pressure is lower during operation, which makes it easier for the liquid to precipitate bubbles.
As can be seen from Figure 13, under different cavitation margin conditions, the pressure curve shows a trend of first decreasing and then slightly rising with the flow position. As the inlet pressure decreases, a low-pressure area appears in the inducer blades. From the velocity curve, due to the different cavitation levels, the fluid flows smoothly without cavitation, and as cavitation develops, the fluid flow is blocked by bubbles and the velocity increases. The gas volume fraction curve also shows obvious fluctuations and peak distributions. The higher the cavitation level, the greater the gas content. The LNG volume fraction diagram verifies the further development of cavitation. It can also be seen from the above figure that cavitation first occurs in the rear half of the inducer blades and then extends along the entire blade.
Figure 14 shows Curve distribution for the development process of induced wheel cavitation in group 1.In general, the flow loss of a pump is the result of the combined effect of multiple factors. In the design, manufacturing, and operation of a pump, it is necessary to comprehensively consider various factors, such as fluid mechanics, thermodynamics, and mechanics, to minimize the flow loss and improve the working efficiency and operational reliability of the pump. In engineering practice, the flow loss of a pump not only affects the energy efficiency of the pump, but also affects the service life and economic benefits of the equipment. Therefore, it is crucial to select the appropriate pump type and optimize the design and operating parameters of the pump for different application scenarios to reduce flow losses.

4. Conclusions

  • Employing a dual-bladed inducer effectively lowers the critical cavitation margin and suppresses local low-pressure zones without compromising the pump head or efficiency. During the commissioning of and under low-flow conditions in LNG pumps, it is therefore advisable to adopt this two-blade design, supplemented by online NPSH monitoring and automated blade clearance adjustment, to extend the startup life and reduce the risk of unplanned downtime.
  • Optimizing the ratio of the inlet angle to the outlet angle can smoothly guide the fluid at the inlet and achieve sufficient kinetic energy to pressure energy conversion at the outlet, thereby slowing down the initiation of cavitation; during the assembly and on-site commissioning stages, the impeller geometry accuracy should be strictly controlled and, combined with a variable frequency speed regulation strategy, the speed should be gradually increased to prevent early cavitation and improve operational stability.
  • By reasonably adjusting the blade wrap angle, the fluid contact time along the blade surface can be extended, the pressure gradient can become smoother, and the initiation of cavitation can be inhibited; at the same time, a surface finish and edge transition treatment must be ensured. Under different LNG composition and temperature conditions, a wrap angle–NPSH relationship database can be established with the help of online vibration and sonar monitoring to achieve dynamic operating condition adjustments that take into account both the efficiency and cavitation risks.

Author Contributions

Conceptualization, Z.W. and W.S.; Writing—original draft, X.L.; Writing—review & editing, Y.Z. and Y.L. All authors have read and agreed to the published version of the manuscript.

Funding

This research received no external funding.

Data Availability Statement

The original contributions presented in the study are included in the article, further inquiries can be directed to the corresponding author.

Conflicts of Interest

The authors declare no conflict of interest.

References

  1. Jiang, H.; Wan, X.; Jing, H. Analysis on the current status and localization of LNG cryogenic submersible pumps in my country. Gen. Mach. 2014, 54–56. [Google Scholar]
  2. Huang, J.; Chen, B.; Huang, X. Research on configuration and control system of LNG cryogenic submersible pump test platform. Petrochem. Equip. Technol. 2018, 39, 26–30. [Google Scholar]
  3. Luo, Z.; Ren, Y.; Chen, S.; Feng, C.; Ge, J. Structure and design analysis of LNG cryogenic submersible pumps. Cryog. Supercond. 2012, 40, 13–16. [Google Scholar]
  4. Pan, Z.; Guan, X. Theory and design of pump inducer. Trans. Chin. Soc. Agric. Mach. 2000, 31, 45–47. [Google Scholar]
  5. Zhang, T.; Guan, X.; Liu, H. Development of hydraulic design software for inducer based on AutoCAD2000. Pump Technol. 2002, 22–25. [Google Scholar]
  6. Wang, J.; Hu, J.; He, Y.; Zhu, B. Design of centrifugal pump inducer. Fluid Mach. 2005, 33, 20–22. [Google Scholar]
  7. Kong, F.; Zhang, H.; Zhang, X.; Wang, Z. Design on variable-pitch inducer based on numerical simulation for cavitation flow. J. Drain. Irrig. Mach. Eng. 2010, 28, 12–17. [Google Scholar]
  8. Wang, X.; Wang, G.; Shi, S.; Wu, Q. Cavitation flow characteristics of liquid hydrogen inside inducer. J. Drain. Irrig. Mach. Eng. 2013, 31, 558–564. [Google Scholar]
  9. Wang, W.; Chen, H.; Li, Y.; Du, Y. Matching of inducer and centrifugal wheel of high-speed centrifugal pump. J. Drain. Irrig. Mach. Eng. 2015, 33, 301–305. [Google Scholar]
  10. Li, X.; Li, J.; Wang, J.; Zhang, W.; Zhao, H. Cavitation performance of inducer with spiral stator blades. J. Beijing Univ. Aeronaut. Astronaut. 2016, 2654–2661. [Google Scholar]
  11. Sun, Q.; Jiang, J.; Zhang, S.; Chen, Q. Effect of variable pitch inducer on cavitation performance of high-speed centrifugal pump. J. Drain. Irrig. Mach. Eng. 2017, 35, 856–862. [Google Scholar]
  12. Parikh, T.; Mansour, M.; Thévenin, D. Maximizing the performance of pump inducers using CFD-based multi-objective optimization. Struct. Multidiscip. Optim. 2022, 65, 9. [Google Scholar] [CrossRef]
  13. Xu, Z.; Kong, F.; Zhang, H.; Zhang, K.; Wang, J.; Qiu, N. Research on Visualization of Inducer Cavitation of High-Speed Centrifugal Pump in Low Flow Conditions. J. Mar. Sci. Eng. 2021, 9, 1240. [Google Scholar] [CrossRef]
  14. Ehsan, D.; Amelie, D.; Moises, S.; Mohamed, K.; Farid, B. Study on the pump cavitation characteristic through novel independent rotation of inducer and centrifugal impeller in co-rotation and counter-rotation modes. Phys. Fluids 2024, 36, 015120. [Google Scholar] [CrossRef]
  15. Yang, Z.; Cao, P.; Zhang, J.; Gao, S.; Song, X.; Zhu, R. Research on Energy Loss of Optimization of Inducer–Impeller Axial Fit Dimensions Based on Wave-Piercing Theory. Water 2024, 16, 1385. [Google Scholar] [CrossRef]
  16. Coutier-Delgosha, O.; Caignaert, G.; Bois, G.; Leroux, J.-B. Influence of the blade number on inducer cavitating behavior. J. Fluids Eng. 2012, 134. [Google Scholar] [CrossRef]
  17. Coutier-Delgosha, O.; Morel, P.; Fortes-Patella, R.; Reboud, J. Numericalsimulation of turbopump inducer cavitating behavior. Int. J. Rotating Mach. 2014, 2005, 135–142. [Google Scholar] [CrossRef]
  18. Pasini, A.; Hadavandi, R.; Valentini, D.; Pace, G.; D’AGostino, L. Dynamics of the blade channel of an inducer under cavitation-induced instabilities. In Proceedings of the International Symposium on Transport Phenomena and Dynamics of Rotating Machinery, Maui, HI, USA, 16–21 December 2017. [Google Scholar]
  19. Xu, X. Research on Low Temperature Cavitation Characteristics of LNG Submersible Pump. Master’s Thesis, Jiangsu University, Zhenjiang, China, 2020. Available online: https://d.wanfangdata.com.cn/thesis/ChhUaGVzaXNOZXdTMjAyNDA5MjAxNTE3MjUSCUQwMjAzNjUxMRoIampoc2hzM2c%3D (accessed on 15 July 2025).
  20. Schnerr, G.H.; Sauer, J. Physical and numerical modeling of unsteady cavitation dynamics. In Proceedings of the Fourth International Conference on Multiphase Flow, New Orleans, LA, USA, 21 May–1 June 2001; pp. 1–8. [Google Scholar]
  21. Cao, J.; Luo, Y.; Shi, Y.; Liu, X.; Xu, D.; Wang, Y.; Zhai, L.; Wang, Z. A review of hydro-turbine unit rotor system dynamic behavior: Multi-field coupling of a three-dimensional model. Phys. Fluids 2024, 36, 121304. [Google Scholar] [CrossRef]
  22. Lu, Y.; Xin, L.; Hu, N.; Zhu, Z.; Xia, W. Influences of floating ice on the water entry process of slender body on the cavity evolution and hydrodynamic characteristic. Phys. Fluids 2025, 37, 042103. [Google Scholar] [CrossRef]
  23. Long, Y.; Wu, Z.; Zhang, M.; Xu, Y. Research on the transient flow and vortex structure evolution mechanism of reactor coolant pump under non-uniform inflow. Ann. Nucl. Energy 2025, 217, 111346. [Google Scholar] [CrossRef]
  24. Long, Y.; Xu, Y.; Guo, X.; Zhang, M. Analysis of internal flow excitation characteristics of reactor coolant pump based on, P.O.D. Ann. Nucl. Energy 2025, 216, 111286. [Google Scholar] [CrossRef]
  25. Zhou, D.; Zhang, N.; Zheng, F.; Gad, M.; Gao, B. Experimental investigation on the effect of the rotor-stator matching mode on velocity pulsation in the centrifugal pump with a vaned diffuser. Nucl. Eng. Technol. 2024. [Google Scholar] [CrossRef]
  26. Li, D.; Zhang, N.; Jiang, J.; Gao, B.; Alubokin, A.A.; Zhou, W.; Shi, J. Numerical investigation on the unsteady vortical structure and pressure pulsations of a centrifugal pump with the vaned diffuser. Int. J. Heat Fluid Flow 2022, 98, 109050. [Google Scholar] [CrossRef]
  27. Wang, W.; Liu, S.; Pei, J.; Sun, J.; Sun, Q. Efficiency improvement and pressure pulsation reduction of volute centrifugal pump through diffuser design optimization. J. Energy Storage 2024, 102, 114184. [Google Scholar] [CrossRef]
Figure 1. LNG pump three-dimensional fluid calculation domain.
Energies 18 04059 g001
Figure 2. Mesh details.
Energies 18 04059 g002
Figure 3. NPSHa = 38; isosurface of group 1 and group 7.
Energies 18 04059 g003
Figure 4. Group 1 to group 6: NPSHa = 33 and isosurface.
Energies 18 04059 g004
Figure 5. Group 2, 5, and 6: NPSHa = 29 and isosurface.
Energies 18 04059 g005
Figure 6. Cavitation volume distribution of leaves with NPSHa = 38 for group 1 and group 7.
Energies 18 04059 g006
Figure 7. Pressure distribution cloud diagram for inducer blades of group 1 and group 7; NPSHa = 38 angle.
Energies 18 04059 g007
Figure 8. Curve distribution diagram for inducer blades of group 1 and group 7.
Energies 18 04059 g008aEnergies 18 04059 g008b
Figure 9. NPSHa = 33; isosurface distribution map of group 1, group 2, and group 3.
Energies 18 04059 g009
Figure 10. Cavitation volume distribution of NPSHa = 33 leaves in group 1, group 2, and group 3.
Energies 18 04059 g010
Figure 11. Group 1, group 4, and group 6: NPSHa = 33 and induction rotation line.
Energies 18 04059 g011
Figure 12. Distribution of cavitation volume in leaves with NPSHa = 33 in group 1, group 4, and group 6.
Energies 18 04059 g012
Figure 13. Development process of induced wheel cavitation in group 1.
Energies 18 04059 g013
Figure 14. Curve distribution for the development process of induced wheel cavitation in group 1.
Energies 18 04059 g014
Table 1. Main physical properties of liquefied natural gas.
Physical ParametersLiquidGas
Temperature−163 °C−163 °C
Molar mass (g/mol)17.024616.0436
Pressure (MPa)0.0840.084
Density (kg/m3)442.21.6598
Dynamic viscosity (Pa s)13.5643.45
Table 2. Inducer orthogonal optimization factor level table.
FactorsLevel 1Level 2Level 3
Number of blades, Z23
Inlet angle, β y 1 +2°−2°±0°
Outlet angle, β y 2 +2°−2°±0°
Blade wrap angle, φ+5°−5°±0°
Table 3. Inducer orthogonal test plan table.
SampleZ β y 1 β y 2 φ
12±0°±0°±0°
22−2°+2°−5°
32+2°−2°+5°
42±0°+2°+5°
52−2°−2°±0°
62+2°±0°−5°
73±0°−2°−5°
83−2°±0°+5°
93+2°+2°±0°
Table 4. Current components’ mesh details.
Flow-Through PartsNumber of ElementsNumber of NodesMinimum Mesh QualityAverage Mesh Quality
Inlet section106,30720,8500.3130.837
Inducer1,213,646224,1190.1780.834
Impeller387,88376,1570.2310.833
Guide vane771,208150,4280.2120.834
Outlet section666,537129,1930.2540.837
Table 5. Orthogonal optimization simulation results.
TestHead
H/m
Efficiency
η/%
Critical Cavitation Margin NPSHr/m
1184.40083.4035.95
2184.87383.4729.04
3182.13983.6035.96
4183.66182.9535.03
5183.52983.1731.35
6185.22683.2630.19
7185.66982.0244.03
8184.49481.5044.25
9184.22481.7846.33
Disclaimer/Publisher’s Note: The statements, opinions and data contained in all publications are solely those of the individual author(s) and contributor(s) and not of MDPI and/or the editor(s). MDPI and/or the editor(s) disclaim responsibility for any injury to people or property resulting from any ideas, methods, instructions or products referred to in the content.

