1. Introduction
Transportation systems play an important role in today’s society as they enable the efficient movement of goods, people, and critical resources on a global scale. However, as the complexity and capacity of these systems increases, so does the likelihood and potential severity of accidents.
Despite the energy transition, the world is still energy-dependent on oil and gas. This means that with the growing global demand for energy resources, a thorough investigation and analysis of accidents that occur in oil and gas transportation systems is essential to inform policy, improve system safety and mitigate future risks.
1.1. The Development of Oil and Gas Pipeline Systems Worldwide from a Safety Perspective
The first commercial oil pipeline systems date back to the 19th century, when pioneer pipelines were built in the United States (Texas) to transport crude oil from the oil fields to refineries and ports. Among the project pioneers was the Second Transcontinental Pipeline System (“Big Inch” 24-inch and “Little Big Inch” 20-inch), which was built for military purposes during World War II and connected Texas to the East Coast of the United States. The Texas Eastern Transmission Corporation purchased the pipelines in 1947, marking the beginning of their use as an important part of America’s energy infrastructure [
1].
The development of oil and gas transportation through pipelines accelerated in the 20th century in parallel with the increase in fuel demand. The Marshall Plan and the establishment of the European Coal and Steel Community (ECSC) encouraged the development of European energy infrastructure [
2], while new pipe welding techniques and the use of advanced materials such as high-strength steels, polyethylene, and composites, made it possible to build longer and more reliable pipelines. As a result, the pipeline construction increased rapidly across Europe, especially after the discovery of large oil fields in Romania and the Soviet Union. Initially, the development of the European gas system focused on domestic gas fields in southern France, northern Italy, Germany, and Romania [
3]. In the 1970s and 1980s, the development of oil and gas pipelines accelerated in response to the energy crisis and the growing demand for energy. The first large (56 in; 4500 km) transcontinental gas pipeline, the “Bratstvo”, was commissioned in 1983, being crucial for supplying Western Europe with natural gas from the Soviet Union and thus an important element of Cold War geopolitics [
4]. Construction of important gas pipelines, such as “Trans-Austria Gas” (36–48 in; 380 km) [
5], and the “Trans-Mediterranean Pipeline” (48 in; 2475 km), which connects North Africa with Europe, made it possible to diversify energy sources and reduce dependence on one supplier [
6]. The 1990s and early 2000s show decisive changes in the development of the European oil and gas pipeline infrastructure, led by the liberalization of energy markets, the geopolitical restructuring following the collapse of the Soviet Union, and the strengthening of energy integration within the EU. In recent decades, Europe continued to expand its oil and gas pipeline network, focusing on security of supply and reducing greenhouse gas emissions. Projects such as the “Nord Stream gas pipeline” (48 in; 1224 km) and the “Southern Gas Corridor” (36–56 in; 3500 km) are modern examples of energy infrastructure investments connecting Europe with various energy sources, including Russia, the Caspian region, and the Middle East [
7,
8]. The total length of active oil and gas pipelines in Europe amounted to 202,685 km at the beginning of 2023 [
9].
In the United States, there are more than 480,000 km of pipelines for the gathering and transport of natural gas and 3.5 million kilometres for distribution to end users (households, industry, and other business entities). Natural gas is transported almost exclusively by pipeline, while more than 90% of transported crude oil and refined petroleum products also use pipelines at some stage of transport [
10].
Today, as in the rest of the world, the most important pipeline systems for the transport of oil and gas include the Trans-Alaska, Keystone, and Baku–Tbilisi–Ceyhan (BTC) oil pipelines as well as the Nord Stream and Yamal–Europe gas pipelines. These infrastructure systems enable the strategic transport of energy between different countries and regions.
However, the expansion of pipeline systems led to a greater focus on safety. A series of major environmental incidents caused by oil spills raised awareness of stricter regulations, safety protocols, and controls to reduce the risks associated with oil and gas transport. As early as the 1960s, the American Petroleum Institute (API) issued the API RP 1104 Welding Pipelines and Related Facilities Standard [
11], followed by the API RP 1110-Recommended Practise for the Pressure Testing of Liquid Petroleum Pipelines in the 1970s [
12]. At the same time, the American Society of Mechanical Engineers (ASME) established ASME B31.4 and B31.8 standards governing the design, construction, and maintenance of liquid hydrocarbon and gas pipelines [
13]. To enforce pipeline safety regulations, the US Congress established the Office of Pipeline Safety in 1968, which today operates under the Pipeline and Hazardous Materials Safety Administration (PHMSA) [
13,
14]. Further steps included the first Natural Gas Pipeline Safety Act, which was passed in 1968 and later expanded to include liquids pipelines. Finally, the Pipeline Safety Act was passed in 1979, but there were also several other laws that impacted pipeline safety, such as the Clean Air Act from 1970 and the Clean Water Act from 1972 [
14]. The basic regulations introduced in the 1960s became increasingly stringent in the 1970s and 1980s. The industry began to pay more attention to pipeline integrity, including corrosion protection.
In addition to the PHMSA federal regulations, the technical standards developed by API and the Association of Oil Pipelines (AOPL) have an important role in pipeline safety. Although these standards are not legally binding, PHMSA often incorporates them into its regulations, making them part of a mandatory safety framework. API RP 1160 (2001–2019) [
15] establishes procedures for pipeline integrity management, including detailed assessments of potential risks. API 1104 (1964–2021) [
11] specifies requirements for welding, while API RP 1130 (2007–2022) [
16] addresses computerised leak detection in liquid pipelines.
At the same time, the safety of the transport of oil and gas pipelines in the European Union is regulated by several laws. In this context, Directive (EU) 2013/30 on the safety of offshore oil and gas operations [
17] and Regulation (EU) 2017/1938 concerning measures to safeguard the security of gas supply [
18] should be mentioned. One of the most recent initiatives is Directive (EU) 2022/2555 on measures for a high common level of cybersecurity across the Union [
19]. Among other things, it ensures that oil and gas pipelines, as important parts of the energy infrastructure, are protected against cyber threats and can maintain their operational security and resilience in the event of incidents.
1.2. Measures to Maintain the Integrity of Pipelines
Maintaining the integrity of pipelines is critical to safety and reliability in the oil and gas industry. Integrity is maintained through the application of technical and operational measures that include the prevention, detection, and mitigation of accidents. The aim of these measures is to reduce the risk of accidents and avoid or mitigate environmental and economic consequences. In practise, they are implemented through careful planning and selection of materials, systematic maintenance, constant monitoring, and emergency preparedness.
Preventive measures are aimed at preventing damage to pipelines. These include good design, selection of materials, installation of safety valves, regular maintenance of infrastructure, and on-site inspections. While on-site inspections are reliable, they are often time-consuming and limited by inaccessible terrain. Aerial inspections using aeroplanes and drones as well as legally required ground patrols are also common practise [
20].
Modern technologies are becoming increasingly important. Synthetic aperture radar (SAR) [
21,
22,
23] enables monitoring of ground deformations regardless of weather conditions, which is useful for detecting displacements caused by seismic activity, landslides, or erosion, while geographical information systems (GIS) combine and analyse data from different sources [
24,
25], enabling better risk assessment and management of pipeline routes. Pipeline maintenance includes mechanical cleaning with so-called pipeline inspection gauges/pipeline intervention gadgets (“pigs”), which remove impurities and enable inspection of the pipe interior [
26,
27,
28,
29].
The most important protection against corrosion is external coatings, which are required by law for buried or submerged pipelines. Over the last 30 years, the technology for coating pipelines developed considerably. Traditional coating systems (coal tar enamel, asphalt, and single and double-layer polyethylene coatings) have been replaced by coatings such as single and double-layer fusion bonded epoxy resins and three-layer polyolefins [
30]. Cathodic protection is also an important measure to protect against corrosion and operate by imparting a direct current onto the buried pipeline, using devices called rectifiers [
31]. Mechanical dampers and flexible couplings are used to control vibrations, and water hammers and advanced rubber compounds with better adaptability are used in more demanding conditions [
32,
33,
34,
35].
The detection of pipeline damage and leaks is based on a combination of traditional and advanced methods. In addition to aerial and ground inspections, supervisory control and data acquisition (SCADA) systems are increasingly being used to enable 24 h real-time monitoring of the pressure, flow, and temperature of the media in the pipeline [
36]. Callipers are used to detect deformations and enable the exact location of damage to be determined via GPS. Electromagnetic methods, such as using the magnetic flux leakage tool (MFL), detect defects caused by corrosion and cracks by analysing changes in magnetic flux, and machine learning algorithms are used for additional accuracy [
20,
37]. With the development of technology, methods emerged that utilise the Hall effect, magneto-sensitive sensors, fluxgate sensors, optical methods, and superconducting quantum interference devices (SQUID). Ultrasonic technology enables very precise measurement of the wall thickness of pipelines and the detection of internal defects. Inspection technologies are advancing towards higher resolution, precision, and positioning accuracy, supported by GPS, automated speed control, and orientation systems. Advances in computing and image processing will enhance detection accuracy. Future developments include integration of ultrasonic testing, high-definition three-axis MFL detectors, dual-field MFL technology, robotic inspection tools for low-pressure pipelines, UAV-assisted positioning, and increasingly intelligent expert systems with self-learning capabilities for better problem-solving [
38]. The latest systems, such as Atmos Pipe and Atmos Eclipse, combine data from different sensors and use sophisticated algorithms to detect leaks at early stage. Fibre optics enable the continuous measurement of temperature and acoustic signals along the pipeline, enabling very precise leak detection, even in the most difficult terrain. Atmos Eclipse is also characterised by its quick installation without drilling holes or welding and its ability to operate autonomously in remote areas [
39].
Mitigation measures are crucial to ensure a quick and efficient response in the event of an accident. The first step is to have access to safety data sheets containing information on the properties and hazards of the substances transported through pipelines. Staff must be trained to carry out emergency operations, while the obligation to call in authorised emergency services is also required by law. There are several guidelines, such as the Pipeline Emergency Response Guidelines published by the Pipeline Association for Public Awareness (PAPA), to prepare responders to safely and effectively respond to an underground or aboveground pipeline incident [
40].
1.3. An Overview of Other Recent Research That Contribute to the Associated Risks, Failure Mechanisms, and Prevention Strategies
Although considerable progress has been made, the safety of oil and gas pipelines remains a highly topical issue and there are numerous published research papers dealing with the tracking of pipeline accidents. Numerous researchers and institutions continue to make important contributions to the scientific understanding of the associated risks, failure mechanisms, and prevention strategies. As technical improvements and greater corporate awareness led to a change in the frequency and nature of accidents, this review focussed on more recent publications to ensure relevance.
Khan et al. [
41] examined how pipeline safety management evolved over the last decades, from simple visual inspections to advanced, risk-based systems that utilise real-time data. The study focuses on the last twenty years and looks at the key issues surrounding integrity management, how risk is part of it, what methods are used, and how Industry 4.0 will shape the future. Chen et al. [
42] conducted a systematic bibliometric analysis on oil and pipeline safety to identify trends and future needs in this area. They examined 598 publications from the Web of Science database between 1970 and 2019. Risk assessment, leakage, and corrosion were the main topics in this research area, selecting fuzzy theory and the Bayesian network as the main research methods. The development of risk management systems in oil and gas pipeline projects, especially in countries with insecure environments and low safety standards, was a topic of the study by Kraidi et al. [
43]. They emphasise that the lack of information about the causes of failures and limited knowledge about safety make risk management difficult. The authors used a document analysis and a survey of industry stakeholders to identify and evaluate risk factors (RF) and risk mitigation methods (RMM). The results, which were processed using fuzzy logic, show that terrorism, corruption, and unsafe areas are the biggest risks.
The safety of pipelines has been a topic of research for various institutions as well. Rutgers University and West Virginia University collaborated to identify research, development and training needs for oil and gas pipeline safety, and produced a comprehensive report on the topic [
44]. With a similar objective, The Pipeline and Hazardous Materials Safety Administration (PHMSA) published the Pipeline Safety R&D Update Report, which focuses on the development of advanced leak detection technologies and the importance of infrastructure integrity [
45].
Some of the authors focussed on specific causes of accidents. Yu, J. et al. [
46], for example, focused on safety analysis and emergency response strategies for suspended oil and gas pipelines affected by natural disasters. They analysed the safety of suspended oil and gas pipelines using a nonlinear finite element method, investigated how factors such as the length of the suspended pipeline and pressure affect pipeline failure, and proposed a contingency plan based on the plastic strain values.
There are more research papers that deal with safety methods for recognising accidents. For example, Korlapati et al. [
47] analysed various methods for detecting leaks in pipelines and provided insights into their effectiveness, applications, advantages, and limitations.
Some authors also examined how new trends such as digitalisation, smart technologies, and the shift to low-carbon energy are changing oil and gas pipeline systems. While new technologies are helping to reduce costs, they are also creating safety concerns [
48].
Some contribution to the literature review was made by Woldesellasse and Tesfamariam [
49], who examined how researchers approached the problem of pipeline safety over the past four decades, focussing on the assessment and management of oil and gas pipelines risk. The focus has been on predicting when and how pipelines might fail, often using advanced tools such as fuzzy logic, Bayesian networks, and simulation methods. However, the study points to a gap: less effort has been made to analyse what happens after a failure, such as environmental damage or financial losses. Furthermore, the study shows that the most influential research comes from institutions in China, Canada, and the United States. The authors suggest that more attention should be paid to understanding the consequences of failures in the future and that modern technologies such as GIS and machine learning could help to improve the management of pipeline risks.
Accidents in oil and gas transportation systems can cause catastrophic damage. It is therefore important to understand their causes, frequency, and patterns in order to improve prevention and safety standards. Relying on the database is a logical way forward. Pipeline incident databases collect detailed information on operating conditions, causes, and consequences. Currently, there are several different databases that collect information on accidents in oil and gas transport systems, each of them using different methodologies, classification criteria, levels of detail, and geographical areas. As there is no standardised and consistent source of Information, it is difficult to fully understand the problem and compare results across regions or time periods. The challenges posed by different reporting criteria in different regions require standardised data collection. Although some studies consider different data sources, such as the study by Halim et al. [
50], which analyses incident data from three different regional databases (PHMSA, Canada National Energy Board (NEB), and EGIG) to examine how incidents are classified and to show dependencies between background, underlying, and direct causes, most of them rely on one data source and focus on isolated factors and neglect how multiple causes interact to lead to failure. Alves and Lima [
51] published a paper proposing the establishment of a database on pipeline incidents in Brazil. Based on an analysis of international standards and a survey of 180 experts, they defined the architecture for data collection and demonstrated its application by analysing root causes and protective measures.
Most previous work uses individual databases (e.g., PHMSA or EGIG) for the statistical analysis of oil and gas transport systems, but rarely provides a systematic comparison of multiple databases in terms of methodology, coverage, definitions, and level of detail. The frequency and causes of failures vary greatly from region to region and result from a combination of factors, such as the age of the infrastructure, geological and climatic conditions, the extent of maintenance, the technical standards applied, geopolitical stability, and institutional control.
For these reasons, this research focuses on the most important databases of various national and international organisations, such as the European Gas Pipeline Accident Data Group (EGIG), Conservation of Clean Air and Water in Europe (CONCAWE), eNatech, Transport Safety Board of Canada (TSB), Pipeline and Hazardous Materials Safety Administration (PHMSA), and the National Response Centre. These platforms provide information on previous accidents that can be used to identify causes, but also to recognise trends in accidents and draw conclusions about cause-and-effect relationships.
The main objective of this review was to provide an overview of the available databases and the information they contain and, furthermore, to perform a qualitative analysis of the causes of accidents in the pipeline systems by integrating their contents. Therefore, this paper provides an integrated qualitative analysis of the causes of accidents, their interrelationships, and the context in which they occur. The main contribution is the synthesis of data from several databases and a comprehensive overview of their content, i.e., their structure, the type of data they contain, and their potential applicability for future research and practical use in the field.
By analysing the statistical data from the databases of the different regions, the existing differences in practise and awareness can be revealed. This means that a comparative approach based on analysing statistical data from different databases will shed light on which practises and conditions contribute to higher system reliability and which pose risks, which is crucial for future energy infrastructure planning policy.
3. Systematic Analysis of the Data Available in Databases
The systematic collection of accident data has been carried out by various organisations worldwide for many years, so that the data collected in this way form the basis for the development of prevention strategies and the improvement of safety standards. The integration of historical data helps to make decisions in the area of risk management, which is crucial for industrial safety.
3.1. eNatech Database
The European Union maintains the eNatech database via the “Europa.eu” portal [
52] as a central instrument for collecting and analysing data on so-called “natech accidents”, i.e., technical accidents caused by natural disasters [
52,
53]. Systematic research into “natech” events began in the late 1970s and has become increasingly important as the number of such accidents has risen worldwide. Initial effort focussed primarily on earthquakes as the main cause of natech events. Later, research expanded to include hydrometeorological hazards such as floods, storms, and cyclones, as well as complex multi-hazards and cross-sectoral issues, allowing for a deeper understanding of the complexity of “natech” risks. The eNatech database currently contains 13 cases of pipeline accidents recorded between 1979 and 2023. Analysis of these cases shows that the most common cause of accidents was landslides (61.5%), which resulted in damage to infrastructure, including the release of hazardous substances into the environment and other related accidents, followed by earthquakes (23.1%), lightning (7.7%), and flooding (7.7%).
3.2. European Gas Pipeline Accident Data Group (EGIG)
The European Gas Pipeline Accident Data Group (EGIG) [
54] was founded in 1982, and today, it collects on yearly basis data from 19 network operators. The criteria for the accident data concerns the material (the pipeline is made of steel), the operating pressure (more than 15 bar), and the location (onshore pipelines located outside the gas facilities). The accidents must lead to an unintentional release of gas into the environment. Although the information entered into the database itself is not publicly accessible, the analysis reports regularly published by EGIG contain statistical data since 1970, as well as histograms on trends in transport systems, the frequency of failures, and the consequences of accidents. The causes of accidents are divided into six categories: “External interference”, “Corrosion”, “Construction defect”/material failure”, “Hot tap made by error”, “Ground movement”, and “Other and unknown”. Accidents caused by landslides, floods, and erosion are included in the landslide category, which also covers accidents caused by other landslide-leading factors, such as the exploitation of mineral resources and the bursting of dams. Lightning is included in the “Other/unknown” category [
55].
Over the observed period of just over fifty years, a continuous expansion of the gas transport infrastructure can be observed, from 18,000 km of pipelines in 1970 to around 150,000 km of pipelines in 2022 (
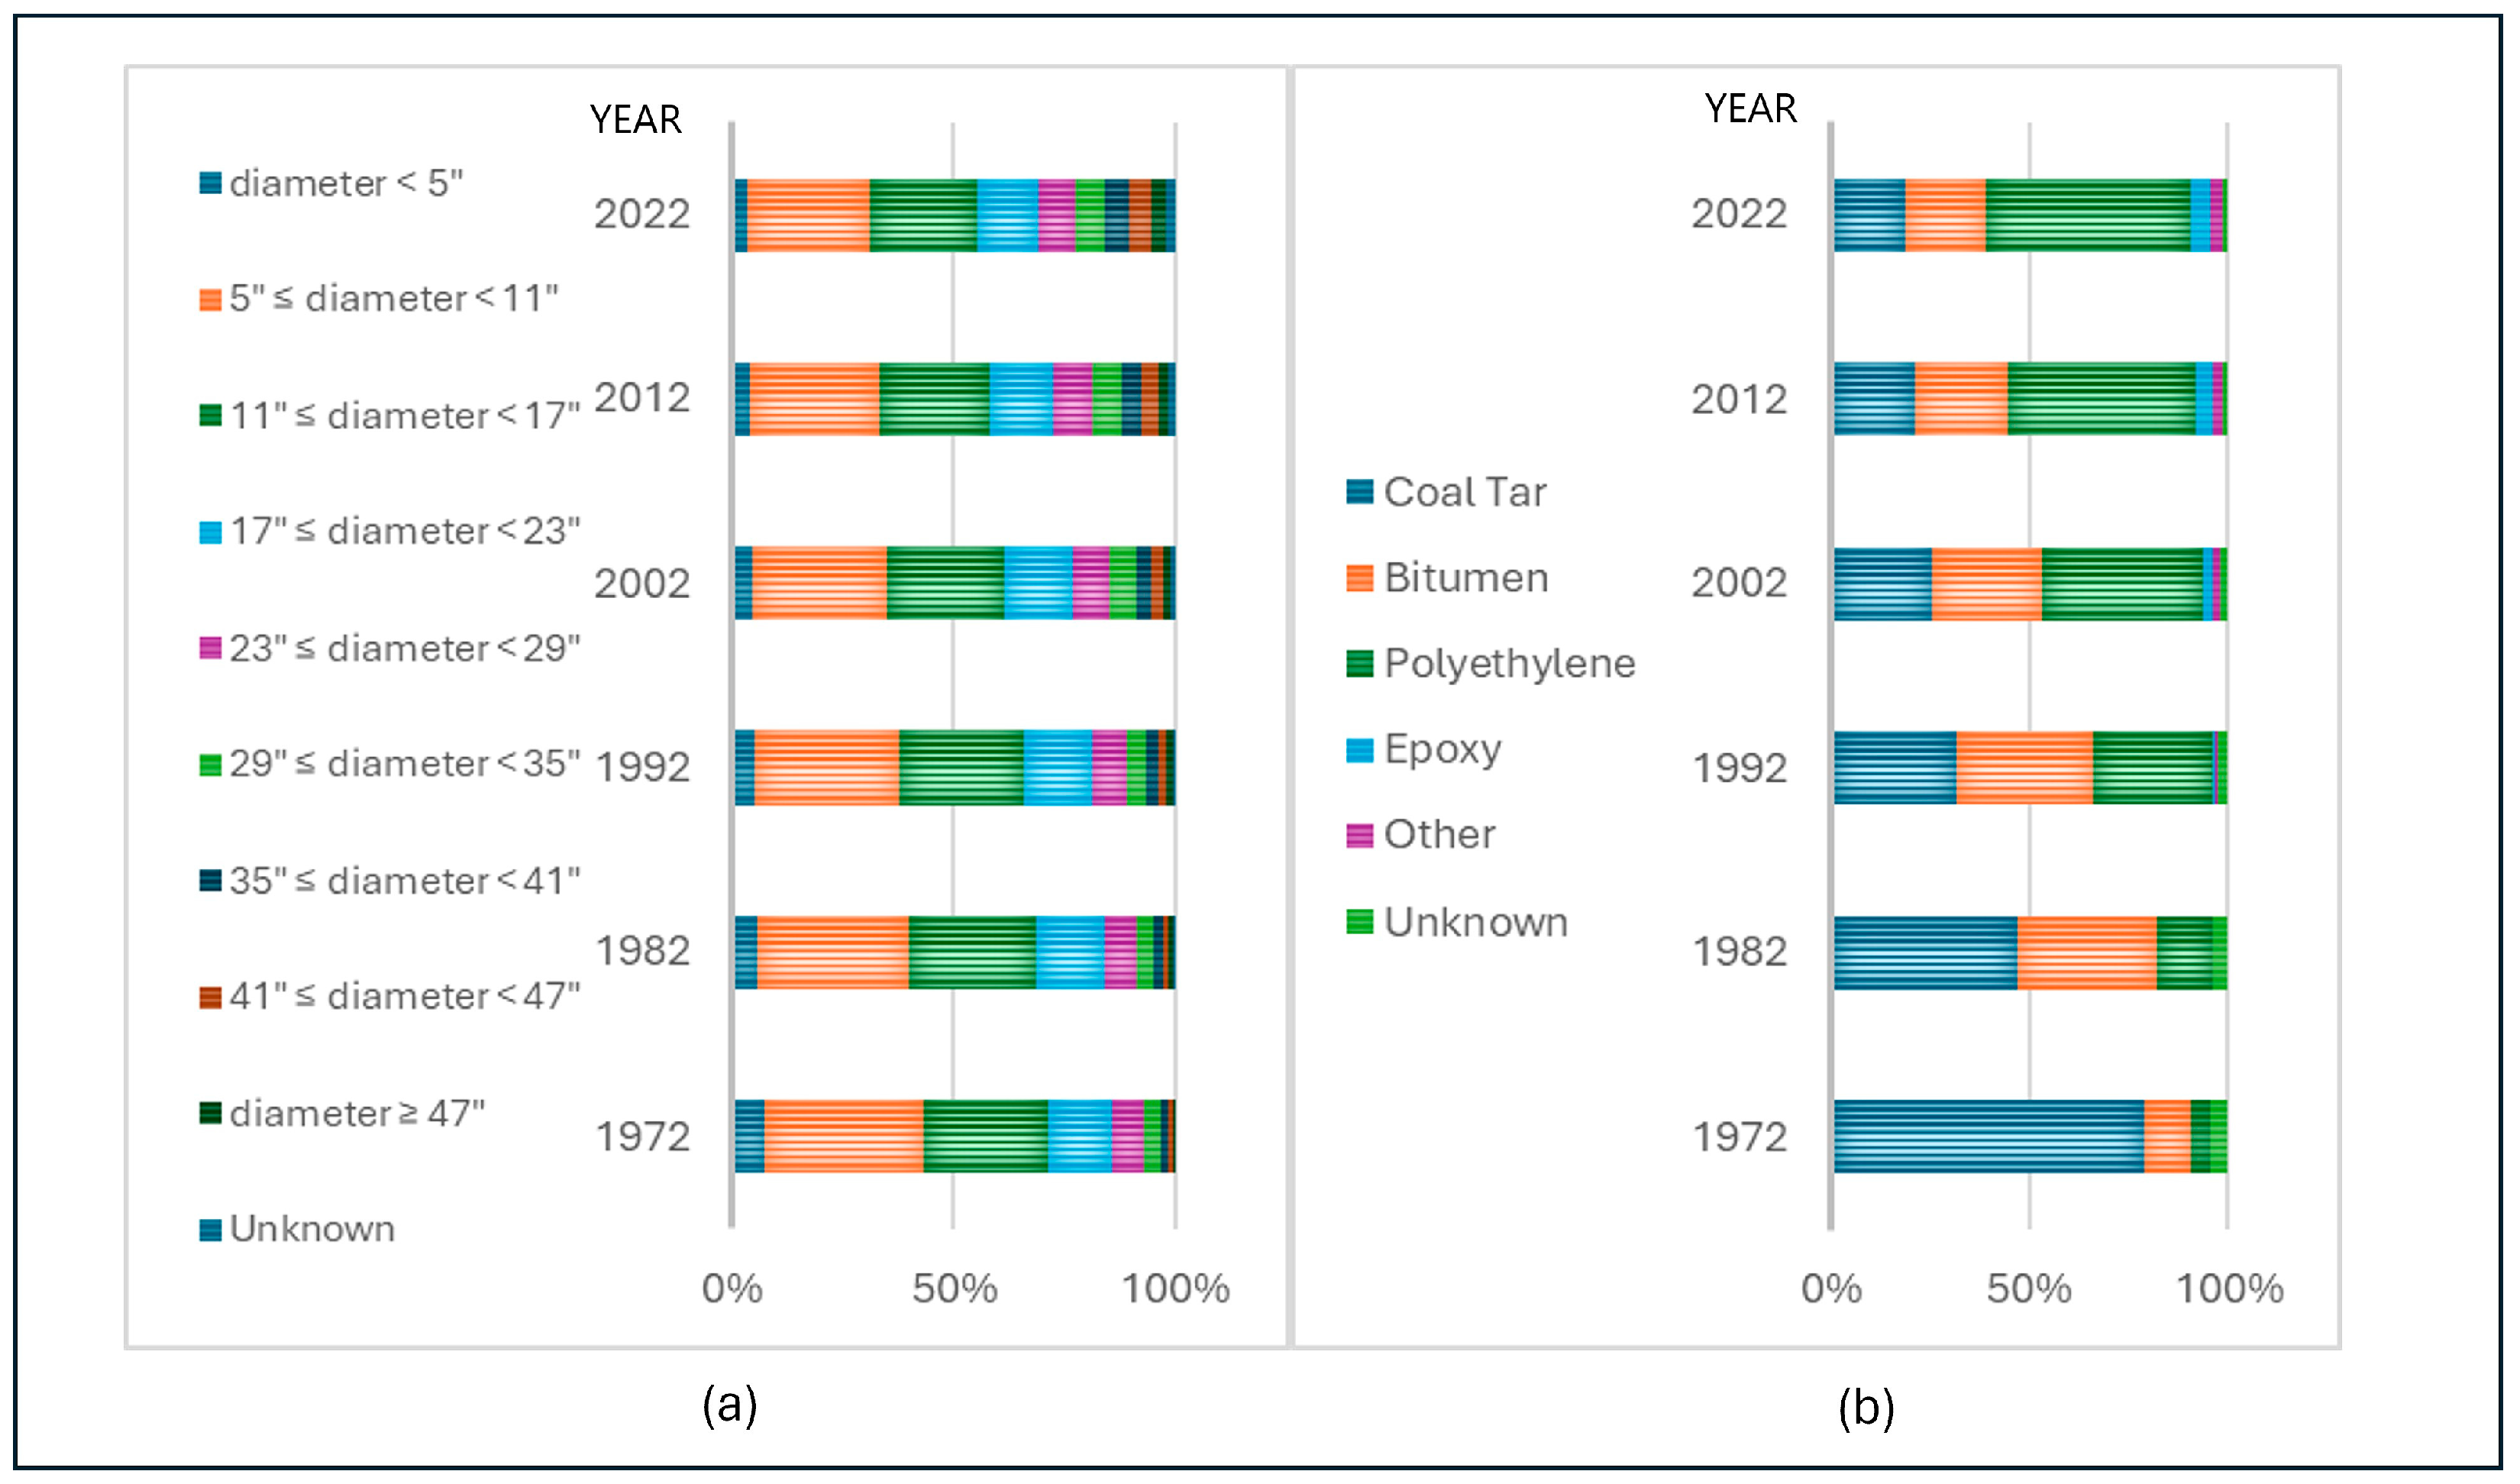
Figure 1). The pipeline classes with diameters from 127 mm to 432 mm (5″–17″) are still the most used (
Figure 2a), with tar, bitumen, and polyethylene being the most commonly applied coatings (today polyethylene is clearly dominating) (
Figure 2b). The EGIG database is organised according to the corresponding material quality classes of the API 5L standard [
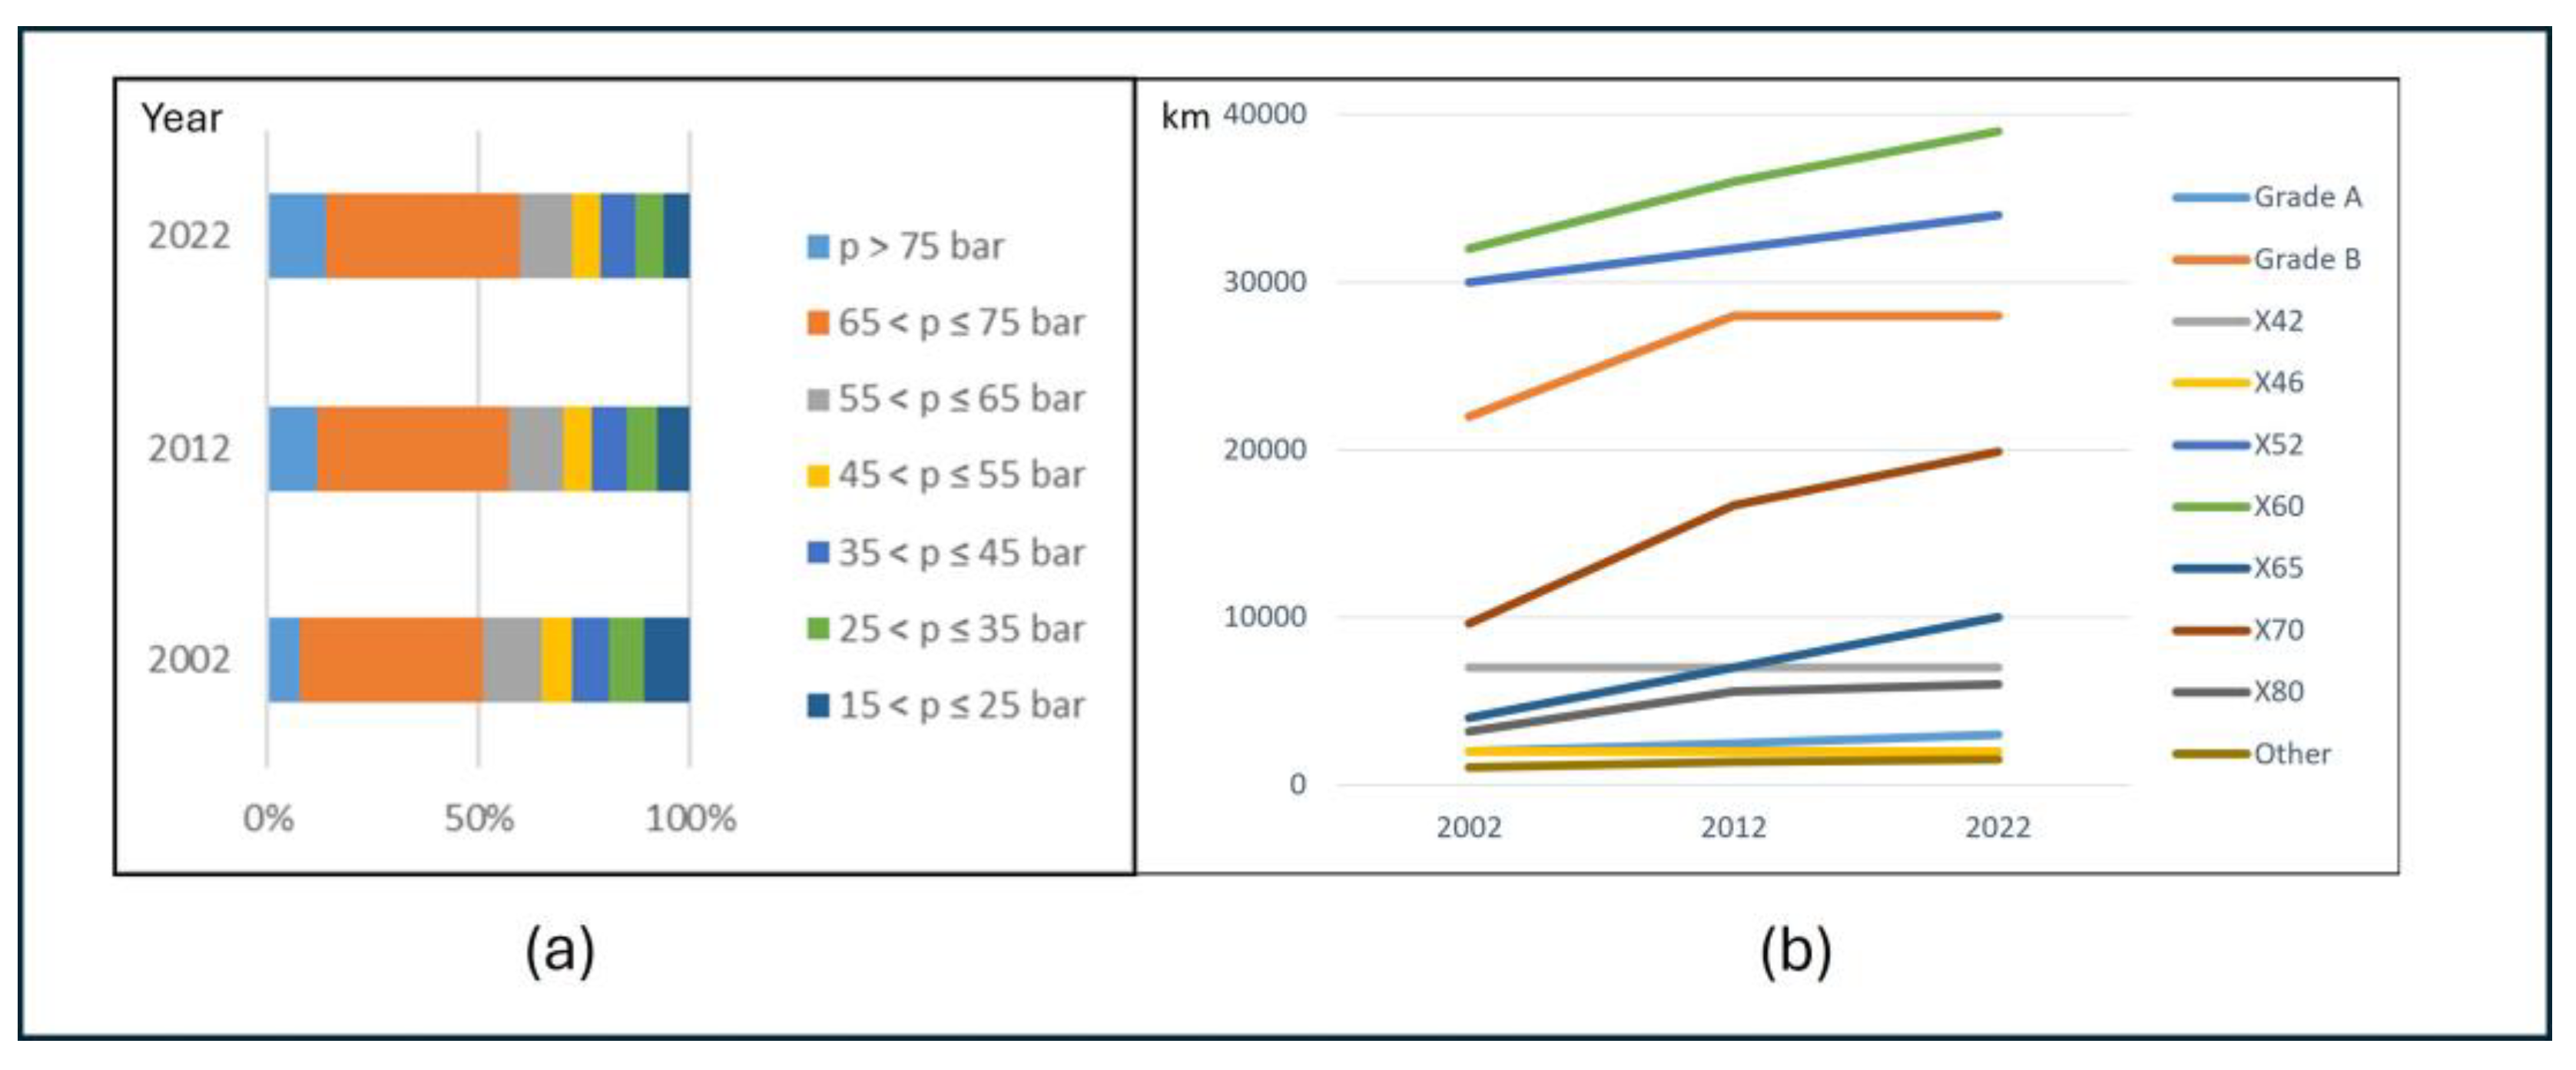
56]. The API 5L standard defines several steel pipe grades based on minimum tensile strength and minimum yield strength. Grade A, which was used for older pipelines, has a relatively lower yield strength and tensile strength compared to the other grades. Grade B is still used for new pipelines, especially those with smaller diameters. Today, steel grades X60, X52, grade B, and X70 are most commonly used for the construction of gas pipelines (
Figure 3a), while the operating pressure of more than 45% of gas pipelines is between 65 and 75 bar. The increase in the number of gas pipelines with a higher pressure (over 65 bar) is particularly striking (
Figure 3b).
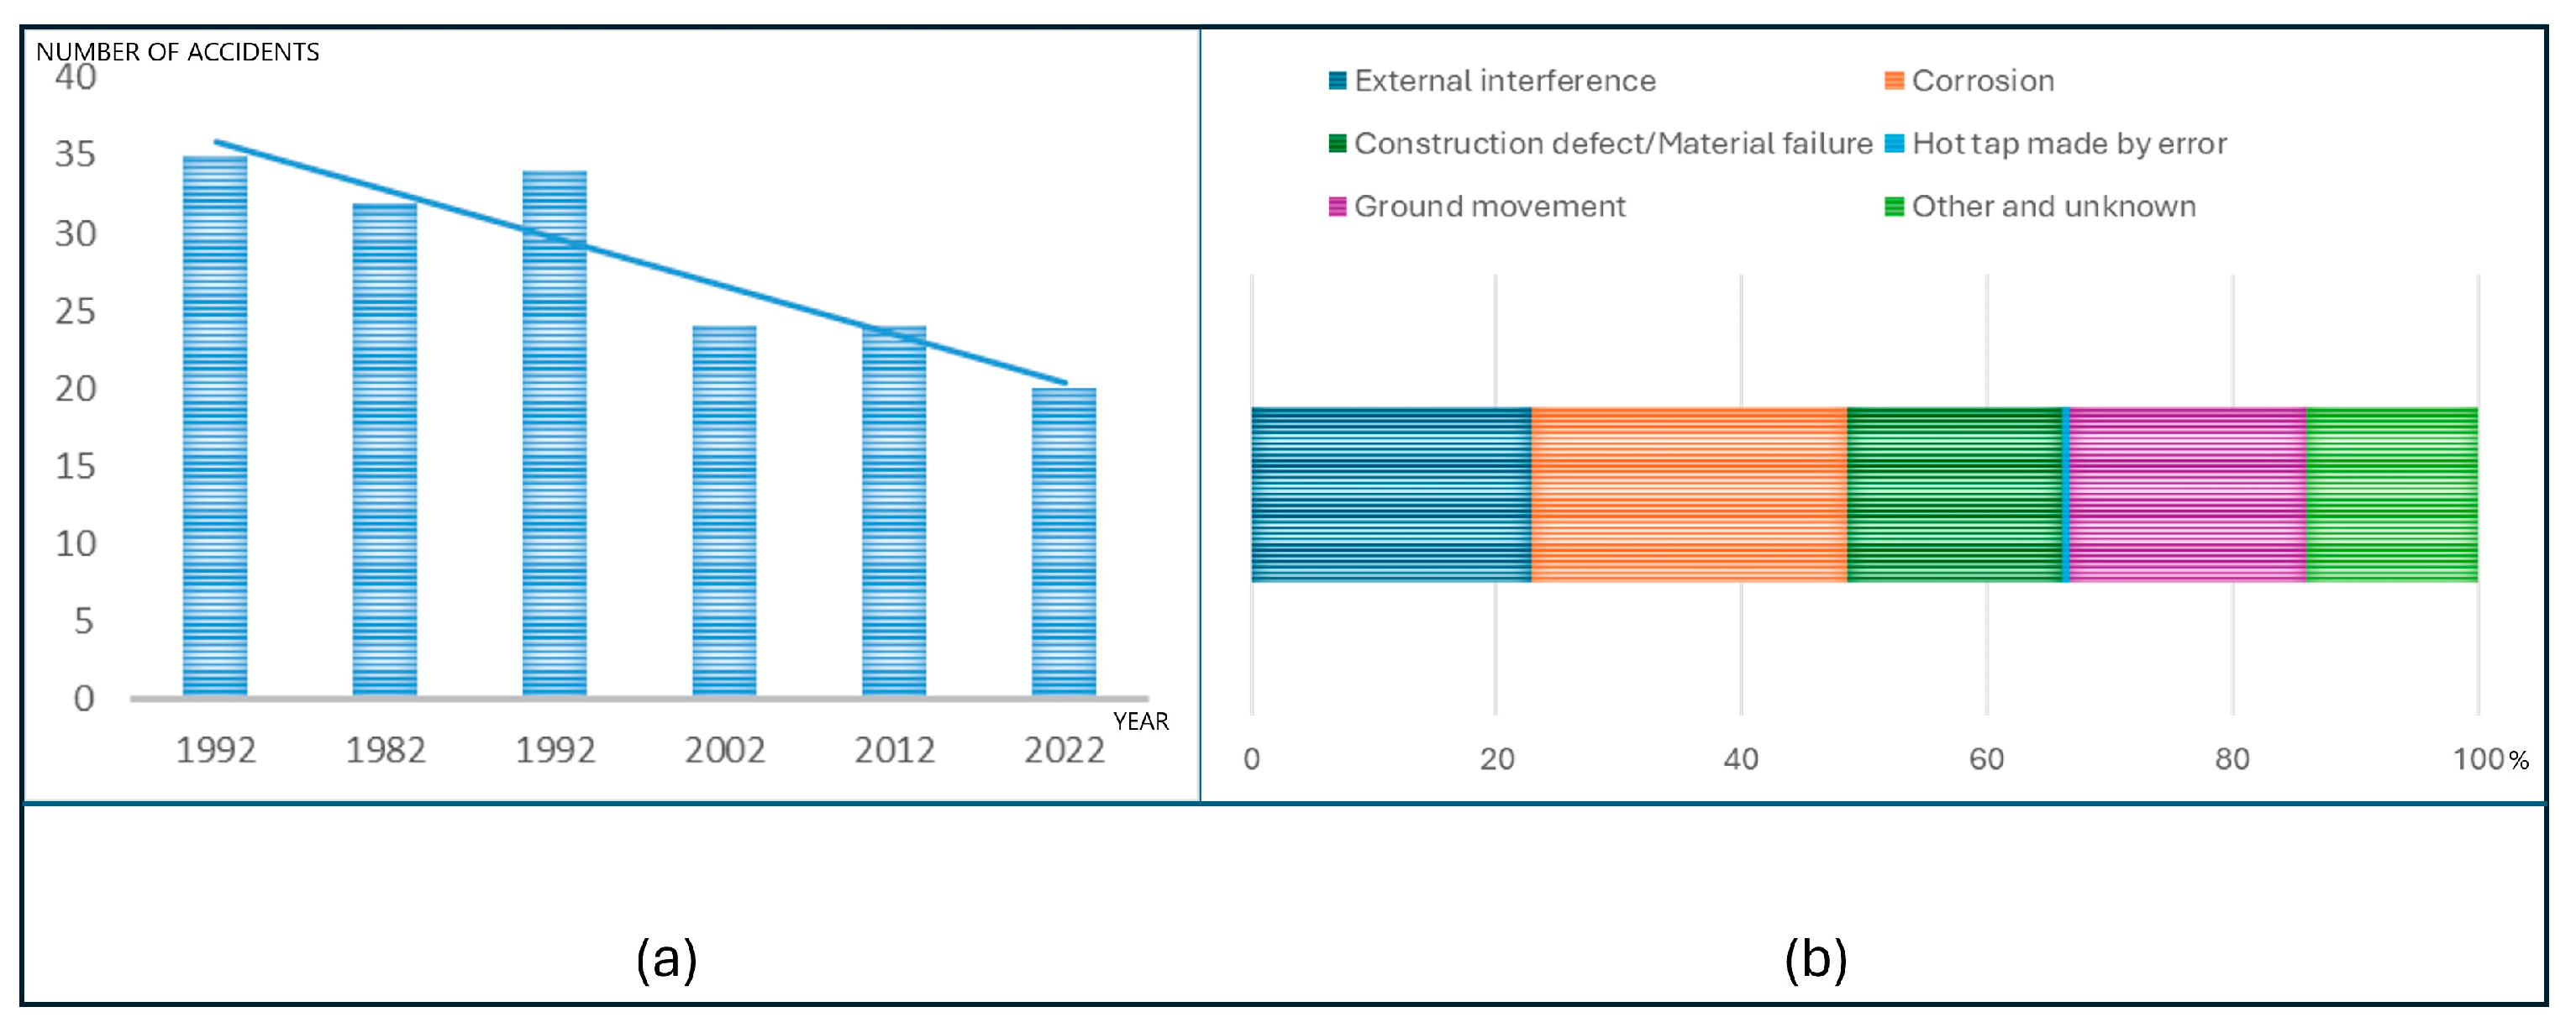
In the period from 1970 to 2022, 1463 accidents involving gas pipelines were recorded in the EGIG database (
Figure 4a). In the last ten years, the most common causes of incidents were corrosion (25.7%), external influences (22.8%), ground movement (19.3%), and construction defects (17.5%) (
Figure 4b) [
55].
The accident frequency is calculated by dividing the number of accidents by the exposure. The EGIG report specifies two types of accident frequency, “primary” and “secondary”, which refer to the concepts of total and partial exposure. The total exposure reflects the length of the pipeline and its operating time (5.29 million km· year), while the partial system exposures are the exposure values calculated per class of a certain design parameter (e.g., diameter or the year of construction).
The primary failure frequency over the entire period decreased from 0.875 per 1000 km· year in 1970 to 0.277 per 1000 km· year in 2022. The secondary failure frequency is calculated by dividing the number of incidents by a partial system exposure. This helps to assess how design parameters influence failure rates by cause and leak size. The calculations in the report included the entire database and data from 2013 to 2022. The frequencies for six causes were analysed by design parameters such as diameter, wall thickness, coating, and year of construction [
55].
Ruptures occurred mainly in smaller-diameter pipelines, i.e., frequency of failure decreases with increasing diameter. Large-diameter pipelines are less prone to external interference than smaller ones, probably due to greater wall thickness, lower presence in urban areas, and lower risk during earthworks. The depth of cover has a strong influence on the frequency of failure, which decreased over time but remained constant over the last decade [
55].
The frequency of failure decreases with the newer years of construction. New pipelines are less prone to construction defects due to technical improvements. Thinner walls fail earlier, while thicker walls allow more time for detection. Thicker walls have also reduced failure rates as no incidents have been recorded with wall thicknesses over 20 mm. No corrosion incidents were recorded for wall thicknesses over 15 mm. Pitting is the most common form of corrosion. Almost all corrosion incidents involving pitting occur on the outer surface of the pipelines. Corrosion in the form of cracks is the second most common form of corrosion. These cracks are found on both the inner and outer surfaces of the pipelines. Polythene-coated pipelines have significantly lower failure rates than other coatings. Nowadays, most transmission system operators use coatings such as polyethylene [
54].
In addition, EGIG analysed injuries and fatalities from pipeline incidents in four groups: gas company employees, third parties causing incidents, emergency services, and the general public. Of the 1463 incidents in the database, only a small percentage resulted in injuries (about 1%) or fatalities (0.7%) [
55].
3.3. CONCAWE Database
The pipeline management group the CONservation of Clean Air and Water in Europe (CONCAWE) [
57] was founded in 1963 and since then has been collecting information and statistics on incidents and spills related to European cross-country oil pipelines. Similar to the EGIG database, the CONCAWE database is not publicly accessible. However, low-resolution information is available in the annual reports that CONCAWE published continuously since 1971, without specifying the exact events. The CONCAWE database records accidents on pipelines and international oil pipelines that are used to transport crude oil or oil derivatives and are at least two kilometres long. The database excludes subsea pipeline systems, terminals, and storage tanks, but it includes pumping stations and buffer storage facilities. Although only accidents involving spills of more than 1 m
3 of hydrocarbons are included in the database, incidents involving smaller spills are also reported if they have a significant impact on safety or the environment.
CONCAWE’s latest annual report [
58] lists a total of 35,307 km of pipelines for the transport of crude oil and refined products in Europe, operated by 68 organisations (companies and agencies). The CONCAWE report divides the pipelines into categories: “Crude pipelines” (used to transport crude oil), “Hot pipelines” (heavy fuels, lubricants, waxes, and other more viscous fluids that may become too viscous for efficient transport at lower temperatures), and “Products pipelines”, used to transport various petroleum products. The diameters of crude oil pipelines are noticeably larger than the diameters of “hot” pipelines and product pipelines. Almost 90% of crude oil pipelines have a nominal diameter ≥ 400 mm (DN 400, 16 in), about 85% of product pipelines have a nominal diameter of less than 400 mm (DN400, 16 in), and over 80% of “hot” pipelines have a diameter of less than 600 mm (DN 600, 24 in). Pipelines for the transport of crude oil and refined products make up the largest part of the European oil pipeline network. The 278 pipeline sections (11,848 km) have been decommissioned since 1971 [
58].
As per the report, the average age of a pipeline system is 40 years, which poses numerous challenges in terms of maintenance and safety. In more than a half century of reporting to the CONCAWE database, five pipeline accidents (1975, 1979, 1989, 1996, and 1999) resulted in a total of 14 fatalities. Most of the fatalities occurred due to fires following the release of transported hazardous substances. In addition, a total of 789 accidents involving spilled substances were recorded. The causes of spills are traditionally divided into five categories: “Mechanical failure” (Design and Materials subcategories), “Operational causes” (System and Human subcategories); “Corrosion” (Internal, External, and Stress corrosion cracking subcategories); “Natural disasters” (Ground movement and Other subcategories); and “Acts of third parties” (Accidental, Incidental, and Intentional subcategories). The number of releases per unit length of pipeline shows that the 5-year moving average of release frequency has fallen from around 1.1 releases per year per 1000 km of pipeline in the mid-1970s to 0.09 releases per year per 1000 km of pipeline in 2022. The total annual volume of releases of oil and hazardous substances fluctuates considerably, but the general trend is negative. Data on the area affected by oil pollution are also monitored. Most spills (around 40%) affected areas between 100 and 999 m
2 and the average spill volume per incident increases sharply for incidents affecting areas between 10,000 and 99,999 m
2, reaching around 800 m
3 per incident [
58].
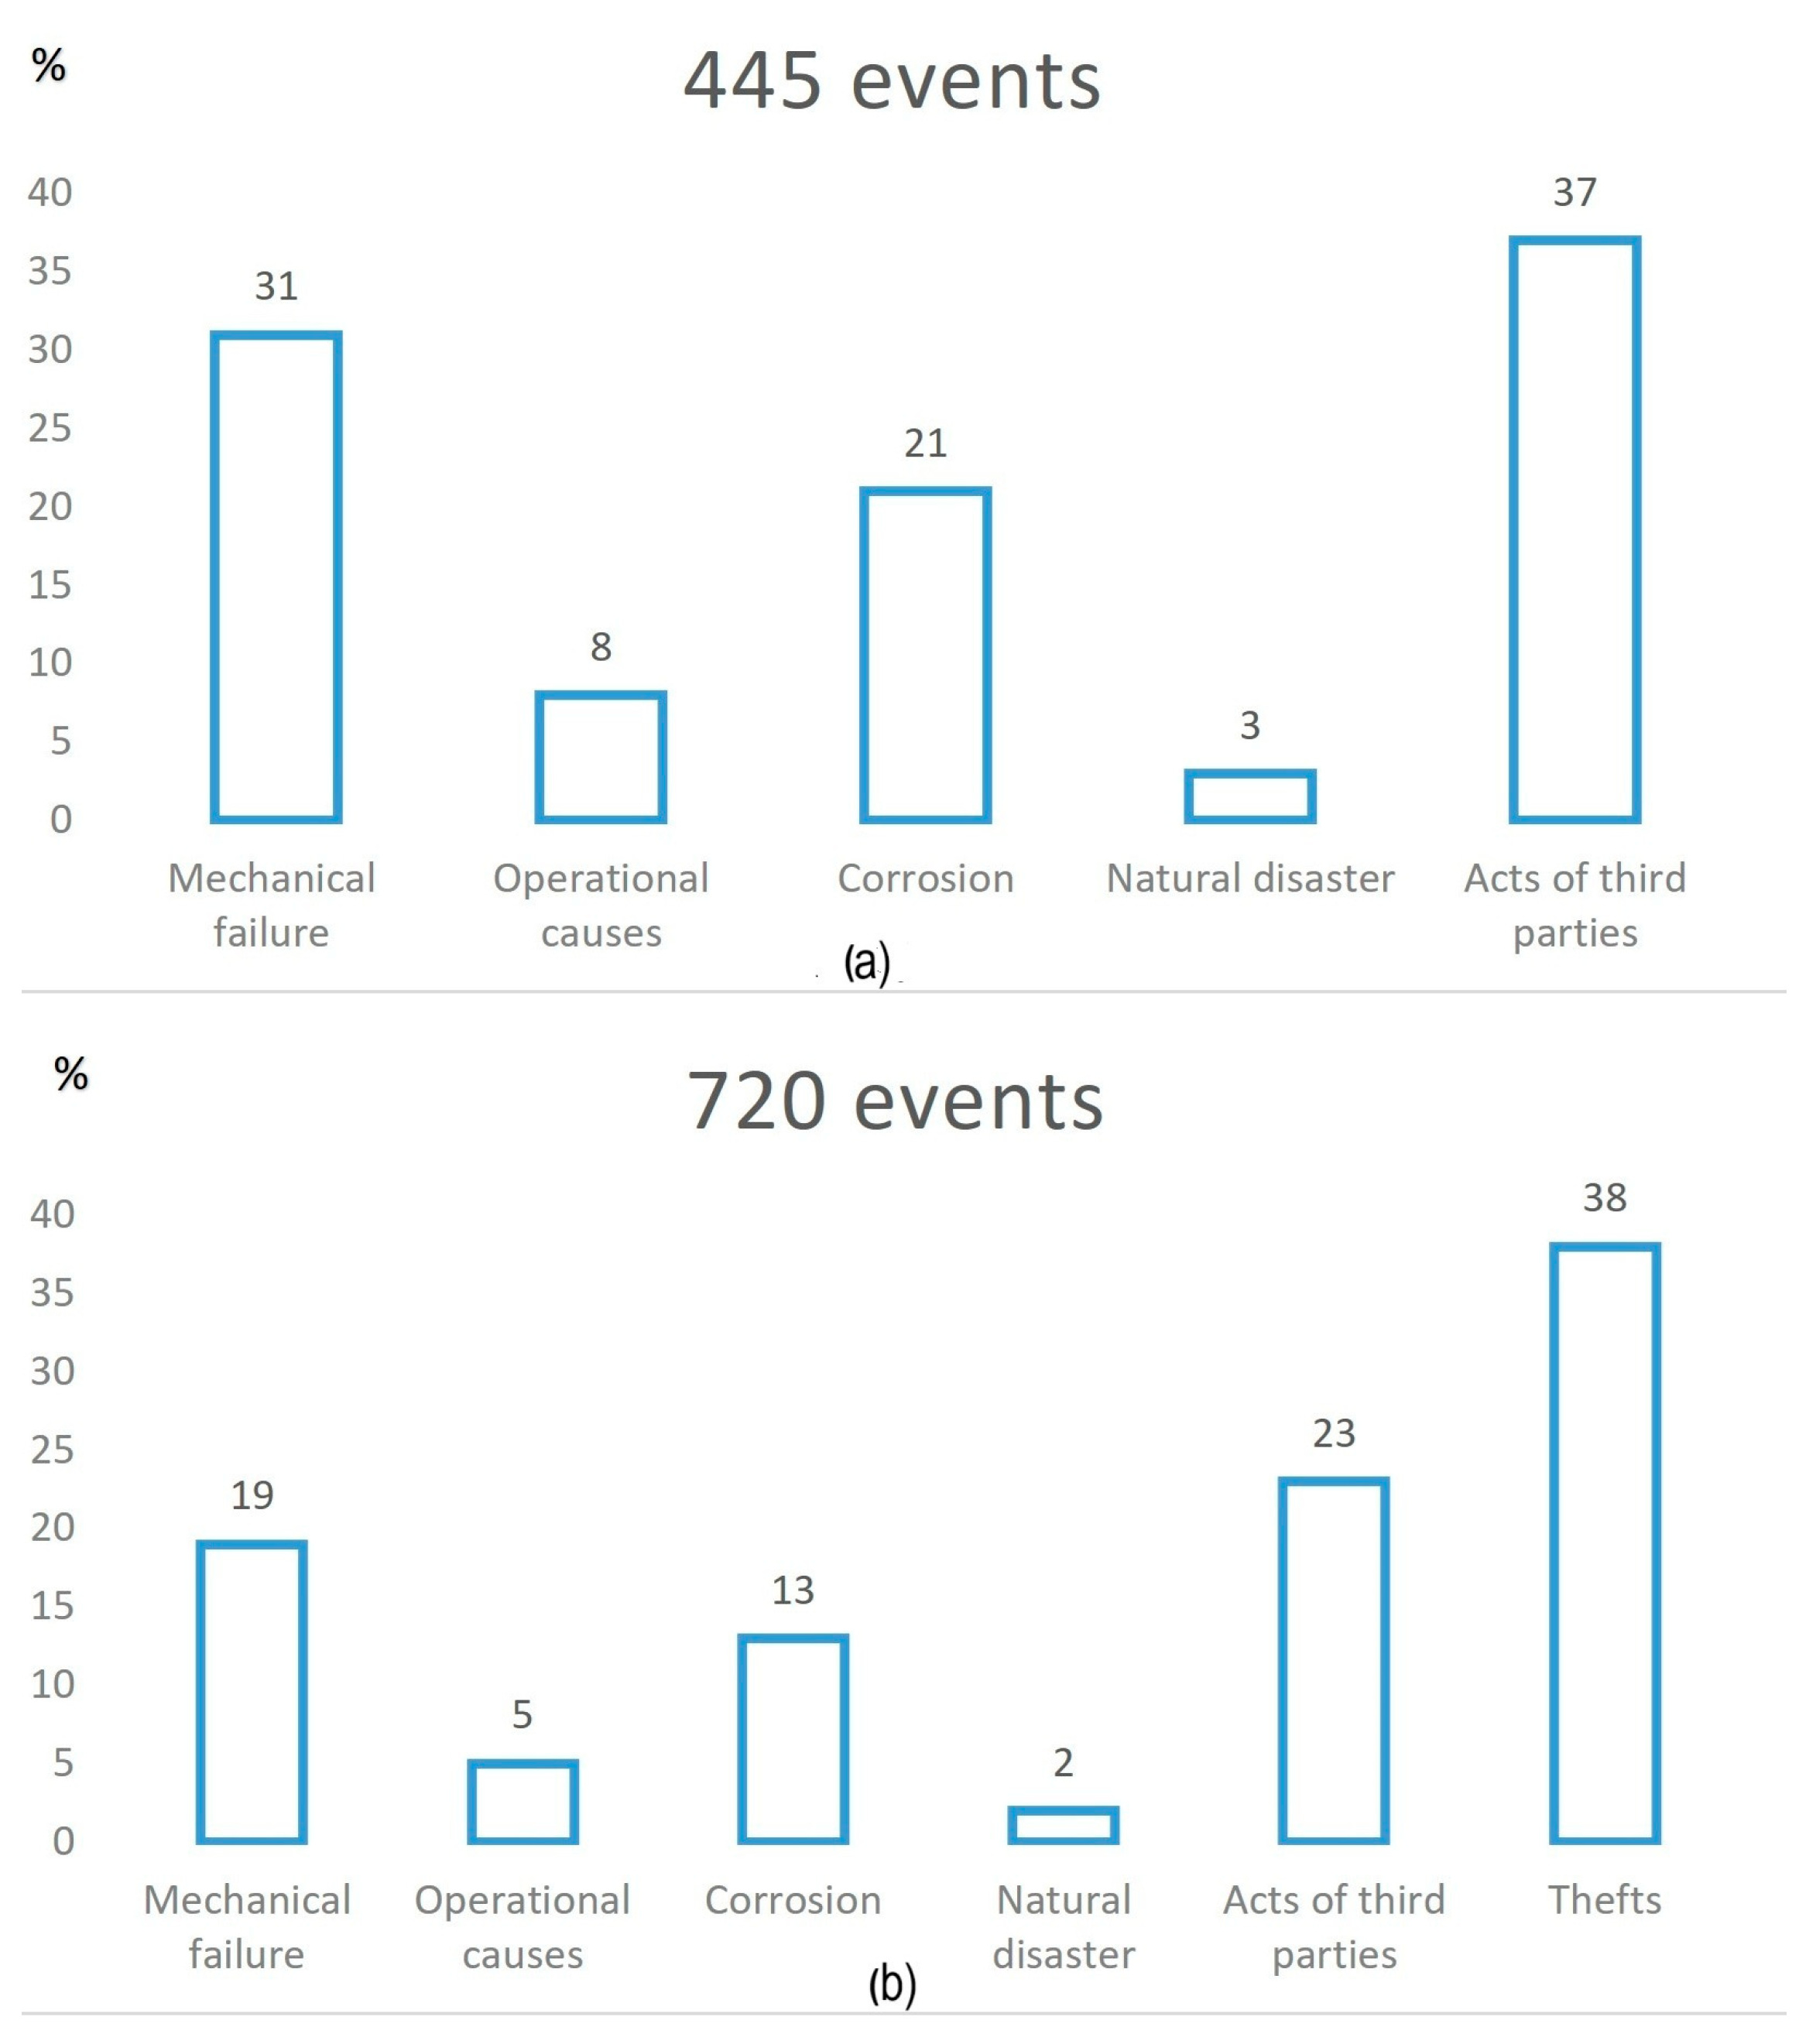
The causes of pipeline accidents differ for “hot” pipelines and oil pipelines. For “hot” pipelines, leaks are mainly due to corrosion (81%), while for oil pipelines, mechanical failure (31%) and third-party actions (37%) are the predominant causes, with corrosion accounting for only 21% of the total, as shown in
Figure 5a [
58]. The distribution of oil spills by cause for oil pipelines (cold pipelines) in the reporting period 1971–2022 is shown in
Figure 5. With the aim of identifying technical and operational causes of pipeline ruptures and thus improving the system, the analysis was carried out separately for the cases that exclude illegal connections (
Figure 5a).
Mechanical failure. Between 1971 and 2022, 142 incidents of mechanical failure were recorded, accounting for 18% of all leaks. A total of 54 accidents in this category were caused by design faults and 88 by design or material defects. Only ten incidents can be reliably attributed to ageing and material fatigue. As already mentioned, 31% of all incidents (19% if thefts are included) involving cold pipelines can be attributed to mechanical failures (
Figure 5).
Operational causes. Between 1971 and 2022, 38 spill accidents caused by operational errors were recorded. For cold pipelines, operational causes were responsible for 8% of all oil pipeline accidents (excluding theft), or 5% if theft is included (
Figure 5).
Corrosion. Between 1971 and 2022, 147 accidents caused by corrosion were recorded, which corresponds to 2.8 leakages per year. A part of incidents were related to “hot” pipeline activities (35 cases), with the external corrosion occurring more frequently. At the same time, about 21% of oil pipeline accidents were related to corrosion (13% if thefts are included) (
Figure 5). Oil pipelines are more susceptible to internal corrosion due to the corrosive properties of the crude oil.
Natural disasters. Natural disasters accounted for 2% of all oil pipelines accidents (3% if thefts are excluded) (
Figure 5). Most of these accidents were caused by ground movements. At least 10 accidents occurred in the same country due to difficult terrain and water conditions.
Third parties’ activities caused 445 events, which corresponds to 56% of all cold pipeline related release events. Accidental damage is most commonly caused by excavation work with machinery due to lack of communication or attention. Intentional damage includes vandalism and attempted theft. In 50% of cases, third parties were aware of the presence of the pipeline but did not inform the operating company. Accidents caused by third-party activities can also occur as latent failures. These events are classified by CONCAWE as a subcategory of “accidental damage”. Third party activities were involved in 37% of all cold pipeline events, or 61% of events if theft is included (
Figure 5).
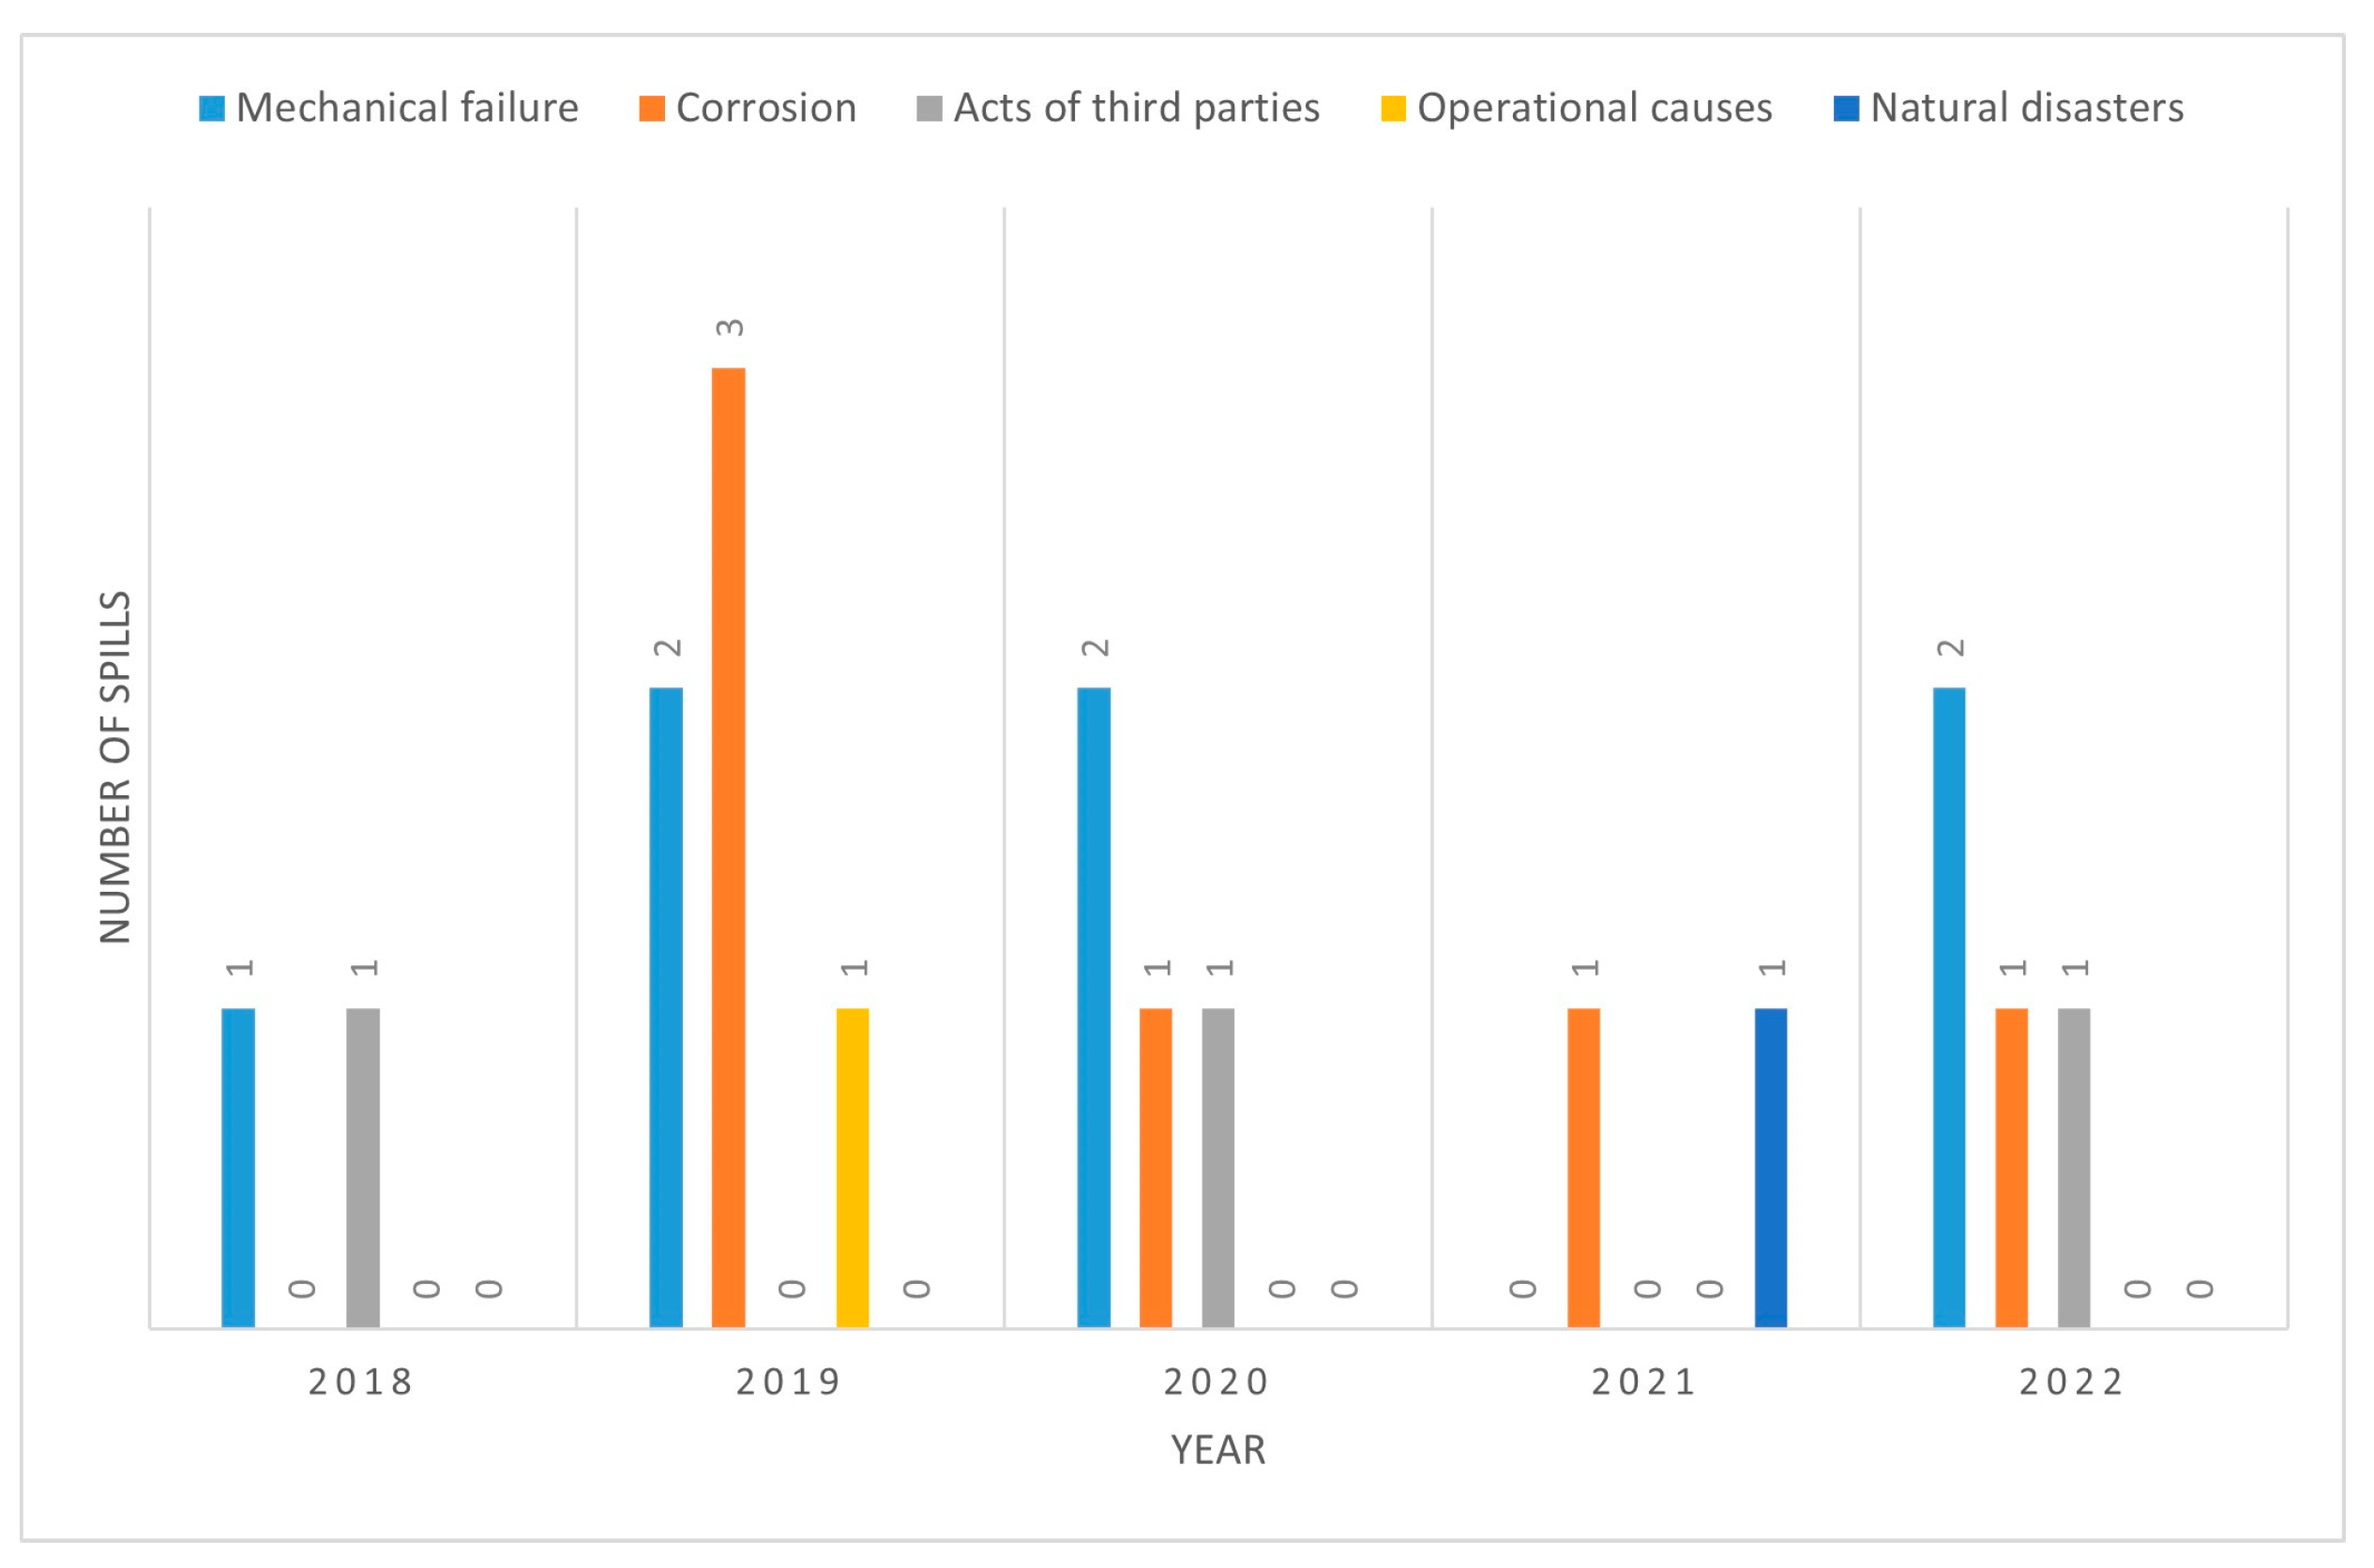
Figure 6 shows that mechanical failures are still the main cause of failures in the recent period of 2018–2022. They are the most common cause in all years except 2019, where corrosion and operational causes occurred more frequently.
3.4. ARIA Database
The ARIA Analysis, Research, and Information on Accidents (ARIA) database [
59] managed by the French Ministry for the Ecological Transition, Bureau for the Analysis of Industrial Risks and Pollution (BARPI) has been collecting information on selected accidents in France and abroad since 1992 with the aim of gaining knowledge from practical examples. It covers accidents in industry and agriculture, dams, and dykes and the transport of dangerous goods, including information on pipeline accidents. The BARPI has the task of compiling, analysing, and disseminating information and experience in the field of industrial and technological accidents [
59].
ARIA currently contains data on over 46,000 accidents that occurred in France or abroad. Around 1200 new cases are added to the database every year. In ARIA, only those accidents/incidents are compiled that represent experience feedback as a tool for risk prevention and minimisation. The criteria used to select the incidents to be catalogued are constantly updated to keep pace with new technologies. For each accident, a brief description of the event is available, mostly in French, but also in English for some accidents. The database offers a web interface with detailed search options for the accident.
Accidents are tracked in line with the European Industrial Accident Scale, which was developed to objectively assess and compare the consequences of industrial accidents. It consists of 18 technical parameters, divided into four main groups (
Table 1):
Dangerous materials releases: This estimates the quantity of hazardous substances released or involved in an explosion in relation to reference values such as the Seveso limits.
Human and social consequences: This includes the number of fatalities, serious and minor injuries, people evacuated, and people without basic services such as water or electricity.
Environmental consequences: This measures the number of animals affected, the pollution of water and soil, and the damage to protected species or habitats.
Economicconsequences: This includes the cost of property damage, loss of production, and environmental clean-up costs.
This “severity” scale was officially introduced in February 1994 by the Committee of Competent Authorities (CCA) of the EU Member States as a means of applying the SEVESO Directive. Each parameter is rated on a scale of 1 to 6, with a higher score indicating more serious consequences. The highest score among all parameters determines the overall accident index [
58].
3.5. PHMSA Data Base
The Pipeline and Hazardous Materials Safety Administration (PHMSA) of the US Department of Transportation [
61] oversees the national regulatory programme to ensure the safe transport of natural gas, oil, and other hazardous materials through pipelines, identifies safety trends, and develops new initiatives to improve safety. PHMSA has been tracking pipeline incidents since 1970 and created 20-year trend lines using data from various pipeline systems. The types of incidents include gas distribution, gas gathering, gas transmission, and hazardous liquids [
62]. Data can be filtered by state, system type, location, and cause. It should be noted that for the purposes of pipeline safety regulations, an incident is an event on a natural gas pipeline that the operator must report to the Office of Pipeline Safety. Incidents of similar magnitude involving hazardous liquid pipelines are referred to as accidents (Reference 49CFR 191.3, 49CFR 195.50) [
63,
64].
The reports have to be submitted within 30 days of the adverse event. The criteria for reporting unwanted pipeline events monitored by PHMSA changed significantly since 1970 and have become more detailed and stringent over time. Originally (1970), reportable incidents were defined under §191.5 and had to be reported if they resulted in death, hospitalisation, fire, loss of 50 barrels of liquid, or damage in excess of USD 5000. The report had to be made immediately by telephone. In 1984, §191.3 established a formal definition of “incident” to mean an event that resulted in a release of gas from a pipeline or liquefied natural gas (LNG) facility that caused a fatality or injury requiring inpatient hospitalisation, or that required the shutdown of a section of a transportation pipeline, that resulted in ignition of the gas, or that caused estimated property damage of USD 50,000 or more. In 2010 (75 FR 72905), significant changes were made to include LNG facilities in the written incident reporting requirement. The definition of “incident” was expanded to include the loss of 84,950.5 m3 (3 million cubic feet) or more of gas. New types of gas, i.e., refrigerant gas and liquefied petroleum gas, have been included. It is clearly stated that the activation of a safety system without an actual hazard does not constitute an incident. The value of the lost gas is explicitly excluded from the calculation of the damage for the reporting threshold. In 2016 (81 FR 91871), there were important changes regarding the inclusion of underground natural gas storage facilities (UNGS) in the definition of an incident: the same criteria now apply to UNGS as to LNG facilities. Written incident reporting is also required for UNGS facilities. Finally, the 2021 changes (86 FR 2237) raised the property damage reporting threshold from USD 50,000 to USD 122,000, noting that it will be updated for inflation.
Serious incidents include a death or injury that requires hospitalisation. Since 2004, significant incidents are defined as a death or injury requiring inpatient hospitalisation, a total cost of USD 50,000 or more (measured in 1984 dollars), a release of volatile liquids of 5 barrels or more, a release of other liquids of 50 barrels or more, or a release of liquids that results in an accidental fire or explosion [
65].
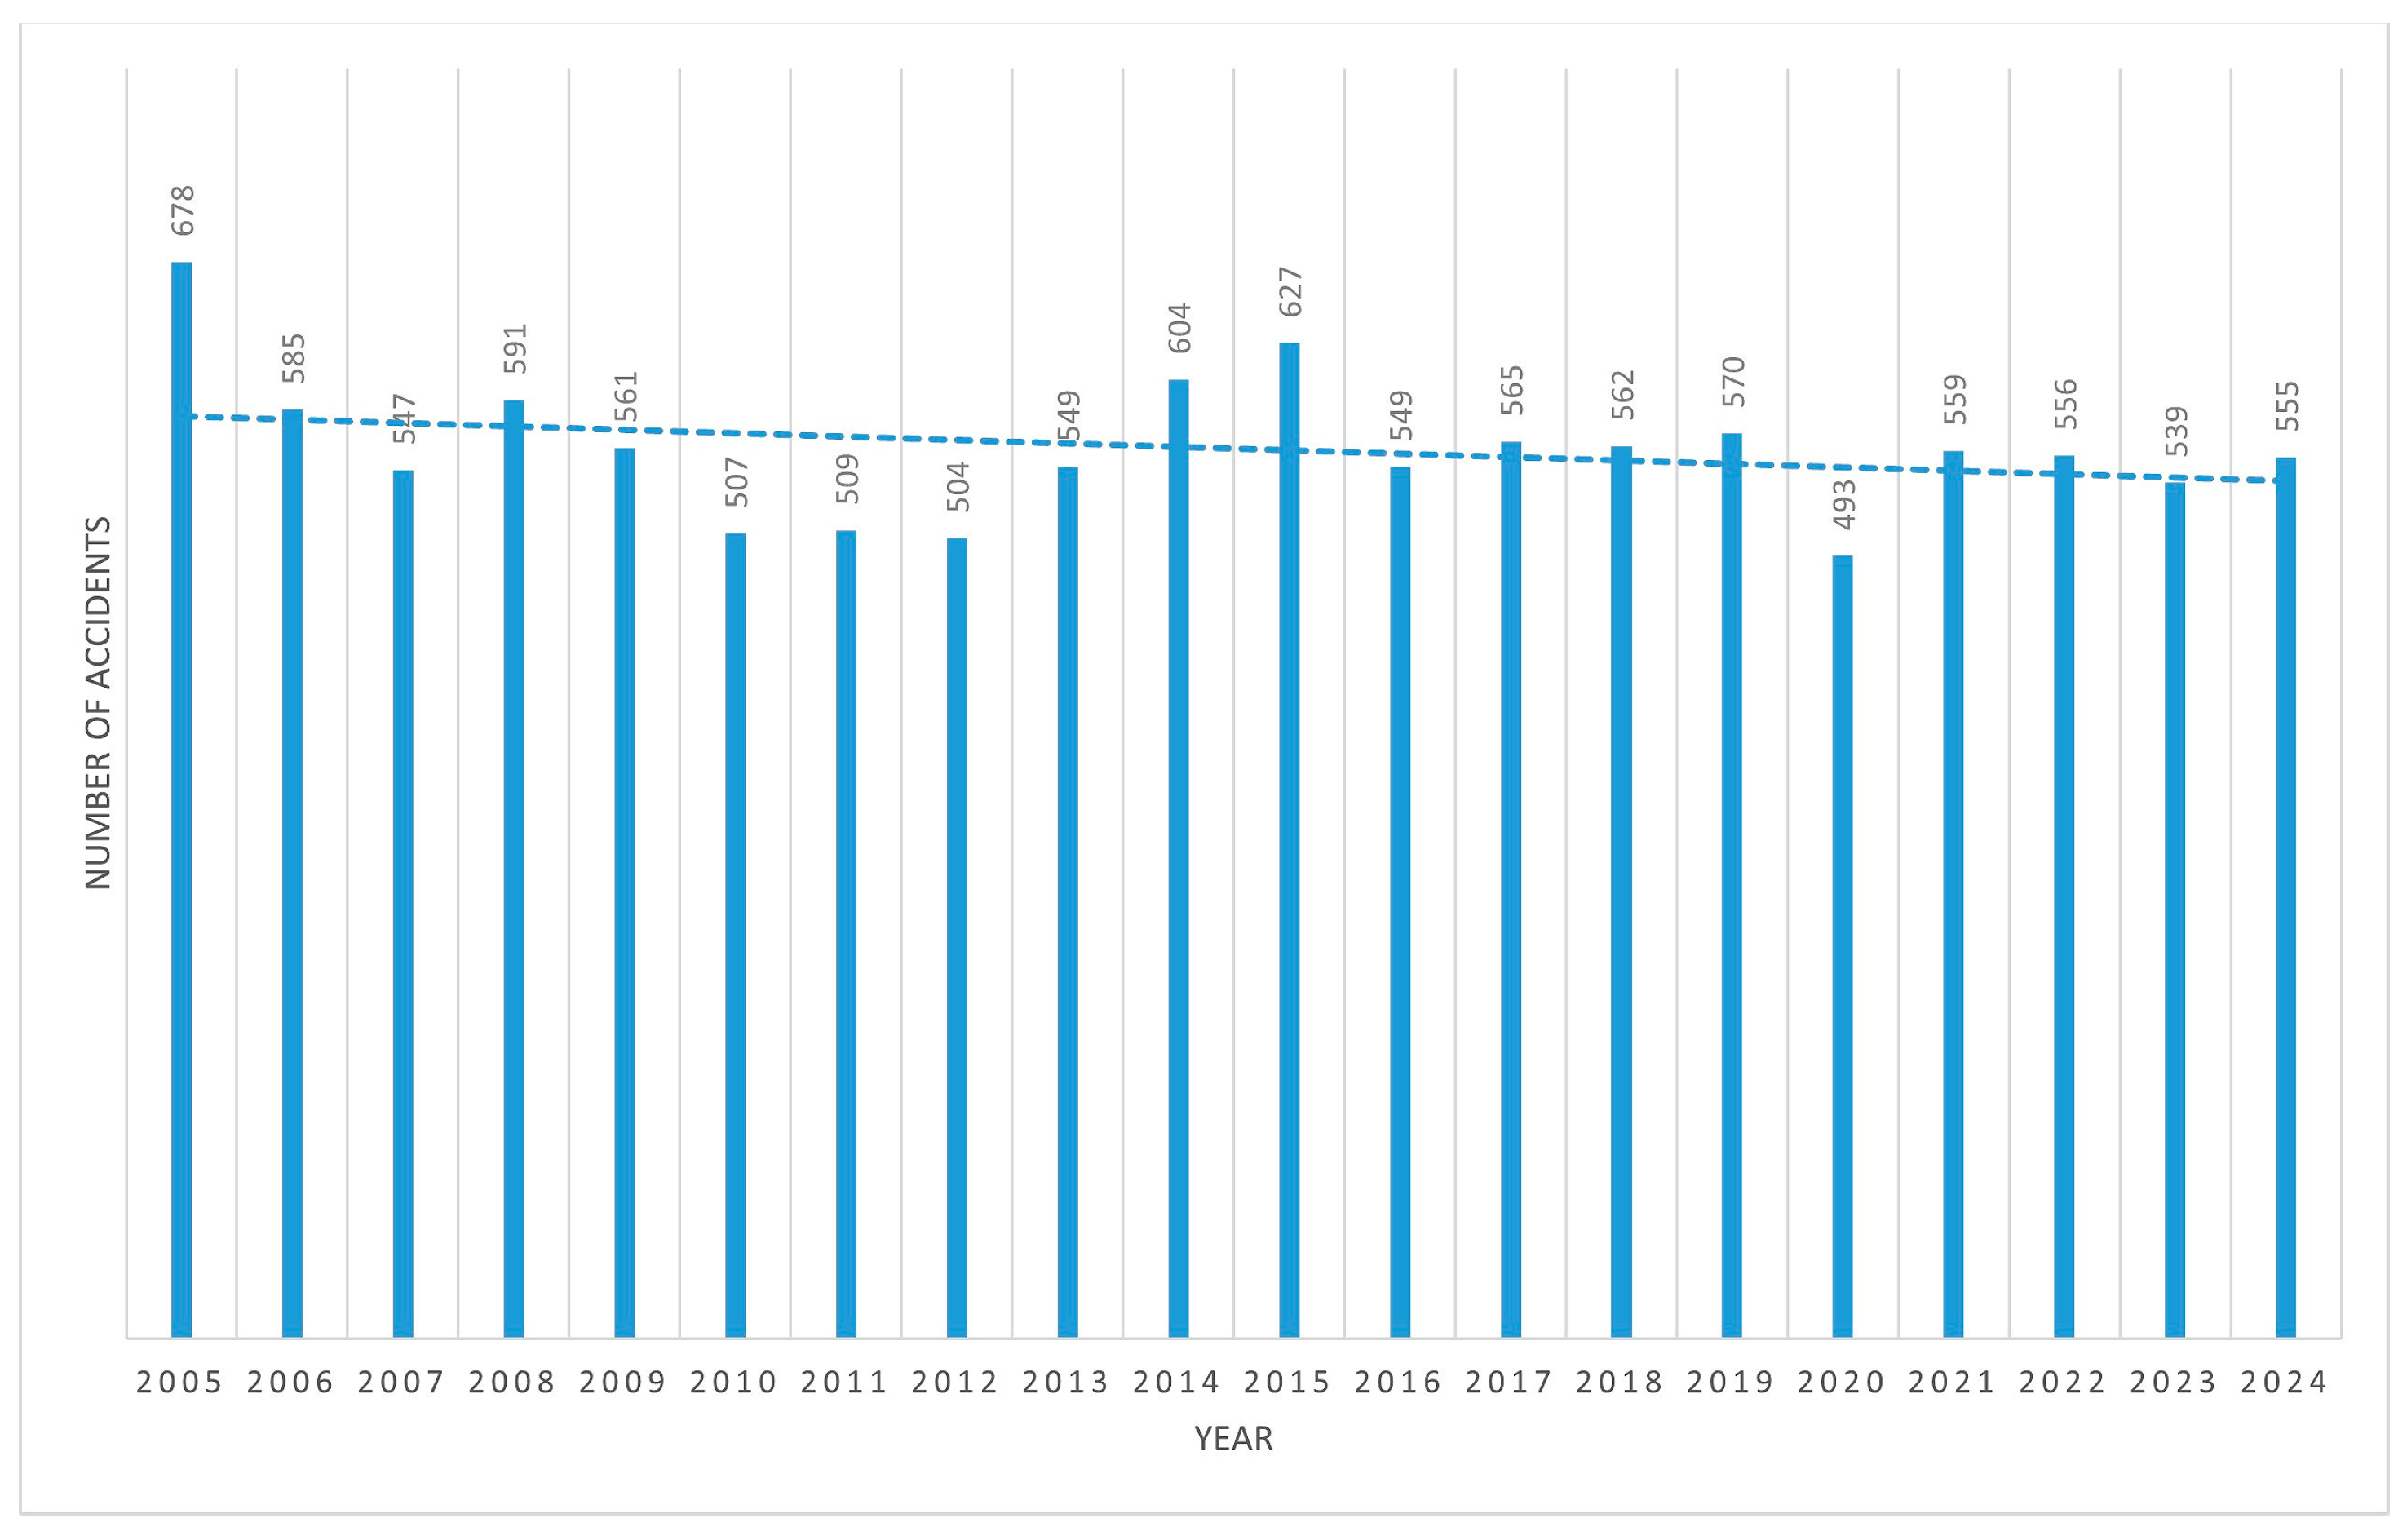
The PHMSA reports contain important information about the pipeline operators, the type of media, the number and type of injuries, fatalities, fires, and explosions. Detailed information is also collected on the locations of the incident, the operating parameters of the system, and information on the causes of the accident and the costs of remediation. Accidents in connection with natural disasters are recorded separately. All information is publicly available on the PHMSA website. In the last 20 years (2004–2023), about 12,700 accidents have been recorded in the database, the distribution of which by year is shown in
Figure 7. The total cost of all remediation carried out in the last 20 years amounts to over USD 11 billion [
66].
Liu [
67] analyses the PHMSA database and concludes that there is a significant correlation between pipeline accident data, suggesting that accidents do not occur randomly, but rather have a significant accumulation, indicating that certain conditions or time periods may predispose the system to higher accident rates. Pipeline repair costs show a declining trend from 1970 to 1984, followed by two relatively stable periods, the first from 1985 to 2001 and the second from 2002 to 2012. The repair costs in the first stable period were about half as high as the average repair costs in the second stable period. This difference can be attributed to changes in PHMSA reporting systems and formats during these periods [
68,
69].
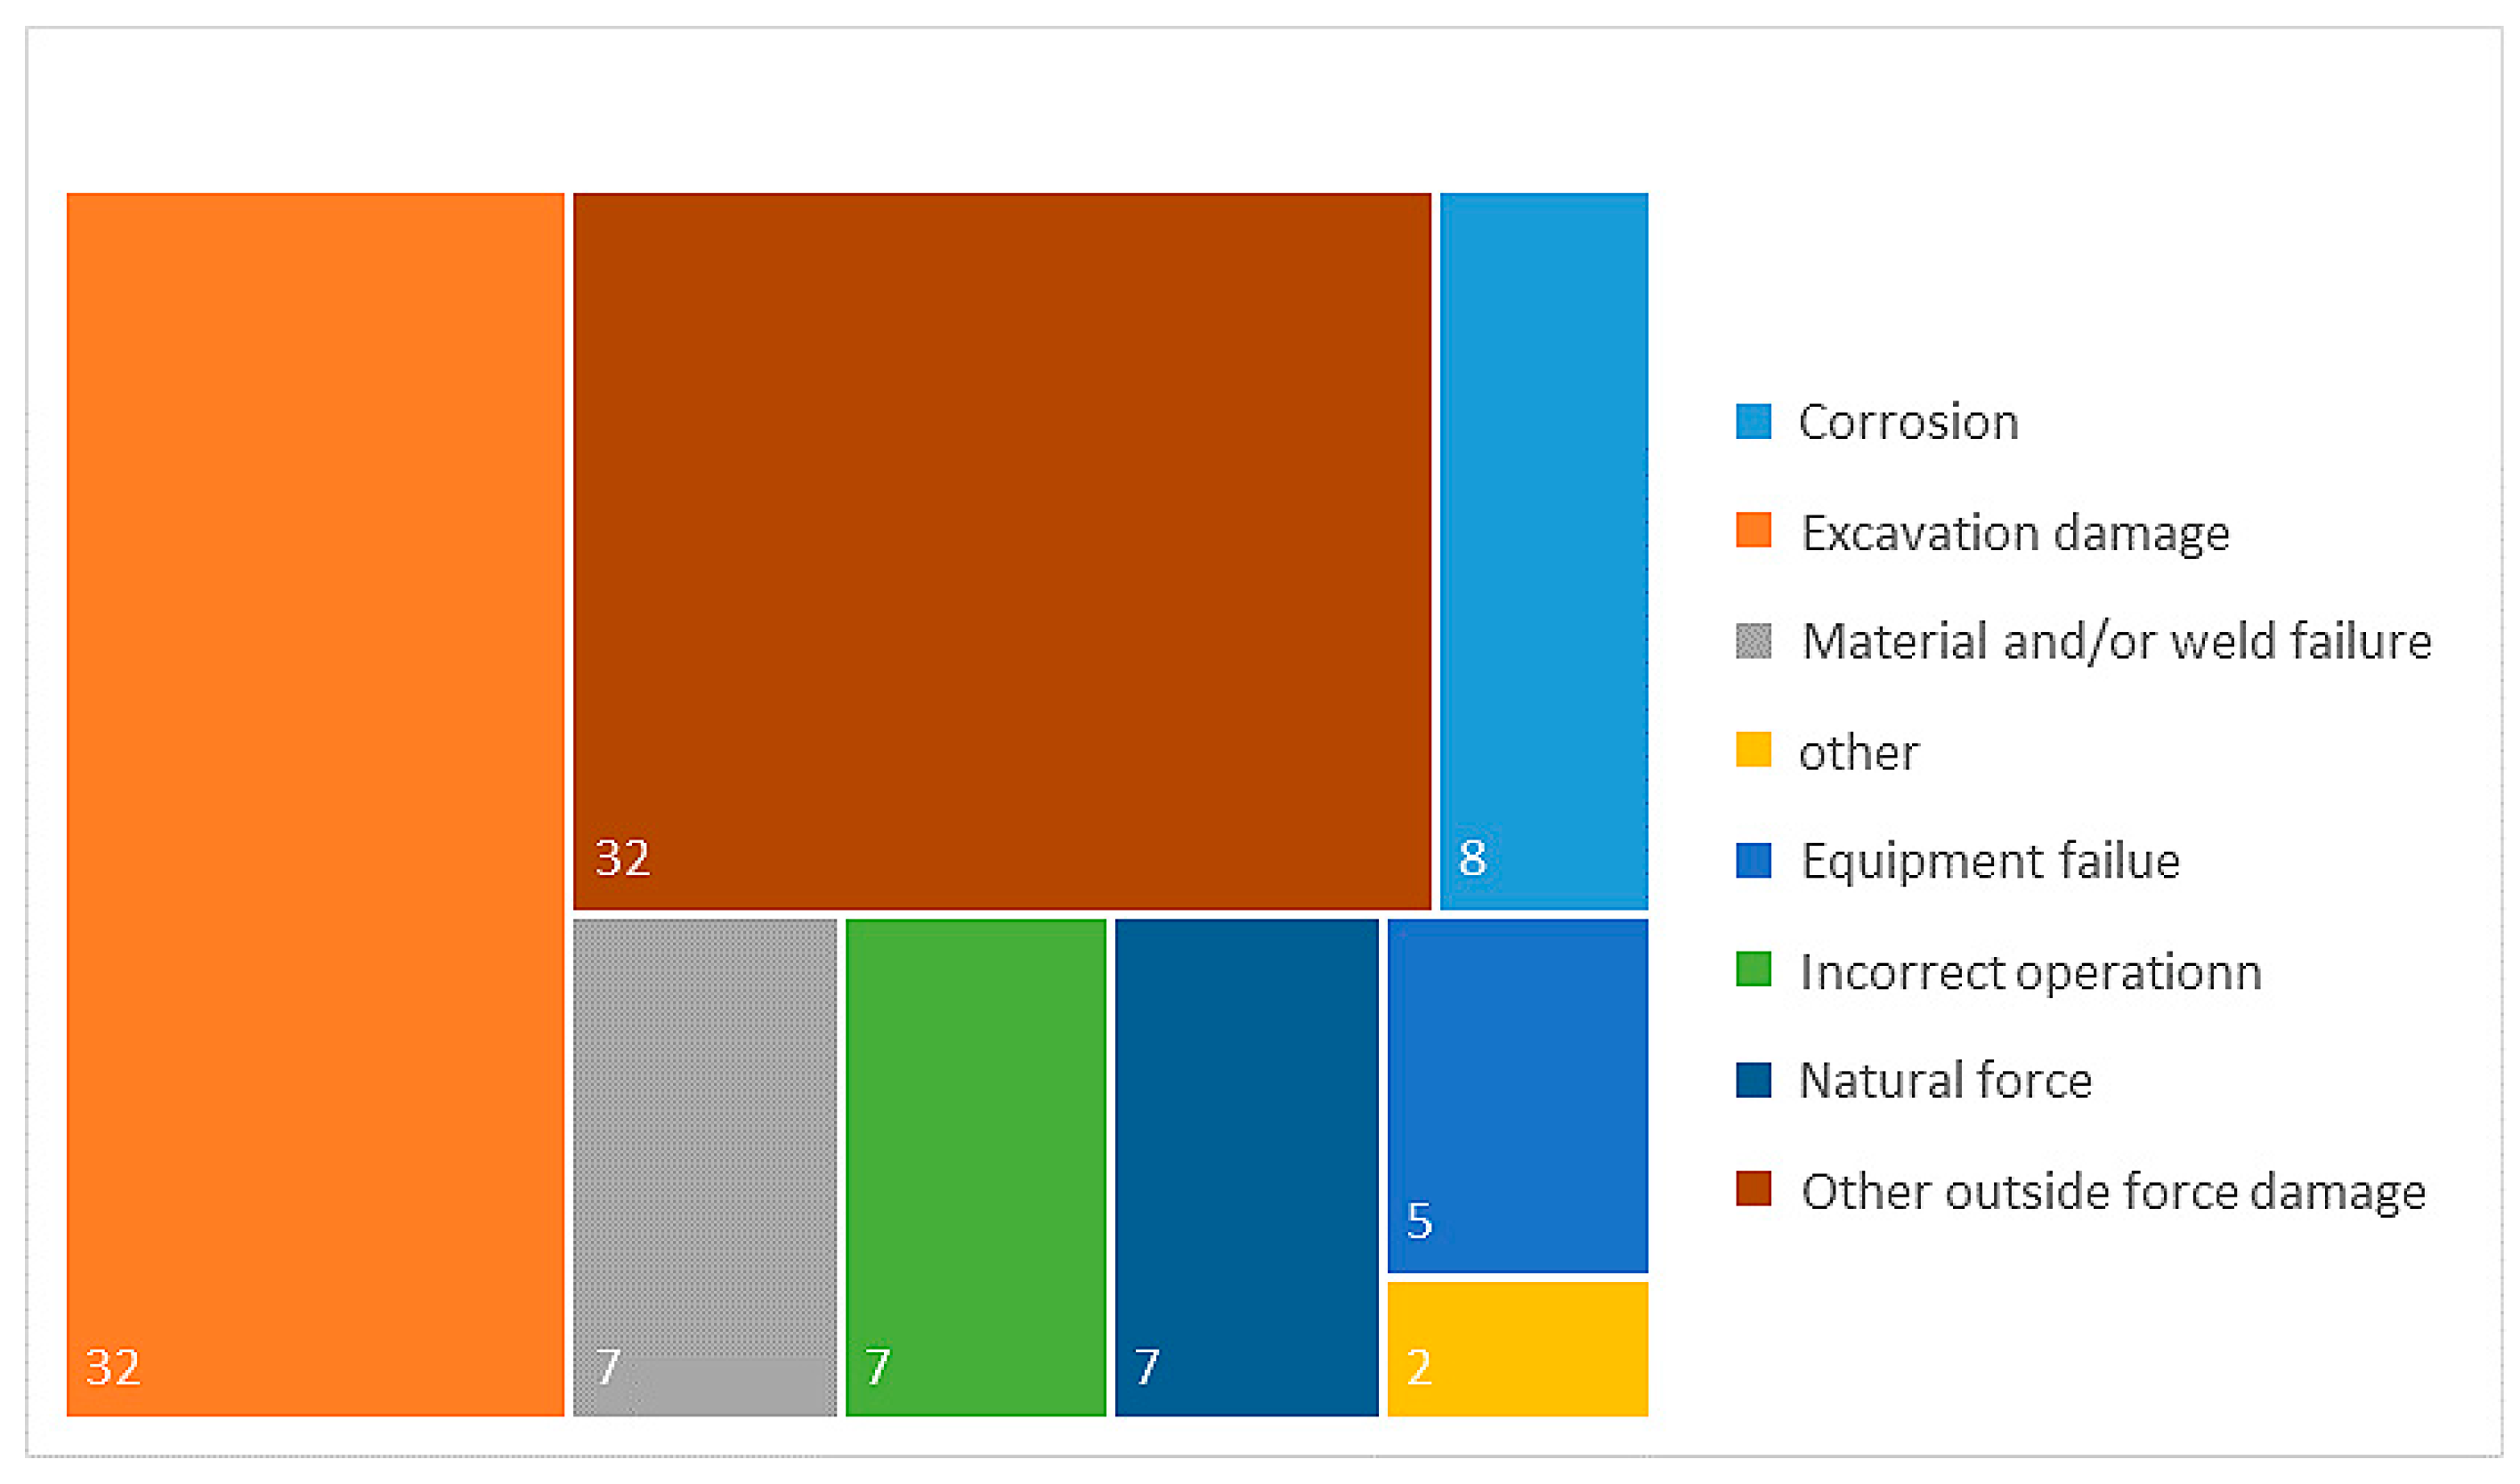
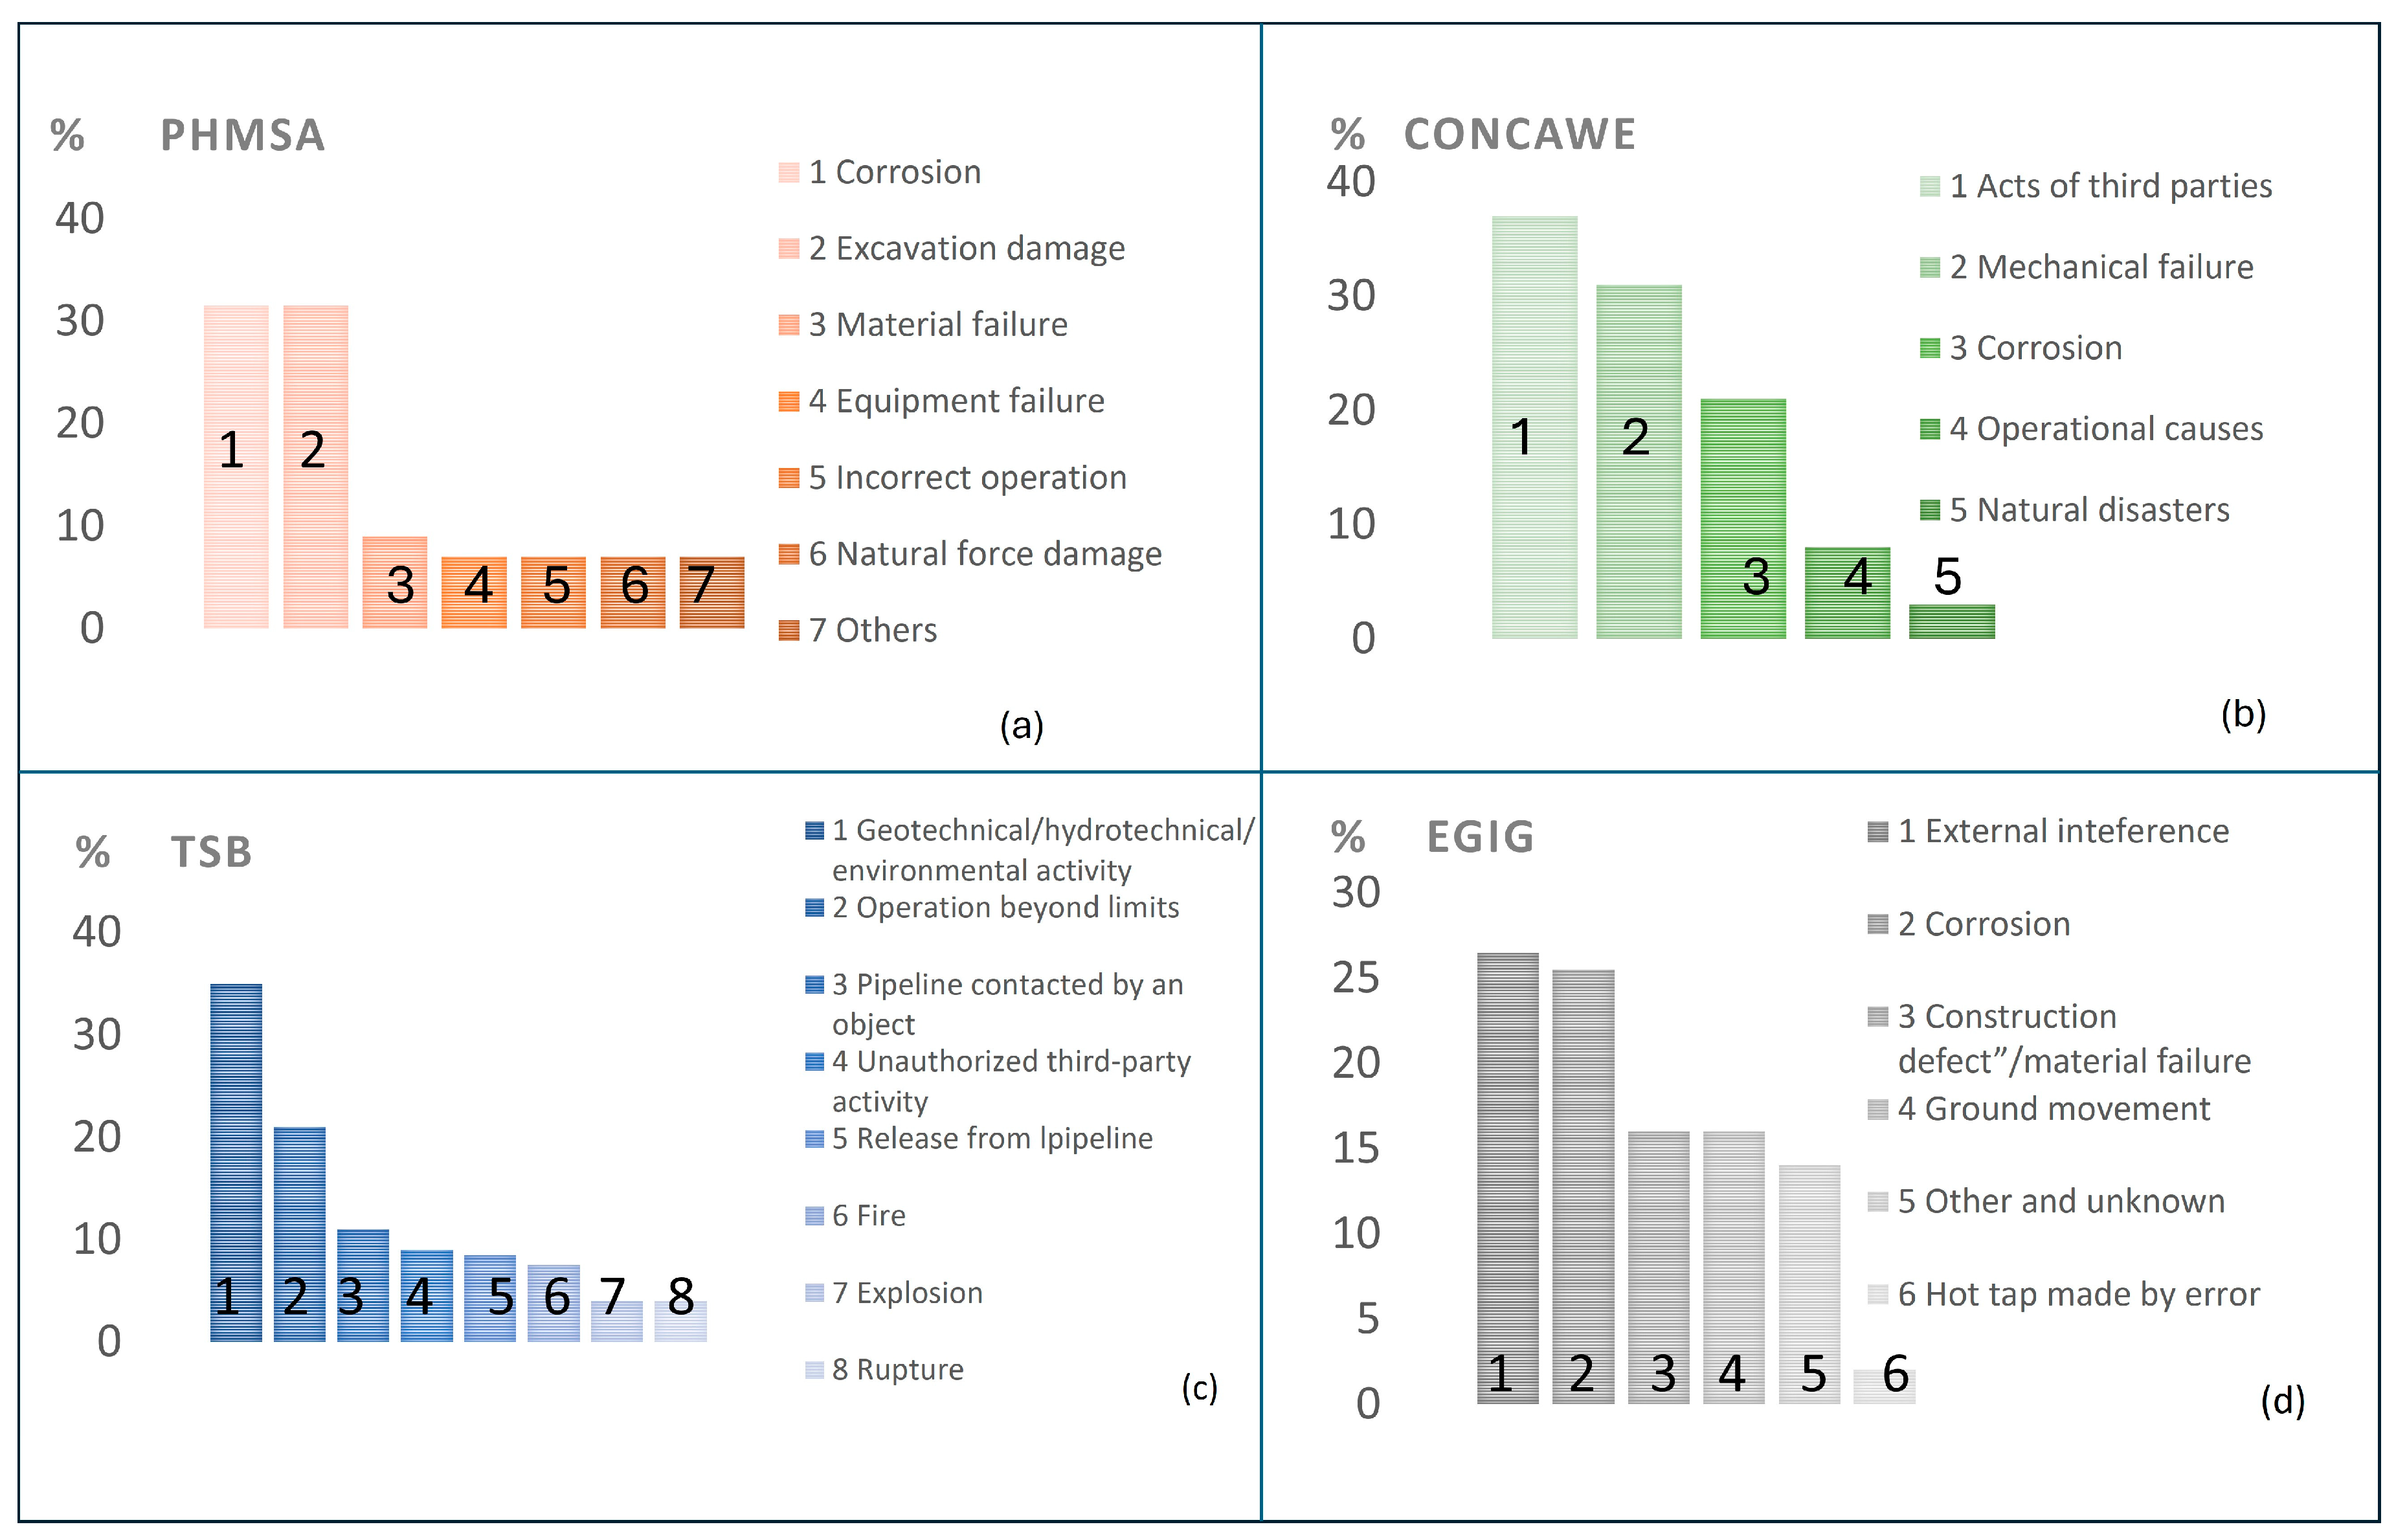
According to PHMSA, the main causes of accidents (
Figure 8) include corrosion, equipment failure, material failure of the pipe or weld, excavation damage, incorrect operation, natura forces, other outside force damage, and others. Damage caused by excavated soil and other external damage is responsible for more than 60% of gas pipeline accidents. These causes are closely linked to humans [
67].
The study [
67] analysed gas pipeline accidents to investigate their occurrence over time using the inter-incident histogram (IIH) and the Fano factor (FF). The IIH shows how the time intervals between successive accidents are distributed, which shows that accidents often occur in clusters. This means that the occurrence of one accident increases the likelihood of further accidents occurring within a short period of time [
70,
71,
72,
73]. The analysis of the Fano factor confirms this clustering of accidents. The Fano factor, represented by the ratio of the variance to the average value of the number of accidents in specified periods, provides information on the type of distribution of events, i.e., it provides an estimate of the dispersion of the number of accidents in relation to their average frequency over time. In this case, it shows values greater than one on all analysed time scales, which means that pipeline accidents are related in time and do not occur randomly [
67,
74]. It suggests that accidents occur in clusters, i.e., that certain factors lead to the grouping of accidents (e.g., seasonal influences, weather events, etc.). The analysis found that more severe accidents have a more pronounced temporal relationship, which means that these accidents are more likely to occur in certain periods or in series, which may be due to certain causes such as seasonal influences or repeated human errors [
67]. For example, accidents that occurred between 2010 and 2020 showed a lower temporal correlation than accidents between 2004 and 2009, suggesting that recent improvements in safety management reduced some of these temporal correlations [
67].
3.6. TSB Database
The Transport Safety Board of Canada (TSB) [
75] is an agency that works to improve transport safety in North America by investigating marine, pipeline, rail, and aviation accidents. It was established in 1990 by an Act of Parliament (Canadian Transportation Accident Investigation and Safety Board Act) [
76]. The TSB’s main responsibilities include conducting in-depth investigations to identify safety deficiencies and issuing detailed reports with safety recommendations. The TSB operates independently under a board appointed by the Governor in Council and ensures unbiased accident investigations covering a wide range of aspects including human factors, equipment, environment, and organisational issues. The TSB’s recommendations have a significant impact on standards, procedures, and safety practises in the transport sector across North America. They are internationally recognised and frequently cited as best practise by various global transport safety organisations and regulators.
The TSB provides users with both data and statistics on pipeline occurrences. The statistics, which interpret and summarise the data, are published monthly and then compiled in annual reports. The database recorded 68 pipeline accidents in 2023, which is no different than the previous year, but 33% below the 10-year average. No accidents or fatalities have been recorded since the TSB was established in 1990. The Canadian pipeline system, with a total length of 68,200 kilometres in 2023, was used by as many as 100 companies transporting a total of 18.8 × 10
18 J of energy that year [
77].
All reportable events must be identified as an accident or incident in the modal database for transport incidents, using the definitions set out in the Transportation Safety Board Regulations SOR/2014-37 [
78]. Since 1 May 2018, the TSB Policy on Occurrence Classification defines pipeline accidents and pipeline incidents as shown in
Table 2, and
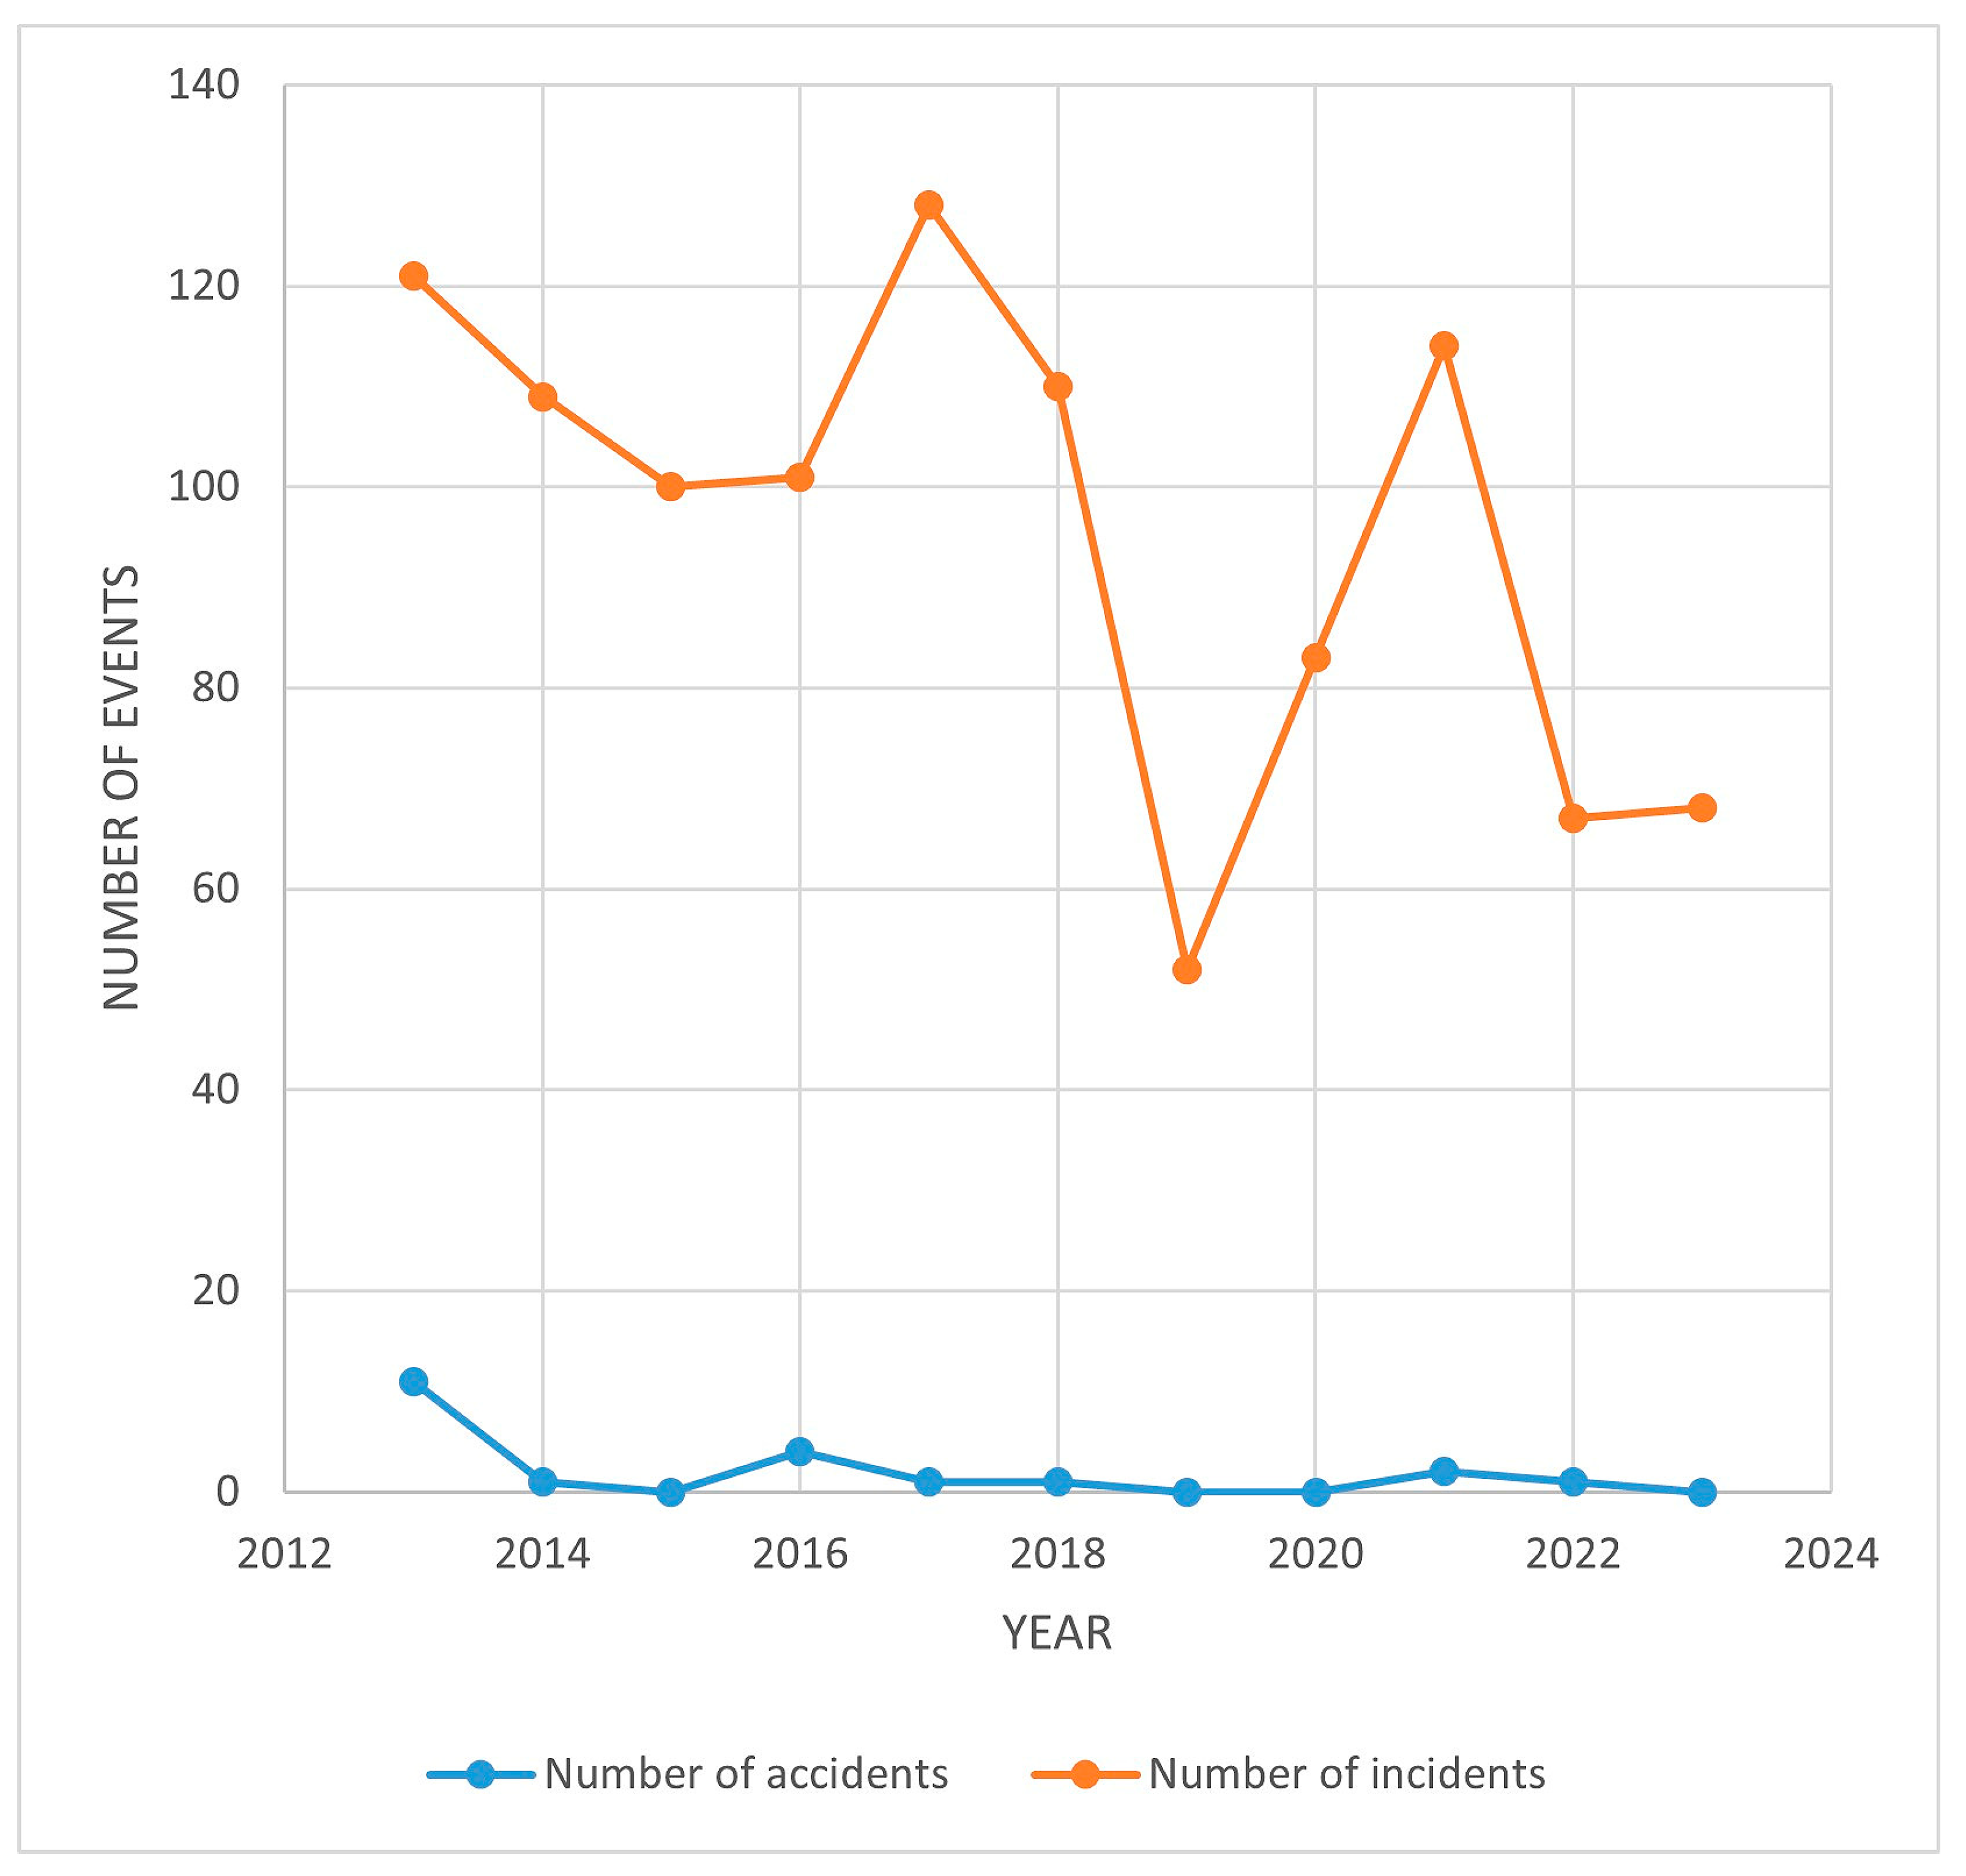
Figure 9 shows the number of incidents from the TSB database fluctuating between 45 and 130 accidents per year.
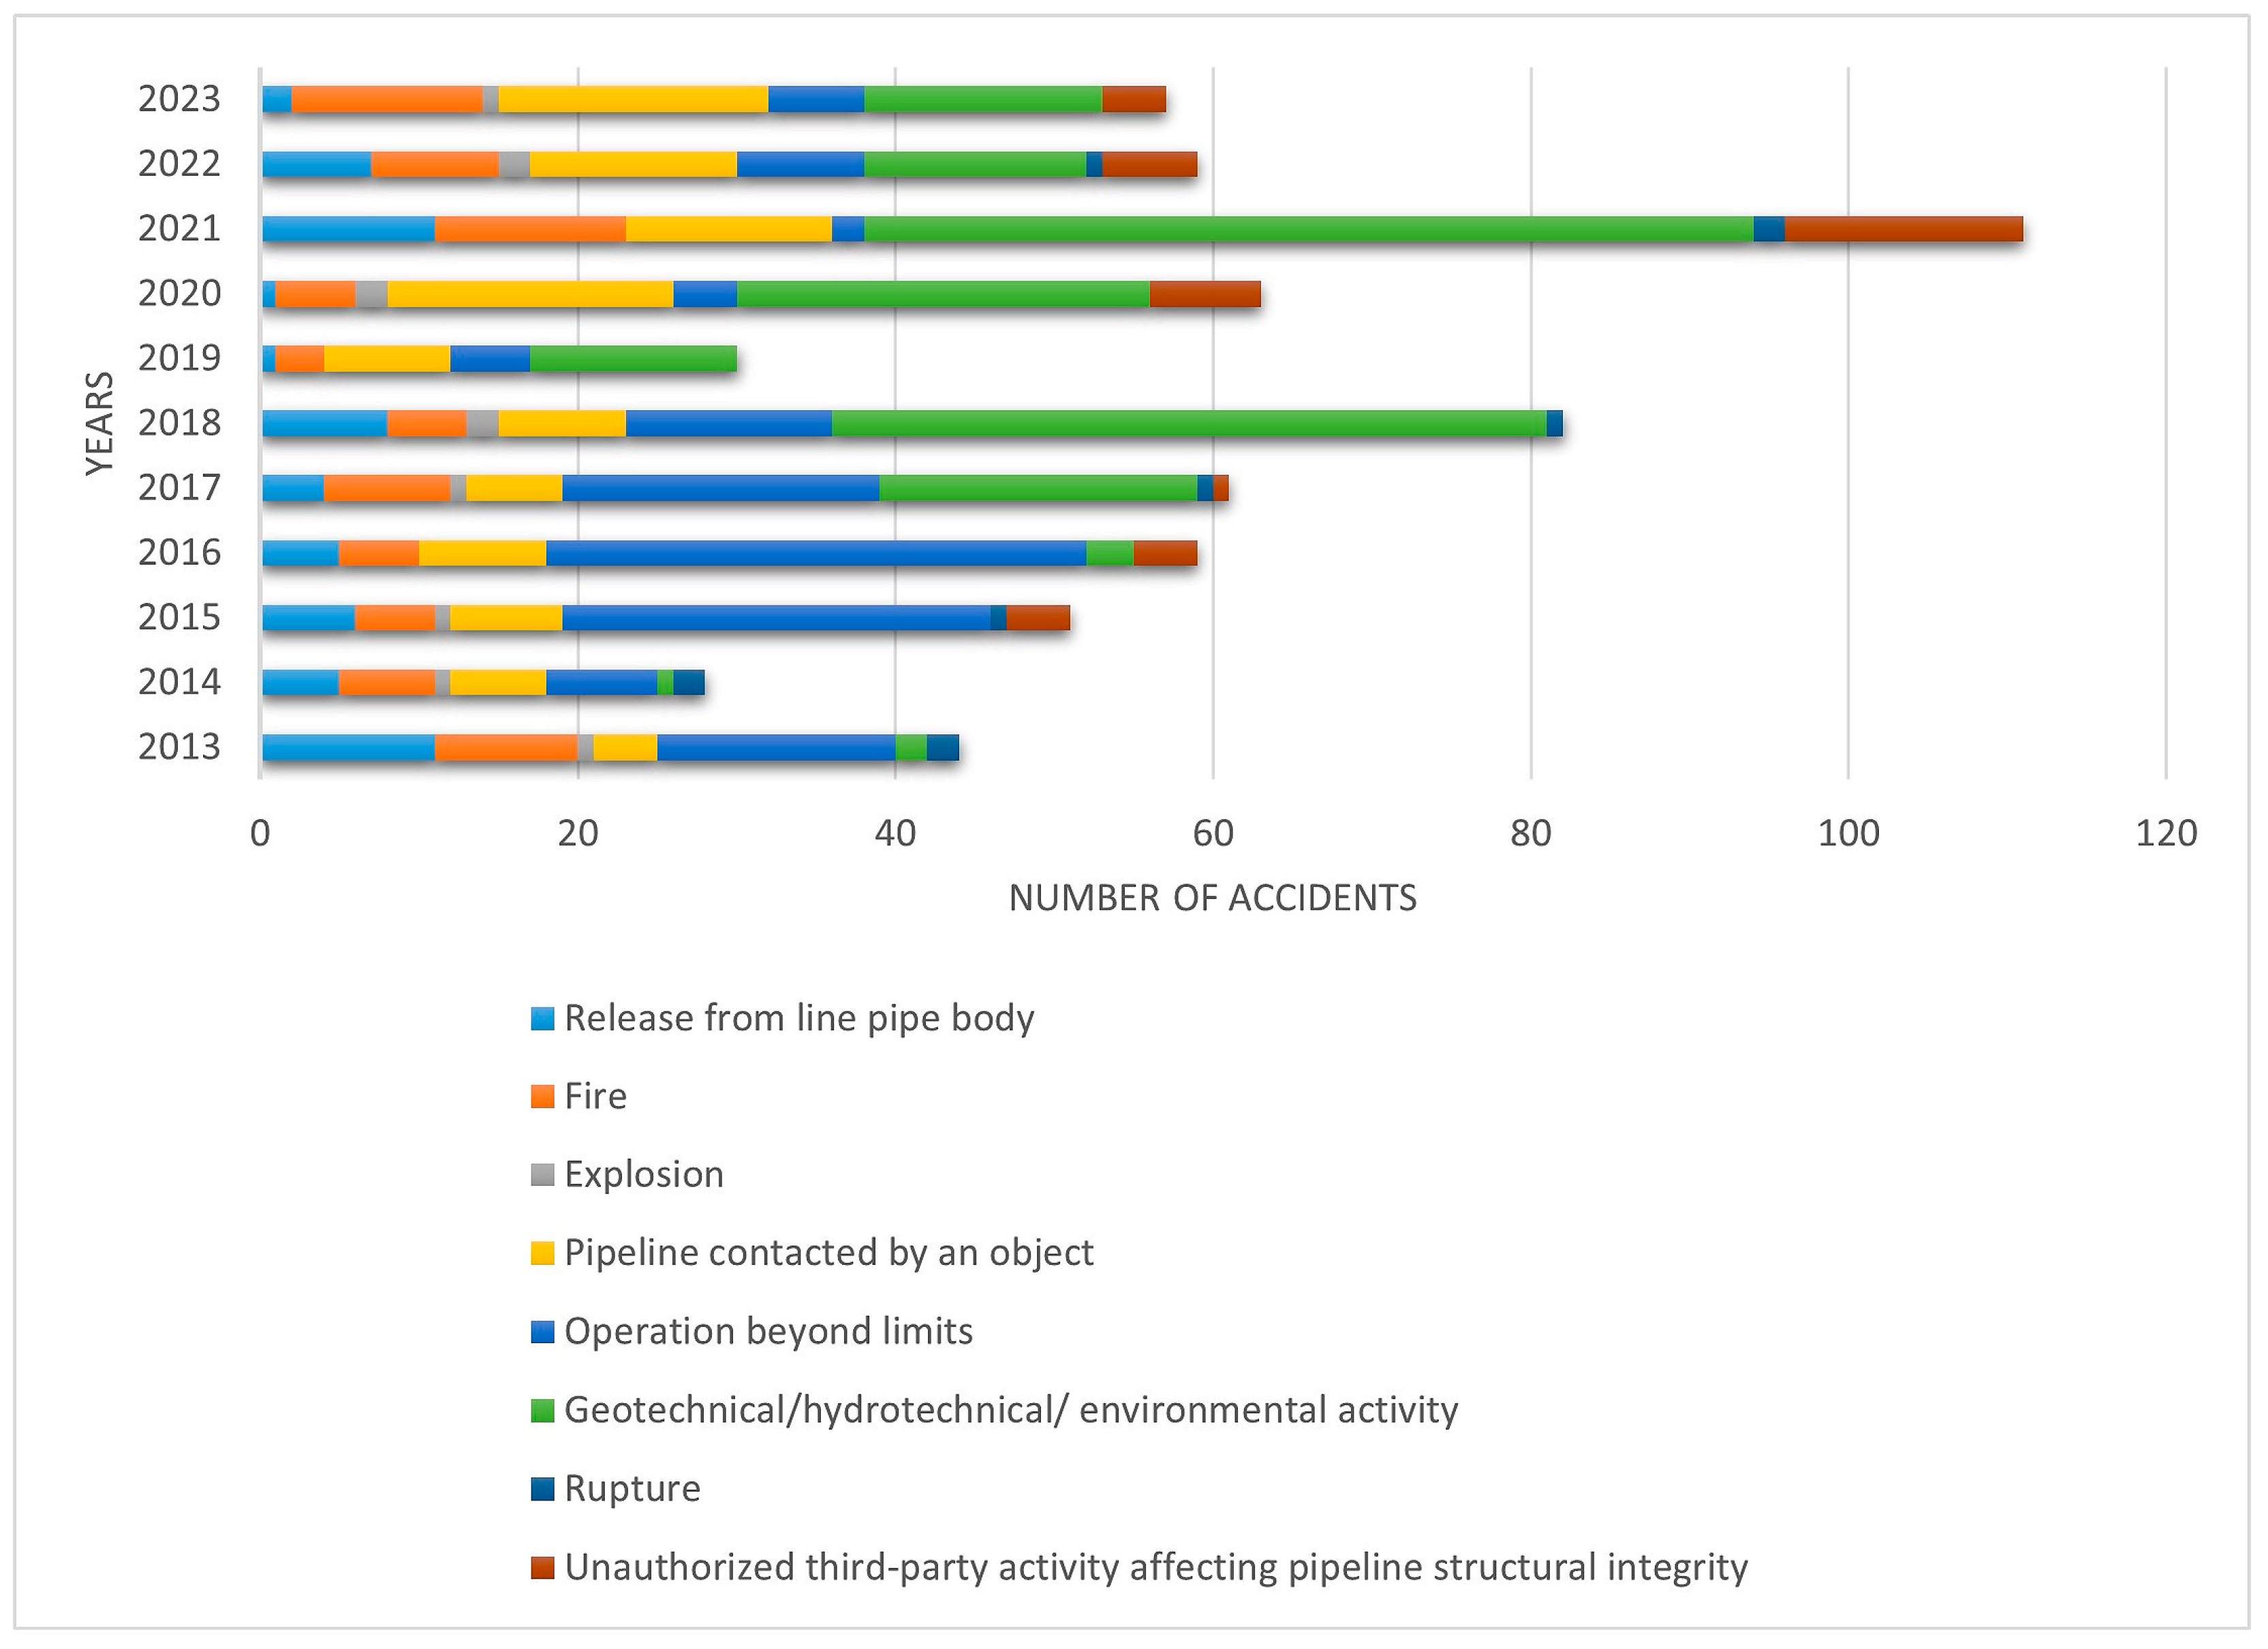
According to the causes, accidents are divided into categories: “Release from line pipe body”, “Fire”, “Explosion”, “Pipeline contacted by an object”, “Operation beyond limits”, “Geotechnical/hydrotechnical/environmental activity”, “Rupture”, and “Unauthorised third-party activity affecting pipeline structural integrity”. The breakdown of accidents by cause for the group of events that are not exclusively categorised as “product released” is shown in
Figure 10.
The “Release from line pipe body” was highest in 2013, when most cases of this species were recorded (11 cases). Thereafter, the number decreases and usually ranges between 1 and 8 per year. The exception is a renewed increase in 2021 (11 cases), followed by a sharp decrease to only 2 in 2023. This cause shows a general downward trend, with an occasional year of increase. “Fires” occur every year. The number is between 5 and 6 in the earlier period, but from 2021, there is a sharp increase, with 12 cases in 2021 and again 12 in 2023. “Explosions” are very rare. For ten years, there were at most 2 per year (2018, 2020, and 2022). No cases were recorded in 2016 and 2021. This cause is stable low and under control. The category “Pipeline contacted by an object” shows a constant growth. The number of incidents increased from 2013 (4 cases) to 2023 (17 cases). The number was particularly high in 2020 (18 cases) and remains stable thereafter (13–17 cases). This type of incident is now one of the most common and is constantly increasing. As regards “Operations beyond limits”, the largest number of incidents was recorded in 2015 (27 cases) and 2016 (34). Thereafter, there has been a significant decline, with only a few cases per year. The trend shows a general decline with occasional slight increases. The “Geotechnical/hydrotechnical/environmental activity” shows the strongest growth of all. From just 2 cases in 2013, the number rises to 45 (2018) and reaches a peak of 56 cases in 2021. Although there is a decline thereafter, there are still 15 cases in 2023. “Rupture” events are very rare (up to 2 incidents per year). “Unauthorised third-party activities affecting the structural integrity of pipelines” were very rare until 2020 (0–1 per year), but a sharp increase was recorded in 2020 (7 cases), and the peak came in 2021 with a whopping 15 cases. In 2023, 4 more cases were recorded. This indicates a new and worrying trend of increasing external threats to pipeline safety.
In the observed period 2013–2023, “Geotechnical/hydrotechnical/environmental activities” were involved with 30.23%, “Operation beyond limits” with 21.86%, “Explosion” with 17.05%, “Contact of the pipeline with an object” with 16.74, “Rupture” with 15.5%, “Fire” with 12.09%, “Unauthorised third party activities affecting the structural integrity of the pipeline” with 6.36% and “Release from the pipeline body” with 9.46%.
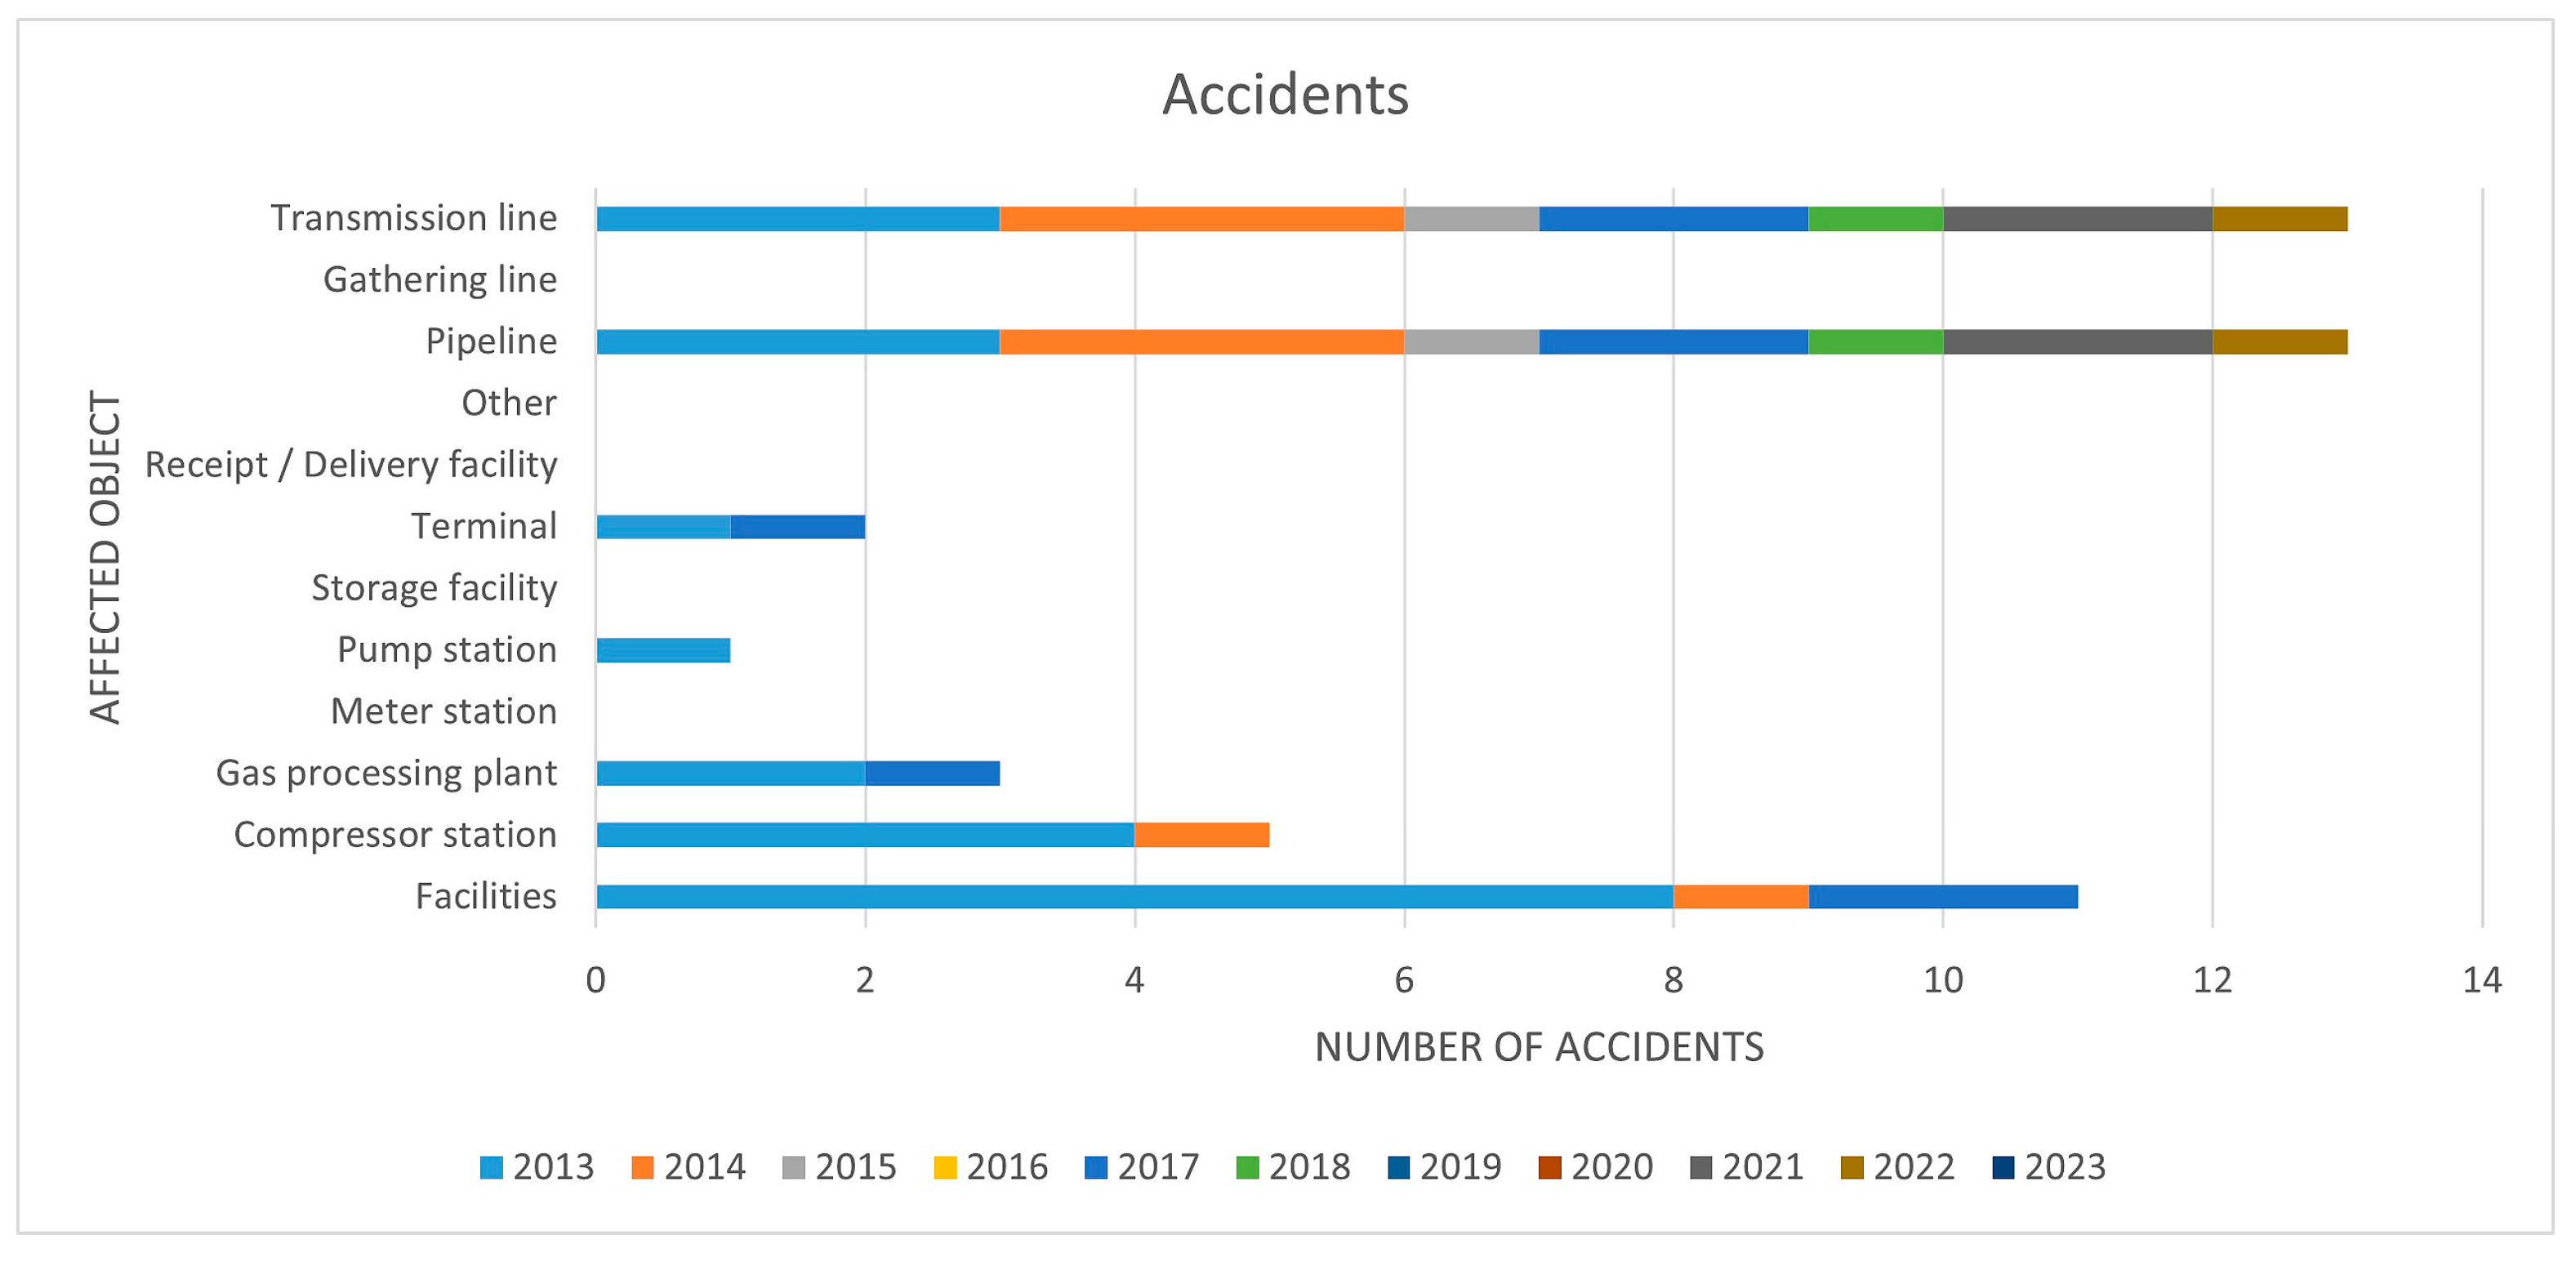
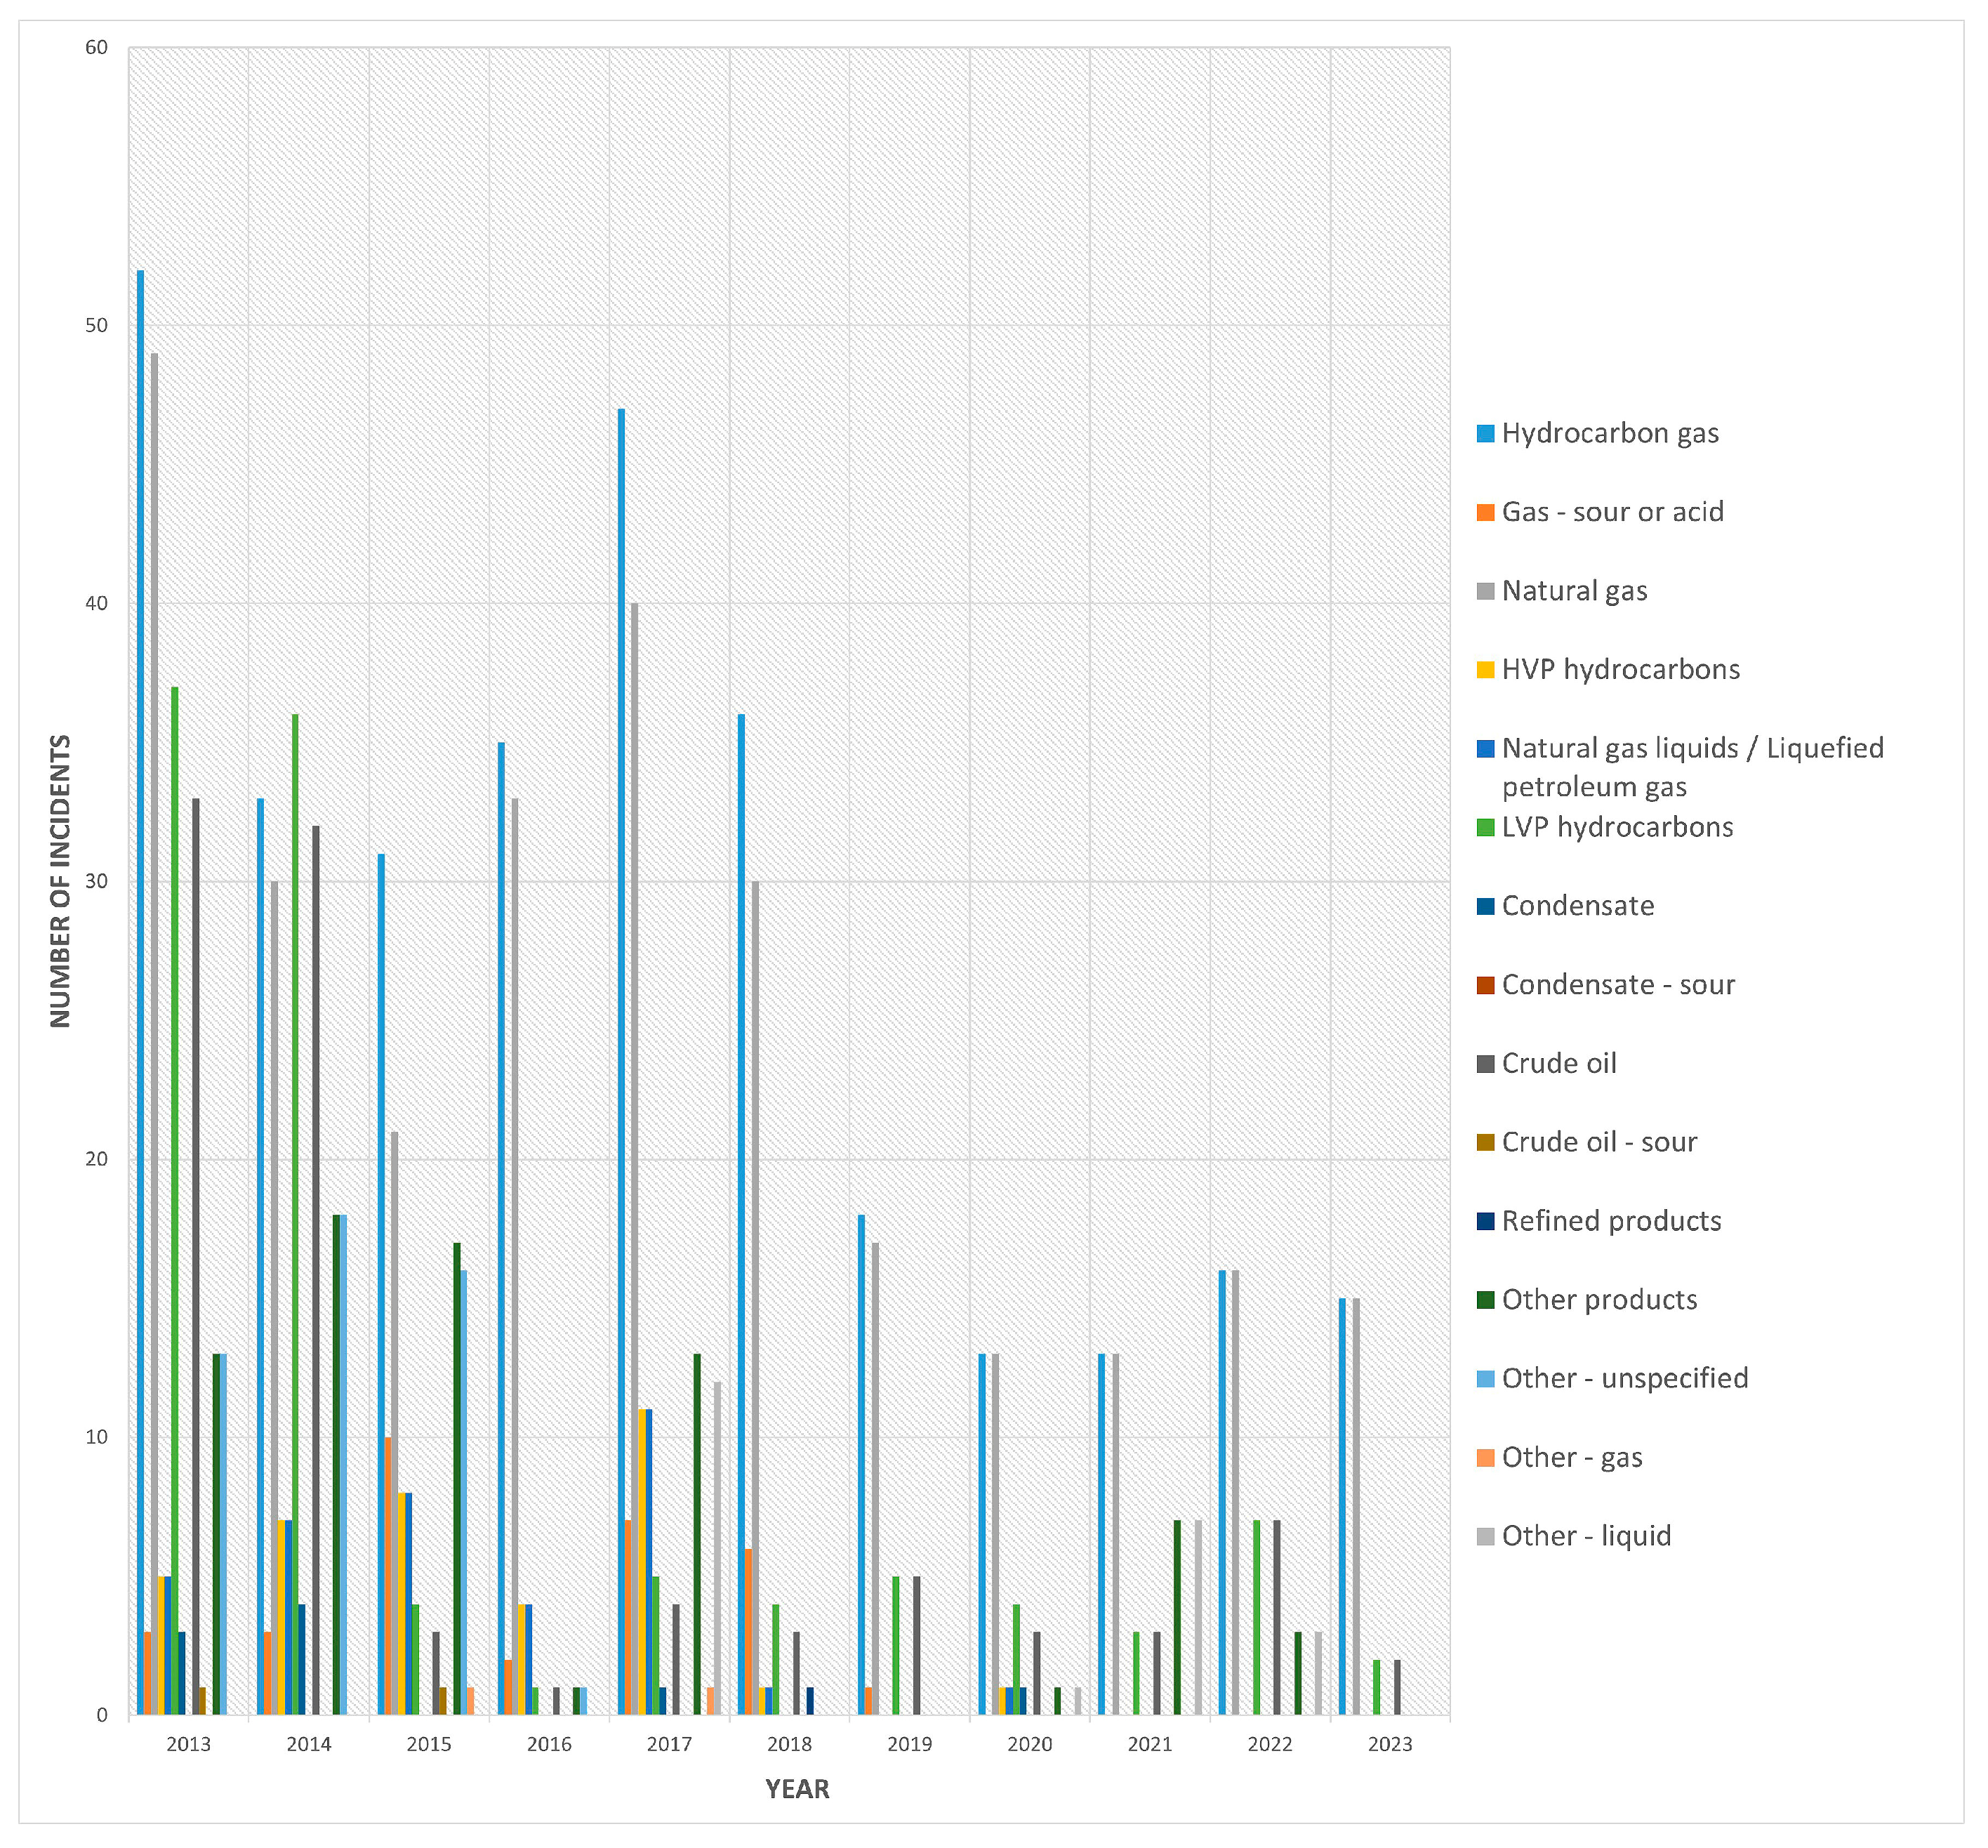
The breakdown of accidents and incidents by affected object and media transported is shown in
Figure 11 and
Figure 12. Transmission lines and compressor stations were affected by accidents with 27.1, and 10.4%, respectively. The situation is similar for incidents, where transmission lines and compressor stations were involved with 57.4, and 30.9%, respectively.
Natural gas was the most common substance in incidents until 2018, with 49 cases in 2013 and 40 cases in 2017. After 2017, the number of incidents fell significantly and stabilised at 13 to 16 per year from 2020. This trend indicates a significant improvement in the control, monitoring, and maintenance of the gas pipeline infrastructure. In 2013 and 2014, low vapour pressure (LVP) hydrocarbons recorded a very high number of incidents with 37 and 36 cases, respectively. However, this was followed by a sharp decline, with the number of incidents falling to just 2 by 2023. The number of incidents related to crude oil is continuously decreasing, from 33 cases in 2013 to only 2 in 2023. Nevertheless, there are still occasional incidents involving crude oil; for example, 7 cases were recorded in 2022. Incidents involving high vapour pressure (HVP) hydrocarbons occurred occasionally until 2017, but after that, they almost completely disappear from the statistics. The categories “Condensate”, “Refined products”, and “Substances” have a very low frequency of incidents, usually between 0 and 4 per year.
4. Analysis of Accidents in Oil and Gas Pipeline Transport
An integrated analysis of accidents in oil and gas pipeline transport systems was carried out by comparing and summarising the data available in the previously presented databases. Each database has its own specifics but is used for the same purpose of minimising the risk of failures. The comparisons of basic characteristics of considered databases are shown in
Table 3.
Figure 13 shows the breakdown of accidents by the four main databases used in this study. Although a comprehensive overview of the available sources of accident information revealed seven databasis, two of them (ARIA and eNatech) were not found to be suitable for this particular analysis due to their limitations in this context. As the basic aim of the ARIA database is to present experiential feedback as a risk prevention tool, which means that it does not claim to be exhaustive, the data were not considered suitable for this analysis. As the eNatech database only contains Enatech accidents, it was also not applicable. However, their consideration is important for formulating recommendations for their use in future analyses, depending on the purpose and needs of the research. The reporting period of the EGIG database was 1970–2022, that of the Concawe database 1971–2022, TSB 2013–2023, and of PHMSA 2005–2024.
In order to enable a more unified and systematic interpretation of the data, and thus facilitate a cross-comparison of accident causes, the categories are divided into five main groups (
Table 4): “Corrosion and material damage”, “Environmental influences and forces of nature”, “Human factors and operational disruptions”, “Technical failure”, and “Extraordinary Accidents and Safety failures”.
The proposed categorisation into five clear groups is suggested as it allows for precise risk identification and effective safety management. The first category, corrosion and material damage, includes corrosion, a long-term and gradual process of chemical degradation of materials. It does not occur suddenly but develops over time and requires special preventive measures such as constant monitoring of corrosion and the condition of the pipe’s protective coating, which enables a timely response in the form of the application of appropriate solutions depending on the location of the damage (application of a new layer of coating, fitting of clamps, and, if necessary, replacement of part of the pipe). The second category refers to sudden technical failure, such as material breakage, mechanical failure, or design faults. Here, the cause is not the environment or human, but a technical weakness or material fatigue. This category requires solutions such as design improvements, inspections, and replacement of worn parts. The third category, environmental influences and forces of nature, includes all problems caused by forces of nature. These include earthquakes, floods, and landslides, but also geotechnical effects. Protective measures refer to proper siting, planning, and building in a safe manner that protects against natural hazards. Such accidents can happen again due to the long service life of the pipeline, but the monitoring technologies available today make it possible to quickly detect such situations in areas that are difficult to access. The fourth category, Human factors and Operational Disruptions, includes failures caused by human action, whether through operator error, working outside authorised limits, third parties, or negligence. Here, it becomes clear how important it is to invest in employee training, work monitoring and clearly defined work processes. The fifth category, Extraordinary Accidents and Safety Failures, deals specifically with consequences such as fires, explosions, and leaks. The key factor here is the fact that these events are extremely dangerous by nature and always require special emergency measures and safety protocols. Unfortunately, such events are difficult to predict despite frequent monitoring.
The following formulas were used to calculate the number of accidents within each specific category:
where
Ba = Number of accidents within each specific category
P = Percentage within the specific data base, %
Ua = Total number of accidents for the specific base.
Then, for each group of categories, the accidents from all corresponding specific categories in all databases were totalled to obtain the total number of accidents per group. These totals were then converted into percentages of the total number of accidents, resulting in the percentage (relative representation) of each group.
where
Ps = Percentage for the group in relation to the total number of accidents
Bs = Number of accidents per each group
Tba = Total number of accidents for all groups.
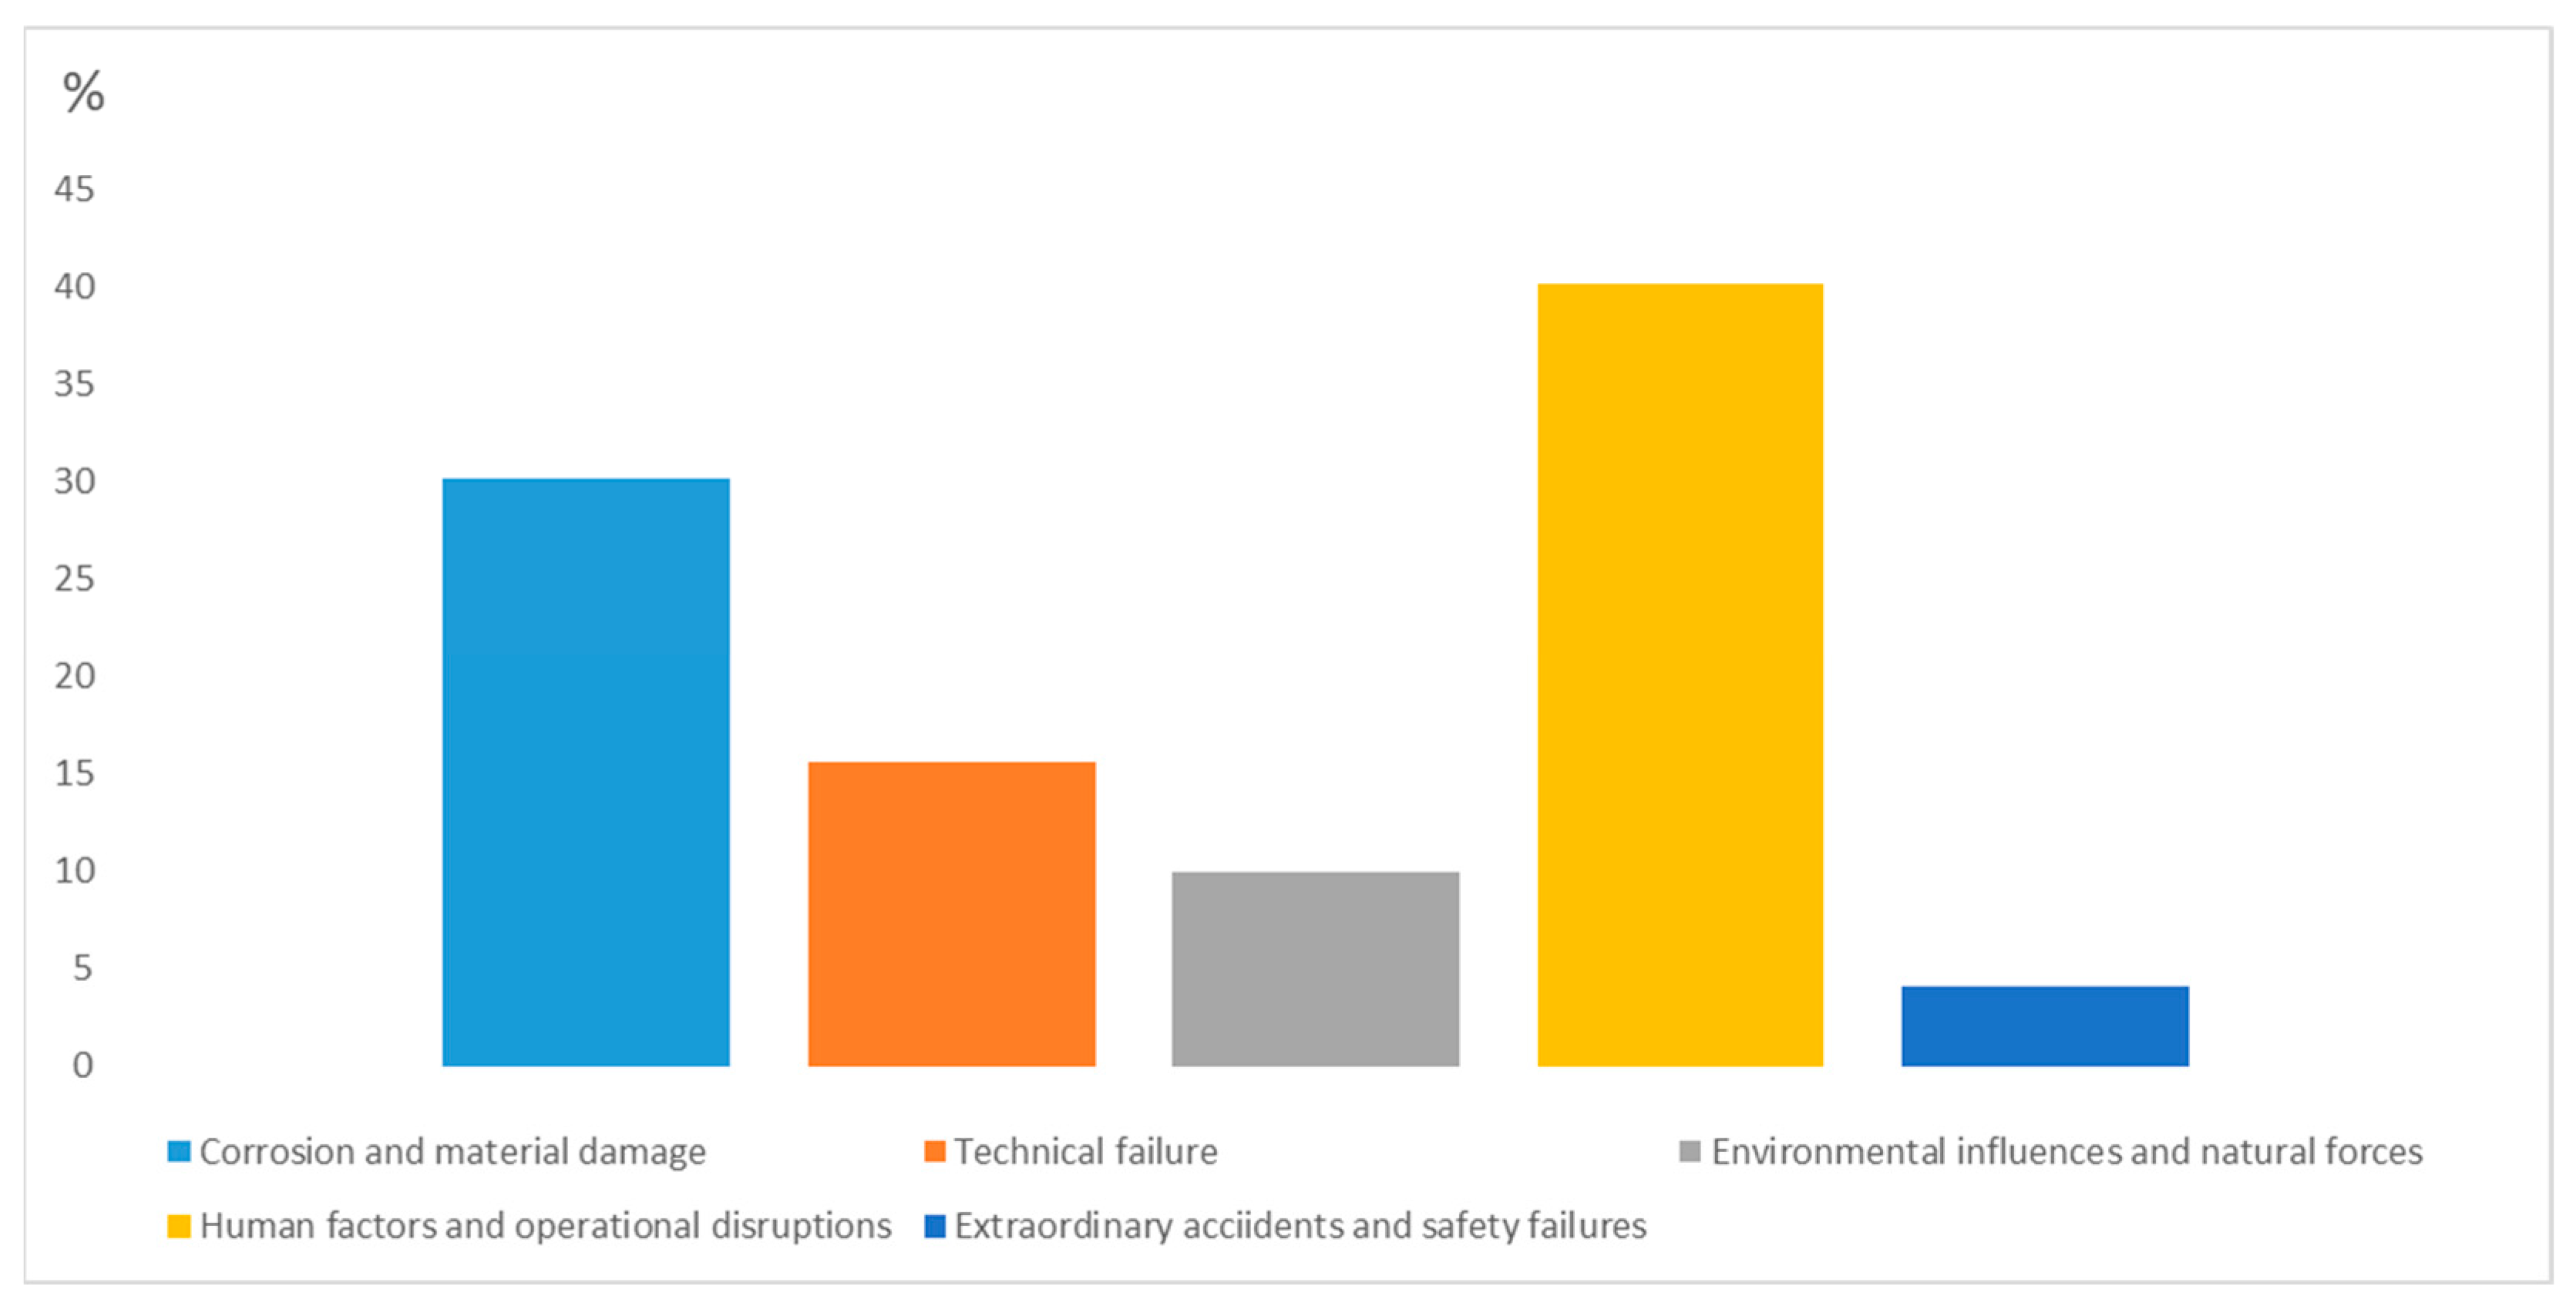
Figure 14 shows the calculation results, and it is clear that the “Human factors and Operational disruptions” and “Corrosion and Material Damage” account for the largest share of all recorded accidents, with 40.2% and 30.15%, respectively. On the other hand, the group “Extraordinary Accidents and Safety Failures” accounts for only 4.95% of accidents, indicating that such incidents are less frequent but potentially very serious.
Based on the analysis of the availability and content of the databases considered, it is recommended to use specific databases according to need as follows: The EGIG database is best suited for comprehensive studies on gas pipeline accidents in Europe due to detailed statistical data and long-term trends. It publishes updated data in the form of statistical summaries of reported releases. The CONCAWE database is ideal for environmental studies and safety risk analyses of oil pipelines as it contains detailed information on oil spills. It contains a large number of reports on oil pipelines and their environmental impact. The eNatech database contains “Natech” accidents. Although the database itself does not contain much information on pipeline accidents, its use can be beneficial for general searches for “Natech” accidents. The PHMSA database is the most comprehensive database of accidents in the USA that is publicly accessible and provides comprehensive data on accidents and their consequences. It is important to note that it is a selection of representative or significant accidents and not a complete register of all incidents. The purpose of the database is therefore different, as it provides information on real accidents and shares experiences.
Comparison of the data from the EGIG, CONCAWE, PHMSA, and TSB databases shows clear regional differences in the causes of accidents involving pipelines for the transport of oil and gas in Europe, the USA, and Canada. In Europe, according to EGIG and CONCAWE data, the most common causes of pipeline accidents are third-party actions, which account for 27% of all incidents involving gas pipelines and 37% for oil pipelines. Another important cause is corrosion problems, which account for 26% of accidents in gas pipelines and 21% in oil pipelines. This data emphasise the importance of proper maintenance and protection of pipelines from external influences and internal deterioration.
In the USA, on the other hand, PHMSA data show that corrosion is the main cause of accidents. It is responsible for up to 32% of all cases, which is significantly higher than the European average of 23.5%. Excavation damage is also a common cause of accidents in the USA, with a similar proportion of 32%. These findings point to the particular challenges faced by pipeline operators in the US, where corrosion protection and control of activities near pipelines are critical to minimising risk.
In Canada, the situation is different, according to data provided by TSB. Geotechnical, hydrological, and environmental factors cause as much as 35% of all accidents, which is significantly higher compared to Europe, where these factors account for 15.76% of accidents on gas pipelines and only 3% on oil pipelines, and the USA, where these factors cause only 7% of incidents. Contact with objects in Canada also causes 11.25% of accidents, while unauthorised third-party activities account for 9.38% of incidents, totalling 20.63%. When comparing these causes with those in Europe and the USA, where third-party actions average 32% of accidents, these specific causes are less prevalent in Canada. This difference emphasises the importance of local geotechnical and environmental conditions as key factors in planning and maintaining the safety of pipelines in Canada.
Although the approach used helps to identify common causes of accidents in oil and gas pipeline transport systems and provides a better insight into the main risks that recur in practise, several important limitations need to be considered. Some databases are specialised in certain types of pipelines (EGIG focus on gas pipelines, while Concawe covers oil pipelines, PHMSA database differ natural gas pipelines, hazardous liquid pipelines, and liquefied natural gas (LNG) plants), which further limits the comparability of the data, as does the fact that the databases cover different regions and time periods. In addition, the data were not weighted in the analysis according to pipeline length, transport intensity, age, or other factors that could influence accident frequency. Therefore, the results only show the absolute numbers and percentages within the available data, without taking into account the differences in size and importance of the individual systems.
5. Conclusions
Standardisation, technical rules, and regulatory requirements are the key to preventing accidents in the increasingly complex and extensive oil and gas transport systems. They rely on a systematic approach that integrates prevention, detection, and mitigation as the key to safety.
Advanced real-time monitoring systems, next-generation sensors, and data analysis algorithms enable early detection of potential failures, increasing the effectiveness of preventive measures. New technologies also help to mitigate the consequences of accidents faster and more precisely, reducing the risks to the environment, people, and property.
The reduction in the number of accidents due to corrosion could be positively influenced by standardised regulatory changes in the sense that pipeline operators above a certain age and diameter of the pipeline (due to the amount of transported fluid-especially oil) and the quality of the pipe material are obliged to monitor the condition of the pipeline with an inline tool. In this way, it would be possible to further increase the safety of pipeline transport through a combination of a technical approach (maintenance and monitoring of pipelines) and regulatory changes. More frequent monitoring of the condition of pipelines would have a positive impact on reducing accidents caused by human factors, failures, and technical failures. More frequent surveillance of pipeline routes would reduce the number of accidents caused by environmental factors and forces of nature, and probably also accidents from the extraordinary accidents and safety failure group.
However, understanding and analysing past accidents enables the adoption of measures to prevent similar events from happening again in the future.
The systematic collection of accident data has been carried out by various organisations worldwide for many years, so that the data collected in this way form the basis for the development of prevention strategies and the improvement of safety standards. The integration of historical data helps to make decisions in the area of risk management, which is crucial for industrial safety. By analysing the statistical data from the most important databases of various national and international organisations, such as the European Gas Pipeline Accident Data Group (EGIG), Conservation of Clean Air and Water in Europe (CONCAWE), eNatech, Transport Safety Board of Canada (TSB), and Pipeline and Hazardous Materials Safety Administration (PHMSA), the following conclusions emerge:
A comparative approach based on the analysis of statistical data from various databases can show which practises and conditions contribute to greater reliability of the system and which pose risks, which is crucial for the policy of planning a future energy infrastructure.
Based on the analysis of the availability and content of the databases considered, it is recommended to use specific databases according to need because each database has its own specific advantages.
As the main purpose of the ARIA database is to collect empirical information for risk calculation, the data from this database were not considered suitable for this analysis, which requires a larger representative sample. Although ARIA is not a classic statistical database, it is used to store information and obtain valuable practical feedback on technological accidents.
The eNatech database, which only records accidents related to Natech events, was also not applicable in this context. The eNatech database contains “Natech” accidents and its use can be beneficial for general searches for “Natech” accidents.
The EGIG database is best suited for comprehensive studies on gas pipeline accidents in Europe due to detailed statistical data and long-term trends.
The CONCAWE database is ideal for environmental studies and safety risk analyses of oil pipelines as it contains detailed information on oil spills.
The TSB provides users with both data and statistics on pipeline occurrences. The TSB’s recommendations have a significant impact on standards, procedures, and safety practises in the transport sector across North America.
The PHMSA database is the most comprehensive database of accidents in the USA that is publicly accessible and provides comprehensive data on real accidents and their consequences.
Comparison of the data from the EGIG, CONCAWE, PHMSA, and TSB databases shows clear regional differences in the causes of accidents involving pipelines for the transport of oil and gas in Europe, the USA, and Canada.
In the databases analysed, the groups “Human factors and Operational disruptions” and “Corrosion and Material Damage” account for the largest share of all recorded accidents, with 40.2% and 30.15%, respectively, indicating that these causes are the most common of all accidents recorded.
The group “Extraordinary Accidents and Safety Failures” accounts for only 4.10% of accidents, indicating that such incidents are less frequent but potentially very serious.


