1. Introduction
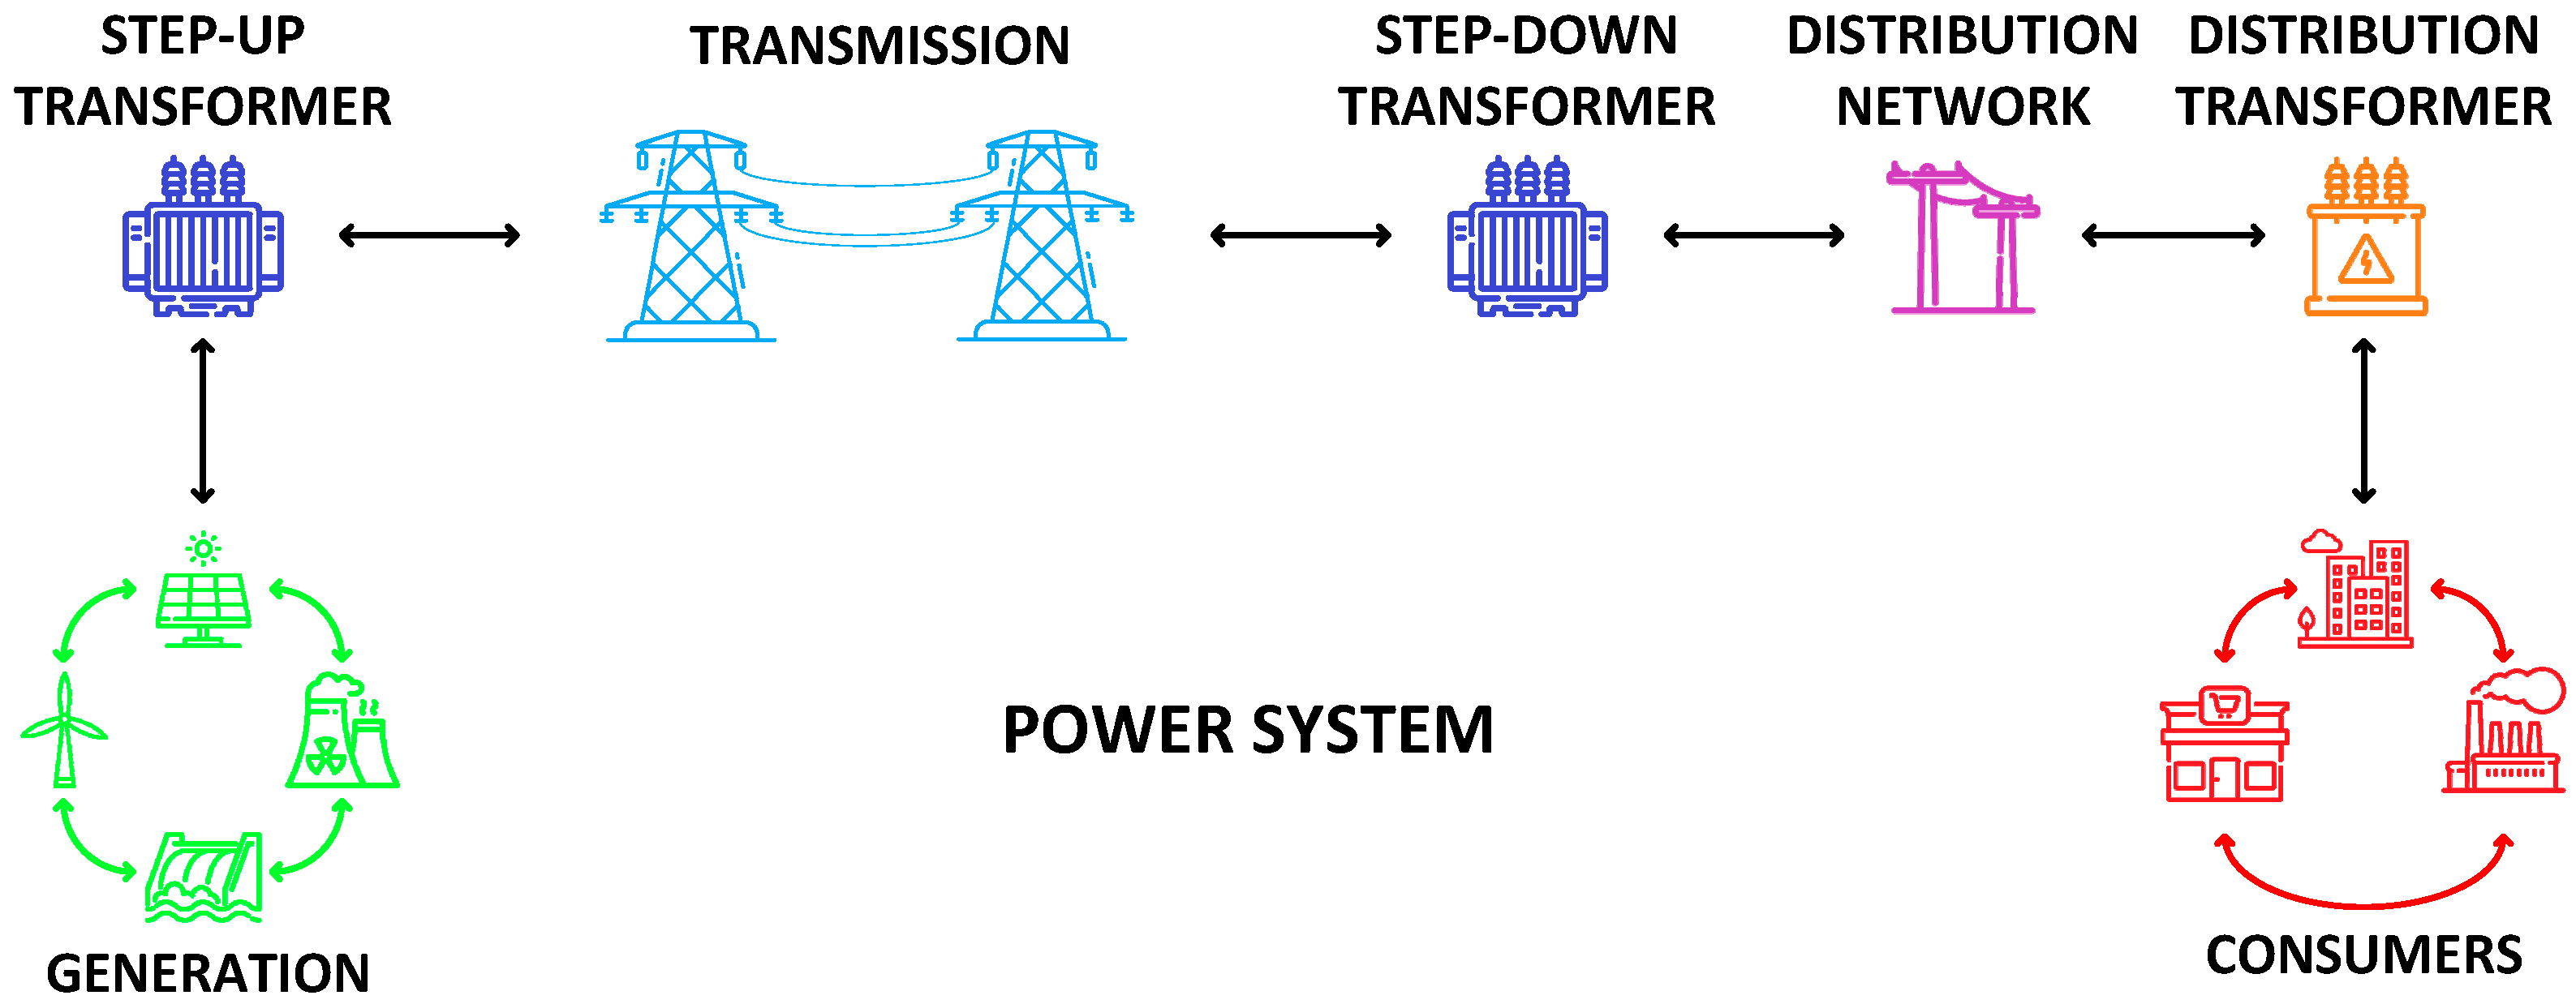
Electric power systems as we know them would not be possible without transformers. These devices are essential to the operation of the electric sector and represent significant investments for utility companies. Present in generation, transmission, and distribution segments, transformers are crucial to the operational reliability of these companies and, consequently, of the entire power system as they connect different voltage levels, as illustrated in
Figure 1.
Given their systemic importance, transformer failures can lead to significant financial, social, and regulatory impacts for the operator. Consequences include high replacement or repair costs, power supply interruptions, large numbers of affected customers, extended repair lead time, financial compensation, safety risks for personnel, environmental damage, regulatory penalties, and intangible losses such as company image.
Throughout their service life, from energization to decommissioning, whether due to failure or retirement, transformers are subject to various stress factors: electrical, thermal, chemical, and mechanical. These cause degradation, reducing the asset’s useful life. Such degradation may occur under normal conditions, within the limits for which the equipment was designed, or abnormal conditions, where accelerated aging occurs, potentially leading to early failure if these conditions persist.
In recent years, growing global demand for transformers has significantly increased acquisition costs and extended manufacturing lead times [
1]. This scenario presents additional challenges for utilities, especially in unplanned replacement situations, requiring a review of asset management practices and reserve equipment planning.
Within this challenging context, efficient asset management becomes strategic. On the one hand, there is increasing pressure for a continuous, high-quality electricity supply; on the other, there are shortages on the market supplier side. Therefore, it is critical for companies to have access to the highest possible level of data about the risk associated with each transformer in their fleets—a task that is far from trivial in practice.
Traditionally, a condition assessment based mainly on maintenance data was used, which mainly followed time-based preventive plans, including periodic visual inspections, oil sampling, functional tests on accessories, electrical tests, and inspections of on-load tap changers (OLTCs). However, in recent decades, new tools and technologies have emerged to assess asset conditions, with continuous monitoring becoming an increasing trend and enabling advanced maintenance strategies. Nevertheless, this level of advancement does not yet apply to a large portion of the existing fleet, which includes transformers of varying ages and limited condition data.
Several studies aim to estimate power transformer conditions based on maintenance and continuous monitoring system data. In [
2], a model based on fuzzy logic (FL) is proposed, applied to the dissolved gas analysis (DGA) method, interpreted using the key gas method and the Dornenburg ratio method for assessing transformer condition. A multilevel condition assessment framework based on Dempster-Shafer theory for the condition-based assessment and maintenance of power transformers is presented in [
3]. The authors of [
4] present a condition assessment based on a generative adversarial network and convolutional neural network using DGA data. The WG A2.44 [
5] offers guidance for manufacturers and power utilities aiming to understand the key aspects of Transformer Intelligent Condition Monitoring (TICM), supporting the development of projects, processes, and specifications that adopt best practices in condition monitoring and diagnostics while enhancing asset management through the large-scale use of integrated information systems. The main objective of [
6] is to provide a tool for understanding the critical balance between cost and quality in power transformer maintenance.
Furthermore, investment in fleet renewal is constrained by several factors, such as limited financial resources, supplier shortages, and regulatory constraints. Consequently, a tool that enables data-driven decisions based on risk assessment becomes a necessity for managers.
By combining transformer condition data with an assessment of failure impact or consequence, several studies have proposed risk-based decision tools. This risk-based approach applied to a transformer fleet enables more effective resource allocation, optimization of maintenance budgets, and better alignment between technical decisions and business objectives. A literature review was presented in [
7], focused on the main approaches reported for the replacement of oil-immersed power transformers. The paper presented in [
8] illustrates a risk-based maintenance strategy to optimize the operational and maintenance costs for power transformers. The study proposed in [
9] discusses a quality risk assessment method for power transformers based on Fault Tree Analysis (FTA), using manufacturing supervision data to identify defects that may compromise the safety and operational stability of the equipment. In [
10], an indicator to estimate the risk level of power transformers was developed, focusing on oil analysis using a fuzzy logic approach. The paper presented in [
11] proposes a decision-making tool for maintenance planning of power transformers, using a three-dimensional risk matrix that considers health, consequence, and economic indices. Given the increasing importance of the environment and sustainability in asset management, the authors of [
12] focused on assessing the carbon footprint of oil-immersed power transformers using a cradle-to-use Life Cycle Assessment (LCA).
The literature review presented in [
7] demonstrates the relevance of and need for further studies aimed at developing risk assessment tools to support investment strategies for power transformers, given the scarcity of published research on this topic.
Existing methodologies typically rely on traditional criteria such as equipment condition to estimate failure risk. However, these approaches often fall short in capturing the complexity and variety of failure modes observed in practice. In this context, this paper proposes a comprehensive and straightforward framework to support decision-makers in assessing the risk associated with transformers within a fleet. The framework is based on a multi-criteria approach that considers both the probability and the impact of failure. A notable aspect of the proposed approach is its ability to incorporate, in addition to conventional condition-based indicators, a broader set of relevant factors, including statistical, operational, regulatory, environmental, and economic criteria. Furthermore, the model is designed to work with input data that are typically available or easily obtainable by utilities, enhancing its practical applicability and encouraging its adoption in real-world.
It is important to emphasize that the proposed methodology is flexible and does not restrict the assessment to the set of criteria initially suggested. It allows for the inclusion of additional factors according to data availability, the specific context of the company, and the technical expertise of its engineering team. This adaptability allows the framework to be tailored to different utility profiles and operational realities, making it a versatile tool for supporting risk-informed asset management decisions.
2. Theoretical Background
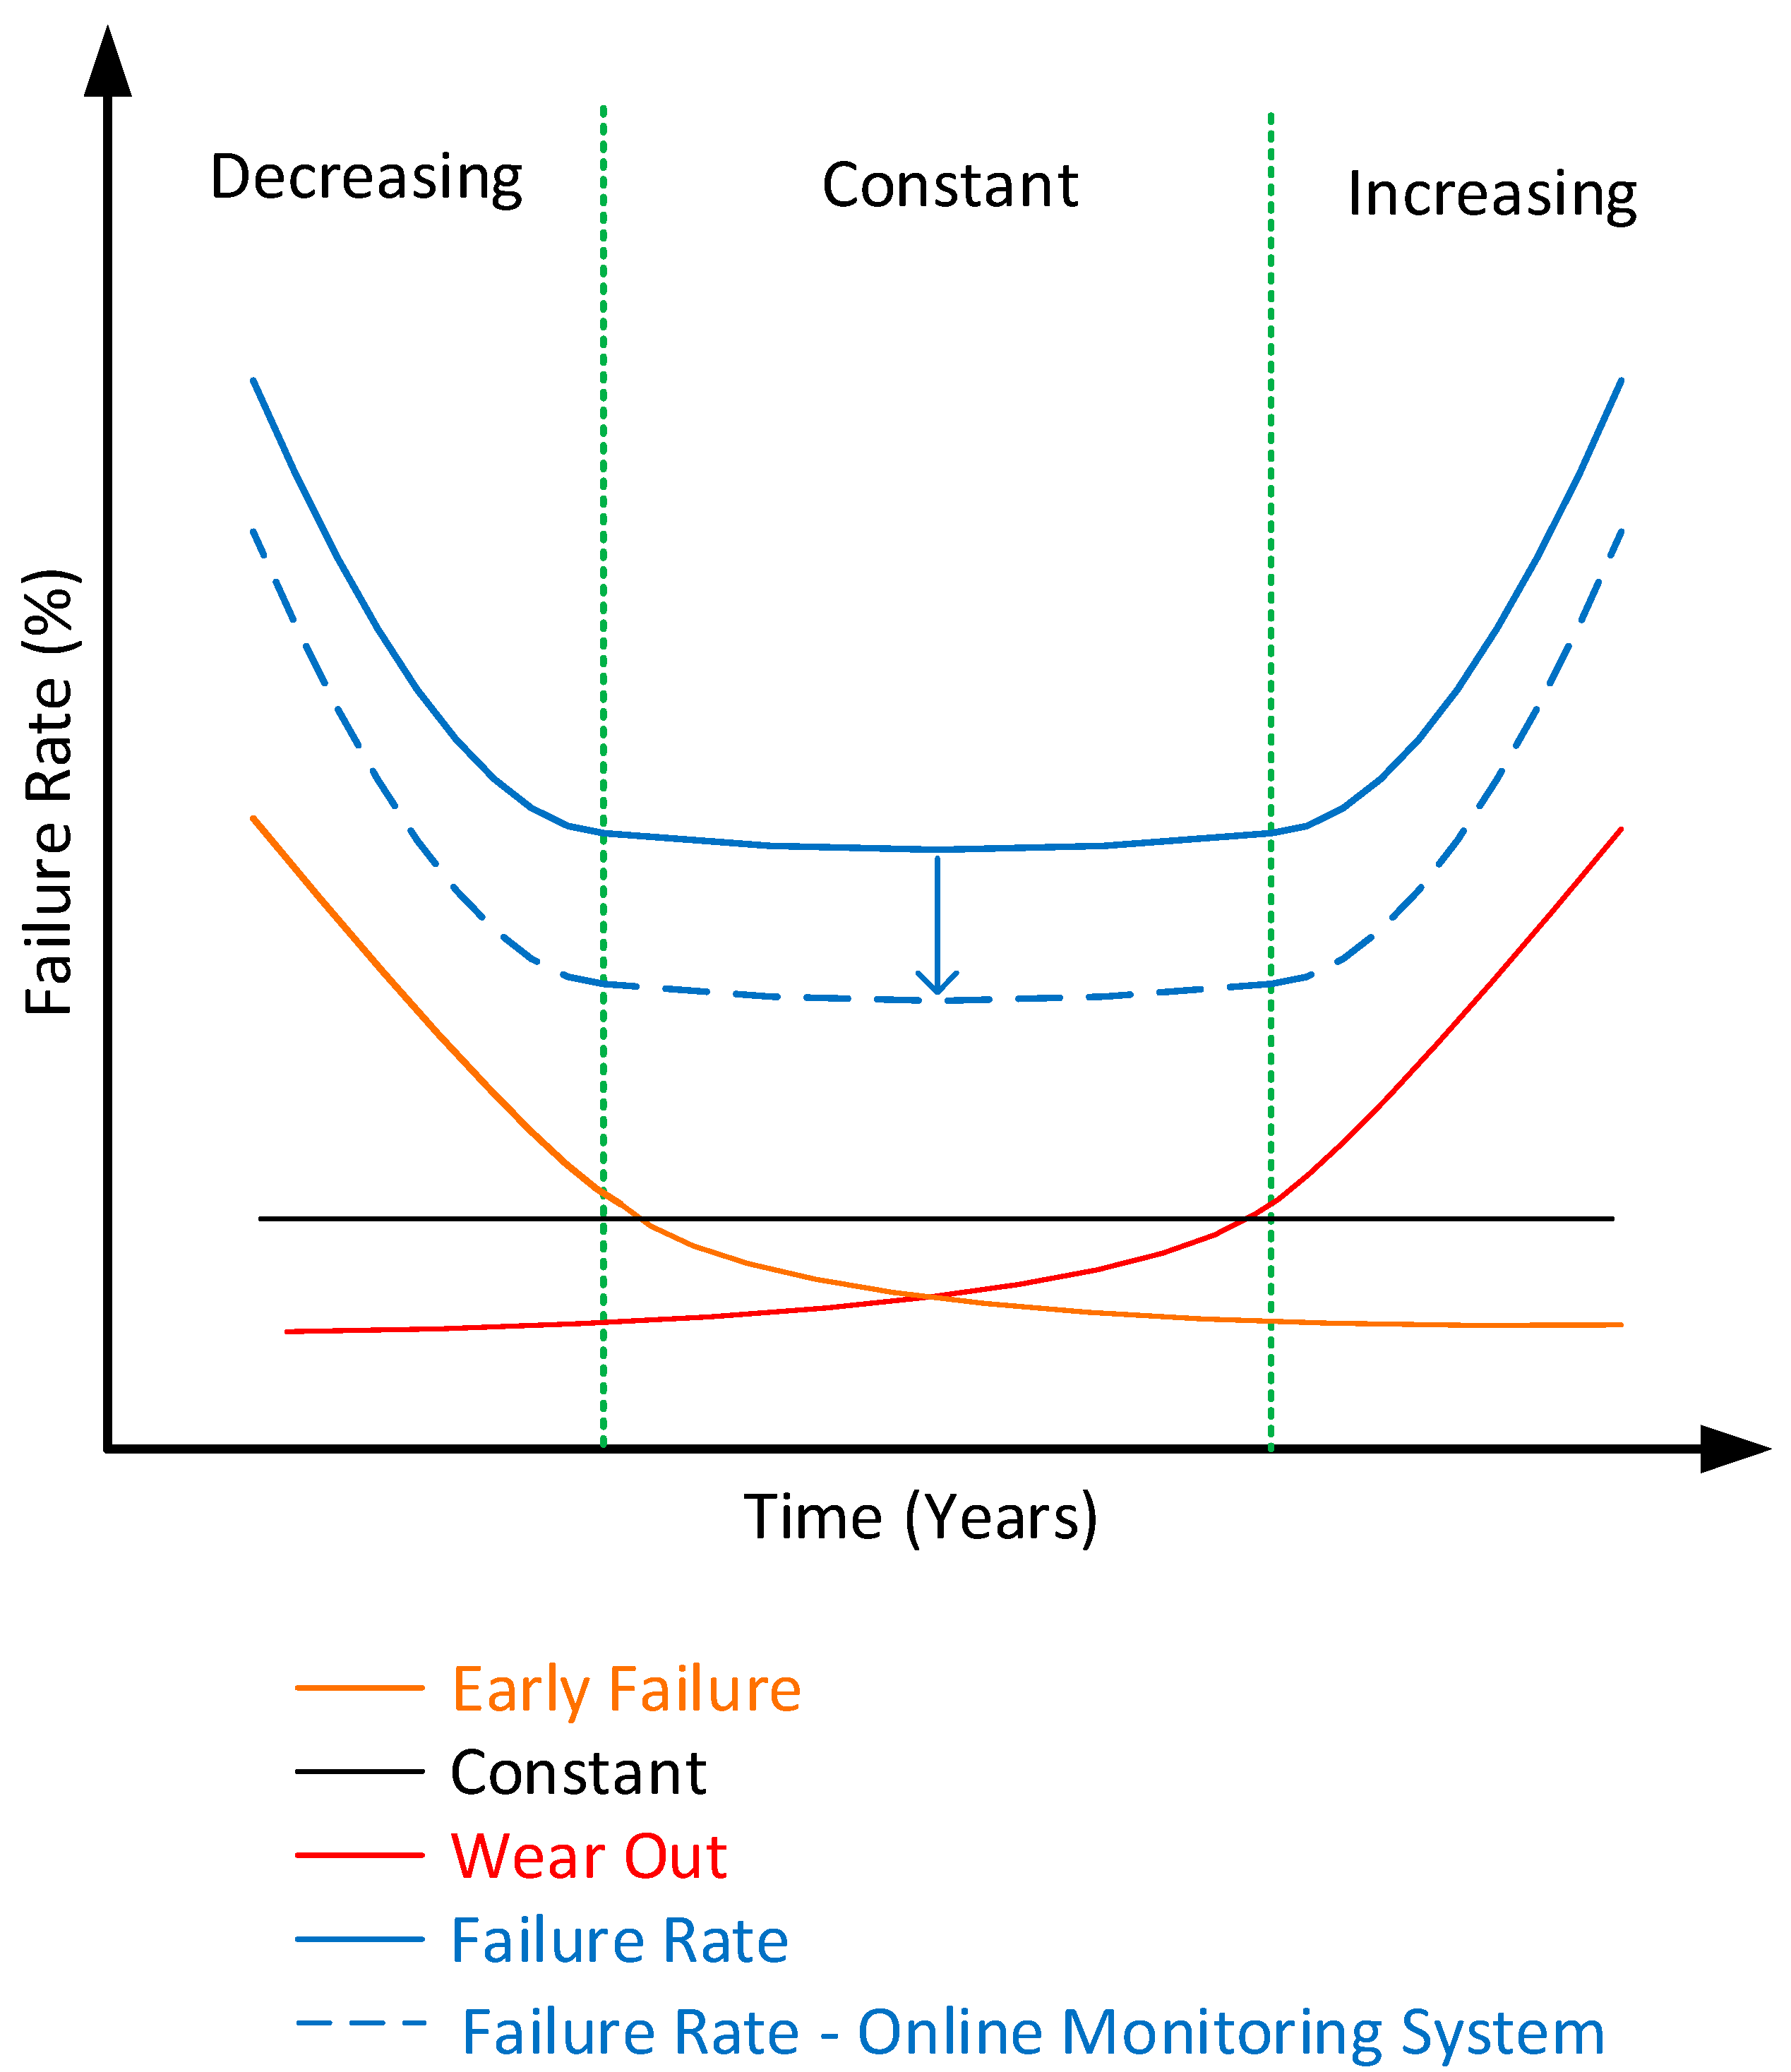
Experience shows that during the life cycle of a power transformer, its failure pattern follows the curve shown in
Figure 2, also known as the bathtub curve [
6,
13]. In this curve, the service life of a transformer is divided into three stages:
Early failure, or the decreasing rate region, usually associated with manufacturing imperfections, transport and commissioning.
The constant failure rate region, representing stable operational conditions.
The wear-out region, marked by an increasing failure rate due to the natural aging and degradation of the transformer.
With continuous transformer monitoring, a reduction in the failure rate over the equipment’s service life is expected, enabling planned replacements, as shown below.
Figure 2.
Transformer failure rate pattern.
Figure 2.
Transformer failure rate pattern.
The WG A2.62 [
14] presents a comprehensive study on transformer reliability. Data about failures and retirements were collected from a population of 37,104 transformers rated above 100 kV, representing approximately 425,000 transformer-years. The study included contributions from 66 companies across 27 countries. The Weibull distribution was used,
where
—hazard rate at age t, in years, representing the instantaneous failure rate given survival until t.
t—transformer age, in years.
—shape parameter, indicating how the failure rate changes over time, representing the different stages in
Figure 2.
—scale parameter, representing the characteristic life (time at which ~63.2% of units have failed).
As expected from
Figure 2, the study conducted by [
14] observed more than one Weibull distribution for the failures considered, as shown in
Figure 3—one representing a constant failure rate for random failures, and another related to wear-out:
where t is given in years. The wear-out region observed in
Figure 3 is approximately 35 years.
Considering the age profile for the population of transformers observed in [
14], a significant portion of these assets are within the region of increasing failure rate due to wear-out. However, the amount of investment required limits the pace of fleet renewal. Therefore, it is essential to understand the risk that these assets represent to their companies in order to prioritize maintenance and investment actions. Failure modes are classified as dielectric, electrical, thermal, physical chemistry, mechanical, and unknown; the result is shown in
Figure 4.
The WG A2.44 [
5] presents the monitored signals for each transformer subsystem and its failure mechanism. Using a similar approach, IEEE Standard C57.143 [
15] presents the transformer components, their failure mode, and the corresponding real-time monitoring signals. The work developed in [
16] establishes a relationship between failure modes and continuous monitoring variables. This makes it possible to visualize the benefit of monitoring a given variable;
Figure 5 presents an update according to data from [
14].
Some of the monitored data in power transformers is well established and widely implemented across most units. It includes parameters provided by transformer protections and accessories, such as load current and voltage, ambient and oil temperature (often obtained through thermal imaging), cooling system, pressure, and oil level.
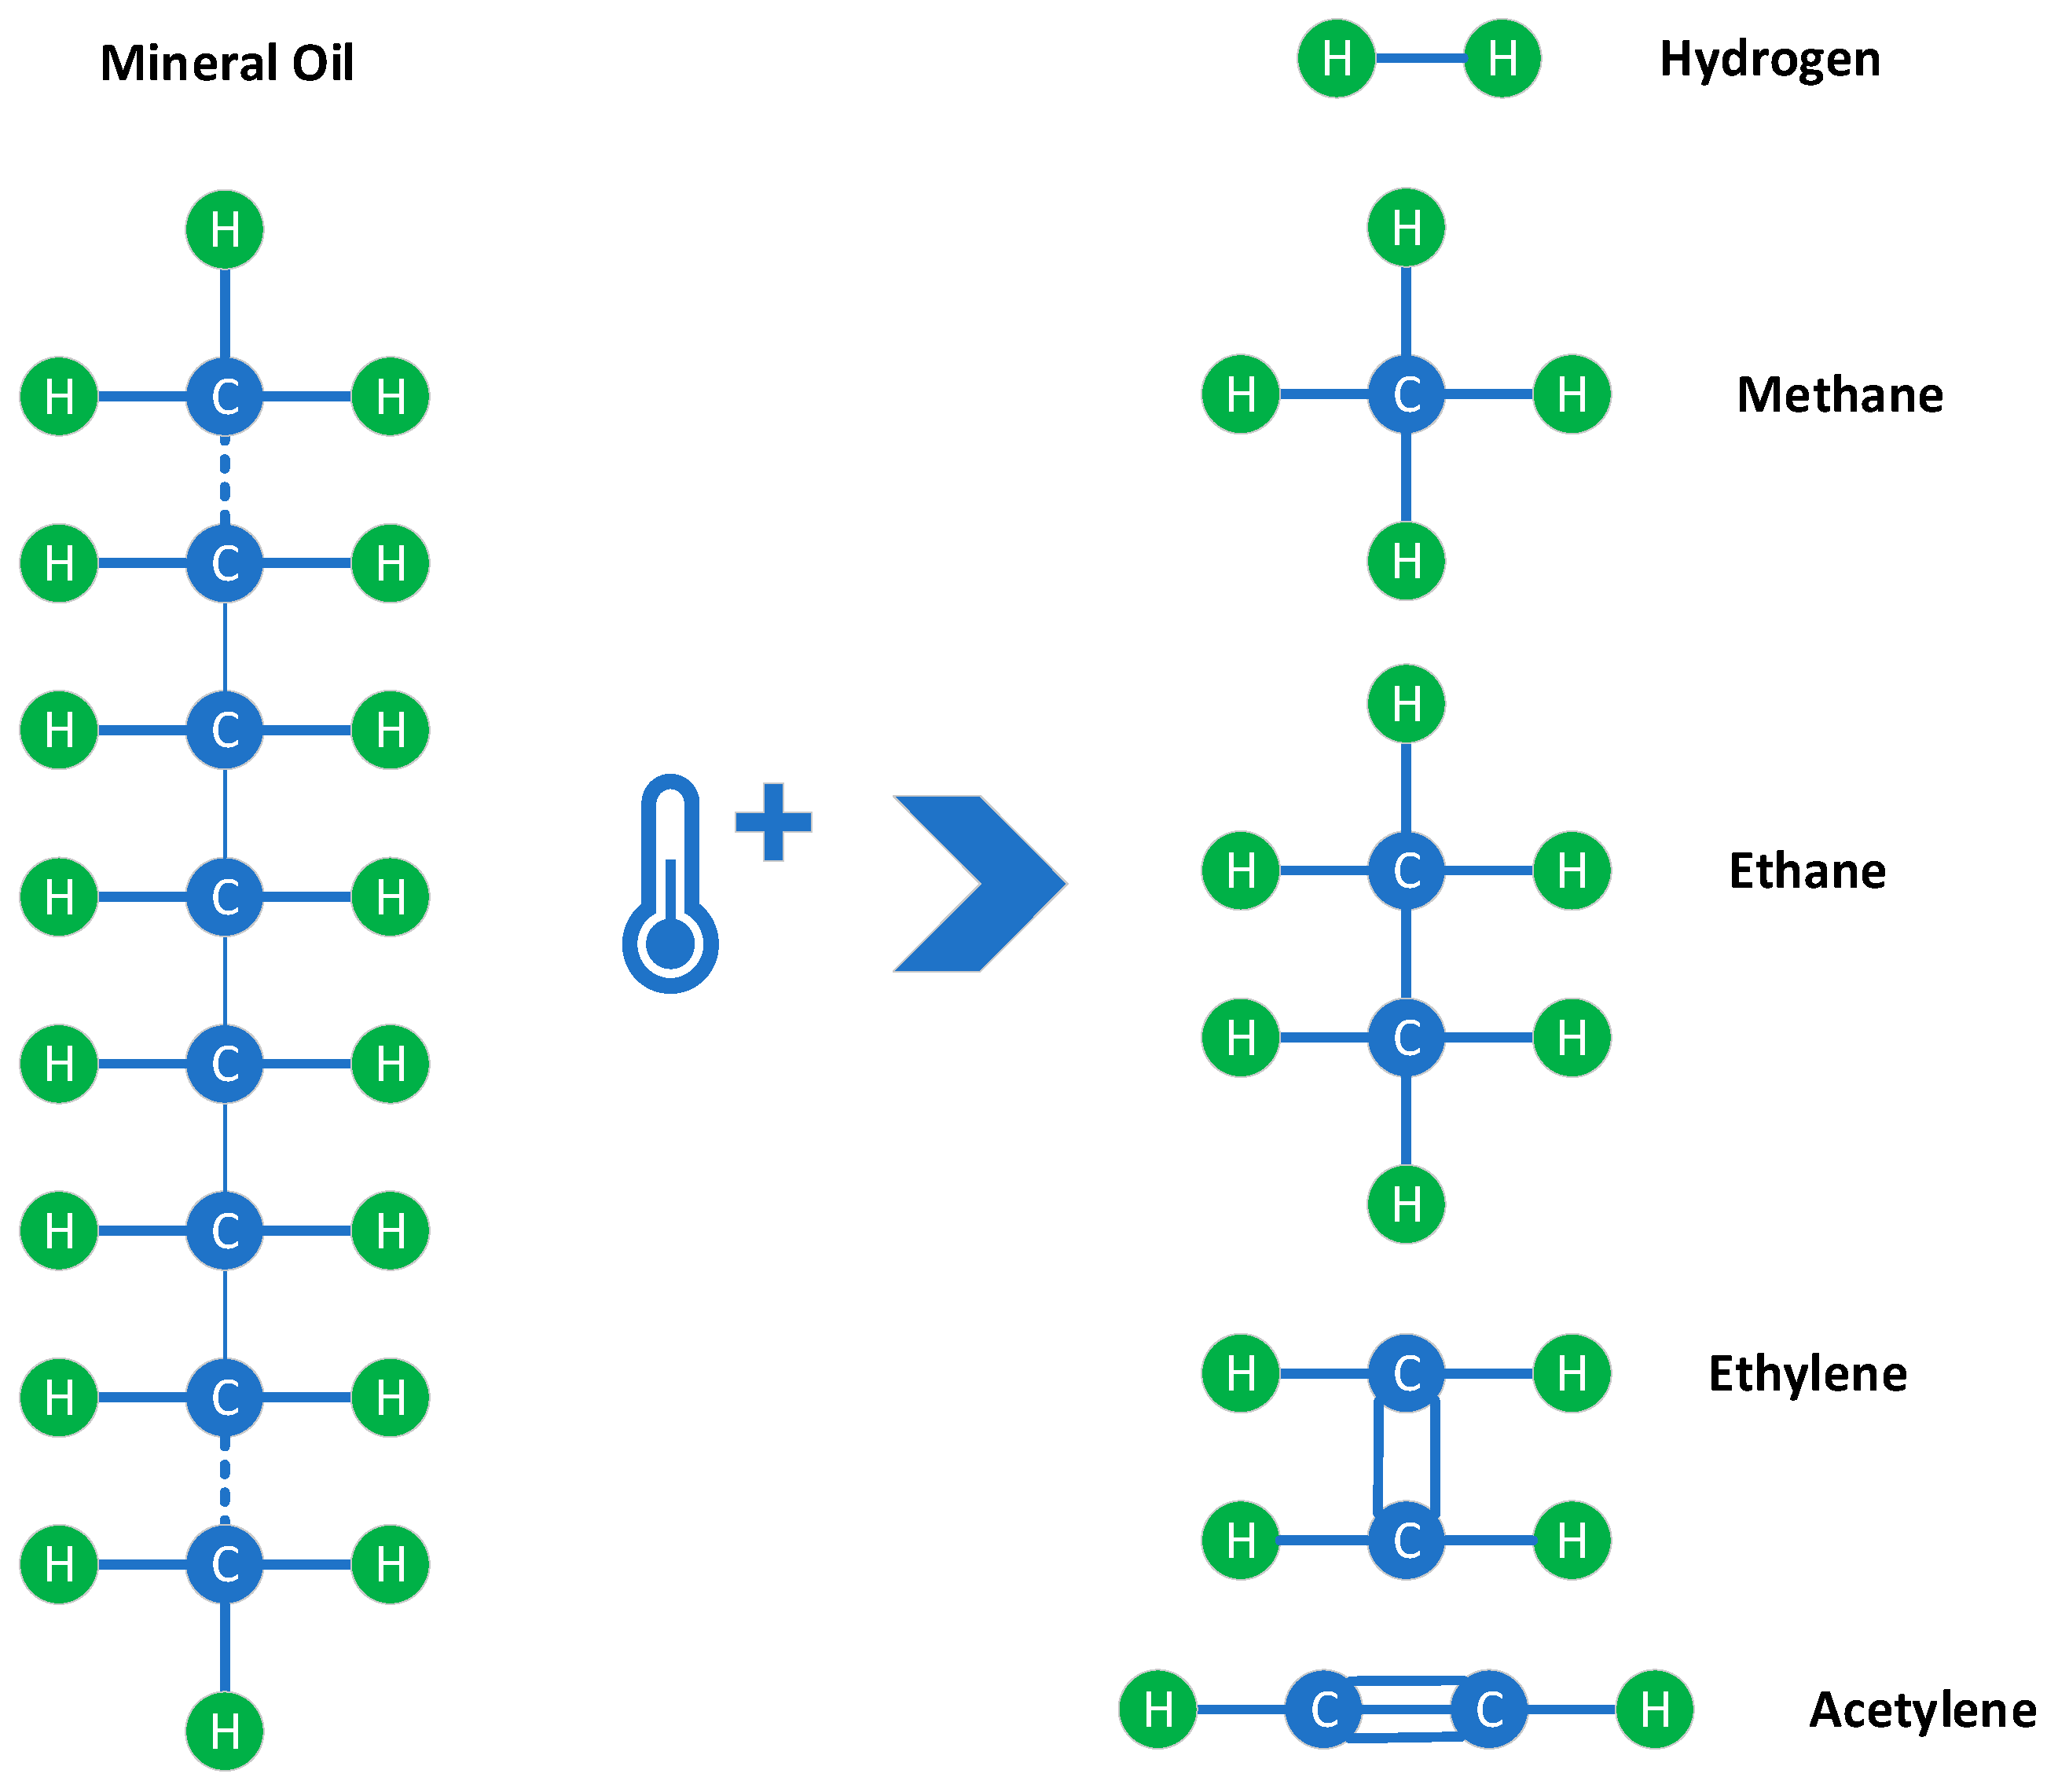
As can be seen in
Figure 5, DGA and moisture demonstrate a high capability for defect detection, addressing various failure modes. This is due to oil’s capability to carry information. Depending on the temperature of an internal event in the power transformer, different types of combustible gases are generated and dissolved in the oil, based on the energy required to break down the insulating oil molecules; the principal gases are hydrogen (H
2), methane (CH
4), ethane (C
2H
6), ethylene (C
2H
4), and acetylene (C
2H
2), as illustrated in
Figure 6. Carbon monoxide (CO) and carbon dioxide (CO
2) are also measured but they are related to solid insulation degradation [
17]. It should be noted that commercially available dissolved gas monitors often come equipped with integrated moisture monitoring capabilities.
The IEEE C57.104 [
17] and IEC 60,599 [
18] standards outline the primary methods for interpreting dissolved gases in oil. References [
19,
20] provide surveys of the technologies used for dissolved gas online monitors.
Partial discharge monitoring has gained attention due to its ability to detect faults at an early stage. These discharges manifest through various physical phenomena such as thermal, chemical, optical, acoustic, and electrical effects. Therefore, they can be detected according to the medium through which their manifestation occurs. Acoustic, electrical, and UHF methods are being increasingly applied in practice.
References [
21,
22,
23] present the main methods for partial discharge detection. In [
24], a monitoring system for PD measurement using the electrical method is presented. The combination of different methods has shown significant results, as the resulting characteristics are complementary when used together.
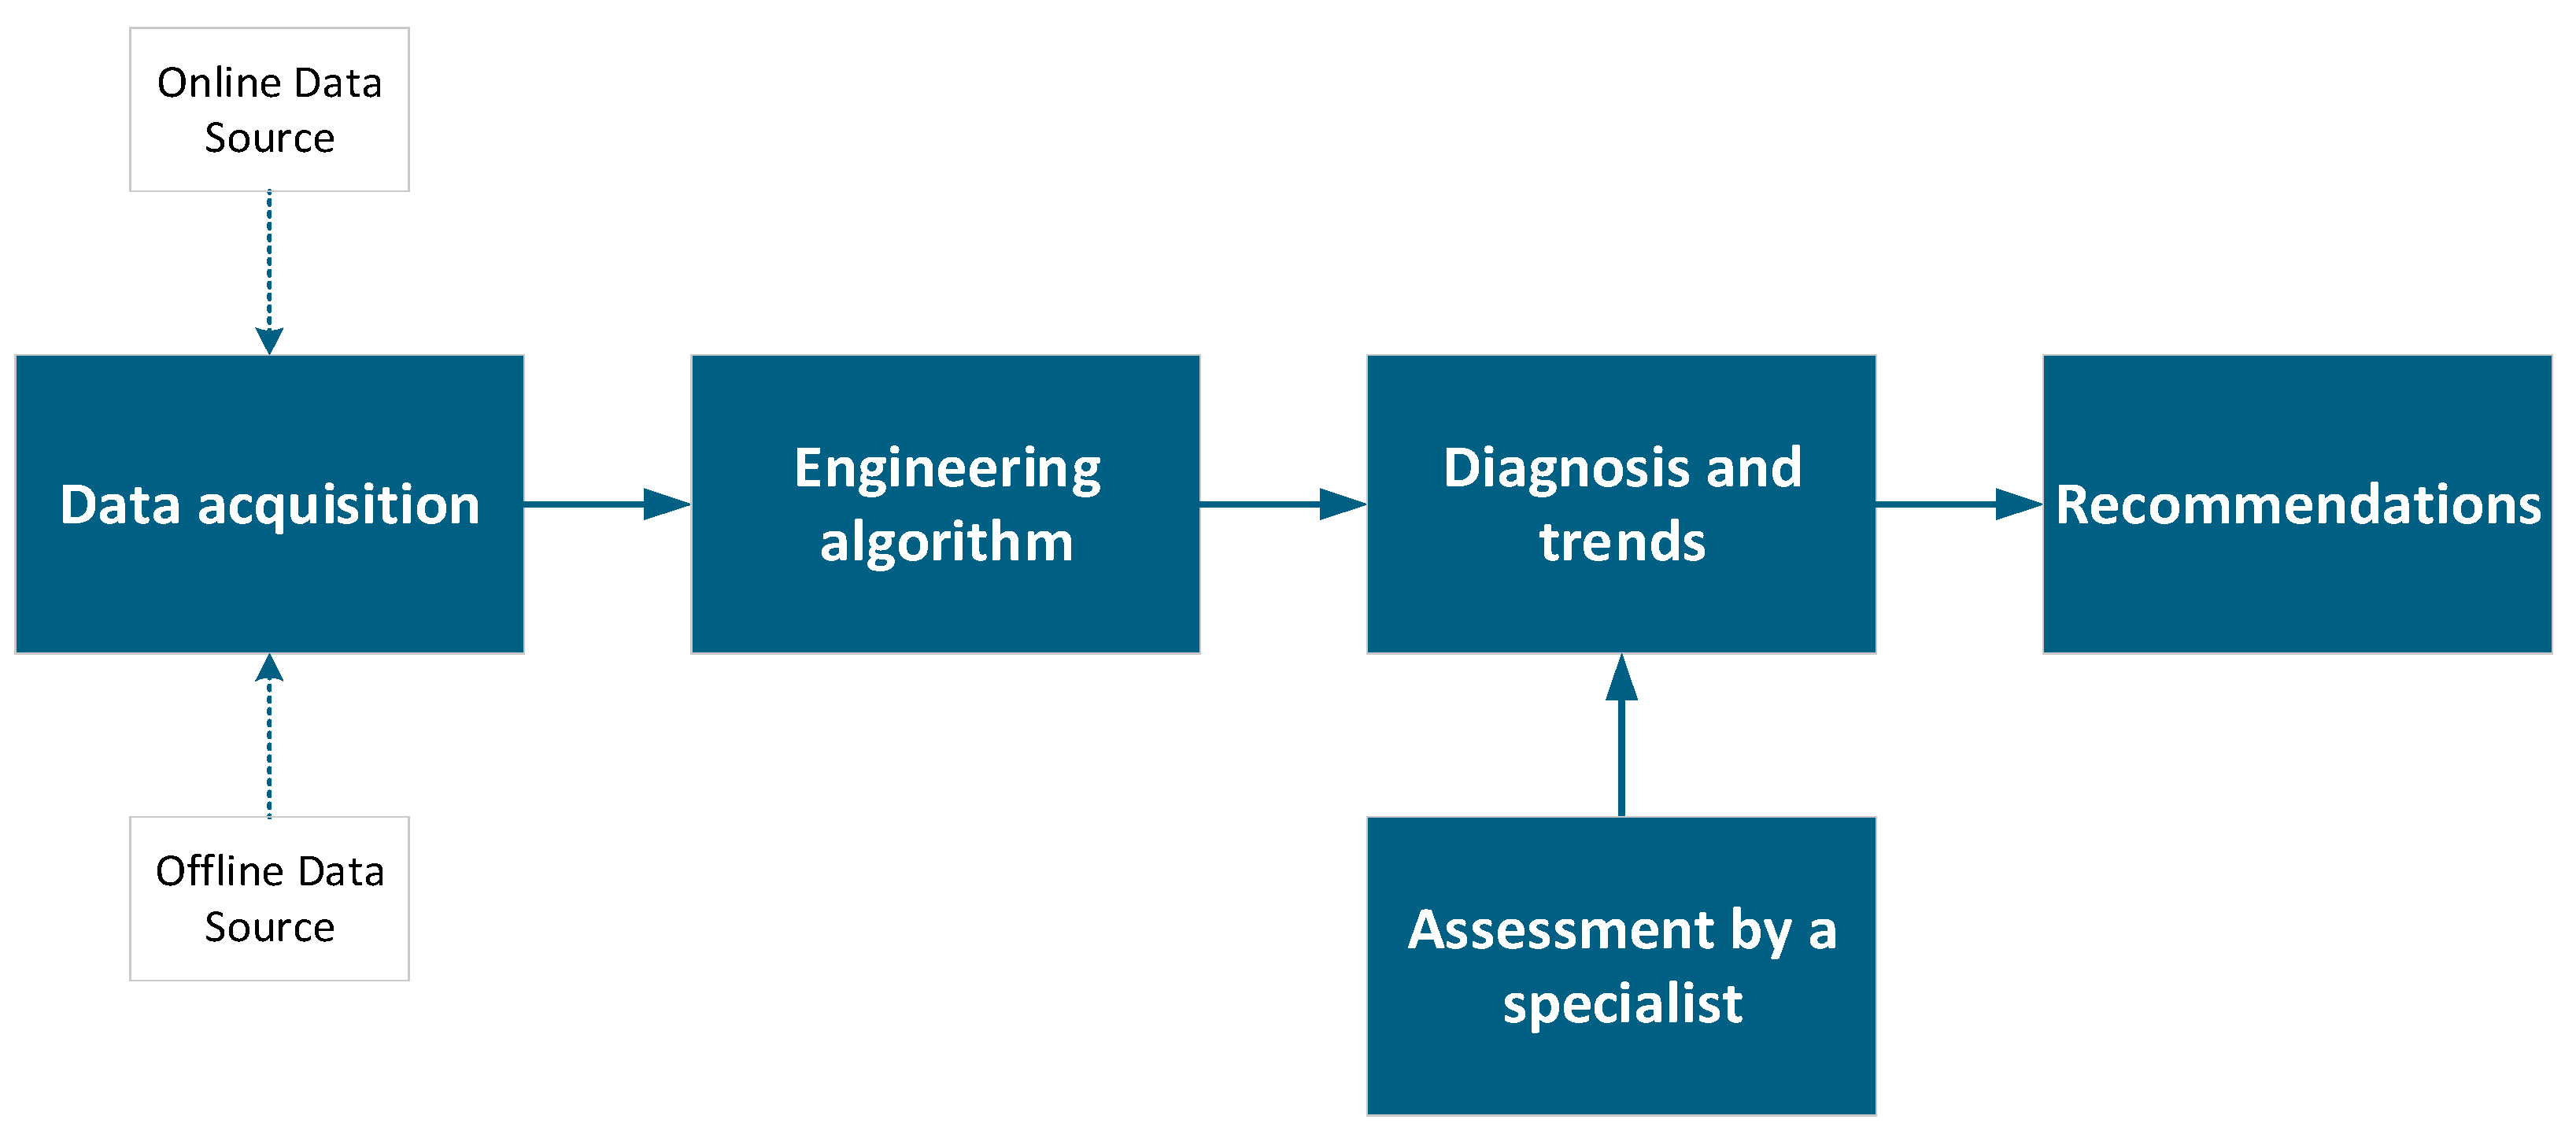
An asset management tool—sometimes referred to as Asset Health Management or, in the case of power transformers, a transformer fleet management tool—should, in general terms, be capable of acquiring data from traditional maintenance plans, offline data, and from different IEDs, gathering as many transformer-related variables as possible. It should incorporate an engineering algorithm responsible for processing this data—either in combination or individually—providing diagnosis and trend analysis and, finally, action recommendations.
Figure 7 illustrates this simplified process, highlighting the role of a specialized engineering team.
3. Risk Assessment
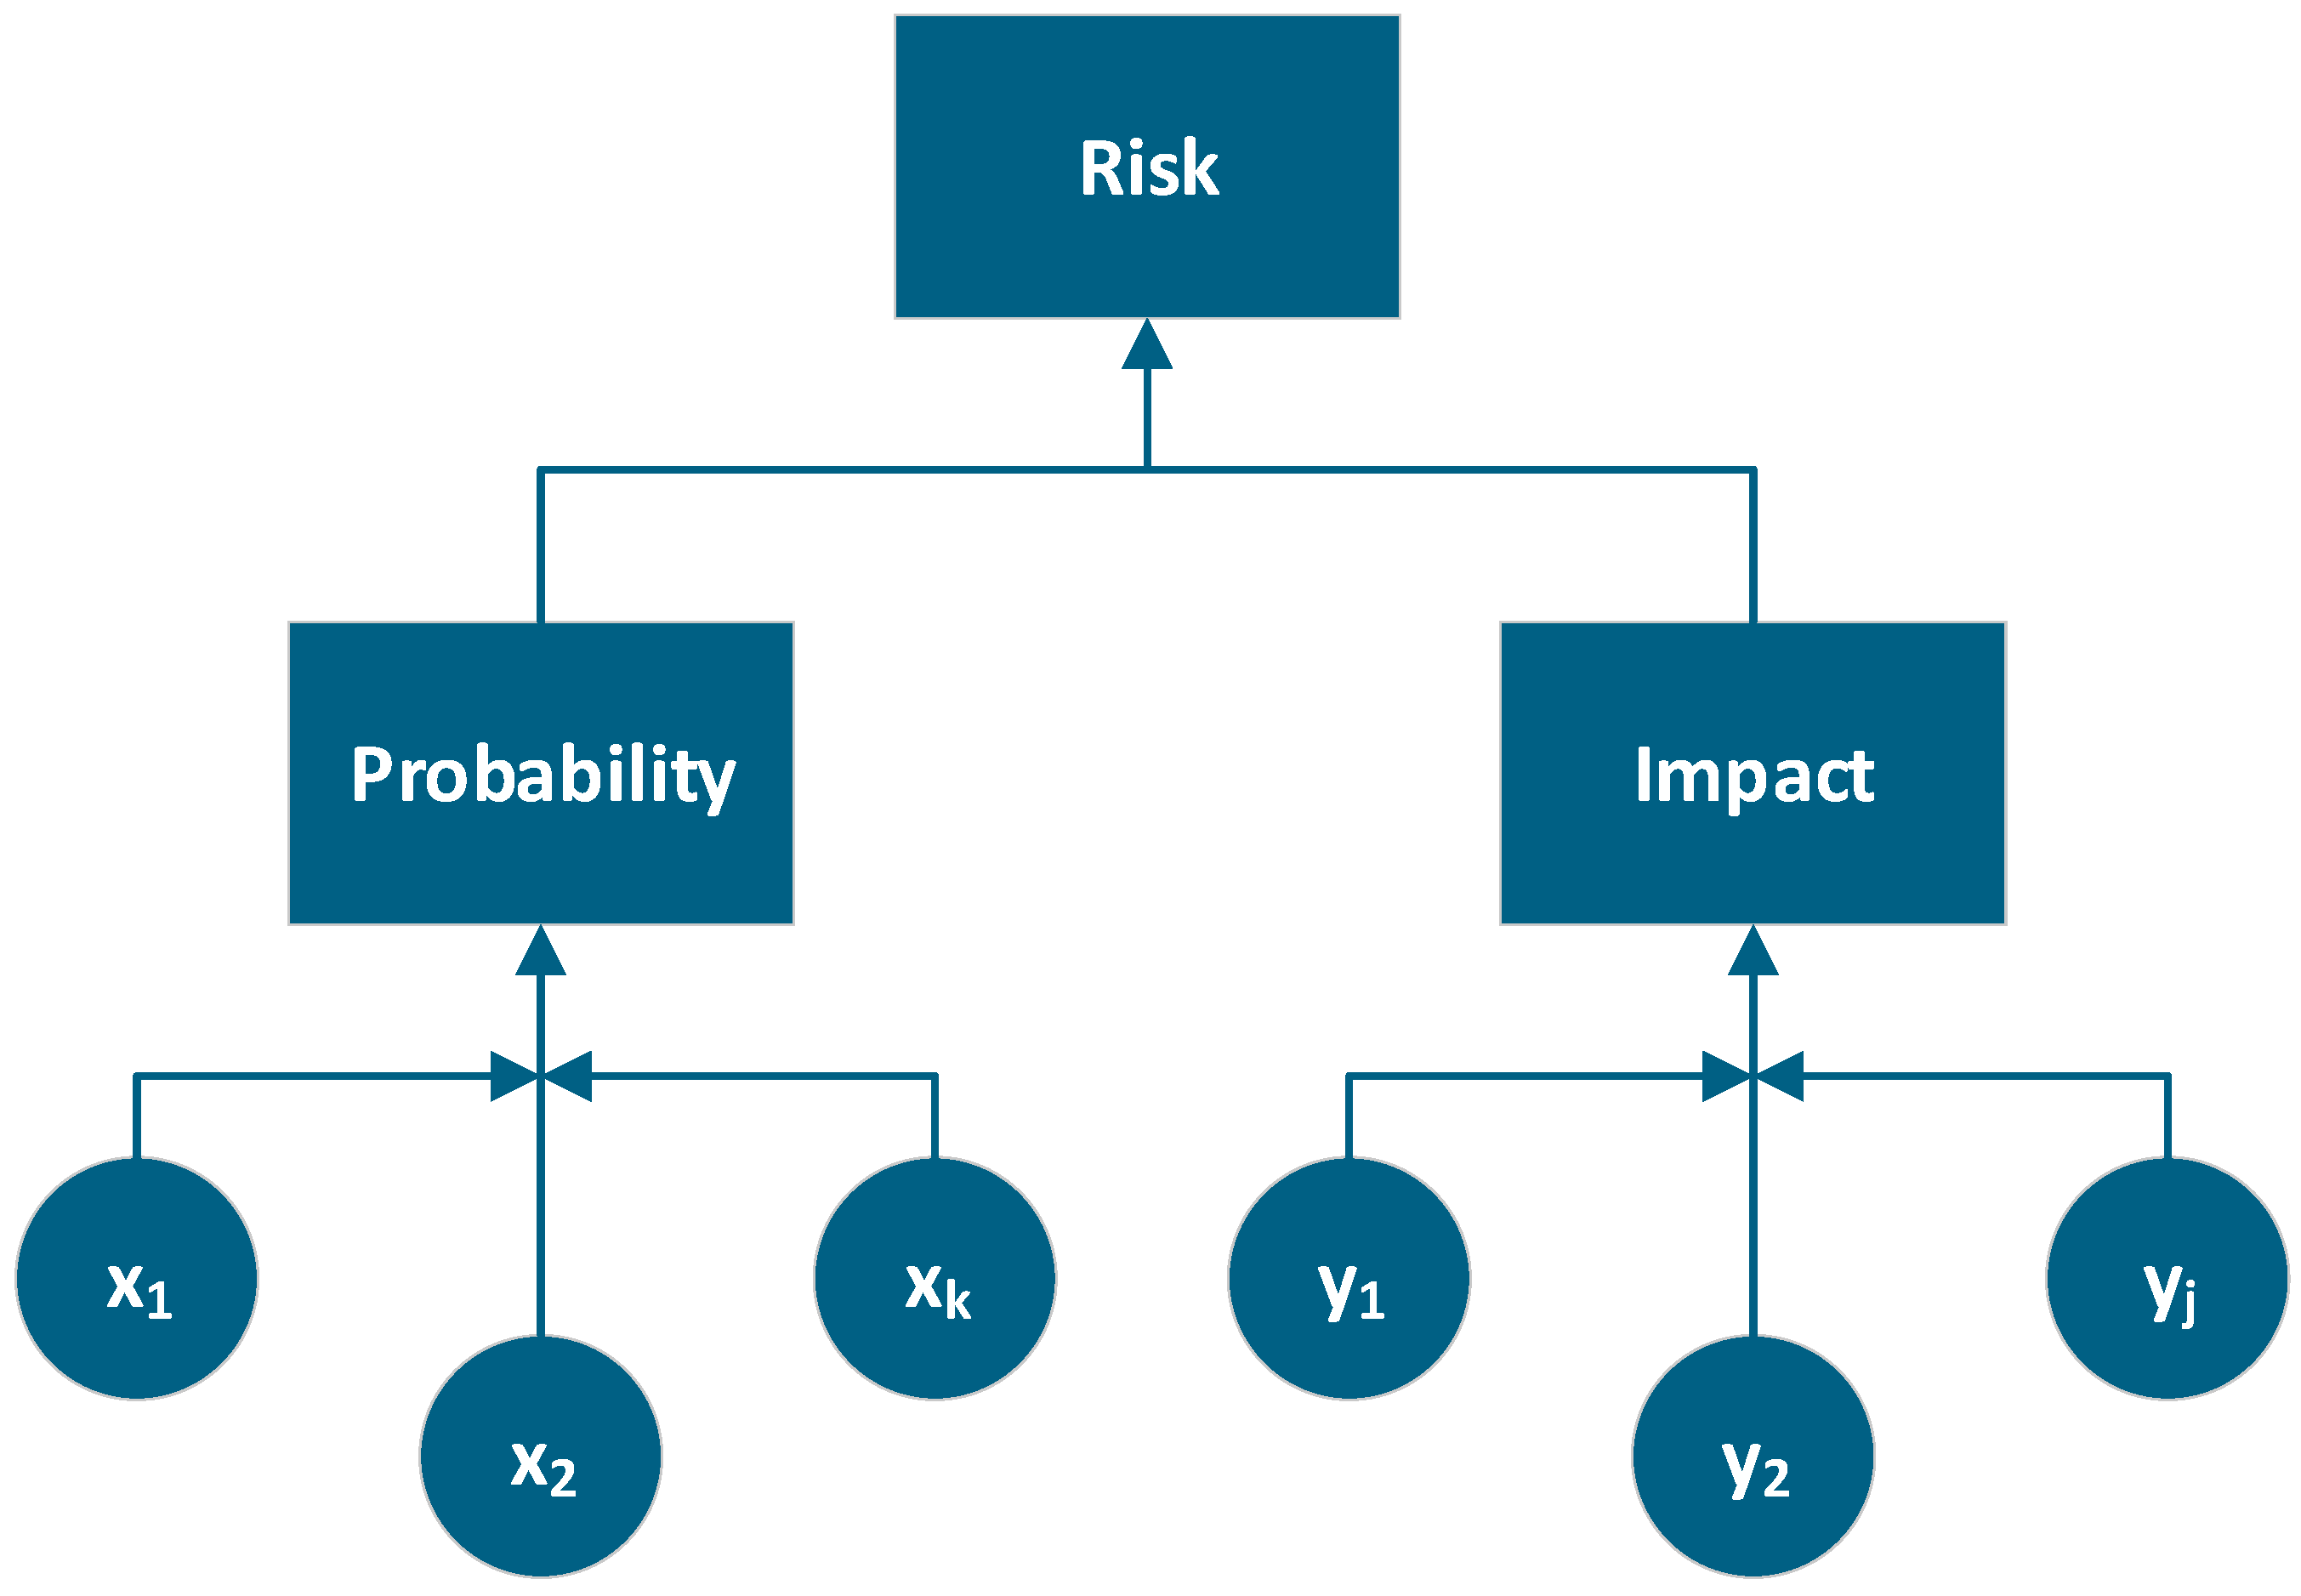
Risk assessment is based on two key factors, impact and probability, as shown in
Figure 8. Both are typically represented by values ranging from 0 to 1. The higher these values, the greater the risk associated with the asset.
In this section, a framework for a multicriteria methodology to estimate both the probability and the impact of transformer failure will be presented. This approach incorporates technical, operational, regulatory, and environmental indices, enabling a more comprehensive and data-driven risk assessment.
Several methods for calculating power transformers indices are presented by the WG A2.49 [
25]. The weighted linear method was selected for the indices calculated in
Table 1,
Table 2,
Table 3 and
Table 4, due to its practical implementation, simplicity, and ease of interpretation by decision-makers. In this methodology, weights are assigned based on the judgment and experience of specialists in maintenance engineering. Best practices and guidelines for weight assignment are also provided in [
25]. It is important to emphasize that poorly calibrated weights can either mask critical conditions or overvalue them.
There is no single correct set of weights, as they depend on the context of index application, data availability, and company policy. In this work, the index was developed as a long-term planning tool to support investment decisions related to the replacement, refurbishment, or implementation of transformer monitoring systems. Thus, the methodology considers only situations that cannot be resolved in the field by the maintenance team, focusing the analysis on assets that may require significant capital allocation.
It is important to note that the specific data and criteria used to calculate both impact and probability factors may vary from one organization to another. These differences depend on the company’s area of operation, data availability, internal risk policies, and asset management practices. Therefore, risk assessment models should be adapted to reflect each organization’s unique context and priorities.
All indices used in transformer assessment inherently involve a degree of uncertainty. This uncertainty arises from various factors, such as the unpredictable nature of degradation processes, lack of available data, or the use of incorrect or outdated information. The WG A2.49 [
25] provides guidelines on how to address these challenges, improve information reliability, and compute an uncertainty index. This aspect is beyond the scope of the present work.
3.1. Probability Factor
The probability of failure of a power transformer can be expressed as a function of multiple influencing criteria. Using a generic indexed formula, we define
where
PF—probability factor;
—criterion k influencing the probability;
n—total number of criteria;
f—function that maps the set of criteria xk for probability factor.
Several studies assess the probability of failure based exclusively on the asset’s condition. However, this single-criterion approach may lead to an underestimated probability, as it overlooks important aspects of transformer behavior. As previously discussed, failures may occur in a region characterized by constant or random failure rates, which are not necessarily linked to deteriorating conditions. Furthermore, relevant factors might not be captured during condition assessment, such as hidden defects, operational stress, or design limitations.
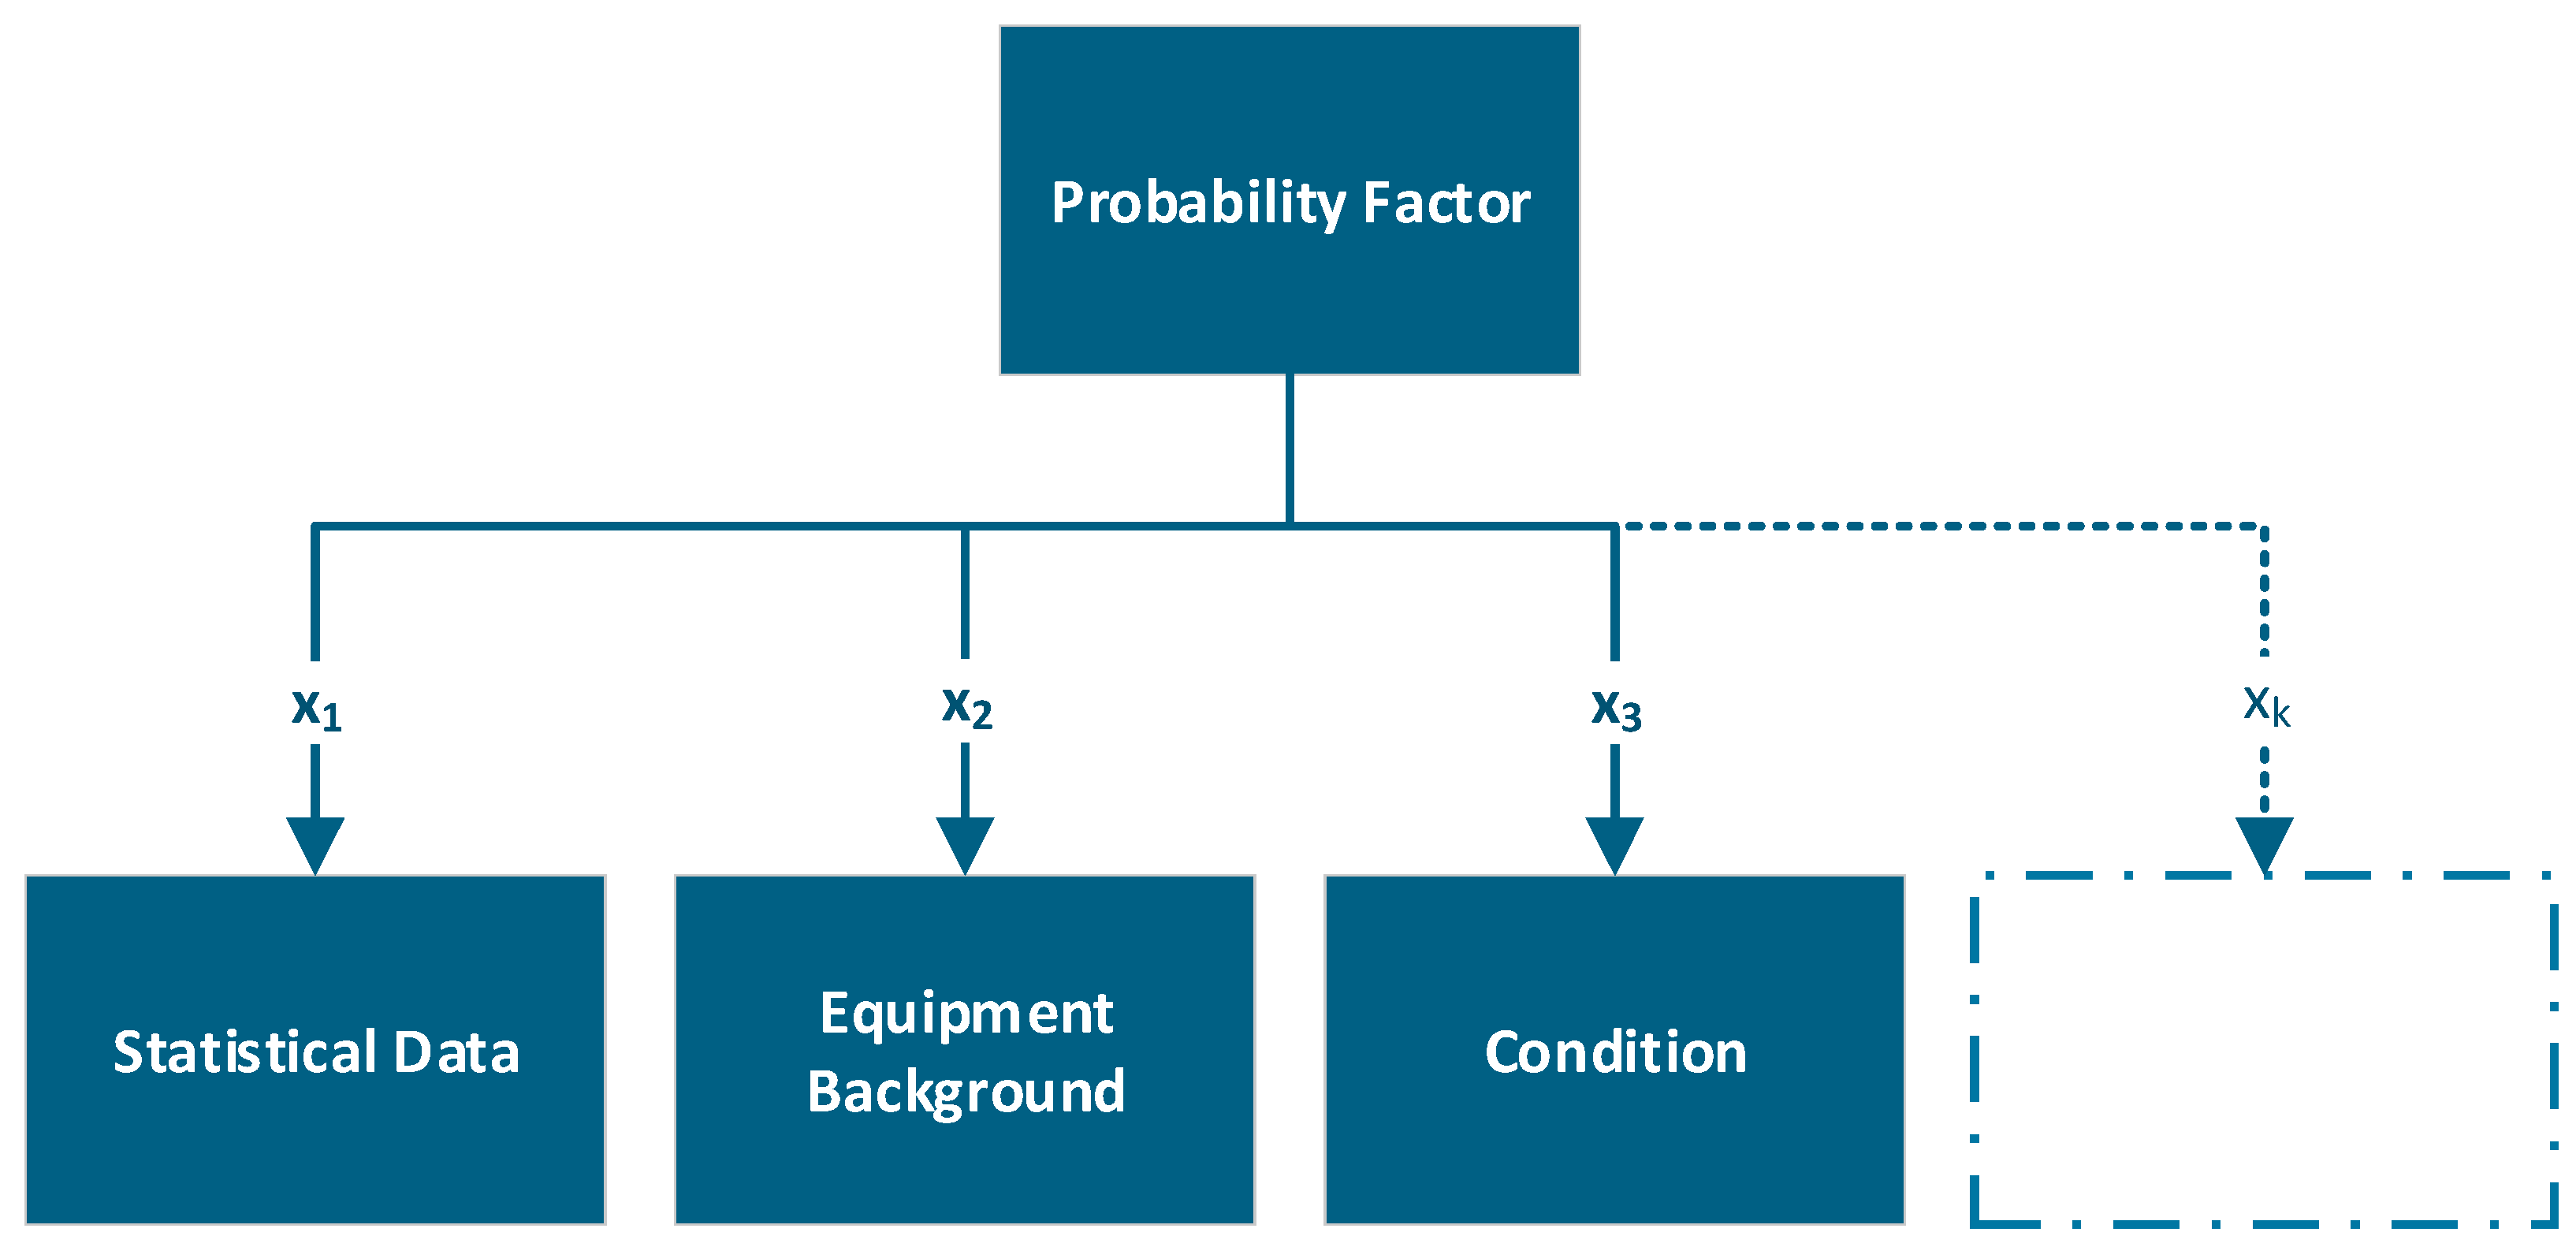
In this work, the probability factor proposed is shown in
Figure 9, considering three indexes: statistical failure data such as those presented in [
14]; condition assessment; and maintenance records of past interventions and protective device trips, such as Buchholz relays, pressure relief valves, or differential relays.
For the statistical criterion, transformer age and the failure hazard function defined in Equation (2) were considered. Additionally, as part of the asset management policy, a maximum age limit of 50 years was adopted for power transformers. Thus, the statistical function was normalized to provide an intuitive interpretation of the values within the asset management context. With this normalization, new transformers are represented by a value of 1, while assets aged 50 years or more—the maximum operational age assumed by the company’s policy—are represented by a value of 0.
For the equipment background index assessment, three attributes were evaluated using four qualitative levels, High, Moderate, Low, and Null, which were assigned values of 0.0, 0.33, 0.66, and 1.0, respectively. The data used for computing the equipment background, along with their respective weights (%), are presented in
Table 1.
The condition index is estimated as a weighted average of information derived from the maintenance plan and continuous monitoring of the transformer. The data are processed according to the engineering algorithm presented in
Figure 7. By comparing the results with predefined thresholds established for each piece of equipment, a qualitative assessment of the transformer’s condition is obtained, which is then translated into a numerical value, as shown in
Table 2.
The function used to compute the probability of failure must be capable of representing both the combined and individual effects of the influencing criteria x
k. In many practical situations, even when most parameters indicate favorable conditions, a single critical factor can significantly increase the overall probability of failure. Therefore, the function should not be based on additive or linear averaging, but instead allow for nonlinear, logical, or threshold-based behavior. For example, if a critical condition is identified, it should dominate the outcome, leading to a high probability of failure regardless of the status of other parameters. The geometric mean is a mathematical approach that reflects this behavior, as it is highly sensitive to low values and tends to decrease significantly when any individual parameter is critical.
3.2. Impact Factor
The impact factor seeks to estimate the consequences of failure for the asset operator and is a function of multiple influencing criteria:
where
IF—impact factor;
—criterion j influencing the impact;
m—total number of criteria;
g—function that maps the set of criteria yj for the impact factor.
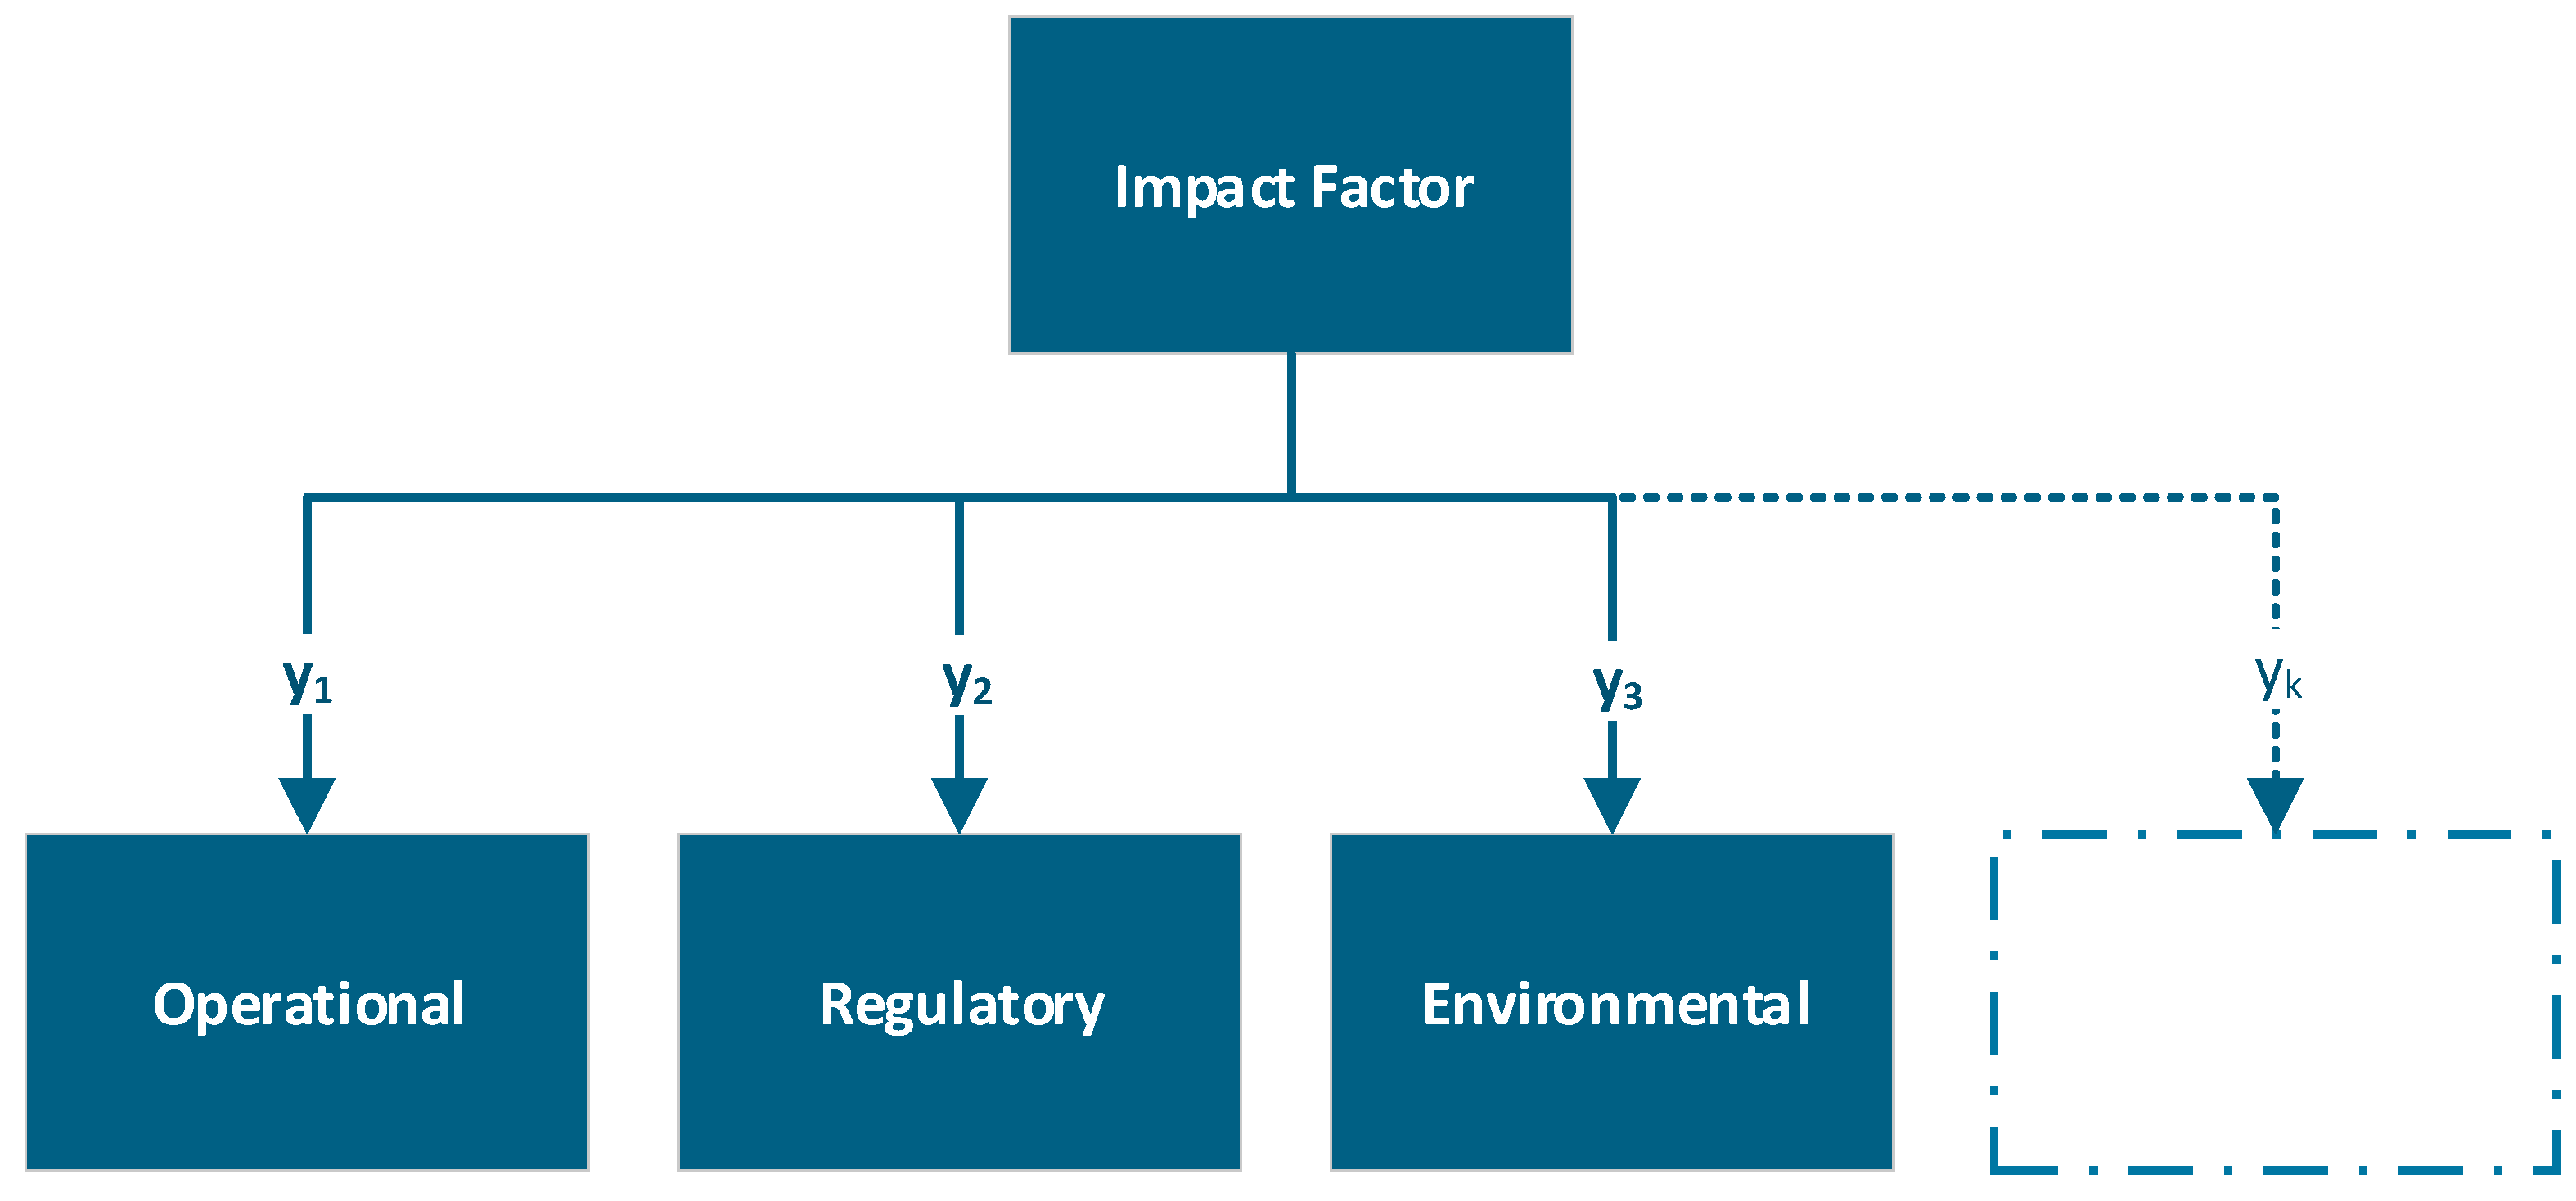
In this work, the impact factor proposed is shown in
Figure 10, considering three indexes: operational; regulatory; and social and environmental.
Quantitative operational data such as the availability and number of spare units, the estimated replacement time, and the percentage of load that can be transferred to other equipment, as shown in
Table 3, representing operational constraints that affect system reliability, were considered as follows:
Number of spare units available: a company policy of N–2 was considered the desired condition. In this context, if one spare unit is available, 50% of the requirement is met; if no spare units are available, the value is 0.
Replacement time in hours: a scenario of 0 h, corresponding to a hot standby, was considered the desired condition, while the longest duration adopted was 12 h by the asset management policy, resulting in a mathematically normalized 0–1 scale.
Percentage of load that can be transferred to other units in operation.
Regulatory data that seeks to reflect the specific impacts associated with the segment in which the company operates—such as generation, transmission, distribution, or industry—may vary significantly from one country to another. Examples include impact on quality and continuity indexes, regulatory penalties, load priority, and asset depreciation. Two regulatory data were considered and are presented in
Table 4:
Asset current value: accounting for depreciation over a 35-year period, according to the regulator in Brazil [
26], as in
where RAV stands for Residual Asset Value in percentage, and t is the transformer age in years. In the context of this work, the regulatory aspects of depreciation applied by regulatory agencies in Brazil were considered. However, for applications in other countries, Equation (6) should be adapted to reflect the local depreciation policies established by the respective regulatory agencies.
Load Priority: this refers to the type of load supplied by the transformer, classified into four levels: priority clients such as hospitals, followed by the predominant load type—industrial, commercial, or residential.
Regarding environmental impact, the substation infrastructure is evaluated based on its capability to handle catastrophic transformer failures—including oil containment, firewalls, fire suppression systems, and transformer spacing. The evaluation adopts a binary scoring, assigning 1 to substations with adequate infrastructure and 0 to those without.
Each criterion used to calculate the impact factor—such as operational, regulatory and environmental—must be structured to reflect the logical relationship between its individual components. Function g must be chosen to reflect how each of these criteria contributes to the overall impact; a simplified approach to calculate the impact factor IF is to compute a weighted sum:
where wⱼ is the weight assigned to criterion yⱼ, reflecting its relative importance. Within the scope of this work, the operational, regulatory, and environmental criteria are assigned weights of 50%, 25%, and 25%, respectively.
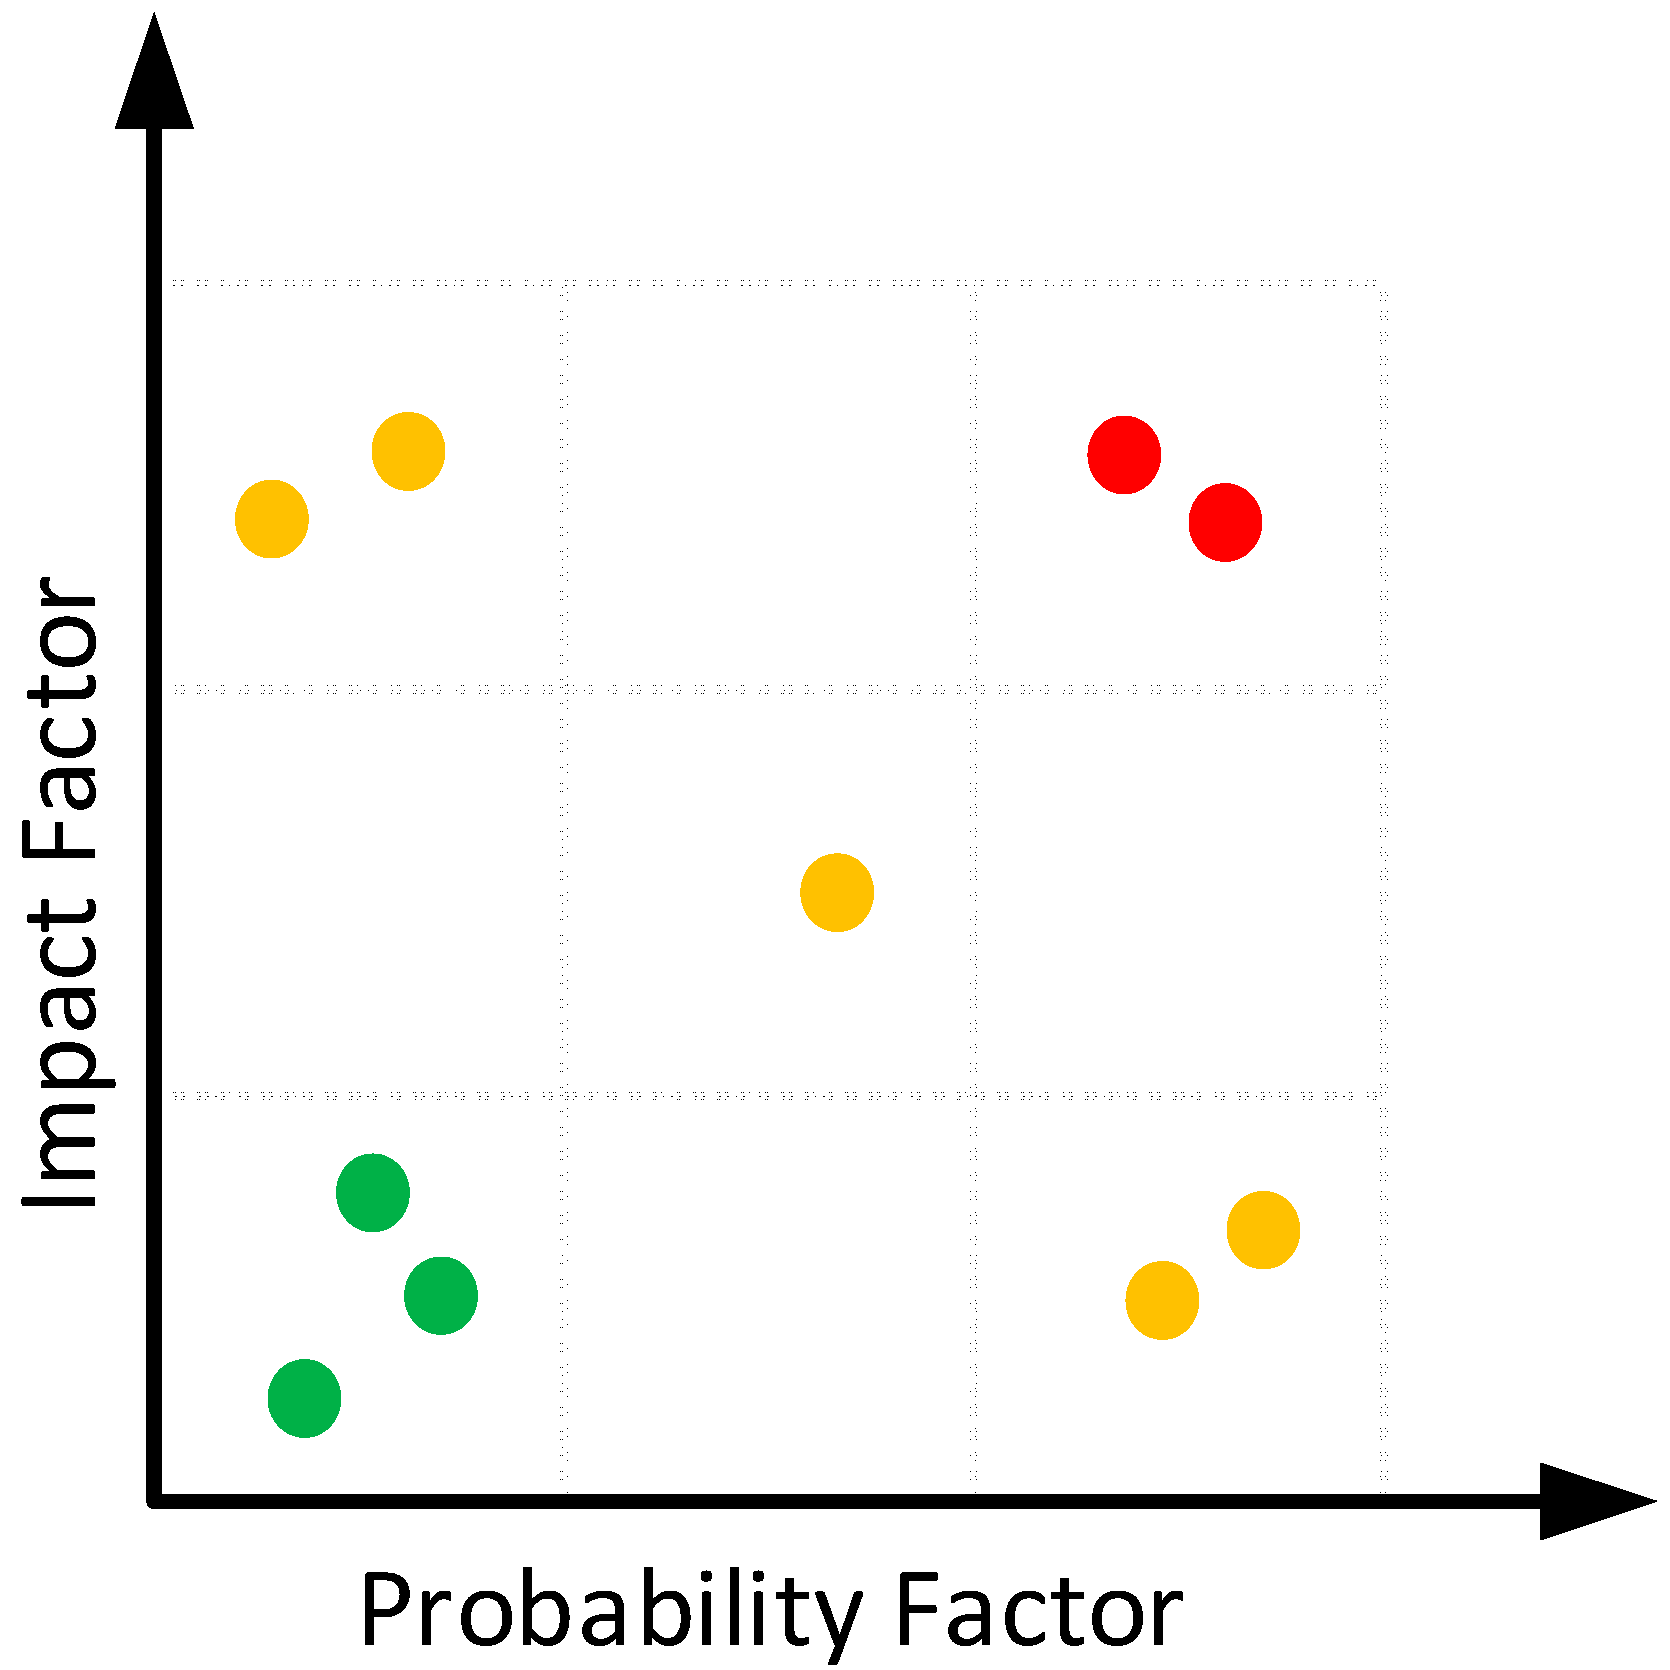
With the probability and impact factors computed, the graph in
Figure 11 can be plotted. This visual representation supports data-driven investment decisions for medium- and long-term planning across a transformer fleet. Assets represented by red dots in the right upper corner—indicating both high probability and high impact—should be prioritized, as they require immediate attention and mitigation measures. Yellow dots indicate moderate risks, either due to high impact and low probability or vice versa. These assets should be closely monitored and managed. Green dots represent low-risk assets in the left lower corner, with both low probability and low impact, and therefore may receive lower priority.
The risk graph is a valuable decision-making tool in asset management, as it visually represents the relative risk associated with each transformer. By combining both probability and impact consequences, it helps prioritize actions and allocate resources efficiently. This approach enables a comprehensive analysis of an entire transformer fleet, allowing asset managers to identify and compare the criticality of multiple units simultaneously.
4. Results
This section presents an example of the proposed methodology applied to a set of ten theoretical transformers. These units share similar attributes, such as voltage level and rated power, and are therefore considered part of the same cluster.
It is important to note that the methodology and criteria adopted in this paper are proposals, and each utility should define them according to its specific context and data available.
The statistical data was normalized to provide an intuitive interpretation of the values within the asset management context:
Table 5,
Table 6 and
Table 7 present the results obtained for statistical, condition, and equipment background indexes. The probability factor calculated according to Equation (4) is shown in
Table 8.
Table 9,
Table 10 and
Table 11 present the results obtained for operational, regulatory, and environmental indexes. The impact factor calculated according to Equation (7) is shown in
Table 12.
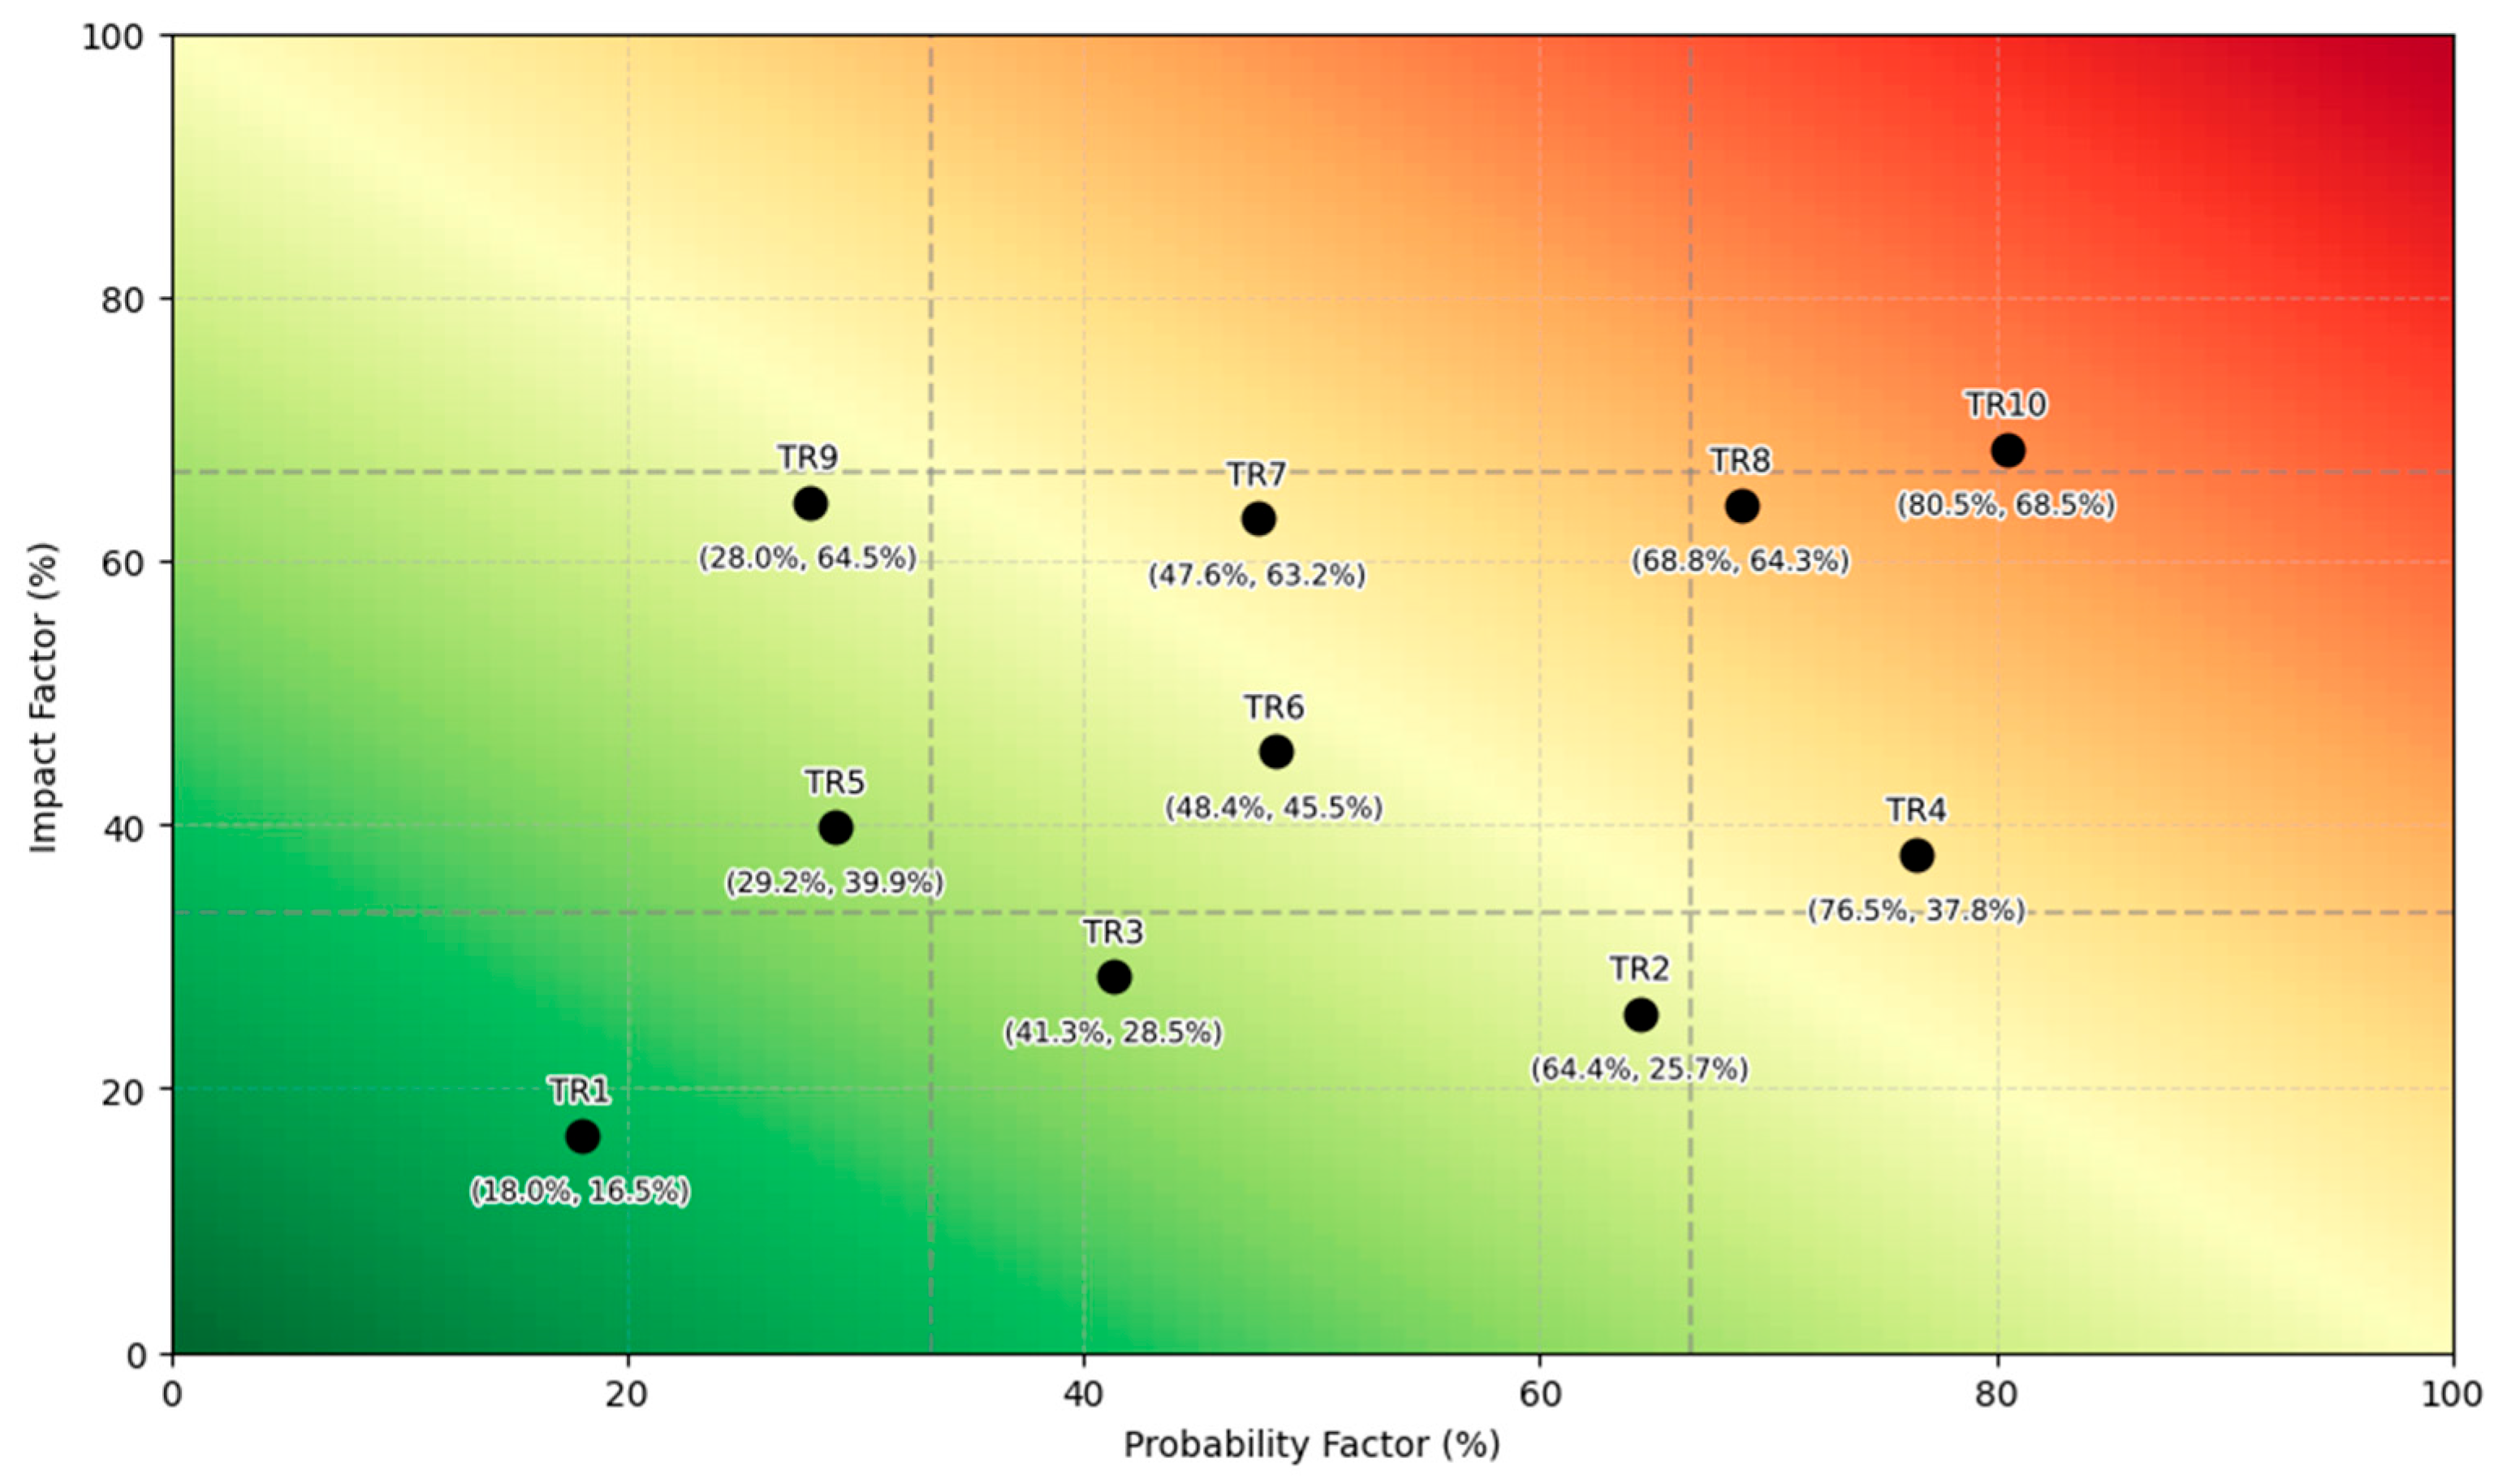
Figure 12 shows the risk graph, based on the results shown in
Table 8 and
Table 12, with the probability factor on the
X-axis and the impact factor on the
Y-axis. Transformers located in the lower-left region exhibit lower probability and impact, while those positioned to the right and above present higher probability and impact. The closer to the upper-right corner, the greater the risk—indicating that these assets should be prioritized for maintenance, replacement, or monitoring investments.
The risk graph is a valuable decision-making tool in asset management, as it visually represents the relative risk associated with each transformer. By combining both probability and impact consequences, it helps prioritize actions and allocate resources efficiently. For example, transformer TR10 has a high probability and impact—justifying investments in terms of repair, replacement, intensive maintenance, or continuous monitoring systems. A more detailed analysis reveals that TR10 is 49 years old, does not meet the N–2 spare unit policy, and has industrial load priority. This scenario highlights possible mitigation actions, such as improving spare availability and planning a replacement due to age. This approach enables a comprehensive analysis of an entire transformer fleet, allowing asset managers to identify and compare the criticality of multiple units simultaneously.
5. Discussion
The framework proposed in this paper provides decision-makers with a comparative view of the transformers within a fleet, facilitating the efficient allocation of limited resources to the assets that require the most attention. This approach aims to offer a practical tool for long-term planning, supporting the prioritization of investments, whether directed toward intensive inspection plans, implementation of real-time monitoring, refurbishment, or replacement.
It is important to highlight that the selected actions should undergo a thorough economic evaluation that considers the associated costs and benefits. In this context, the impact on the equipment’s risk—reflected by its trajectory on the risk plot—should be assessed based on the expected outcome of the chosen action. For this reason, fixed thresholds for risk classification are not defined in the methodology, as such limits depend on each company’s budgetary constraints and internal policies.
Periodic re-evaluations are essential to ensure that prioritization remains aligned with the evolving condition of the fleet and the organization’s strategic goals—particularly during budget planning cycles or recalibration processes. Therefore, the implementation of this methodology should be accompanied by a continuous effectiveness assessment process. This includes analyzing the results obtained and identifying situations that were not accurately captured, such as unexpected failures. These occurrences can support the recalibration of the weights assigned by engineering experts, helping to ensure that the risk associated with each transformer is represented as accurately and reliably as possible.
It should be emphasized that the methodology’s main purpose is to generate a priority ranking for relative comparison among transformers, rather than a comparison of the absolute values obtained for each individual one. Therefore, the methodology focuses on ordering the fleet according to established criteria, thus supporting practical decision-making processes.
As previously mentioned, for the application of this methodology to a transformer fleet, it is recommended that the assets be grouped into clusters with similar attributes, such as rated voltage and power, to ensure greater consistency and accuracy in the evaluation.
As with any evaluation methodology, the proposed approach involves an inherent level of uncertainty, arising from factors such as data unavailability, errors, or outdated information. Although uncertainty was not addressed in this study, future research is encouraged to investigate methods to quantify uncertainty indices associated with the methodology.
One of the advantages of real-time monitoring is its ability to reduce the information latency, which can potentially help decrease uncertainties in the assessment of transformer condition.
Finally, although the methodology was designed to be simple and easy to apply and understand by decision-makers, future studies may explore comparisons with alternative calculation approaches, such as fuzzy logic or machine learning techniques. Additionally, sensitivity analyses may be conducted to evaluate the benefits achieved in relation to the increased complexity introduced into the model, thus supporting the selection of the most appropriate approach for different scenarios.
6. Conclusions
This study proposed a multicriteria framework for assessing the risk associated with power transformers, aiming to support strategic asset management decisions. By combining indicators related to failure probability—such as statistical data, condition indices, and equipment background—with failure impact factors covering operational, regulatory, and environmental aspects, the method enables a comprehensive evaluation of transformer risk across a fleet.
The proposed methodology was applied to clusters of transformers, allowing for the identification of transformers that should be prioritized for investment and maintenance actions under conditions of limited financial resources—particularly relevant in the context of aging infrastructure. The methodology offers a practical tool for long-term planning, adaptable to different utility contexts due to its modular and customizable structure.
It was observed that the criteria adopted within the framework must reflect the specific context of the utility in which it is applied. Consideration should be given to the availability and quality of data across the entire transformer population to ensure consistent and reliable assessments. In this regard, the proposed methodology serves as a practical and flexible decision support tool, enabling the prioritization of limited investments toward the assets that require the most attention.
Future research could focus on incorporating mechanisms to evaluate and mitigate the effects of data uncertainty, as well as exploring different techniques for index calculations such as fuzzy logic and machine learning. Additionally, sensitivity analysis may be employed to understand the influence of each input on the final risk assessment. It is also recommended to assess the trade-off between the potential benefits and the added complexity these enhancements may introduce. These improvements may contribute to improving the robustness and accuracy of the framework across diverse operational scenarios.


 ,
, 


