Article

Wave Prediction Error Compensation and PTO Optimization Control Method for Improving the WEC Power Quality

by
Tianlong Lan
1,
Jiarui Wang
1,
Luliang He
2,
Peng Qian
1,3,
Dahai Zhang
1,3,* and
Bo Feng
1,*
1
State Key Laboratory of Ocean Sensing, Ocean College, Zhejiang University, Zhoushan 316021, China
2
Hangzhou Applied Acoustics Research Institute, Hangzhou 310012, China
3
Hainan Institute, Zhejiang University, Sanya 572025, China
*
Authors to whom correspondence should be addressed.
Energies 2025, 18(15), 4043; https://doi.org/10.3390/en18154043
Submission received: 24 June 2025 / Revised: 23 July 2025 / Accepted: 25 July 2025 / Published: 29 July 2025
(This article belongs to the Section A3: Wind, Wave and Tidal Energy)

Abstract

Reliable wave prediction plays a significant role in wave energy converter (WEC) research, but there are still prediction errors that would increase the uncertainty for the power grid and reduce the power quality. The efficiency and stability of the power take-off (PTO) system are also important research topics in WEC applications. In order to solve the above-mentioned problems, this paper presents a model predictive control (MPC) method composed of a prediction error compensation controller and a PTO optimization controller. This work aims to address the limitations of existing wave prediction methods and improve the efficiency and stability of hydraulic PTO systems in WECs. By controlling the charging and discharging of the accumulator, the power quality is enhanced by reducing grid frequency fluctuations and voltage flicker through prediction error compensation. In addition, an efficient and stable hydraulic PTO system can be obtained by keeping the operation pressure of the hydraulic motor at the optimal range. Thus, smoother power output minimizes grid-balancing penalties and storage wear, and stable hydraulic pressure extends PTO component lifespan. Finally, comparative numerical simulation studies are provided to show the efficacy of the proposed method. The results validate that the dual-controller MPC framework reduces power deviations by 74.3% and increases average power generation by 31% compared to the traditional method.

1. Introduction

Ocean wave energy is a promising renewable energy source with abundant reserves [1]. It is estimated that there are 25 trillion watts of energy in ocean waves around the world. In China, the wave energy is roughly 12.85 GW [2,3,4]. The advantages of using wave energy are its high power density [5] and abundant reserves. The technology of harvesting wave energy has received extensive attention, especially after the oil crisis in the 1970s [6]. Many types of wave energy converters (WECs) have been developed to extract wave energy [7], such as point absorbers [8] and attenuators [9].
Although wave power is regarded as a very promising energy source, it also has the characteristics of fluctuation and randomness, which bring new challenges in wave power system applications [10]. The fluctuation of wave energy may cause fluctuation of the grid frequency, and its randomness will cause the grid bus voltage to flicker [11]. Frequency fluctuation and voltage flicker lead to poor power quality, resulting in the instability of the power system [12]. Hence, the poor power quality further increases the operating cost of the power system. For the power grid, the accurate prediction of waves is considered an important method to reduce the influence of power fluctuation and randomness caused by wave energy [13]. Consequently, reliable wave prediction is of great significance for improving the quality of the power grid and reducing the cost of power operation [14].
In terms of wave prediction, many related studies have been carried out based on traditional physical models [15,16,17]. Meanwhile, the wave prediction technology based on artificial intelligence has also made great progress [18,19]. Although various methods have been applied to improve the accuracy of the wave prediction [20,21], prediction errors still exist due to many factors [22]. While traditional physics-based models rely on wave spectral analysis, they struggle with real-time irregular waves due to computational complexity. AI-based predictions improve accuracy but require extensive training data and lack interpretability. This trade-off highlights the need for error compensation mechanisms in WEC control. Hence, reducing the impact of wave prediction errors on the power grids has become an important research direction in improving power quality. In the research of wind power, the energy storage components such as batteries [23,24,25] and flywheels [26] are used to participate in energy dispatch so as to reduce the impact of wind prediction errors on the power grid. In wave energy converters, accumulators are generally used for energy storage and power smoothing [27]. Compared with batteries and flywheels applied in wind turbines, accumulators are cheaper and more convenient in hydraulic PTO systems in WECs [28]. Consequently, this paper proposes a new control approach based on the charge and discharge of accumulators in the PTO system to reduce the influence of wave prediction errors on the power grid and obtain an efficient and stable hydraulic power take-off system at the same time.
In addition, in the past few years, a lot of research has been carried out to improve the efficiency and the stability of the hydraulic PTO system in WEC applications [29]. For example, the floater geometry, power take-off (PTO), and controller are treated as an integrated system, achieving full-chain impedance matching from wave energy to electrical power through a two-port network model, thereby maximizing energy transfer efficiency in [30]. The wave energy capture efficiency has also been improved by optimizing the parameters of the hydraulic PTO, including the displacement of the hydraulic motor [31], the area of the hydraulic cylinder piston [32], and the size of the hydraulic motor [33]. There are also plenty of works that have been conducted to maintain the stability of the hydraulic PTO system, including reducing the hydraulic oil oscillation [34] and keeping the hydraulic motor speed at a stable value [35]. However, in actual irregular waves, WEC’s hydraulic PTO still has efficiency and stability challenges [36]. Research on the efficiency characteristics of hydraulic motors shows that the speed and pressure have a significant impact on the efficiency of hydraulic motors [37]. Therefore, maintaining the hydraulic motor pressure in the optimal range can make the hydraulic power take-off system operate in a highly efficient and stable state.
Recent MPC applications in WECs (e.g., [8]) focus on energy capture maximization but neglect hydraulic PTO efficiency. Papini et al. [38] proposed a real-time energy-maximizing MPC strategy for WECs but did not explicitly analyze the efficiency changes in PTO components. Unlike wind energy studies (e.g., [25]), WEC-specific MPC designs must address both power smoothing and hydraulic stability. The advances in MPC for WECs demonstrate effective handling of nonlinear PTO constraints and damping dynamics. The pseudo-spectral method proposed by Liao [39] validates that tailored mapping functions can mitigate wave prediction errors. As also highlighted by Shadmani et al. [40], both MPC and reinforcement learning (RL) demonstrate the ability to address the high intermittency and non-causality challenges in wave energy conversion, generating smart energy predictions and optimizing energy capture efficiency.
This paper proposes an optimizing control method based on a model predictive control (MPC) algorithm, which is used to improve the power quality while improving the efficiency and stability of the hydraulic PTO. The main contributions of this paper are as follows:
  • By optimizing the control of the charge and discharge of the accumulators in the PTO system, the poor power quality caused by wave prediction errors is improved.
  • The operation efficiency and stability of the hydraulic PTO system are increased by controlling the torque of the generator.
The rest of the paper is organized as follows. Section 2 introduces the overview of the control method. Section 3 explains the dynamic model and hydraulic model of a floating pendulum WEC; then, the implementation process of the MPC control algorithm is presented. Simulation results are demonstrated in Section 4. Finally, the conclusion is given in Section 5.

2. Problem Statement and Overview of Control Method

Wave energy suffers from the problems of fluctuation and randomness. For the power grid, the accurate prediction of wave energy is considered a major approach to improve the reliability of wave power generation. However, the prediction errors are inevitable due to many natural factors and the randomness of waves. In addition, the fluctuations of wave energy will also cause hydraulic oil oscillation when it is transmitted in the PTO system, resulting in energy loss and reliability degradation of the PTO system. In order to deal with those problems, this paper proposes a real-time optimal control method for a WEC system based on an MPC algorithm. The control method adopts a feedback correction to compensate for the influence of wave prediction errors and improve the operation efficiency and stability of the hydraulic PTO system.
In Figure 1, the block diagram shows the overall view of the proposed control scheme for WECs. It consists of a prediction error compensating controller and a PTO optimization controller.
The prediction error compensation controller is used to compensate for the impact of wave prediction errors on the power grid. By optimizing the charge and discharge control of the accumulators in the PTO system, the poor power quality caused by the wave prediction errors is improved. The expected power P E x p p o w is calculated based on the prediction wave data, while the actual power P A c t p o w is obtained based on the actual wave data. The power deviation P O r i g e r r (difference between the actual power P A c t p o w and the expected power P E x p p o w ) is used as input for the optimization controller. The controller outputs an optimal signal to adjust the accumulator’s charge and discharge to compensate for the influence of wave prediction errors on the power grid. Finally, the WEC system generates the control power P C t o l p o w after the controller compensation.
The PTO optimization controller is designed to optimize the efficiency and stability of the hydraulic PTO system. The controller maintains the operating pressure of the hydraulic motor in the optimal range by controlling the torque of the generator. The optimal expected operation pressure of the hydraulic motor is calculated as P E x p p r e based on prediction wave data and the efficiency characteristics of the hydraulic motor. The actual operation pressure P A c t p r e is fed back from the PTO system. The difference between P E x p p r e and P A c t p r e is used as the optimization controller input, and then the controller generates an optimal torque control signal T O p t to the generator to maintain the hydraulic motor pressure in the optimal range.

3. Modeling Analysis

A floating pendulum WEC is selected as the research object in this study. The simplified schematic diagram of the WEC is shown in Figure 2. The primary energy conversion stage is a floating pendulum that rotates around a rotation axis on a support to convert wave energy into mechanical energy. The secondary energy conversion stage is a hydraulic system, which converts mechanical energy into hydraulic energy through the hydraulic cylinders. Finally, the hydraulic motor drives the generator to generate electrical power.

3.1. Dynamic Modeling of Floating Pendulum

In this paper, the floating pendulum force analysis shown in Figure 3 only considers the motion of the heave freedom degree.
m z t ¨ + F r t + F c t + F b t + F P T O t = F e x t
where m is the mass of the floating pendulum; F r is the radiation force; F c is the viscous force which can be expressed as the product of speed and the damping coefficient of the pendulum; F b is the net buoyancy, which is the combined force of the buoyancy and gravity on the floating pendulum; F P T O is the interaction force between the floating body and PTO system; F e x is the exciting force [41].
In terms of the radiation force, it can be expressed as
F r = a z t ¨ + 0 t h ( t τ ) z t ˙ d τ
where a is the additional mass when the frequency is close to infinity and h ( t ) represents the speed response function, which can be further expressed as
h t = 2 π 0 b ω sin ω t ω d ω = 2 π 0 a ω a cos ( ω t ) d ω
Hence, the various components’ forces are decomposed, and the equations are described as
m + a ( ω 0 ) z t ¨ + b ( ω 0 ) + c z t ˙ + K z t = F e x t F P T O t
m + a z t ¨ + c z t ˙ + K z t + 0 t h ( t τ ) z t ˙ d τ = F e x t F P T O t
In Equations (4) and (5), c represents the viscous damping coefficient of the pendulum; a ( ω 0 ) and b ( ω 0 ) are the additional mass and radiation damping coefficient at frequency ω 0 ; K represents the coefficient of restoring force.
The product of the heave force of the floating pendulum and the equivalent arm length is used as the torque; the corresponding Equations (4) and (5) can be expressed as
J + J a d d ( ω 0 ) θ t ¨ + b ( ω 0 ) + c · l · θ t ˙ + K · l · θ t = M e x t
J + J a d d θ t ¨ + c · l · θ t ˙ + K l · θ t + l · 0 t h ( t τ ) θ t ˙ d τ = M e x ( t )
where J is the moment of inertia of the pendulum; J a d d is the additional moment of inertia; l is the length of the equivalent arm.
Equations (6) and (7) are the dynamic equations of the floating pendulum under regular waves and irregular waves, respectively, in which the wave-related forces include the wave exciting force and wave radiation force. The wave excitation force can be decomposed into Froude–Krylov force and diffraction force for calculation by potential flow theory. In this paper, AQWA is used to calculate the wave-related hydrodynamic parameters. The simulation model is constructed in Simulink based on the dynamic equations of the floating pendulum.

3.2. Hydraulic System Modeling

The wave energy is converted from the floating pendulum to the hydraulic PTO system, and the hydraulic motor drives the generator to generate electrical power. The block diagram of the hydraulic power take-off system is shown in Figure 4.
The PTO optimization controller keeps the hydraulic motor (6) in optimal operation pressure by controlling the torque of the generator (7).
In order to reduce the fluctuation caused by the prediction errors, the prediction error compensation controller controls the charging and discharging of the accumulator (4-1) by adjusting the opening degree of the solenoid valve (5-1).
The accumulator (4-2) is pre-charged with pressure to avoid vibration and noise in the hydraulic system. The electric motor (11) and the hydraulic pump (10) are used to replenish oil for the accumulator.

3.2.1. Hydraulic Motor Analysis

The hydraulic motor is a key power executive component in the hydraulic system. Keeping the hydraulic motor in the best operating condition is of great significance to the realization of an efficient and stable power take-off system. The operation state of the hydraulic motor has a high correlation with its operation pressure and rotation speed.
The efficiency η of the hydraulic motor can be divided into volumetric efficiency ( η v ) and mechanical efficiency ( η m ), illustrated as follows:
η v = q t q = q q q = 1 ( q q )
η m = T a T t = T t T T t = 1 ( T T t )
η = η V η m
where the actual flow q of the hydraulic motor is higher than the theoretical flow q t ; the actual torque T a is smaller than the theoretical torque T t .
The efficiency characteristics of the hydraulic motor obtained from a commercial product are shown in Figure 5. It can be seen that there is a parabolic relationship between pressure and efficiency, and the optimal pressure interval is from 30 bar to 40 bar.

3.2.2. Accumulators Analysis

The accumulator can charge and discharge energy through the compression and expansion of gas. The compression and expansion process in the accumulator follows the gas change law. The relationship between the gas pressure P and the volume V can be expressed as
P V n = P 0 V 0 n = P 1 V 1 n = P 2 V 2 n
where P 0 and V 0 are the initial pressure and the corresponding initial gas volume; P 1 and V 1 are the minimum pressure and the maximum gas volume; P 2 and V 2 are the maximum pressure and the corresponding minimum gas volume; n is the Boyle–Mariotte gas variability index. The energy E of the accumulator can be expressed as
d E = P d V
The minus sign means that the energy increases as the volume decreases.
The derivation of P V n in Equation (11) can be expressed as
V n d P + n P V n 1 d V = 0
d V = V d P n P
V = P 0 P 1 n V 0
Then, Equation (16) expresses the relationship among energy, pressure, and volume in the accumulator:
E = 1 n V 0 P 0 1 n   P 0 P P 1 n d P = V 0 P 0 1 n n 1 ( P 1 1 n P 0 1 1 n )
The accumulator’s energy buffering capacity E m a x and response speed τ exhibit a fundamental trade-off governed by gas pre-charge pressure P 0 and volume V 0 . The maximum storable energy can be calculated by
E m a x = V 0 P 0 n 1 P m a x P 0 1 1 n 1
where P m a x is the upper pressure limit. It can be seen that increasing volume V 0 linearly enhances capacity. Higher P 0 increases energy density but reduces usable volume. A higher pressure differential P m a x / P 0 also improves energy storage efficiency.
The response speed is constrained by valve dynamics and gas expansion/compression time.
τ = V 0 Q v a l v e + P · V 0 k v a l v e
where Q v a l v e is the maximum valve flow rate; k v a l v e is the flow-pressure coefficient. Increasing E m a x prolongs the gas expansion time and leads to a faster response speed. Higher P 0 improves energy density but leads to higher valve control pressure ( P = P m a x P 0 ), potentially exceeding actuator dynamic ranges.
Through this analysis, the accumulator needs to achieve dynamic optimization via control algorithms.

3.2.3. Simplification Analysis

The above hydraulic model simplifies certain dynamics, such as oil compressibility and valve transients, because in this study, we focus on the accumulator’s pressure control and its role in power smoothing. The primary goal is to compensate for wave prediction errors and stabilize the hydraulic motor pressure, where accumulator dynamics dominate the energy buffering effect. While oil compressibility and valve dynamics are critical for micro-scale transients, their impact on macro-scale energy buffering is secondary. Besides, high-fidelity fluid models may introduce computational complexity incompatible with the MPC’s real-time requirements. A detailed explanation of the MPC methodology will be provided in the subsequent section.

3.3. MPC Control System Design

MPC algorithms have received great attention in recent years due to their simple implementation, straightforward handling of nonlinearities and constraints, and good dynamic performance. MPC is mainly composed of a prediction model, objective function, and control law. The most critical part of designing an MPC system is to determine the predictive model, since the future outputs, rolling optimization, and feedback correction are based on the model [42]. There are two methods to determine the predictive model, namely modeling based on physical laws and system identification. Modeling based on physical laws is complicated, and the necessary assumptions made in the physical derivation process will also affect the accuracy of the results. The two controllers constructed in this paper are based on nonlinear systems. Hence, for MPC application in this research, the system identification method is adapted to generate the predictive model.
The linear discrete-time state–space mathematical model is obtained by using the Linear Analysis Tool in Amesim, which is represented by Equations (17) and (18).
x ˙ = A x + B u
y = C x + D u
where x , u , and y indicate state, input, and output vectors, respectively. In terms of the prediction error compensation controller, x 1 = T m   ω g   P p r e   L   L ˙ T , u 1 = i l , y 1 = P C p o w . For the PTO efficiency optimization controller, x 2 = T m   ω g   P p r e   L   L ˙ T , u 2 = T g , y 2 = P p r e . T m is the hydraulic motor torque; ω g is the generator speed; P p r e is the hydraulic motor operation pressure; L and L ˙ is the spool position and velocity of valve 5-1; i l is the control signal for the valve 5-1; P C p o w is the generator output power; T g is the generator torque.
The objective function is used for rolling optimization and feedback correction problems. The objective function represented by Equations (19)–(22) is constructed by penalizing the errors between the control output and the reference trajectory.
m i n   J = j = 1 p y r k + j y ^ k + j T Q y r k + j y ^ k + j + j = 0 m ( u k + j T R u k + j + u k + j T S u k + j )
y m i n y ^ k + i k y m a x
u m i n u k + i k u m a x
Δ u m i n Δ u k + i k Δ u m a x
where p is the length of the prediction time domain; m is the length of the control time domain ( m p ); y r ( k + j ) is reference output; y ^ ( k + j ) is prediction output; u ( k + j ) is control input; u k + j is the control increment; Q , R , S comprise the error weight coefficient matrix. The control weight coefficient matrix and the control increment weight coefficient matrix are determined by the control target.
The parameters of two controllers are listed as follows.
Prediction error compensation controller:
A 1 = 10 9.55 0 0 0 0 0 88.49 0 0 0 19.47 1.34   ×   10 3 0 0 0 0 1.33   ×   10 6 0 1.58   ×   10 4 0 0 0 1 452.39
B 1 = 0 0 0 0 78.96
C 1 = 784.18 52.36 0 0 0
D 1 = 0
0 u 1 k + i k 200
0.01 Δ u 1 k + i k 0.01
PTO optimization controller:
A 2 = 10 9.55 0 0 0 0 0 88.49 0 0 0 19.47 1.34   ×   10 3 0 0 0 0 1.33   ×   10 6 0 1.58   ×   10 4 0 0 0 1 452.39
B 2 = 10 0 0 0 0
C 2 = 0 0 1 0 0
D 2 = 0
100 u 2 k + i k 100
0.3 Δ u 2 k + i k 0.3
MPC demonstrates significant potential in wave energy conversion systems due to its optimization capabilities and constraint-handling advantages, particularly in power maximization and grid stability. However, computational complexity and model dependency remain key challenges [43]. Pasta et al. [44] proposed an improved method based on nonlinear economic MPC and addressed its high computational complexity through a deep neural network (DNN), providing a feasible solution for real-time optimal control of wave energy devices and offering insights for the control design of other complex nonlinear systems. The proposed MPC controller’s computational cost is critical for real-time deployment. The MPC’s optimization problem, shown as Equation (19), is solved via quadratic programming, with a time complexity of O(n3) for n state variables. For our model (n = 5), we can use a moving horizon window (p = 10 steps), which is shorter than wave dominant periods, to balance prediction accuracy and calculation speed. To reduce problem dimensionality and accelerate the optimization algorithm, it is acceptable to employ warm-starting, where the solution from the previous step is reused as the input for the QP solver to reduce iteration counts. Control laws can also be precomputed offline and stored in lookup tables, enabling constant-time online evaluation.
The optimal simulation results are presented in Section 4 by the co-simulation of MATLAB R2021b and Amesim 2021.2. The generator torque control assumes instantaneous response, while actual systems exhibit delays due to electromagnetic inertia. Accumulator gas dynamics were modeled with a constant polytropic index, neglecting temperature fluctuations. Nonlinear effects of the oil are also simplified in the co-simulation.

4. Case Study

In order to verify the performance of the proposed method, the actual waves are created based on the Pierson–Moskowitz spectrum. The significant wave height of the actual wave H s is 1 m, and the spectral peak period T p is 5 s. The predicted wave is generated by the neural network toolbox in MATLAB. Root mean square error (RMSE = 0.0500) and mean absolute error (MAE = 0.0406) show that the prediction algorithm accurately predicted the actual wave data, but the error still exists. The actual wave data and predicted wave data are shown in Figure 6.

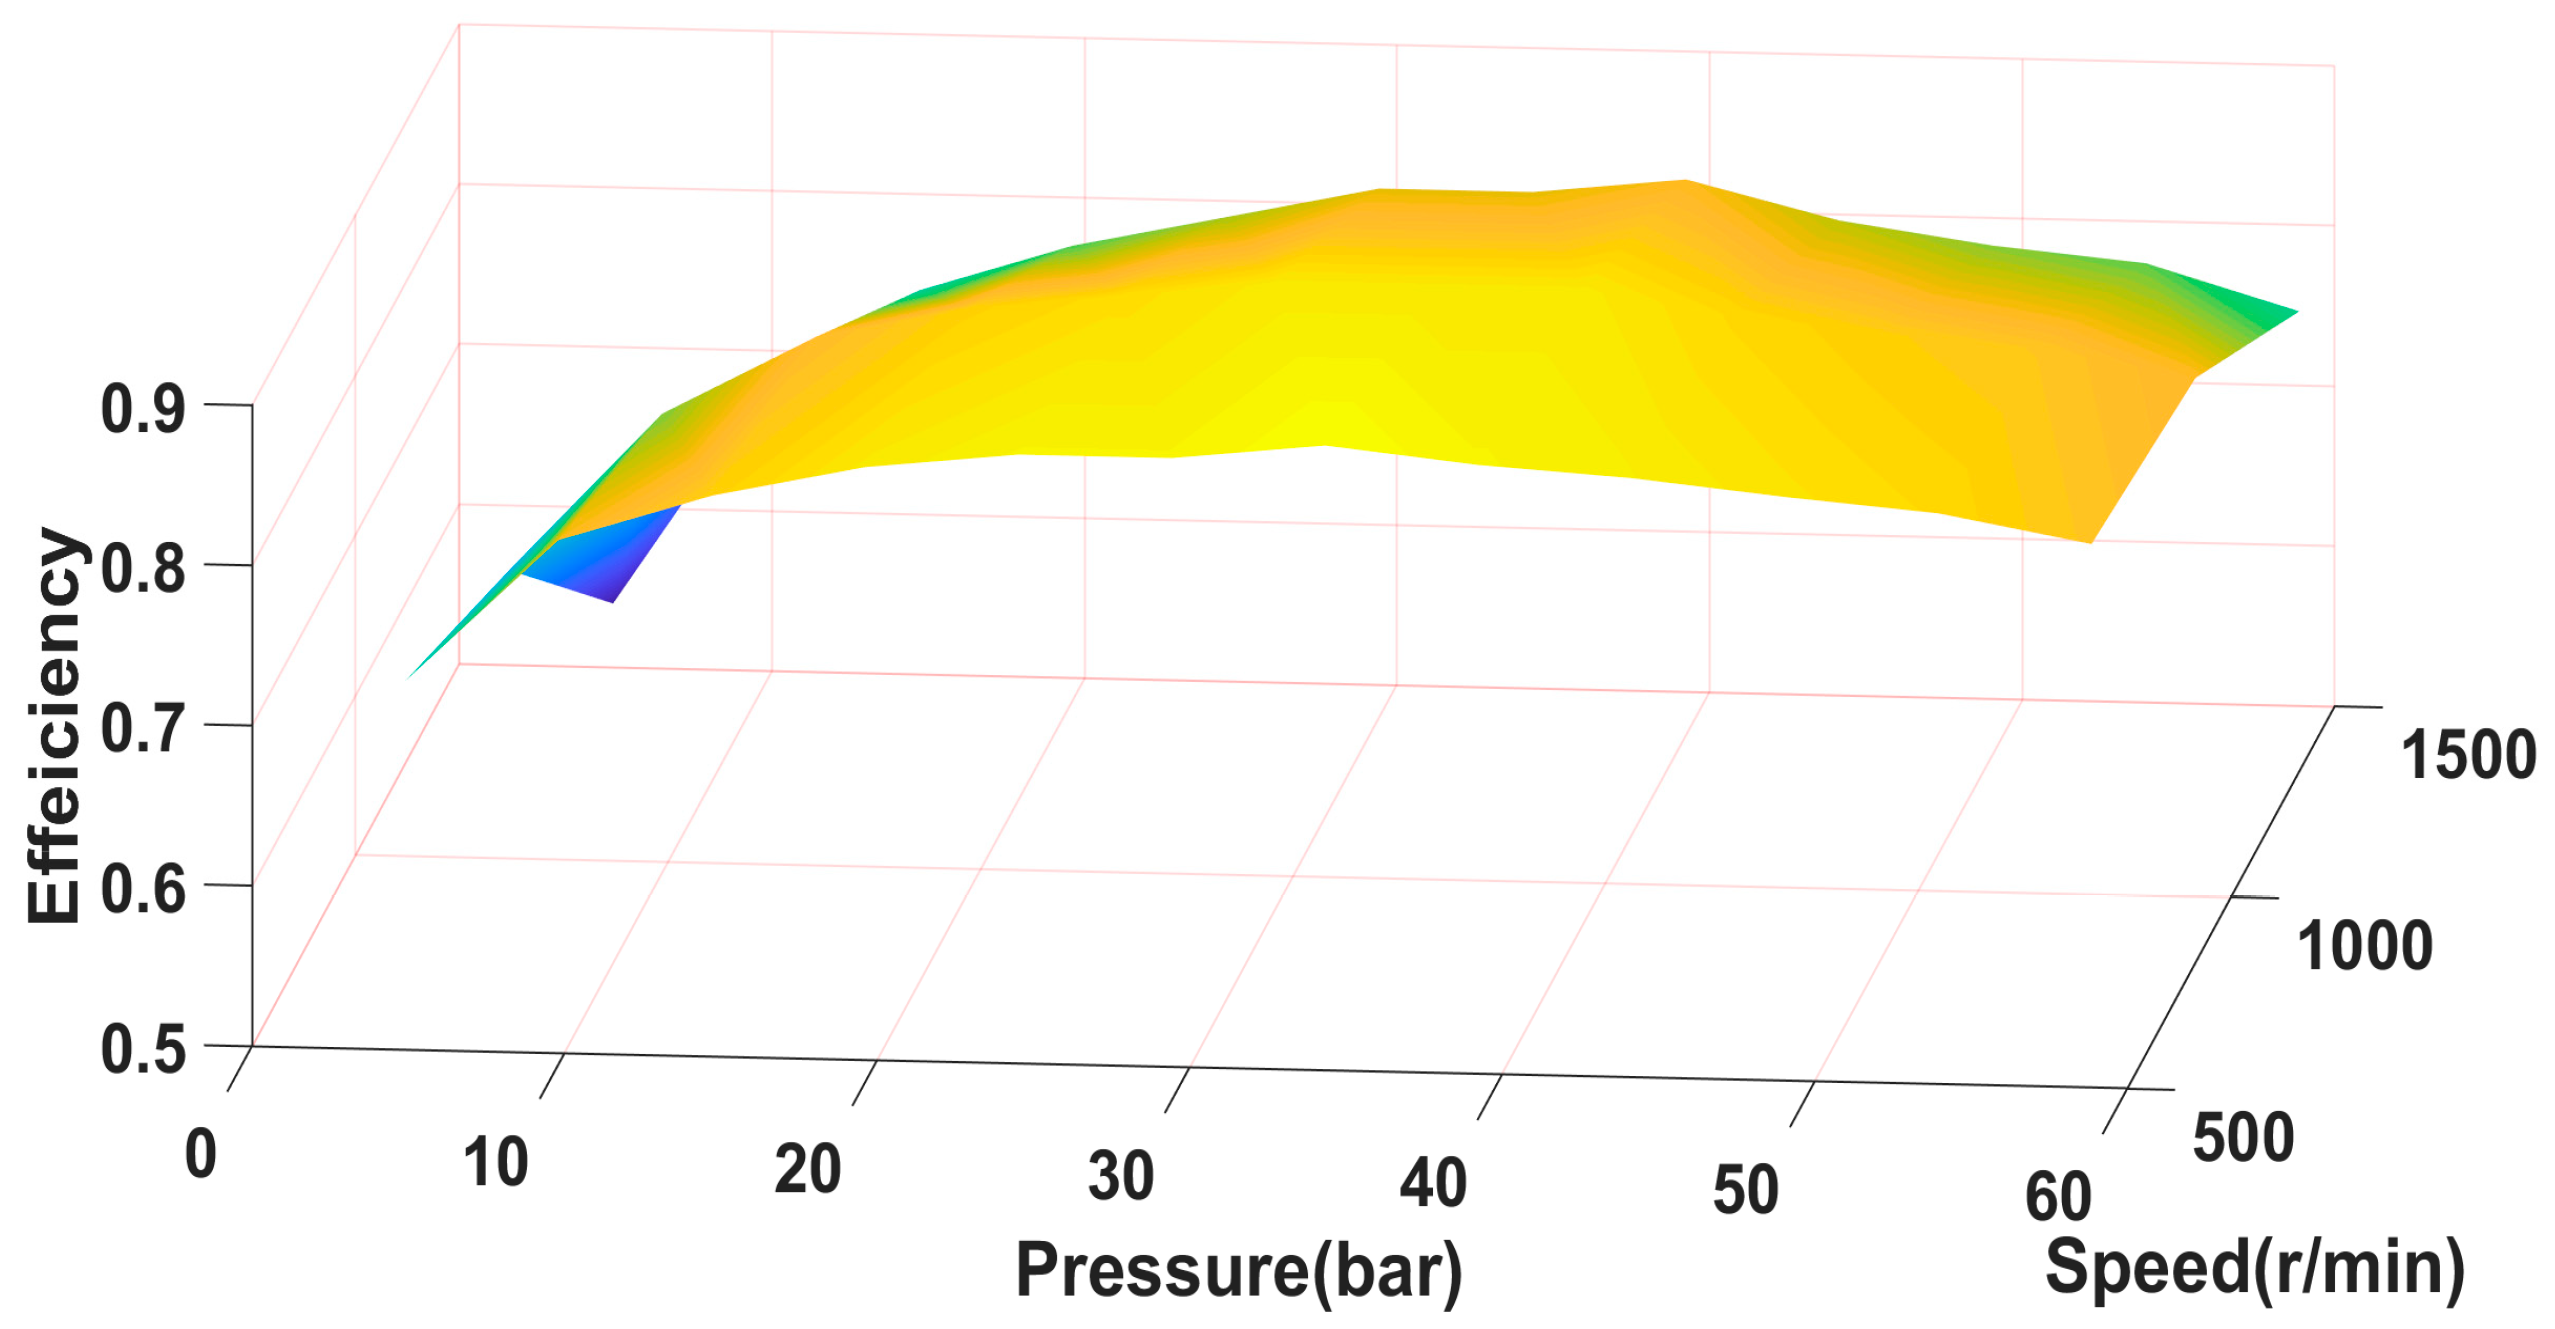
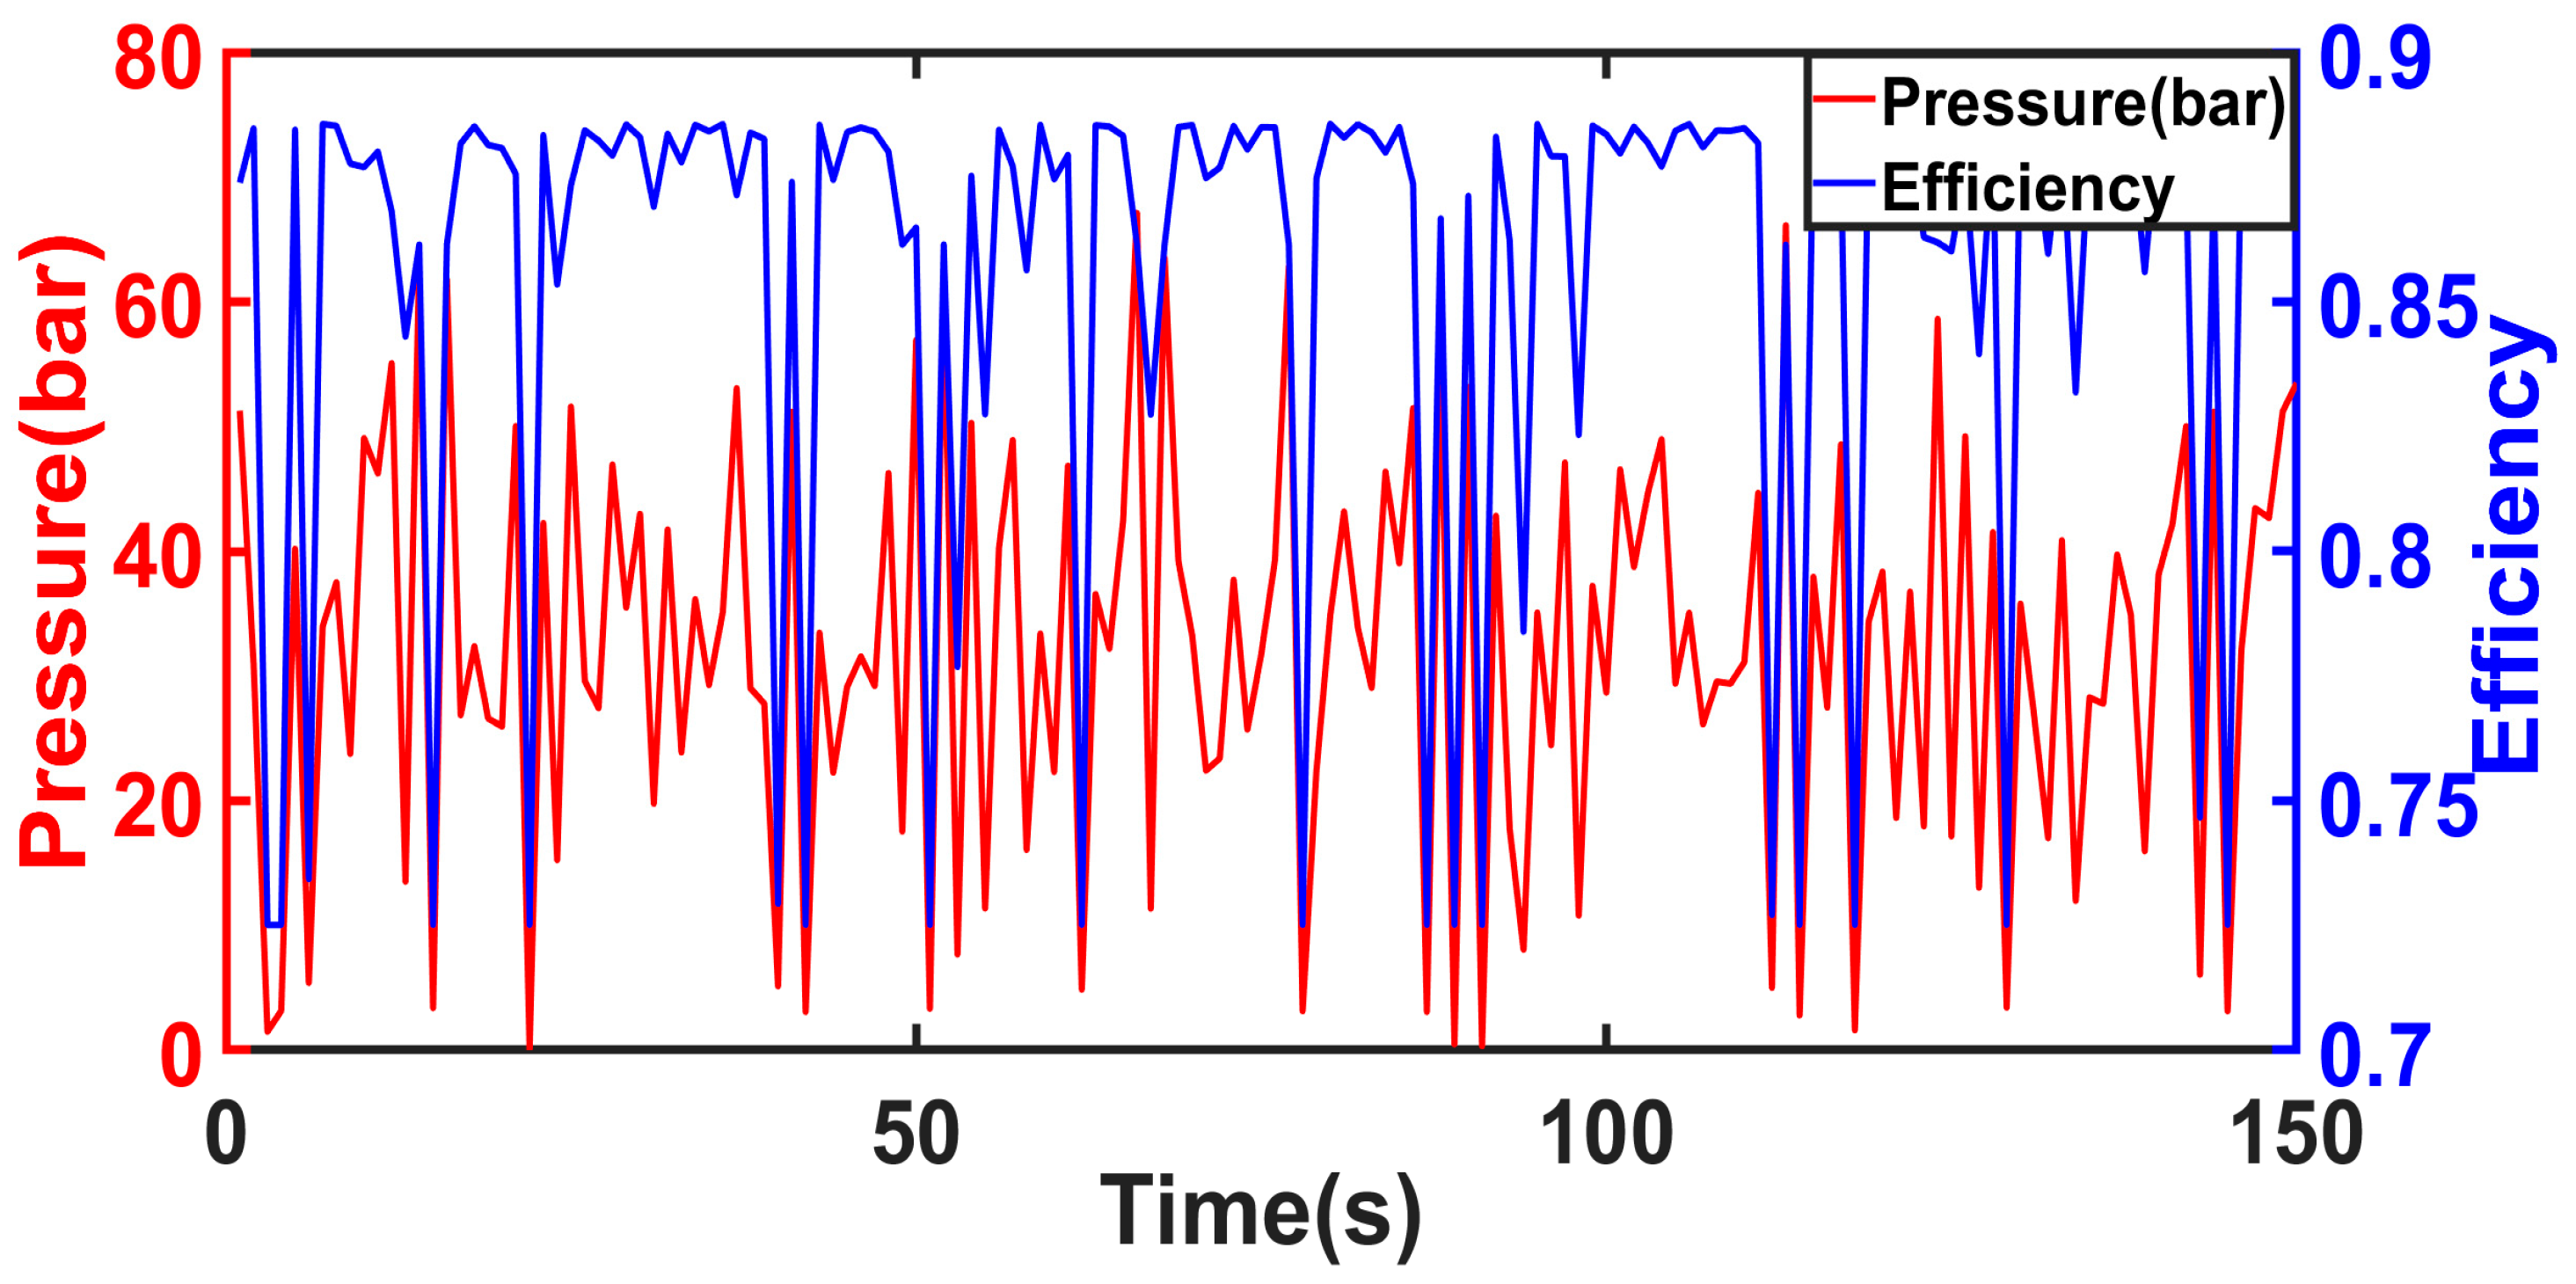
4.1. Hydraulic Efficiency Optimization Verification

In order to validate the effectiveness of the proposed method, it is compared with the traditional method. The traditional method uses the same ratings and configuration of the hydraulic PTO components as the proposed method without applying the control system. Figure 7 shows the pressure and efficiency of the hydraulic motor using the traditional method. The pressure and efficiency result of the proposed method is given in Figure 8. Figure 7 and Figure 8 illustrate that the efficiency of the hydraulic motor is greatly affected by pressure. Compared with the traditional method, the proposed method provides a smoother and lower oscillation amplitude (29 bar–33 bar) pressure, which leads to a higher (0.884–0.886) and smoother efficiency.
In order to demonstrate the impact of the proposed method on the performance of WECs, the power generation comparison of the two methods is shown in Figure 9. It shows that the average power generation of the proposed method reaches 2778 W, while the traditional method can only reach 2117 W. Therefore, the conversion efficiency of the proposed method is increased by 31%.

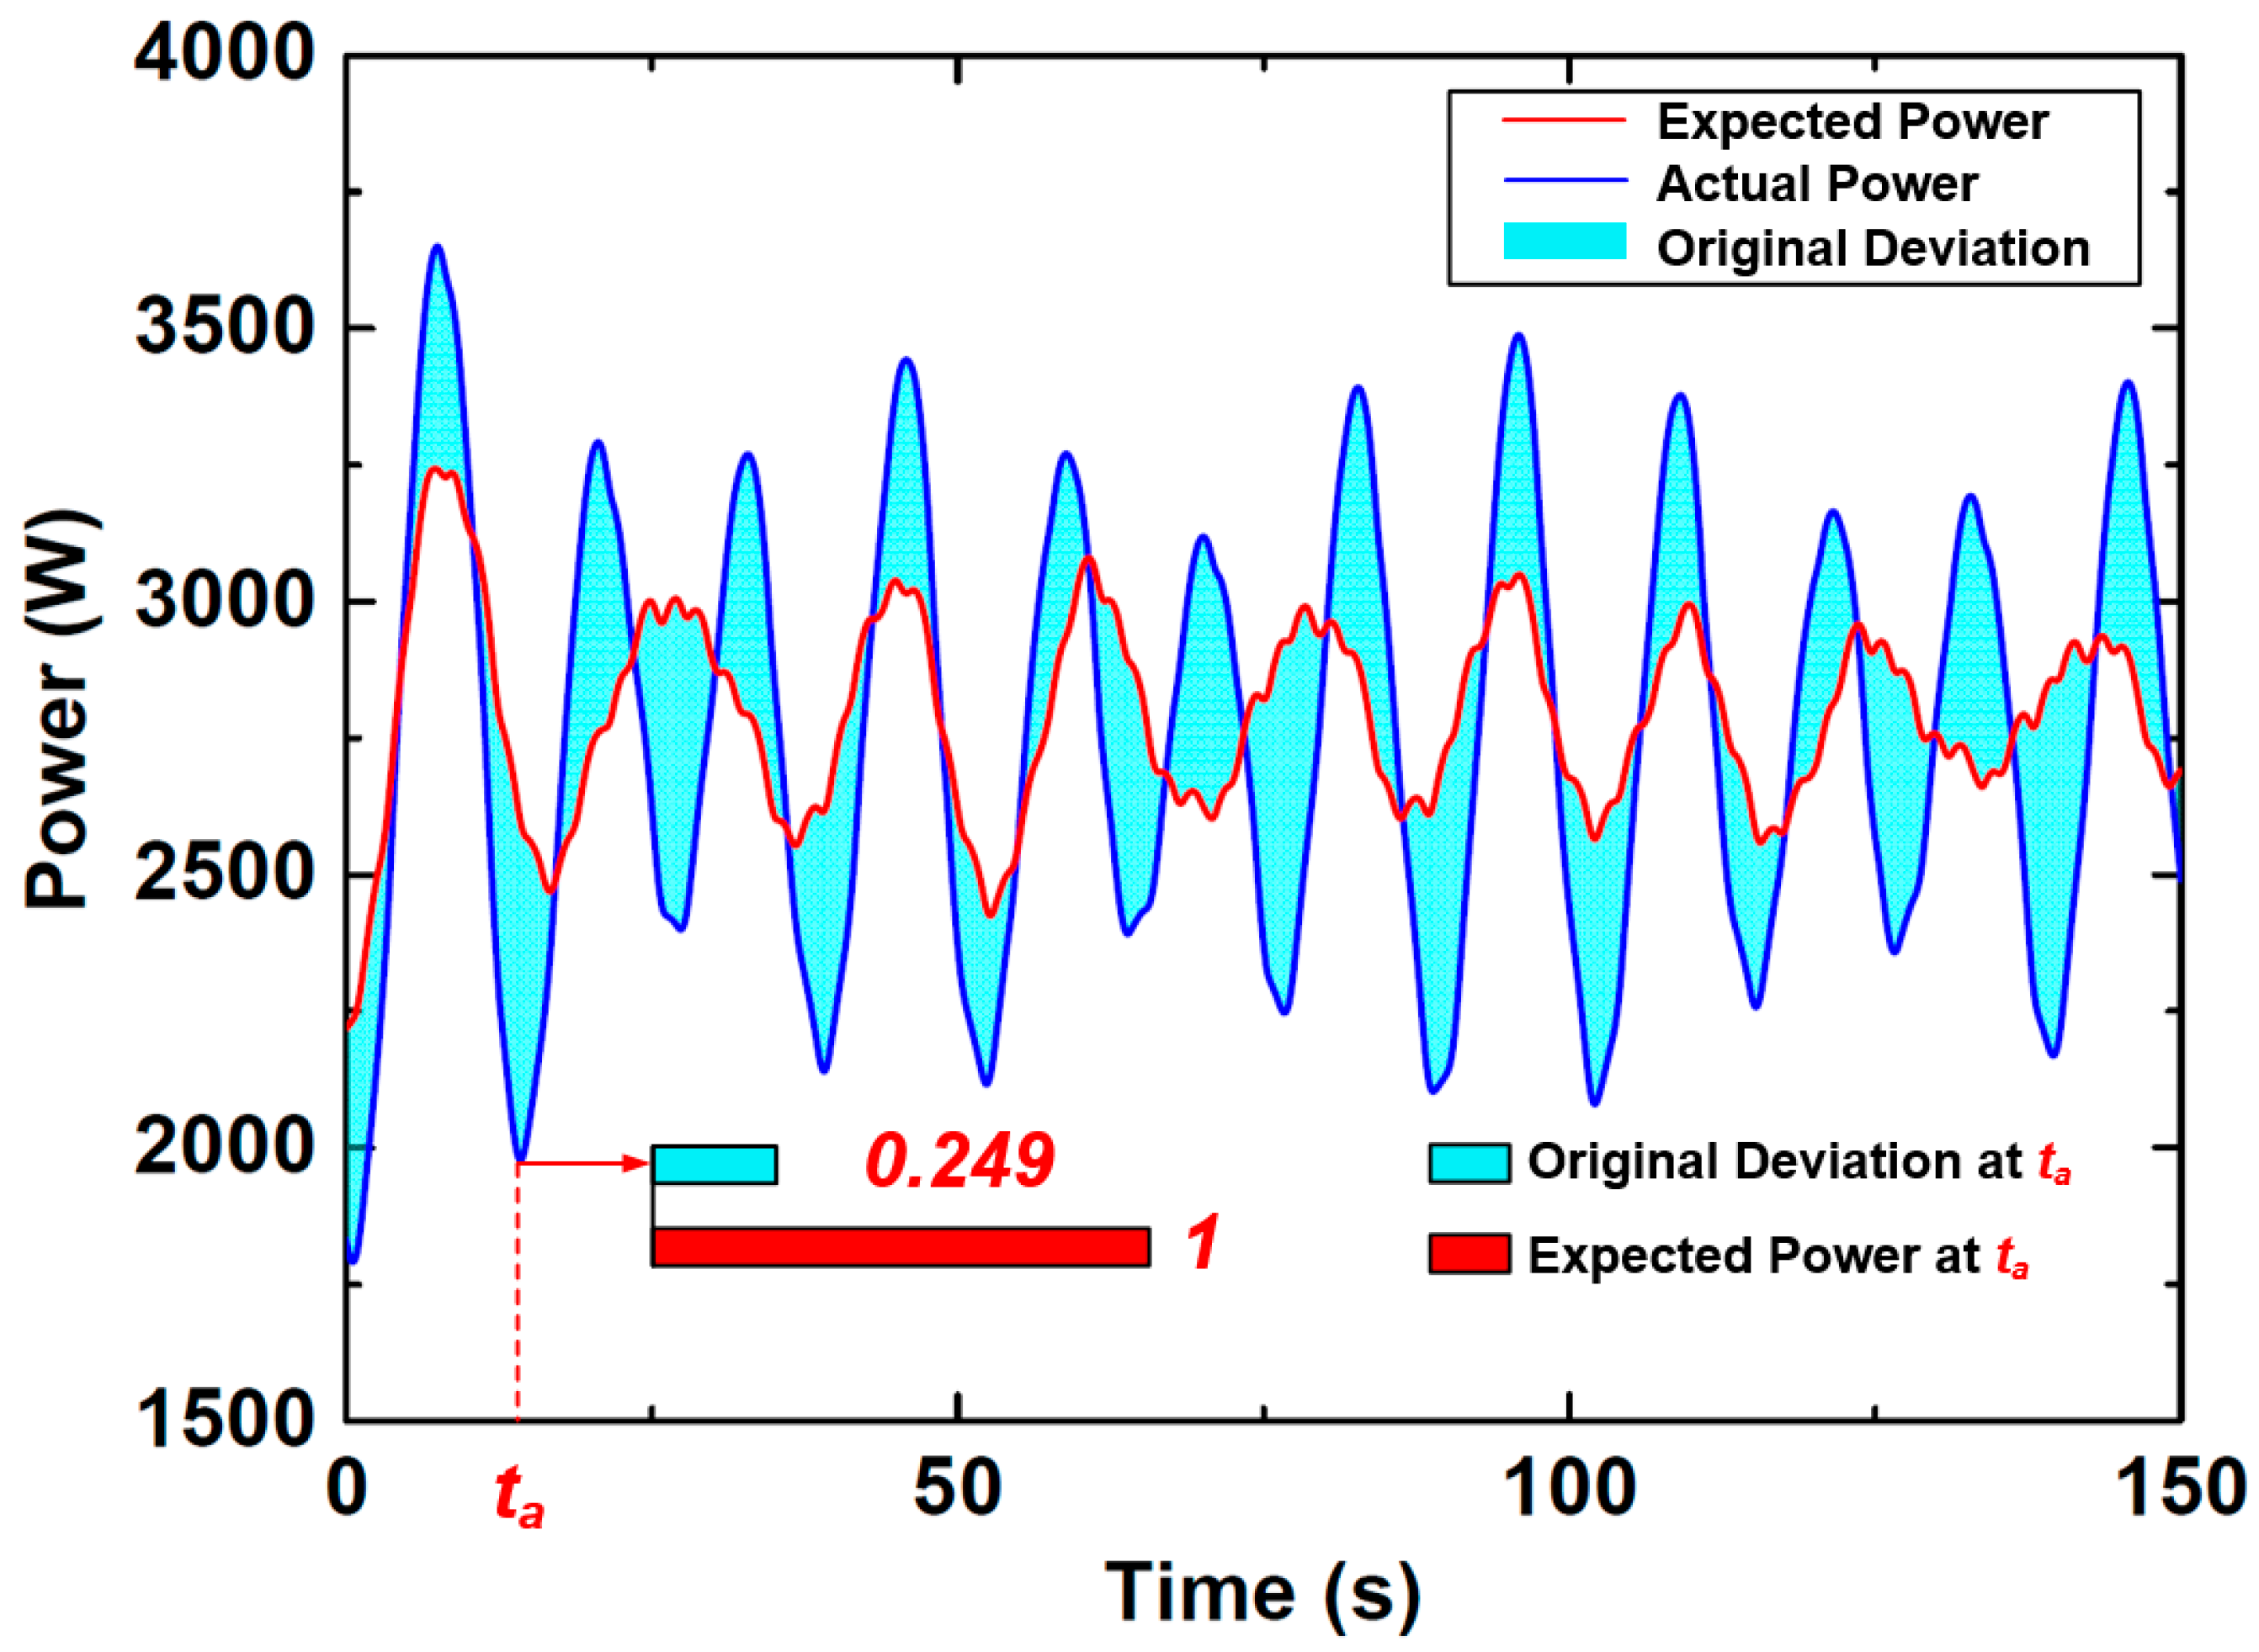
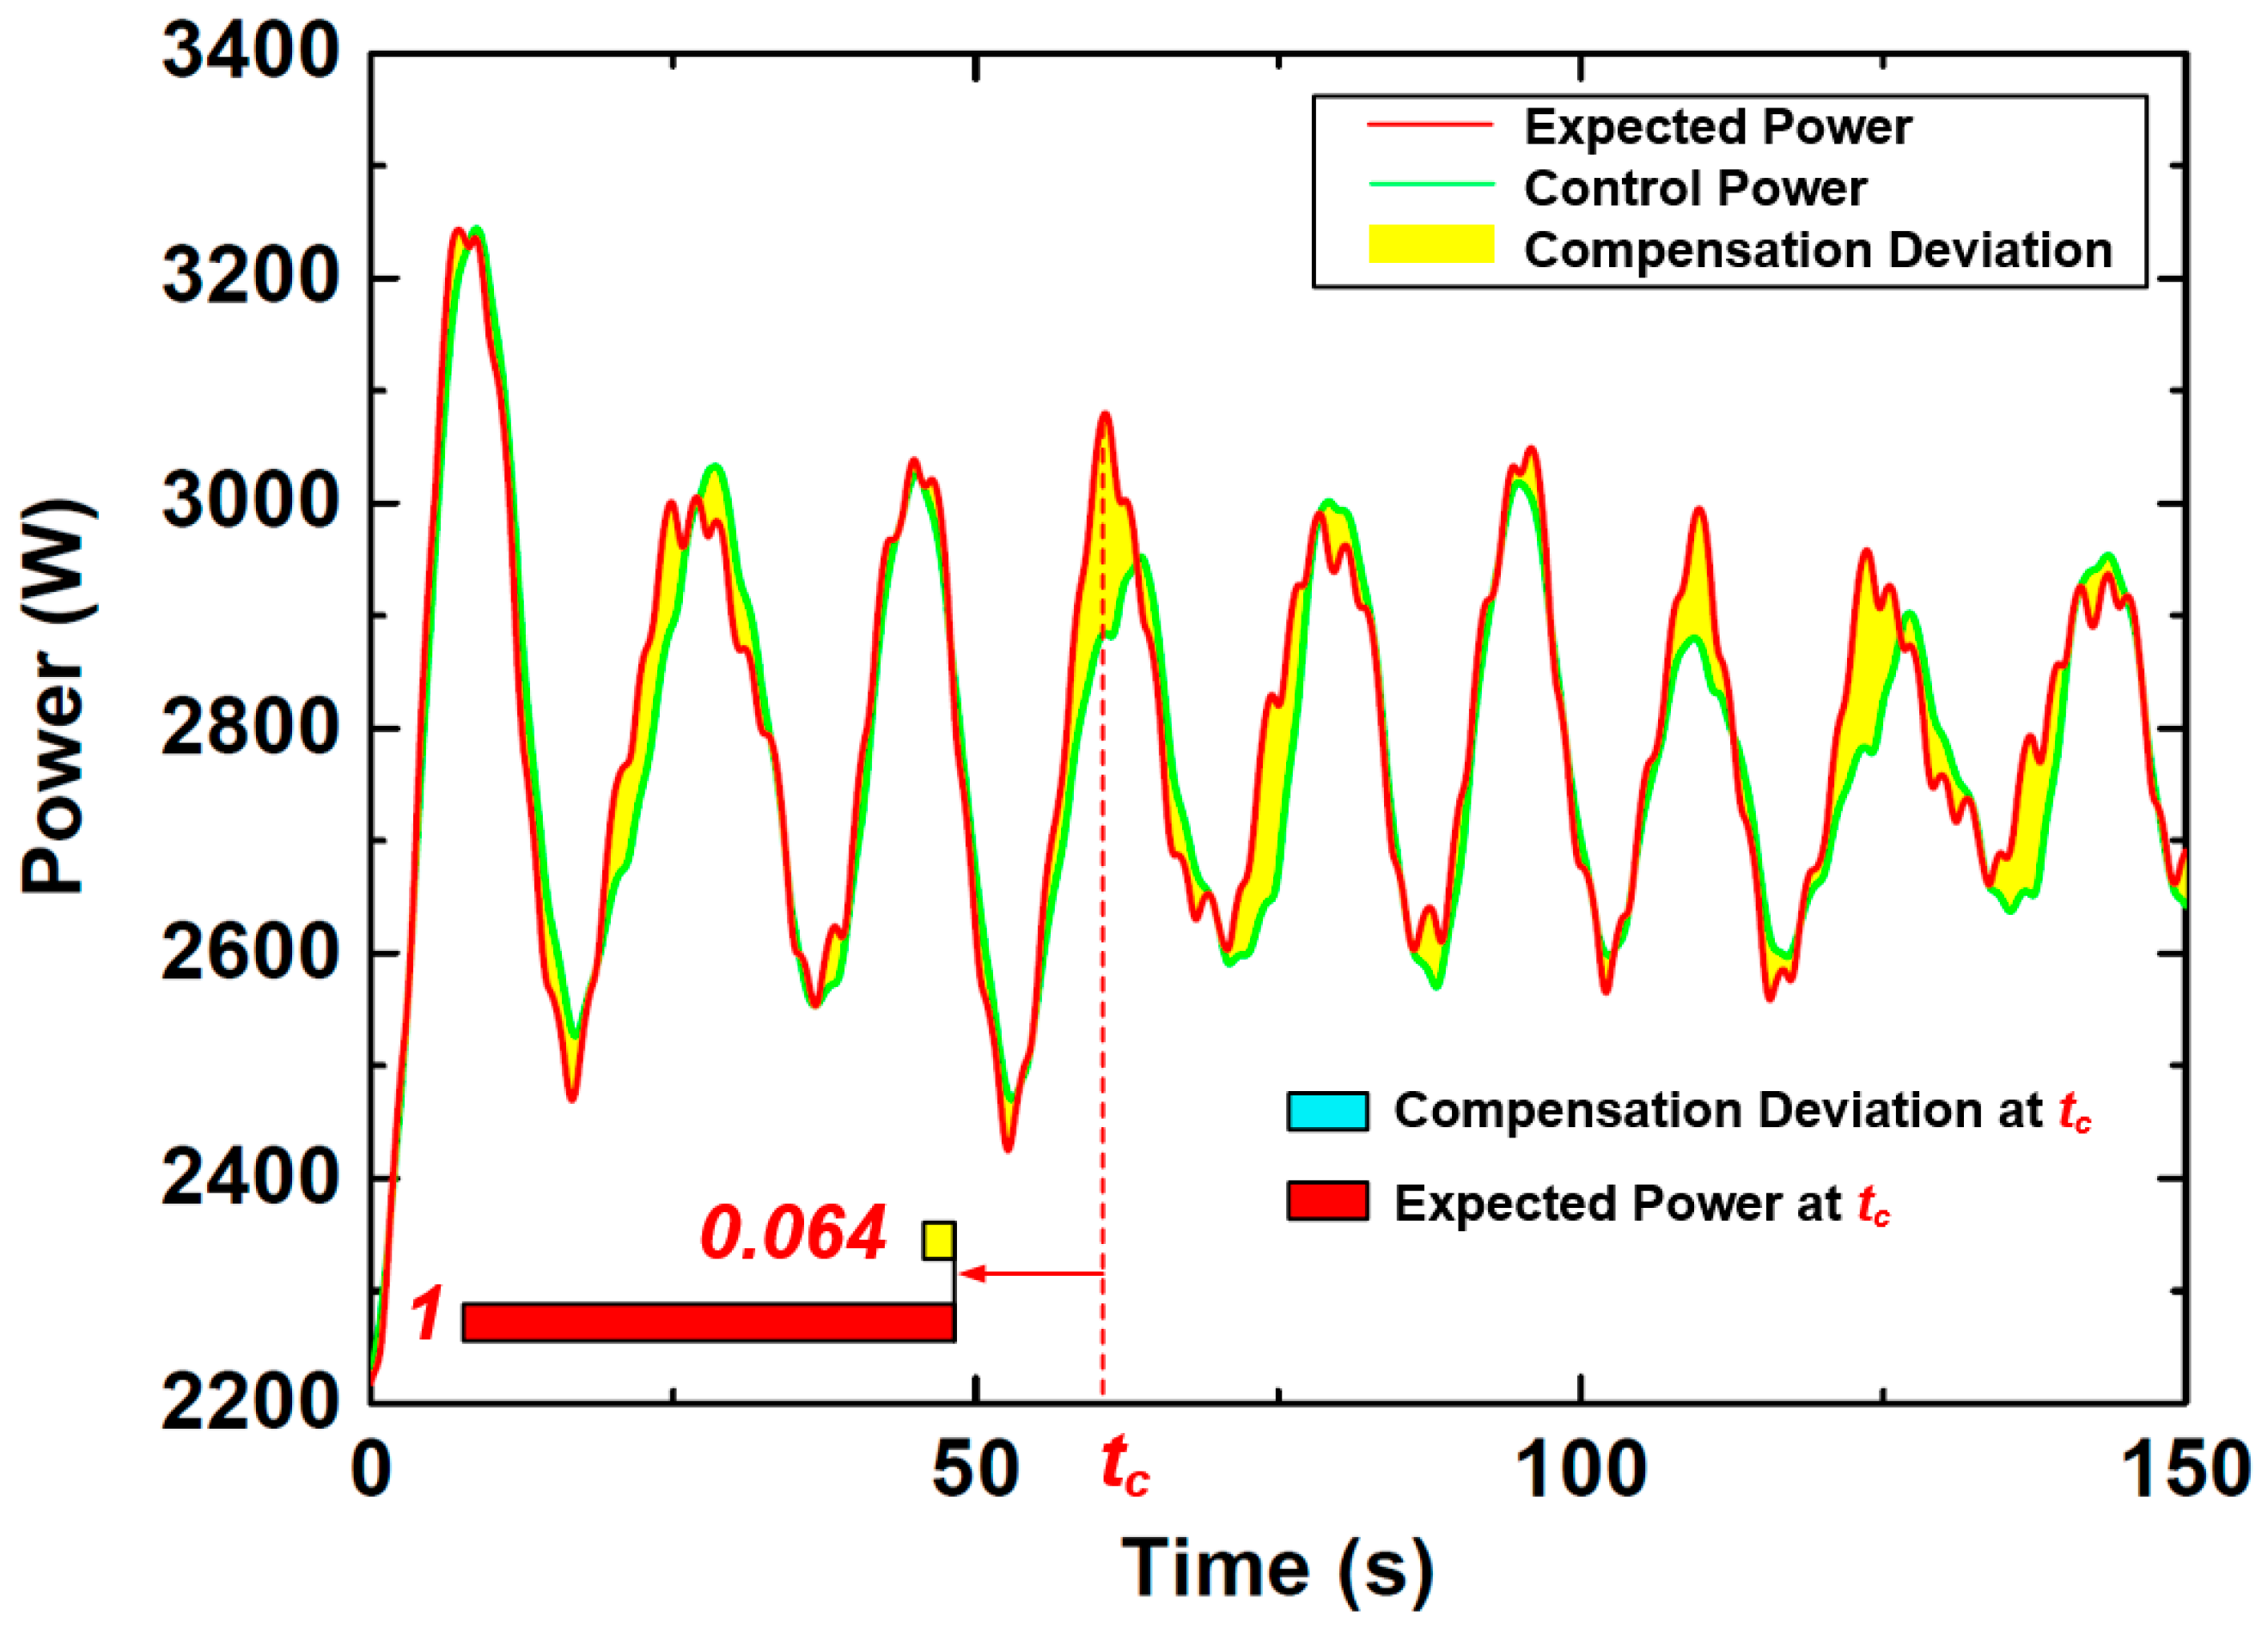
4.2. Prediction Deviation Compensation Verification

Figure 10 shows the comparison of the expected power and the actual power. The filled area between the expected power and the actual power is the original deviation P O r i g e r r . It can be seen that although the wave prediction accuracy is high, there is still a large deviation between the actual power and the expected power due to the prediction error, which will greatly increase the uncertainty of the power generation and reduce the power quality. Figure 11 shows the comparison of the expected power and the control power. The filled area between the expected power and the control power represents the compensation deviation P C o m p e r r .
In Figure 10, the maximum original deviation occurs at time t a , and its ratio to the current expected power generation is 0.249. In Figure 11, the maximum compensation deviation appears at time t c , and its ratio to the current expected power generation is 0.064, which is 74.3% less than the original deviation.
In reference [37], the model was developed for oil pressures up to 320–350 bar. Correspondingly, the overall efficiency of the hydraulic circuit can reach 73%. In this paper, the proposed method provides a smoother pressure (29 bar–33 bar) and a higher efficiency (0.884–0.886), which shows that our hydraulic motor efficiency range exceeds that of [37]. Meanwhile, in reference [26], the simulation results of the error index are 33.59 and 67.86, respectively. After error correction, the results become 10.6 and 16.98, respectively. Corresponding deviation compensation is up to 68.4% and 75.0%, respectively. In this paper, the maximum deviation under the proposed method is 74.3%. Therefore, our results align with Zhang et al. [26].
The proposed method is also applied to two other wave accuracy predictions (RMSE = 0.1499, RMSE = 0.2871) based on the same actual wave. Table 1 shows the detailed comparison results of the proposed method and the traditional method for the three prediction waves.
In this comparison, r 1 is the average ratio of the deviation to the expected power during the simulation time; r 2 is the difference between the r 1 of P O r i g e r r and P C o m p e r r . r 1 , r 2 can be expressed as follows:
r 1 ( P O r i g e r r ) = ( t = 0 T | P A c t p o w P E x p p o w | P E x p p o w   T )
r 1 ( P C o m p e r r ) = ( t = 0 T | P C t o l p o w P E x p p o w | P E x p p o w   T )
r 2 = r 1 P O r i g e r r r 1 ( P C o m p e r r )
where T is the simulation time ( T = 150 s ).
The results show that a lower wave accuracy prediction will lead to a higher original power deviation. However, using the proposed method, the power deviation compensation of the three predicted waves can be performed on the basis of the original deviation. Furthermore, the power deviation compensation of this method has better performance improvement in wave prediction with lower wave prediction accuracy.

5. Conclusions

5.1. Overall Conclusions

This paper proposed a novel WEC control method to improve the power quality and the operation efficiency and stability of the PTO system. A prediction error compensation controller is developed to control the charging and discharging of the accumulators and is used to compensate for the influence of wave prediction errors on the power grid, while a PTO optimization controller is designed to keep the operation pressure of the hydraulic motor in the optimal range, which improves operation efficiency and the stability of the hydraulic PTO system. The effectiveness of the proposed method is validated based on a floating pendulum WEC. Compared with the traditional method, it shows an improved power quality and an optimized hydraulic PTO system. The proposed method reduces peak power deviations by 74.3% and increases energy conversion efficiency by 31%. The controller’s real-time adaptability is also validated under varying prediction accuracies, demonstrating robustness for field deployment.

5.2. Limitations and Future Works

Though the case study results demonstrate the improvement of the proposed method, this paper has limitations. The validation is currently limited to simulation environments due to constraints in hardware availability and time restrictions. Potential deviations exist between simulated and practical conditions, particularly in highly stochastic real-sea environments. Thus, future work will include conducting hardware-in-the-loop (HIL) tests using a scale ratio model to validate control performance. In addition to RMSE values, our future work will also include a systematic sensitivity analysis examining the impact of varying wave heights and periods on power compensation performance, thereby further validating the robustness of the proposed control method. While this study focuses on control optimization, the sensitivity of the hydraulic PTO system to material properties and system parameter effects warrants further investigation. Future work will also include comparative studies of the effects of hydraulic cylinder and accumulator bladder materials and components to reduce maintenance needs in corrosive marine environments.

Author Contributions

D.Z., review, funding acquisition, methodology, supervision; T.L., analysis, data curation, literature review, writing; J.W., analysis, writing—original draft preparation; L.H., investigation, resources; P.Q., formal analysis, methodology; B.F., methodology, review and editing. All authors have read and agreed to the published version of the manuscript.

Funding

This research was funded by the National Key R&D Program of China (Grant No. 2023YFB4204103), the National Natural Science Foundation of China (Grant No. 52371292), the Key Research and Development Program of Zhejiang Province (Grant No. 2023C03121), the Key Research and Development Program of Hainan Province, China (Grant No. ZDYF2024GXJS028), International Scientific and Technological Cooperation and Research and Development Projects in Hainan Province (Grant No. GHYF2025005), Sanya Technology ‘Starry Sky’ Special Project (Grant No. 2024KJFX027), Zhejiang Provincial Natural Science Foundation of China (Grant No. LR25E090001), and the Bureau of Science and Technology of Zhoushan (Grant No. 2023C81008).

Data Availability Statement

The original contributions presented in the study are included in the article, further inquiries can be directed to the corresponding authors.

Acknowledgments

The authors are grateful for the provision of financial support.

Conflicts of Interest

The authors declare no conflicts of interest.

References

  1. Astariz, S.; Iglesias, G. The economics of wave energy: A review. Renew. Sustain. Energy Rev. 2015, 45, 397–408. [Google Scholar] [CrossRef]
  2. Clément, A.; McCullen, P.; Falcão, A.; Fiorentino, A.; Gardner, F.; Hammarlund, K.; Lemonis, G.; Lewis, T.; Nielsen, K.; Petroncini, S.; et al. Wave energy in Europe: Current status and perspectives. Renew. Sustain. Energy Rev. 2002, 6, 405–431. [Google Scholar] [CrossRef]
  3. Yang, X.; Song, Y.; Wang, G.; Wang, W. A Comprehensive Review on the Development of Sustainable Energy Strategy and Implementation in China. IEEE Trans. Sustain. Energy 2010, 1, 57–65. [Google Scholar] [CrossRef]
  4. Falcão, A.F.d.O. Wave energy utilization: A review of the technologies. Renew. Sustain. Energy Rev. 2010, 14, 899–918. [Google Scholar] [CrossRef]
  5. Sheng, W. Wave energy conversion and hydrodynamics modelling technologies: A review. Renew. Sustain. Energy Rev. 2019, 109, 482–498. [Google Scholar] [CrossRef]
  6. Clemente, D.; Rosa-Santos, P.; Taveira-Pinto, F. On the potential synergies and applications of wave energy converters: A review. Renew. Sustain. Energy Rev. 2021, 135, 110162. [Google Scholar] [CrossRef]
  7. He, Z.; Ning, D.; Gou, Y.; Zhou, Z. Wave energy converter optimization based on differential evolution algorithm. Energy 2022, 246, 123433. [Google Scholar] [CrossRef]
  8. Cretel, J.A.M.; Lightbody, G.; Thomas, G.P.; Lewis, A.W. Maximisation of Energy Capture by a Wave-Energy Point Absorber using Model Predictive Control. IFAC Proc. Vol. 2011, 44, 3714–3721. [Google Scholar] [CrossRef]
  9. Liao, Z.; Gai, N.; Stansby, P.; Li, G. Linear Non-Causal Optimal Control of an Attenuator Type Wave Energy Converter M4. IEEE Trans. Sustain. Energy 2020, 11, 1278–1286. [Google Scholar] [CrossRef]
  10. Mahdy, A.; Hasanien, H.M.; Helmy, W.; Turky, R.A.; Abdel Aleem, S.H.E. Transient stability improvement of wave energy conversion systems connected to power grid using anti-windup-coot optimization strategy. Energy 2022, 245, 123321. [Google Scholar] [CrossRef]
  11. Li, H.; Zou, H.; Zhu, J. Optimization of Energy Storage Configuration for Error Compensation of Wind Power Prediction. In Proceedings of the 2019 6th International Conference on Systems and Informatics (ICSAI), Shanghai, China, 2–4 November 2019. [Google Scholar]
  12. Zhu, J.-H.; Pan, W.-X.; Li, X. Energy storage scheduling design on friendly grid wind power. Sustain. Energy Technol. Assess. 2018, 25, 111–118. [Google Scholar] [CrossRef]
  13. Shamshirband, S.; Amir, M.; Timon, R.; Narjes, N.; Chau, K.-W. Prediction of significant wave height; comparison between nested grid numerical model, and machine learning models of artificial neural networks, extreme learning and support vector machines. Eng. Appl. Comput. Fluid Mech. 2020, 14, 805–817. [Google Scholar] [CrossRef]
  14. Ni, C.; Ma, X. Prediction of Wave Power Generation Using a Convolutional Neural Network with Multiple Inputs. Energies 2018, 11, 2097. [Google Scholar] [CrossRef]
  15. Uihlein, A.; Magagna, D. Wave and tidal current energy—A review of the current state of research beyond technology. Renew. Sustain. Energy Rev. 2016, 58, 1070–1081. [Google Scholar] [CrossRef]
  16. Malmberg, A.; Holst, U.; Holst, J. Forecasting near-surface ocean winds with Kalman filter techniques. Ocean Eng. 2005, 32, 273–291. [Google Scholar] [CrossRef]
  17. Kazeminezhad, M.H.; Etemad-Shahidi, A.; Mousavi, S.J. Application of fuzzy inference system in the prediction of wave parameters. Ocean Eng. 2005, 32, 1709–1725. [Google Scholar] [CrossRef]
  18. Deo, M.C.; Kumar, N.K. Interpolation of wave heights. Ocean Eng. 2000, 27, 907–919. [Google Scholar] [CrossRef]
  19. Belmont, M.R.; Horwood, J.M.K.; Thurley, R.W.F.; Baker, J. Filters for linear sea-wave prediction. Ocean Eng. 2006, 33, 2332–2351. [Google Scholar] [CrossRef]
  20. Shi, Z.; Liang, H.; Dinavahi, V. Direct Interval Forecast of Uncertain Wind Power Based on Recurrent Neural Networks. IEEE Trans. Sustain. Energy 2018, 9, 1177–1187. [Google Scholar] [CrossRef]
  21. Li, F.; Liao, H.-y. An intelligent method for wind power forecasting based on integrated power slope events prediction and wind speed forecasting. IEEJ Trans. Electr. Electron. Eng. 2018, 13, 1099–1105. [Google Scholar] [CrossRef]
  22. Zheng, C.W.; Wang, Q.; Li, C.Y. An overview of medium- to long-term predictions of global wave energy resources. Renew. Sustain. Energy Rev. 2017, 79, 1492–1502. [Google Scholar] [CrossRef]
  23. Cai, Z.; Bussar, C.; Stöcker, P.; Moraes, L.; Magnor, D.; Leuthold, M.; Sauer, D.U. Application of Battery Storage for Compensation of Forecast Errors of Wind Power Generation in 2050. Energy Procedia 2015, 73, 208–217. [Google Scholar] [CrossRef]
  24. Mishra, S.P.; Dhar, S.; Dash, P.K. An effective battery management scheme for wind energy systems using multi Kernel Ridge regression algorithm. J. Energy Storage 2019, 21, 418–434. [Google Scholar] [CrossRef]
  25. Arasteh, F.; Riahy, G.H. MPC-based approach for online demand side and storage system management in market based wind integrated power systems. Int. J. Electr. Power Energy Syst. 2019, 106, 124–137. [Google Scholar] [CrossRef]
  26. Zhang, Y.; Wang, P.; Ni, T.; Cheng, P.; Lei, S. Wind Power Prediction Based on LS-SVM Model with Error Correction. Adv. Electr. Comput. Eng. 2017, 17, 3–8. [Google Scholar] [CrossRef]
  27. Henderson, R. Design, simulation, and testing of a novel hydraulic power take-off system for the Pelamis wave energy converter. Renew. Energy 2006, 31, 271–283. [Google Scholar] [CrossRef]
  28. Ahamed, R.; McKee, K.; Howard, I. Advancements of wave energy converters based on power take off (PTO) systems: A review. Ocean Eng. 2020, 204, 107248. [Google Scholar] [CrossRef]
  29. Cargo, C.J.; Hillis, A.J.; Plummer, A.R. Optimisation and control of a hydraulic power take-off unit for a wave energy converter in irregular waves. Proc. Inst. Mech. Eng. Part A J. Power Energy 2014, 228, 462–479. [Google Scholar] [CrossRef]
  30. Grasberger, J.; Yang, L.; Bacelli, G.; Zuo, L. Control co-design and optimization of oscillating-surge wave energy converter. Renew. Energy 2024, 225, 120234. [Google Scholar] [CrossRef]
  31. Cargo, C.J.; Plummer, A.R.; Hillis, A.J.; Schlotter, M. Determination of optimal parameters for a hydraulic power take-off unit of a wave energy converter in regular waves. Proc. Inst. Mech. Eng. Part A J. Power Energy 2012, 226, 98–111. [Google Scholar] [CrossRef]
  32. Liu, C.; Yang, Q.; Bao, G. Influence of hydraulic power take-off unit parameters on power capture ability of a two-raft-type wave energy converter. Ocean Eng. 2018, 150, 69–80. [Google Scholar] [CrossRef]
  33. Falcão, A.F.d.O. Phase control through load control of oscillating-body wave energy converters with hydraulic PTO system. Ocean Eng. 2008, 35, 358–366. [Google Scholar] [CrossRef]
  34. Lin, Y.; Bao, J.; Liu, H.; Li, W.; Tu, L.; Zhang, D. Review of hydraulic transmission technologies for wave power generation. Renew. Sustain. Energy Rev. 2015, 50, 194–203. [Google Scholar] [CrossRef]
  35. López, I.; Andreu, J.; Ceballos, S.; Martínez de Alegría, I.; Kortabarria, I. Review of wave energy technologies and the necessary power-equipment. Renew. Sustain. Energy Rev. 2013, 27, 413–434. [Google Scholar] [CrossRef]
  36. Fan, Y.; Mu, A.; Ma, T. Design and control of a point absorber wave energy converter with an open loop hydraulic transmission. Energy Convers. Manag. 2016, 121, 13–21. [Google Scholar] [CrossRef]
  37. Gaspar, J.F.; Calvário, M.; Kamarlouei, M.; Soares, C.G. Design tradeoffs of an oil-hydraulic power take-off for wave energy converters. Renew. Energy 2018, 129, 245–259. [Google Scholar] [CrossRef]
  38. Papini, G.; Pasta, E.; Carapellese, F.; Bonfanti, M. Energy-maximising model predictive control for a multi degree-of-freedom pendulum-based wave energy system. IFAC-Pap. 2022, 55, 433–438. [Google Scholar] [CrossRef]
  39. Liao, Z.; Li, G. Model predictive control of a wave-to-wire wave energy converter system with non-linear dynamics and non-linear constraints using a tailored pseudo-spectral method. Energy 2024, 304, 132060. [Google Scholar] [CrossRef]
  40. Shadmani, A.; Nikoo, M.R.; Gandomi, A.H.; Wang, R.-Q.; Golparvar, B. A review of machine learning and deep learning applications in wave energy forecasting and WEC optimization. Energy Strategy Rev. 2023, 49, 101180. [Google Scholar] [CrossRef]
  41. Bacelli, G.; Coe, R.G. Comments on Control of Wave Energy Converters. IEEE Trans. Control Syst. Technol. 2021, 29, 478–481. [Google Scholar] [CrossRef]
  42. Gajjar, A.G.; Patel, A.I.; Singh, R.G. Real time implementation of MPC in bottle washer machine for small scale beverage industry. In Proceedings of the 2017 6th International Conference on Computer Applications In Electrical Engineering-Recent Advances (CERA), Roorkee, India, 5–7 October 2017. [Google Scholar]
  43. Gallutia, D.; Tahmasbi Fard, M.; Gutierrez Soto, M.; He, J. Recent advances in wave energy conversion systems: From wave theory to devices and control strategies. Ocean Eng. 2022, 252, 111105. [Google Scholar] [CrossRef]
  44. Pasta, E.; Carapellese, F.; Mattiazzo, G. Deep Neural Network Trained to Mimic Nonlinear Economic Model Predictive Control: An Application to a Pendulum Wave Energy Converter. In Proceedings of the 2021 IEEE Conference on Control Technology and Applications (CCTA), San Diego, CA, USA, 9–11 August 2021. [Google Scholar]
Figure 1. Diagram of control system structure.
Energies 18 04043 g001
Figure 2. Floating pendulum wave energy converter.
Energies 18 04043 g002
Figure 3. Six degrees of freedom of the floating pendulum: 1. Surge, 2. Sway, 3. Heave, 4. Roll, 5. Pitch, 6. Yaw.
Energies 18 04043 g003
Figure 4. Hydraulic PTO system structure block diagram. 1. Hydraulic cylinder, 2. Electro-hydraulic control switch valve, 3. One-way valve, 4. Accumulator, 5. Electromagnetic control valve, 6. Hydraulic motor, 7. Generator, 8. Overflow valve, 9. Pressure gauge, 10. Hydraulic pump, 11. Electric motor, 12. Manual valve, 13. Filter, 14. Tank.
Energies 18 04043 g004
Figure 5. Three-dimensional efficiency of the hydraulic motor.
Energies 18 04043 g005
Figure 6. The comparison of actual wave data and prediction wave data.
Energies 18 04043 g006
Figure 7. The pressure and efficiency of the hydraulic motor in the traditional model.
Energies 18 04043 g007
Figure 8. The pressure and efficiency of the hydraulic motor in the proposed model.
Energies 18 04043 g008
Figure 9. The comparison of power generation in the traditional model and the proposed model.
Energies 18 04043 g009
Figure 10. The comparison of expected power and actual power.
Energies 18 04043 g010
Figure 11. The comparison of expected power and control power.
Energies 18 04043 g011
Table 1. Comparison results of the proposed method and the traditional method in three different wave accuracy predictions.
RMSE of Wave Prediction ErrorDeviationRMSE of Power Deviation r 1 r 2
0.0500 P O r i g e r r 351.990.11230.0964
P C o m p e r r 58.140.0159
0.1499 P O r i g e r r 437.200.14050.1199
P C o m p e r r 74.140.0206
0.2871 P O r i g e r r 642.800.19430.1277
P C o m p e r r 219.400.0666
Disclaimer/Publisher’s Note: The statements, opinions and data contained in all publications are solely those of the individual author(s) and contributor(s) and not of MDPI and/or the editor(s). MDPI and/or the editor(s) disclaim responsibility for any injury to people or property resulting from any ideas, methods, instructions or products referred to in the content.

