Abstract
The synergistic development of low-permeability reservoirs such as deep coalbed methane (CBM) and tight gas has emerged as a key technology to reduce development costs, enhance single-well productivity, and improve gas recovery. However, due to fundamental differences between coal seams and tight sandstones in their pore structure, permeability, water saturation, and pressure sensitivity, significant variations exist in their flow capacities and fluid production behaviors. To address the challenges of production allocation and main reservoir identification in the co-development of CBM and tight gas within deep gas-bearing basins, this study employs the transient multiphase flow simulation software OLGA to construct a representative dual-gas co-production well model. The regulatory mechanisms of the gas–liquid distribution, deliquification efficiency, and interlayer interference under two typical vertical stacking relationships—“coal over sand” and “sand over coal”—are systematically analyzed with respect to different tubing setting depths. A high-precision dynamic production allocation method is proposed, which couples the wellbore structure with real-time monitoring parameters. The results demonstrate that positioning the tubing near the bottom of both reservoirs significantly enhances the deliquification efficiency and bottomhole pressure differential, reduces the liquid holdup in the wellbore, and improves the synergistic productivity of the dual-reservoirs, achieving optimal drainage and production performance. Building upon this, a physically constrained model integrating real-time monitoring data—such as the gas and liquid production from tubing and casing, wellhead pressures, and other parameters—is established. Specifically, the model is built upon fundamental physical constraints, including mass conservation and the pressure equilibrium, to logically model the flow paths and phase distribution behaviors of the gas–liquid two-phase flow. This enables the accurate derivation of the respective contributions of each reservoir interval and dynamic production allocation without the need for downhole logging. Validation results show that the proposed method reliably reconstructs reservoir contribution rates under various operational conditions and wellbore configurations. Through a comparison of calculated and simulated results, the maximum relative error occurs during abrupt changes in the production capacity, approximately 6.37%, while for most time periods, the error remains within 1%, with an average error of 0.49% throughout the process. These results substantially improve the timeliness and accuracy of the reservoir identification. This study offers a novel approach for the co-optimization of complex multi-reservoir gas fields, enriching the theoretical framework of dual-gas co-production and providing technically adaptive solutions and engineering guidance for multilayer unconventional gas exploitation.
1. Introduction
In recent years, with the continuous advancement of unconventional natural gas development technologies [1,2], the synergistic exploitation of low-permeability reservoirs, such as deep coalbed methane (CBM), tight gas, and shale gas, has emerged as a critical approach to improving overall gas production [3,4]. In particular, coal seams and tight sandstone formations in deep gas-bearing basins often exhibit complex geological configurations such as vertical stacking, interbedding, or close spatial distributions. These characteristics provide both resource potential and wellbore structural advantages for multi-reservoir co-development [5]. Against this backdrop, exploiting multiple reservoirs through a single well has become an effective strategy to enhance single-well productivity, reduce well spacing, and minimize development costs [6,7]. Among such strategies, the co-production of deep CBM and tight gas—referred to as dual-gas co-production—has gained increasing traction as a frontier technique for efficient unconventional gas recovery. It has been successfully performed and promoted in several basins, demonstrating promising technical applicability and economic viability [7]. However, compared with single-reservoir exploitation, dual-gas co-production wells are inherently more complex. Fundamental differences between coal seams and tight sandstones in terms of their pore structure, permeability, water saturation, and pressure sensitivity result in distinct flow capacities and fluid production characteristics. CBM production typically involves a high water yield and exhibits a pronounced desorption–diffusion–flow coupling behavior [8], whereas tight gas primarily flows in the free state, driven mainly by pressure gradients. The simultaneous production of these two reservoirs through a shared wellbore inevitably induces significant interlayer interference, gas–liquid phase segregation, and pressure competition along the wellbore [9,10]. These effects complicate the internal multiphase flow regimes, hinder effective liquid unloading, and obscure the relationship between wellhead monitoring parameters (e.g., pressure, temperature) and individual reservoir contributions. In such a dynamic and highly coupled production environment, the accurate identification of each reservoir’s contribution becomes a prerequisite for refined production management and optimization strategies [11].
Production allocation plays a pivotal role not only in evaluating the reservoir potential and quantifying interlayer interference but also in informing key development decisions, such as fracturing design, injection–production scheduling, layer selection, and strategy optimization [12,13]. Currently, the production allocation in dual-gas wells relies heavily on downhole measurements, such as logging interpretation and zonal testing [14]. While these approaches offer some utility at specific development stages, they are constrained by their limited resolution, operational complexity, and high costs, making it difficult to achieve real-time or continuous monitoring [15]. Furthermore, existing allocation models based on theoretical assumptions or empirical formulas often lack robustness when applied to structurally complex, dynamically evolving dual-gas systems [16]. Their generalization ability is limited, and they frequently rely on parameters that are difficult to measure or track under field conditions. This restricts their applicability in practical production environments, where high-resolution, adaptive, and real-time production tracking is needed [17]. To address this challenge, numerous researchers have proposed various methods for production allocation in multilayer gas wells. In recent years, various layered production allocation models have been proposed to address the challenges of the multiphase flow and interlayer interference in multilayer gas wells. Some studies integrated transient flow theory and additional physical mechanisms to improve the accuracy of the productivity prediction (e.g., Ren et al. [18] incorporated CO2 dissolution effects, while Cheng et al. [19] introduced elliptical boundary flow and material balance). Others employed optimization algorithms and machine learning approaches to enhance adaptability under complex reservoir conditions (e.g., Song et al. [20] used SMBO, ensemble learning, and cooperative game theory). Additionally, several works improved upon traditional models by introducing interference coefficients [21], accounting for stress sensitivity [22], or adapting to specific reservoir types such as karst [23] and tight sandstone [24]. However, most of these methods either rely heavily on static reservoir parameters or require extensive historical data and simulation iterations, limiting their applicability in real-time field operations. In contrast, our proposed method integrates real-time wellhead monitoring parameters with reservoir layer dynamics and transient flow behavior, enabling accurate, automated production allocation in dual-gas co-production wells with limited data requirements. This approach improves the prediction precision while enhancing operational efficiency in complex multi-reservoir systems.
Despite these advancements, prevailing methods such as the KH method, the step-change method, and production profile testing all have limitations. The KH method neglects reservoir pressure effects and is applicable only to mildly heterogeneous reservoirs. The step-change method considers only static conditions and fails to reflect dynamic changes. Production profile testing is costly and unsuitable for continuous monitoring. Theoretical and model-based methods require numerous reservoir parameters, which are often difficult to quantify in real-time, limiting their applicability. Given that production allocation coefficients are foundational for multilayer dynamic forecasting, it is of great significance to develop methods capable of dynamically updating these coefficients. To this end, a robust production allocation model that responds to real-time changes and incorporates the wellbore structure and monitoring data is urgently needed to support layer contribution identification, interference assessment, and adaptive strategy development in dual-gas co-production wells. In this study, a transient numerical simulation model of a dual-gas co-production well was constructed using OLGA software (version 2022). The regulatory mechanisms of the gas–liquid phase behavior in the wellbore, influenced by critical structural parameters such as the tubing depth and reservoir stacking configuration, were systematically analyzed. The non-steady-state flow behaviors under complex well conditions were investigated, including flow splitting and coupling effects. Based on the transient simulations, a novel dynamic production allocation method was developed, driven by real-time monitoring data. Unlike traditional methods that rely on static logging or assumed parameters, the proposed approach establishes a physically based mapping between reservoir-specific fluid contributions and observable wellhead responses. This enables the inverse estimation of reservoir contributions under long-term, variable, and multi-condition production scenarios. The method provides both theoretical support and practical tools for the dynamic monitoring and optimized development of multilayer unconventional gas reservoirs.
2. Layered Production Allocation Method
For natural flowing wells, real-time surface monitoring includes the oil pressure, casing pressure, and gas and liquid production from both the tubing and annulus. For pumping wells, due to the pressure discontinuity at the pump, real-time downhole pressure monitoring at the pump inlet is utilized. Under the condition of dual-reservoir commingled production, let the gas and liquid production from the upper reservoir be denoted as Qgru and Qlru and from the lower reservoir as Qgrd and Qlrd. The gas and liquid production from the tubing are Qgt and Qlt and from the annulus are Qgc and Qlc, respectively. The conservation equations are established as follows:
(1) Gas allocation from the upper reservoir:
When the tubing is set above the dual-reservoir interval, gas from the upper reservoir first enters the casing and then is distributed at the tubing shoe. In this case, part of the gas enters the tubing and the rest flows through the casing. If the tubing is set at the mid or lower part of the dual-reservoir, gas from the upper reservoir is entirely produced via the annulus.
(2) Liquid allocation from the upper reservoir:
In gas–water-producing wells, the upper reservoir also produces water under the production pressure differential. When the tubing is placed at the top, the produced water is distributed between the tubing and casing at the tubing shoe.
If the tubing is placed in the mid or lower part, the liquid may fall under gravity and be lifted by the lower reservoir gas. When the casing gas velocity exceeds the critical liquid-lifting velocity [25], all liquid is transported via the annulus; otherwise, a portion falls to the bottom and is lifted by the lower reservoir gas, while the rest is carried by the upper reservoir gas.
(3) Gas allocation from the lower reservoir:
If the tubing is set in the upper or middle section, the lower reservoir is located below the tubing shoe, and its gas flows to the tubing shoe, where it splits between the tubing and annulus. If the tubing is set at the bottom, gas is produced entirely through the annulus.
(4) Liquid allocation from the lower reservoir:
If the tubing is set in the upper or middle section, the liquid is split at the tubing shoe similarly to the gas.
If the tubing is placed at the bottom, the gravity-driven liquid fallback and gas-lifting interaction dictate the split.
(5) Wellhead production accounting:
From the above fluid flow and conservation principles, the measured wellhead production for tubing and casing streams provides the following balance:
where Qgru and Qlru represent the gas and liquid production rates from the upper reservoir layer (m3/s), Qgrd and Qlrd represent the gas and liquid production rates from the lower reservoir layer (m3/s), Qgt and Qlt represent the tubing gas and liquid production rates at the wellhead (m3/s), Qgc and Qlc represent the casing (annulus) gas and liquid production rates at the wellhead (m3/s), subscripts c and t indicate the production through the casing and tubing, respectively, and vsg and vsgc represent the superficial gas velocity and the critical liquid-carrying velocity, respectively (m/s).
(6) Allocation process:
The layered production allocation process involves a multi-factor coupled computation including the phase split at the tubing/casing, inter-reservoir fluid distribution, and multiphase flow in the wellbore. During the production allocation, it is assumed that the gas–liquid ratio remains constant, and the production allocation coefficient is introduced to stratify the gas and liquid production rates contributed by each reservoir in a co-producing well. The production allocation coefficient describes the relative contribution of a specific reservoir layer to the total production, representing its proportionate share in the total gas or liquid output. This coefficient reflects the production imbalance among different reservoir layers. Physically, it can be interpreted as the ratio of gas (or liquid) produced from a specific reservoir to the total gas (or liquid) production of the well under current operating conditions. The calculation formula is given as follows.
where λ(t) is the gas allocation coefficient at time t, and Qgj(t) and Qg(t) are the gas production rate of the j-th reservoir and total gas production rate at time t, respectively.
At each time step, the tubing and casing phase mass is updated by accounting for the reservoir inflow and wellhead outflow:
where i denotes time step index, mgc, mgt, mlc, and mlt represent the gas and liquid mass in the casing and tubing (kg), mgru,c, mgru,t, mgrd,c, and mgrd,t represent the mass of the gas from upper and lower reservoirs entering the casing and tubing (kg), mlru,c, mlru,t, mlrd,c, and mlrd,t represent the mass of the liquid from upper and lower reservoirs entering the casing and tubing (kg), and mgout,c, mgout,t, mlout,c, and mlout,t represent the gas and liquid masses exiting the casing and tubing at the wellhead (kg).
Accordingly, the gas production from each reservoir can be written as follows:
To compute the unknowns at each time step, including gas and liquid masses in the tubing and casing and the allocation coefficient, the phase mass can be determined using the gas–liquid equation of state:
Using measured wellhead tubing and casing pressures, the bottomhole pressure at the shoe of the tubing and casing is calculated through a multiphase flow model:
where and represent the tubing and casing pressures at the wellhead (Pa), Zt and Zc represent the Z-factors for the gas in the tubing and casing, R is the universal gas constant (J/(kg·K)), Tt and Tc represent the average gas temperatures in the tubing and casing (K), Mg is the molar mass of the gas (mol/kg), At and Ac represent the cross-sectional areas of the tubing and casing (m2), Hlt and Hlc represent the liquid column heights in the tubing and casing (m), ρl is the liquid density (kg/m3), Pt and Pc represent the tubing pressure and casing pressure (Pa), γg is the specific gravity of the gas, and Pwft and Pwfc are the calculated bottomhole pressure at the tubing and casing shoes (Pa).
In the inverse modeling process, the objective function is defined as minimizing the deviation between simulated and measured wellhead pressures at each time step, subject to the constraint that the pressures at the tubing and casing shoes must be equal due to the flow equilibrium. Hence, the optimization objective function is
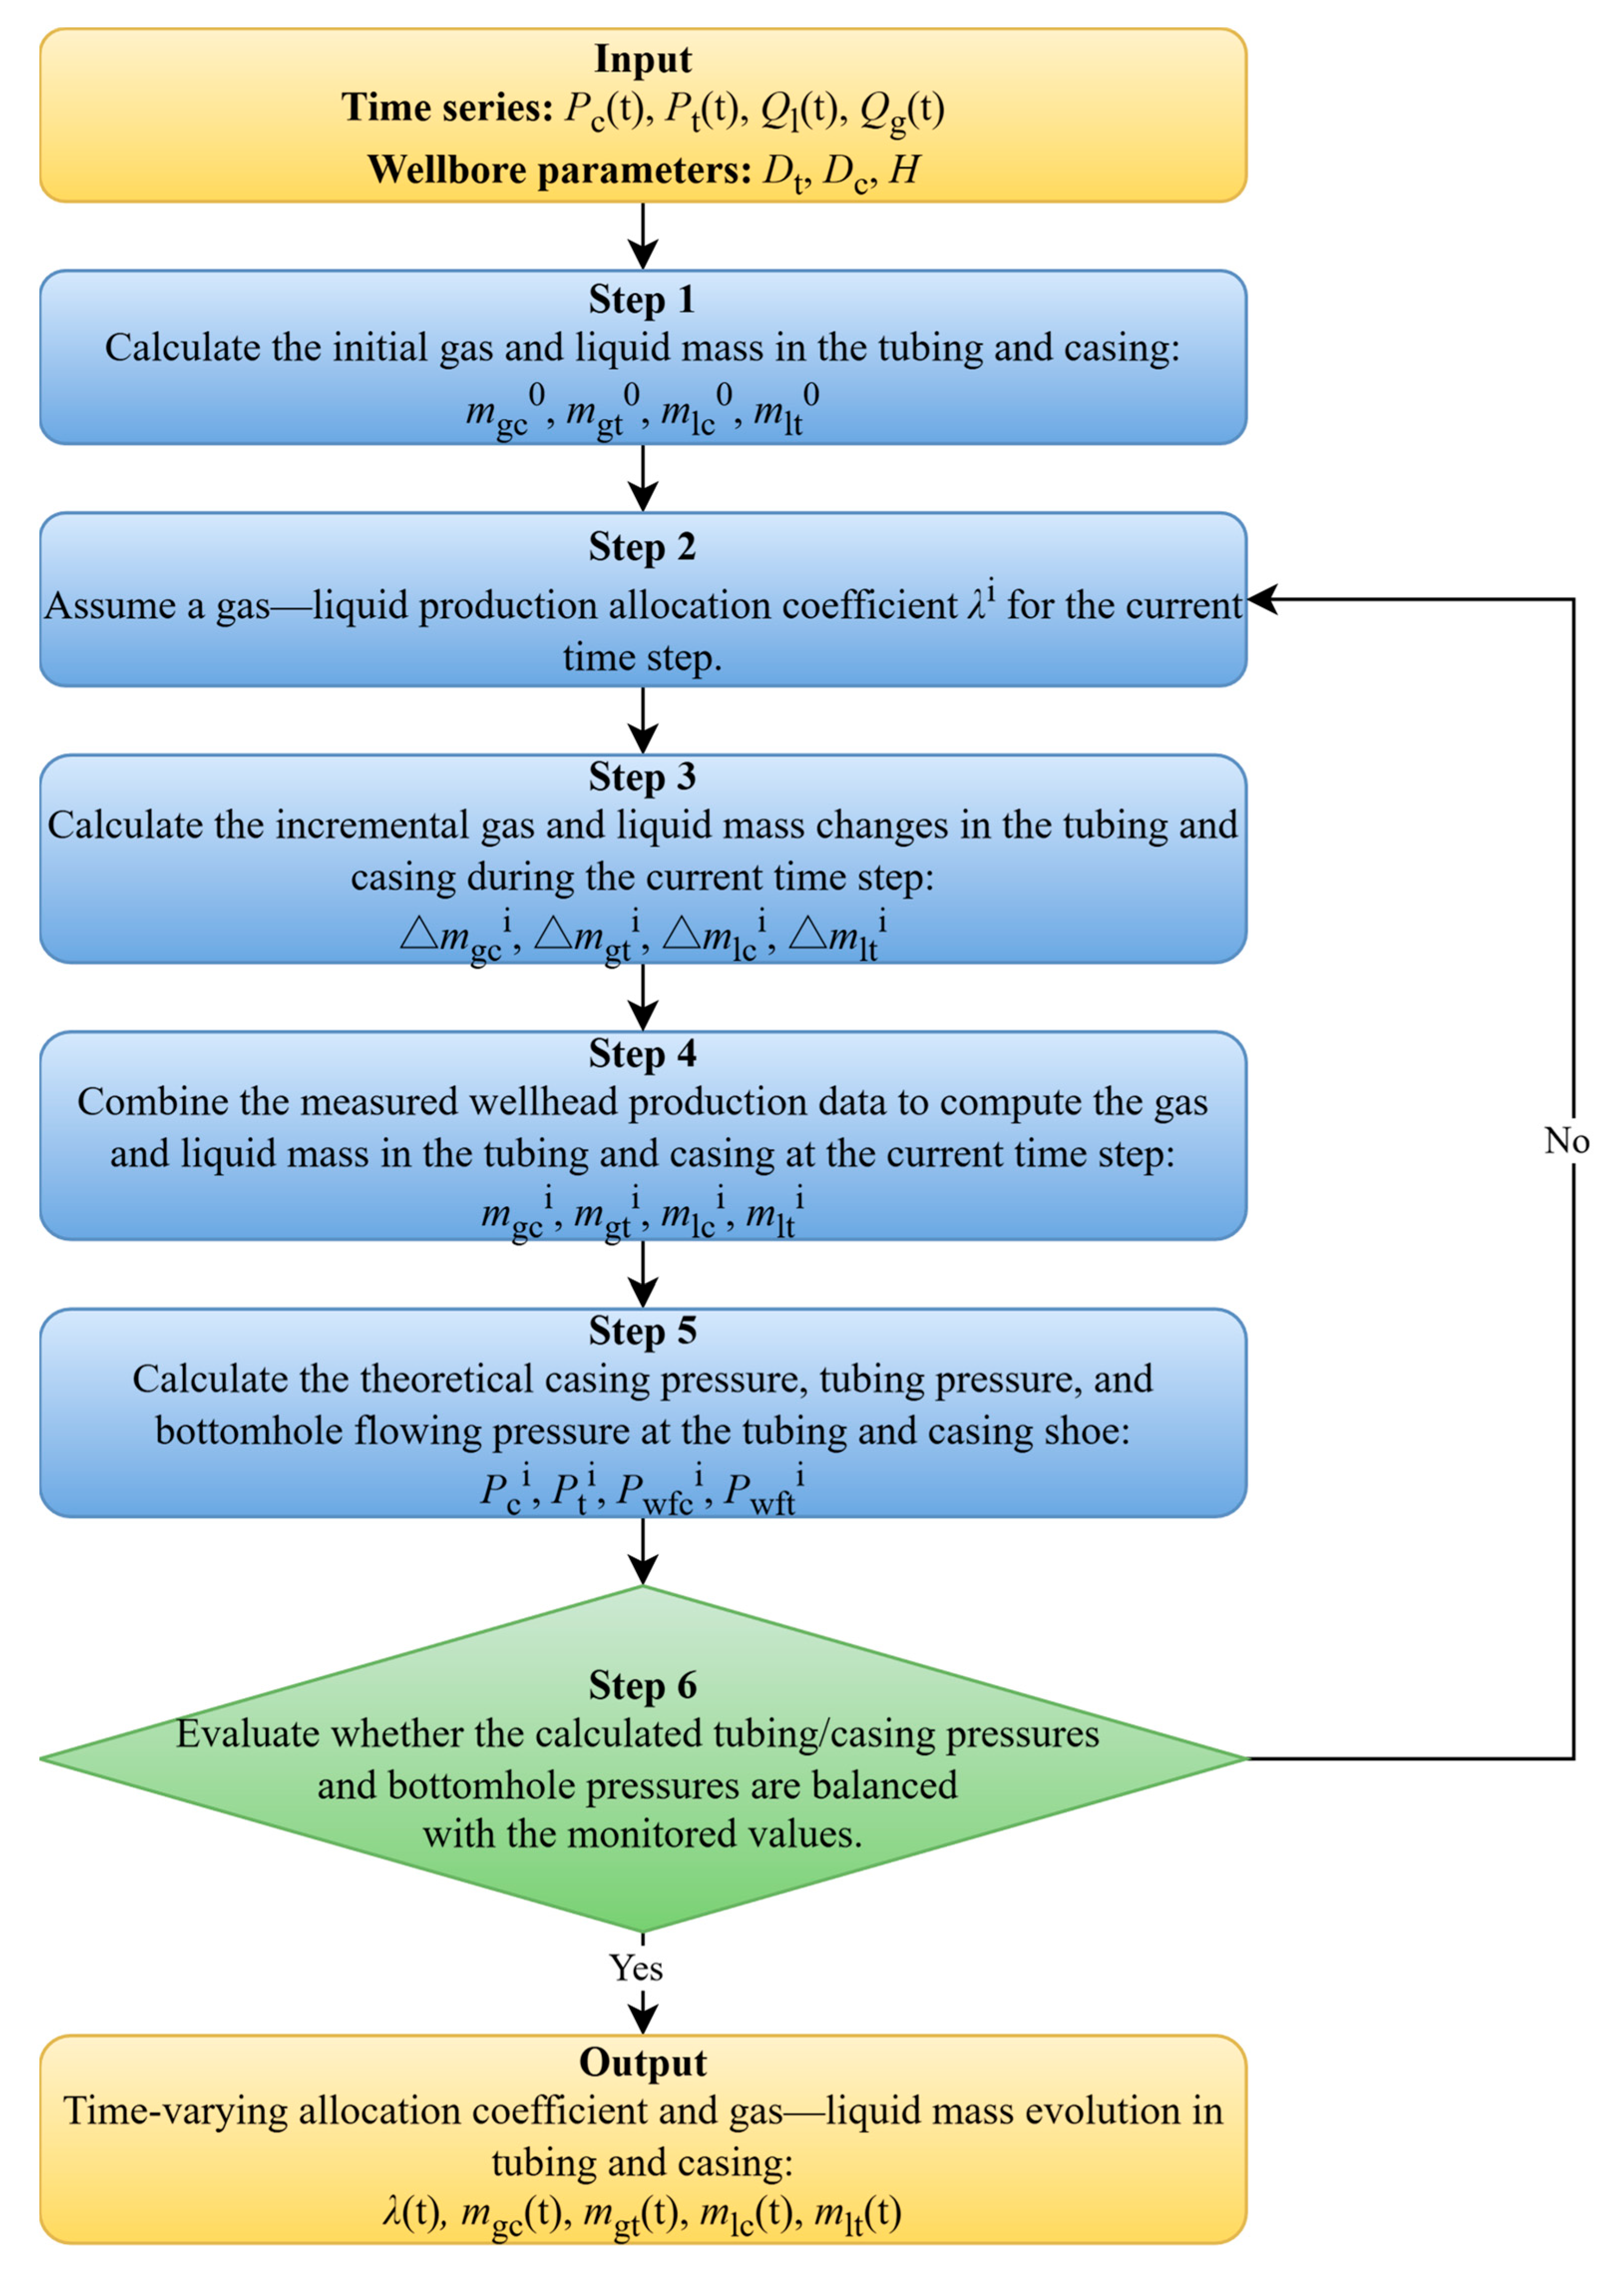
The solution process follows a systematic iterative approach at each time step, as illustrated in Figure 1. The model begins with time series inputs, including the measured tubing pressure Pt(t), casing pressure Pc(t), total liquid rate Ql(t), and total gas rate Qg(t), alongside well configuration parameters such as the inner tubing diameter Dt, inner casing diameter Dc, and well depth H. Step 1 involves estimating initial gas and liquid phase masses in the tubing and casing (mgt0, mgc0, mlt0, mlc0) based on the static pressure and well geometry. In Step 2, an initial guess for the gas–liquid split coefficient λi is assumed for the current time step. Step 3 calculates the incremental changes in gas and liquid masses in both tubing and casing (Δmgci, Δmgti, Δmlci, Δmlti). Step 4 updates the total phase masses by combining increments with prior values. Step 5 uses these updated masses within a multiphase pressure gradient model to compute theoretical pressures at the casing and tubing shoes and at the wellhead (Pci, Pti, Pwfci, Pwfti). Step 6 assesses the convergence by comparing computed pressures with measured values; if not converged, λi is adjusted and the process iterates until tolerance is met. The output consists of the time-varying allocation coefficient λ(t) and dynamic phase mass evolutions mgt(t), mgc(t), mlt(t), mlc(t), effectively linking inputs and outputs through a clear computational workflow.

Figure 1.
Flowchart of gas–liquid production allocation process.
3. Transient Simulation of Gas–Liquid Segregation in Dual-Gas Co-Production Wells
3.1. Model Construction
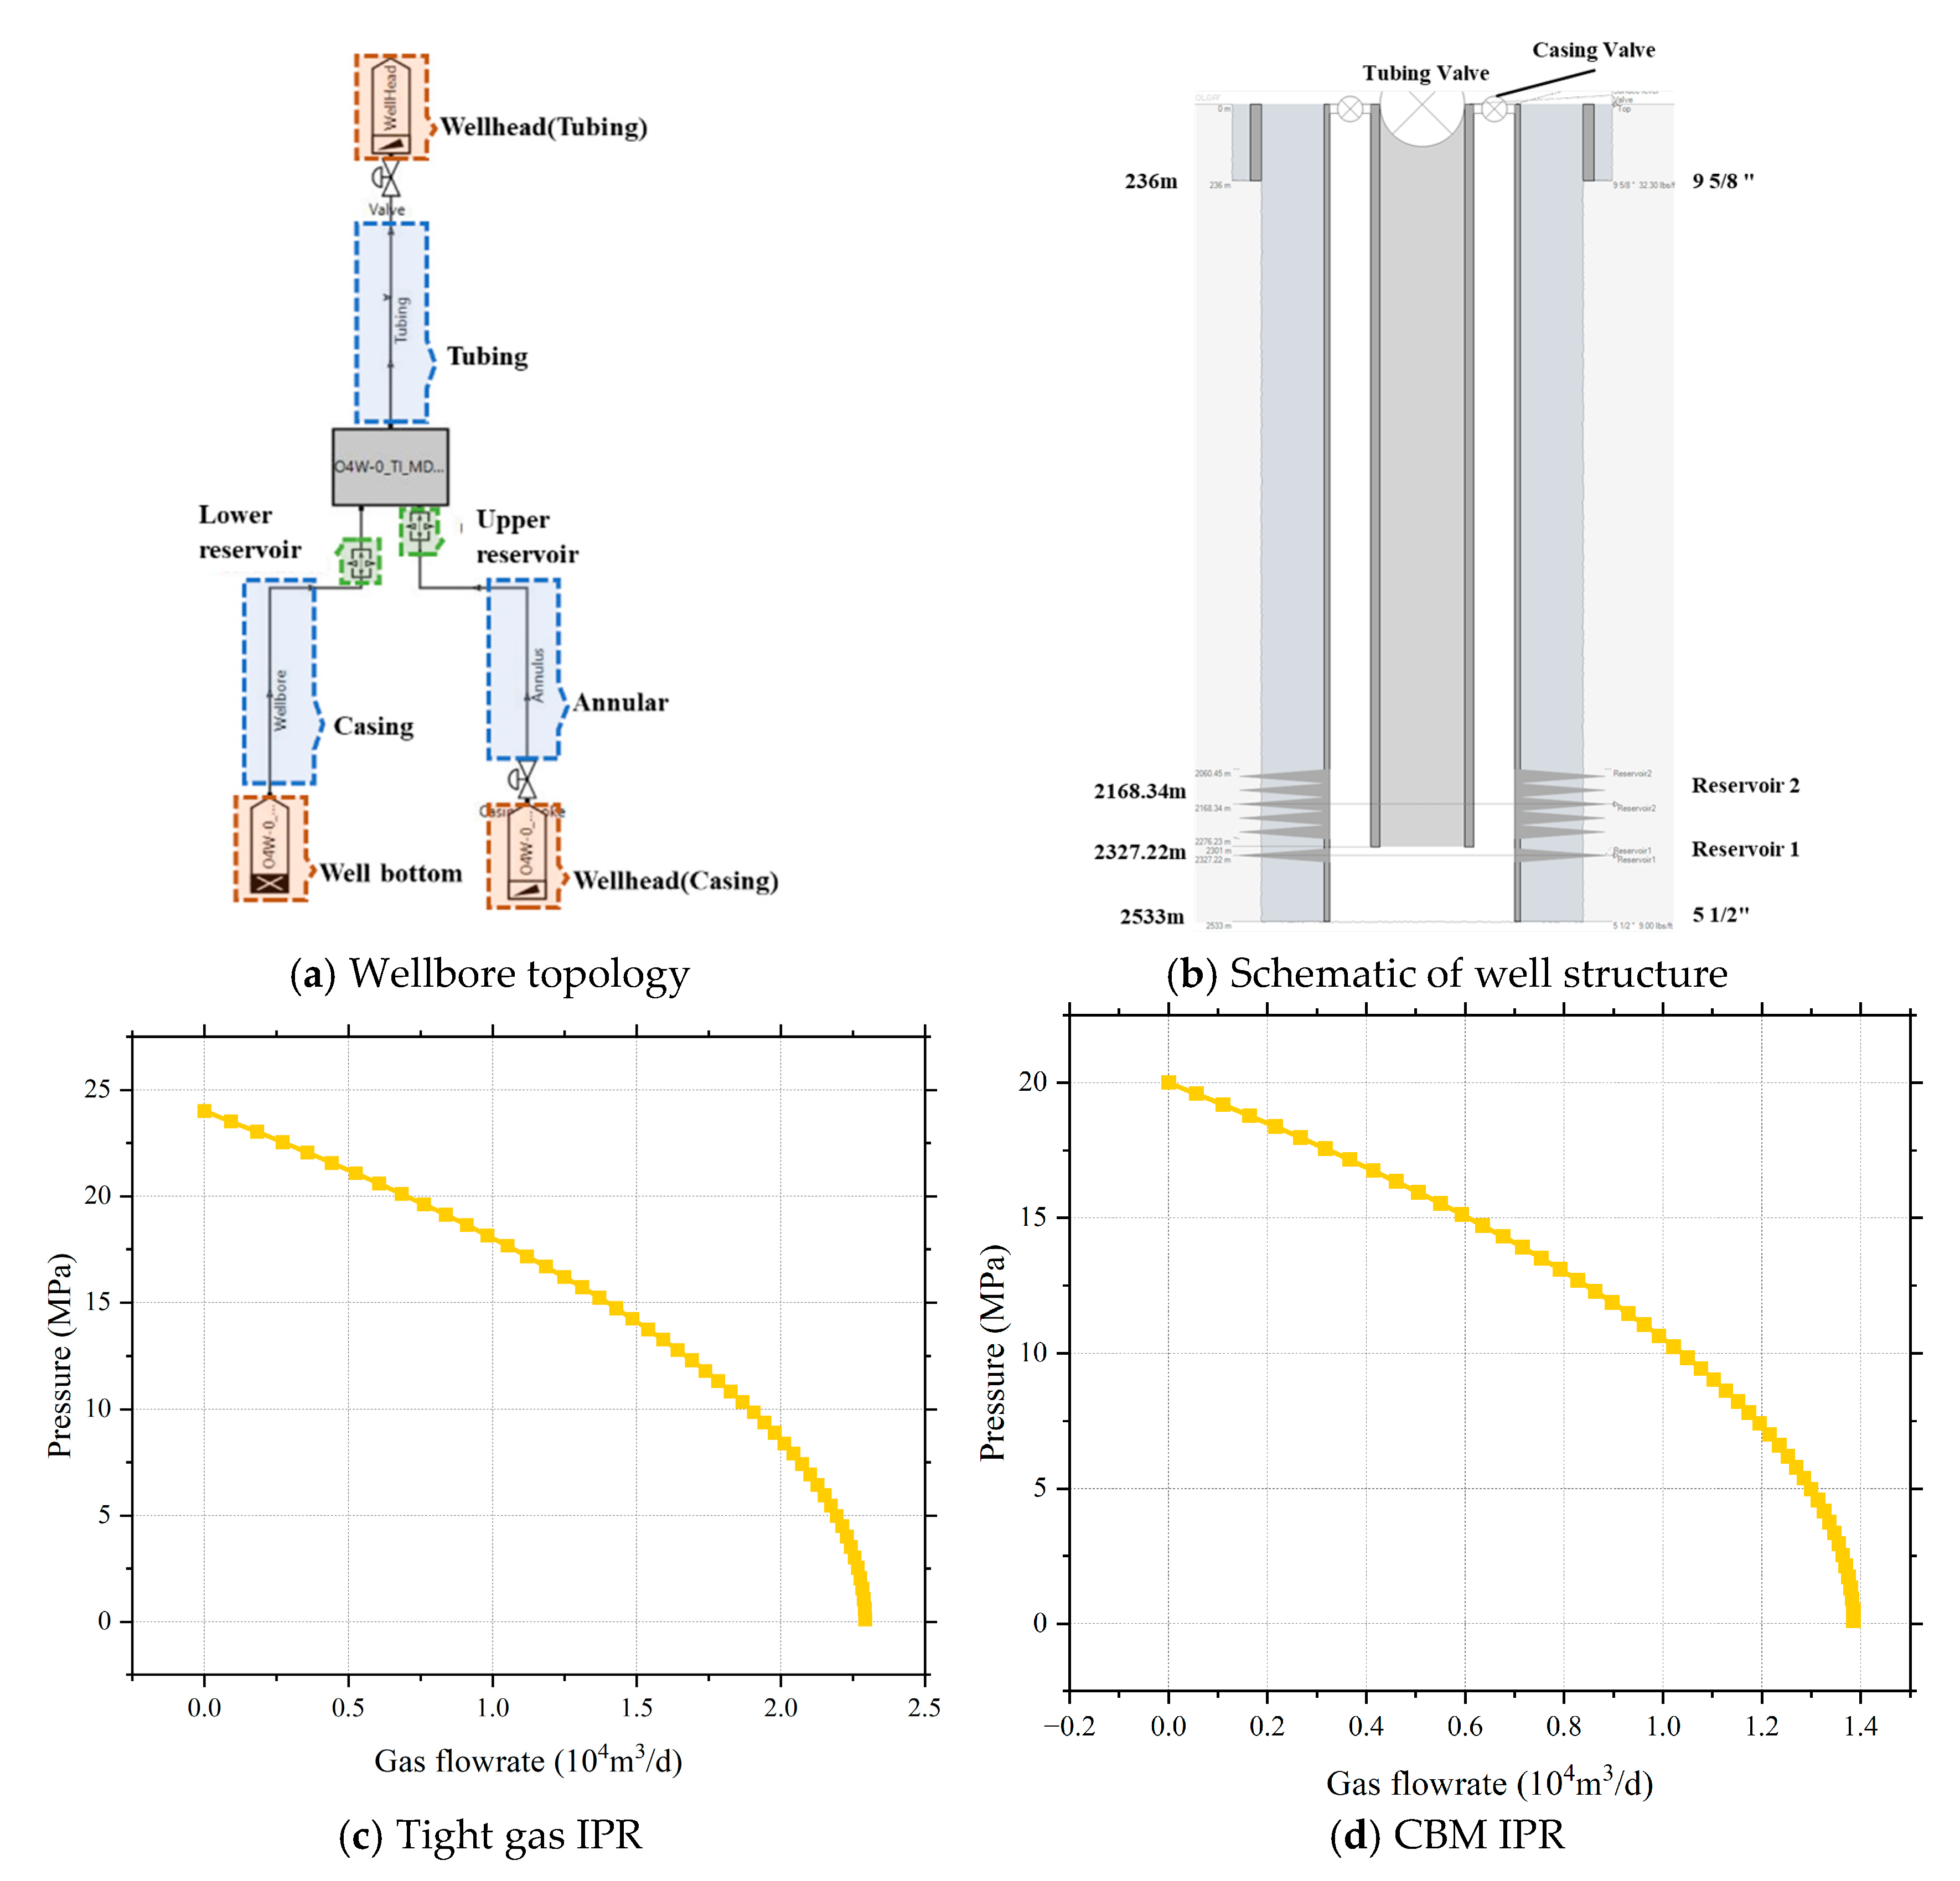
To accurately simulate the gas–liquid segregation behavior in dual-gas co-production wells under co-production conditions, the transient multiphase flow simulation software OLGA was employed. OLGA is well-suited for capturing the complex flow dynamics under unsteady-state conditions. A representative dual-gas co-production wellbore model was constructed, incorporating two typical vertical stacking configurations, “sand over coal” and “coal over sand,” as illustrated in Figure 2 and Table 1. The input parameters include the wellbore trajectory, wellbore architecture (inner diameter of 60 mm; casing depth of 2533 m, casing inner diameter of 139.7 mm), and reservoir inflow dynamics. The mid-depth of the lower coal seam reservoir is 2327.22 m, while that of the upper tight gas reservoir is 2168.34 m. The respective inflow performance relationships (IPRs) for the tight gas and coalbed methane are shown in Figure 2c,d. To evaluate the influence of the tubing setting depth on the gas–liquid flow behavior and phase segregation, three tubing configurations were simulated: tubing set above both reservoirs (depth: 2020 m), tubing set between the two reservoirs (depth: 2301 m), and tubing set near the bottom of both reservoirs (depth: 2330 m).
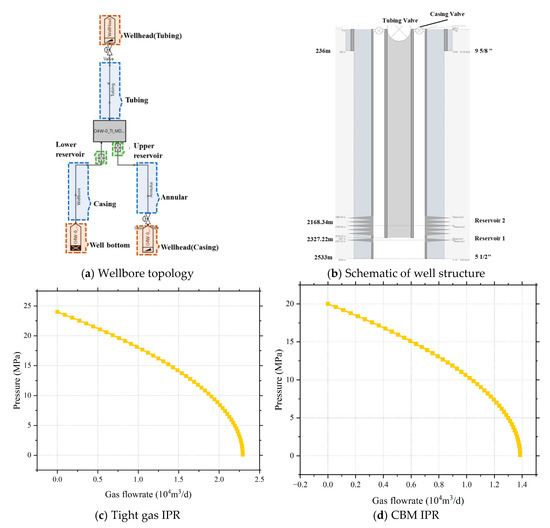
Figure 2.
The transient model configuration of the dual-gas co-production well.

Table 1.
Summary table of key simulation parameters.
3.2. Simulation Results and Analysis
3.2.1. Flow Path Characteristics and Phase Behavior
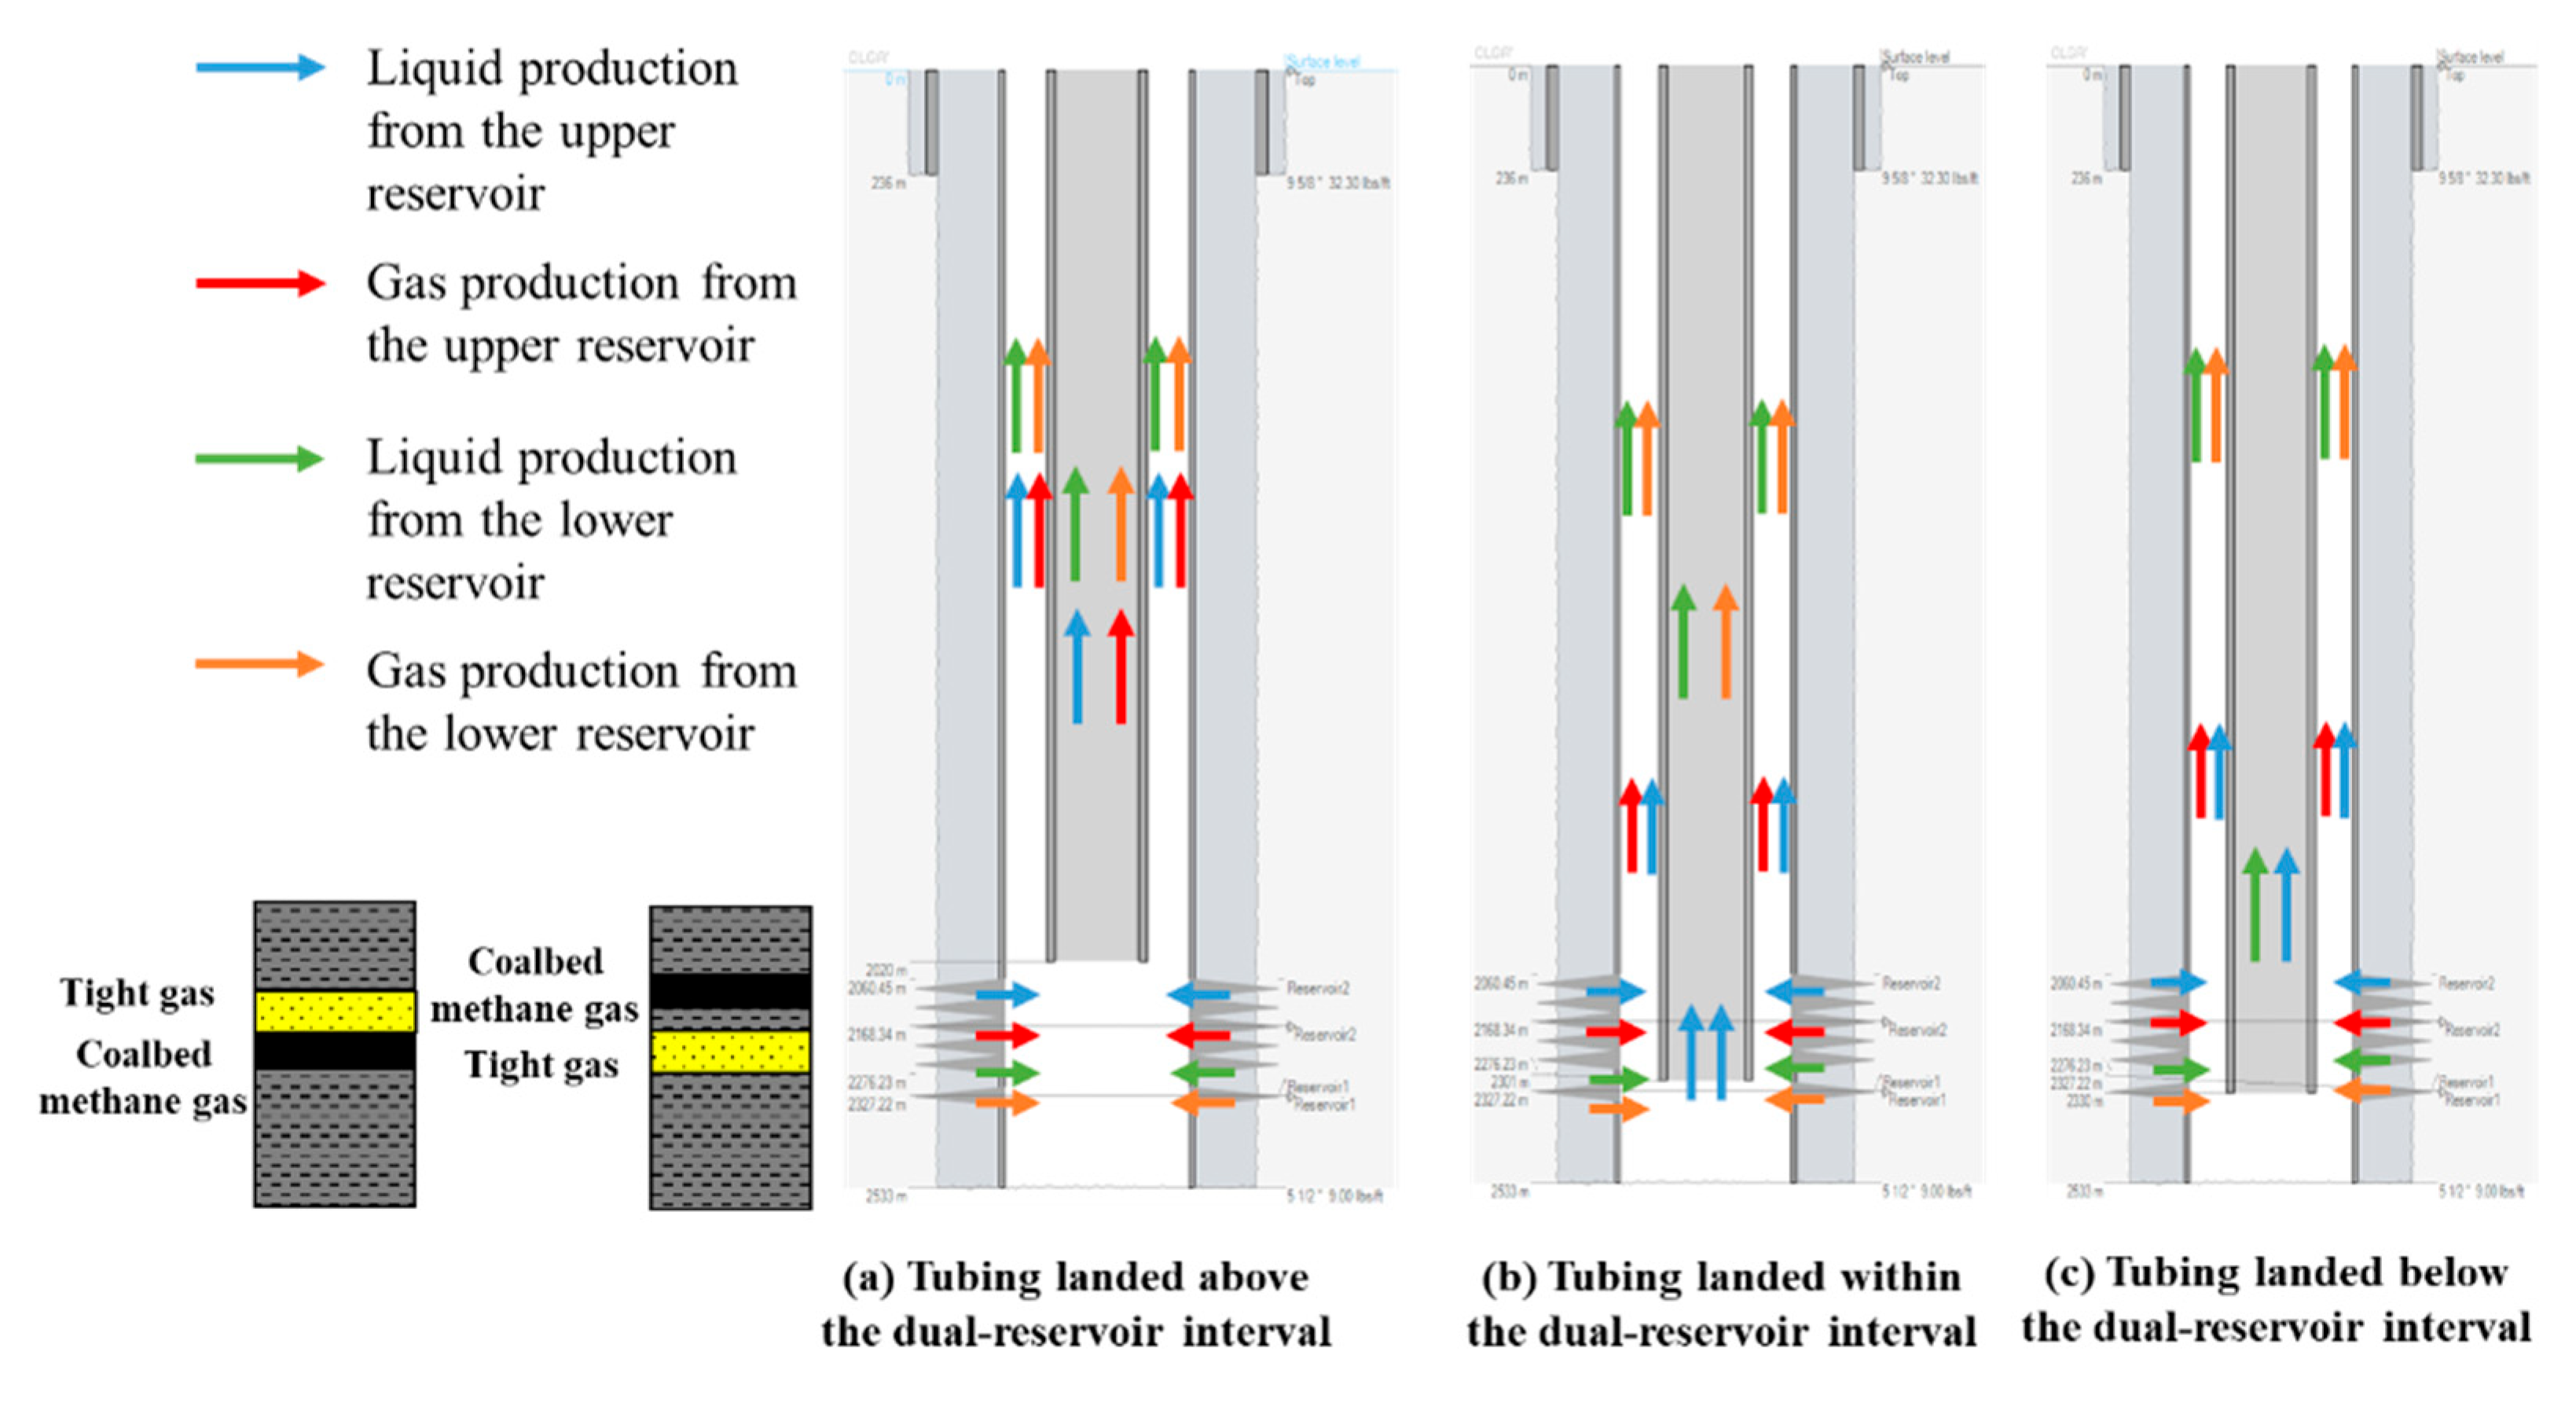
The distribution of the flow channels and multiphase flow behavior in the dual-gas co-production wellbore are depicted in Figure 3. The tubing setting depth significantly influences the flow paths of gas and liquid phases, their segregation modes, and the overall wellbore flow stability. These effects ultimately determine the liquid lifting efficiency and the degree of the synergistic production between the two reservoirs. When the tubing is set above the dual-reservoir interval—close to the upper tight gas reservoir—the gas and water produced from both the upper and lower reservoirs enter the annular space beneath the tubing. Under this configuration, a gas–liquid mixing zone initially forms in the mid-wellbore region, where fluids from both reservoirs converge and begin to interact. Before entering the main flow conduits (tubing and casing), the mixed fluids undergo gas–liquid separation. Due to the smaller diameter and higher flow resistance within the tubing, gas tends to rise through the lower-resistance casing annulus, while a portion of the liquid stratifies between the tubing and casing under a gravitational influence. Although both the gas and liquid can still be transported to the surface under this structure, the complex flow paths and intense phase disturbances can trigger slug flow, leading to unstable liquid unloading—especially pronounced when the lower CBM reservoir produces substantial water volumes.
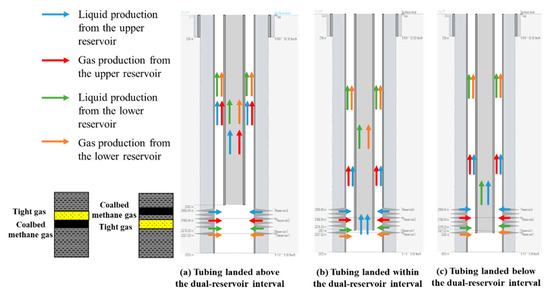
Figure 3.
Flow path distribution characteristics in dual-gas co-production well.
When the tubing is set between the two reservoirs, i.e., in the interface zone between the tight sandstone and coal seam, the flow behavior becomes more intricate. Gas from the upper tight gas reservoir primarily ascends through the casing annulus to the surface, while some accompanying liquids are carried upward by the gas phase. However, a portion of the liquid descends under gravity, creating a countercurrent regime between the upward gas flow and downward liquid flow. Meanwhile, the lower CBM reservoir produces gas–liquid mixtures that rise into the annular space and participate in gas–liquid redistribution at the tubing shoe. The gas phase, being more mobile, preferentially moves upward via the casing, while the liquid phase is driven by pressure differentials to ascend through the tubing. This redistribution mechanism—where fluids from both reservoirs mix before separation—induces intense interfacial disturbances and a localized liquid holdup near the tubing entry, increasing the system pressure drop and reducing the deliquification efficiency.
When the tubing is set at the bottom of the dual-reservoir interval—adjacent to the lower CBM reservoir—the flow path becomes clearer, and the phase separation is more efficient [26]. Under this configuration, the gas produced from both the upper tight gas and lower CBM reservoirs, due to its low density and strong mobility, preferentially rises through the casing annulus and exits at the surface [25]. The liquid phase is distributed based on its position and the acting forces: some liquid is carried upward by the gas in the annulus, while the rest flows downward under gravity, accumulates at the well bottom, and is then driven up through the tubing by the pressure differential [27]. This design effectively utilizes the combined casing–tubing flow paths for phase segregation, minimizing the bottomhole liquid residence time, significantly enhancing the liquid lifting efficiency, reducing the risk of liquid loading, and maintaining a low wellbore liquid holdup. Overall, it yields the most favorable production performance [28].
3.2.2. Simulation Results for the “Coal over Sand” Vertical Stacking Configuration
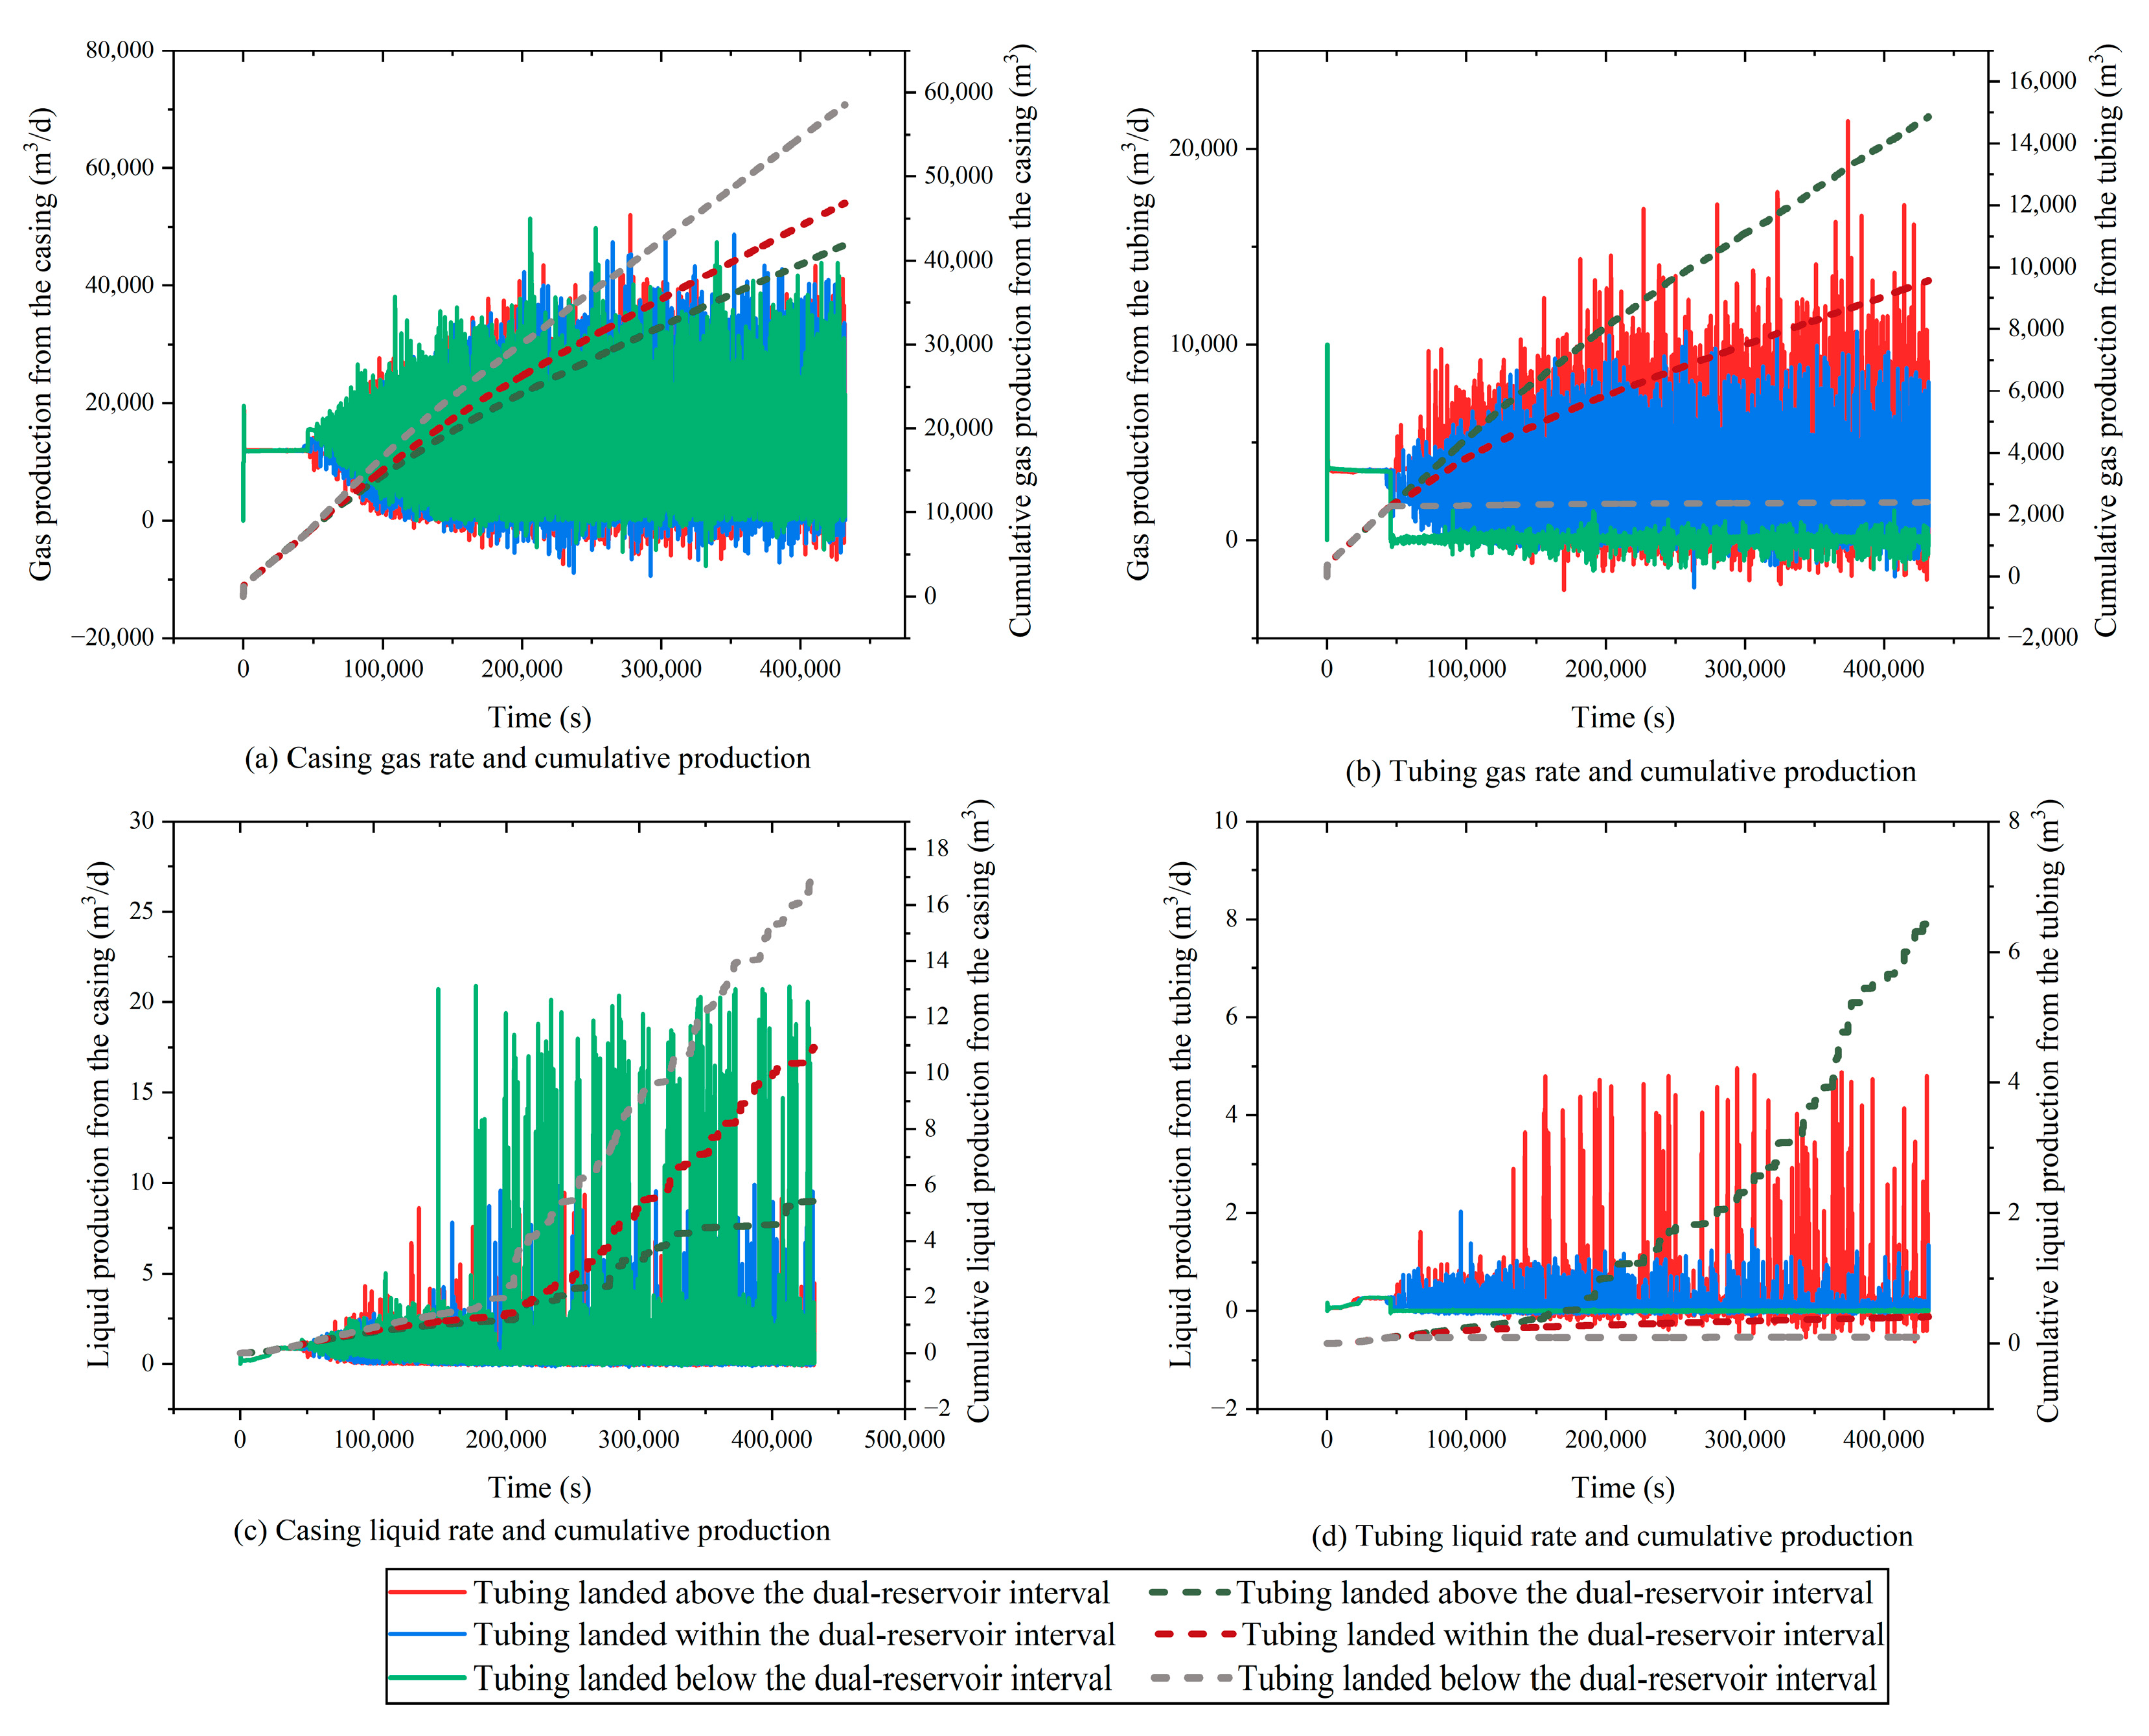
The simulation outputs under various tubing setting depths include gas and liquid production rates, as presented in Figure 4. These results reveal clear distinctions in the wellbore production behavior under the “coal over sand” reservoir stacking configuration. Overall, placing the tubing at the bottom of the dual-reservoir interval yields the most efficient liquid unloading, with the highest liquid production observed. In contrast, setting the tubing at the top enhances the gas production performance, achieving the maximum gas output. This divergence arises primarily from the intrinsic differences in fluid properties and flow characteristics between the two reservoir types, coupled with the tubing’s influence on the phase transport and segregation. Specifically, the lower tight sandstone reservoir predominantly produces gas with a low viscosity and high mobility, while the upper CBM reservoir contains more associated water and is highly dependent on effective liquid drainage due to its tendency for liquid accumulation.
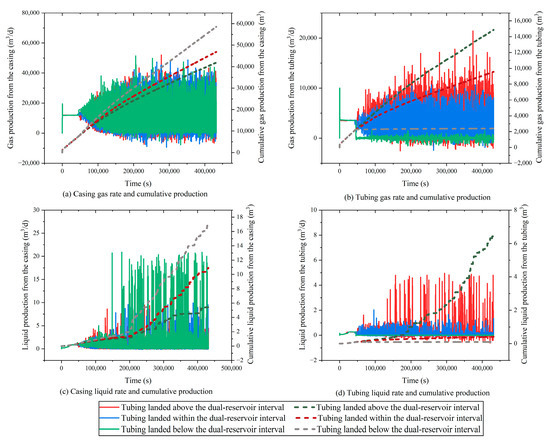
Figure 4.
Production performance under “coal over sand” stacking configuration.
When the tubing is positioned near the upper CBM reservoir, the associated water from the upper formation can be directly discharged through the tubing. Simultaneously, the gas from the lower tight gas reservoir can ascend via the tubing–casing annulus, enhancing the overall gas flow through the wellbore. This dual-path structure reduces the flow resistance and improves the gas–liquid carry efficiency, particularly during the early-stage low-water production. However, as the liquid volumes increase, the limited tubing diameter and long upward flow path may lead to local liquid accumulation, impairing stable unloading.
In contrast, positioning the tubing near the bottom tight sandstone reservoir significantly improves the deliquification efficiency. Under this configuration, liquids from both reservoirs naturally fall toward the tubing inlet due to gravity, minimizing countercurrent flow and facilitating efficient liquid convergence. The resulting higher liquid velocity in the narrow tubing promotes favorable flow regimes, such as slug or annular mist flow, mitigating bottomhole liquid loading and restoring dynamic pressure differentials. Moreover, the high-energy gas flow from the tight reservoir enhances the liquid lifting, indirectly supporting the water discharge from the upper CBM reservoir and establishing an inter-reservoir cooperative drainage mechanism.
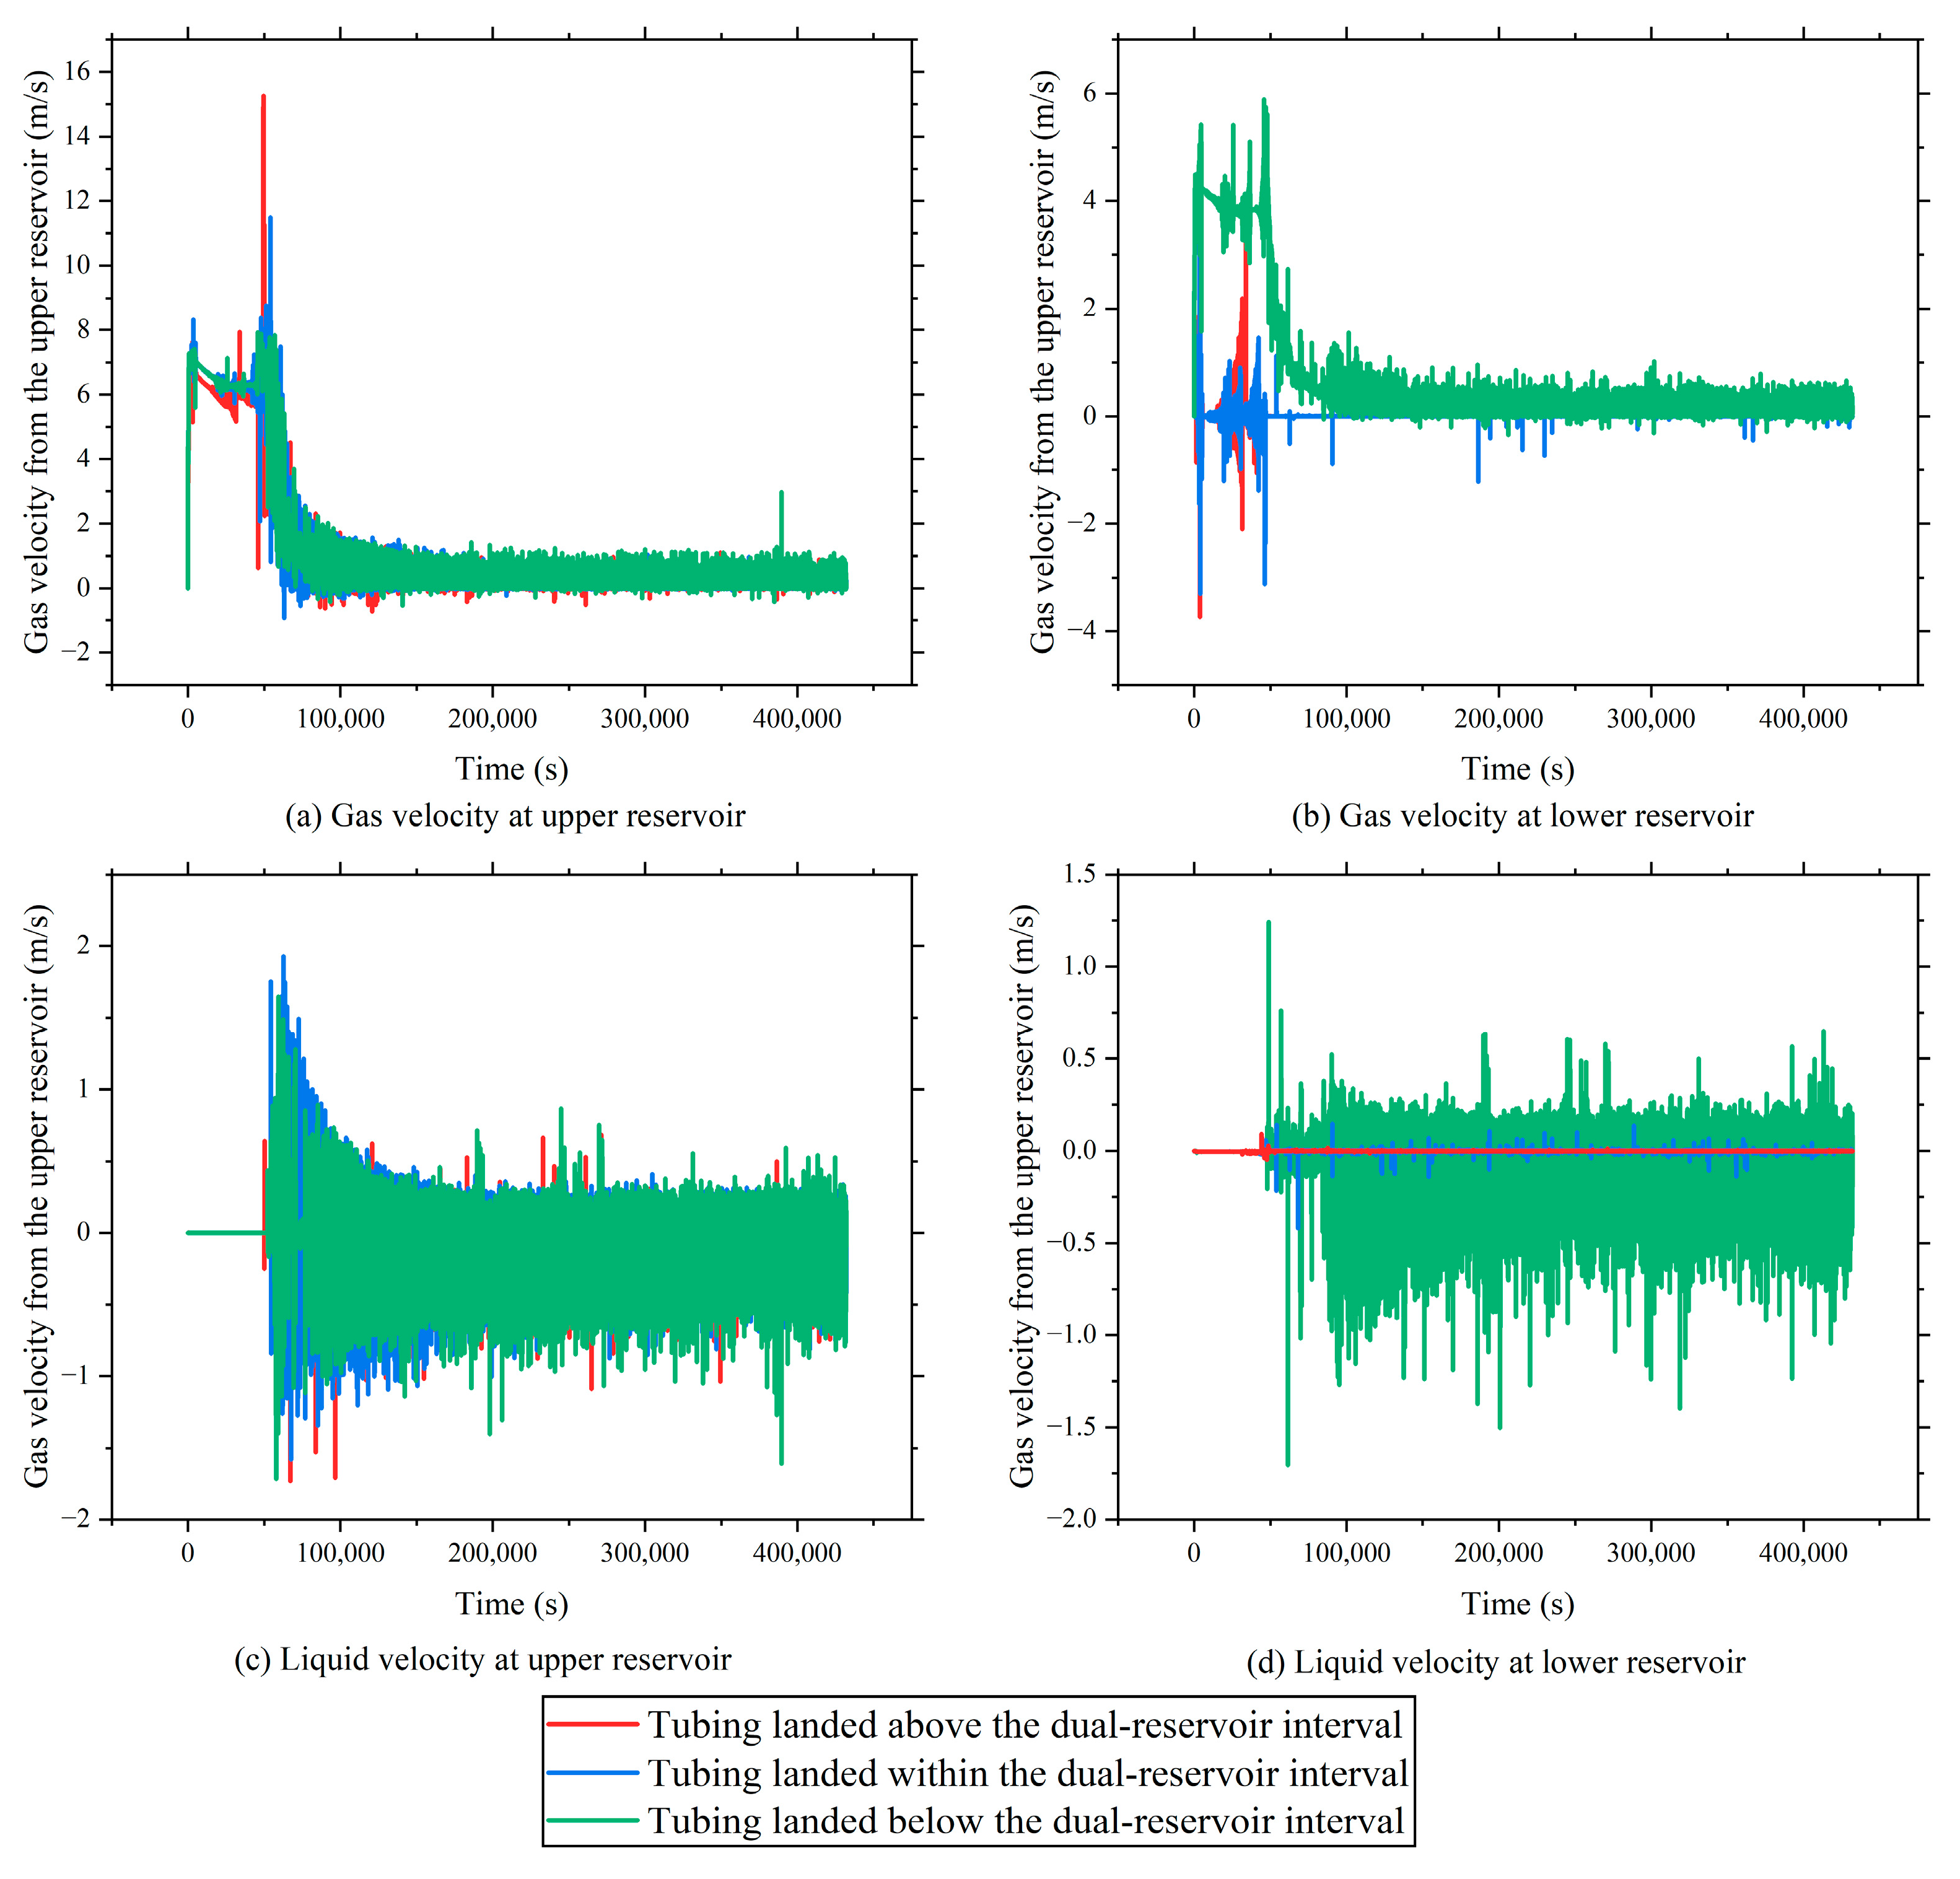
To further analyze the effect of the tubing depth on the low behavior within the dual-reservoir configuration, gas and liquid velocity monitoring points were set at the depths of both reservoirs. Figure 5 presents the local dynamic flow characteristics of the gas and liquid at each reservoir level under three representative tubing positions. The results elucidate how the tubing depth affects the phase distribution efficiency, deliquification capacity, and wellbore liquid holdup.
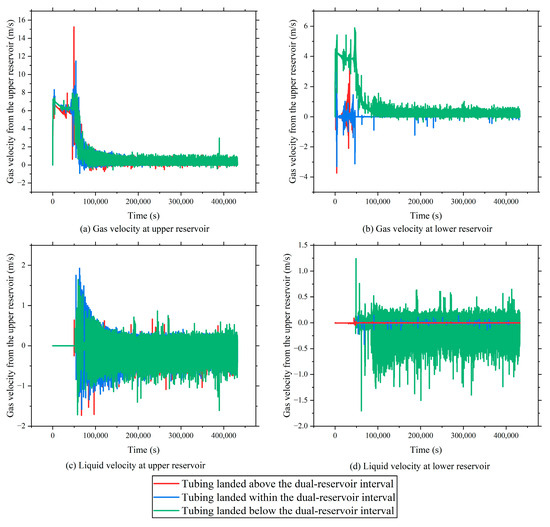
Figure 5.
Phase velocity profiles under “coal over sand” stacking configuration.
When the tubing is placed at the bottom of the dual-reservoir section, near the tight gas reservoir, both gas and liquid velocities at the upper CBM reservoir location reach their highest values. Here, gravity directs the liquid back to the tubing inlet, while the gas from the lower reservoir provides a strong lifting capacity, forming an efficient drainage path. Water produced from the upper coal seam enters the wellbore and is quickly lifted by the upward gas flow, preventing mid-wellbore accumulation and maintaining a low liquid holdup. Under this configuration, the surface liquid discharge is continuous, with no observed interruptions or liquid fallback, indicating superior production stability and an improved upper reservoir performance.
In contrast, when the tubing is set at the midpoint between the two reservoirs, i.e., at the interface zone, noticeable liquid accumulation occurs. Simulation results show that the gas and liquid converge in the mid-wellbore and interact turbulently. However, due to the limited pressure differential and restricted liquid pathways, the liquid removal is inefficient. Velocity monitoring points indicate a near-zero liquid velocity, confirming a liquid-loading condition. This hinders effective gas–liquid transport, reduces surface liquid production, and may ultimately trigger water flooding and backflow, risking well shut-in.
When the tubing is placed at the top of the dual-reservoir section, close to the CBM reservoir, the deliquification becomes less effective. Although the initial liquid removal via the tubing and casing may occur, sustained production is challenged by long upward flow paths for the gas from the lower reservoir. This structural limitation, combined with gravitational forces, makes the lower reservoir water more likely to accumulate. As liquid builds up in the mid- and lower wellbore, the rising liquid level can eventually cover reservoir inflow points, significantly increasing the backpressure and potentially causing reservoir backflow and production instability.
Overall, under the “coal over sand” stacking configuration, placing the tubing at the bottom of the dual-reservoir interval achieves the best deliquification and phase transport performance. This setup enhances the lower reservoir’s lifting capability, improves the water removal from the upper CBM reservoir, and minimizes wellbore liquid holdup, thereby maintaining stable and continuous gas production. The mid-depth tubing configuration offers a limited drainage capacity and system stability, while the top-set tubing performs worst, posing significant risks of liquid loading and reservoir backflow.
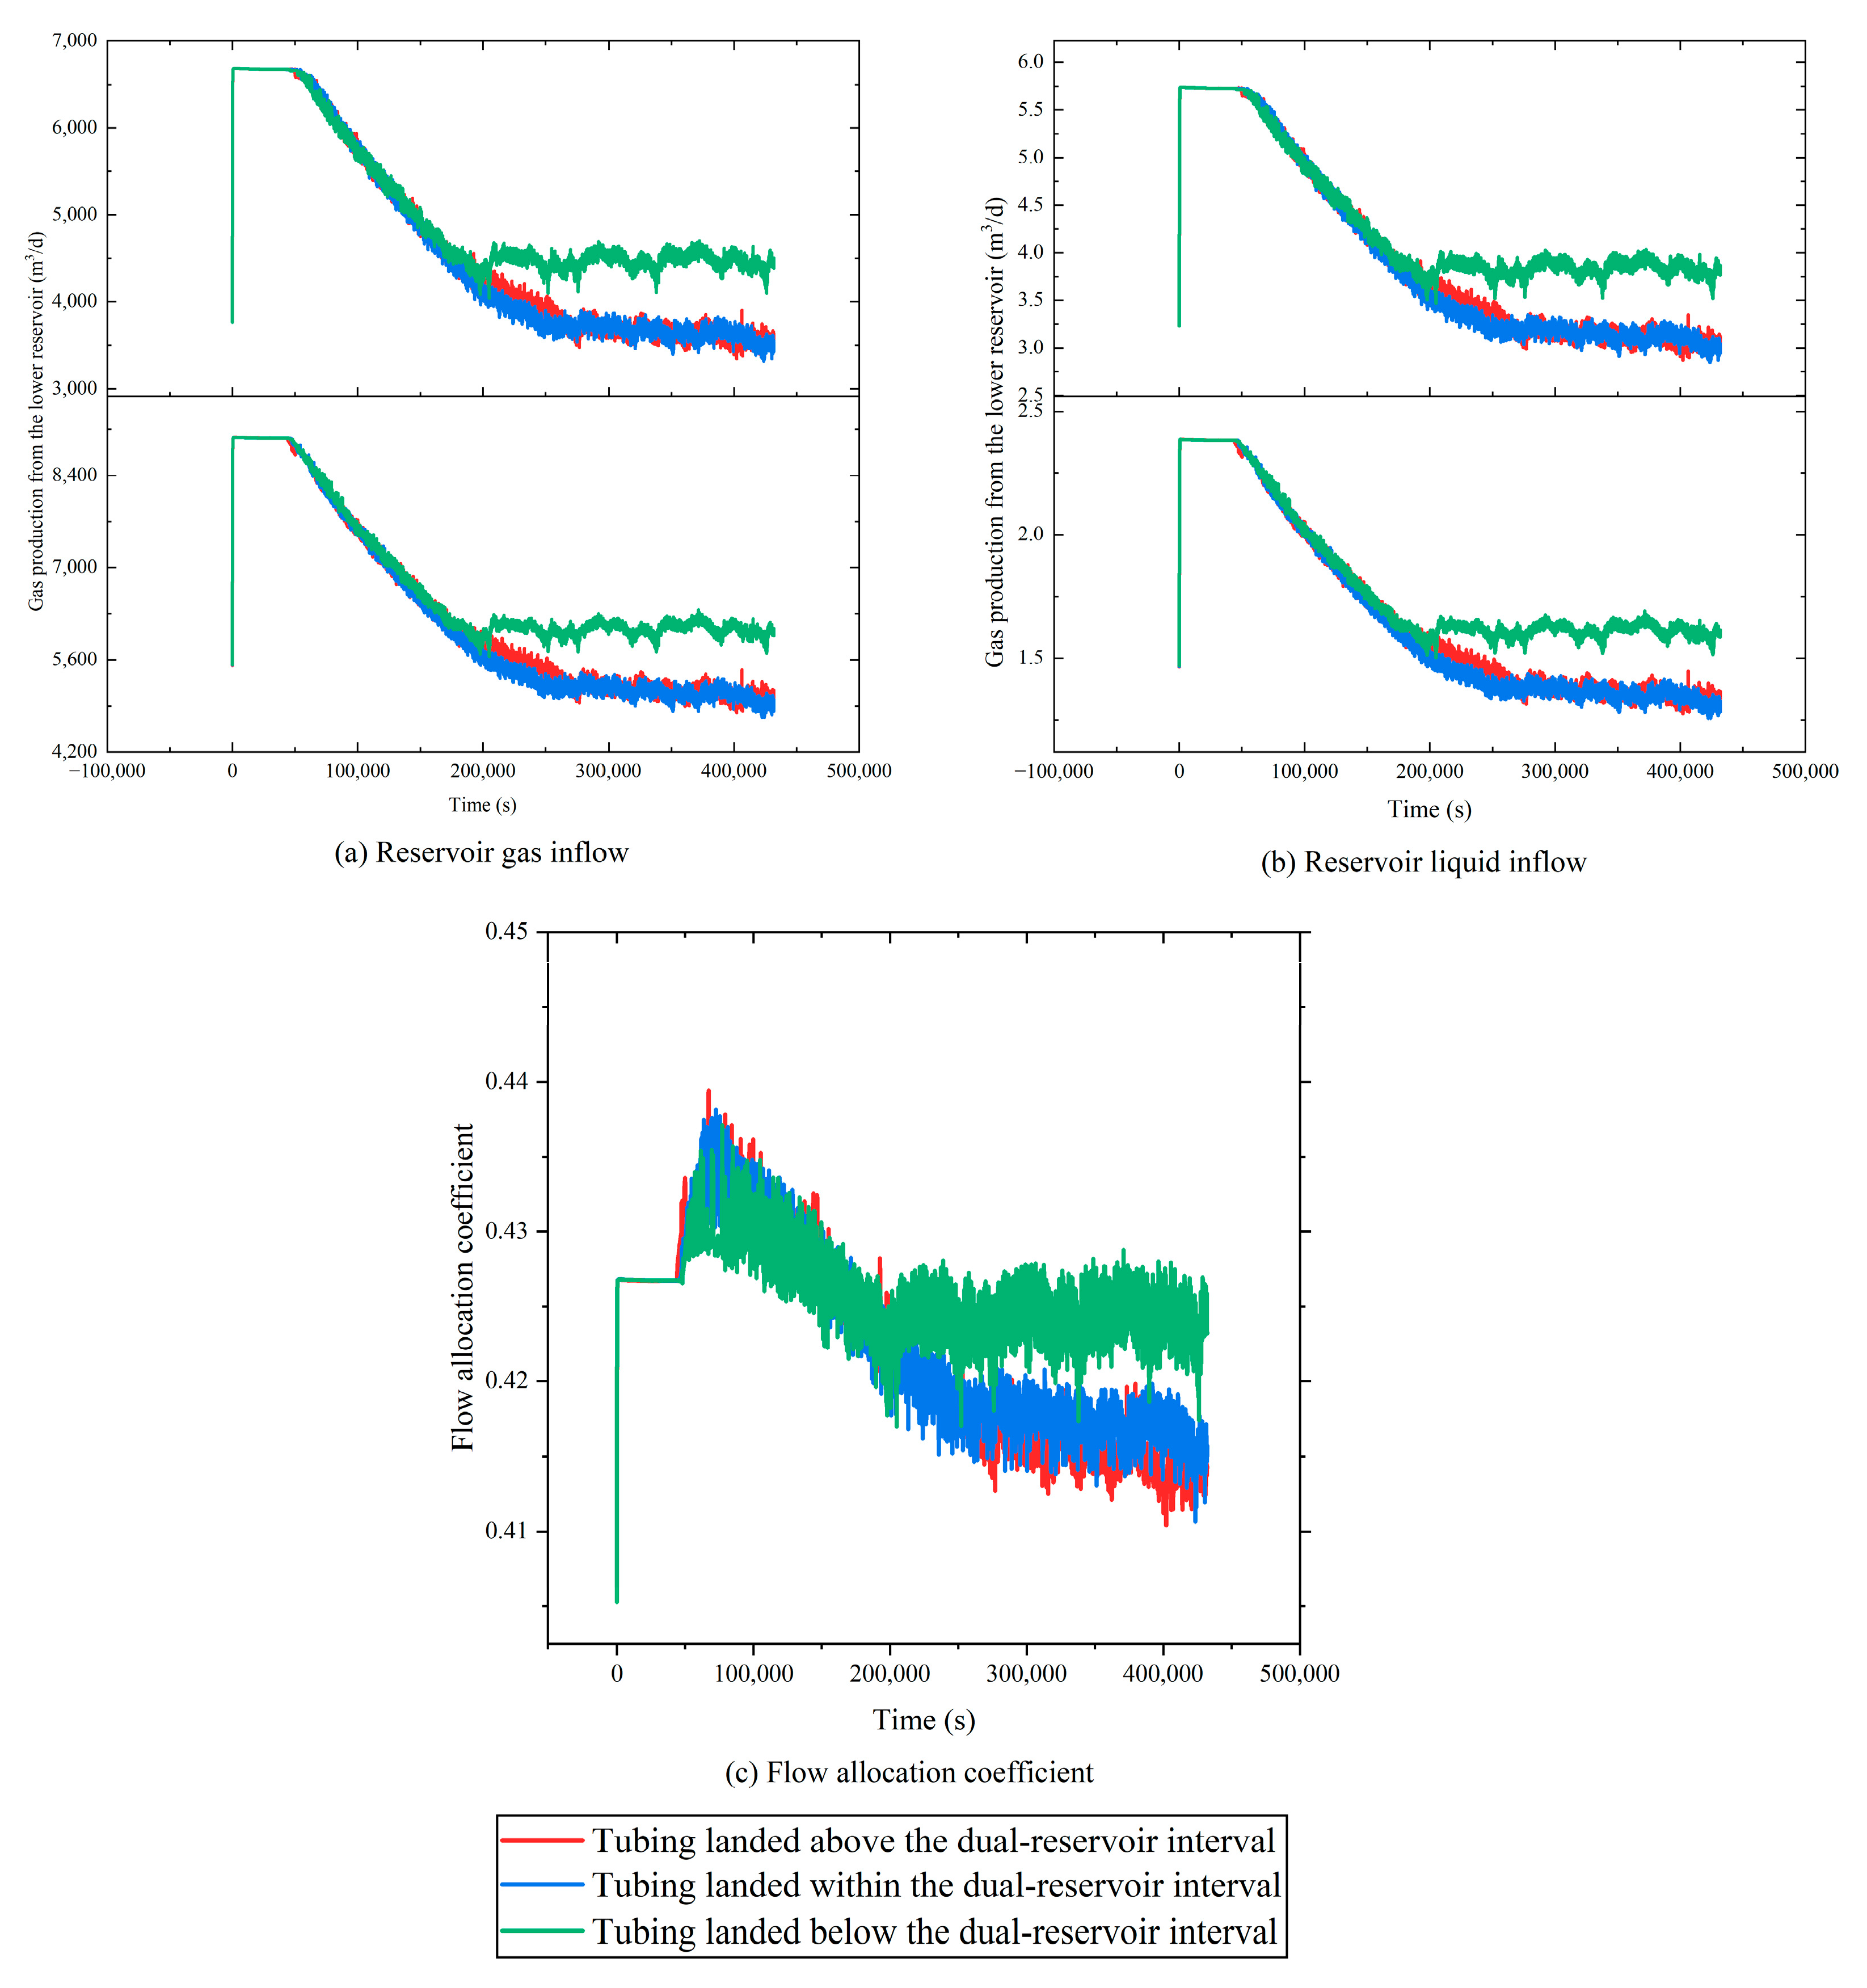
In the vertically stacked “coal over sand” reservoir configuration, the tubing depth has a significant impact on the inflow behavior of the gas and liquid from each reservoir and the respective contributions to overall productivity. Figure 6 illustrates the inflow rates (gas and liquid) and the evolution of the flow allocation coefficient under three representative tubing placement scenarios: the top, middle, and bottom of the dual-reservoir interval. According to the simulation results, during the initial production phase, the inflow rates from both the upper CBM reservoir and the lower tight sandstone reservoir exhibit a pronounced decline, regardless of the tubing depth. This is primarily attributed to unstable initial wellbore fluid dynamics, the transient pressure redistribution, and the natural depletion of the formation pressure, leading to a rapid decrease in reservoir deliverability. As the production continues, the system gradually stabilizes, and the pressure regime approaches equilibrium, resulting in more moderate changes in gas and liquid production. At this stage, the configuration with the tubing placed at the bottom demonstrates the highest reservoir inflow rates from both reservoirs, indicating an improved energy utilization and enhanced overall development efficiency.
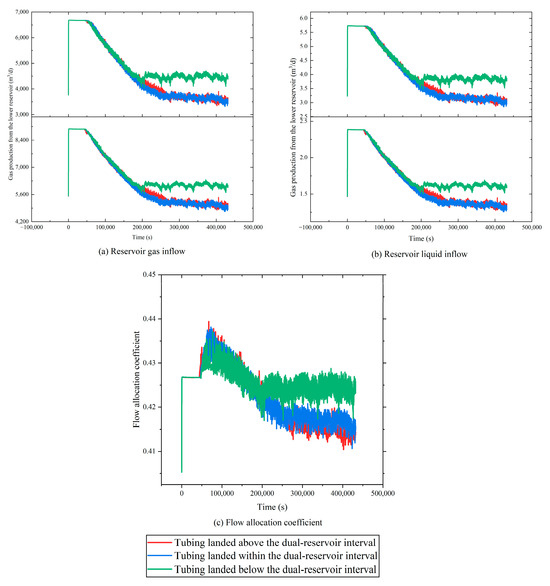
Figure 6.
Reservoir inflow and flow partitioning under “coal over sand” stacking.
Focusing on the upper CBM reservoir, the evolution of the flow allocation coefficient (i.e., the ratio of CBM inflow to total inflow) reveals that the two reservoirs contribute nearly equally during early production, with a slight advantage observed for the tight sandstone. However, as production advances, the allocation coefficient for the CBM reservoir steadily decreases, indicating a reduced contribution to total deliverability. This trend highlights the increasing restriction of the CBM productivity due to the rising bottomhole pressure, which is particularly detrimental to pressure-sensitive reservoirs like CBM. As a result, the inflow rate of CBM declines more sharply than that of the tight sandstone, diminishing inter-reservoir synergy.
The comparative analysis across scenarios reveals that, under identical reservoir properties and IPR constraints, the bottom tubing configuration consistently yields the highest flow allocation coefficient, demonstrating a superior phase distribution and coordinated productivity. The underlying mechanism lies in the enhanced ability of this configuration to effectively remove bottomhole liquids, thereby suppressing liquid loading, maintaining a favorable pressure differential, and facilitating sustained gas and liquid inflow. Consequently, the tight sandstone continues to provide a stable gas supply, while the CBM benefits from reduced backpressure and improved water removal, maintaining a more synchronized production regime between the two reservoirs.
3.2.3. Simulation Results for the “Sand over Coal” Configuration
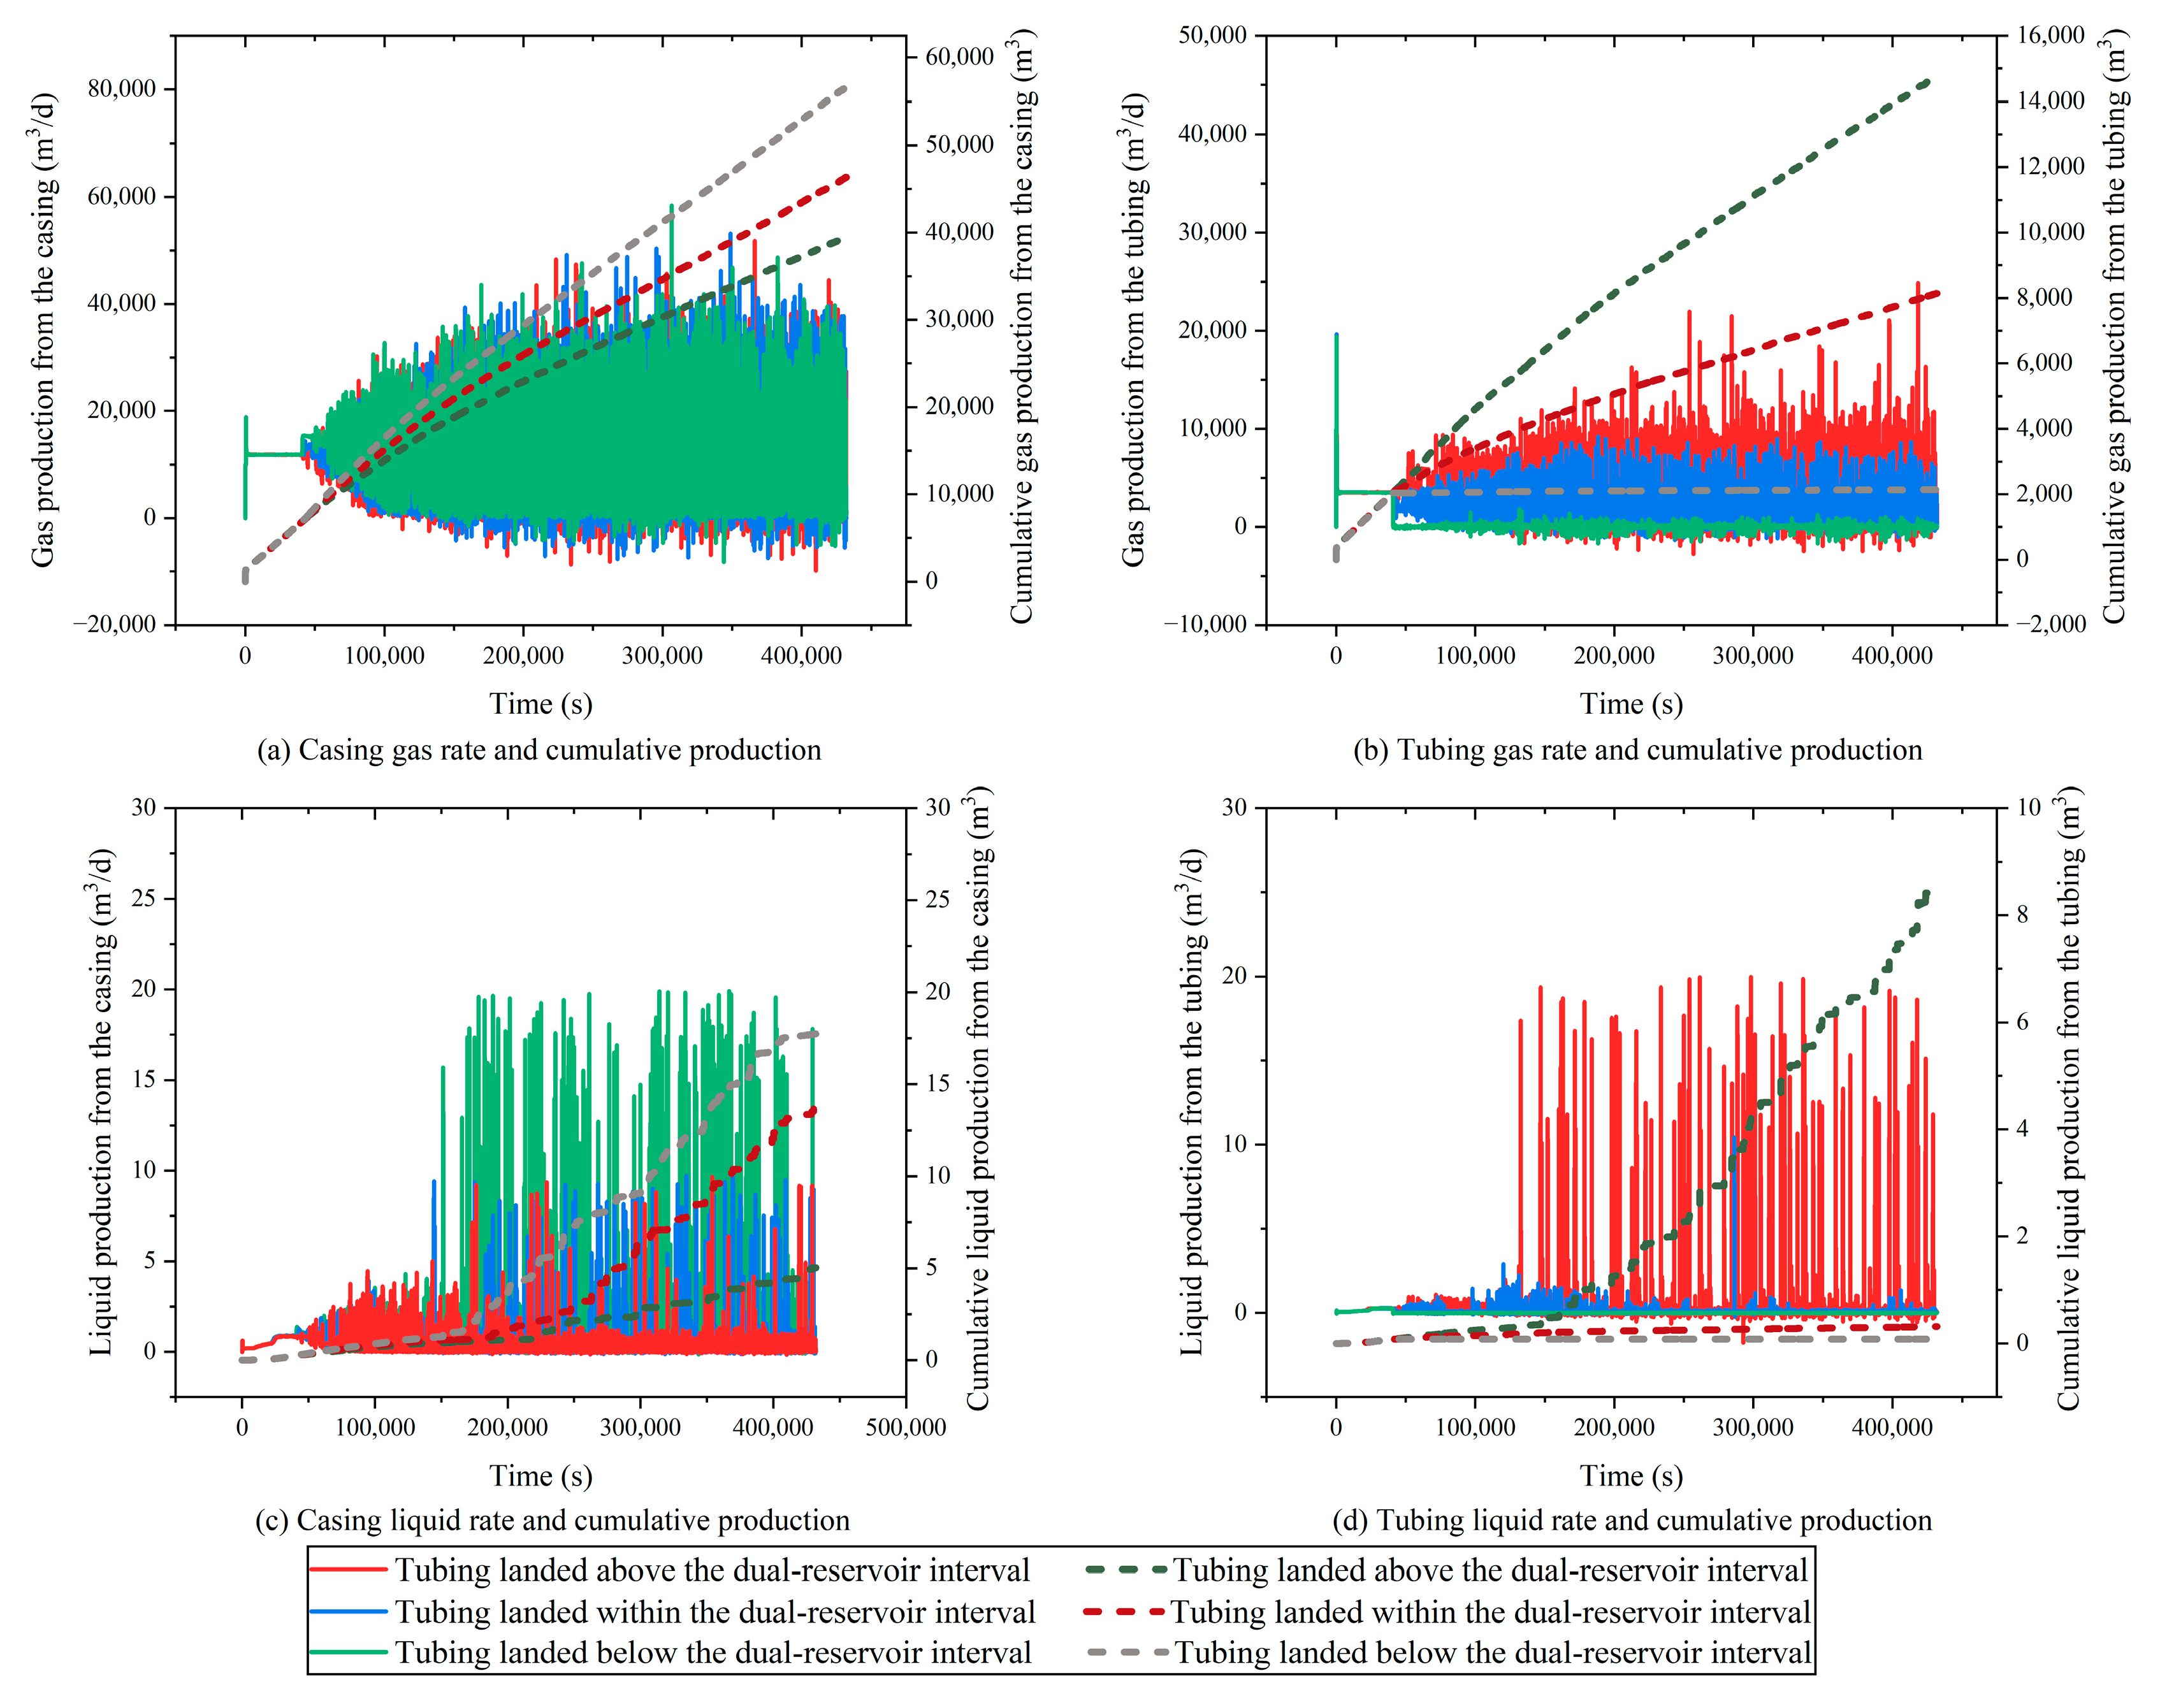
For the “sand over coal” stacking scenario, production simulations were conducted for different tubing placement depths to evaluate the gas and liquid output profiles. The simulation results are shown in Figure 7, which presents wellhead production responses under three representative tubing positions: the lower, middle, and upper sections of the dual-reservoir system. These include phase split characteristics between the tubing and casing flow paths. The results indicate that the tubing depth significantly affects the flow paths for reservoir fluids. Similarly to the “coal over sand” configuration, when the tubing is placed near the lower coal seam, the casing becomes the primary flow conduit for gas–liquid mixtures, exhibiting a higher overall production efficiency. Conversely, when the tubing is placed near the upper sandstone layer, the smaller diameter and flow resistance at the tubing shoe promote fluid discharge through the tubing, making it the dominant production path. Notably, when the tubing is set at the interface between the two reservoirs, the phase interaction and local pressure reduction lead to an unstable flow division and reduced overall production efficiency. Among the three configurations, the tubing placed near the bottom of the dual-reservoir interval yields the best productivity, followed by the upper tubing configuration, while the middle tubing scenario performs the worst. Physically, the lower tubing setup allows the gas and liquid from both reservoirs to flow into the casing annulus and be discharged through the casing, thereby avoiding the increased flow resistance within the tubing and enhancing the liquid unloading efficiency. Critically, this configuration enables the effective removal of bottomhole accumulated liquids, restoring the pressure drawdown and supporting sustained reservoir energy delivery.
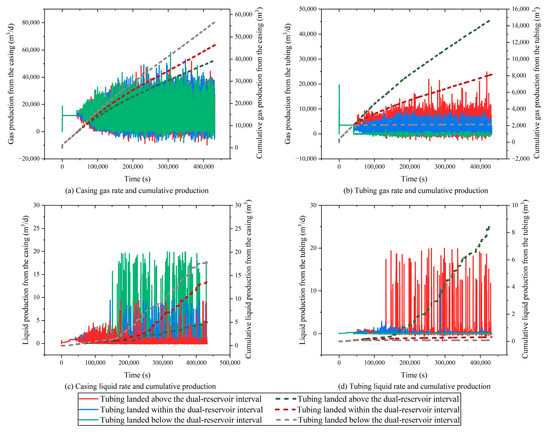
Figure 7.
Gas and liquid production profiles for the tubing and casing under the “sand over coal” configuration.
To further elucidate the impact of the tubing depth on the dynamic production behavior of the “sand over coal” configuration, gas and liquid velocity monitoring points were established at both reservoir depths. Simulation results, shown in Figure 8, characterize the transient evolution of the two-phase flow and the associated drainage efficiency under different tubing placements. When the tubing is positioned near the top of the interval (i.e., close to the upper sandstone layer), the flow is predominantly in the slug flow regime, but high liquid holdup, infrequent slug events, and prolonged liquid residence times are observed. Although some deliquification is achieved, the higher pressure head and limited tubing diameter hinder the efficient upward transport of fluids from the lower reservoir, leading to increased fluid accumulation. By contrast, the tubing placed at the bottom enhances both gas velocities and significantly boosts liquid velocities in the upper reservoir. Under this condition, the gas–liquid mixture mobility is maximized, slug flow events are more frequent and regular, and the liquid holdup reaches a minimum, indicating optimal deliquification. This setup minimizes bottomhole fluid accumulation and facilitates the full recovery of the pressure drawdown, promoting continuous inter-reservoir production.
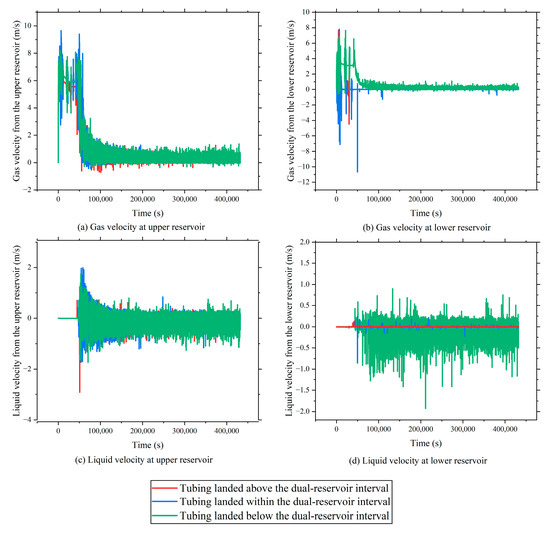
Figure 8.
Gas and liquid velocity profiles at each reservoir under the “sand over coal” configuration.
The detailed analysis of the lower reservoir liquid velocities under different tubing depths reveals oscillatory behavior when the tubing is placed at the bottom. This indicates an initial downward movement due to gravity, followed by successful upward transport driven by the gas lift, signifying efficient cyclic drainage. In contrast, when the tubing is placed at the reservoir interface (middle depth), liquid velocities approach zero at both observation points, indicative of stagnant conditions and severe liquid loading. The tubing liquid level remains constant or even rises, signaling long-term fluid retention and a potential shutdown due to accumulation. The casing flow exhibits weak oscillations, insufficient to overcome the pressure differential, resulting in intermittent and minimal surface liquid discharge. Under this configuration, the liquid holdup is at its highest, and both the casing and tubing function inefficiently.
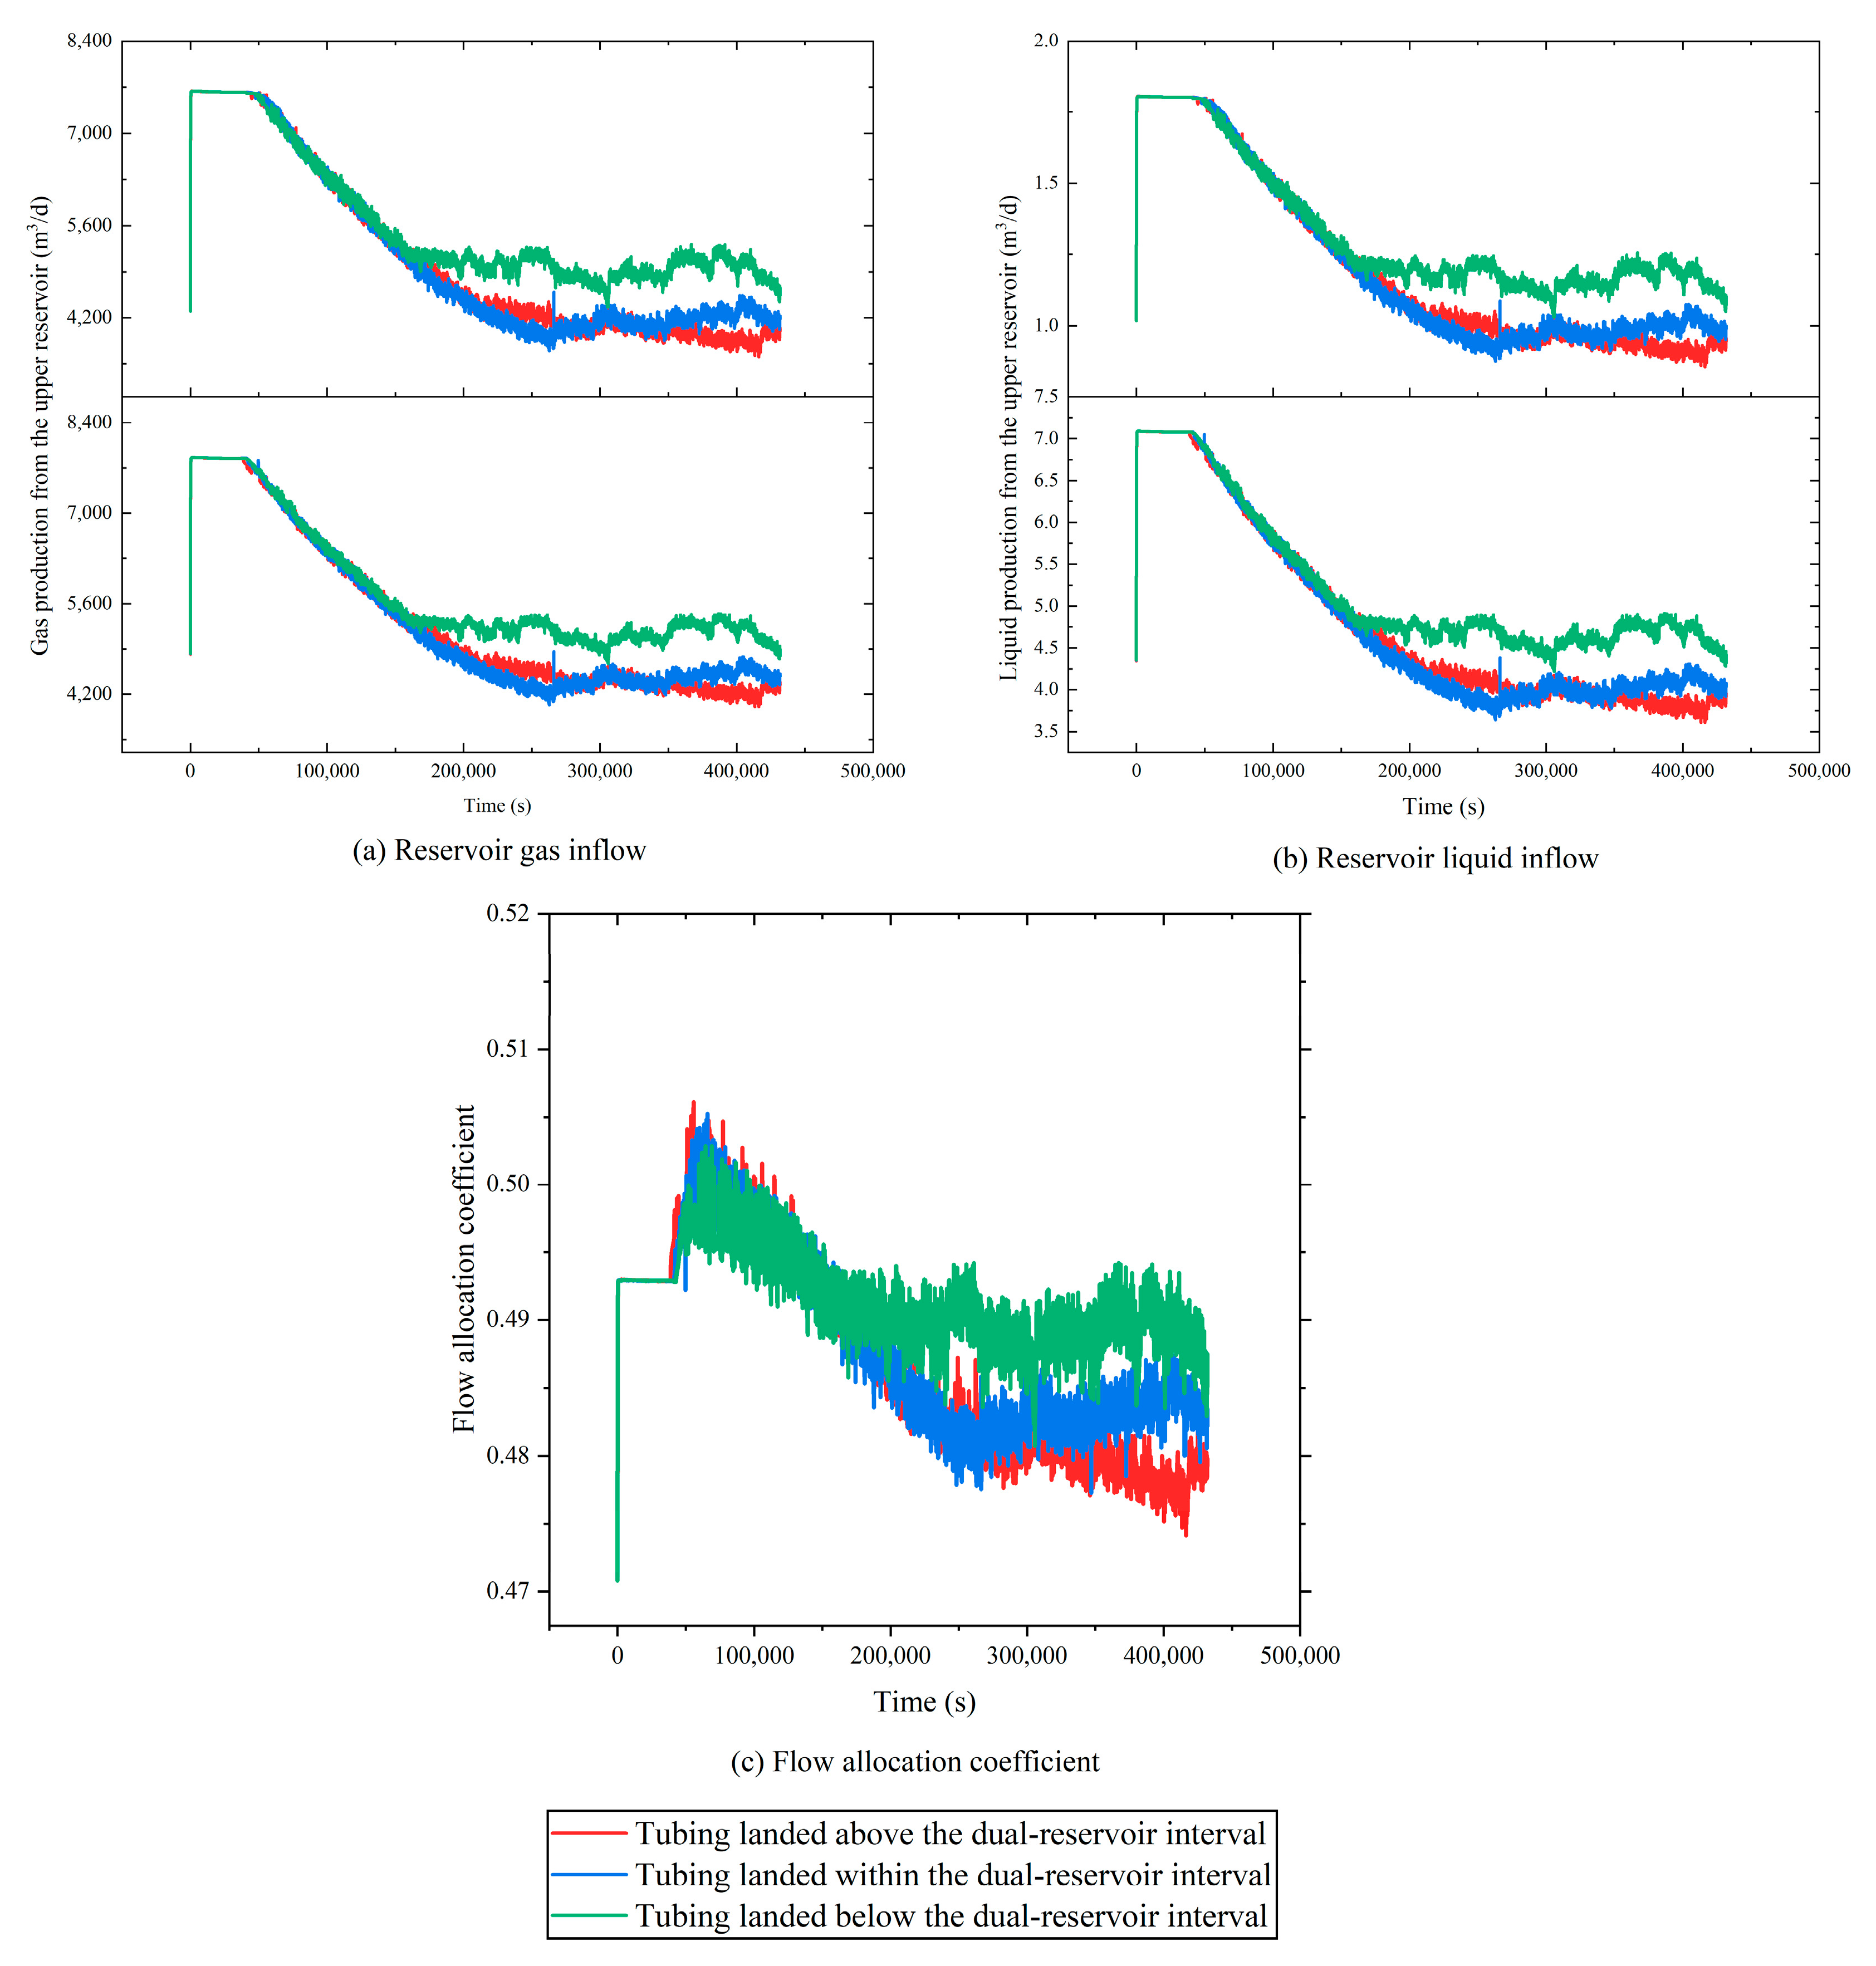
Under the “sand over coal” vertical stacking configuration, the tubing depth strongly influences the gas and liquid inflow behavior. Figure 9 presents the corresponding reservoir inflow rates and flow allocation coefficients under different tubing depths. Comparison with the “coal over sand” scenario shows similar trends in flow dynamics and allocation behavior. During the early production phase, all three scenarios experience declining inflow rates from both reservoirs, reflecting a gradual reduction in system deliverability. In the stabilized production stage, the tubing placed at the bottom outperforms the other configurations in terms of the both gas and liquid inflow, reflecting higher drainage efficiency and energy utilization. Analyzing the flow allocation coefficient for the upper CBM reservoir under each scenario, the results indicate relatively balanced contributions from both reservoirs in the early stage, with a minimal pressure differential and a strong co-production potential. As the production progresses into the mid-to-late stages, the energy depletion and evolving pressure systems shift the contribution balance slightly toward the lower coal seam. Although the flow allocation coefficient decreases, the contribution disparity remains moderate, maintaining a dynamic production equilibrium.
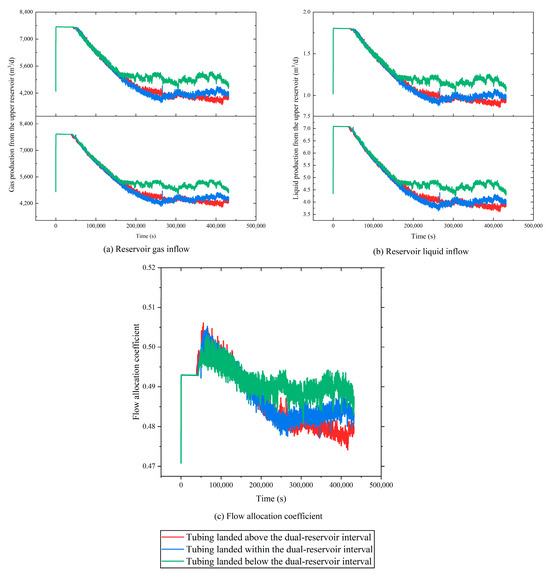
Figure 9.
Gas and liquid inflow rates and the flow allocation coefficient under the “sand over coal” stacking configuration.
Among the three tubing depths, the bottom tubing configuration delivers the best performance in terms of the reservoir inflow and allocation balance. Specifically, it enhances the driving force for the fluid inflow from both reservoirs under equivalent IPR conditions. Mechanistically, the configuration leverages the annular casing as the primary flow path, facilitating efficient liquid removal from the lower reservoir and minimizing bottomhole fluid accumulation. Simultaneously, it enables the rapid restoration and maintenance of a high bottomhole pressure differential, driving a continuous two-phase inflow and establishing a balanced and stable co-production regime.
3.2.4. Summary of Tubing Placement Effects
Table 2 summarizes the effects of different tubing placements on key production indicators under dual-reservoir co-production conditions. As the tubing depth increases, the gas–liquid distribution between the upper and lower reservoirs undergoes significant changes. Deeper tubing placements tend to enhance the liquid-carrying capacity of the lower reservoir by increasing the local pressure drop and improving the gas holdup near the intake, which helps delay liquid loading. However, an excessive tubing depth may reduce the contribution from the upper tight sandstone layer due to increased backpressure. These results highlight the importance of optimizing the tubing placement to balance the gas–liquid allocation and maximize the total production efficiency in layered co-production wells.
Table 2.
Effects of different tubing placements on key production indicators.
3.3. Model Validation
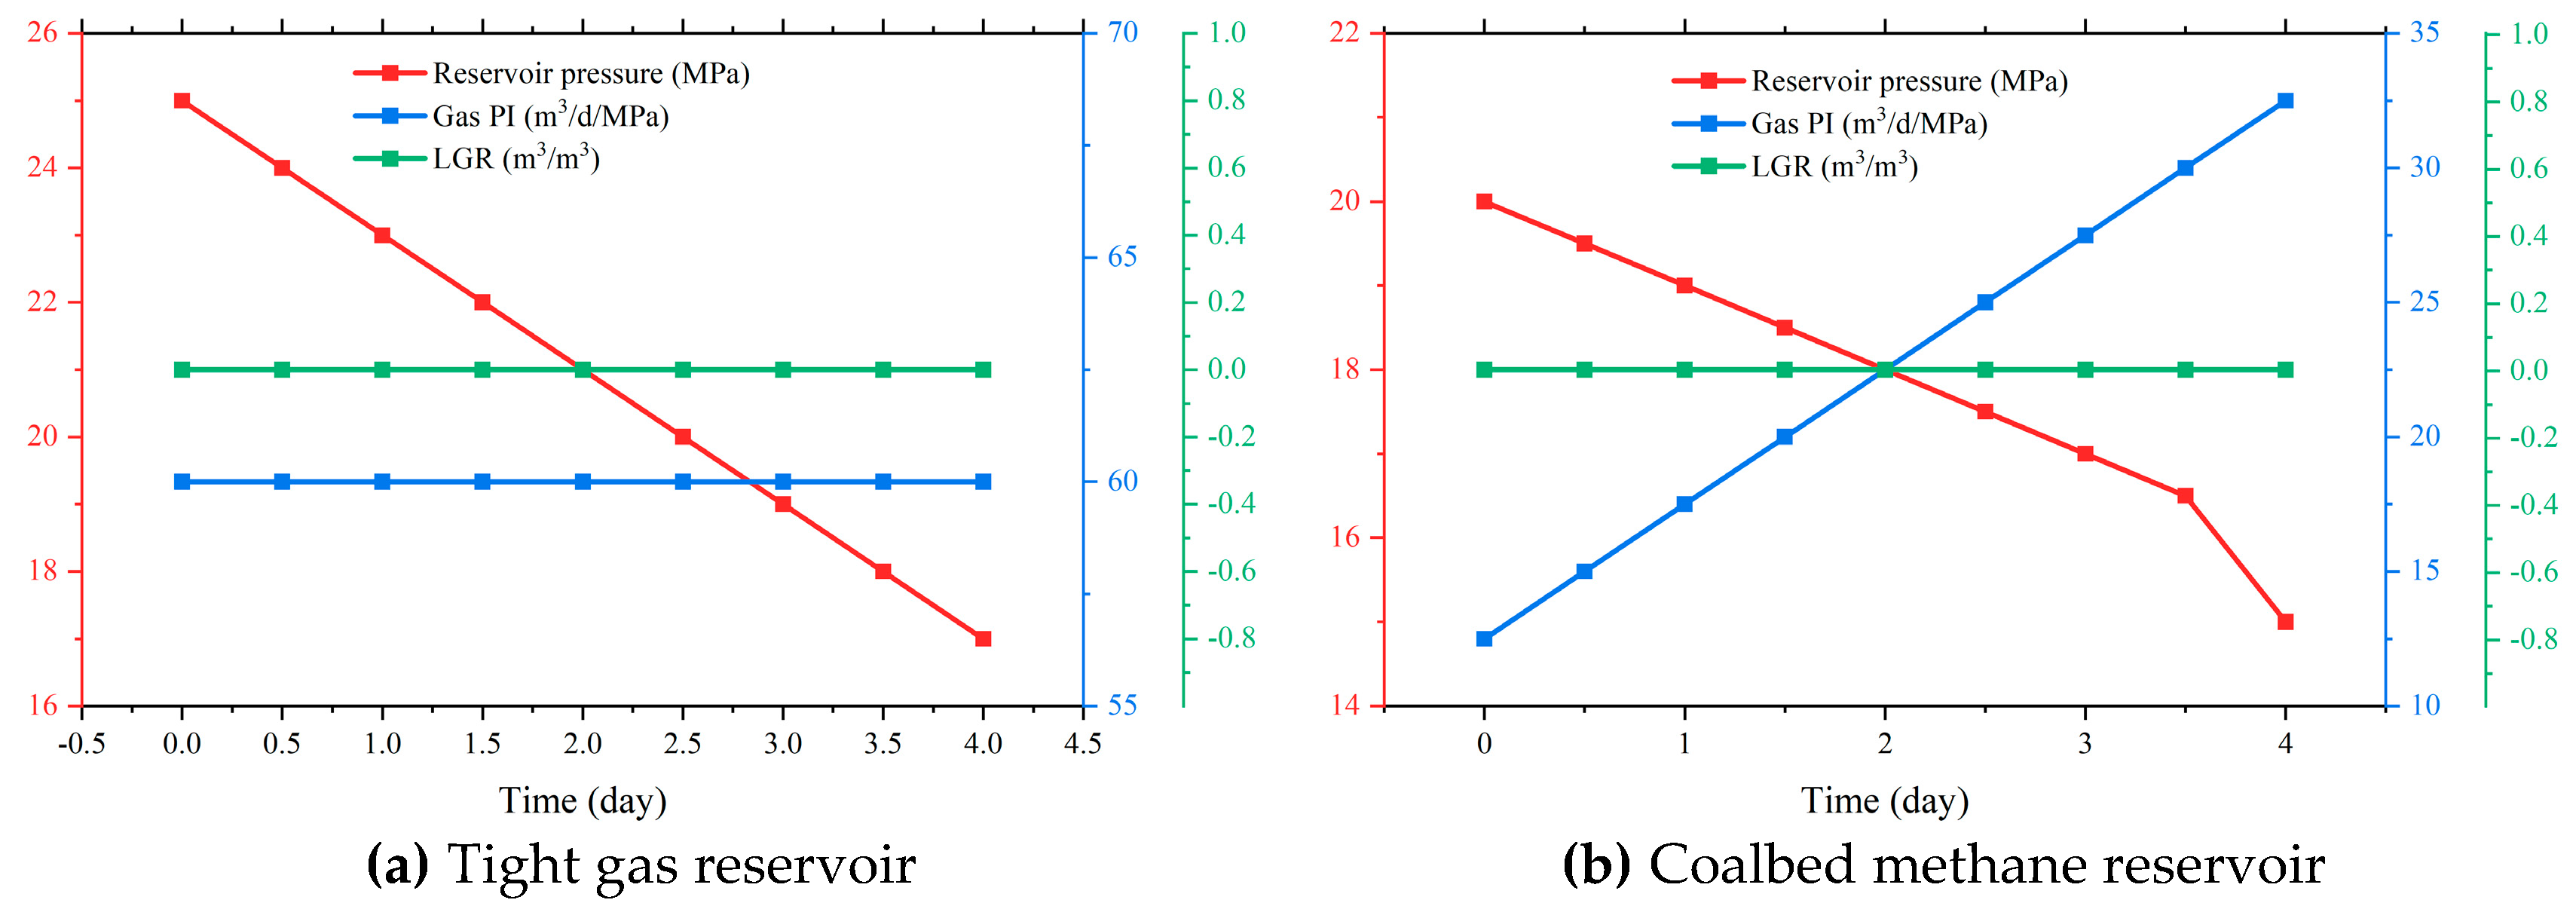
To verify the accuracy and feasibility of the proposed layered production allocation model, a dual-reservoir configuration of a co-producing tight gas and coalbed methane (CBM) well was constructed using the OLGA transient multiphase flow simulator. The flow parameters used in the model—such as the pipe diameter, pipe depth, and roughness—are consistent with those in the previous simulation. The model represents an overlying tight sandstone gas reservoir (upper layer) and an underlying coal seam gas reservoir (lower layer), simulating the typical “tight-over-coal” stratigraphic relationship observed in field applications. To enhance the robustness of the proposed approach, timers were embedded in the simulation to emulate different production phases of the tight gas and CBM development. These phases were characterized by varying reservoir pressures and gas productivity indices, reflecting time-dependent production behavior. The analysis indicates that the tight gas reservoir primarily produces gas with a relatively low water–gas ratio and undergoes a rapid pressure depletion, yielding high gas flow rates in the early stage that decline sharply thereafter. In contrast, the CBM reservoir exhibits higher water production, a slower pressure decline, and lower initial gas production. However, as the desorption progresses with a continued depletion, the gas production from CBM gradually increases. Therefore, the tight gas reservoir was assigned a lower water–gas ratio and faster pressure decline, while the CBM reservoir was modeled with a higher water–gas ratio, slower pressure depletion, and increasing productivity index over time. The temporal evolution of reservoir inflow properties is shown in Figure 10.
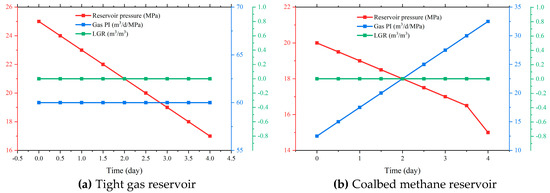
Figure 10.
Reservoir inflow characteristics.
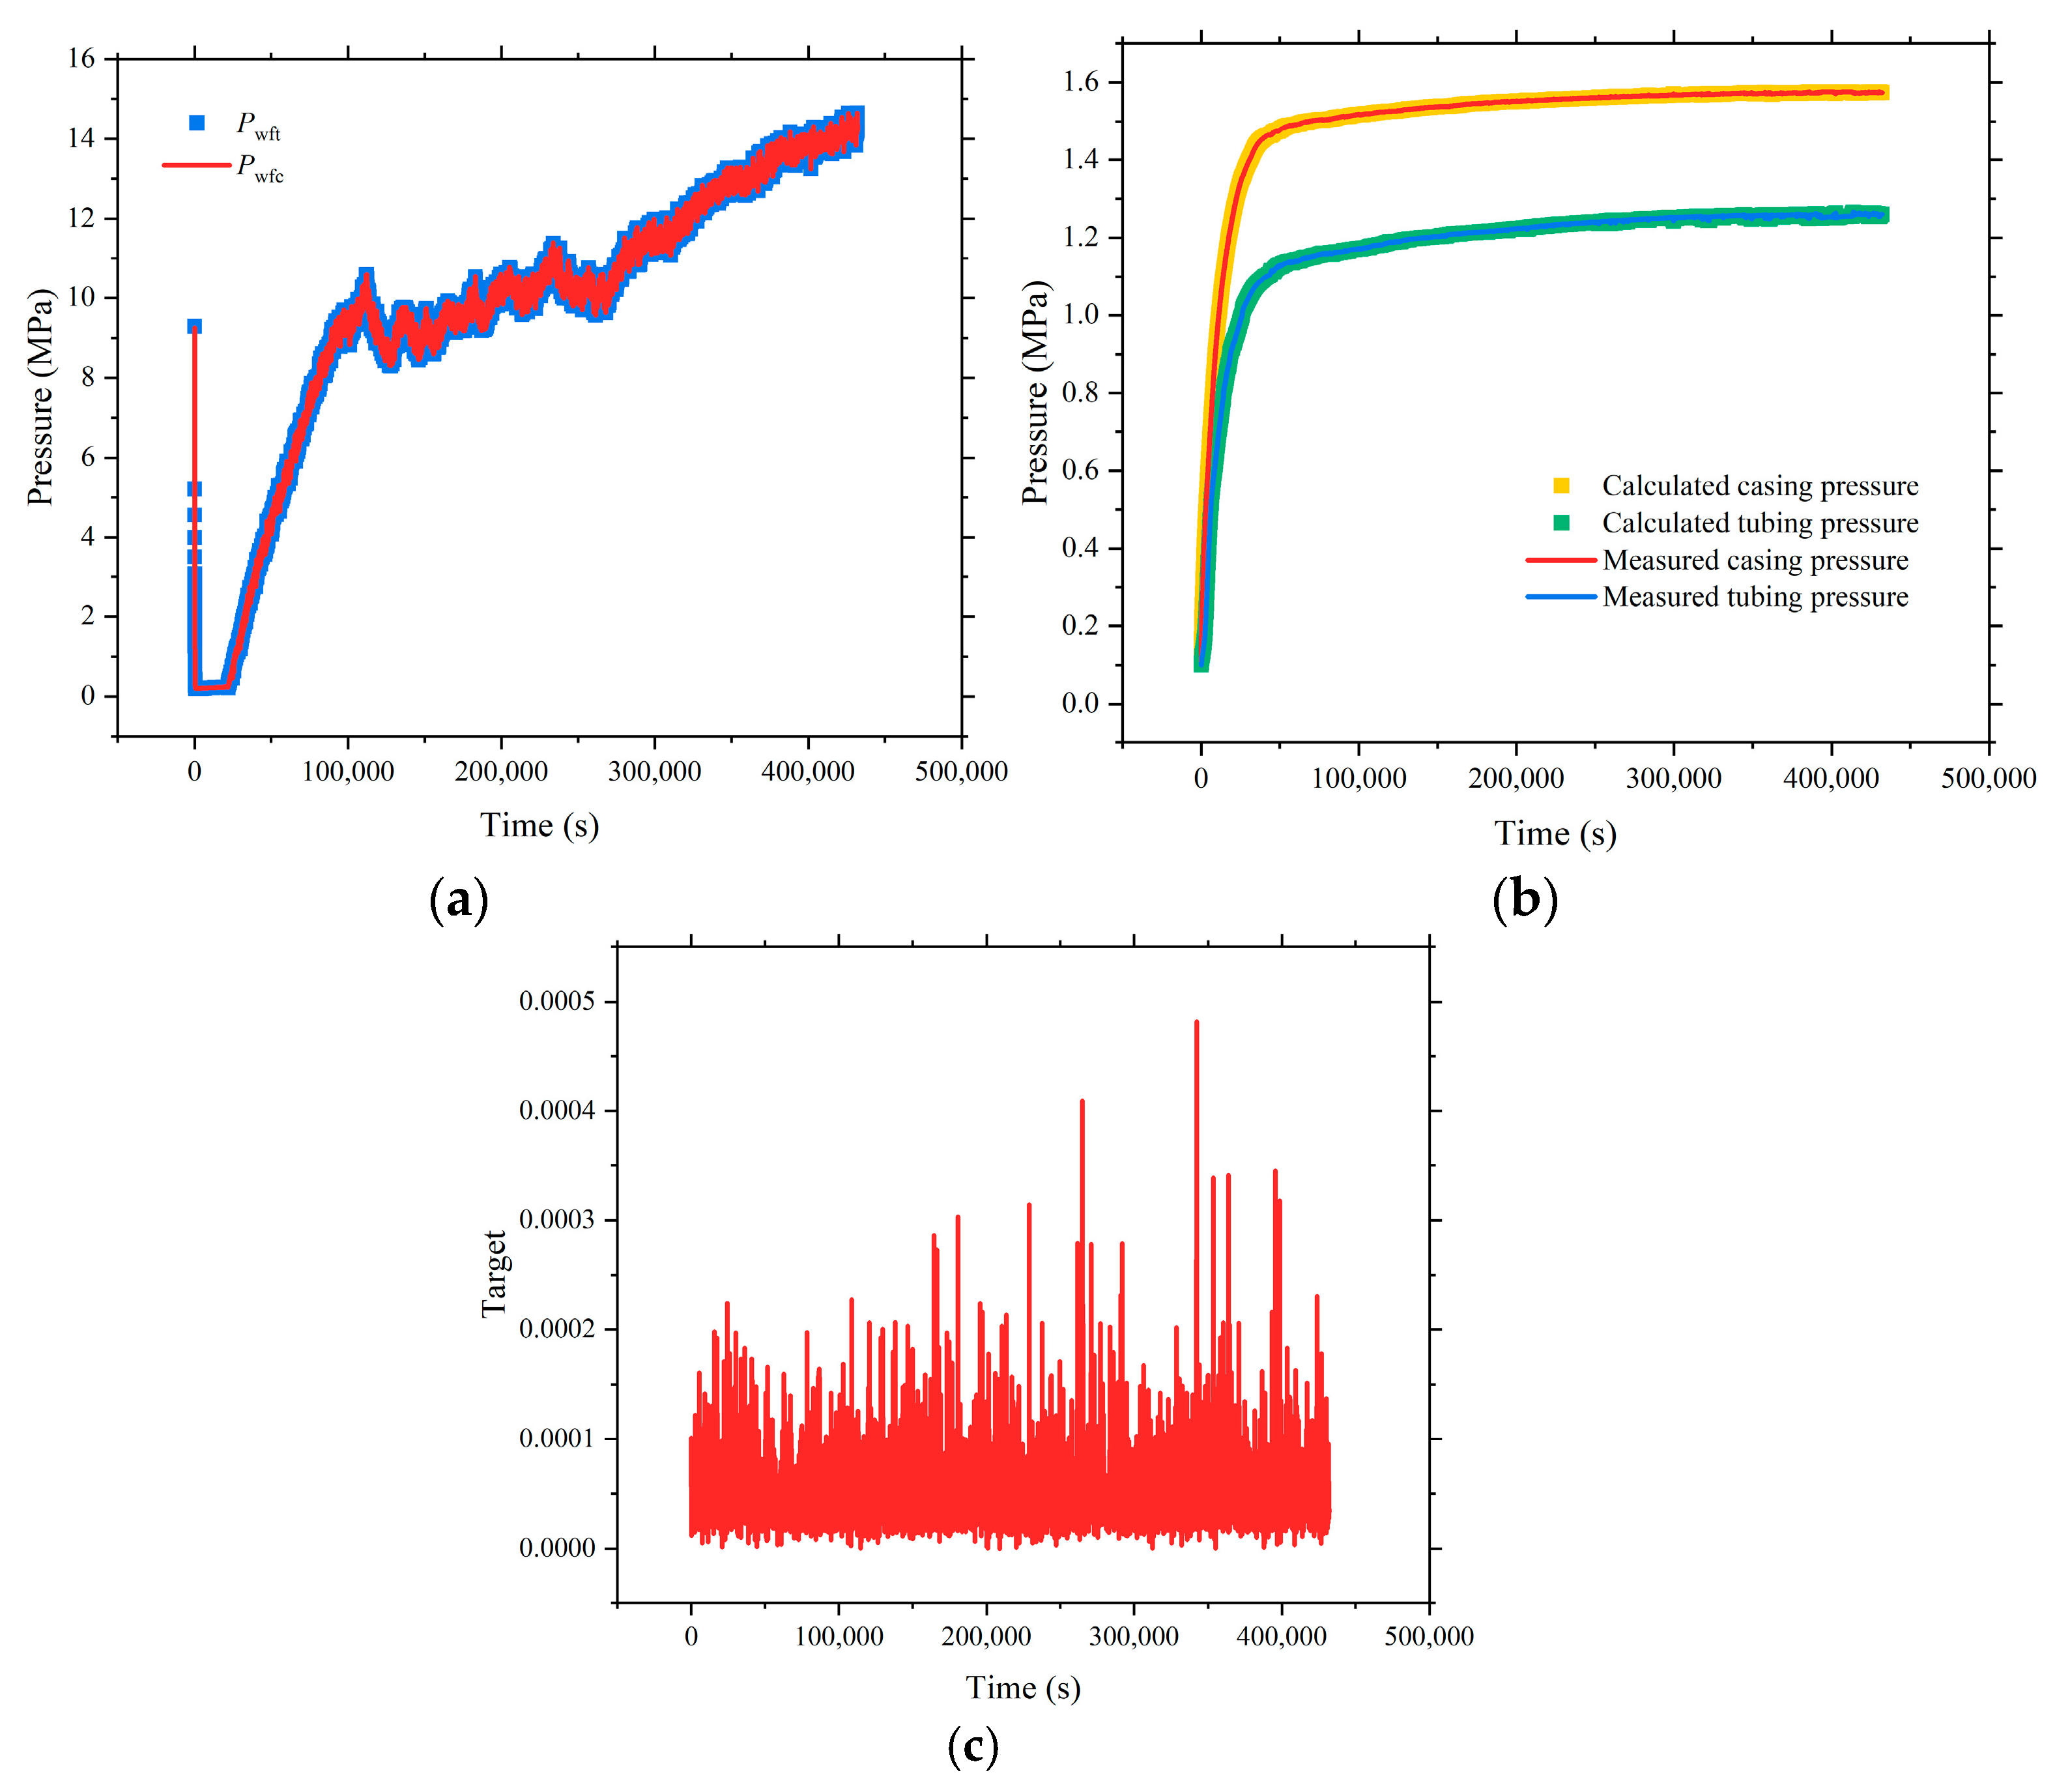
After applying the proposed model to calculate stratified production allocation, the simulation results are presented in Figure 11. The computed bottomhole pressures at the tubing and casing shoes, along with the simulated wellhead pressures, were compared against field-measured data. The results demonstrate a strong consistency in magnitude, with minimal relative errors between computed and measured values. Specifically, pressures at the tubing and casing shoe depths and the wellhead exhibited a negligible deviation from monitored data, indicating no apparent systematic bias. This confirms that the model offers a high stability and accuracy in the pressure field reconstruction. Furthermore, the objective function values remained small across all tested conditions, and the iterative optimization converged rapidly, demonstrating the model’s excellent numerical stability and robustness under multi-parameter inversion scenarios. No numerical oscillations or divergence were observed during the computation, which supports the model’s reliability and feasibility in practical layered production allocation applications.
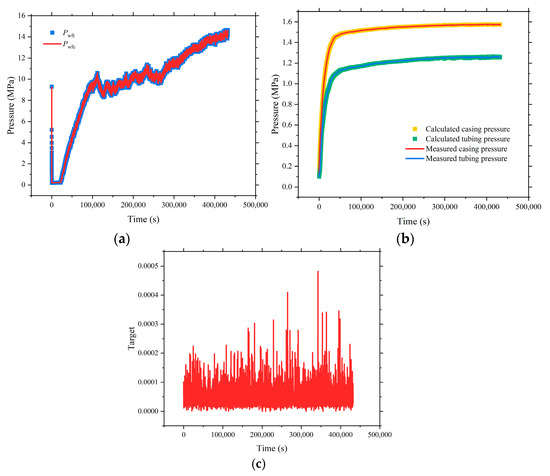
Figure 11.
Model calculation results. (a) Comparison of calculated bottomhole pressures at tubing and casing shoes; (b) Comparison of simulated and monitored wellhead pressures; (c) Evolution of objective function values.
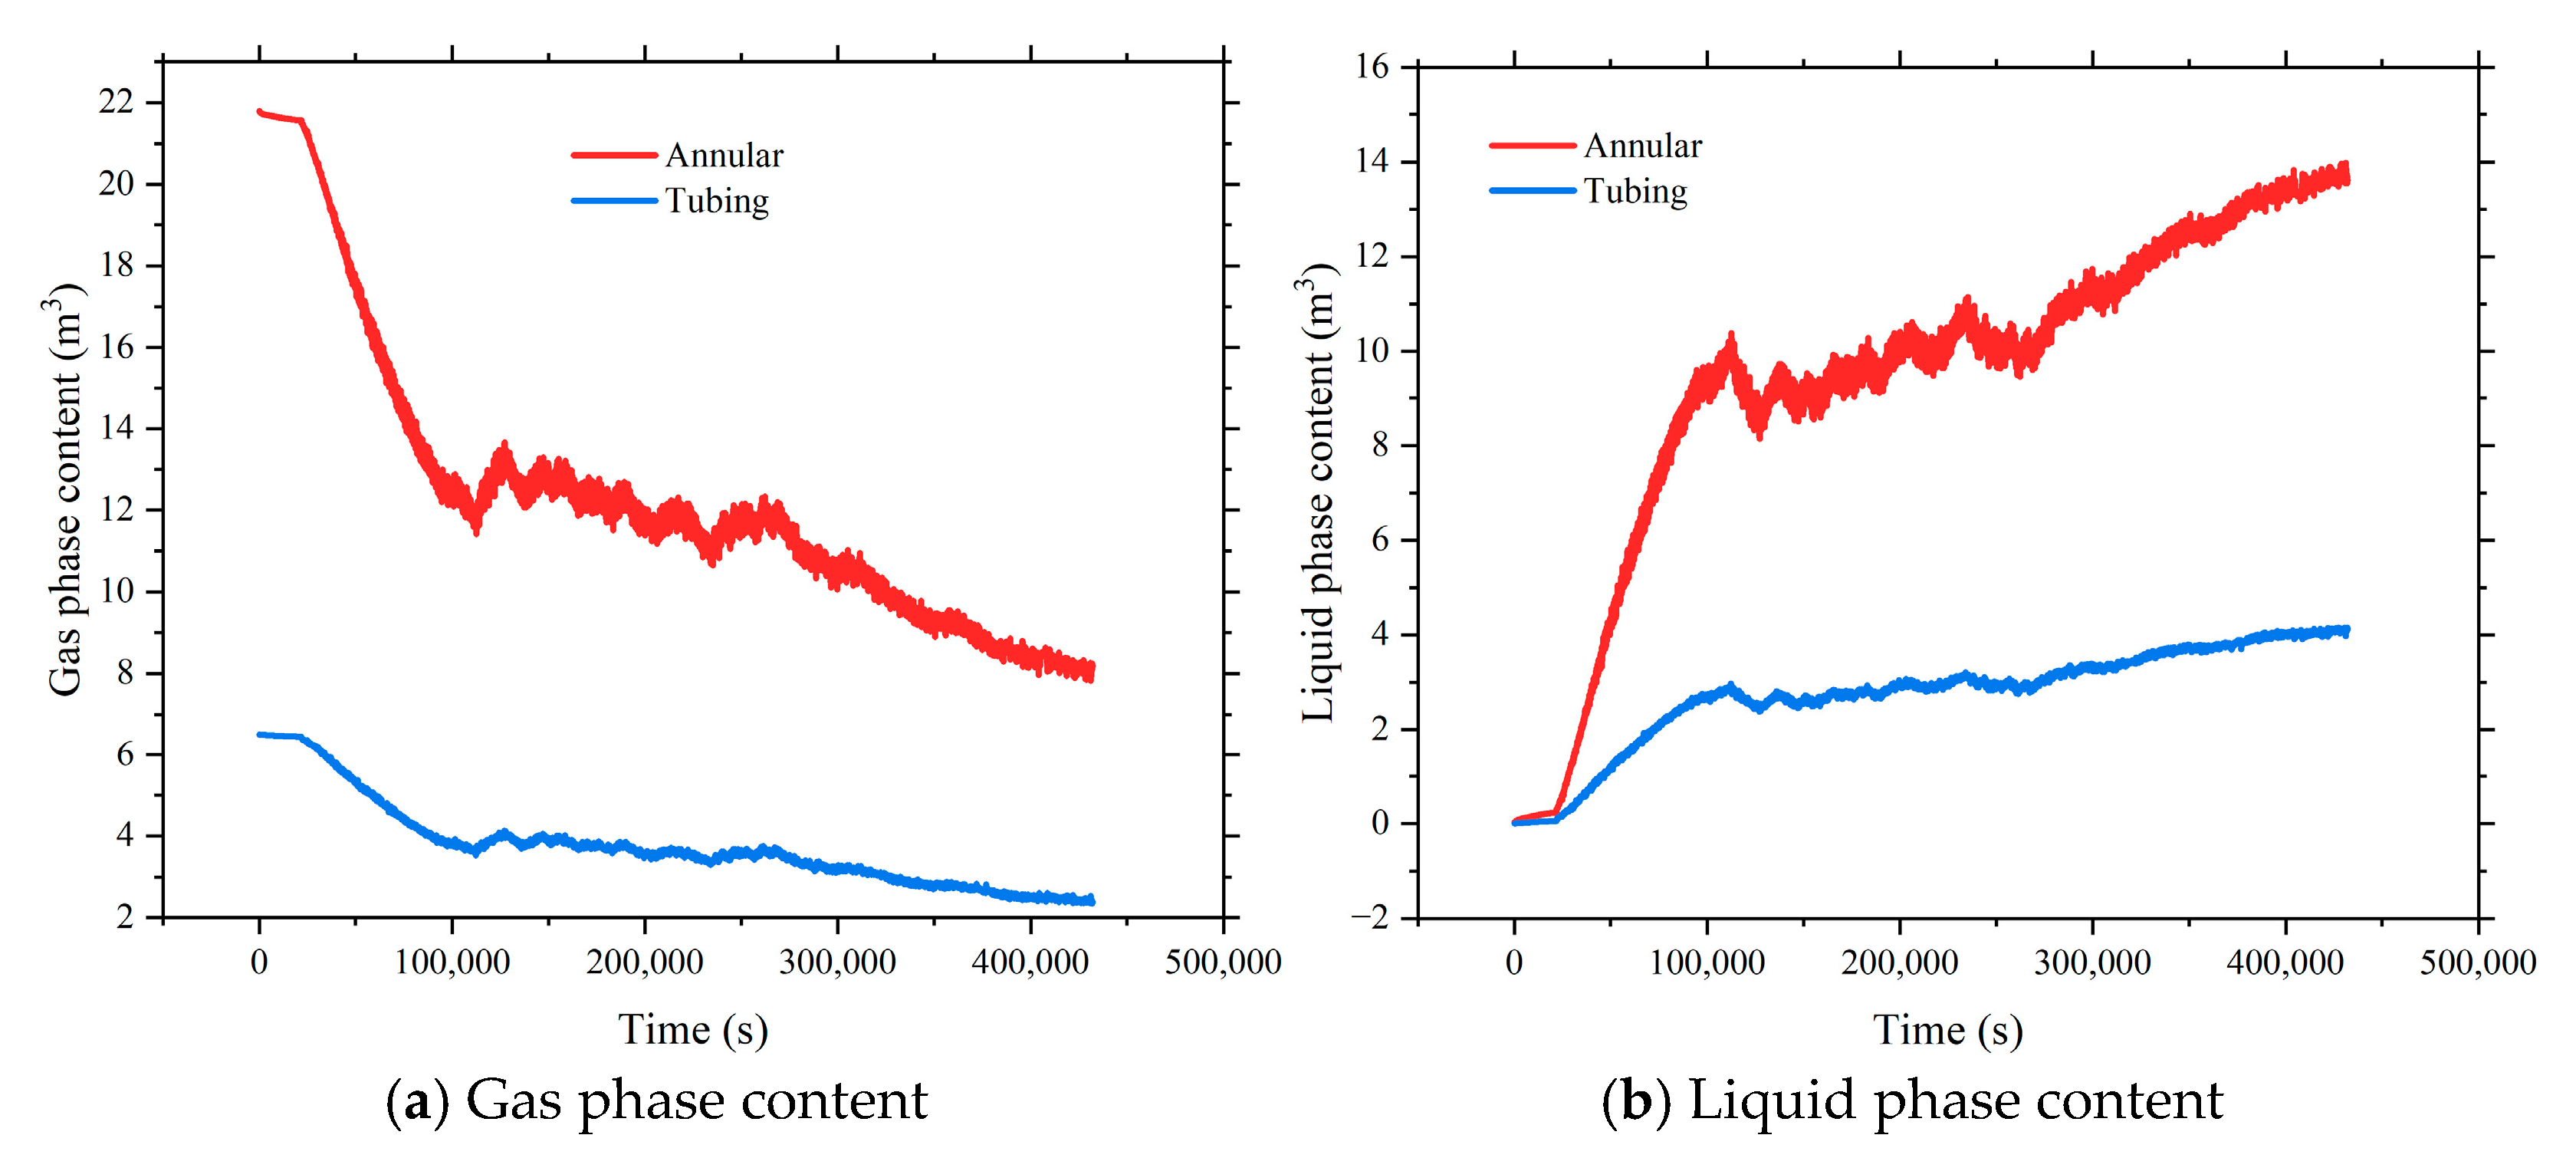
Based on the time-dependent reservoir properties defined in Figure 10, the internal fluid dynamics of the wellbore were simulated using the proposed model. Figure 12 shows the evolution of the gas and liquid content in the tubing and annulus. Initial conditions assumed zero liquid contents in both the tubing and casing, with the gas mass computed based on measured initial wellhead pressures. As production commenced, the pre-existing gas was gradually expelled to the surface, while the gas–liquid inflow from the reservoirs began replenishing the wellbore. This led to a rise in the liquid content and a simultaneous decline in the gas content. In early production stages, the low-density, high-mobility gas phase was preferentially produced, while the liquid, especially from the CBM reservoir, accumulated due to lower mobility, resulting in a rapid increase in the liquid holdup. This phase is characterized by a “gas decline and liquid rise” trend in the wellbore. In the mid-to-late production phase, the tight gas reservoir experienced a significant pressure depletion, leading to a decline in the gas supply. Meanwhile, the CBM reservoir—benefiting from enhanced desorption, pressure recovery at the bottomhole, and an increasing productivity index—became the dominant contributor. As the CBM gas production increased, the overall gas content in the wellbore rose again, forming a “decline–stabilization” trend. Simultaneously, the accumulated liquid was gradually lifted out by the CBM gas stream, leading to a “rise–stabilization” behavior in the liquid content.
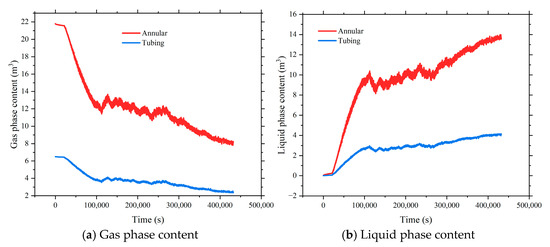
Figure 12.
The evolution of the gas and liquid content in the wellbore.
Figure 13 illustrates the temporal evolution of the gas and liquid production from both reservoirs, along with the corresponding allocation coefficient. The simulation reflects a continuous decline in the formation pressure and productivity index for both reservoirs under dynamic production conditions. Although both reservoirs initially demonstrated a strong production capacity, their decline mechanisms and depletion rates differ substantially. In the early stage, the tight gas reservoir—with a higher initial pressure, lower porosity, and lower permeability—primarily produces free gas and rapidly releases energy, resulting in high initial gas rates. However, due to its pressure sensitivity, the rapid gas withdrawal leads to a steep pressure drop and a quick transition into the decline phase. After this initial drop, the decline rate gradually stabilizes. By contrast, the CBM reservoir suffers from initial water-blocking and delayed desorption effects, producing lower gas volumes. Over time, however, the desorption is enhanced, and the gas production becomes more stable. Additionally, CBM typically co-produces large volumes of formation water. In the early stages, the liquid production is relatively high but declines faster than in the tight gas reservoir due to the finite liquid volume and enhanced gas–liquid transport. This also reduces the liquid holdup in the wellbore, improving the drainage path.
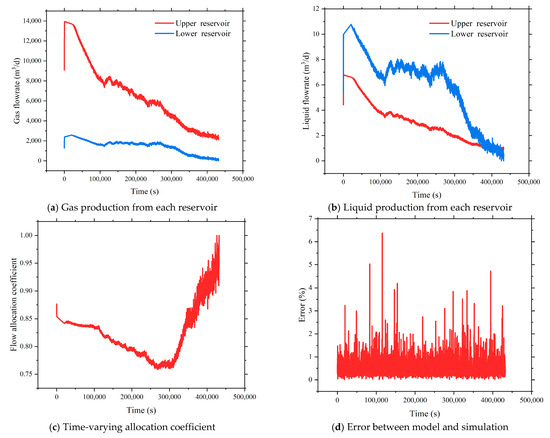
Figure 13.
Reservoir production and allocation coefficient results.
From the perspective of the allocation coefficient—defined as the ratio of the tight gas production to the total production—it is evident that the tight gas reservoir remains the dominant contributor throughout most of the production cycle. Initially, due to its strong gas deliverability, it dominates the total output. As the CBM desorption accelerates, its gas contribution temporarily increases, slightly reducing the allocation coefficient and suggesting short-term co-production synergy. However, this phase is brief and does not result in a shift in the dominant production layer. In the late stage, with a declining CBM water output, hindered drainage, and increasing liquid accumulation in the wellbore, the CBM production is suppressed due to the higher backpressure. The gas desorption is inhibited, and CBM’s contribution diminishes. As a result, the allocation coefficient increases again and in extreme cases may reach one, indicating that the production is fully dominated by the tight gas reservoir, with CBM nearly shut in.
Figure 13d compares the allocation coefficient obtained from the proposed model with that derived from transient numerical simulations. The results validate the applicability and accuracy of the method across different production phases. Throughout the production cycle, the predicted coefficients closely matched the simulated reference values. Most errors remained within 1%, with the maximum relative error observed during abrupt productivity transitions, reaching 6.37%. The average error across the simulation period was only 0.49%, confirming the model’s strong predictive performance.
To further objectively and quantitatively evaluate the consistency between the model predictions and simulation results—beyond subjective visual comparisons—two widely used statistical indicators were introduced: the Mean Squared Error (MSE) and the Root Mean Squared Error (RMSE). These metrics are standard in engineering model validations and effectively quantify the overall deviation and dispersion between predicted and reference values. The formulas are given as
where yi and ŷi represent the simulated and predicted values, respectively.
In this study, the MSE was calculated to be 0.0032, and the RMSE was 0.0056, indicating a high level of agreement between the model outputs and reference simulations.
The relatively low RMSE suggests that the deviations between the predicted and simulated allocation coefficients are minimal and mostly distributed within a narrow range. This further confirms the model’s robustness in capturing dynamic production behavior. The few larger errors observed correspond to periods of rapid production changes, where gas–liquid flow regimes shift sharply, introducing nonlinearity and transient effects that are difficult to fully capture with simplified monitoring-based methods. Despite this, the overall error remains within an acceptable range, demonstrating the model’s applicability to real-time field deployment.
4. Conclusions
In this study, a transient simulation-based approach was employed to systematically investigate the productivity distribution and wellbore fluid dynamics of dual-reservoir co-producing wells under different tubing landing depths, considering two typical vertical stacking sequences: “tight-over-coal” and “coal-over-tight”. By analyzing the flow and pressure distribution characteristics within the wellbore, a production allocation model was developed that integrates the wellhead monitoring data and reservoir dynamic evolution. The following conclusions can be drawn:
(1) A dual-reservoir co-production model was established using the OLGA transient simulation software to evaluate the dynamic interactions under both “coal-over-tight” and “tight-over-coal” vertical configurations. The simulations systematically analyzed the operational performance under various tubing landing depths.
(2) Landing the tubing at the bottom of the dual-reservoir interval significantly improves the drainage efficiency, reduces the liquid holdup in the wellbore, and enhances the water removal from the coal seam. This configuration helps maintain a stable liquid unloading channel and promotes synergistic production from both reservoirs. In contrast, locating the tubing in the upper or middle section of the reservoir stack tends to cause unstable drainage paths, fluid retention, and intensified gas–liquid interactions, which can lead to severe liquid loading and even well shut-in.
(3) A production allocation coefficient model was proposed that couples dynamic reservoir parameters with real-time wellhead monitoring data. By incorporating two-phase flow mechanisms and pressure differential response characteristics, the model dynamically assesses each reservoir’s production contribution. It effectively identifies reservoir-specific productivity at different development stages and demonstrates strong physical interpretability and engineering applicability.
(4) A comparison between model-calculated allocation coefficients and those obtained from transient numerical simulations shows an excellent agreement, with a maximum relative error of 6.37% and an average error of only 0.49%. This validates the accuracy and robustness of the proposed method. Compared with conventional empirical allocation methods, the proposed approach offers greater advantages in identifying co-producing reservoirs and supporting refined production management. It is particularly suitable for production allocation analysis and optimization in complex dual-reservoir scenarios.
Building on the simulation framework and allocation model proposed in this study, future research can further explore the intelligent optimization of dual-reservoir co-production by integrating data-driven and real-time adaptive methods. First, advanced machine learning and artificial intelligence (AI) techniques—such as deep neural networks and reinforcement learning—can be introduced to automatically identify reservoir flow patterns, optimize the tubing landing depth, and predict allocation coefficients under changing reservoir conditions. Second, a real-time inversion and parameter correction based on surface monitoring data (e.g., pressure, flowrate, temperature) can be developed to enhance the accuracy of dynamic coupling between wellbore and reservoir systems. Third, the concept of a digital twin can be applied to construct a real-time, continuously updated virtual model of co-production wells, enabling intelligent decision-making, the early warning of abnormal working conditions, and the autonomous adjustment of operating parameters. These directions are expected to significantly improve the efficiency, adaptability, and intelligence of multi-reservoir production systems in complex formations.
Author Contributions
Methodology, Y.C.; software, Z.X.; validation, J.Y.; formal analysis, Z.L.; resources, J.Y.; data curation, G.W.; writing—original draft, G.H.; writing—review and editing, Z.X.; project administration, Z.L. All authors have read and agreed to the published version of the manuscript.
Funding
This research received no external funding.
Data Availability Statement
No new data were created or analyzed in this study. Data sharing is not applicable to this article.
Conflicts of Interest
Authors Guangai Wu, Zhun Li, Yanfeng Cao and Jifei Yu were employed by the company CNOOC Research Institute Ltd. The remaining authors declare that the research was conducted in the absence of any commercial or financial relationships that could be construed as a potential conflict of interest.
References
- Tang, S.; Tang, D.; Li, S.; Xu, H.; Tao, S.; Geng, Y.; Ma, L.; Zhu, X. Fracture System Identification of Coal Reservoir and the Productivity Differences of CBM Wells with Different Coal Structures: A Case in the Yanchuannan Block, Ordos Basin. J. Pet. Sci. Eng. 2018, 161, 175–189. [Google Scholar] [CrossRef]
- Xing, Z.; Han, G.; Jia, Y.; Tian, W.; Gong, H.; Zuo, H.; Jiang, W.; Liang, X. Mechanistic Modeling and Experimental Study of Multistage Plunger Lift for Liquid Unloading in Ultra-Deep Gas Well. Geoenergy Sci. Eng. 2025, 246, 213653. [Google Scholar] [CrossRef]
- Zhang, Y.; Sun, B.; Deng, Z.; Chao, W.; Men, X. In Situ Stress Distribution of Deep Coals and Its Influence on Coalbed Methane Development in the Shizhuang Block, Qinshui Basin, China. ACS Omega 2023, 8, 36188–36198. [Google Scholar] [CrossRef] [PubMed]
- Shen, J.; Li, K.; Zhang, H.; Shabbiri, K.; Hu, Q.; Zhang, C. The Geochemical Characteristics, Origin, Migration and Accumulation Modes of Deep Coal-Measure Gas in the West of Linxing Block at the Eastern Margin of Ordos Basin. J. Nat. Gas Sci. Eng. 2021, 91, 103965. [Google Scholar] [CrossRef]
- Hou, X.; Liu, S.; Zhu, Y.; Yang, Y. Evaluation of Gas Contents for a Multi-Seam Deep Coalbed Methane Reservoir and Their Geological Controls: In Situ Direct Method versus Indirect Method. Fuel 2020, 265, 116917. [Google Scholar] [CrossRef]
- Xing, Z.-S.; Han, G.-Q.; Jia, Y.-L.; Tian, W.; Gong, H.-F.; Jiang, W.-B.; Mai, P.-D.; Liang, X.-Y. Optimization of Plunger Lift Working Systems Using Reinforcement Learning for Coupled Wellbore/Reservoir. Pet. Sci. 2025, 22, 2154–2168. [Google Scholar] [CrossRef]
- Chen, S.; Tang, D.; Tao, S.; Xu, H.; Li, S.; Zhao, J.; Ren, P.; Fu, H. In-Situ Stress Measurements and Stress Distribution Characteristics of Coal Reservoirs in Major Coalfields in China: Implication for Coalbed Methane (CBM) Development. Int. J. Coal Geol. 2017, 182, 66–84. [Google Scholar] [CrossRef]
- Fu, H.; Tang, D.; Xu, H.; Xu, T.; Chen, B.; Hu, P.; Yin, Z.; Wu, P.; He, G. Geological Characteristics and CBM Exploration Potential Evaluation: A Case Study in the Middle of the Southern Junggar Basin, NW China. J. Nat. Gas Sci. Eng. 2016, 30, 557–570. [Google Scholar] [CrossRef]
- Li, S.; Qin, Y.; Tang, D.; Shen, J.; Wang, J.; Chen, S. A Comprehensive Review of Deep Coalbed Methane and Recent Developments in China. Int. J. Coal Geol. 2023, 279, 104369. [Google Scholar] [CrossRef]
- Li, S.; Tang, D.; Pan, Z.; Xu, H.; Tao, S.; Liu, Y.; Ren, P. Geological Conditions of Deep Coalbed Methane in the Eastern Margin of the Ordos Basin, China: Implications for Coalbed Methane Development. J. Nat. Gas Sci. Eng. 2018, 53, 394–402. [Google Scholar] [CrossRef]
- Li, X.; Fu, X.; Yang, X.; Ge, Y.; Quan, F. Coalbed Methane Accumulation and Dissipation Patterns: A Case Study of the Junggar Basin, NW China. J. Asian Earth Sci. 2018, 160, 13–26. [Google Scholar] [CrossRef]
- Cheng, Y.; Luo, X.; Chen, P.; Guo, C.; Wang, F.; Tan, C. Production Allocation Optimization of Gas Reservoirs with Edge and Bottom Aquifer Based on a Parallel-Structured Genetic Algorithm. ACS Omega 2024, 9, 27329–27337. [Google Scholar] [CrossRef]
- Meng, D.; He, D.; Guo, Z.; Wang, G.; Ji, G.; Tang, H.; Zeng, Q. Dynamic Analysis of High-Water-Cut Tight Sandstone Gas Reservoirs and Study of Water Production Splitting of Gas Wells: A Case Study on the Western Sulige Gas Field, Ordos Basin, NW China. Processes 2023, 11, 2093. [Google Scholar] [CrossRef]
- Liu, H.; Zheng, L.C.; Yang, Q.H.; Yu, J.Q.; Yue, Q.F.; Jia, D.L.; Wang, Q.B. Development and Prospect of Separated Zone Oil Production Technology. Pet. Explor. Dev. 2020, 47, 1103–1116. [Google Scholar] [CrossRef]
- Song, H.W.; Guo, H.M.; Guo, S.; Shi, H.Y. Partial Phase Flow Rate Measurements for Stratified Oil-Water Flow in Horizontal Wells. Pet. Explor. Dev. 2020, 47, 613–622. [Google Scholar] [CrossRef]
- Men, X.; Yan, X.; Chen, Y.; Li, Z.; Gong, H. Gas-Water Phase Flow Production Stratified Logging Technology of Coalbed Methane Wells. Pet. Explor. Dev. 2017, 44, 315–320. [Google Scholar] [CrossRef]
- Liang, X.; Xing, Z.; Yue, Z.; Ma, H.; Shu, J.; Han, G. Optimization of Energy Consumption in Oil Fields Using Data Analysis. Processes 2024, 12, 1090. [Google Scholar] [CrossRef]
- Ren, C.; Deng, C.; Jiang, Z.; Fu, Q.; Jiang, L.; Guo, Y.; Wu, K. The Production Splitting Method of Offshore Multilayer Combined Water Flooding Gas Wells with Gas Dissolving. ACS Omega 2024, 9, 12850–12865. [Google Scholar] [CrossRef]
- Cheng, G.; Wei, Y.; Guo, Z.; Fu, B.; Wang, Q.; Wang, G.; Jiang, Y.; Meng, D.; Han, J.; Shen, Y.; et al. A Novel Approach to Production Allocation for Multi-Layer Commingled Tight Gas Wells: Insights from the Ordos Basin, NW China. Energies 2025, 18, 456. [Google Scholar] [CrossRef]
- Song, T.; Zhu, W.; Chen, Q.; Wang, F.; Pan, B.; Bu, W.; Yue, M.; Song, H. A Novel Approach for Production Allocation in Multi-Layer Oil Reservoirs Based on Machine Learning Combining Game Theory. Geoenergy Sci. Eng. 2025, 247, 213706. [Google Scholar] [CrossRef]
- Xue, G.; Huang, X.; Deng, X.; Qi, Z.; Liu, N.; Li, S. A production splitting model of heterogeneous multi-layered reservoirs with commingled production. J. Porous Media 2023, 26, 101–120. [Google Scholar] [CrossRef]
- Li, J.; Chen, X.; Gao, P.; Zhou, J. Tight Carbonate Gas Well Deliverability Evaluation and Reasonable Production Proration Analysis. J. Pet. Explor. Prod. Technol. 2021, 11, 2999–3009. [Google Scholar] [CrossRef]
- Zhang, D. Production Allocation Method in Numerical Simulation for Fractured Vuggy Reservoirs. Geoenergy Sci. Eng. 2023, 226, 211735. [Google Scholar] [CrossRef]
- Lv, M.; Cui, H.; Lei, Y.; Lei, K.; Zhu, Y. Study on Reasonable Production Allocation Method of Tight Sandstone Gas Reservoir—A Case of XX Block in Ordos Basin. Front. Energy Res. 2023, 10, 1021989. [Google Scholar] [CrossRef]
- Lou, W.; Wang, Z.; Zhang, J.; Liu, H.; Sun, B.; Zhang, F. Flow Regime Evolution Mechanism and Falling Flux Prediction Model for Bypass Injection of Viscous Liquid in Vertical T-Junction. Chem. Eng. J. 2023, 476, 146601. [Google Scholar] [CrossRef]
- Guo, C.; Qin, Y.; Yi, T.S.; Chen, Z.L.; Yuan, H.; Gao, J.Z.; Guo, J. A Method for Identifying Coalbed Methane Co-Production Interference Based on Production Characteristic Curves: A Case Study of the Zhijin Block, Western Guizhou, China. Pet. Explor. Dev. 2022, 49, 1126–1137. [Google Scholar] [CrossRef]
- Liu, H.; Lou, W.; Li, H.; Wang, Z.; Gao, Y.; Li, H.; Sun, B. A Modified Comprehensive Prediction Model for Wellbore Temperature-Pressure Field and Liquid Loading of Gas Wells. Geoenergy Sci. Eng. 2024, 232, 212452. [Google Scholar] [CrossRef]
- Yang, Z.B.; Qin, Y.; Zhang, Z.G.; Sun, H.S.; Li, Y.Y.; Wu, C.C. Optimization Methods of Production Layer Combination for Coalbed Methane Development in Multi-Coal Seams. Pet. Explor. Dev. 2018, 45, 312–320. [Google Scholar] [CrossRef]


Disclaimer/Publisher’s Note: The statements, opinions and data contained in all publications are solely those of the individual author(s) and contributor(s) and not of MDPI and/or the editor(s). MDPI and/or the editor(s) disclaim responsibility for any injury to people or property resulting from any ideas, methods, instructions or products referred to in the content. |
© 2025 by the authors. Licensee MDPI, Basel, Switzerland. This article is an open access article distributed under the terms and conditions of the Creative Commons Attribution (CC BY) license (https://creativecommons.org/licenses/by/4.0/).