

Factors Impacting Projected Annual Energy Production from Offshore Wind Farms on the US East and West Coasts


Abstract
1. Introduction
- (1)
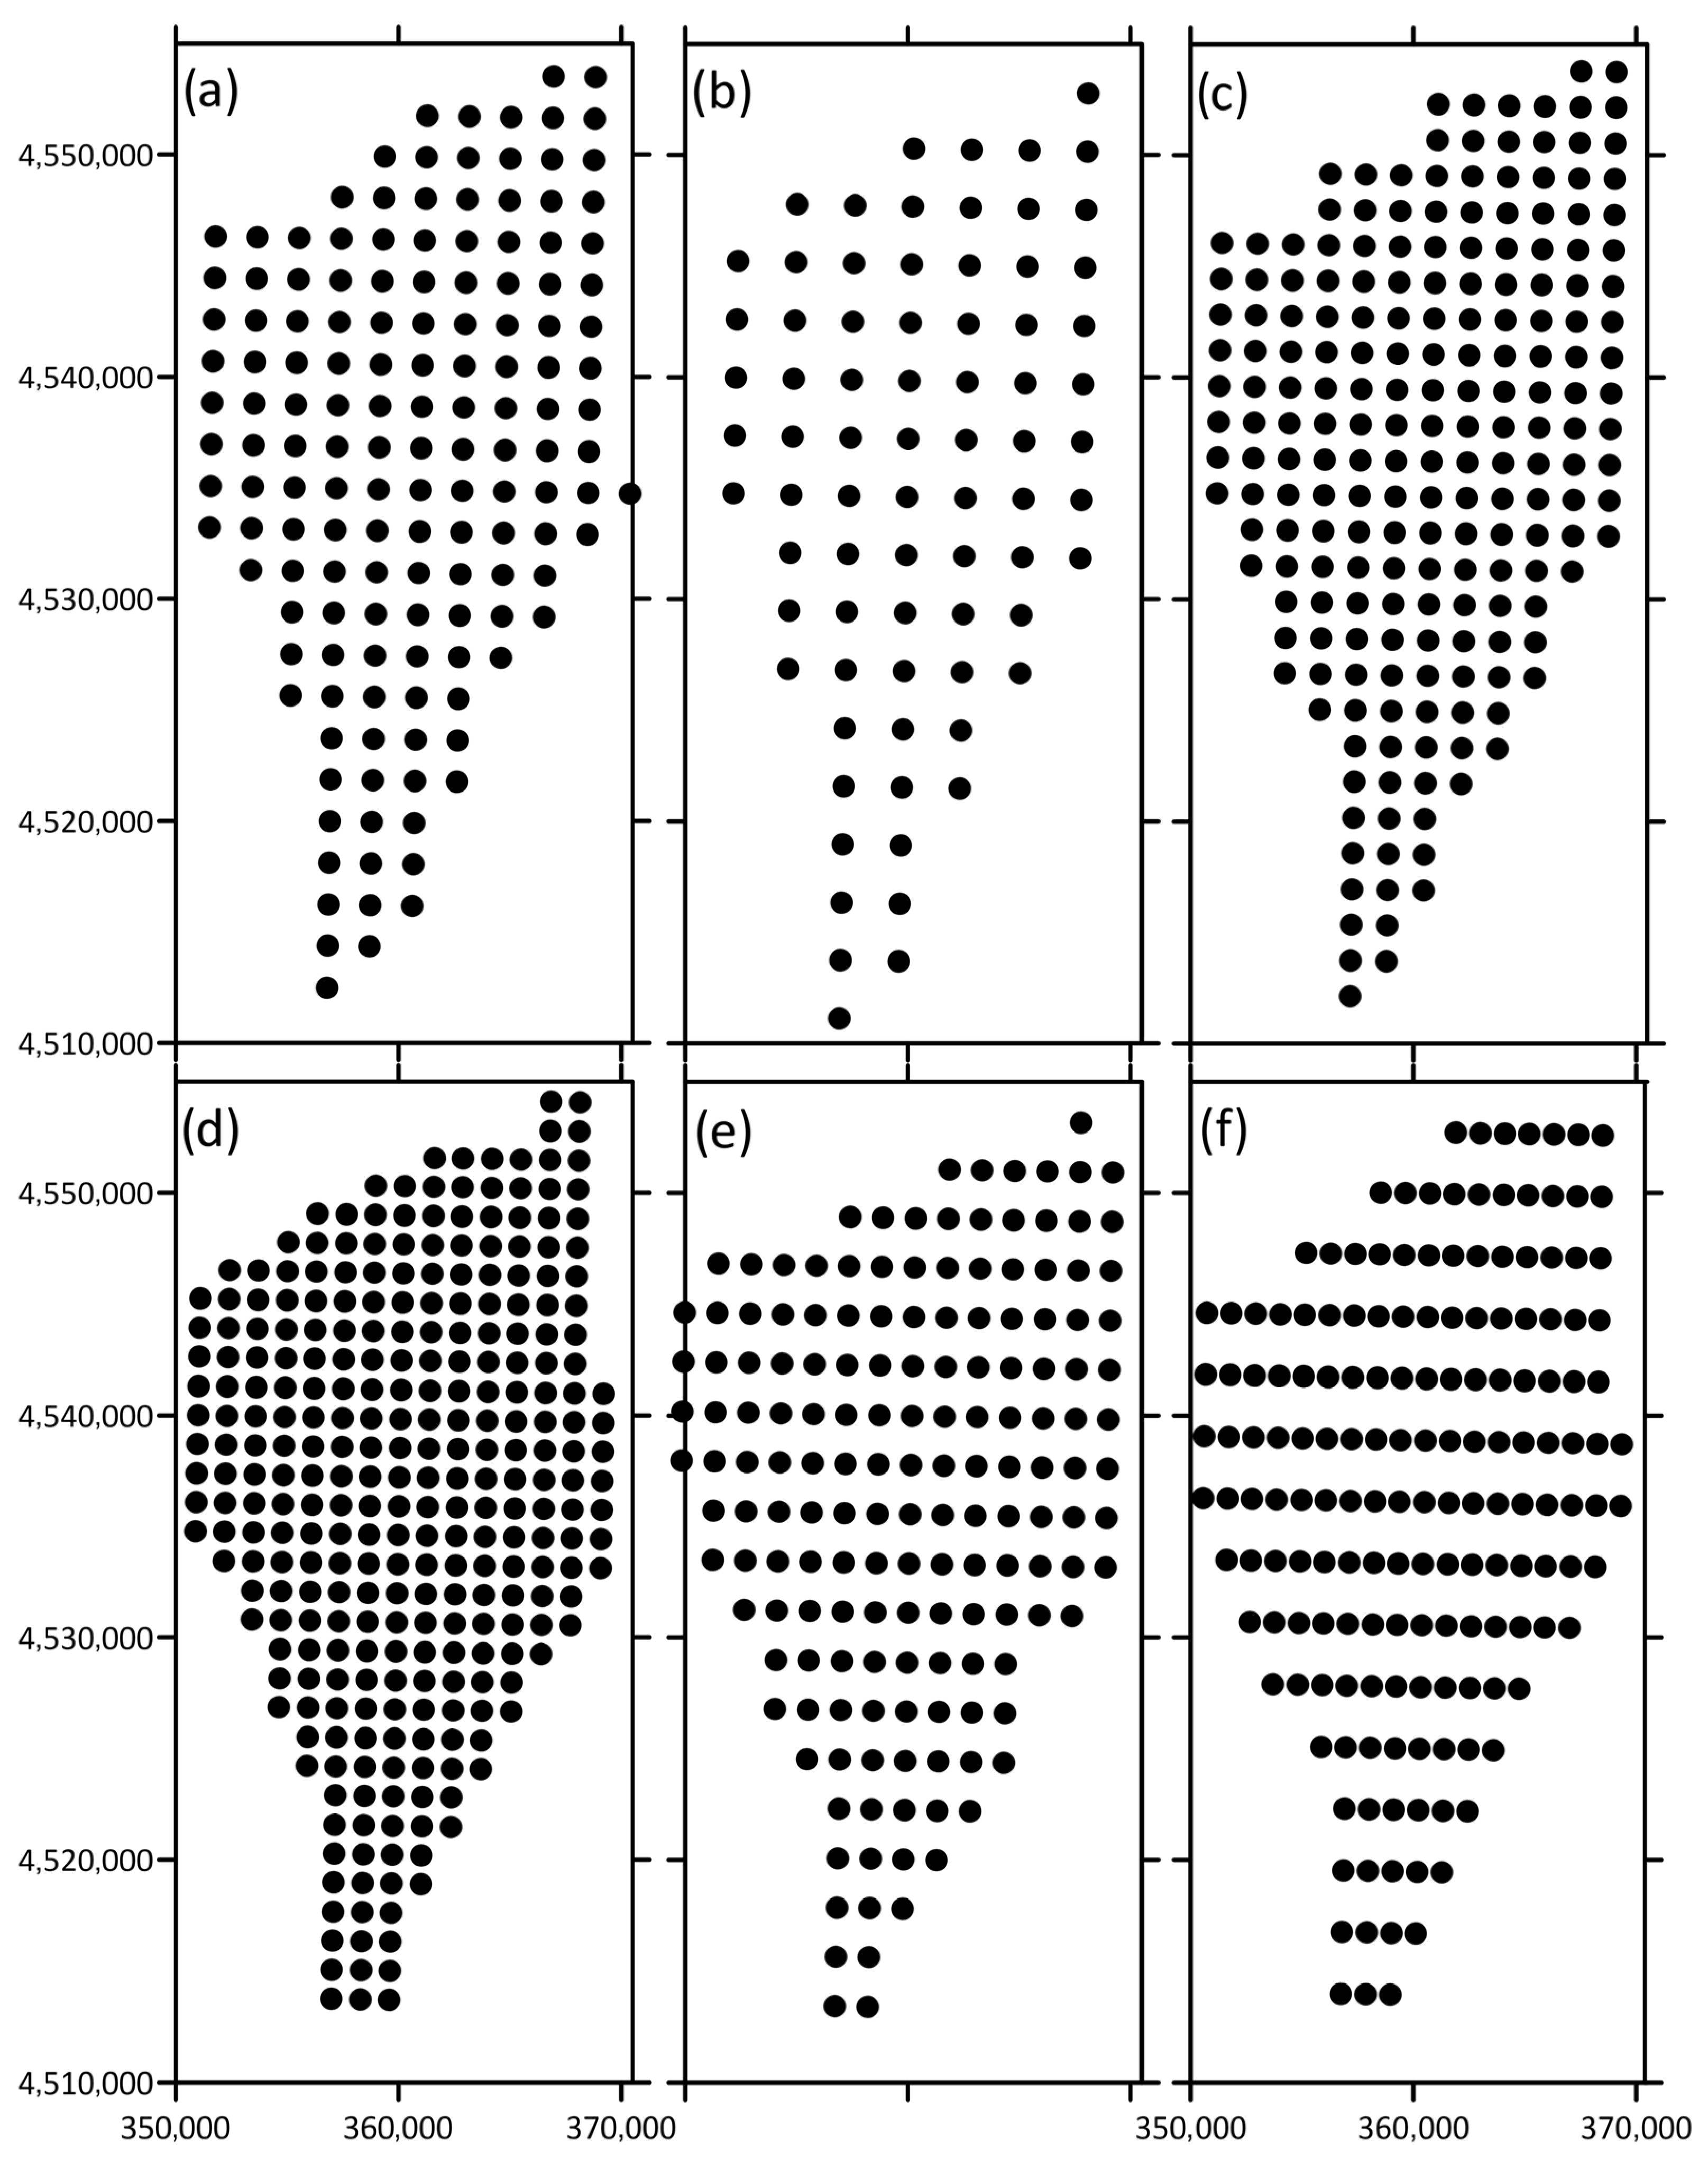
- The layout and spatial extent of the wind farms. Here we describe the turbine layout using the installed capacity density (ICD) (defined as total installed wind turbine rated capacity divided by total area) to allow for irregular array layouts. Most large European offshore wind farms have ICD of 4–10 MW km−2 [16]. Previous work suggests that AEP of large wind farms in wind climates with non-unidirectional wind direction distributions is sensitive to ICD but not the precise alignment of wind turbine rows/columns [8].
- (2)
- The model used to describe the generation and expansion of wind turbine wakes.
- (3)
- The sources of the meteorological data used to drive the wake models including assumptions regarding vertical extrapolation (if any) of wind speeds to wind turbine hub-height. Unfortunately, there is low availability of high-quality, long-duration, observations at wind turbine relevant heights for many offshore areas that are currently under consideration for large-scale wind turbine deployments [33]. Thus, most wake analyses employ meteorological output from reanalysis products or mesoscale simulations.
2. Methodology
2.1. Offshore Wind Lease Areas
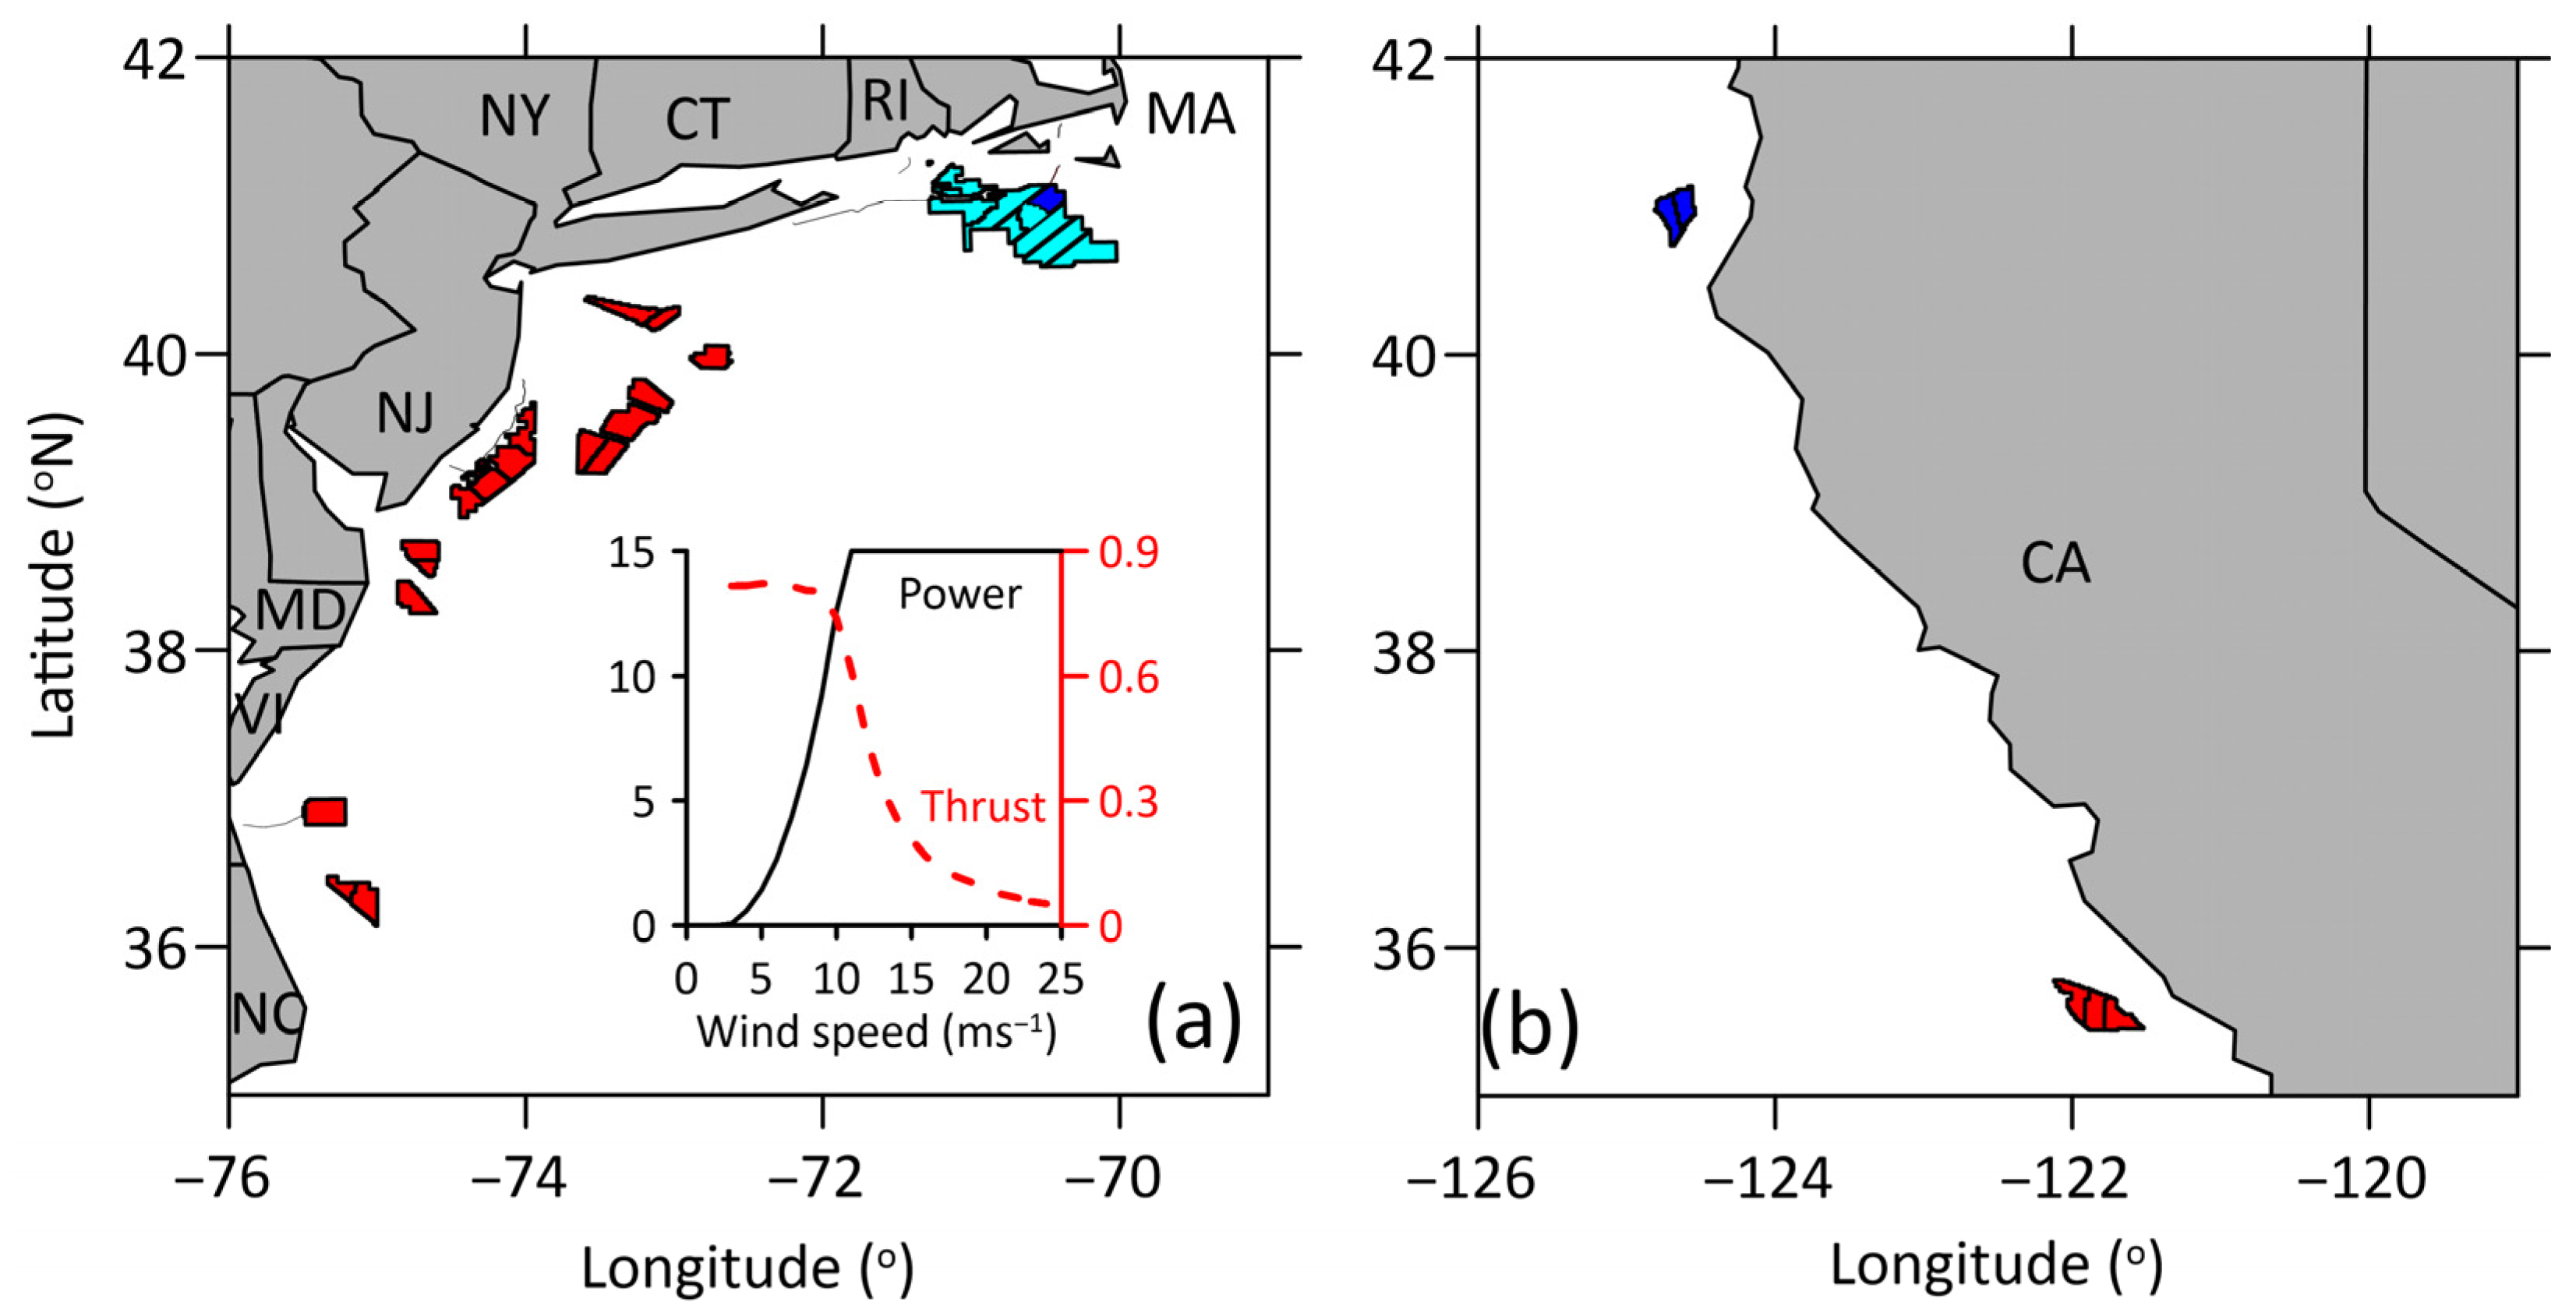
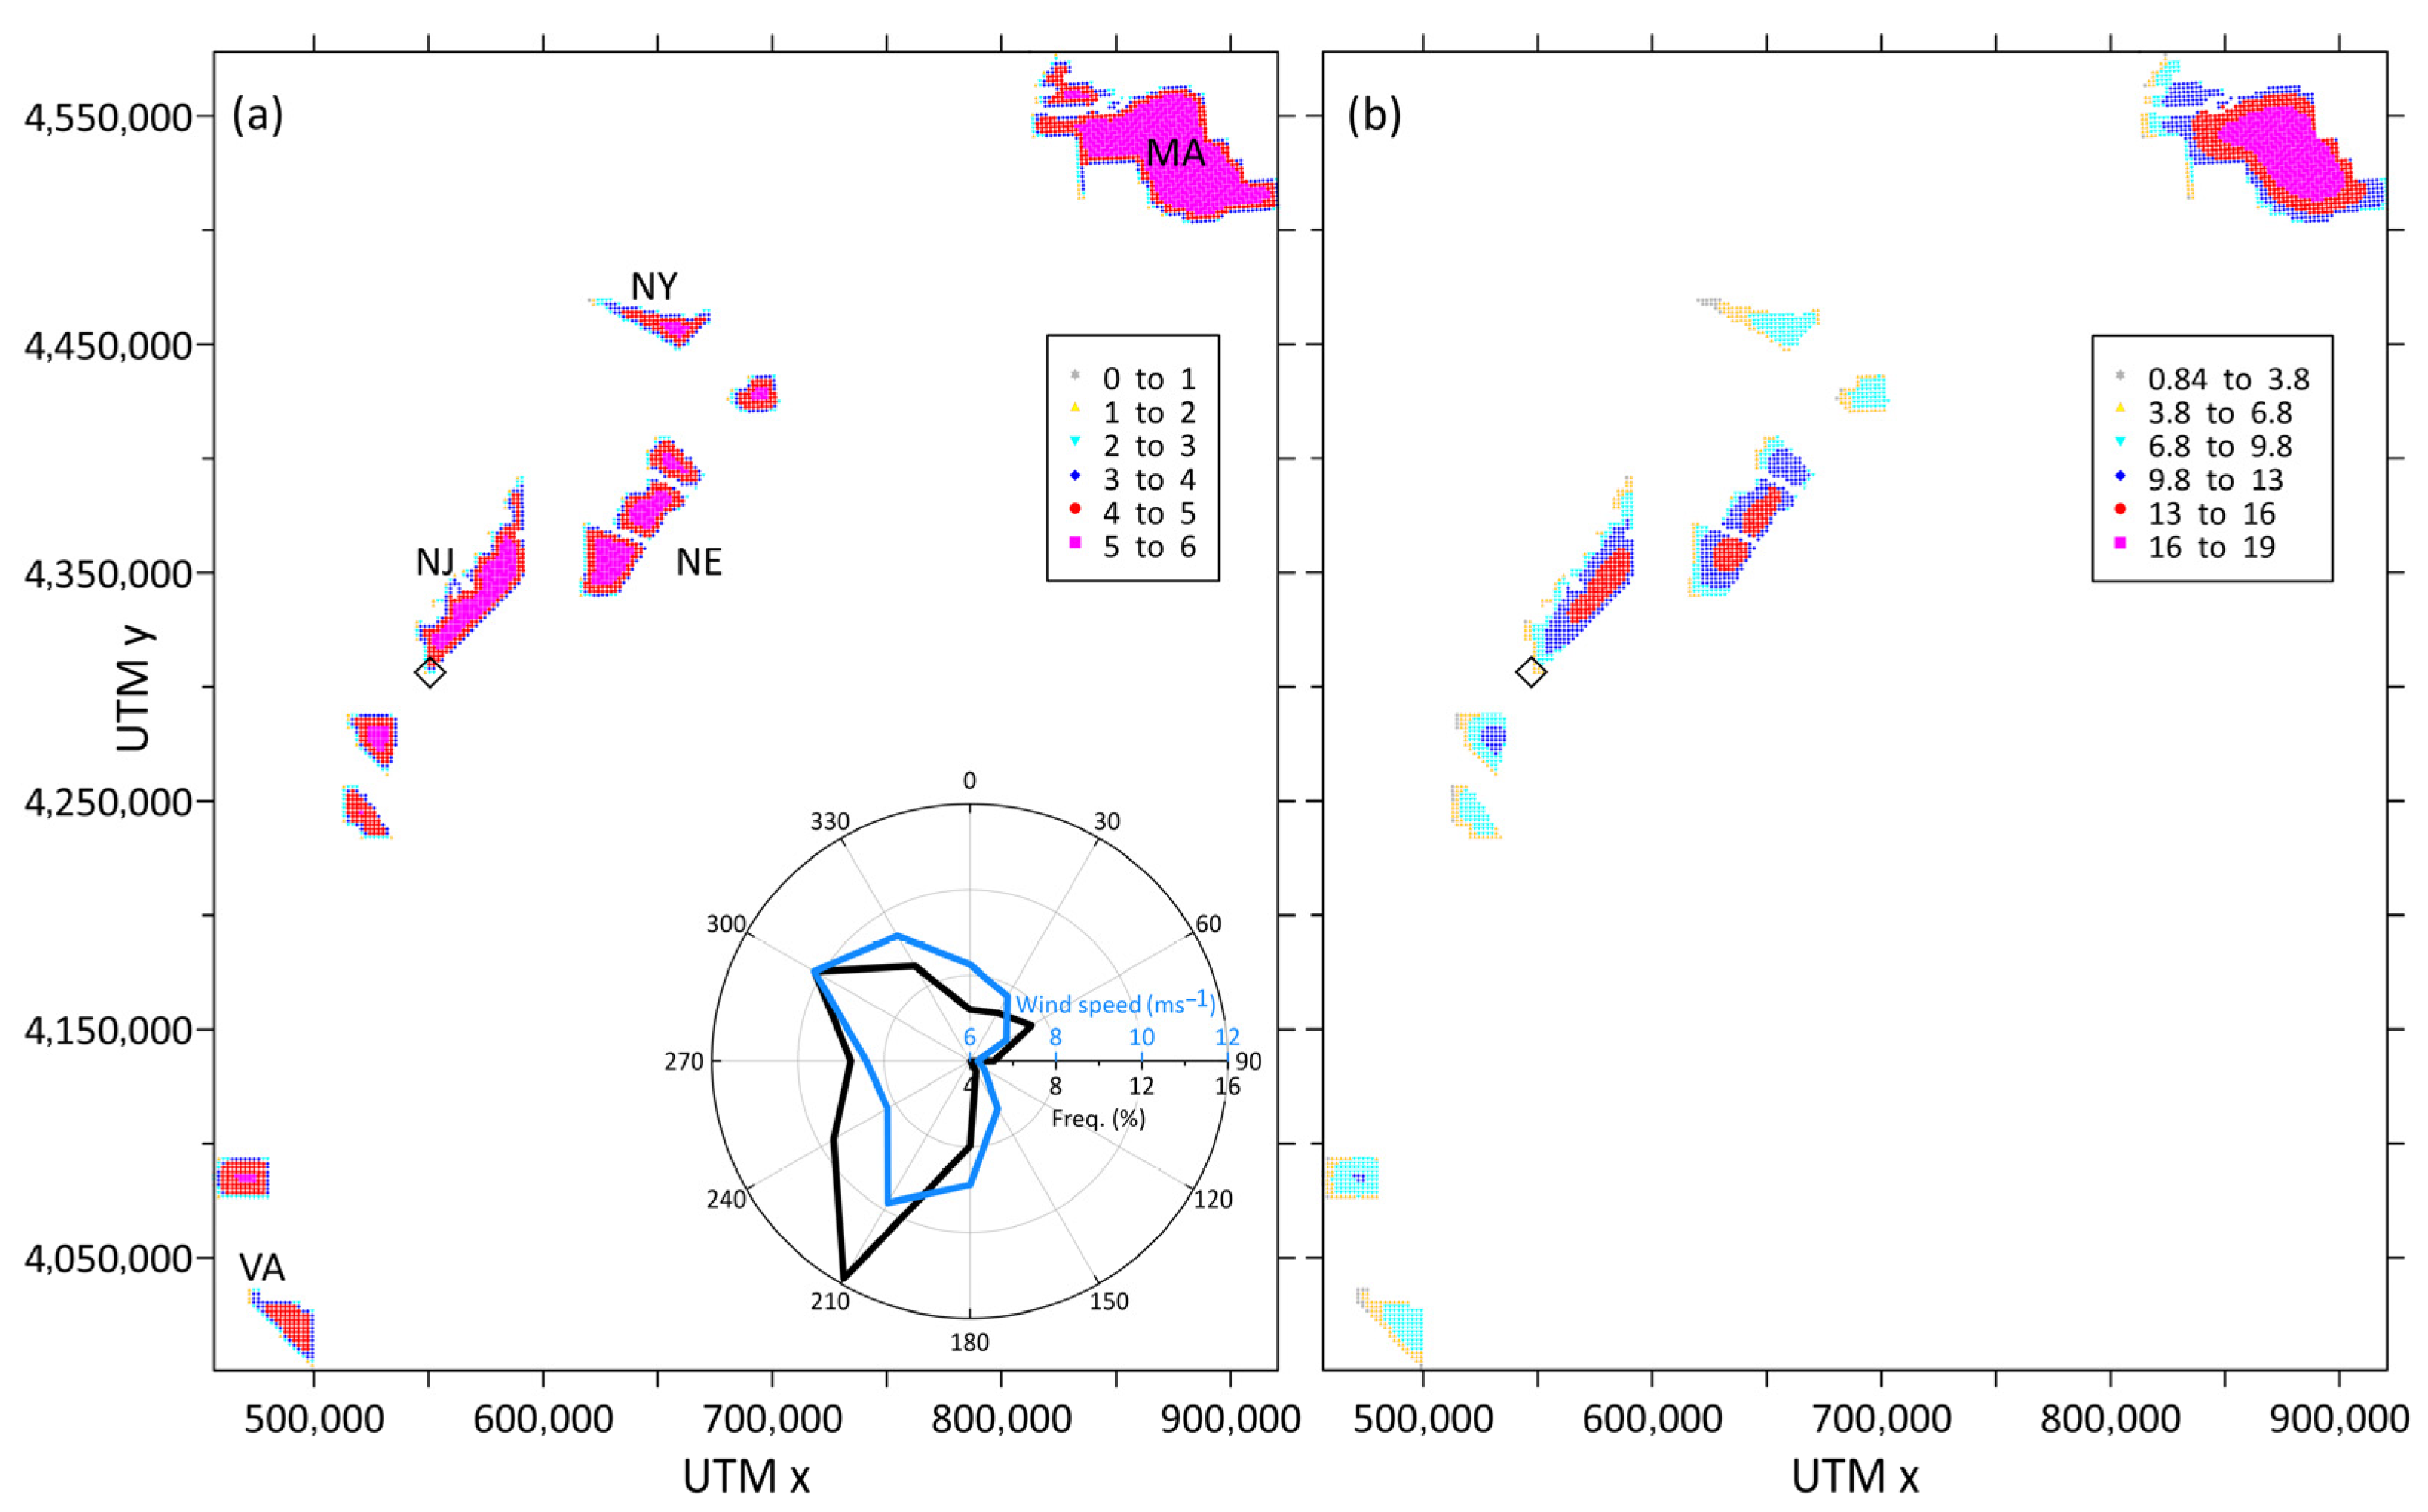
2.1.1. US East Coast
2.1.2. Humboldt LA
2.2. Wind Farm Design
2.3. Meteorological Data
- (1)
- ERA5 reanalysis dataset [42]. Hourly u- and v-wind components at 100 m height from 1979 to 2018 were used to compute wind speeds and directions. The abbreviations used to refer to these data are XXERA, where XX denotes the location:
- HUERA for a central location for the Humboldt LA. The mean wind speed is 9.3 ms−1 at 150 m height from the onsite floating lidar measurements (long-term adjusted using ERA5) [43].
- (2)
- National Renewable Energy Laboratory (NREL) National Offshore Wind dataset (NOW-23) [44] comprises output from a twenty-one-year simulation with the Weather Research and Forecasting (WRF) model. Wind speeds and directions at 150 m were extracted for both Humboldt and Vineyard locations (HUNOW and VYNOW).
- (3)
- Buoy datasets. For Humboldt LA, in addition to the WRF and ERA5 datasets described above, data from a floating lidar buoy are available (FLidar) [43]. The Leosphere Windcube 866 was deployed off the coast of California at 40.97° N and 124.59° W in a water depth of ~580 m. The data period used here is 8 October 2020 to 29 June 2022 and there are 12 measurement heights from 40 m to 240 m in 20 m intervals, with data collected at additional height of 90 m. It is challenging to maintain a measurement stream from the floating lidar and so the number of observations in each calendar month varies from 2588 in March to 8497 in June. To create a representative dataset Flidar data were ‘corrected’ to a long-term dataset using the measure-correlate-predict method described below [45]. The data are from National Data Buoy Center (NDBC) buoy 46022 height for 1982–2022 [46]. The NDBC buoy location is 40.748° N, 124.527° W and it operates in water depth of 456 m. The dataset is nearly complete with very few years having less than 50% data recovery, and overall data recovery is 82.5%.
- Identify overlapping 10 min wind speed periods in 2020, 2021 and 2022 (a total of 58,305 10 min periods) between FLidar at 160 m height and the NDBC buoy 3.7 m wind speeds. The seasonal distribution of the overlapping data is December, January, February; 22.7%, March, April, May; 21.2% June, July, August; 28.8%, September, October, November; 27.2% which is broadly representative for this purpose.
- Use linear regression to find a relationship between the 10 min NDBC buoy wind speeds at 3.8 m height to FLidar at 160 m from these overlapping data:
- Apply Equation (4) to reconstruct wind speeds at 160 m (Recon) for 1982–2022 at Humboldt LA.
- Wind directions were used directly from the NDBC data buoy 46022 without any adjustment.
- In the following simulations, the reconstructed dataset (Recon) is used in preference to the Flidar data.
2.4. Wake Modeling: Microscale
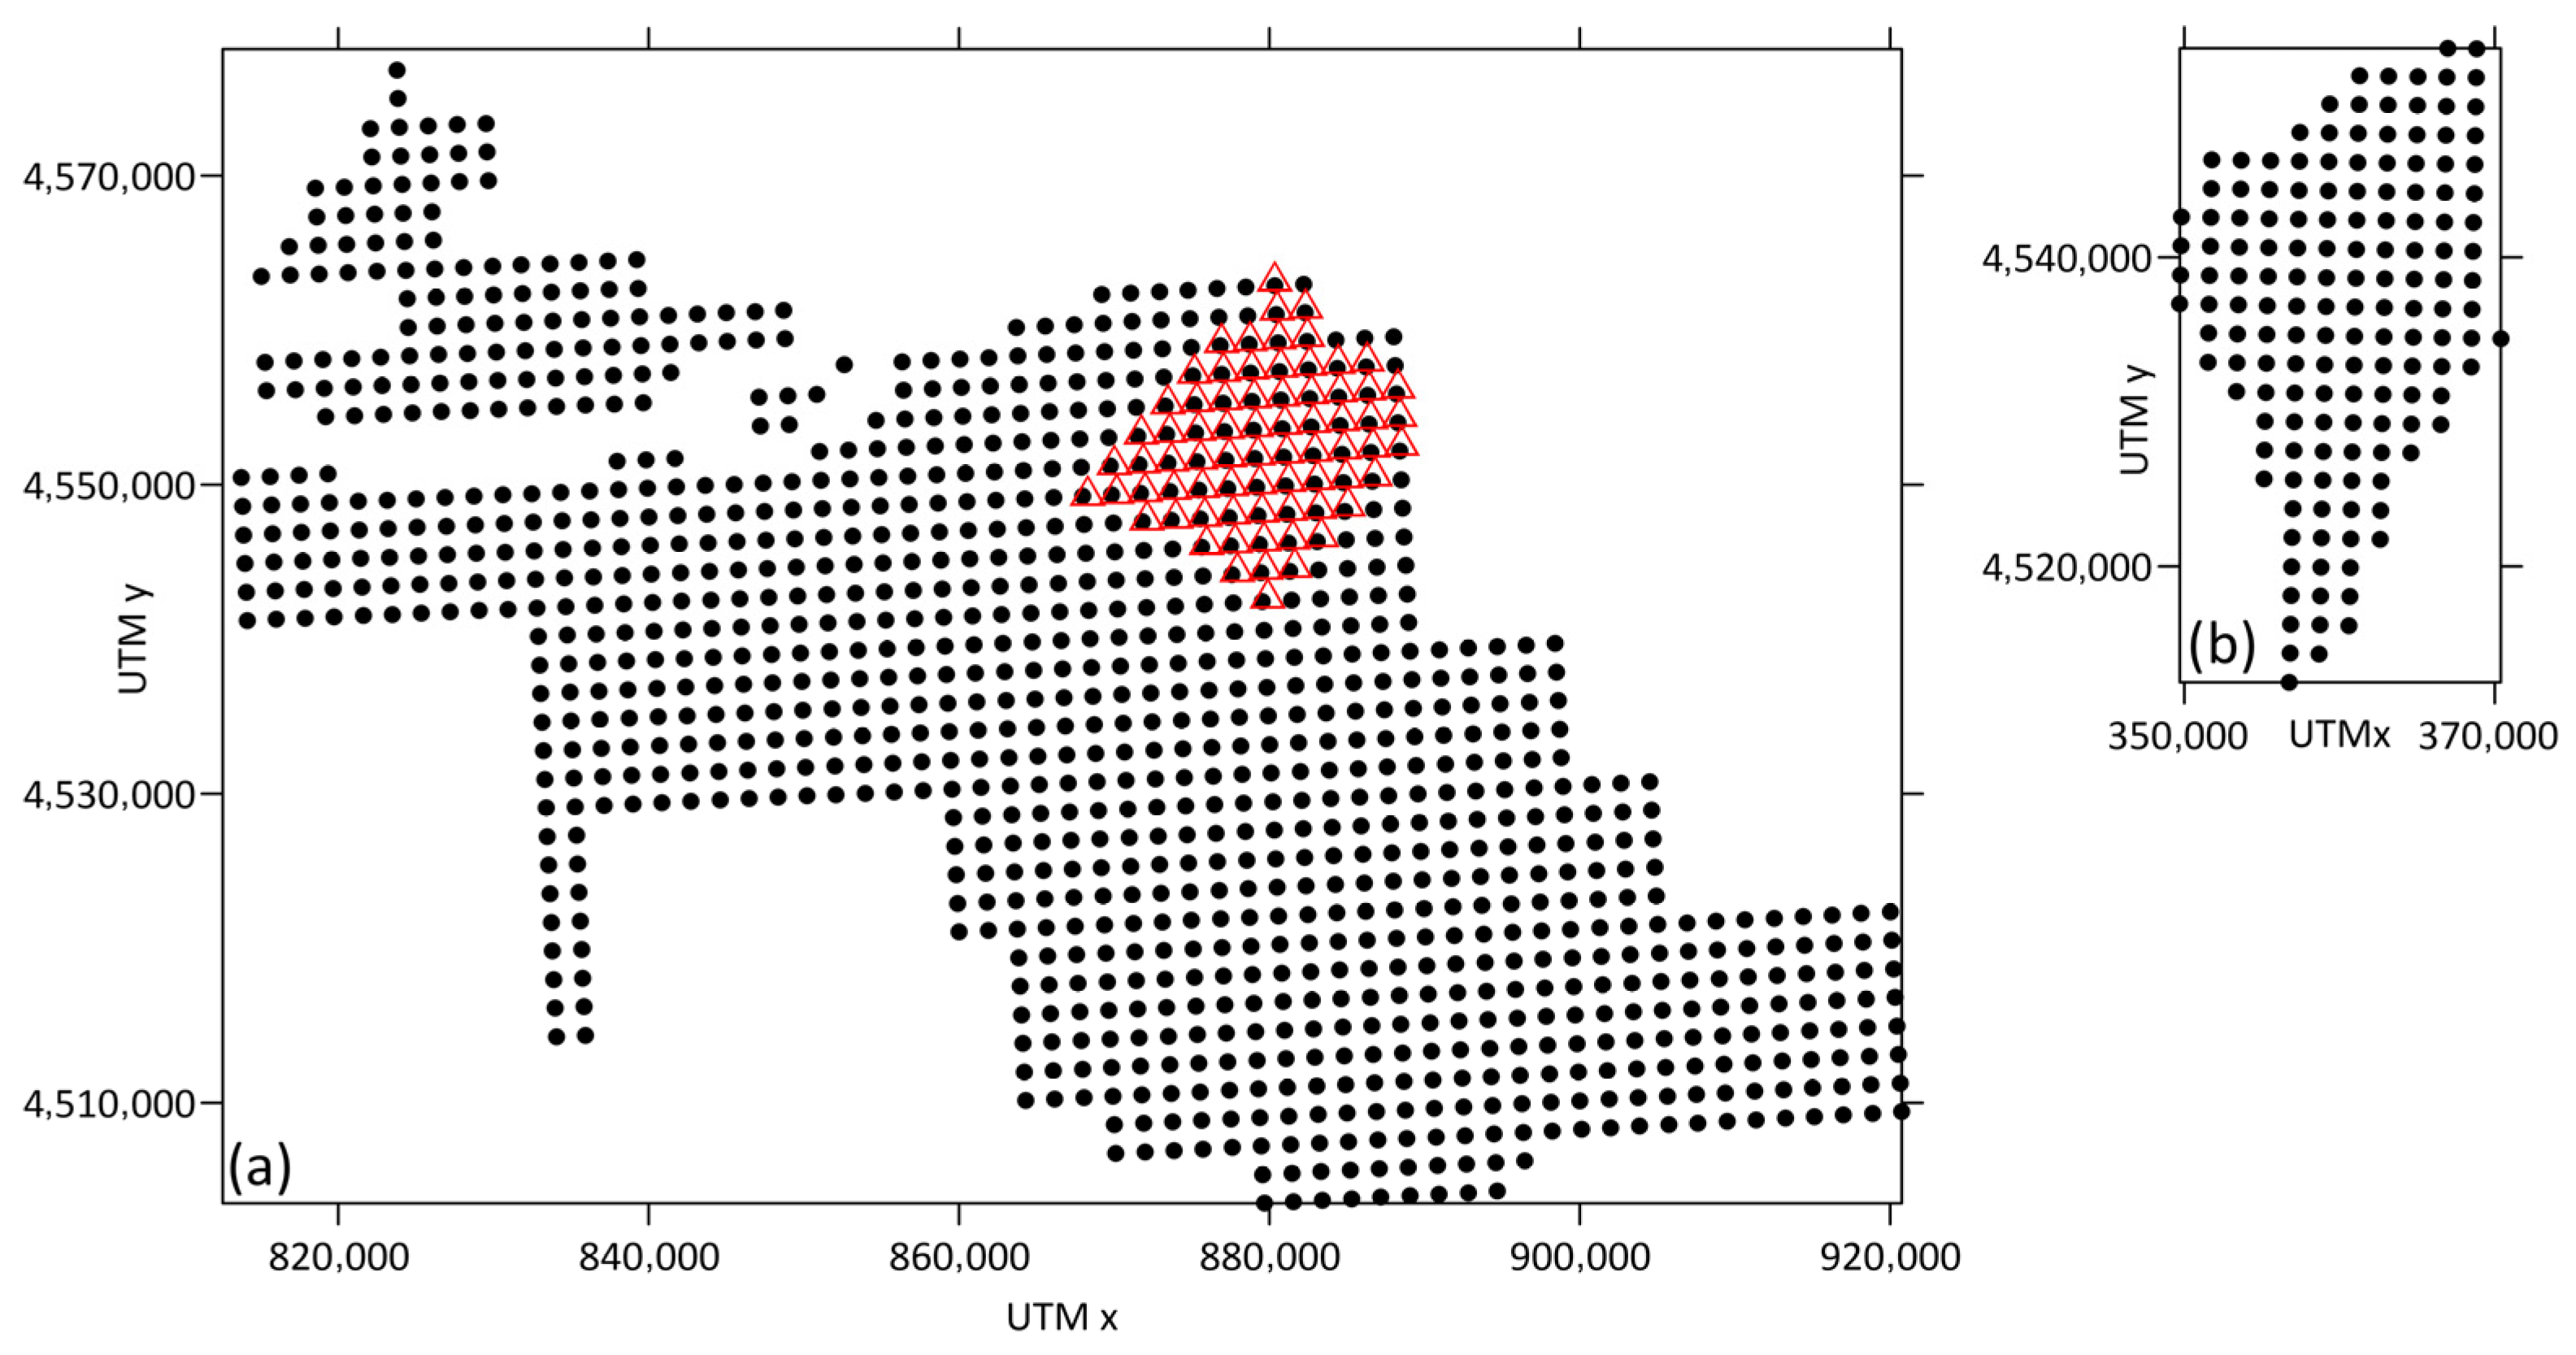
- Wind turbine locations (in UTM)
- Wind turbine power and thrust curves, and dimensions
- Site wind climate (Frequency, Weibull scale and shape parameters in twelve directional sectors).
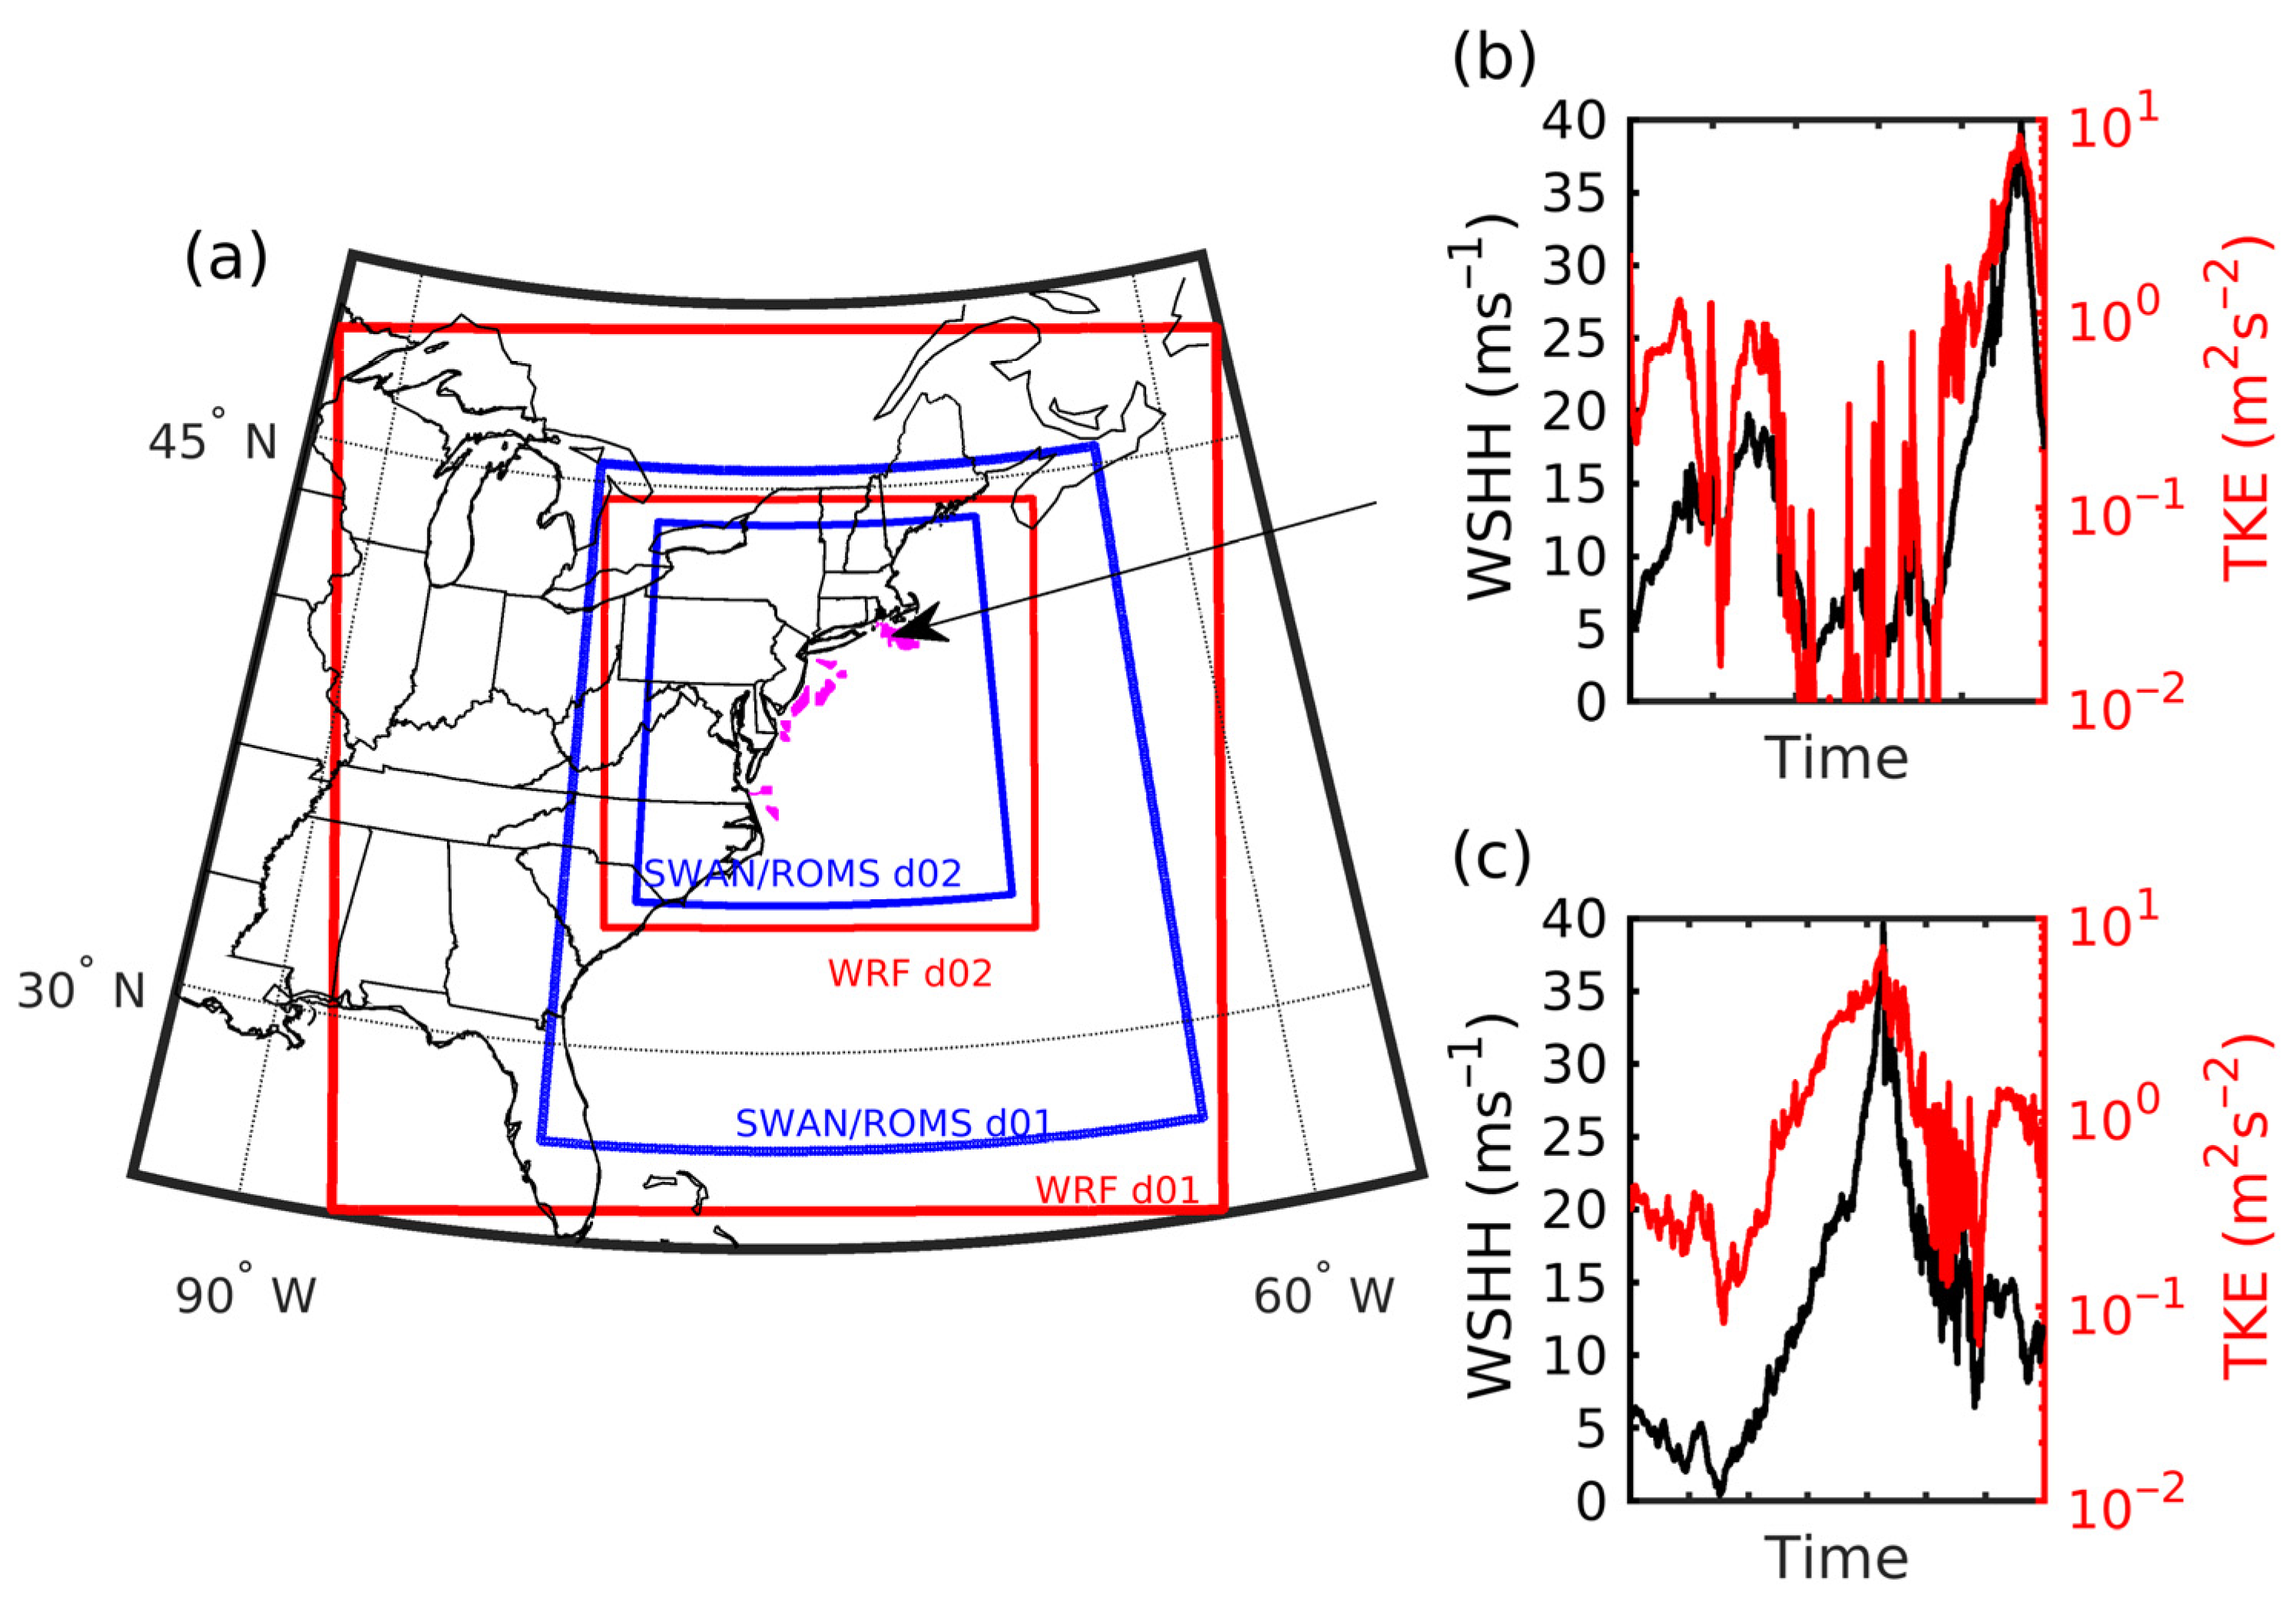
2.5. Wake Modeling: Mesoscale
3. Results from Microscale Wake Modeling
3.1. All East Coast LA
3.2. Sensitivity of AEP and CF to Installed Capacity Density
3.2.1. MA
3.2.2. Humboldt
3.3. Sensitivity of AEP and CF to Wind Climate
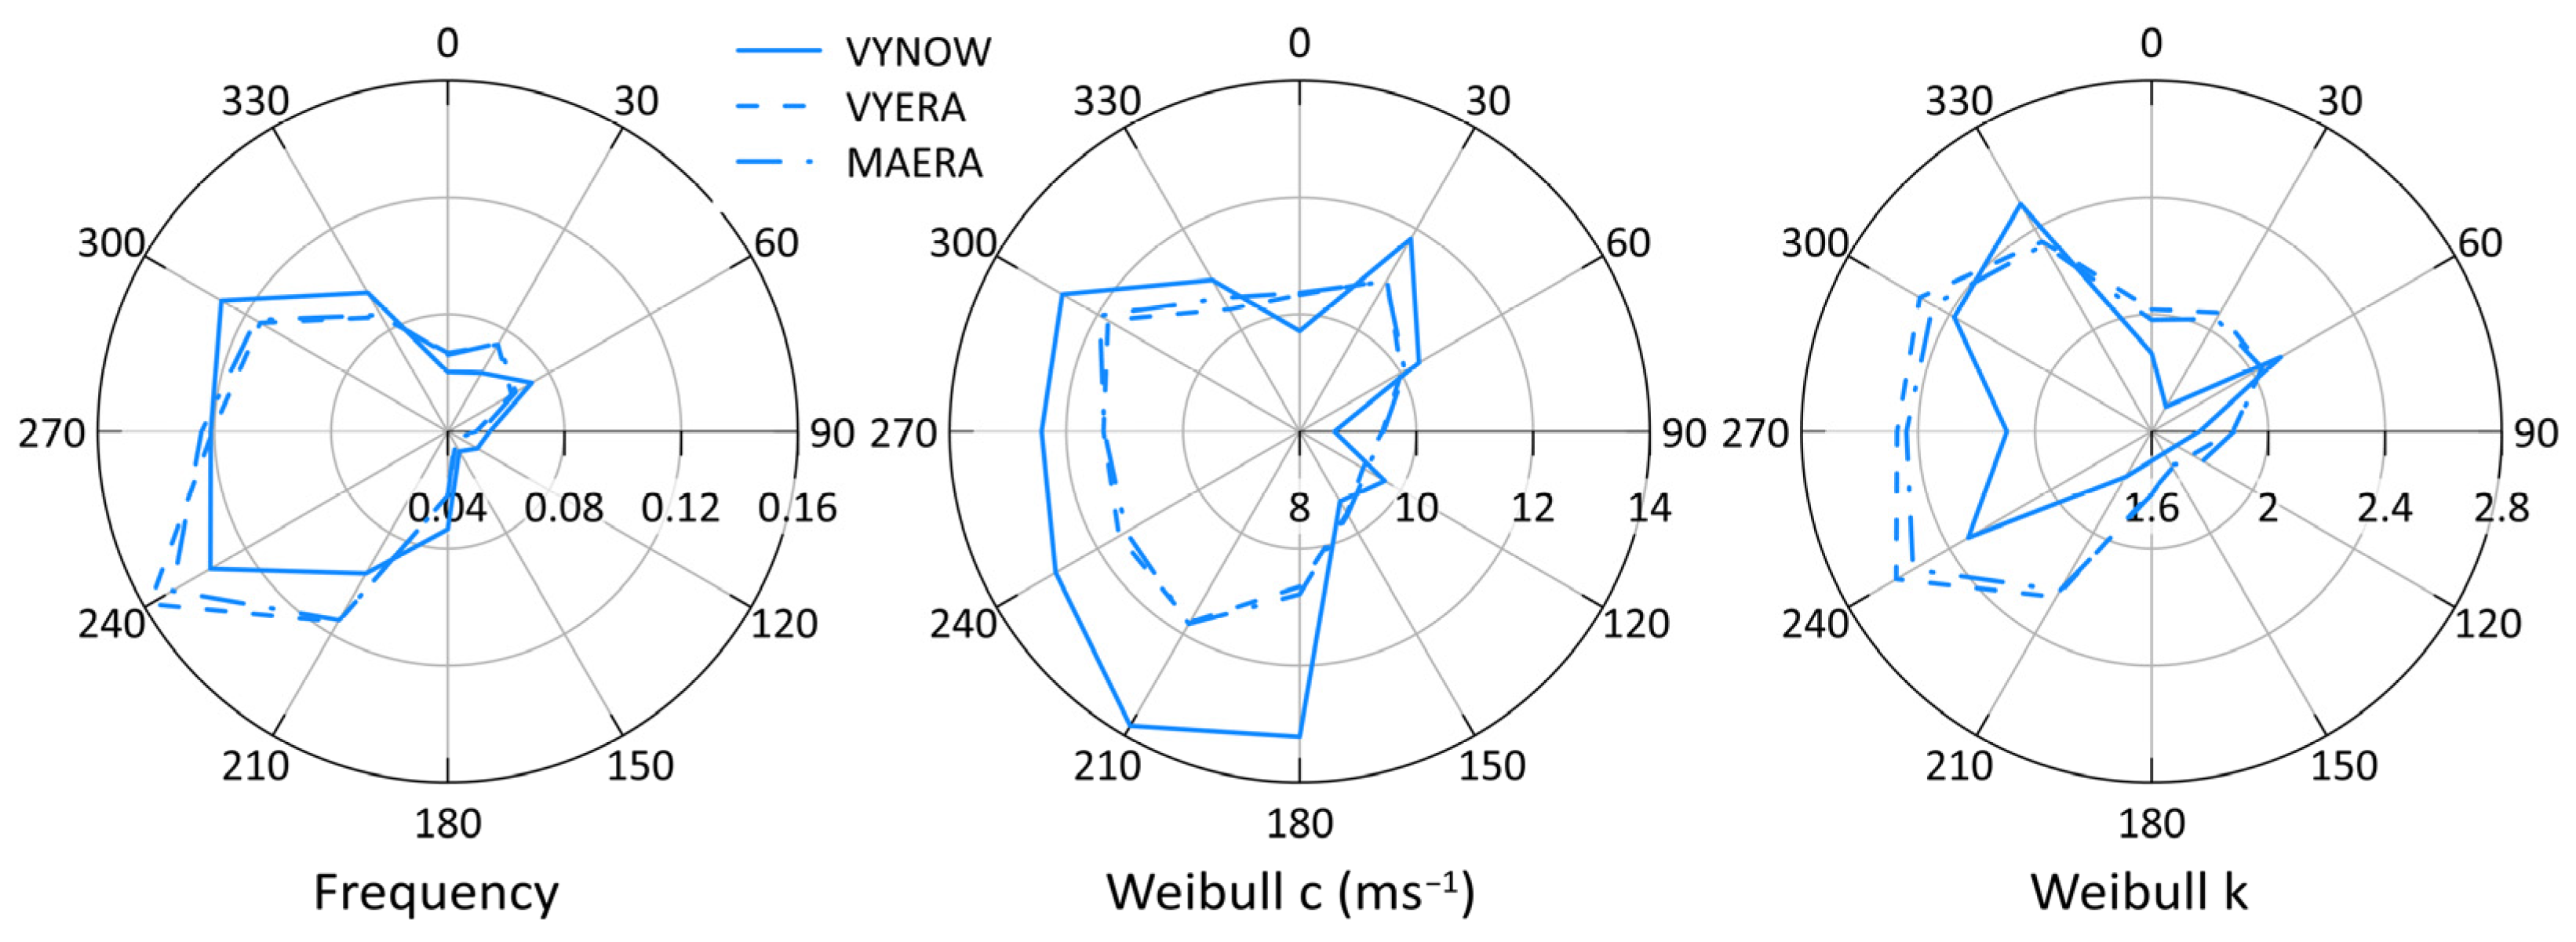
3.3.1. Vineyard Wind I
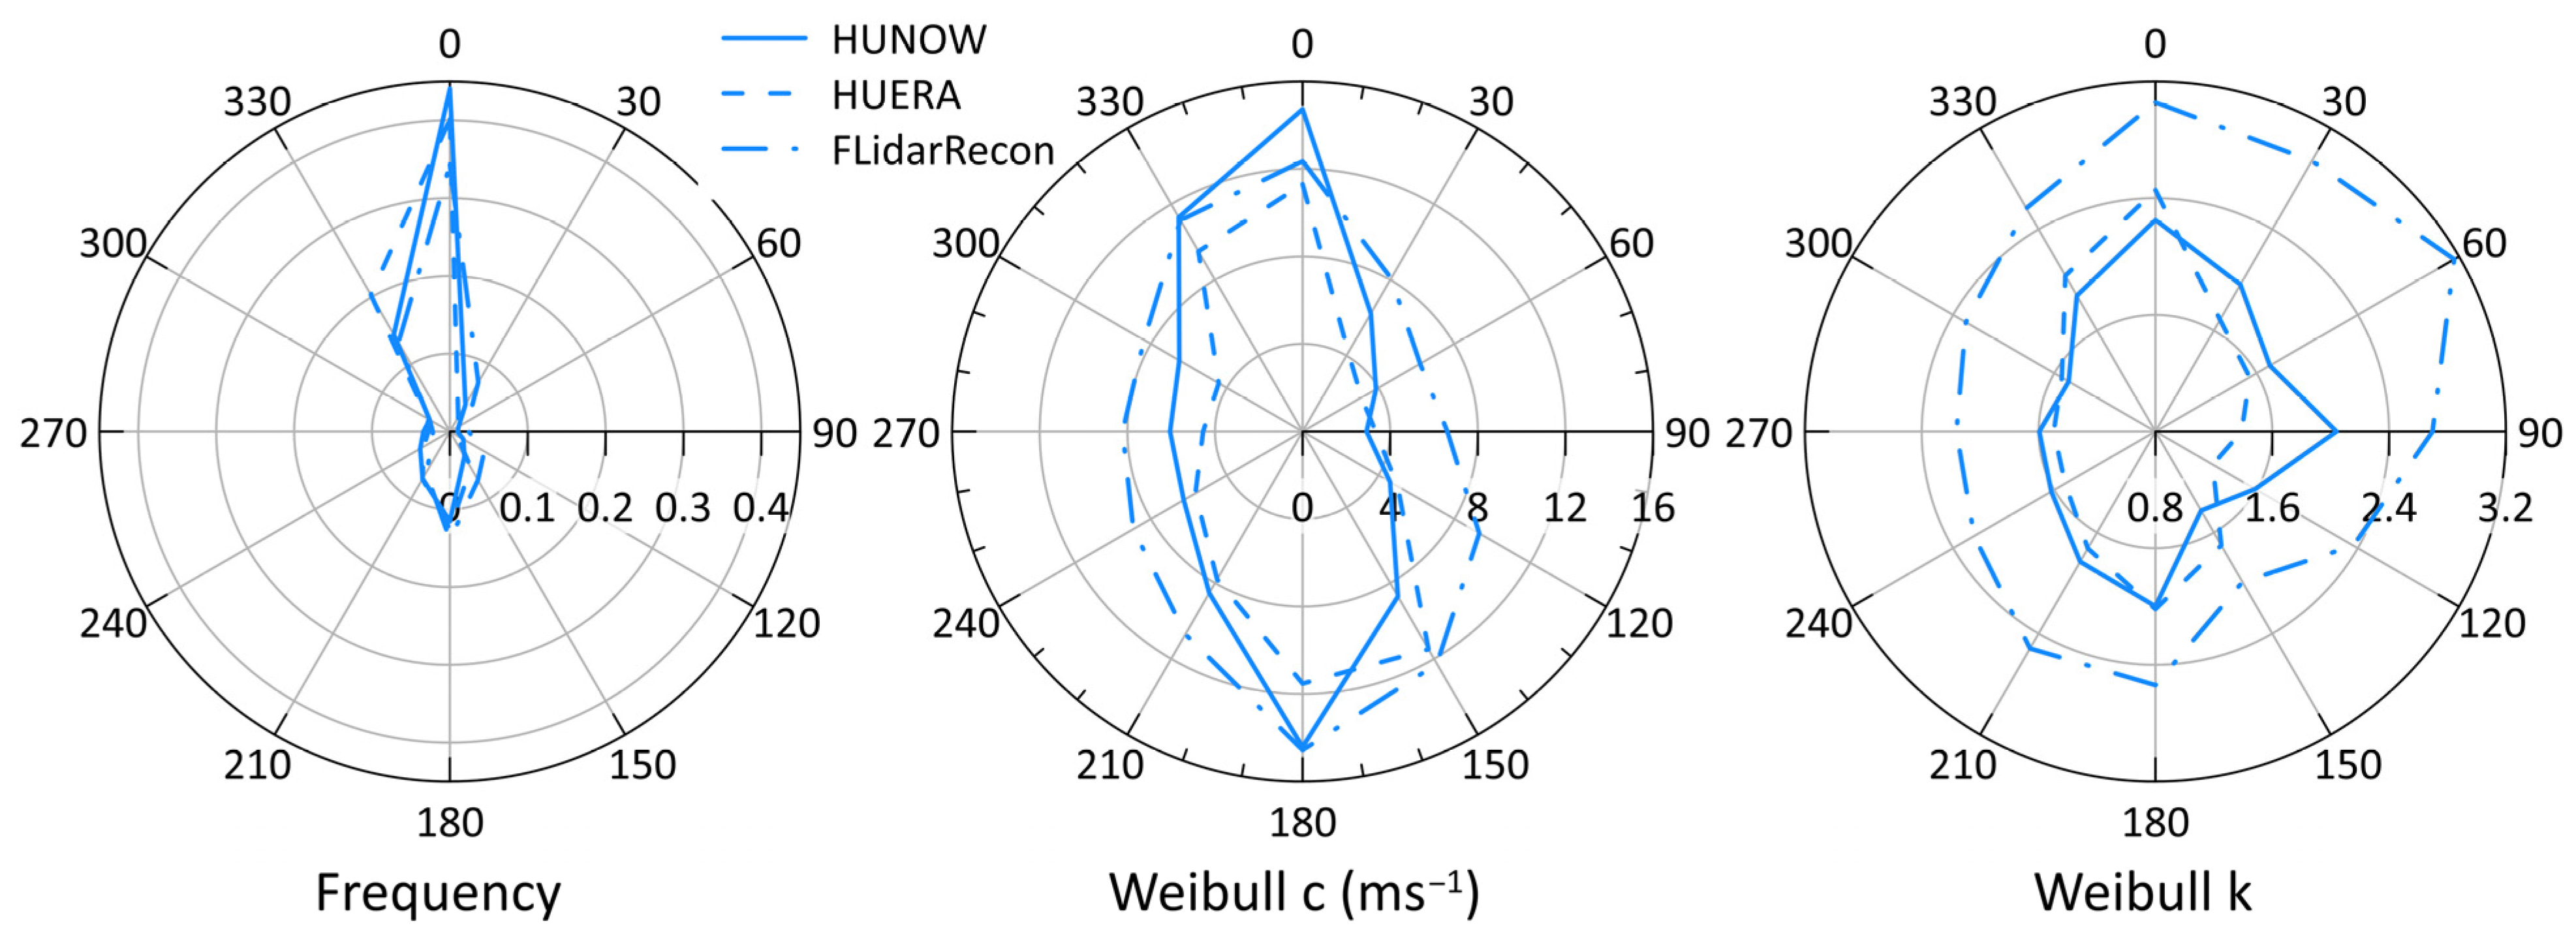
3.3.2. Humboldt
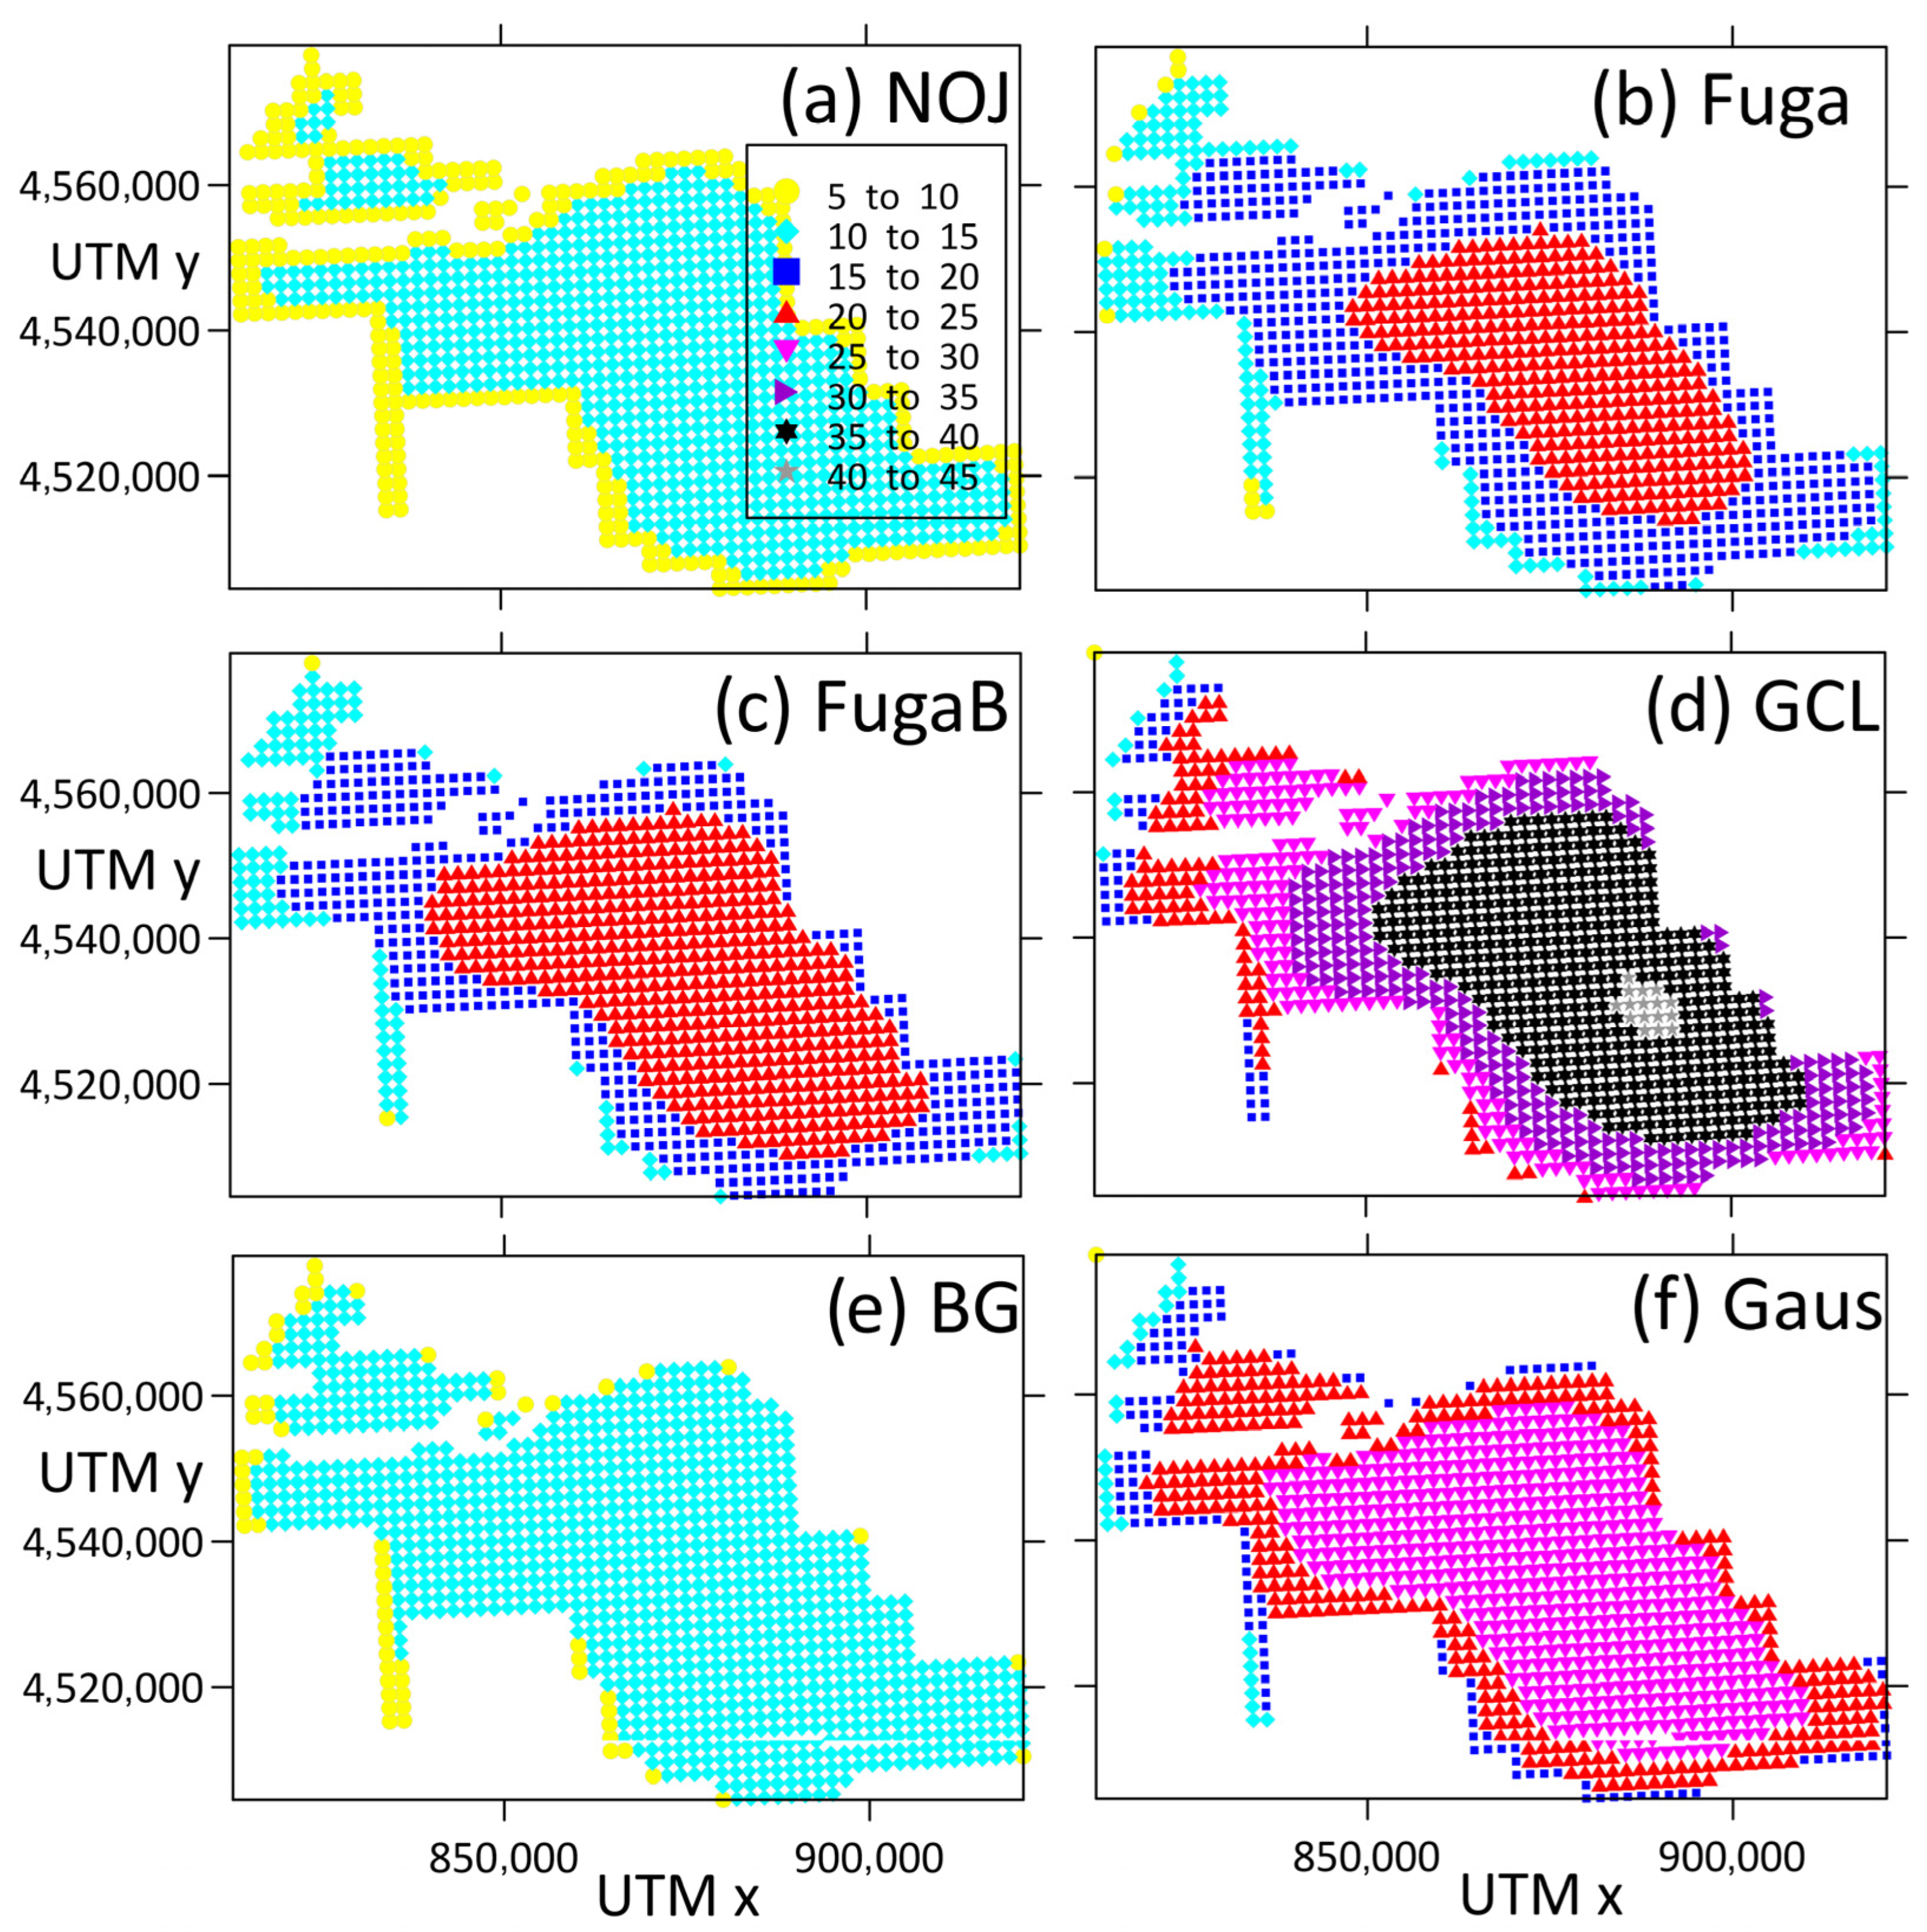
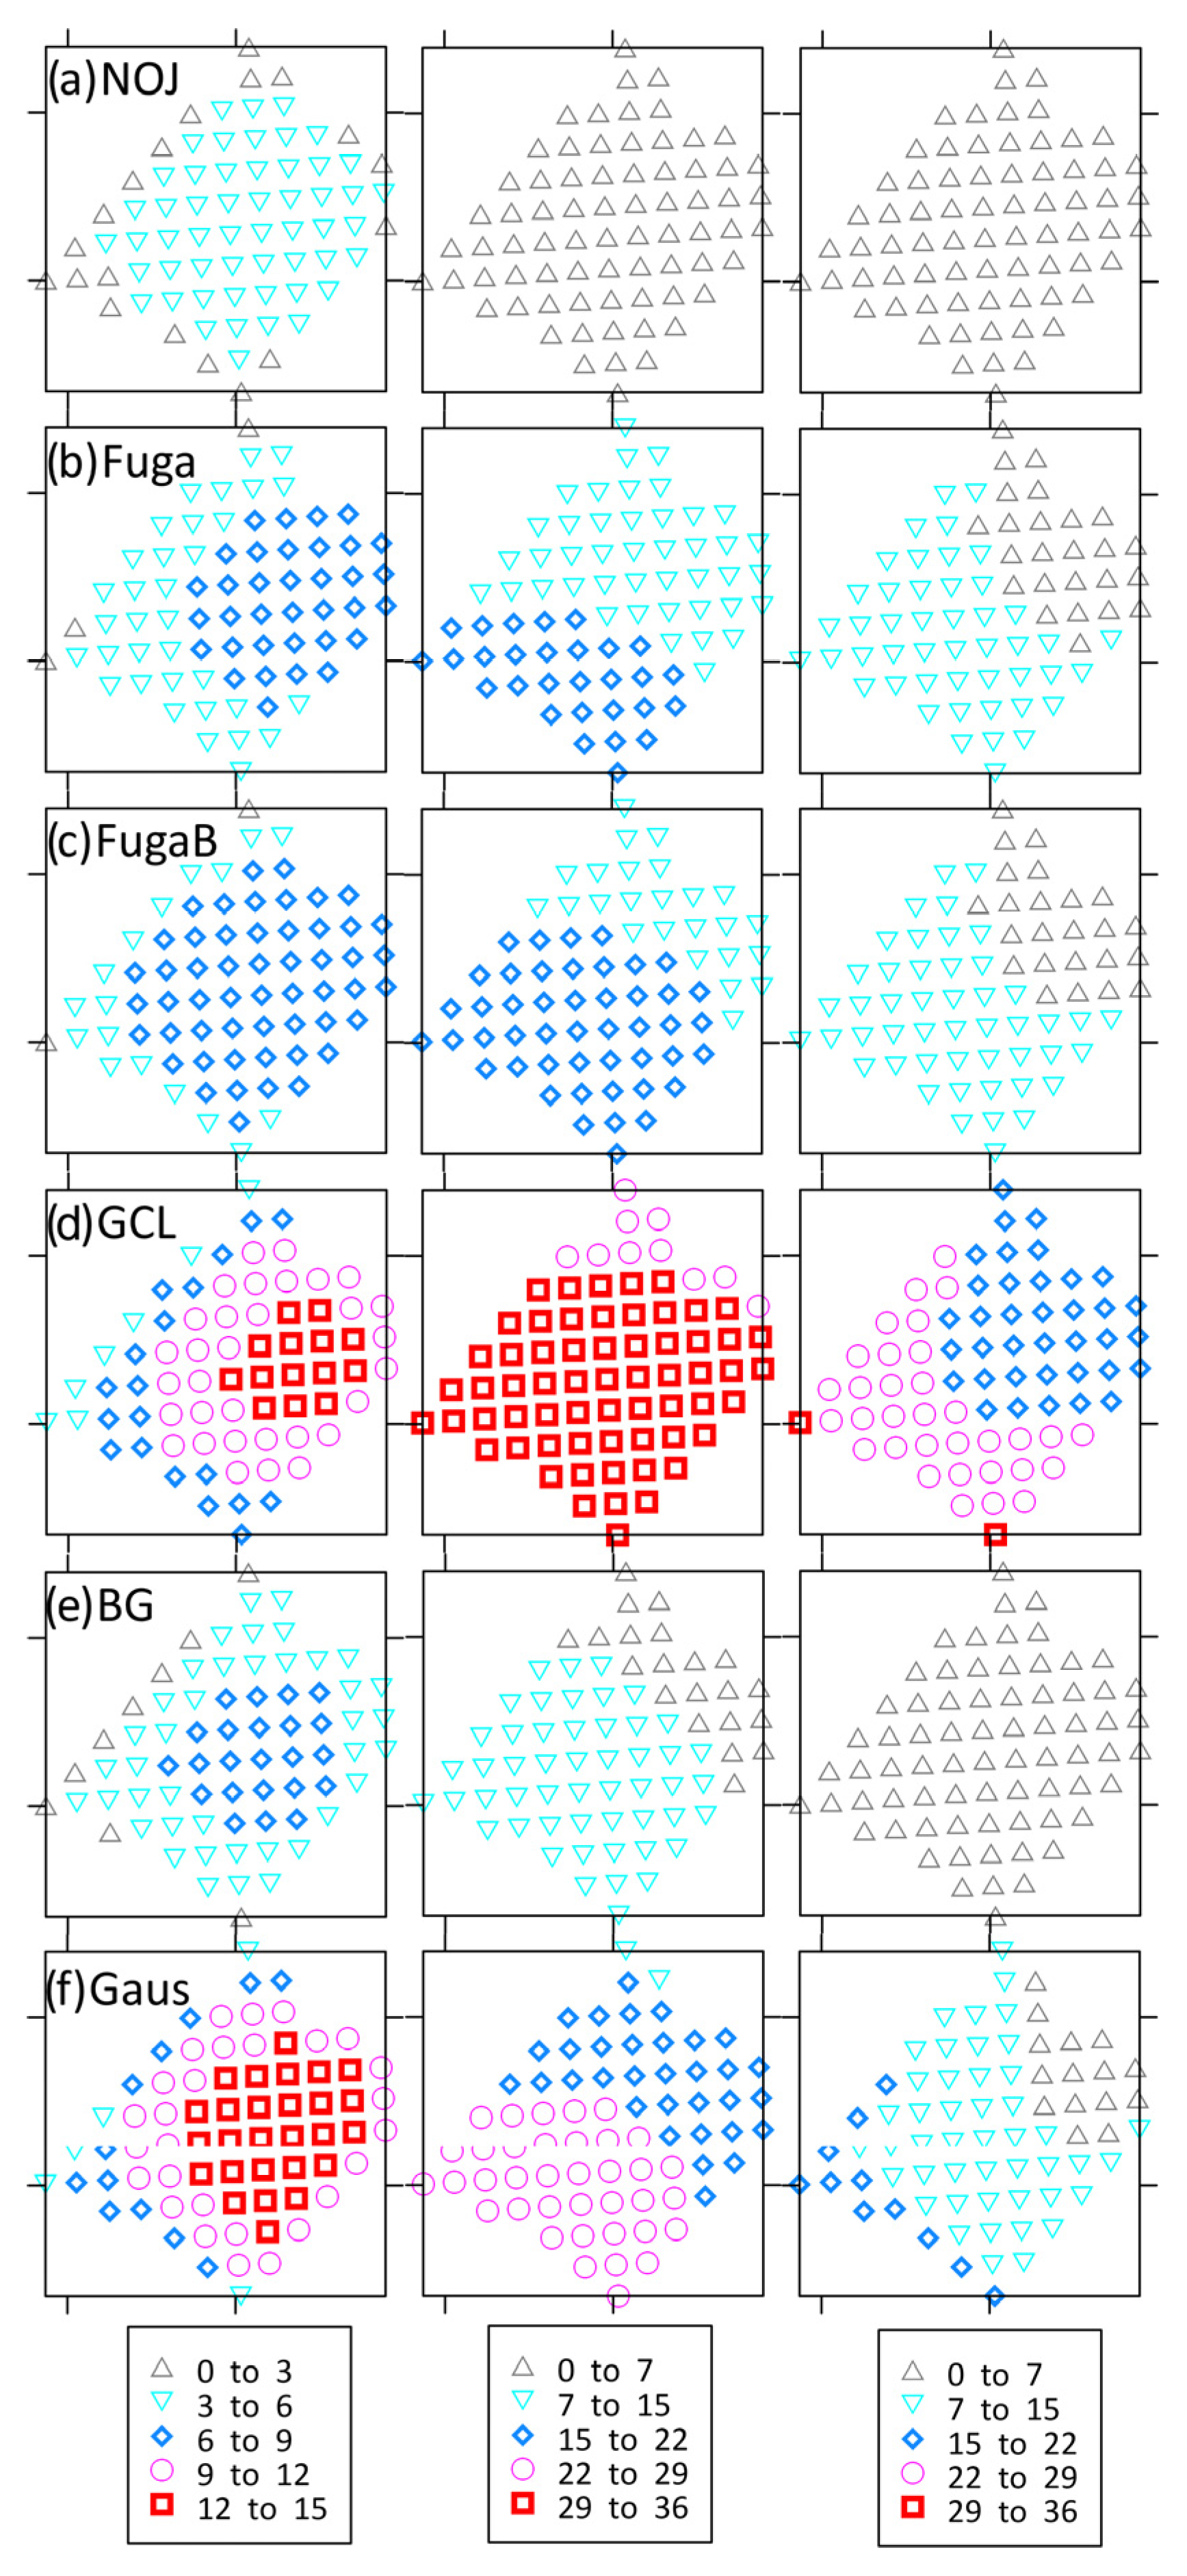
3.4. Sensitivity to Wake Parameterization
3.4.1. MA
3.4.2. Humboldt
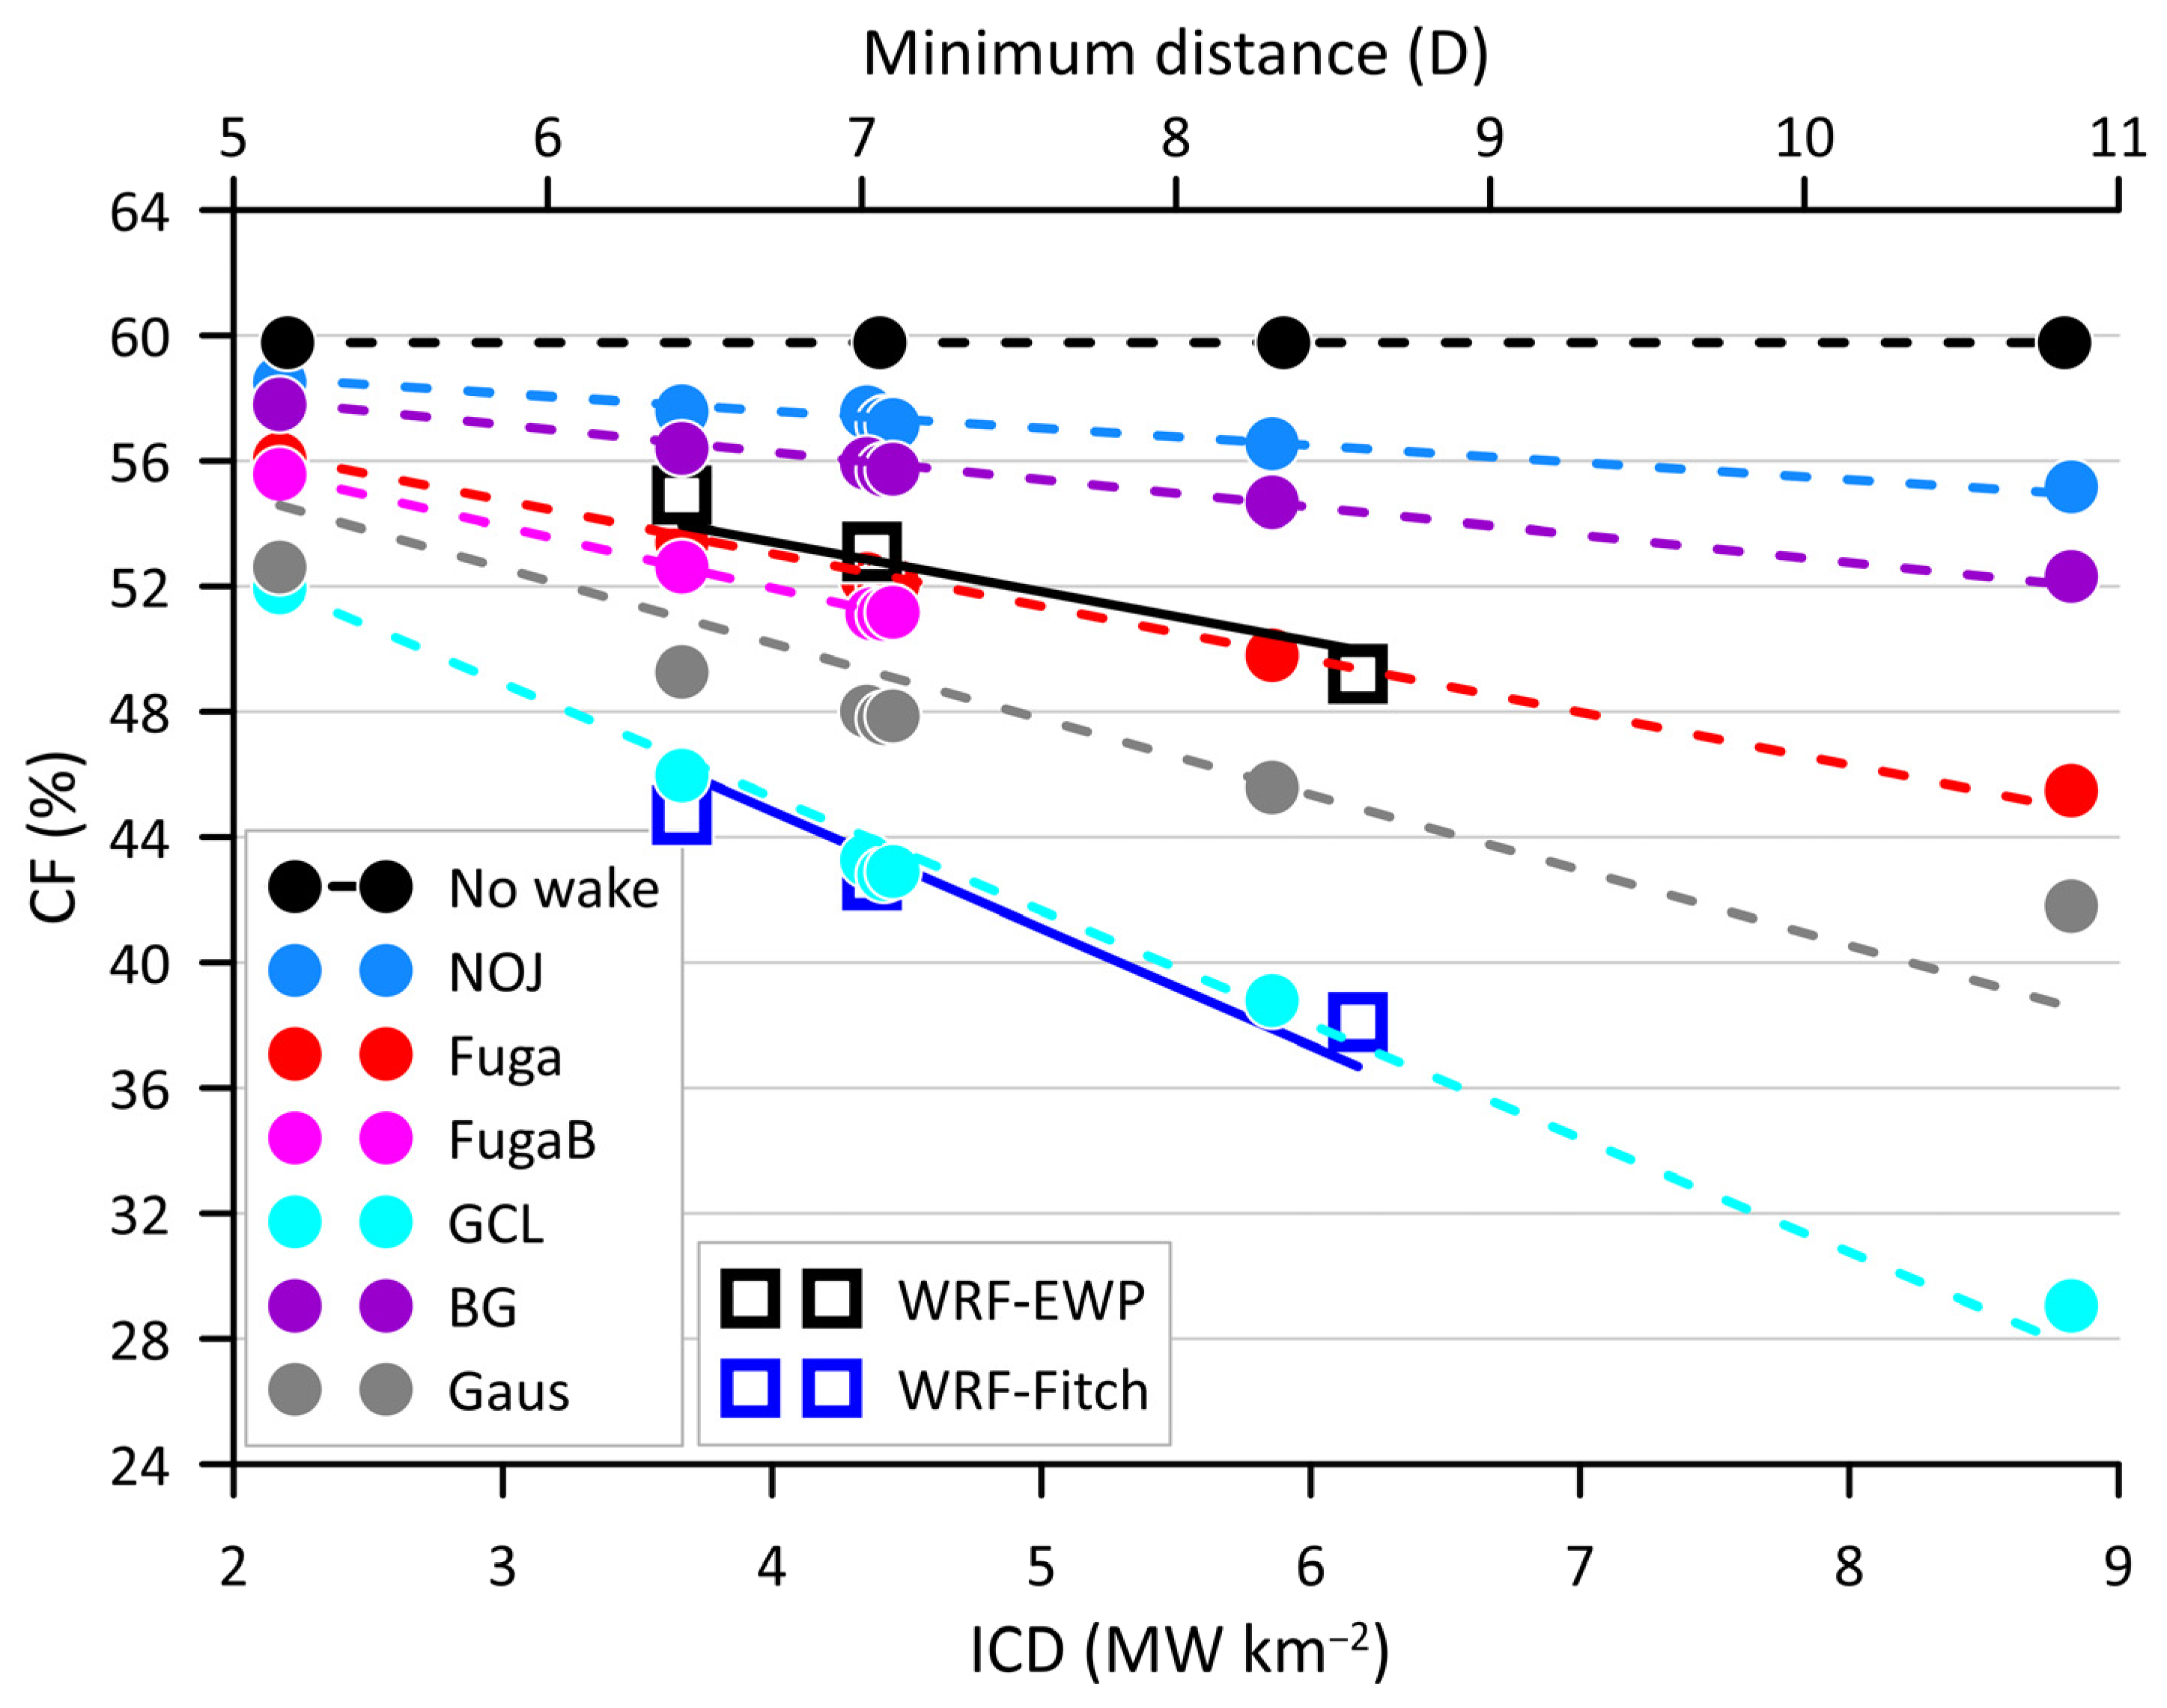
- Wake losses from the six different parameterizations span a range of 3.7 to 17.7% of AEP for the layout comprising 151 turbines at the CNTR spacing (i.e., ICD of 4.2 MW km−2). This is much greater than the sensitivity to the wind climate, range of 14.1–17.7% with GCL wake parameterization (HUNOW v HUERA). For comparison mean wake losses modeled with FLORIS using a WRF wind climate [78] for an ICD of 5.7 MW km−2 are 5–6% [19].
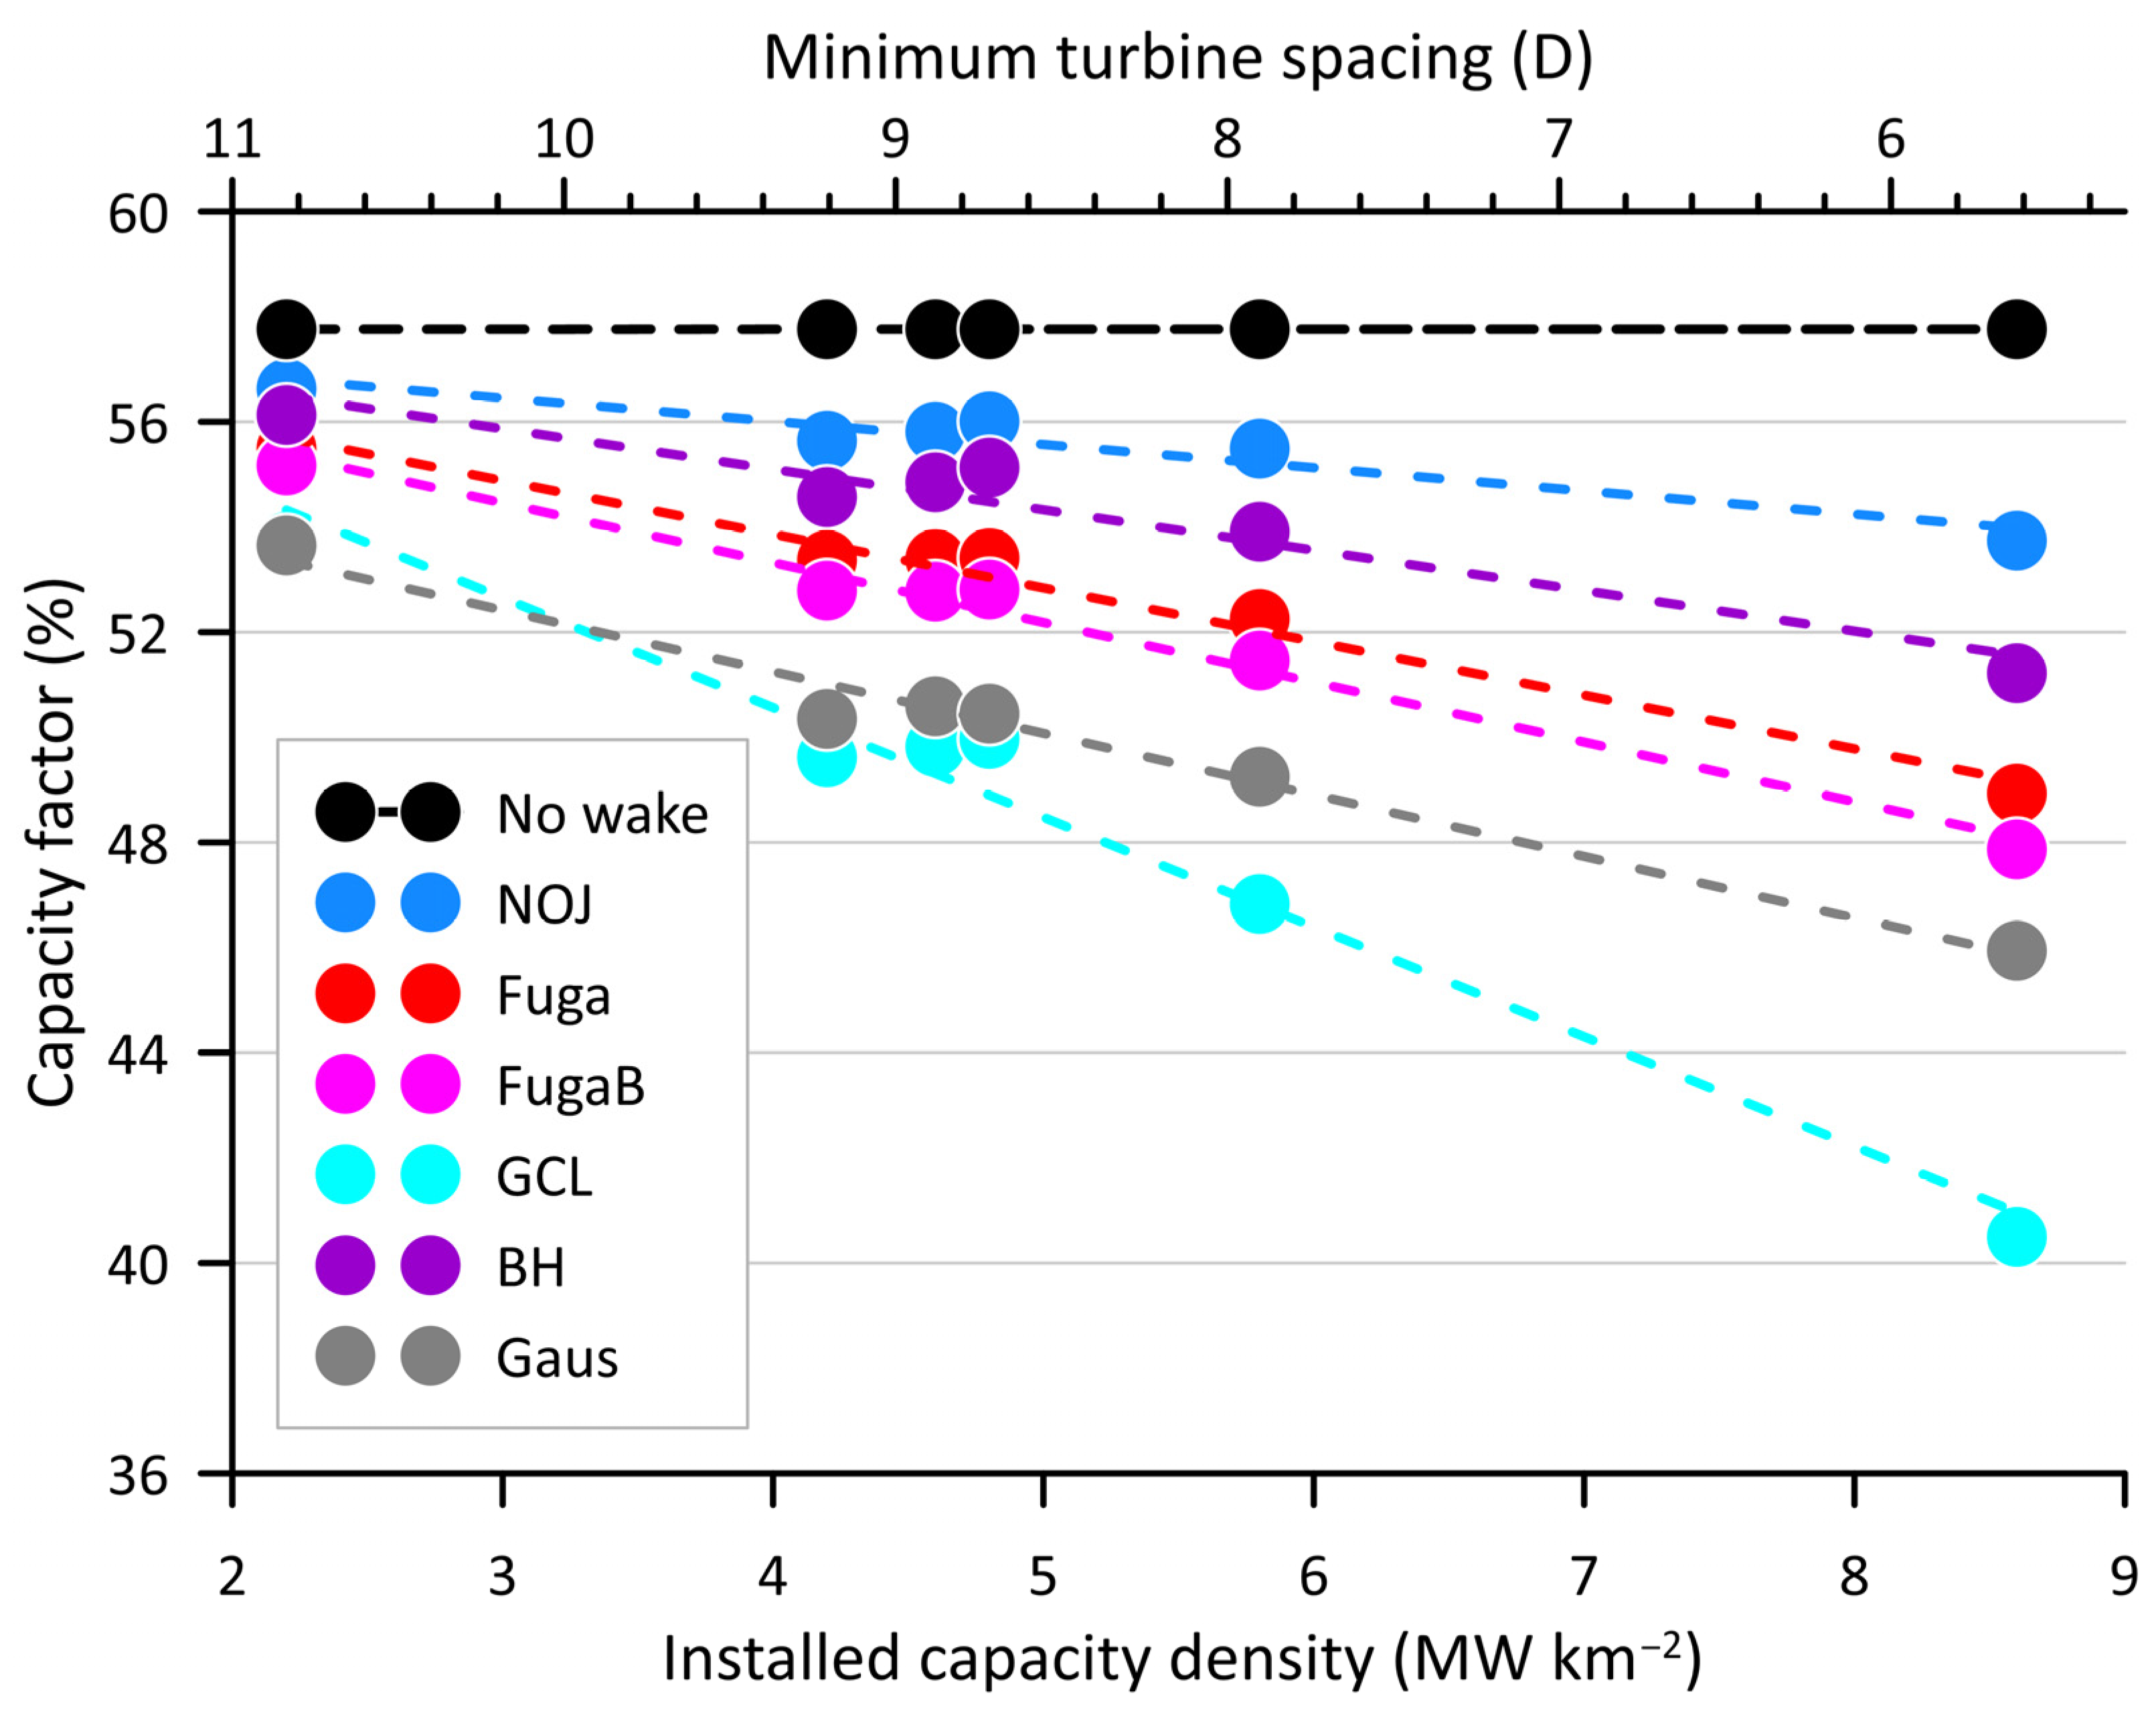
- CF exhibit modest sensitivity to increase wind turbine spacing in the S-N direction (the cluster of points at ICD~4.5 MW km−2 depict these different layouts; CNTR, LONG, LLNG) of up to 1.5 percentage points for some wake parameterizations.
- The change in CF with increasing ICD is most pronounced for the GCL wake parameterization. For this size of wind farm and ICD, CF (and wake loss) responses to ICD are close to linear (Figure 10). In the case of the GCL wake parameterization, linear fitting to the results implies a 2-percentage-point reduction in CF for each 1 MW km−2 increment in ICD (Table 7).
3.4.3. VY
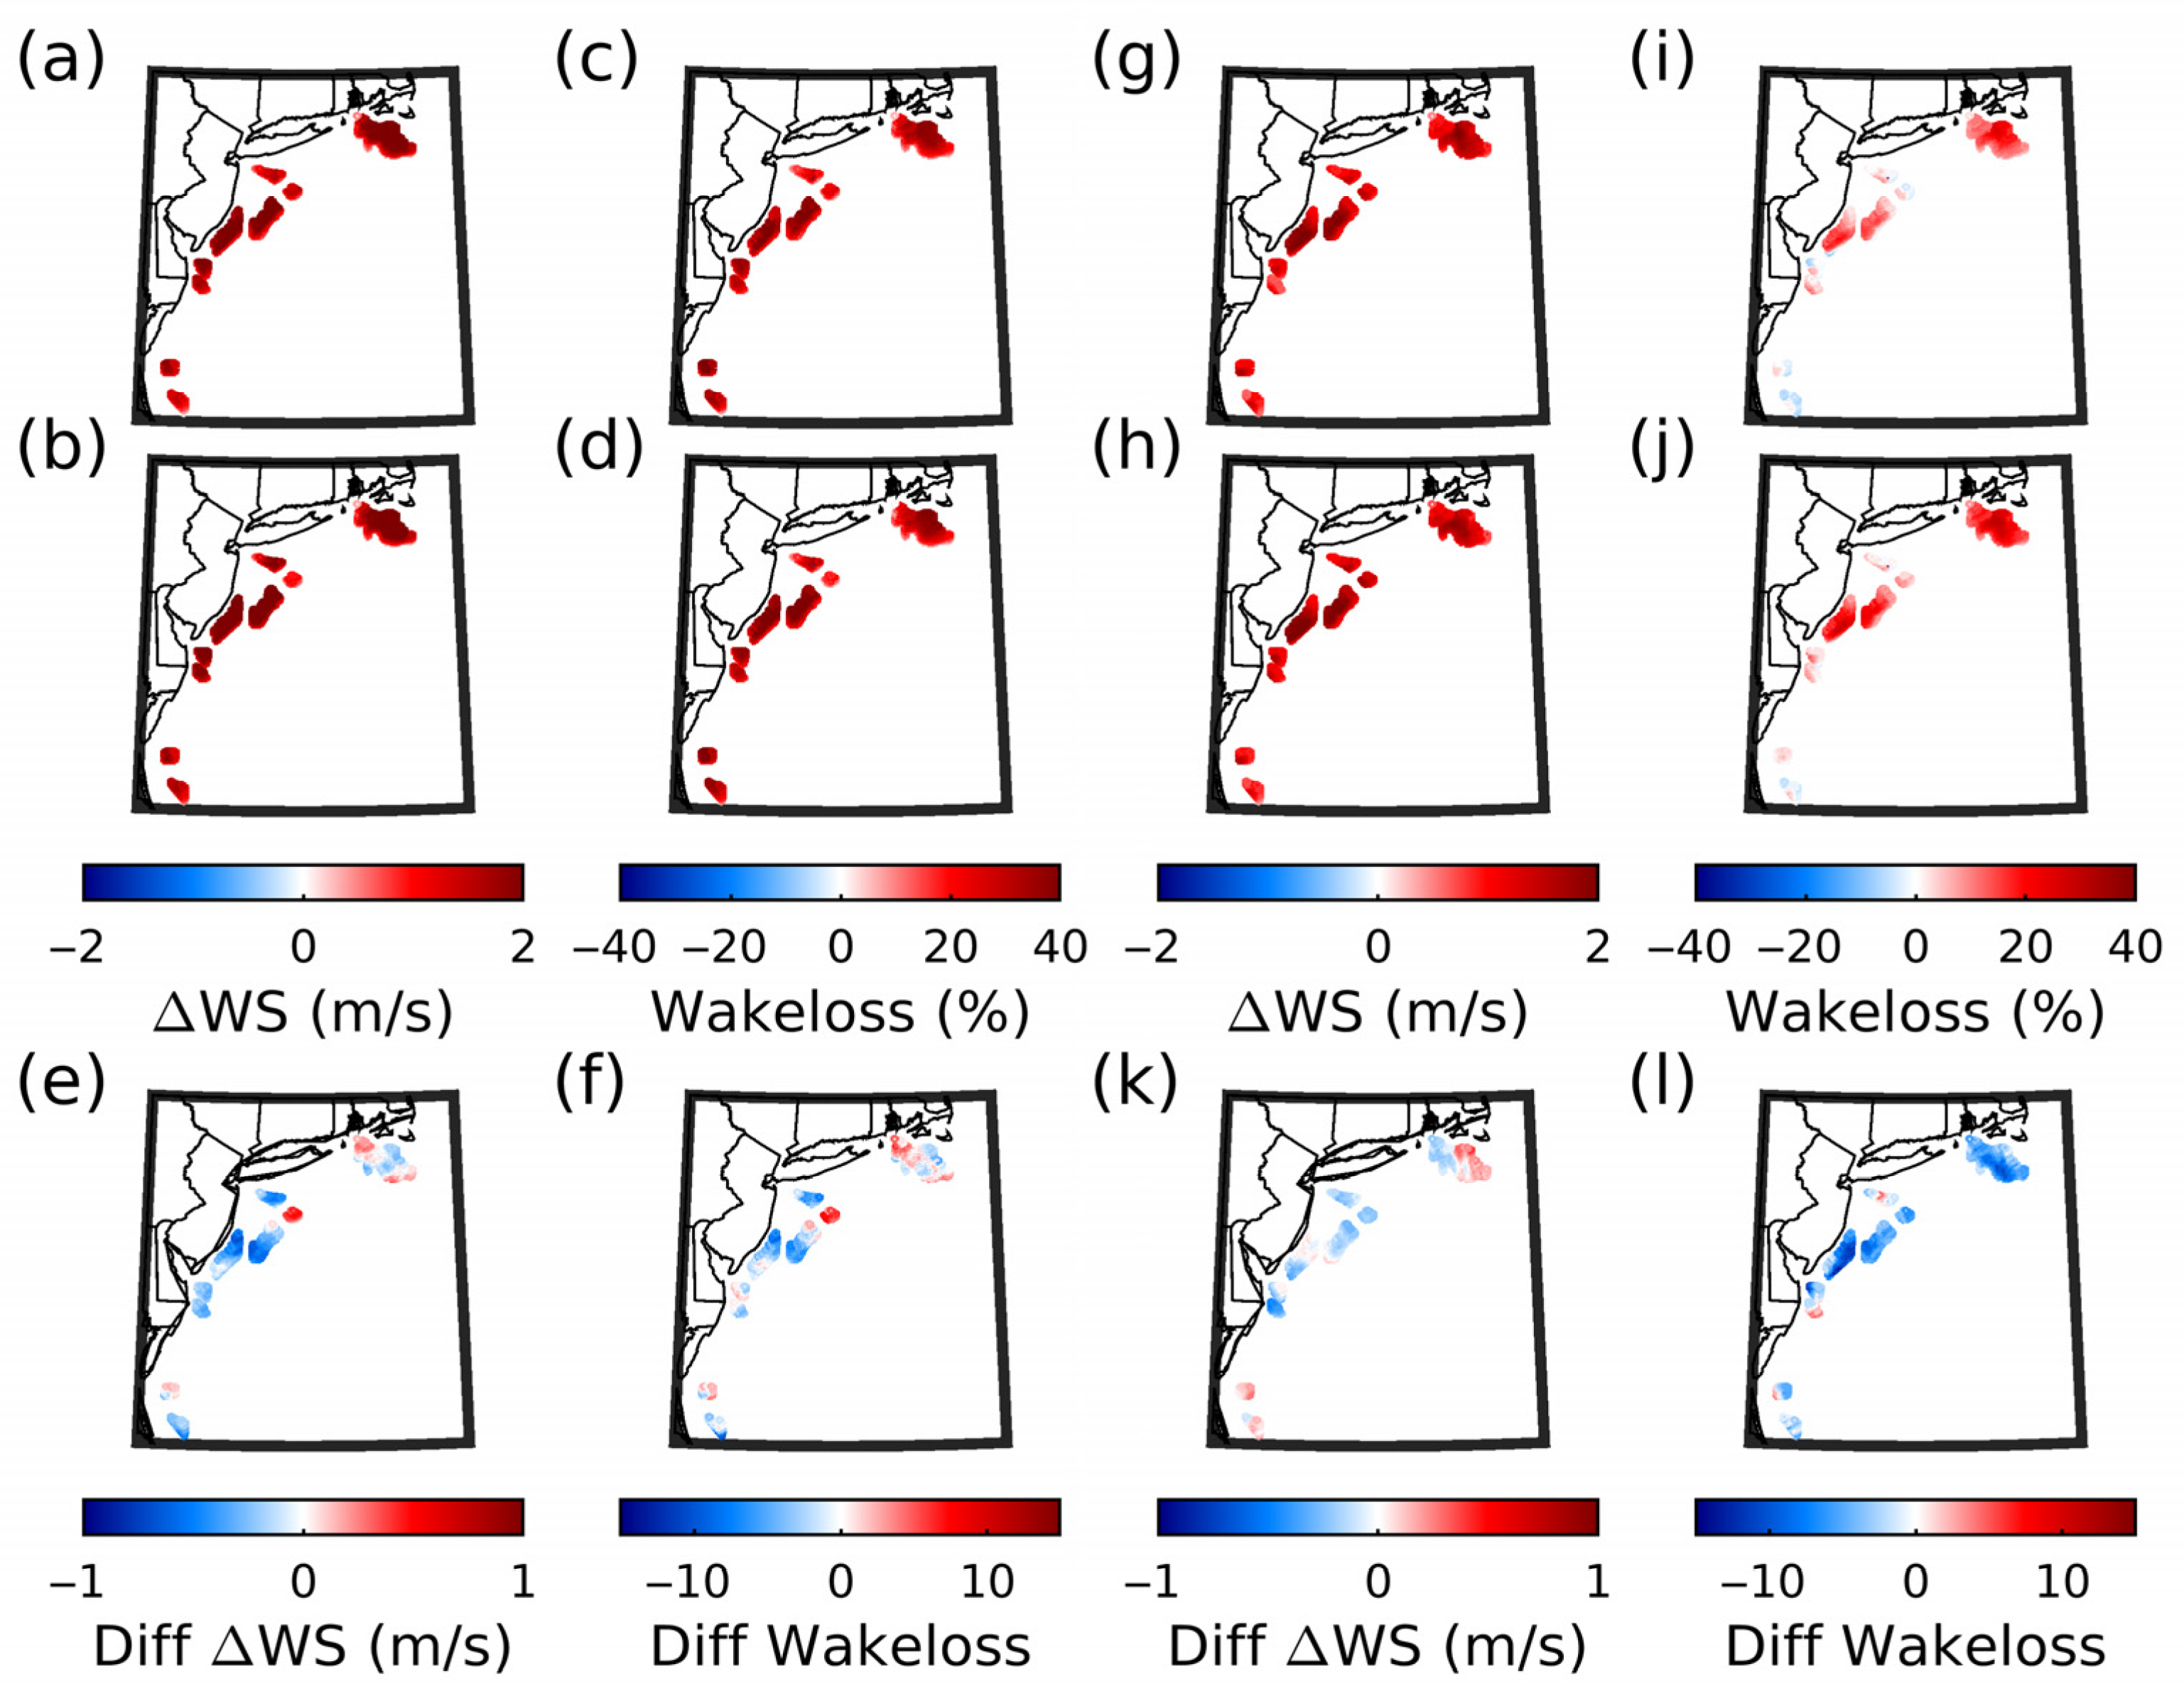
3.5. Internal vs. External Wake Effects
4. Results from Mesoscale Wake Modeling
5. Discussion
- (1)
- Use of wind climates from different sources has only a moderate effect on modeled AEP, CF and wake losses for the LA considered herein and the range of engineering wake models. Along the US east coast, the range of AEP or CF arising from use of output data the ERA5 reanalysis or NOW-23 is small. For example, at the VY LA use of ERA5 or NOW-23 gives AEP projections that lie within ~1% of each other. However, at the HU LA projected AEP from the Recon dataset averages 6 percentage points higher than when NOW-23 data is used and differs by over 16 percentage points from simulations based on HUERA. Thus, there would be utility in performing additional measurements to validate model output from ERA5 [42] and NOW-23 [44]. However, the use of wind climates from these sources does not appear to be a dominant source of uncertainty in AEP projections at least for offshore wind energy LA along the US east coast.
- (2)
- Increasing ICD leads to higher AEP, but also results in increased wake losses, which can markedly reduce CF (Figure 6 and Figure 10). This trade-off is important for developers, who must balance higher energy production with additional CAPEX costs and the risk of additional fatigue loading and potentially enhanced OPEX.
- (3)
- CF vary considerably across the range of microscale wake engineering models and discrepancies increase with wind farm size and ICD. For the MA LA (Section 3.2.1), the range of simulated wake losses using Fuga is 17.9 percentage points for ICD increasing from 2.2 to 8.8 MW km−2. This is a smaller range than simulated with different wake parameterizations (Section 3.2.2) of 23.9 percentage points. Generally, the GCL wake parameterization yields lowest CF and exhibits the strongest dependence on ICD (see Figure 6 and Table 2). NOJ predicts the lowest wake losses and thus highest AEP/CF. FugaB is the only wake parameterization to include blockage but also requires the most computer memory and thus it was not possible to explore the full range of ICD for this wake parameterization even on a system with 500 GB of RAM.
- (4)
- Some studies have shown reasonable agreement between WRF and engineering models simulations in terms of wind speed deficits in case studies [23,26,80]. For the US east coast, climatological CF is lowest from the Fitch WFP within WRF and based on microscale modeling with GCL. Mean CF from WRF-Fitch and the GCL wake parameterization also exhibit a similar dependence on ICD. Conversely, climatological CF from WRF-EWP is considerably higher and are most consistent with Fuga in absolute terms and with respect to the dependence on ICD.
- (5)
- Increasing ICD from 2.2 to 8.8 MW km−2 (i.e., quadrupling the number of wind turbines deployed in the largest wind energy lease area cluster that covers 3673 km2) increases AEP by a factor of less than four indicating the emergence of an increasingly large deep array effect where power production from wind turbines in the center of the array is substantially compromised by wake losses. AEP increases by a factor of 2.3–3.8 depending on the wake parameterization, with the GCL wake parameterization showing lowest AEP gain with increasing ICD.
- (6)
- Even for very large LA clusters, CF from most wake parameterizations scale approximately linearly with ICD for ICD of 2.2 to 8.8 MW km−2. Within this likely range of ICD, a simple scaling analysis extrapolating from the noWT CF that depends solely on the wind climate can provide preliminary projections of AEP without the need for numerous detailed simulations. However, we note that the Gaus wake model, that is trained on observations from smaller offshore wind farms, exhibits the most non-linear response to ICD changes. Further, use of these fits of CF to ICD in out-of-sample contexts (e.g., other wind climates) is not recommended.
6. Conclusions
Author Contributions
Funding
Data Availability Statement
Acknowledgments
Conflicts of Interest
References
- Global Wind Report 2025; The Global Wind Energy Council: Brussels, Belgium, 2025; p. 108. Available online: https://www.gwec.net/reports/globalwindreport (accessed on 23 April 2025).
- Buljan, A. Half of Global Operational Offshore Wind Capacity in China Industry. Available online: https://www.offshorewind.biz/2025/02/07/half-of-global-operational-offshore-wind-capacity-in-china/ (accessed on 7 February 2025).
- Latest Wind Energy Data for Europe; WindEurope: Brussels, Belgium, 2024; p. 36. Available online: https://windeurope.org/intelligence-platform/product/latest-wind-energy-data-for-europe-autumn-2024/ (accessed on 9 January 2025).
- Global Wind Energy Council Global Offshore Wind Report 2024; The Global Wind Energy Council: Brussels, Belgium, 2024; p. 156. Available online: https://www.gwec.net/reports/globaloffshorewindreport/2024 (accessed on 31 December 2024).
- Wind Energy in Europe Trends and Statistics 2019; WindEurope: Brussels, Belgium, 2020; p. 24. Available online: https://windeurope.org/wp-content/uploads/files/about-wind/statistics/WindEurope-Annual-Statistics-2019.pdf (accessed on 27 February 2020).
- Offshore Wind Energy 2024 Statistics; WindEurope: Brussels, Belgium, 2025; p. 49. Available online: https://windeurope.org/intelligence-platform/reports/ (accessed on 11 June 2025).
- Pryor, S.C.; Barthelmie, R.J. Wind shadows impact planning of large offshore wind farms. Appl. Energy 2024, 359, 122755. [Google Scholar] [CrossRef]
- Barthelmie, R.J.; Larsen, G.C.; Pryor, S.C. Modeling Annual Electricity Production and Levelized Cost of Energy from the US East Coast Offshore Wind Energy Lease Areas. Energies 2023, 16, 4550. [Google Scholar] [CrossRef]
- Tjaberings, J.; Fazi, S.; Ursavas, E. Evaluating operational strategies for the installation of offshore wind turbine substructures. Renew. Sustain. Energy Rev. 2022, 170, 112951. [Google Scholar] [CrossRef]
- Virtanen, E.A.; Lappalainen, J.; Nurmi, M.; Viitasalo, M.; Tikanmäki, M.; Heinonen, J.; Atlaskin, E.; Kallasvuo, M.; Tikkanen, H.; Moilanen, A. Balancing profitability of energy production, societal impacts and biodiversity in offshore wind farm design. Renew. Sustain. Energy Rev. 2022, 158, 112087. [Google Scholar] [CrossRef]
- Hansen, T.A.; Wilson, E.J.; Fitts, J.P.; Jansen, M.; Beiter, P.; Steffen, B.; Xu, B.; Guillet, J.; Münster, M.; Kitzing, L. Five grand challenges of offshore wind financing in the United States. Energy Res. Soc. Sci. 2024, 107, 103329. [Google Scholar] [CrossRef]
- Ambrose, J. What Went Wrong at UK Government’s Offshore Wind Auction? The Guardian: London, UK, 2023; Available online: https://www.theguardian.com/environment/2023/sep/08/what-went-wrong-at-uk-governments-offshore-wind-auction (accessed on 8 September 2023).
- Buljan, A. US Cancels Second Gulf of Mexico Offshore Wind Lease Sale; offshoreWIND.biz: Rotterdam, The Netherlands, 2024; Available online: https://www.offshorewind.biz/2024/07/26/us-cancels-second-gulf-of-mexico-offshore-wind-lease-sale/ (accessed on 25 April 2025).
- No Offshore Bids in Denmark—Disappointing but Sadly Not Surprising; WindEurope: Brussels, Belgium, 2024; Available online: https://windeurope.org/newsroom/press-releases/no-offshore-bids-in-denmark-disappointing-but-sadly-not-surprising/ (accessed on 7 September 2024).
- Jordan, D. Nine Offshore Wind Farm Projects Awarded in UK Auction. BBC News, 3 September 2024. Available online: https://www.bbc.com/news/articles/c86ldzve4neo (accessed on 3 September 2024).
- Borrmann, R.; Rehfeldt, K.; Wallasch, A.K.; Lüers, S. Capacity Densities of European Offshore Wind Farms; SP18004A1; Deutsche Windguard GmbH: Hamburg, Germany, 2018; p. 86. Available online: https://www.msp-platform.eu/practices/capacity-densities-european-offshore-wind-farms (accessed on 20 January 2021).
- Pryor, S.C.; Barthelmie, R.J.; Shepherd, T.J. Wind power production from very large offshore wind farms. Joule 2021, 5, 2663–2686. [Google Scholar] [CrossRef]
- Barthelmie, R.J.; Frandsen, S.T.; Nielsen, N.M.; Pryor, S.C.; Rethore, P.E.; Jørgensen, H.E. Modelling and measurements of power losses and turbulence intensity in wind turbine wakes at Middelgrunden offshore wind farm. Wind Energy 2007, 10, 217–228. [Google Scholar] [CrossRef]
- Cooperman, A.; Duffy, P.; Hall, M.; Lozon, E.; Shields, M.; Musial, W. Assessment of Offshore Wind Energy Leasing Areas for Humboldt and Morro Bay Wind Energy Areas, California; NREL/TP-5000-82341; National Renewable Energy Laboratory (NREL): Golden, CO, USA, 2022; p. 85. Available online: https://www.nrel.gov/docs/fy22osti/82341.pdf (accessed on 2 May 2023).
- Draft Construction and Operations Plan Volume I Vineyard Wind Project; Vineyard Wind LLC: New Bedford, MA, USA, 2020; p. 27. Available online: https://www.boem.gov/sites/default/files/documents/renewable-energy/Vineyard-Wind-COP-Volume-III-Section-4.pdf (accessed on 31 December 2024).
- Richard, C. Vineyard Wind Secures Levelised Cost of $65/MWh; Windpower Monthly: London, UK, 2018; Available online: https://www.windpowermonthly.com/article/1489414/vineyard-wind-secures-levelised-cost-65-mwh (accessed on 7 September 2024).
- Sebastiani, A.; Castellani, F.; Crasto, G.; Segalini, A. Data analysis and simulation of the Lillgrund wind farm. Wind Energy 2021, 24, 634–648. [Google Scholar] [CrossRef]
- Fischereit, J.; Schaldemose Hansen, K.; Larsén, X.G.; van der Laan, M.P.; Réthoré, P.E.; Murcia Leon, J.P. Comparing and validating intra-farm and farm-to-farm wakes across different mesoscale and high-resolution wake models. Wind Energy Sci. 2022, 7, 1069–1091. [Google Scholar] [CrossRef]
- Badger, M.; Pena Diaz, A.; Hahmann, A.N.; Mouche, A.; Hasager, C.B. Extrapolating satellite winds to turbine operating heights. J. Appl. Meteorol. Climatol. 2016, 55, 975–991. [Google Scholar] [CrossRef]
- Schneemann, J.; Rott, A.; Dörenkämper, M.; Steinfeld, G.; Kühn, M. Cluster wakes impact on a far-distant offshore wind farm’s power. Wind Energy Sci. 2020, 5, 29–49. [Google Scholar] [CrossRef]
- Cañadillas, B.; Foreman, R.; Barth, V.; Siedersleben, S.; Lampert, A.; Platis, A.; Djath, B.; Schulz-Stellenfleth, J.; Bange, J.; Emeis, S.; et al. Offshore wind farm wake recovery: Airborne measurements and its representation in engineering models. Wind Energy 2020, 23, 1249–1265. [Google Scholar] [CrossRef]
- Nygaard, N.G.; Newcombe, A.C. Wake behind an offshore wind farm observed with dual-Doppler radars. J. Phys. Conf. Ser. 2018, 1037. [Google Scholar] [CrossRef]
- Howland, M.F.; Quesada, J.B.; Martínez, J.J.P.; Larrañaga, F.P.; Yadav, N.; Chawla, J.S.; Sivaram, V.; Dabiri, J.O. Collective wind farm operation based on a predictive model increases utility-scale energy production. Nat. Energy 2022, 7, 818–827. [Google Scholar] [CrossRef]
- Kenis, M.; Lanzilao, L.; Bruninx, K.; Meyers, J.; Delarue, E. Trading rights to consume wind in presence of farm-farm interactions. Joule 2023, 7, 1394–1398. [Google Scholar] [CrossRef]
- Pryor, S.C.; Barthelmie, R.J. Power Production, Inter- and Intra-Array Wake Losses from the U.S. East Coast Offshore Wind Energy Lease Areas. Energies 2024, 17, 1063. [Google Scholar] [CrossRef]
- Thomas, J.J.; Baker, N.F.; Malisani, P.; Quaeghebeur, E.; Sanchez Perez-Moreno, S.; Jasa, J.; Bay, C.; Tilli, F.; Bieniek, D.; Robinson, N.; et al. A comparison of eight optimization methods applied to a wind farm layout optimization problem. Wind Energ. Sci. 2023, 8, 865–891. [Google Scholar] [CrossRef]
- Warder, S.C.; Piggott, M.D. The future of offshore wind power production: Wake and climate impacts. Appl. Energy 2025, 380, 124956. [Google Scholar] [CrossRef]
- Foody, R.; Coburn, J.; Aird, J.A.; Barthelmie, R.J.; Pryor, S.C. Quantitative comparison of power production and power quality onshore and offshore: A case study from the eastern United States. Wind Energy Sci. 2024, 9, 263–280. [Google Scholar] [CrossRef]
- U.S. Bureau of Ocean Energy Management. Renewable Energy GIS Data. 2024. Available online: https://www.boem.gov/renewable-energy/mapping-and-data/renewable-energy-gis-data (accessed on 18 September 2024).
- Barthelmie, R.J.; Dantuono, K.; Renner, E.; Letson, F.; Pryor, S.C. Extreme wind and waves in U.S. east coast offshore wind energy lease areas. Energies 2021, 14, 1053. [Google Scholar] [CrossRef]
- renews.BIZ. Uniform Turbine Layout Touted for NE US Offshore Wind. 2019. Available online: https://renews.biz/56505/uniform-turbine-layout-touted-for-ne-offshore-wind/ (accessed on 21 October 2021).
- Ahmed, Z. Top 12 Biggest Offshore Wind Farms in The World. Available online: https://www.marineinsight.com/know-more/biggest-offshore-wind-farms/ (accessed on 12 July 2024).
- Bureau of Ocean Energy Management. Final Environmental Assessment. Commercial Wind Lease and Grant Issuance and Site Assessment Activities on the Pacific Outer Continental Shelf Humboldt Wind Energy Area, California; Bureau of Ocean Energy Management: Washington, DC, USA, 2022; p. 101. Available online: https://www.boem.gov/sites/default/files/documents/renewable-energy/state-activities/Humboldt-EA.pdf (accessed on 17 January 2025).
- Gaertner, E.; Rinker, J.; Sethuraman, L.; Zahle, Z.; Anderson, B.; Barter, G.; Abbas, B.; Meng, F.; Bortolotti, F.; Skrzypinski, W.; et al. Definition of the IEA 15-Megawatt Offshore Reference Wind Turbine; NREL/TP-5000-75698; National Renewable Energy Laboratory: Golden, CO, USA, 2020. Available online: https://www.nrel.gov/docs/fy20osti/75698.pdf (accessed on 5 November 2020).
- von Brandis, A.; Centurelli, G.; Schmidt, J.; Vollmer, L.; Djath, B.; Dörenkämper, M. An investigation of spatial wind direction variability and its consideration in engineering models. Wind Energy Sci. 2023, 8, 589–606. [Google Scholar] [CrossRef]
- Simley, E.; Fleming, P.; King, J.; Sinner, M. Wake Steering Wind Farm Control With Preview Wind Direction Information. In 2021 American Control Conference; IEEE: New York, NY, USA, 2021; pp. 1783–1789. [Google Scholar] [CrossRef]
- Hersbach, H.; Bell, B.; Berrisford, P.; Hirahara, S.; Horányi, A.; Muñoz-Sabater, J.; Nicolas, J.; Peubey, C.; Radu, R.; Schepers, D.; et al. The ERA5 global reanalysis. Q. J. R. Meteorol. Soc. 2020, 146, 1999–2049. [Google Scholar] [CrossRef]
- Krishnamurthy, R.; García Medina, G.; Gaudet, B.; Gustafson, W.I., Jr.; Kassianov, E.I.; Liu, J.; Newsom, R.K.; Sheridan, L.M.; Mahon, A.M. Year-long Buoy-Based Observations of the Air–Sea Transition Zone off the U.S. West Coast. Earth Syst. Sci. Data 2023, 15, 5667–5699. [Google Scholar] [CrossRef]
- Bodini, N.; Optis, M.; Rossol, M.; Rybchuk, A.; Lundquist, J.K.; Rosencrans, D. 2023 National Offshore Wind Dataset; National Renewable Energy Laboratory: Golden, CO, USA, 2024; Available online: https://data.openei.org/submissions/4500 (accessed on 9 December 2024). [CrossRef]
- Rogers, A.; Rogers, J.; Manwell, J.F. Comparison of the performance of four measure-correlate-predict algorithms. J. Wind Eng. Ind. Aerodyn. 2005, 93, 243–264. [Google Scholar] [CrossRef]
- National Data Buoy Center Station 46022 (LLNR 500). 2024. Available online: https://www.ndbc.noaa.gov/station_page.php?station=46022 (accessed on 17 January 2025).
- Barthelmie, R.J. Evaluating the impact of wind induced roughness change and tidal range on extrapolation of offshore vertical wind speed profiles. Wind Energy 2001, 4, 99–105. [Google Scholar] [CrossRef]
- International Electrotechnical Commission. International Standard, IEC61400 Wind Turbines Part 3-1: Design Requirements for Fixed Offshore Wind Turbines, Edition 1.0 2019-04; IEC, FDIS: Geneva, Switzerland, 2019; p. 314. [Google Scholar]
- Pryor, S.C.; Nielsen, M.; Barthelmie, R.J.; Mann, J. Can satellite sampling of offshore wind speeds realistically represent wind speed distributions? Part II: Quantifying uncertainties associated with sampling strategy and distribution fitting methods. J. Appl. Meteorol. 2004, 43, 739–750. [Google Scholar] [CrossRef]
- Barthelmie, R.J.; Pryor, S.C.; Frandsen, S.T.; Hansen, K.; Schepers, J.G.; Rados, K.; Schlez, W.; Neubert, A.; Jensen, L.E.; Neckelmann, S. Quantifying the impact of wind turbine wakes on power output at offshore wind farms. J. Atmos. Ocean. Technol. 2010, 27, 1302–1317. [Google Scholar] [CrossRef]
- Göçmen, T.; Laan, P.v.d.; Réthoré, P.-E.; Diaz, A.P.; Larsen, G.C.; Ott, S. Wind turbine wake models developed at the technical university of Denmark: A review. Renew. Sustain. Energy Rev. 2016, 60, 752–769. [Google Scholar] [CrossRef]
- Nygaard, N.G. Wakes in very large wind farms and the effect of neighbouring wind farms. J. Phys. Conf. Ser. 2014, 524, 012162. [Google Scholar] [CrossRef]
- Christiansen, M.B.; Hasager, C. Wake effects of large offshore wind farms identified from satellite SAR. Remote Sens. Environ. 2005, 98, 251–268. [Google Scholar] [CrossRef]
- Pedersen, M.M.; van der Laan, P.; Friis-Møller, M.; Rinker, J.; Réthoré, P.-E. DTUWindEnergy/PyWake: PyWake (Version v1.0.10); Zenodo: Geneva, Switzerland, 2019. [Google Scholar] [CrossRef]
- Jensen, N.O. A Note on Wind Turbine Interaction; Risø-M-2411; Risø National Laboratory: Roskilde, Denmark, 1983; p. 16. Available online: https://orbit.dtu.dk/en/publications/a-note-on-wind-generator-interaction (accessed on 5 December 2017).
- Katic, I.; Højstrup, J.; Jensen, N.O. A simple model for cluster efficiency. In Proceedings of the European Wind Energy Association, Rome, Italy, 7–9 October 1986; pp. 407–409. [Google Scholar]
- Troen, I.; Petersen, E.L. European Wind Atlas; Risø National Laboratory: Roskilde, Denmark, 1989; p. 656. Available online: http://orbit.dtu.dk/files/112135732/European_Wind_Atlas.pdf (accessed on 31 December 2024).
- Ott, S.; Nielsen, M. Developments of the Offshore Wind Turbine Wake Model Fuga; DTU Wind Energy: Roskilde, Denmark, 2014; p. 22. ISBN 978-87-92896-81-0. Available online: https://orbit.dtu.dk/en/publications/developments-of-the-offshore-wind-turbine-wake-model-fuga (accessed on 27 September 2021).
- Ott, S.; Berg, J.; Nielsen, M. Linearised CFD Models for Wakes; Risoe-R-1772 (EN); DTU: Roskilde, Denmark, 2011; Available online: https://orbit.dtu.dk/en/publications/linearised-cfd-models-for-wakes(c29803f3-a1eb-45ab-b73f-ede444928477).html (accessed on 26 July 2019).
- Meyer Forsting, A.; Troldborg, N.; Gaunaa, M. The flow upstream of a row of aligned wind turbine rotors and its effect on power production. Wind Energy 2017, 20, 63–77. [Google Scholar] [CrossRef]
- Pedersen, J.G.; Svensson, E.; Poulsen, L.; Nygaard, N.G. Turbulence Optimized Park model with Gaussian wake profile. J. Phys. Conf. Ser. 2022, 2265, 022063. [Google Scholar] [CrossRef]
- Orsted. 2022. Available online: https://github.com/OrstedRD/TurbOPark (accessed on 3 May 2023).
- Nygaard, N.G.; Poulsen, L.; Svensson, E.; Pedersen, J.G. Large-scale benchmarking of wake models for offshore wind farms. J. Phys. Conf. Ser. 2022, 2265, 022008. [Google Scholar] [CrossRef]
- Bastankhah, M.; Porté-Agel, F. A new analytical model for wind-turbine wakes. Renew. Energy 2016, 70, 116–123. [Google Scholar] [CrossRef]
- Larsen, G.C. A Simple Stationary Semi-Analytical Wake Model. Risø National Laboratory for Sustainable Energy, Technical University of Denmark. Denmark. Forskningscenter Risoe. Risoe-R No. 1713(EN). 2009. Available online: https://orbit.dtu.dk/en/publications/a-simple-stationary-semi-analytical-wake-model (accessed on 24 June 2024).
- Skamarock, W.C.; Klemp, J.B.; Dudhia, J.; Gill, D.O.; Barker, D.M.; Wang, W.; Powers, J.G. A Description of the Advanced Research WRF Version 2; Note NCAR/TN-468+STR; NCAR Tech: Boulder, CO, USA, 2005; p. 88. [Google Scholar]
- Thompson, K.B.; Barthelmie, R.J.; Pryor, S.C. Hurricane impacts in the United States East Coast offshore wind energy lease areas. Wind Energy Sci. Discuss. 2025, Preprint wes-2025-37. [Google Scholar] [CrossRef]
- Fitch, A.C.; Olson, J.B.; Lundquist, J.K. Parameterization of Wind Farms in Climate Models. J. Clim. 2013, 26, 6439–6458. [Google Scholar] [CrossRef]
- Fitch, A.C.; Olson, J.B.; Lundquist, J.K.; Dudhia, J.; Gupta, A.K.; Michalakes, J.; Barstad, I. Local and Mesoscale Impacts of Wind Farms as Parameterized in a Mesoscale NWP Model. Mon. Weather Rev. 2012, 140, 3017–3038. [Google Scholar] [CrossRef]
- Archer, C.L.; Wu, S.; Ma, Y.; Jiminez, P.A. Two Corrections for Turbulent Kinetic Energy Generated by Wind Farms in the WRF Model. Mon. Weather Rev. 2020, 148, 4823–4835. [Google Scholar] [CrossRef]
- Volker, P.J.H.; Badger, J.; Hahmann, A.N.; Ott, S. The Explicit Wake Parametrisation V1.0: A wind farm parametrisation in the mesoscale model WRF. Geosci. Model Dev. 2015, 8, 3481–3522. [Google Scholar] [CrossRef]
- Pryor, S.C.; Shepherd, T.; Volker, P.; Hahmann, A.; Barthelmie, R.J. ‘Wind theft’ from onshore arrays: Sensitivity to wind farm parameterization and resolution. J. Appl. Meteorol. Climatol. 2020, 59, 153–174. [Google Scholar] [CrossRef]
- Porchetta, S.; Muñoz-Esparza, D.; Munters, W.; van Beeck, J.; van Lipzig, N. Impact of ocean waves on offshore wind farm power production. Renew. Energy 2021, 180, 1179–1193. [Google Scholar] [CrossRef]
- Warner, J.C.; Armstrong, B.; He, R.; Zambon, J.B. Development of a Coupled Ocean–Atmosphere–Wave–Sediment Transport (COAWST) Modeling System. Ocean Model. 2010, 35, 230–244. [Google Scholar] [CrossRef]
- U.S. Energy Information Administration. Electricity Consumption in the United States Was About 4 Trillion Kilowatthours (kWh) in 2022. 2023. Available online: https://www.eia.gov/energyexplained/electricity/use-of-electricity.php (accessed on 16 September 2024).
- Barthelmie, R.J.; Jensen, L.E. Evaluation of wind farm efficiency and wind turbine wakes at the Nysted offshore wind farm. Wind Energy 2010, 13, 573–586. [Google Scholar] [CrossRef]
- Irwin, J.S. A theoretical variation of the wind profile power-law exponent as a function of surface roughness and stability. Atmos. Environ. 1979, 13, 191–194. [Google Scholar] [CrossRef]
- Optis, M.; Rybchuk, O.; Nicola, B.; Rossol, M.; Musial, W. Offshore Wind Resource Assessment for the California Pacific Outer Continental Shelf; NREL/TP-5000-77642; National Renewable Energy Laboratory (NREL): Golden, CO, USA, 2020. [Google Scholar] [CrossRef]
- Bodini, N.; Rybchuk, A.; Optis, M.; Musial, V.; Lundquist, J.K.; Redfern, S.; Draxl, C.; Krishnamurthy, R.; Gaudet, B. Update on NREL’s 2020 Offshore Wind Resource Assessment for the California Pacific Outer Continental Shelf; National Renewable Energy Laboratory (NREL): Golden, CO, USA, 2022. Available online: https://www.osti.gov/biblio/1899984 (accessed on 5 May 2024).
- Platis, A.; Siedersleben, S.K.; Bange, J.; Lampert, A.; Bärfuss, K.; Hankers, R.; Cañadillas, B.; Foreman, R.; Schulz-Stellenfleth, J.; Djath, B.; et al. First in situ evidence of wakes in the far field behind offshore wind farms. Sci. Rep. 2018, 8, 2163. [Google Scholar] [CrossRef] [PubMed]
- Barthelmie, R.J.; Folkerts, L.; Rados, K.; Larsen, G.C.; Pryor, S.C.; Frandsen, S.; Lange, B.; Schepers, G. Comparison of wake model simulations with offshore wind turbine wake profiles measured by sodar. J. Atmos. Ocean. Technol. 2006, 23, 888–901. [Google Scholar] [CrossRef]
- Ma, Y.; Archer, C.L.; Vasel-Be-Hagh, A. Comparison of individual versus ensemble wind farm parameterizations inclusive of sub-grid wakes for the WRF model. Wind Energy 2022, 25, 1573–1595. [Google Scholar] [CrossRef]
- Sun, J.; Yang, J.; Jiang, Z.; Xu, J.; Meng, X.; Feng, X.; Si, Y.; Zhang, D. Wake redirection control for offshore wind farm power and fatigue multi-objective optimisation based on a wind turbine load indicator. Energy 2024, 313, 133893. [Google Scholar] [CrossRef]
- White, R. RWE Urges Government Intervention in Ørsted Wake Effect Dispute; Windpower Monthly: London, UK, 2025; Available online: https://www.windpowermonthly.com/article/1906938/rwe-urges-government-intervention-orsted-wake-effect-dispute (accessed on 2 May 2025).

| Platform | Wake Parameterization | Description | References | |
|---|---|---|---|---|
| PyWake | Microscale: detailed individual wakes. Limited atmospheric feedback (i.e., wind farm wakes negligible) | [54] | ||
| PyWake | NOJ | Standard and first wake parameterization. Linear expansion and analytical multiple wake solution. It defines the wind speed in the wake (Uwake) from a single wind turbine as a function of downstream distance as follows: | [50,55,56,57] | |
| (8) | ||||
| where Ct is the wind turbine thrust coefficient, Dw is the wake diameter, X is the distance downstream and k is the expansion coefficient which is physically related to roughness length and stability and is typically set to 0.05 for offshore applications. NOJ is also employed in the WAsP Program and is the only one that uses a ‘top-hat’ wake shape rather than a Gaussian profile. Velocity deficit in multiple wakes uses the sum of squares approach. NOJ is frequently used because of its fast and robust performance although it underestimates wake propagation downstream of large offshore arrays. | ||||
| PyWake | Fuga | Fuga is based on a linearized Reynolds Averaging Navier–Stokes approach that tracks individual, embedded wakes. It was explicitly developed for offshore wind farms It uses a set of Look Up Tables (LUT) for particular roughness length and stability criteria. Use of LUT to store intermediate results speeds up the calculations many-fold and allows the wakes of many wind turbines and the far downstream wake to be determined. To calculate the combined velocity deficit for multiple wakes the linear superposition approach is used. | [58,59] | |
| PyWake | FugaB | As Fuga but includes upstream blockage. Similar wake losses to Fuga with additional blockage effect of ~1–2% AEP loss. Requires more computing resources than Fuga. Fuga Blockage includes the decrease in wind speed directly upstream of a wind farm in addition to the downstream wake effect. To calculate the combined velocity deficit for multiple wakes the linear superposition approach is used. | [60] | |
| PyWake | TurboGauss (TurboG) | The model is implemented based on TurboPark using the Gaussian wake shape with a non-linear turbulence-dependent wake expansion coefficient [61] that decreases with downstream distance from the turbine. TurboPark gives unbiased estimates of wake losses in comparison with SCADA data from European offshore wind farms. To calculate the combined velocity deficit for multiple wakes the sum of squares approach is used. | [61,62,63] | |
| PyWake | BastankhahGaussianDeficit (BG) | There are several versions of this analytical model which applies mass and momentum conservation in the wake and uses Gaussian wake shape with linear wake expansion. It uses Ct and requires a wake expansion coefficient (k) to be defined. Here k is set to 0.032455. To calculate the combined velocity deficit for multiple wakes the sum of squares approach is used. It generally scales with ICD in a similar manner to NOJ, but with larger wake losses. | [64] | |
| PyWake | GLC | An analytic approach that uses the thin shear layer approximation of the Navier–Stokes equations as the basis of an axisymmetric wake expansion that employs a Gaussian shape wake e coefficient that depends on the thrust coefficient and turbulence intensity. To calculate the combined velocity deficit for multiple wakes the linear superposition approach is used. | [65] | |
| WRF | Mesoscale model requires high-performance computing (HPC). Atmospheric feedback to wind speed, planetary boundary layer structure and turbulence intensity. Limited individual wake details via a wind farm parameterization (WFP) but full wind farm wakes modeled. | [66,67] | ||
| Fitch | Default WFP in WRF. No in grid wake expansion. Momentum extracted from the rotor plane. Turbulent Kinetic Energy (TKE) added as function of wind turbine thrust coefficient. | [68,69,70] | ||
| EWP | Gaussian form for momentum extraction which thus extends vertically beyond the rotor plane. Within grid wake expansion treated. TKE only added via shear. | [71,72] | ||
| Platform and Wake Parameterization | Mean CF (%) for ICD~4.3 MW km−2 | Regression Slope (m) | r2 |
|---|---|---|---|
| WRF Fitch [30] | 42.9 | −3.74 | 0.798 |
| WRF EWP [30] | 53.2 | −1.59 | 0.909 |
| PyWake | |||
| NoWT | 59.8 | - | - |
| NOJ | 57.3 | −0.55 | 0.971 |
| Fuga | 52.2 | −1.68 | 0.990 |
| FugaB | 51.1 | −1.91 | 0.998 |
| GCL | 43.3 | −3.63 | 0.986 |
| BG | 55.9 | −0.88 | 0.988 |
| Gaus | 48.0 | −2.41 | 0.660 |
| Layout | # Turbines | ICD (MW km−2) | Spacing (km) | AEP NOJ (GWh/yr) | AEP Fuga (GWh/yr) |
|---|---|---|---|---|---|
| CNTR | 151 | 4.2 | 1.85 × 1.85 (7.8 × 7.8 D) | 11,798 | 11,215 |
| DOUB | 78 | 2.2 | 2.6 × 2.2 (10.8 × 9.2 D) | 6227 | 6078 |
| 6MWD | 208 | 5.8 | 1.6 × 1.2 (6.7 × 5.0 D) | 16,009 | 14,856 |
| HALF | 306 | 8.6 | 1.2 × 1.3 (5.0 × 5.4 D) | 22,899 | 20,358 |
| LONG | 164 | 4.6 | 1.1 × 2.2 (4.6 × 9.2 D) | 12,845 | 12,164 |
| LLNG | 172 | 4.8 | 1.0 × 2.8 (4.2 × 11.7 D) | 13,517 | 12,757 |
| Wind Climate | VYERA | VYNOW | MAERA | ||||||
|---|---|---|---|---|---|---|---|---|---|
| Wake Parameterization | AEP (GWh/yr) | CF (%) | Wake Loss (%) | AEP (GWh/yr) | CF (%) | Wake Loss (%) | AEP (GWh/yr) | CF (%) | Wake Loss (%) |
| NoWT | 5663 | 59.9 | 0 | 5695 | 60.2 | 0 | 5655 | 59.8 | 0 |
| NOJ | 5466 | 57.8 | 3.5 | 5524 | 58.4 | 3.0 | 5459 | 57.7 | 3.5 |
| Fuga | 5341 | 56.5 | 5.7 | 5418 | 57.3 | 4.9 | 5335 | 56.4 | 5.7 |
| FugaB | 5276 | 55.8 | 6.8 | 5360 | 56.7 | 5.9 | 5271 | 55.7 | 6.8 |
| GCL | 5112 | 54.0 | 9.7 | 5215 | 55.1 | 8.4 | 5107 | 54.0 | 9.7 |
| BG | 5375 | 56.8 | 5.1 | 5445 | 57.6 | 4.3 | 5368 | 56.7 | 5.1 |
| Gaus | 5049 | 53.4 | 10.8 | 5161 | 54.6 | 9.4 | 5046 | 53.3 | 10.8 |
| Dataset | Data Period | Number of Observations (%) | Height | Mean Wind Speed (ms−1) | Standard Deviation (ms−1) | Weibull Shape Factor (ms−1) | Weibull Scale Factor |
|---|---|---|---|---|---|---|---|
| FLidar | 2020–22 (overlap) | 53,281 (91%) * | 160 | 10.40 | 5.70 | 11.73 | 1.92 |
| NDBC | 2020–22 (overlap) | 53,281 | 3.8 | 5.71 | 3.27 | 6.43 | 1.83 |
| NDBC | 1982–2022 | 305,575 (82.5%) | 3.8 | 5.64 | 3.45 | 6.33 | 1.71 |
| Recon | 1982–2022 | 305,575 (82.5%) | 160 | 10.09 | 4.61 | 11.42 | 2.34 |
| Wind Climate | HUNOW | HUERA | Recon | ||||||
|---|---|---|---|---|---|---|---|---|---|
| Wake Parameterization | AEP (GWh/y) | CF (%) | Wake Loss (%) | AEP (GWh/y) | CF (%) | Wake Loss (%) | AEP (GWh/y) | CF (%) | Wake Loss (%) |
| NoWT | 11,459 | 61.1 | 0.0 | 10,444 | 52.0 | 0.0 | 12,337 | 61.4 | 0.0 |
| NOJ | 11,040 | 55.6 | 3.7 | 9932 | 50.1 | 4.9 | 11,798 | 59.5 | 4.4 |
| Fuga | 10,590 | 53.4 | 7.6 | 9409 | 47.4 | 9.9 | 11,215 | 56.5 | 9.1 |
| FugaB | 10,474 | 52.8 | 8.6 | 9269 | 46.7 | 11.3 | 11,506 | 58.0 | 6.7 |
| GCL | 9845 | 49.6 | 14.1 | 8601 | 43.3 | 17.7 | 10,305 | 51.9 | 16.5 |
| BG | 10,828 | 54.6 | 5.5 | 9679 | 48.8 | 7.3 | 11,521 | 58.1 | 6.6 |
| Gaus | 10,056 | 50.3 | 12.2 | 8780 | 44.0 | 15.9 | 10,485 | 52.5 | 15.0 |
| Wake Parameterization | Modeled HU CF (%) | Regression Slope (m) | Average Regression Slope, m (HU and MA from Table 2) | Estimated CF at VY for ICD of 4.3 MW km−2 | Modeled CF at VY for ICD of 4.3 MW km−2 |
|---|---|---|---|---|---|
| NoWT | 57.8 | 59.7 | 59.7 | ||
| NOJ | 55.6 | −0.46 | −0.51 | 57.48 | 57.70 |
| Fuga | 53.4 | −1.00 | −1.34 | 53.80 | 56.39 |
| FugaB | 52.8 | −1.12 | −1.52 | 53.03 | 55.71 |
| GCL | 49.6 | −1.89 | −2.76 | 47.56 | 53.98 |
| BG | 54.6 | −0.70 | −0.79 | 56.22 | 56.74 |
| Gaus | 50.3 | −1.50 | −1.96 | 51.10 | 53.34 |
| VY Internal Wakes Only | VY Internal Wakes + External Wakes | |||||
|---|---|---|---|---|---|---|
| Parameterization | AEP (GWh/yr) | CF(%) | Wake Loss (%) | AEP (GWh/yr) | CF (%) | Wake Loss (%) |
| NoWT | 5659 | 59.8 | 0.0 | 5659 | 59.8 | 0.0 |
| NOJ | 5459 | 57.7 | 3.5 | 5400 | 57.0 | 4.5 |
| Fuga | 5335 | 56.4 | 5.7 | 4860 | 51.4 | 14.1 |
| FugaB | 5271 | 55.7 | 6.8 | 4782 | 50.6 | 15.4 |
| GCL | 5107 | 54.0 | 9.7 | 3849 | 40.7 | 31.9 |
| BG | 5368 | 56.7 | 5.1 | 5262 | 55.6 | 6.9 |
| Gaus | 5046 | 53.3 | 10.8 | 4446 | 47.0 | 21.4 |
| LA (Section) | Platform | Wind Climate/Source of LBC for Mesoscale | Wind Farm/Wake Parameterization | Number of Turbines # | ICD (MW/km2) | AEP (GWh/y) | Range of AEP (Waked) (%) | CF (%) | Range of CF (Waked) (Percentage Points) | Wake Losses (%) | Wake Range (Percentage Points) |
|---|---|---|---|---|---|---|---|---|---|---|---|
| All (3.1) | PyWake | NJERA | NoWT, NOJ, Fuga | 2617 | 4.3 | 191,067, 182,682, 169,756 | 7.1 | 55.6, 53.1, 49.4 | 3.8 | 0, 4.4, 11.2 | 6.8 |
| All (3.1) | WRF | ERA5 | EWP, Fitch [30] | 1922 | 4.3 | 53.2, 42.6 | 10.6 | ||||
| All (3.1) | WRF | ERA5 | EWP [30] | 1604–2598 | 3.5–6.0 | 54.9– 49.7 | 5.2 | 11–19 | 8 | ||
| All (3.1) | WRF | ERA5 | Fitch [30] | 1604–2598 | 3.5– 6.0 | 44.8–38.7 | 6.1 | 27–37 | 10 | ||
| MA (3.2.1) | WRF | ERA5 | EWP [30] | 1073– 1485 | 4.3, 6.0 | 53.1, 49.2 | 3.9 | ||||
| MA (3.2.1) | WRF | ERA5 | Fitch [30] | 1073– 1485 | 4.3, 6.0 | 42.6 38.1 | 4.5 | ||||
| MA (3.2.1) | PyWake | MAERA | NOJ | 532–2162 | 2.2–8.8 | 40,891–156,727 | 73.9 | 58.5–55.2 | 3.3 | 2.1– 7.7 | 5.6 |
| MA (3.2.1) | Py-Wake | MAERA | Fuga | 532–2162 | 2.2–8.8 | 39,194–129,200 | 69.7 | 56.1 45.5 | 10.6 | 6.3– 23.9 | 17.6 |
| HU (3.2.2) | Py-Wake | Recon | NOJ | 78– 306 | 2.2–8.6 | 6227–22,899 | 72.8 | 56.6–53.7 | 2.9 | 2.2– 8.4 | 6.2 |
| HU (3.2.2) | Py-Wake | Recon | Fuga | 78– 306 | 2.2–8.6 | 6078–20,358 | 70.1 | 55.5–48.9 | 6.6 | 4.6– 18.6 | 14.0 |
| VY (3.3.1) | Py-Wake | VYERA, VYNOW, MAERA | NoWT | 72 | 4.3 | 5663, 5695, 5665 | 0.5 | 59.9, 60.2, 59.8 | 0.4 | - | - |
| HU (3.3.2) | Py-Wake | HUERA, HUNOW, Recon | NoWT | 151 | 4.2 | 10,444, 11,459, 12,337 | 18.1 | 52.0, 61.1, 61.4 | 9.4 | - | - |
| MA (3.4.1) | PyWake | MAERA | NOJ, Fuga, GCL, BG, Gaus | 1066 | 4.3 | 60,593–80,624 | 24.8 | 43.3–57.6 | 14.3 | 3.7– 27.6 | 23.9 |
| VY (3.4.2) | PyWake | VYERA | NOJ, Fuga, FugaB, GCL, BG, Gaus | 72 | 4.3 | 5049– 6159 | 18.0 | 53.4–57.8 | 4.4 | 3.5– 10.8 | 7.3 |
| HU (3.4.3) | PyWake | HUNOW | NOJ, Fuga, FugaB, GCL, BG, Gaus | 151 | 4.2 | 9845–11,040 | 10.8 | 49.6–55.6 | 6.0 | 3.7– 12.1 | 8.4 |
| VY (3.5) | PyWake | MAERA | NOJ, Fuga, GCL, BG, Gaus | 72 | 4.3 | 5046– 5459 | 7.7 | 53.3–57.7 | 4.4 | 3.5– 10.8 | 7.3 |
| VY in MA (3.5) | PyWake | MAERA | NOJ, Fuga, GCL, BG, Gaus | 72 of 1066 | 4.3 | 3849– 5400 | 28.7 | 40.7–57.1 | 17.2 | 4.5– 31.9 | 27.4 |
Disclaimer/Publisher’s Note: The statements, opinions and data contained in all publications are solely those of the individual author(s) and contributor(s) and not of MDPI and/or the editor(s). MDPI and/or the editor(s) disclaim responsibility for any injury to people or property resulting from any ideas, methods, instructions or products referred to in the content. |
© 2025 by the authors. Licensee MDPI, Basel, Switzerland. This article is an open access article distributed under the terms and conditions of the Creative Commons Attribution (CC BY) license (https://creativecommons.org/licenses/by/4.0/).
Share and Cite
Barthelmie, R.J.; Thompson, K.B.; Pryor, S.C. Factors Impacting Projected Annual Energy Production from Offshore Wind Farms on the US East and West Coasts. Energies 2025, 18, 4037. https://doi.org/10.3390/en18154037
Barthelmie RJ, Thompson KB, Pryor SC. Factors Impacting Projected Annual Energy Production from Offshore Wind Farms on the US East and West Coasts. Energies. 2025; 18(15):4037. https://doi.org/10.3390/en18154037
Chicago/Turabian StyleBarthelmie, Rebecca J., Kelsey B. Thompson, and Sara C. Pryor. 2025. "Factors Impacting Projected Annual Energy Production from Offshore Wind Farms on the US East and West Coasts" Energies 18, no. 15: 4037. https://doi.org/10.3390/en18154037
APA StyleBarthelmie, R. J., Thompson, K. B., & Pryor, S. C. (2025). Factors Impacting Projected Annual Energy Production from Offshore Wind Farms on the US East and West Coasts. Energies, 18(15), 4037. https://doi.org/10.3390/en18154037