
Geological Evaluation of In-Situ Pyrolysis Development of Oil-Rich Coal in Tiaohu Mining Area, Santanghu Basin, Xinjiang, China

 , ,
, , 
Abstract
1. Introduction
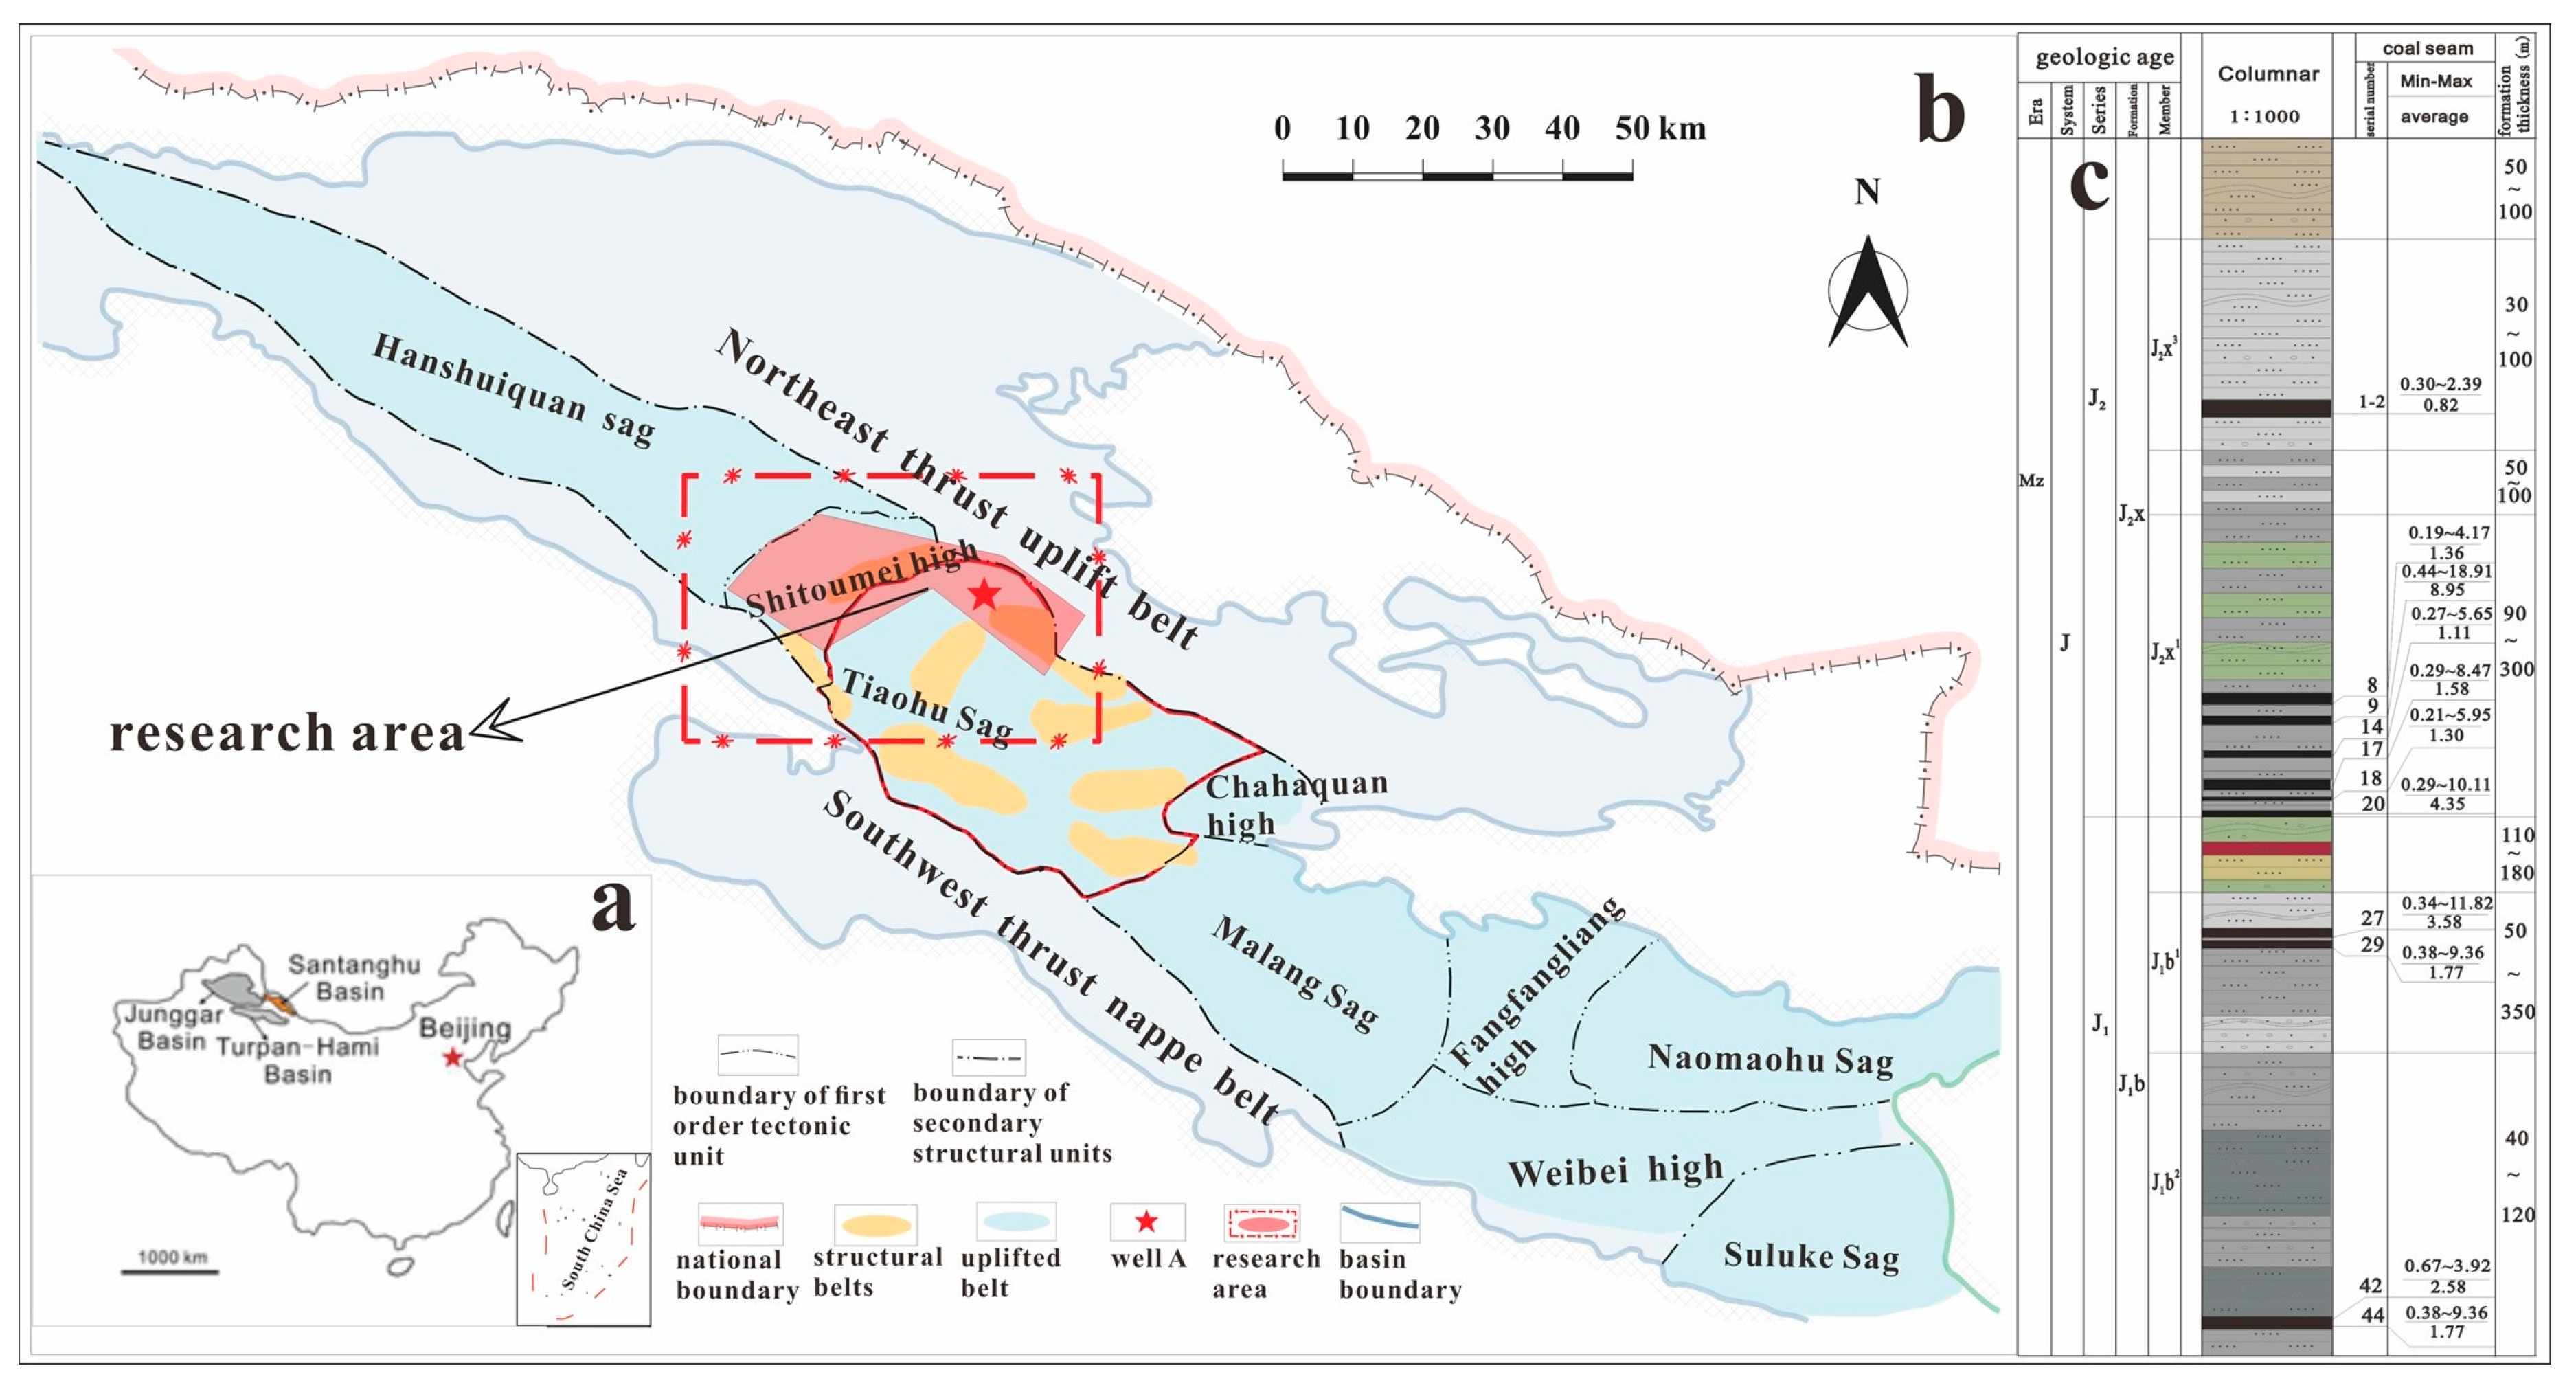
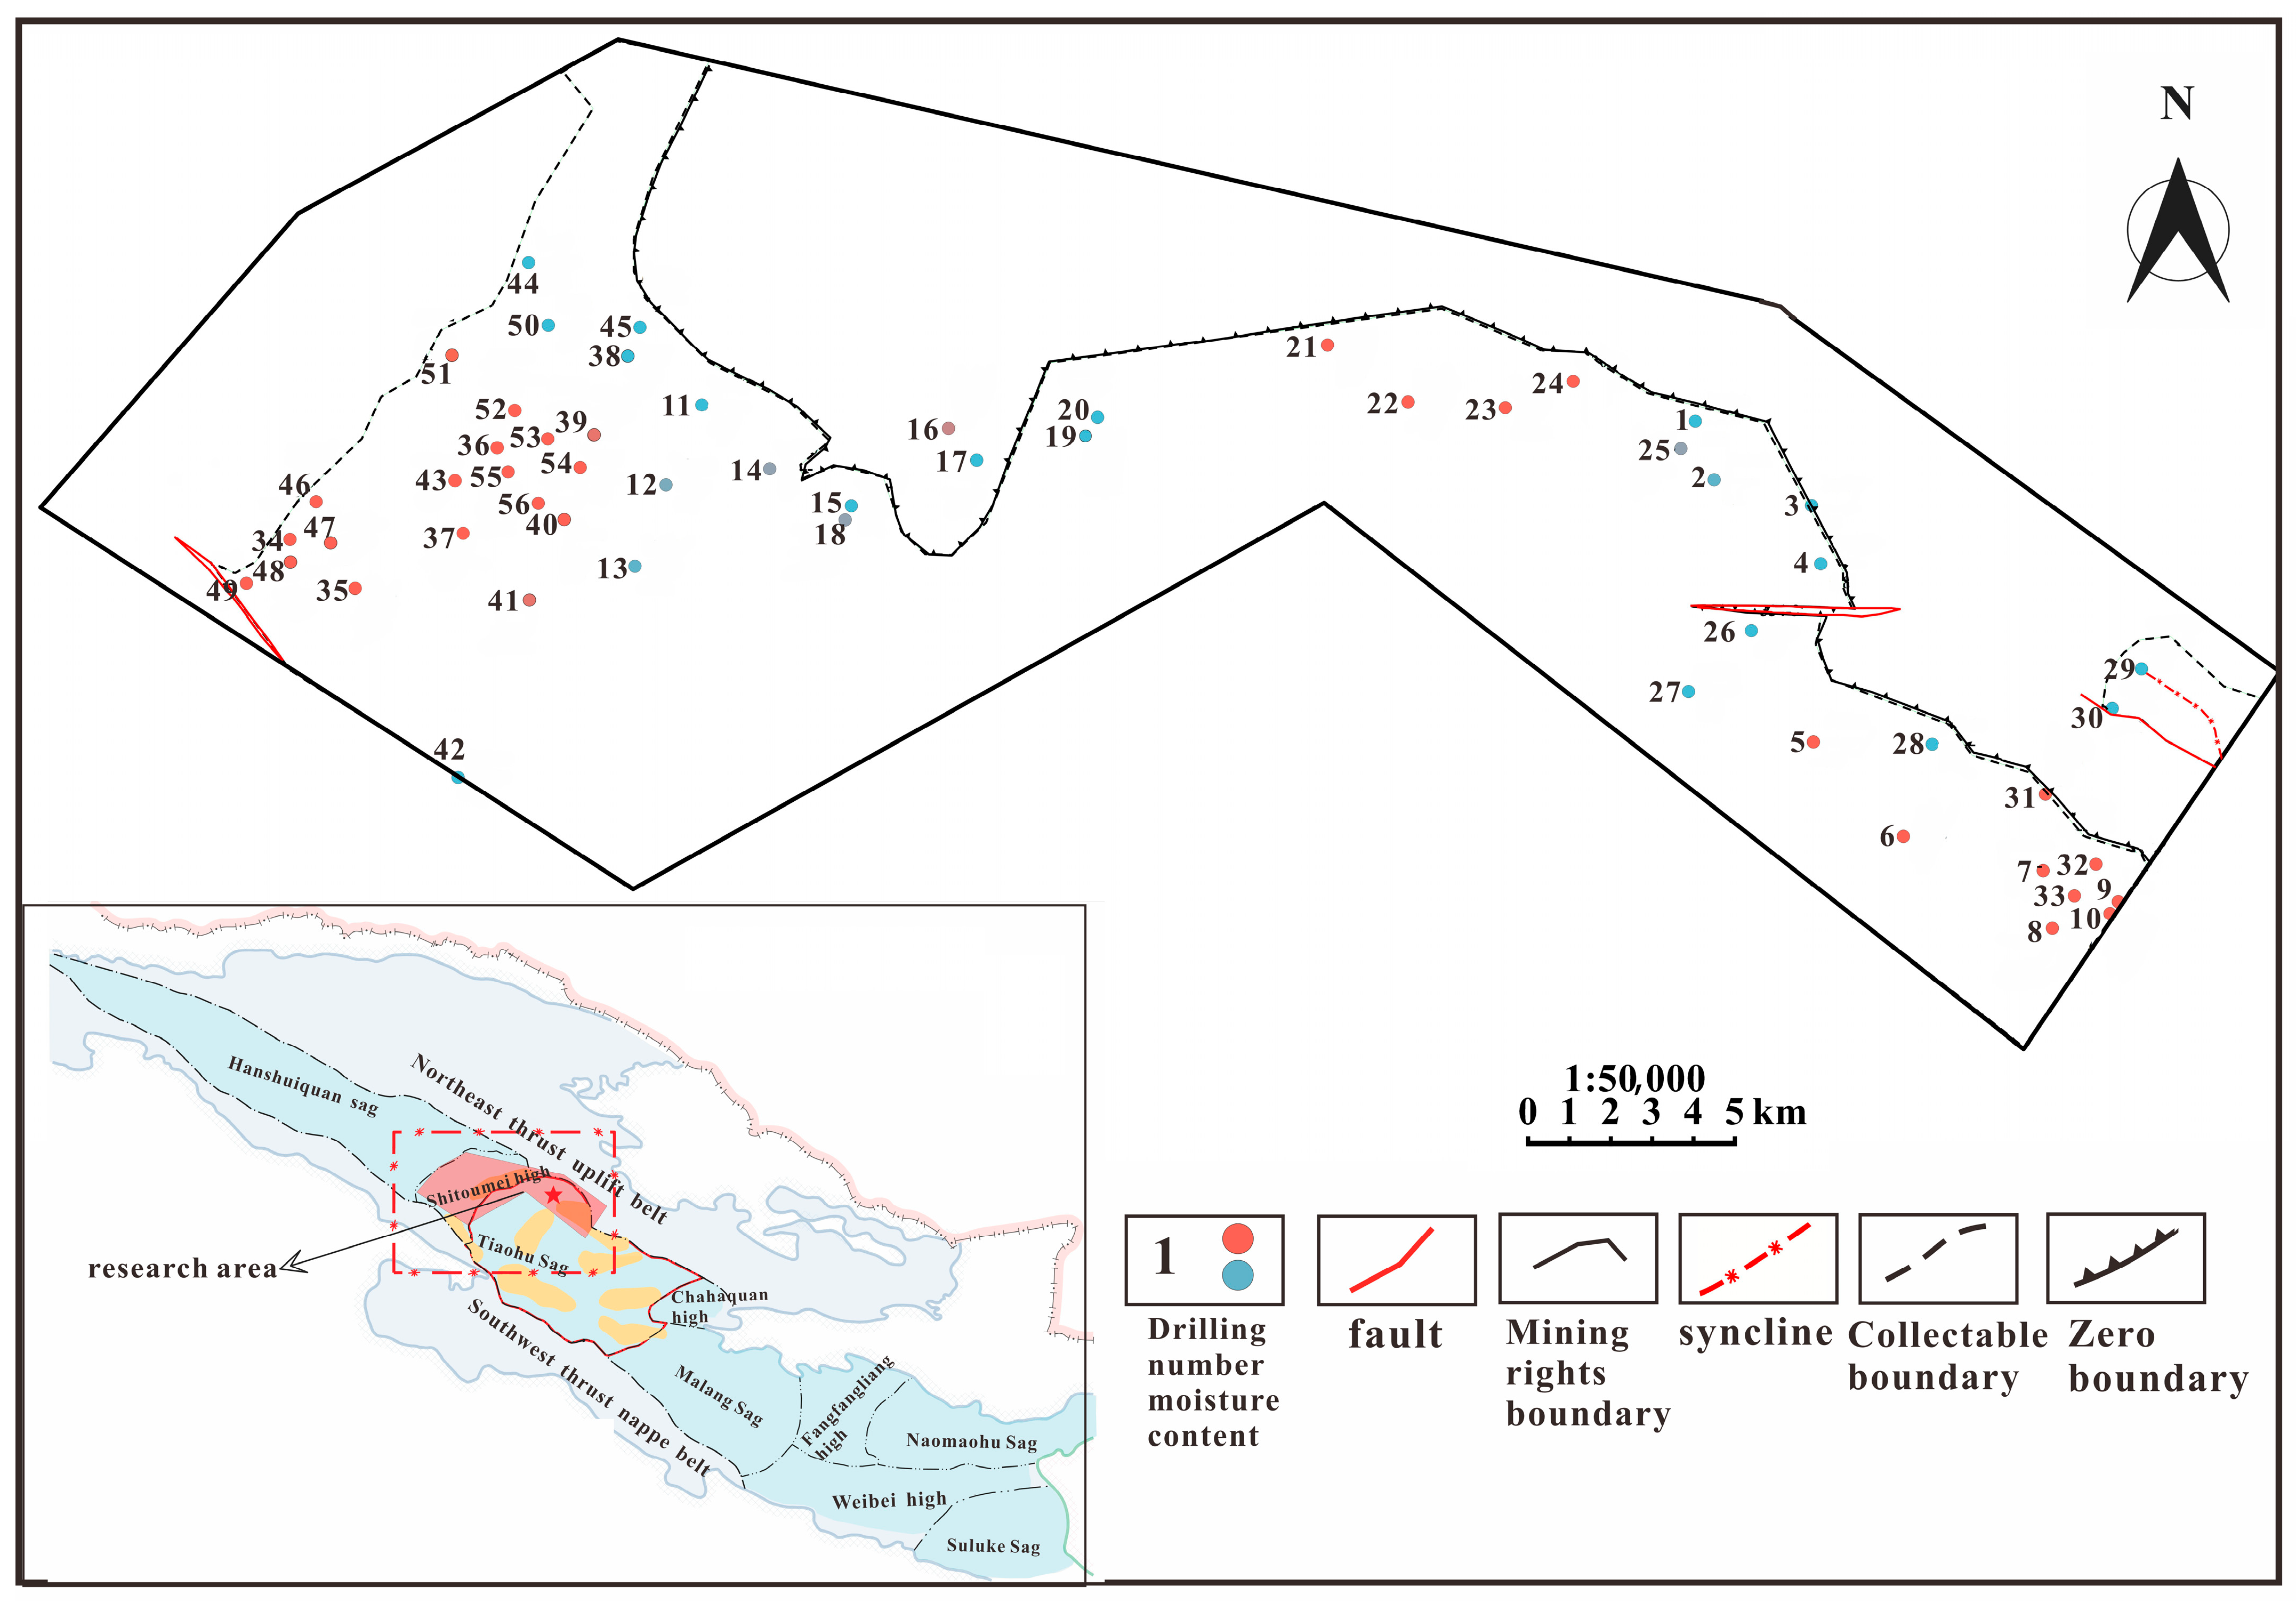
2. General Geology
3. Evaluation Method
3.1. Construction of Evaluation Index System
3.2. Determination of Index Weight
3.3. Mathematical Evaluation Method of Geological Selection
4. Evaluation of Favorable Area of Target Coal Seam in the Study Area
4.1. Quantification of Regional Geological Indicators
4.1.1. Coal Quality Conditions
- (1)
- Coal type
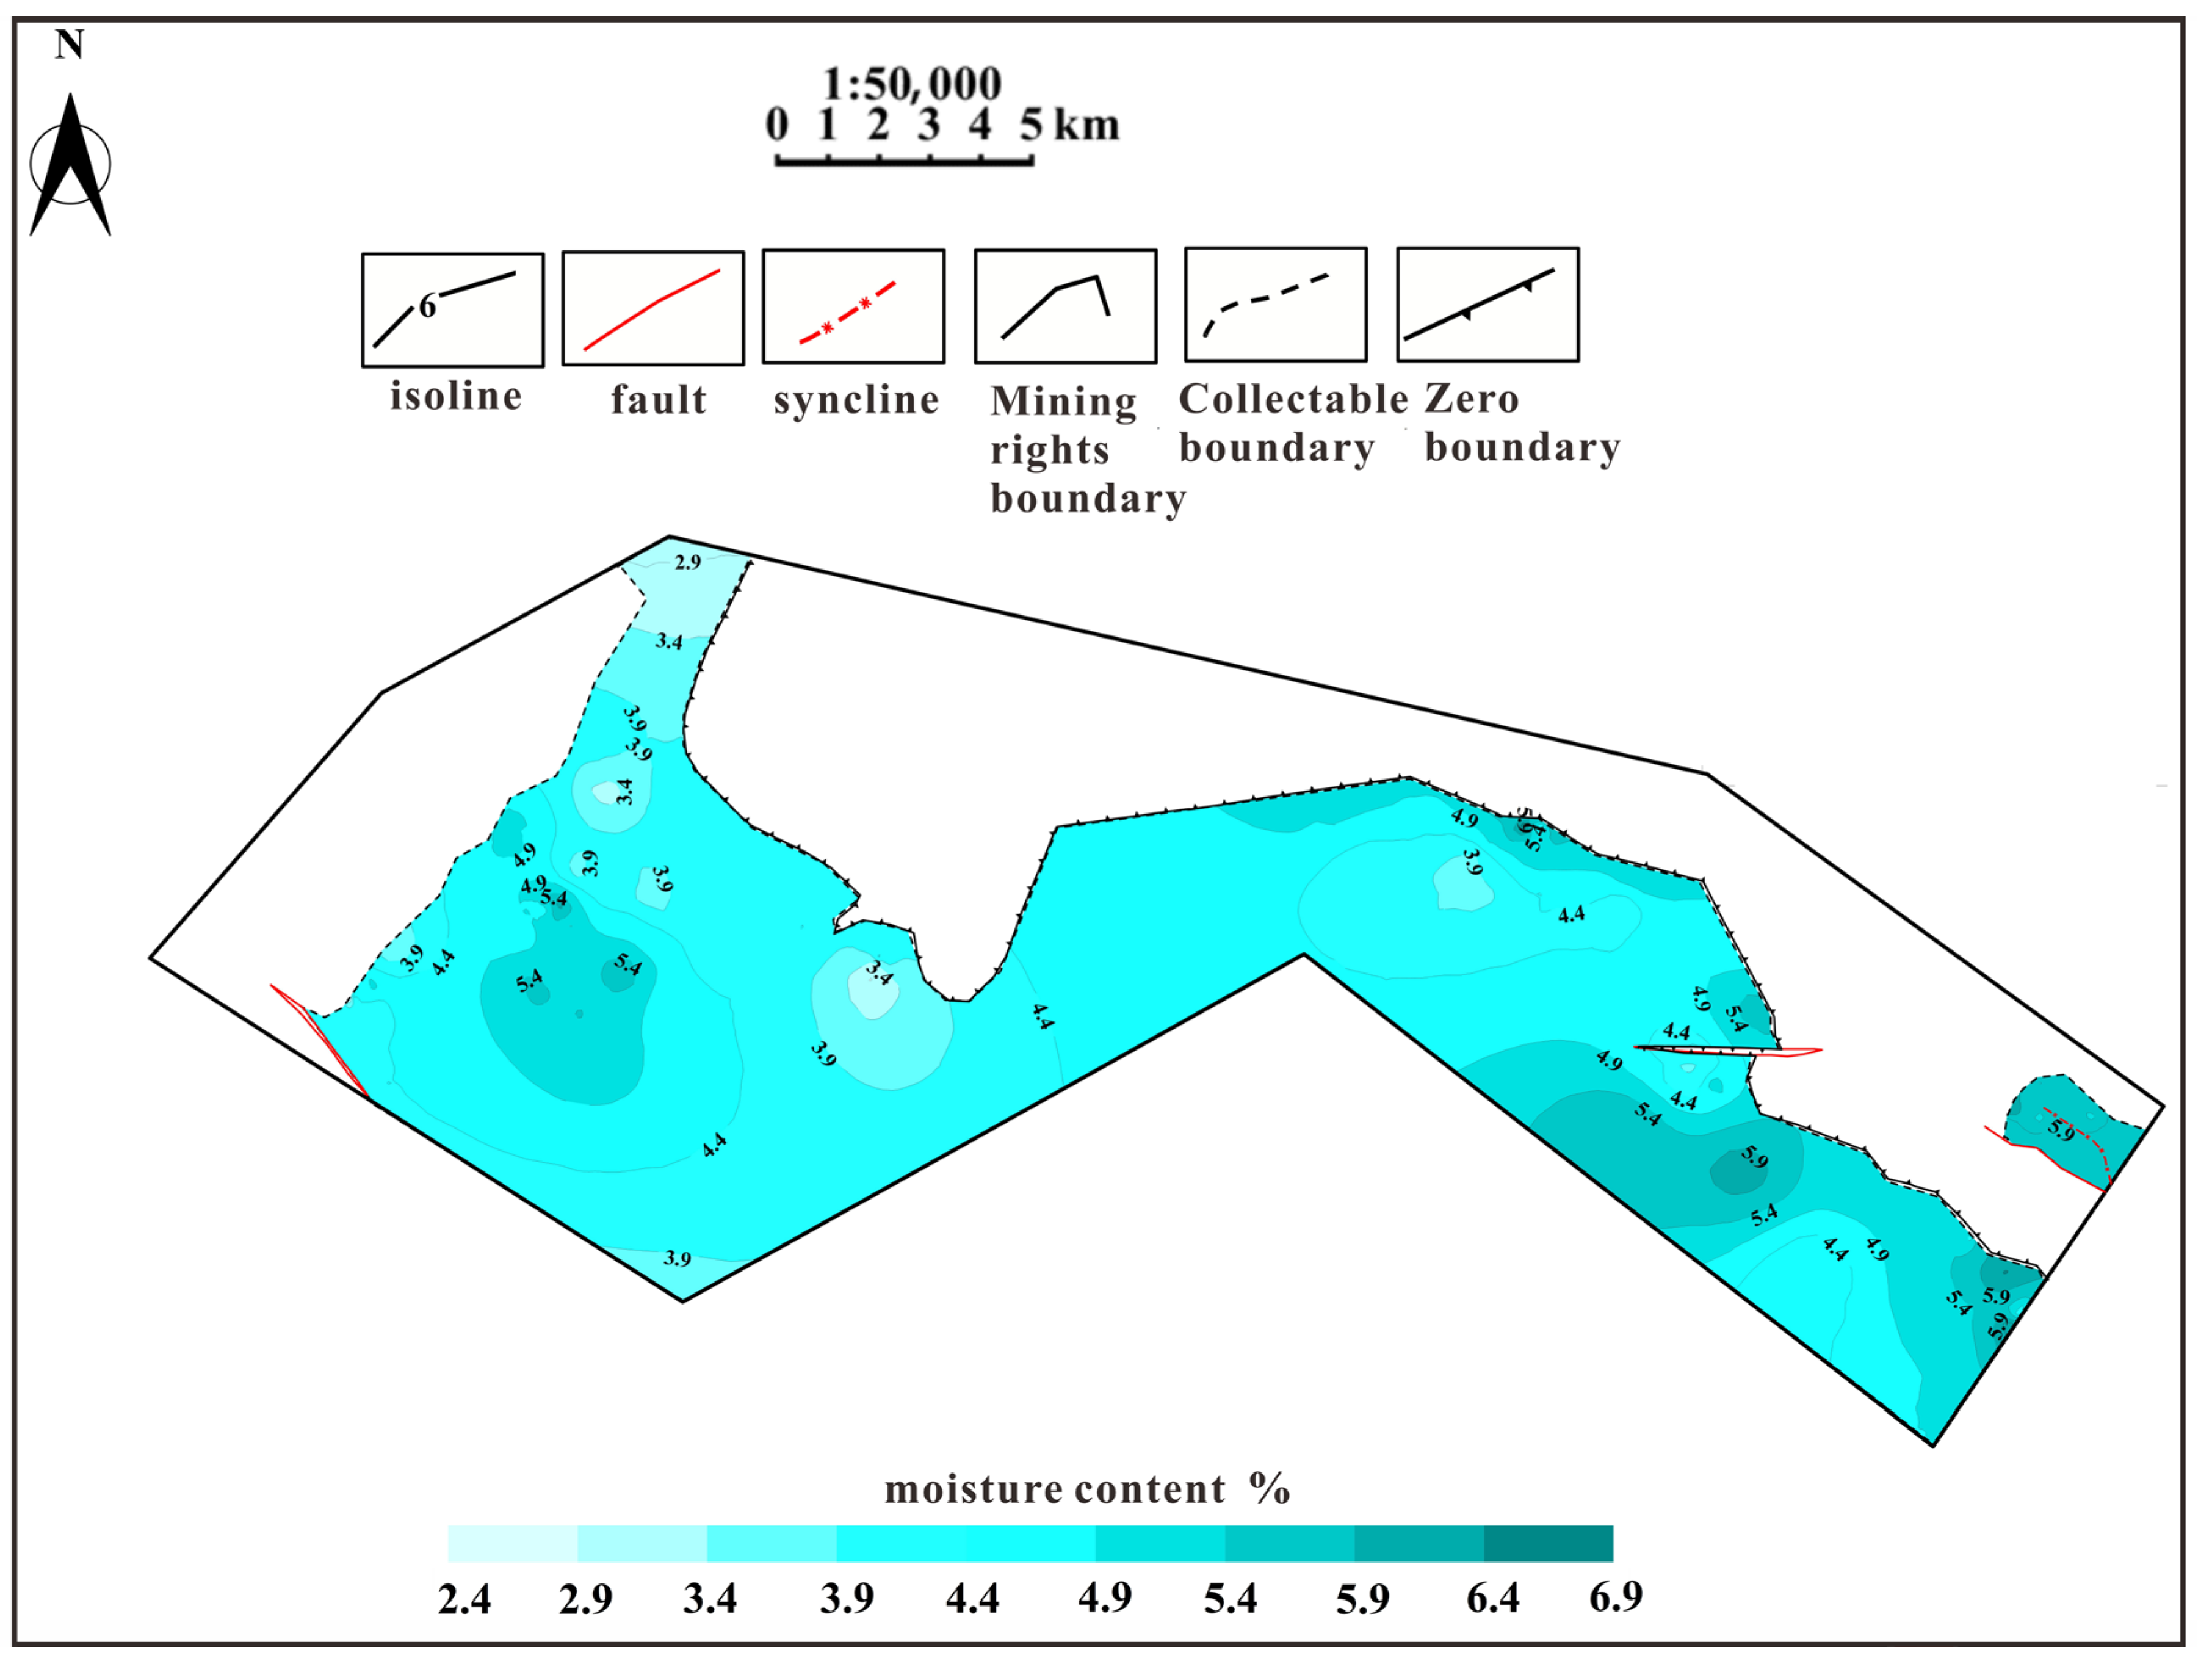
- (2)
- Moisture content
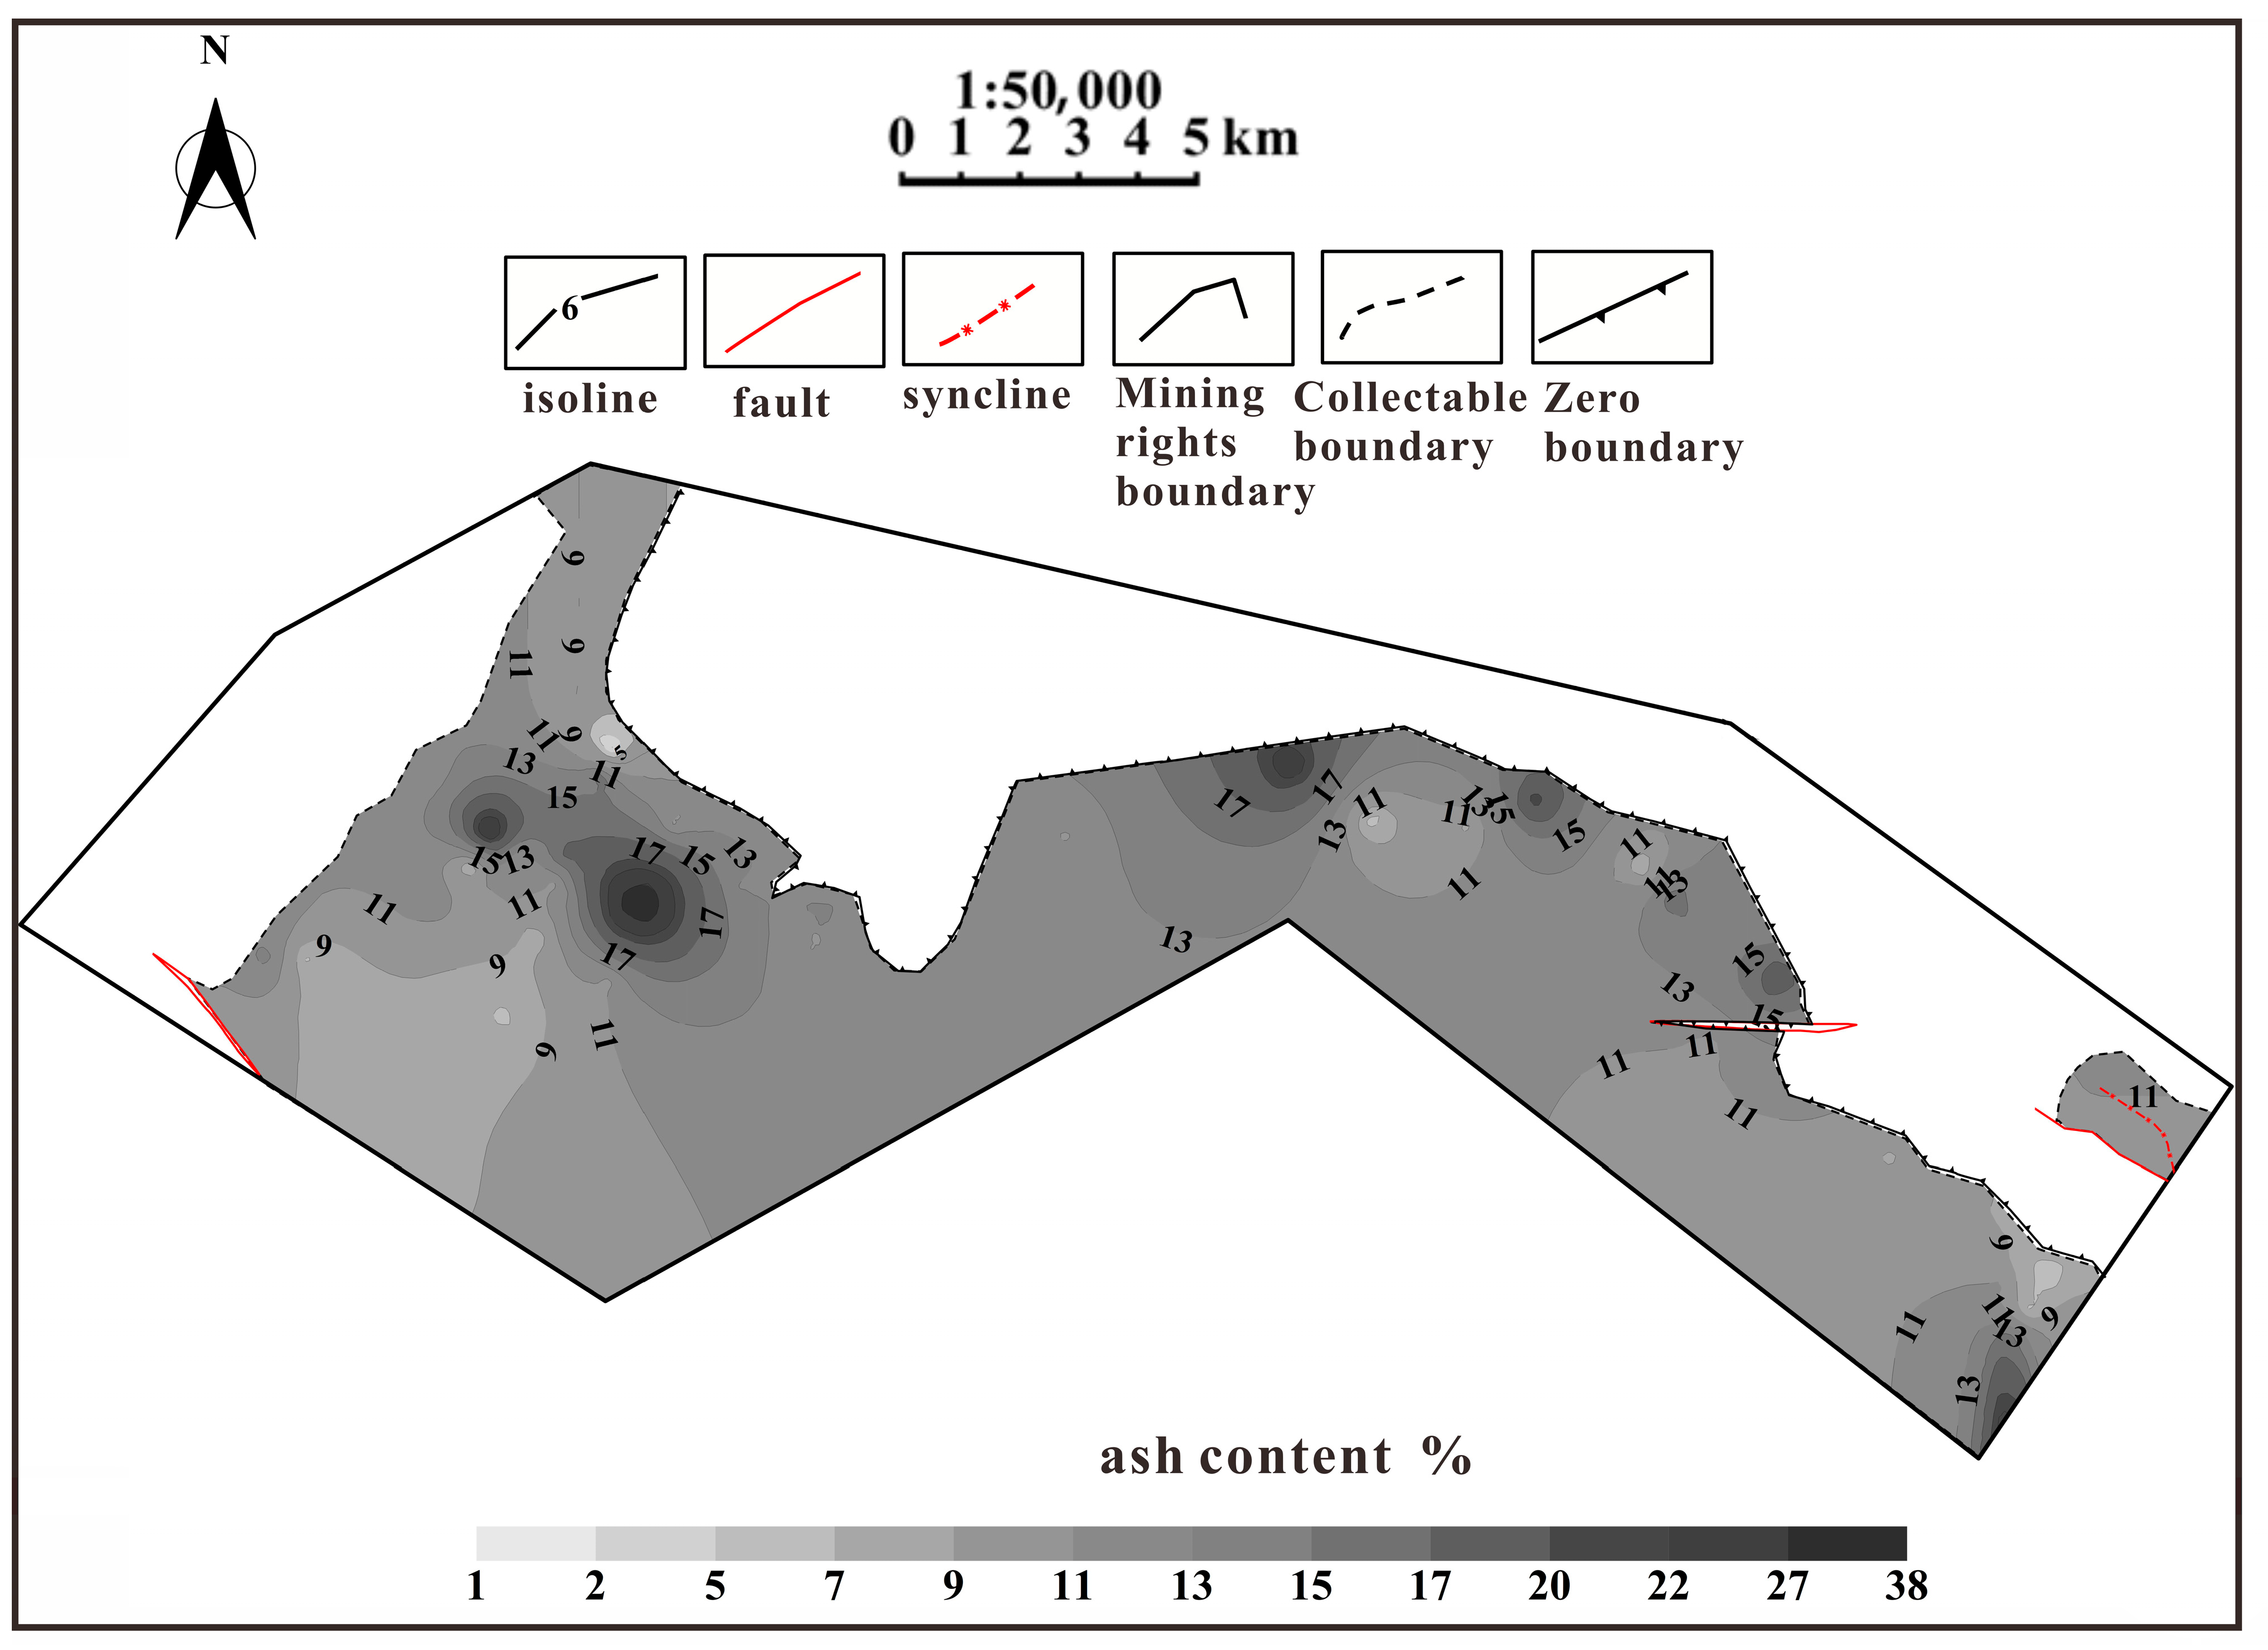
- (3)
- Ash yield
- (4)
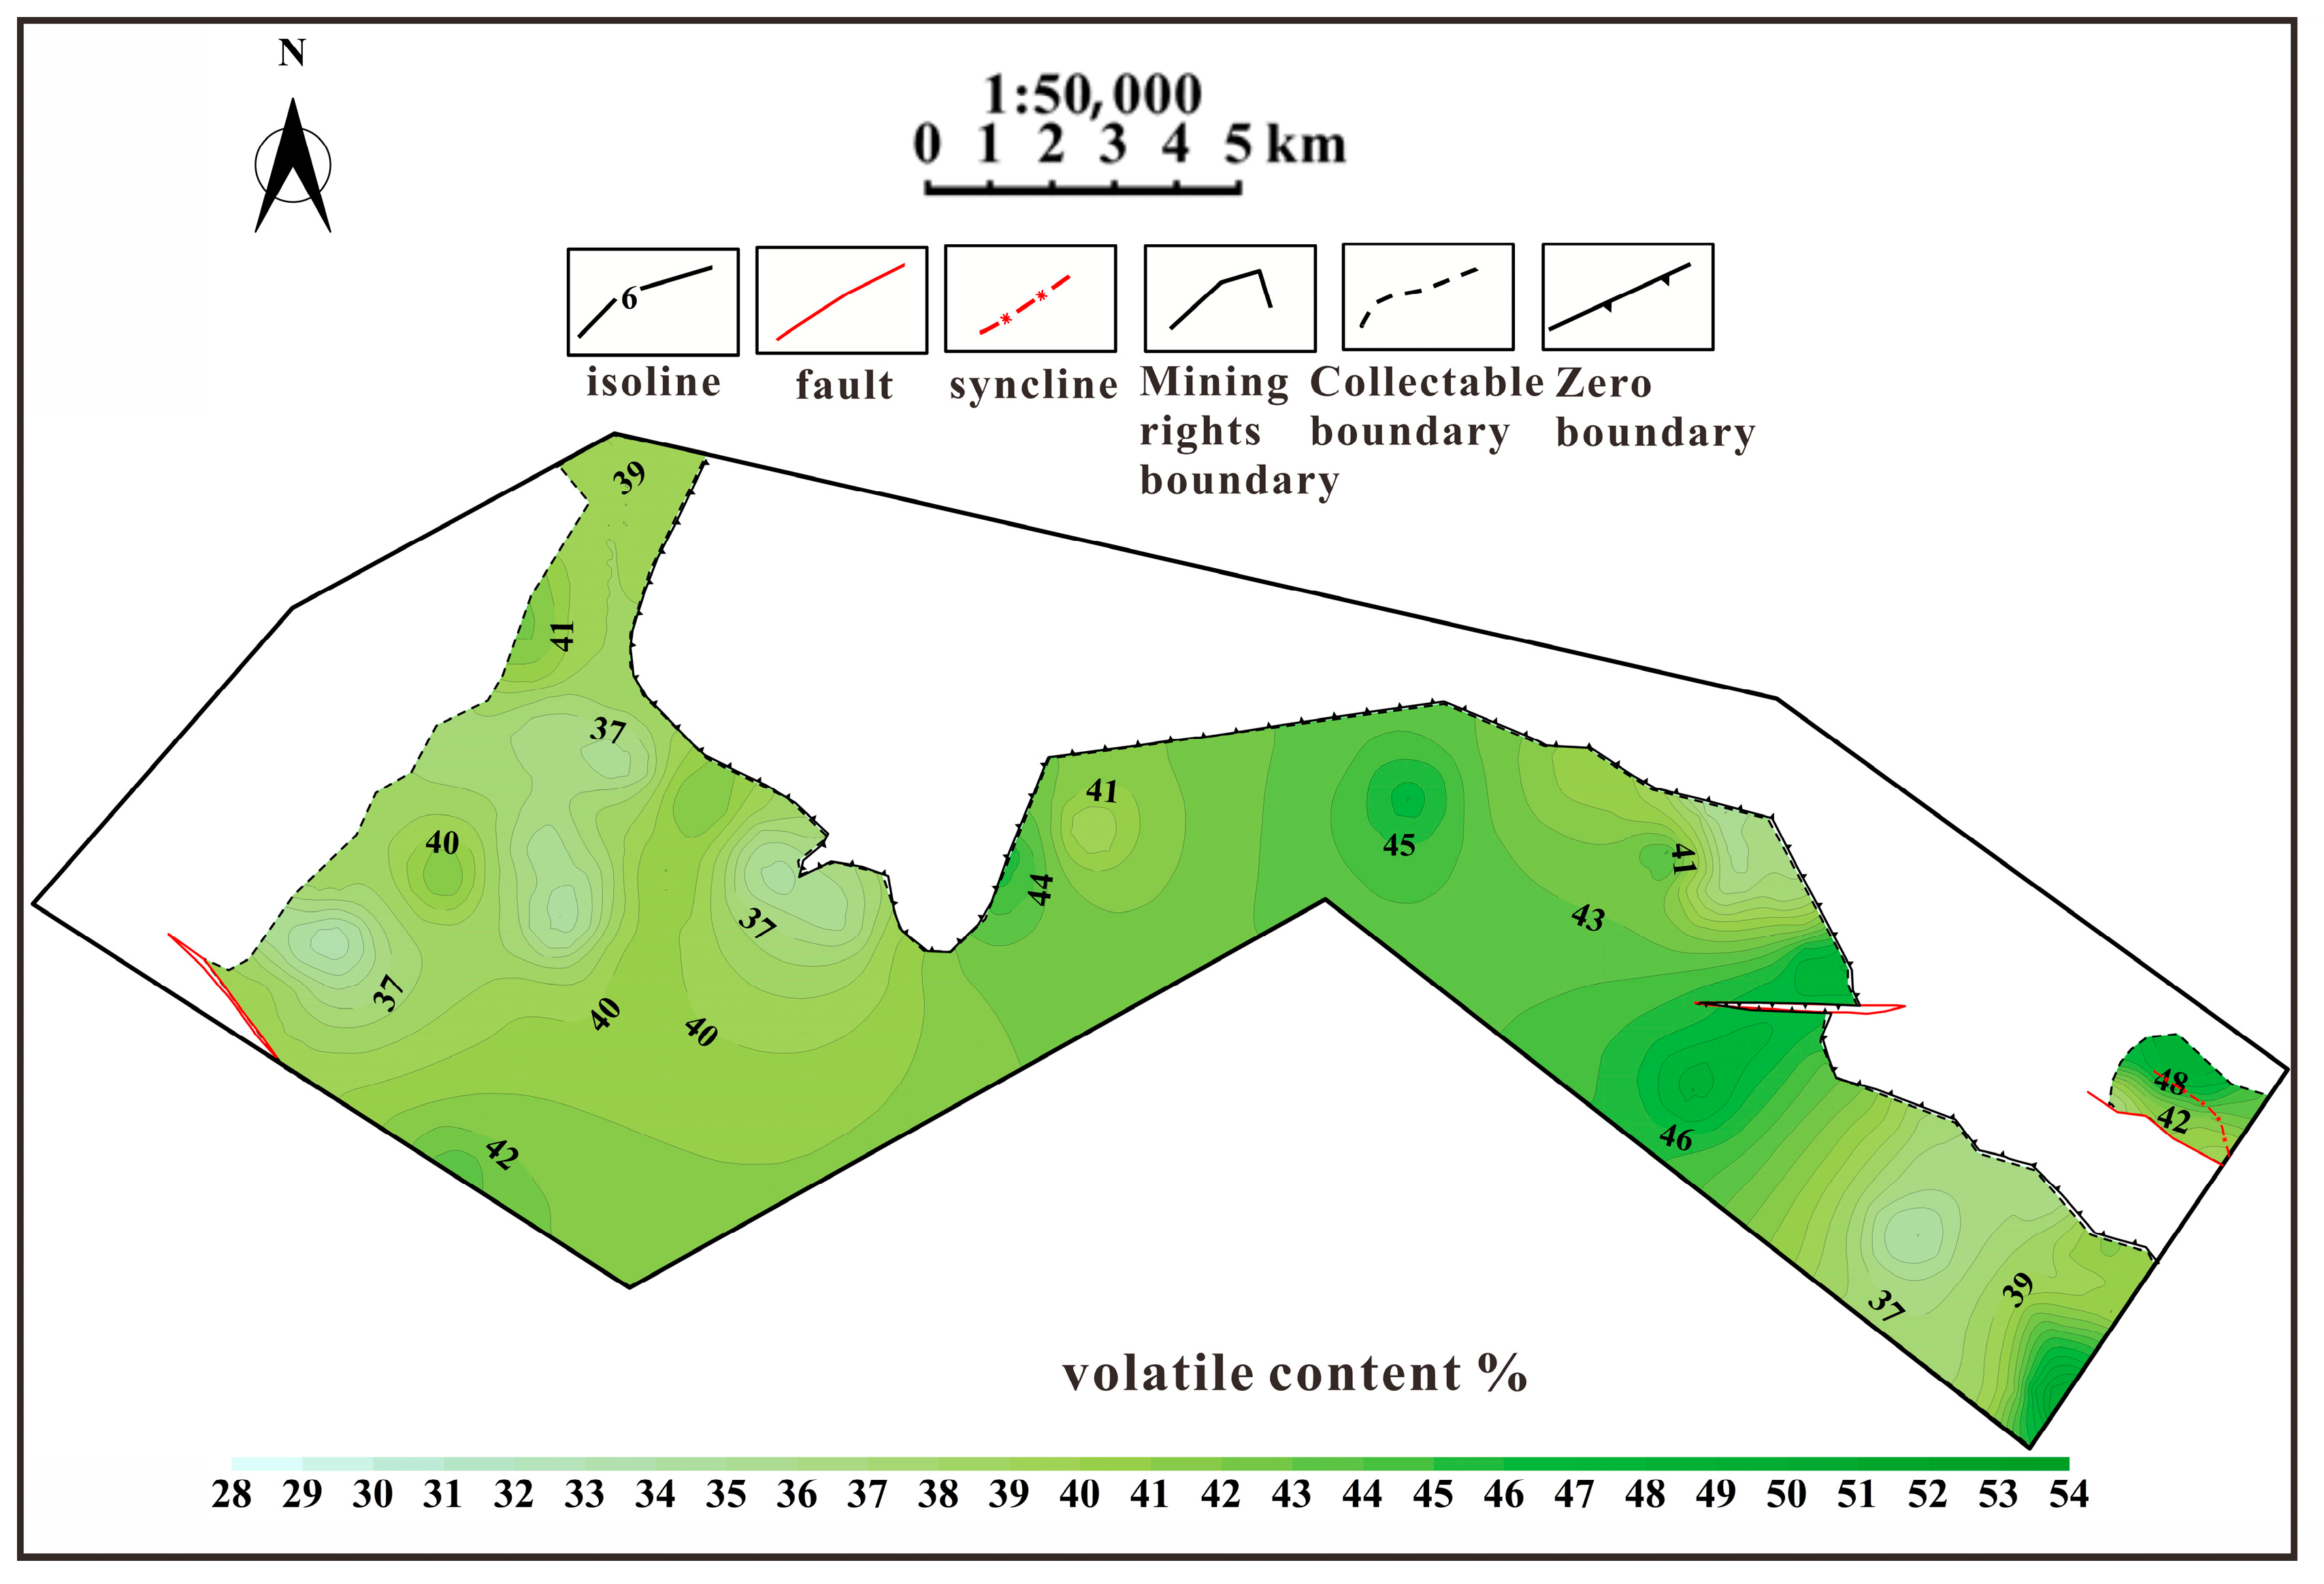
- Volatile yield
- (5)
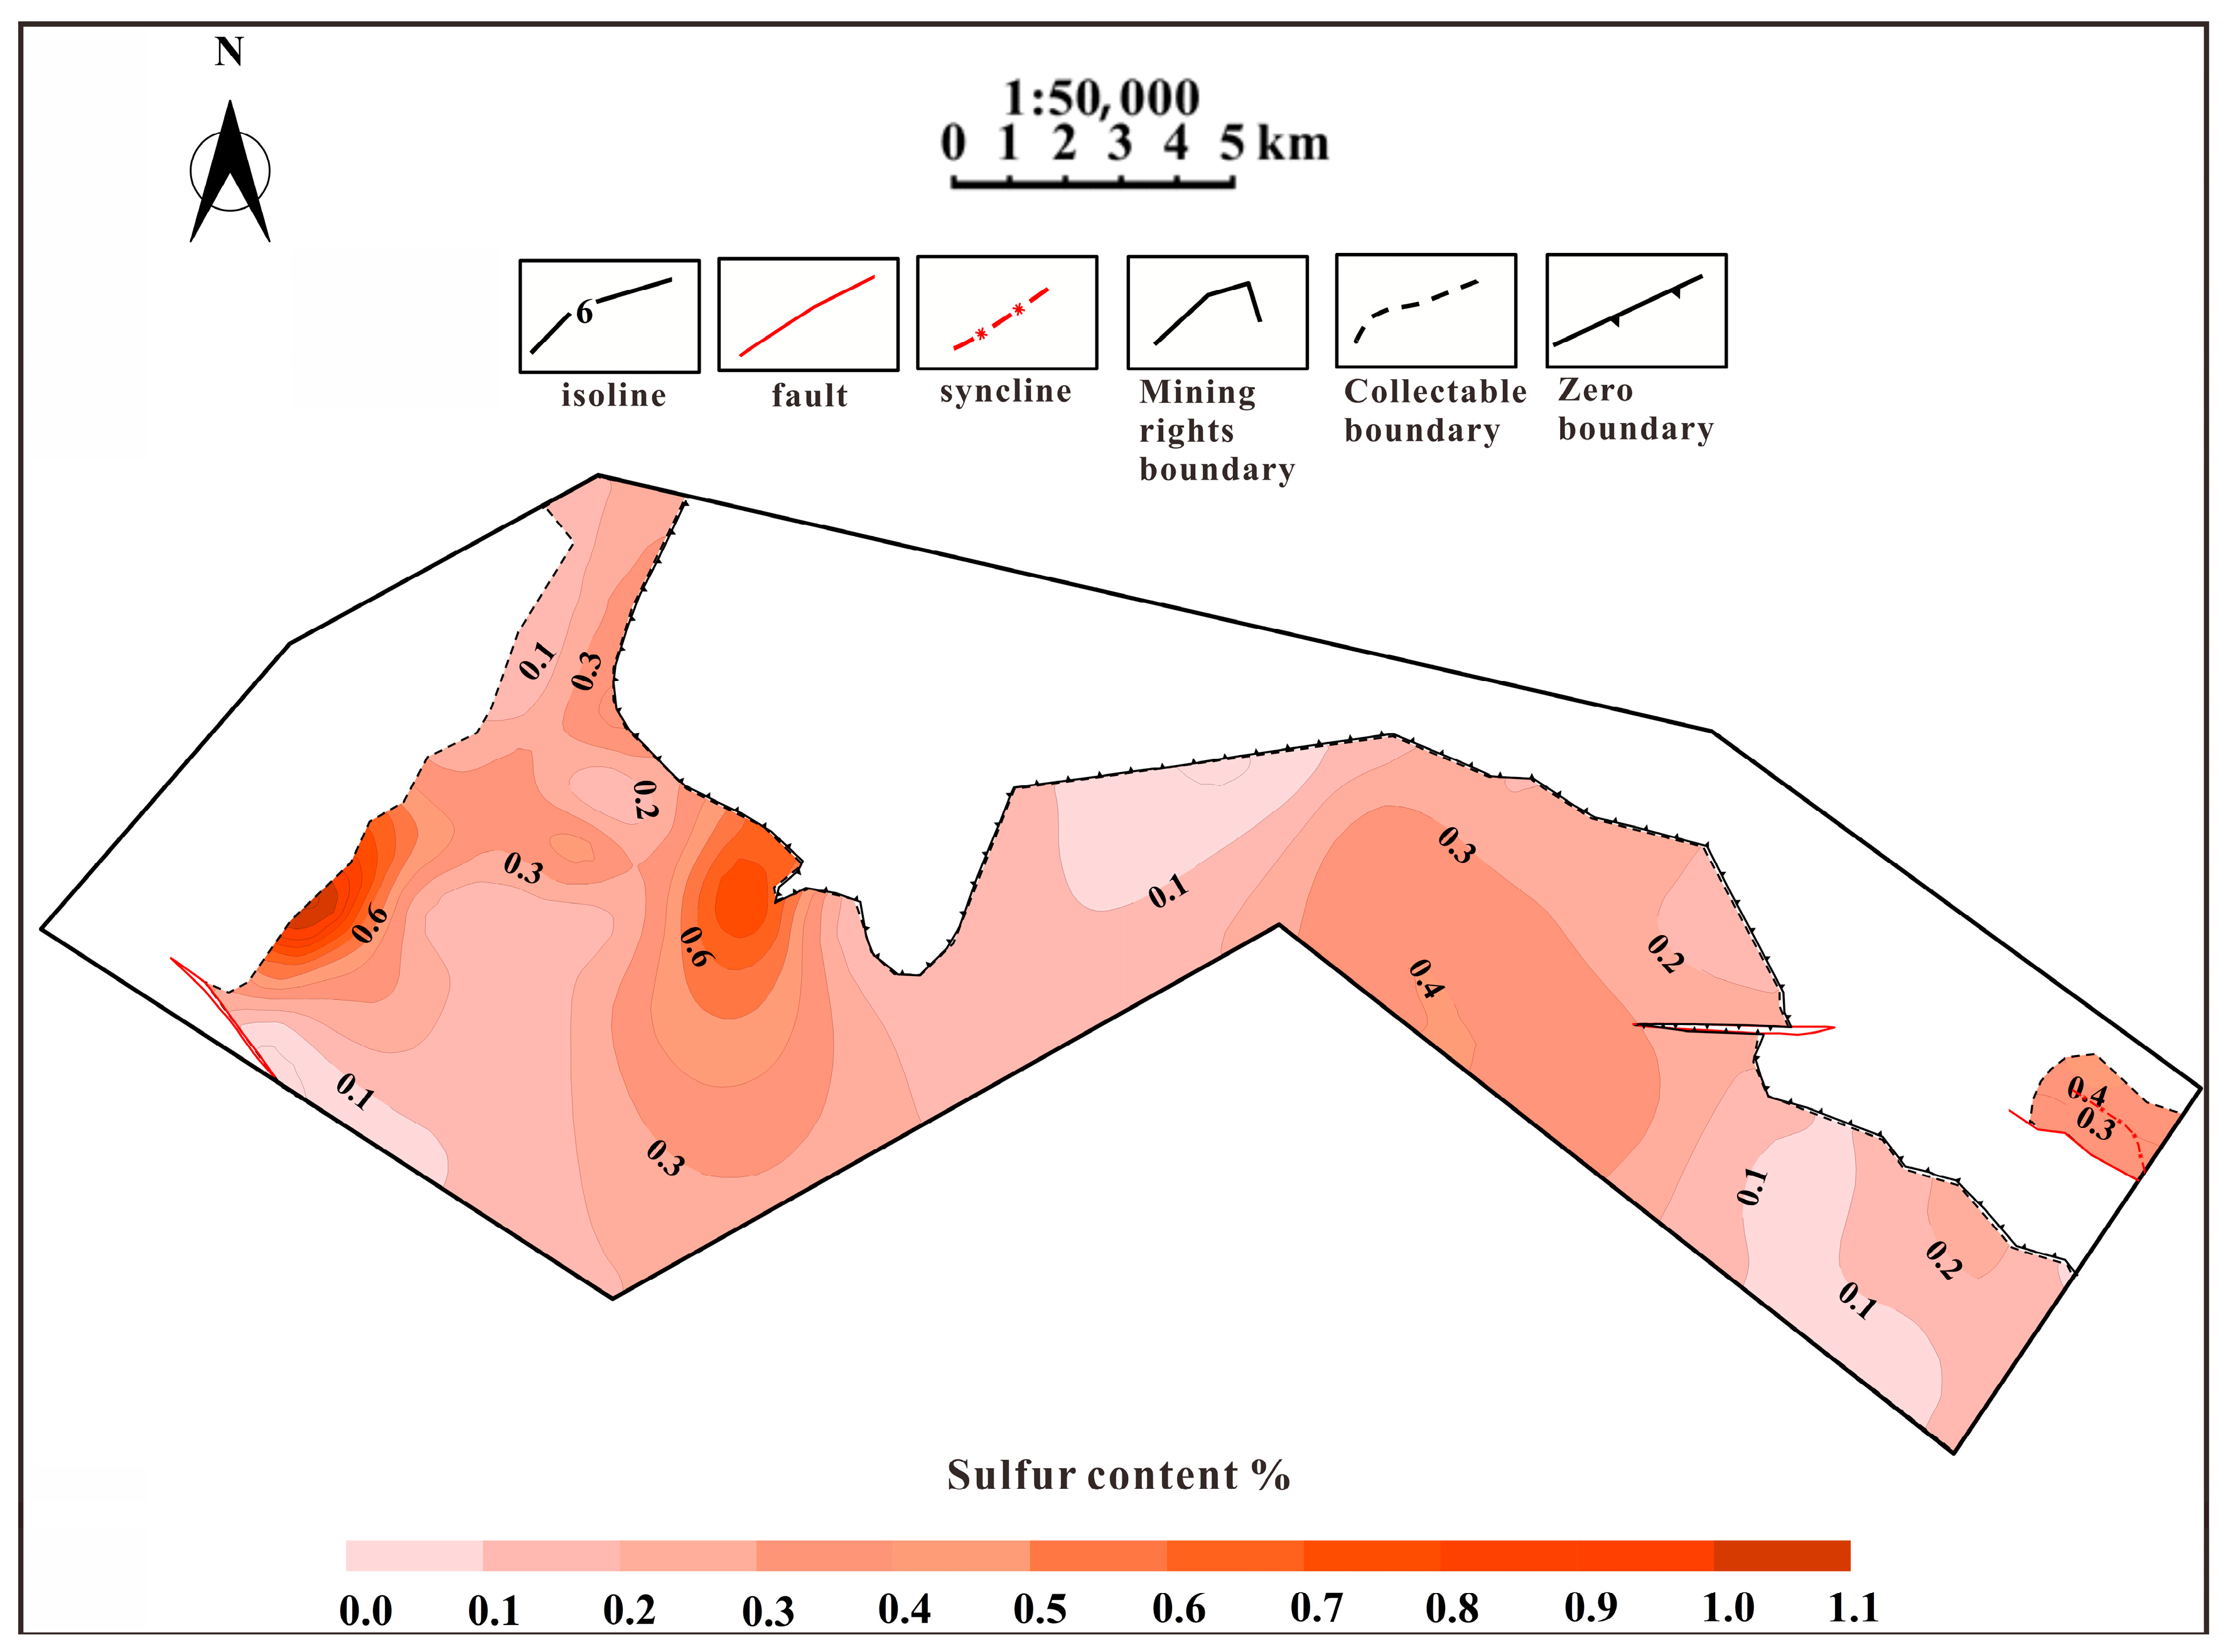
- Sulfur content
4.1.2. Coal Seam Occurrence Conditions
4.1.3. Surrounding Rock Conditions
4.1.4. Closed Condition
4.1.5. Hydrogeological Conditions
4.1.6. Environmental Geological Conditions
4.2. Determination of Membership Degree and Weight of Geological Evaluation Index
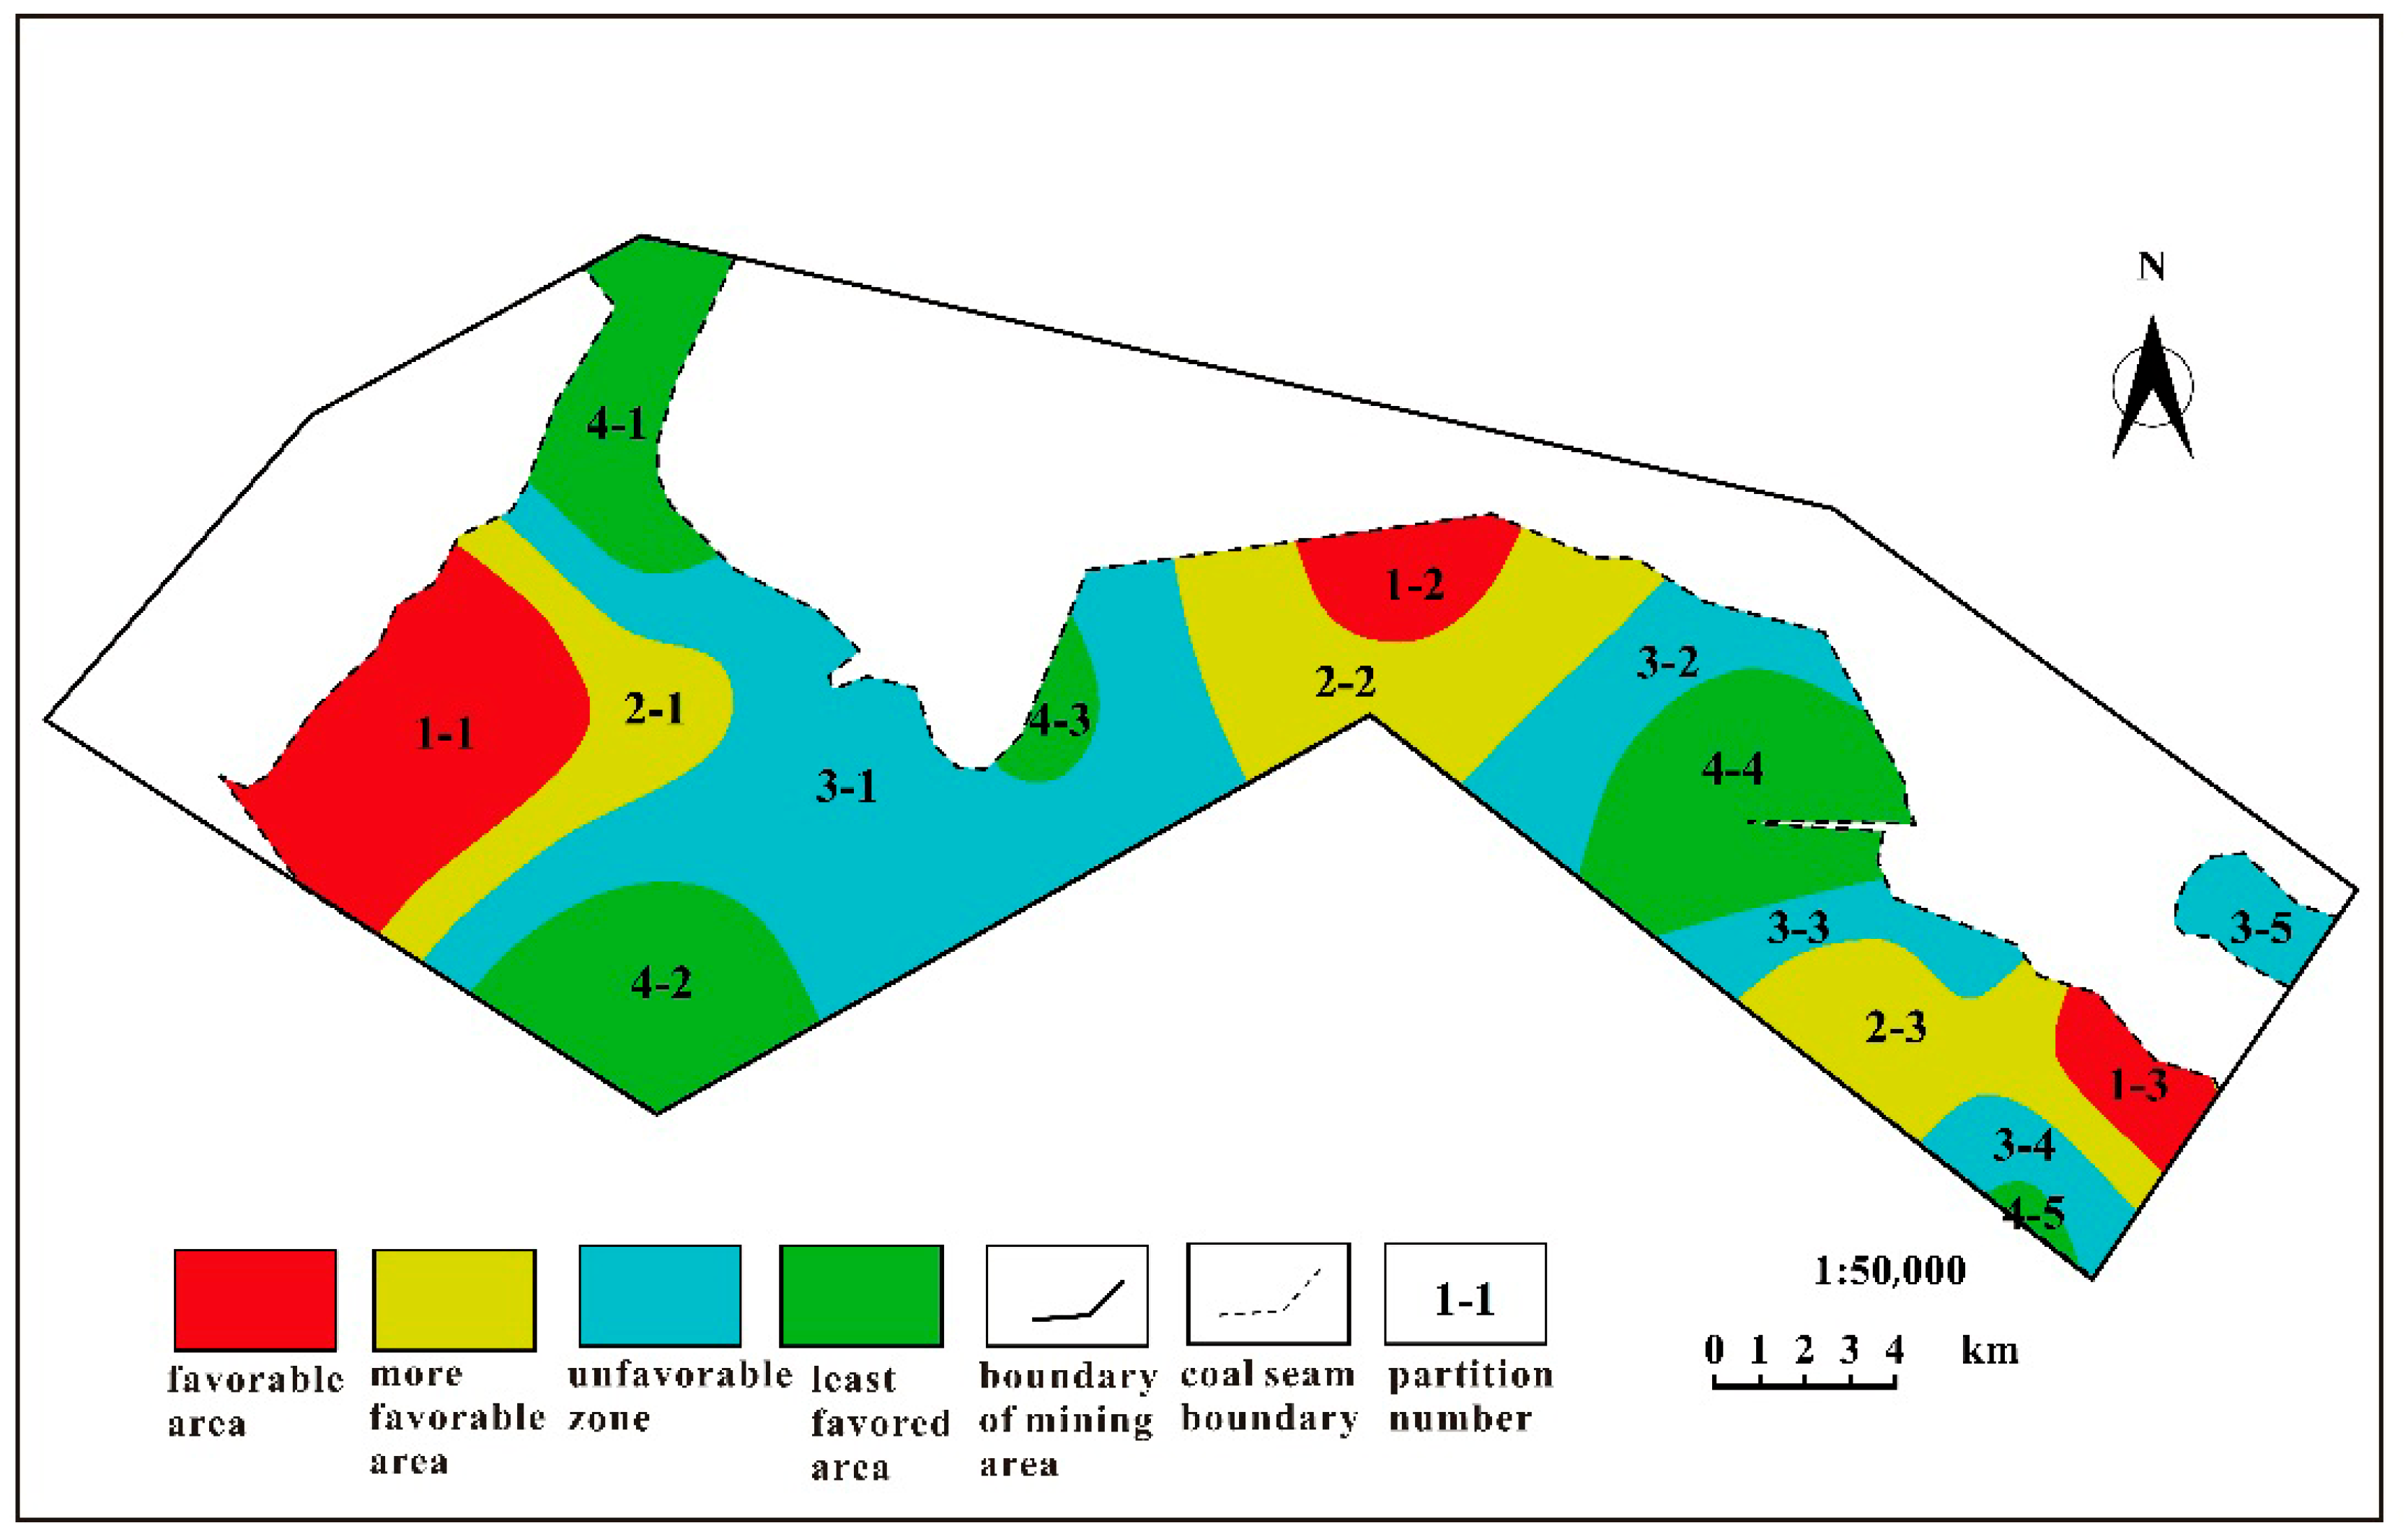
4.3. Comprehensive Evaluation
5. Geological Evaluation of In-Situ Pyrolysis Furnace Target Area in a Favorable Area
5.1. Geological Evaluation of Target Area Optimization of Pyrolysis Furnace
5.2. Selection of One-Vote Veto Index
- (1)
- Coal tar yield
- (2)
- Permeability
- (3)
- Porosity
- (4)
- Coal thickness
- (5)
- Buried depth
- (6)
- Coefficient of variation of coal thickness
- (7)
- Distance from large normal fault
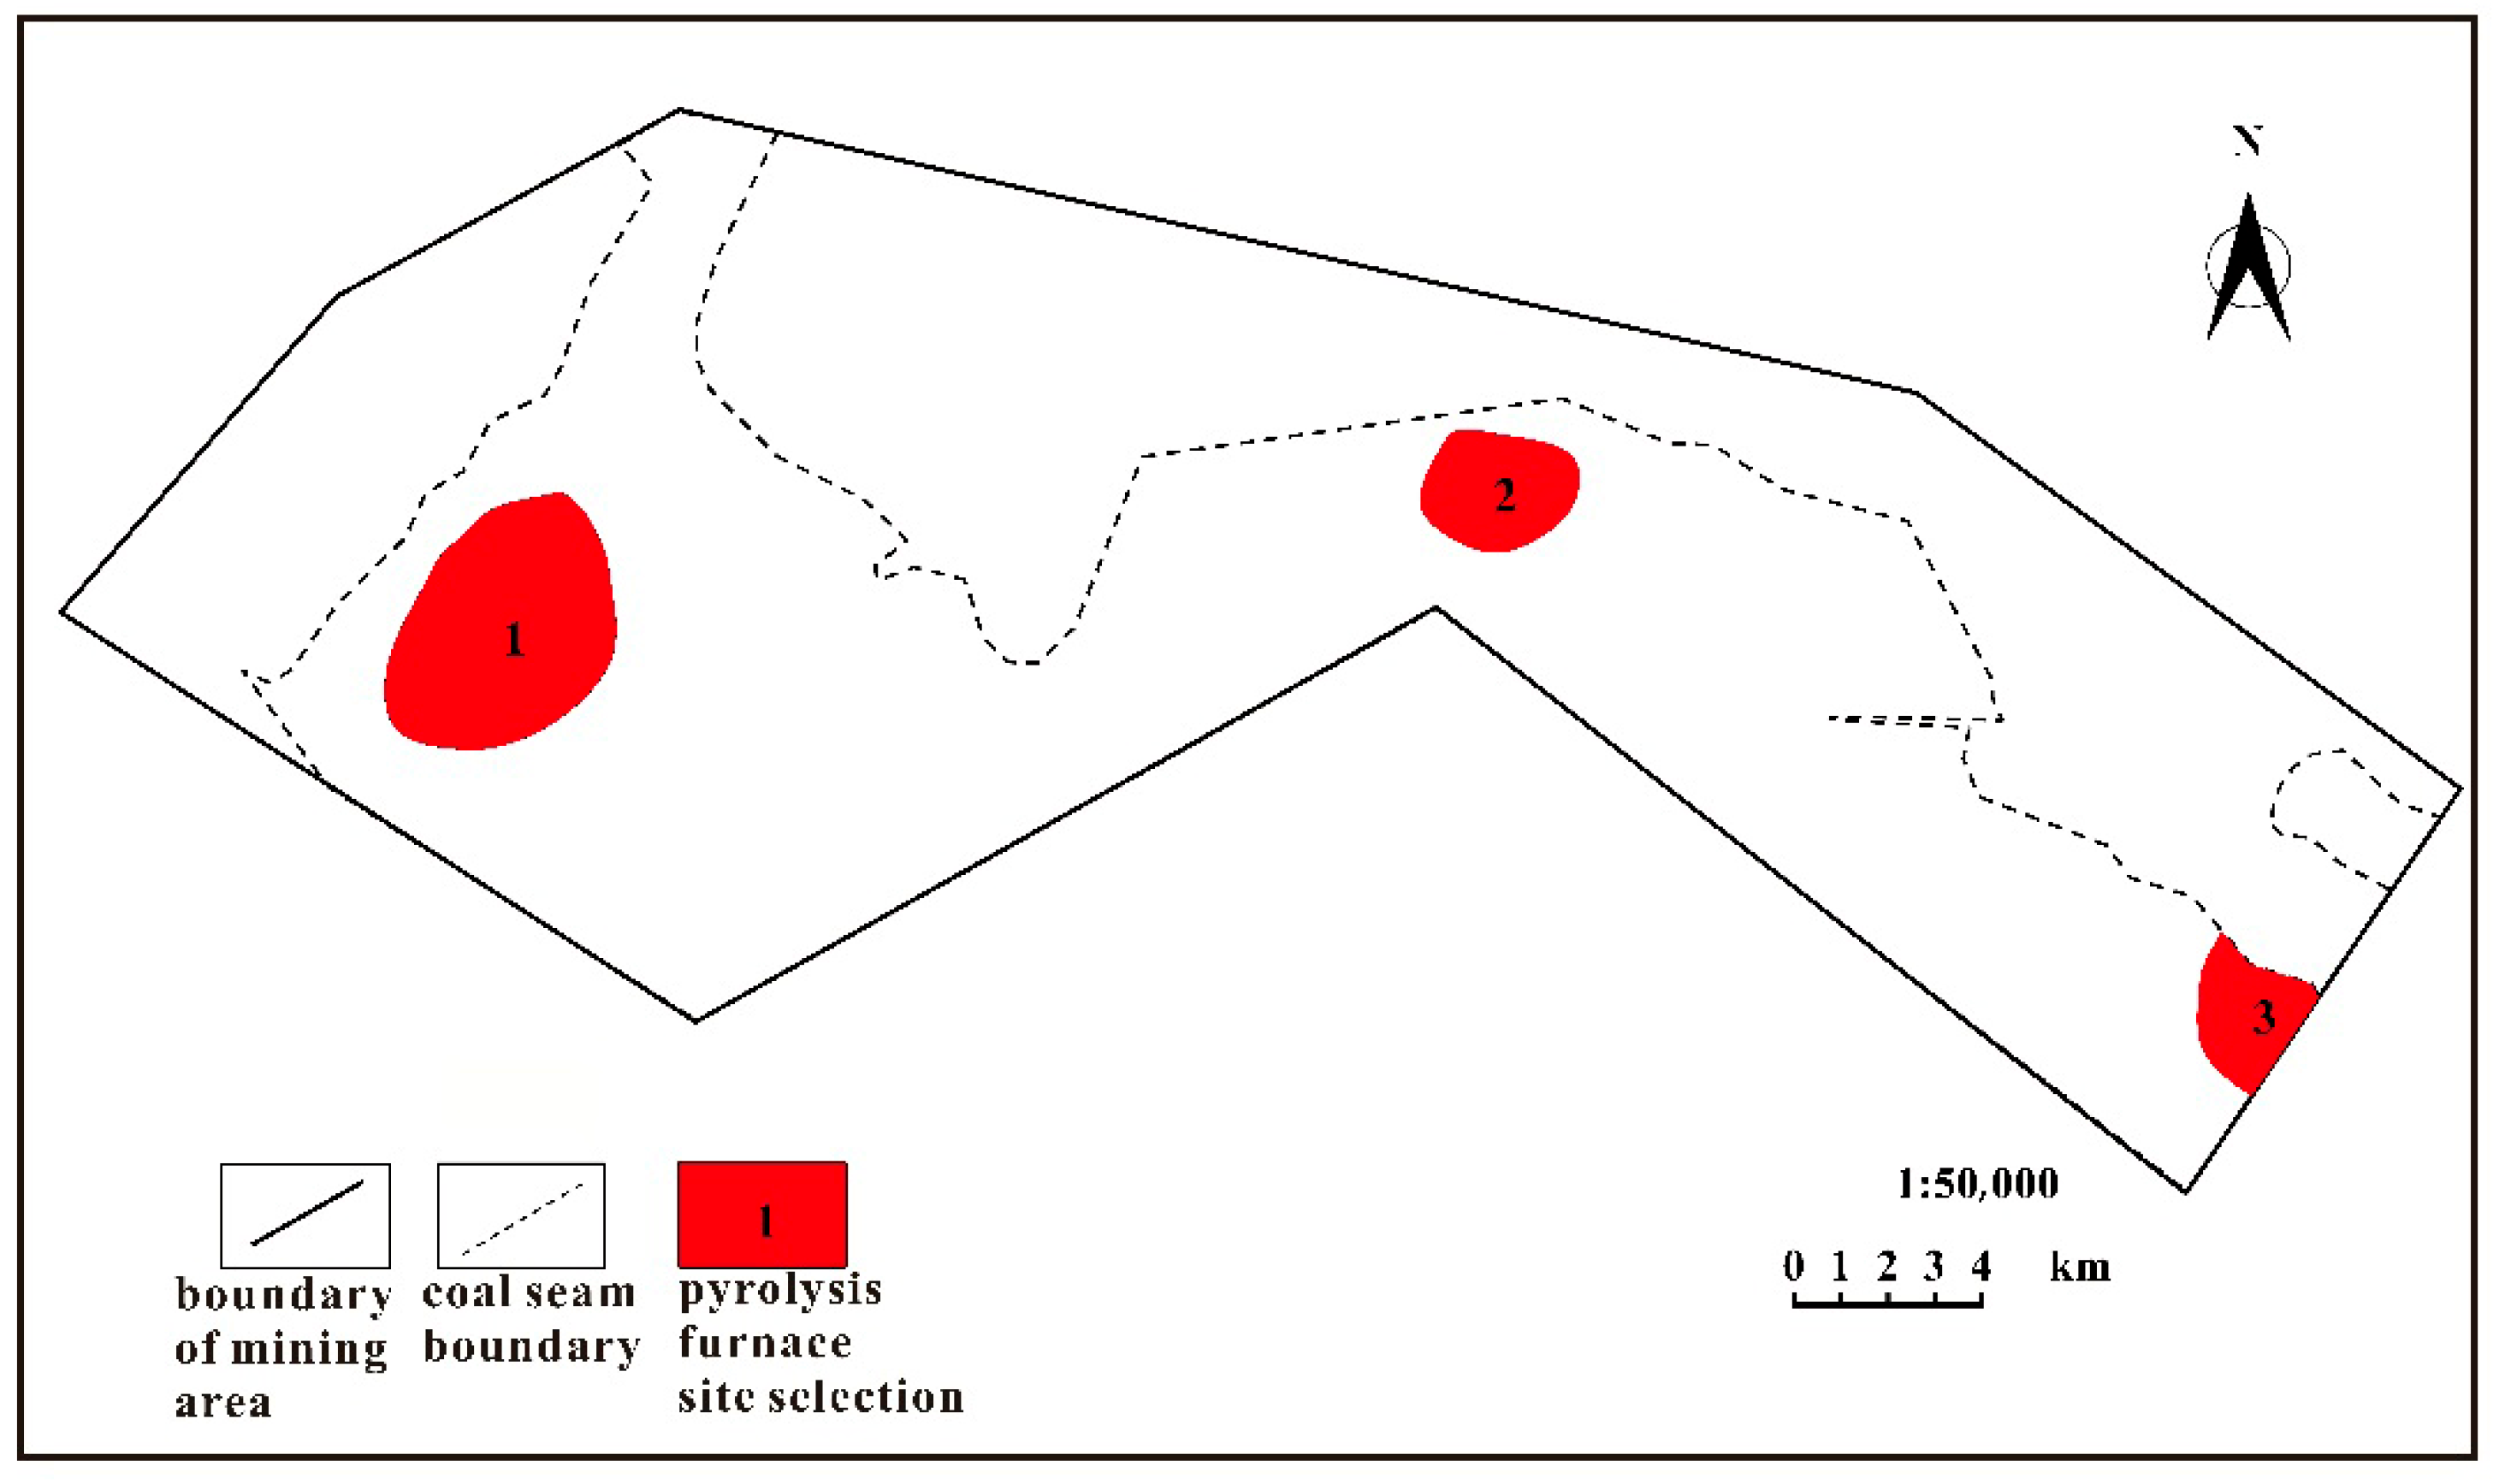
5.3. Pyrolysis Furnace Target Optimization
6. Conclusions
Supplementary Materials
Author Contributions
Funding
Data Availability Statement
Acknowledgments
Conflicts of Interest
References
- Wang, S.; Shi, Q.; Wang, S.; Shen, Y.; Sun, Q.; Cai, Y. Resource property and exploitation concepts with green and low-carbon of tar-rich coal as coal-based oil and gas. J. China Coal Soc. 2021, 46, 1365–1377. [Google Scholar]
- Wang, S.; Wang, H.; Ren, S.; Dong, S.; Zheng, D.; Tan, K.; Hou, E.; Wang, S.; Qu, Y.; Jiao, X. Potential Analysis and Technical Conception of Exploitation and Utilization of Tar-Rich Coal in Western China. Strateg. Study CAE 2022, 24, 49–57. [Google Scholar] [CrossRef]
- Zhu, Y.; Li, C.; Cao, H.; Wu, L.; Yang, F.; Fu, S.; Zhou, J. Effects of spatial distribution of tar-rich coal and oil shale and primary factors on product characteristics during microwave co-pyrolysis. Fuel 2025, 385, 134085. [Google Scholar] [CrossRef]
- Wang, K.; Guo, L.; Zhai, X.; Deng, J.; Li, Y. Hydrogen abstraction reaction mechanism of oil-rich coal spontaneous combustion. Fuel 2024, 367, 131538. [Google Scholar] [CrossRef]
- Chen, M.; Du, Y.; Wang, C.; Hou, Y.; Yuan, T.; Chang, L.; Deng, L.; Che, D. Study on thermo-fluid-chemical coupling simulation and characteristic fields evolution during in-situ pyrolysis of tar-rich coal. Int. J. Heat Fluid Flow 2025, 116, 109903. [Google Scholar] [CrossRef]
- Zhang, J. Study on Optimizing Layout of Resource Development Based on Fuzzy Analytic Hierarchy Process. Shandong Land Resour. 2022, 38, 61–66. [Google Scholar]
- Li, M.; Wang, H.; Wang, D.; Shao, Z.; He, S. Risk assessment of gas explosion in coal mines based on fuzzy AHP and bayesian network. Process Saf. Environ. Prot. 2020, 135, 207–218. [Google Scholar] [CrossRef]
- Paraskevis, N.; Roumpos, C.; Stathopoulos, N.; Aikaterini, A. Spatial analysis and evaluation of a coal deposit by coupling AHP & GIS techniques. Int. J. Min. Sci. Technol. 2019, 29, 943–953. [Google Scholar] [CrossRef]
- Ning, S.; Cao, D.; Zhu, S.; Qiao, J.; Wei, Y.; Deng, X.; Zhang, J.; Li, C. Discussion on comprehensive evaluation technical method of coal resources. China Min. Mag. 2019, 28, 73–79. [Google Scholar]
- Du, J.; Shen, Y.; Li, Y.; Wang, J. Comprehensive evaluation of coal resource development and utilization based on integrated AHP/entropy weight method: Taking Luning Coal Industry Group as an example. China Min. Mag. 2020, 29, 32–37. [Google Scholar]
- Chun, Y.; Zhang, J.; Han, Y. Green development level assessment and obstacle analysis of China’s coal-resource-based regions. Heliyon 2023, 9, e22495. [Google Scholar] [CrossRef]
- Li, H.; Yao, Z.; Li, N.; Gao, J.; Xie, Q.; Wang, Q. Occurrence characteristics and resource potential evaluation of tar-rich coal for No.5-2 coal seam in Shenfu Mining Area. Coal Geol. Explor. 2021, 49, 26–32+41. [Google Scholar]
- Wu, M.; Qin, Y.; Li, G.; Shen, J.; Song, X.; Zhu, S.; Han, L. Research progress on influencing factors and evaluation methods of underground coal gasification. Coal Sci. Technol. 2022, 50, 259–269. [Google Scholar]
- Wang, J.; Yang, S.; Wei, W.; Zhang, J.; Song, Z. Drawing mechanisms for top coal in longwall top coal caving (LTCC): A review of two decades of literature. Int. J. Coal Sci. Technol. 2021, 8, 1171–1196. [Google Scholar] [CrossRef]
- Fang, G.; Liu, Y.; Liang, X.; Huang, H. Hydrogeological characteristics and mechanism of a water-rich coal seam in the Jurassic coalfield, northern Shaanxi Province, China. Arab. J. Geosci. 2020, 13, 1088. [Google Scholar] [CrossRef]
- Smith, E.K.; Barakat, S.M.; Akande, O.; Ogbaga, C.C.; Okoye, P.U.; Okolie, J.A. Subsurface combustion and gasification for hydrogen production: Reaction mechanism, techno-economic and lifecycle assessment. Chem. Eng. J. 2024, 480, 14809. [Google Scholar] [CrossRef]
- Xu, S.; Zhang, P.; Cheng, G.; Wu, H. In-situ pyrolysis of tar-rich coal: Effects on geological environments and geological guarantee technology. Coal Geol. Explor. 2024, 52, 73–84. [Google Scholar]
- Shi, Q.; Geng, X.; Wang, S.; Cai, Y.; Zhao, H.; Ji, R.; Xing, L.; Miao, X. Tar yield prediction of tar-rich coal based on geophysical logging data: Comparison between semi-supervised and supervised learning. Comput. Geosci. 2025, 196, 105848. [Google Scholar] [CrossRef]
- Yu, M.; Gao, G.; Liu, M.; Liang, H.; Kang, J.; Xu, X.; Zhao, X. Sedimentary environment shift and organic matter enrichment mechanism in response to volcanic ash influence: A case study of the Permian Lucaogou Formation, Santanghu Basin, NW China. J. Palaeogeogr. 2024, 13, 793–822. [Google Scholar] [CrossRef]
- Zhi, D.; Li, J.; Yang, F.; Chen, X.; Wu, C.; Wang, B.; Zhang, H.; Hu, J.; Jin, J. Whole petroleum system in Jurassic coal measures of Taibei Sag in Tuha Basin, NW China. Pet. Explor. Dev. 2024, 51, 519–534. [Google Scholar] [CrossRef]
- Zhang, L.W.; Yan, D.T.; Yang, S.G.; Li, B.Q.; Fu, H.J.; Wang, G.; Yang, X.R.; Zhang, B.; Liang, W.L.; Zhang, J.F. Evolution of the Middle Jurassic paleoclimate: Sedimentary evidence from coal-bearing strata in the Santanghu Basin, NW China. J. Asian Earth Sci. 2023, 242, 105495. [Google Scholar]
- Yi, C.; Xu, H.; Tang, D.; Chen, Y.; Zhao, T. Geological Evaluation for Underground Coal Gasification and Favorable Area Optimization in Eastern Junggar Basin. Sci. Technol. Eng. 2020, 20, 3845–3851. [Google Scholar]
- Chen, X.; Zhao, S.; Liu, Z.; Chen, G. Research on evaluation technology system of mid-deep underground coal gasification based on researchers from China. Heliyon 2024, 10, e33248. [Google Scholar] [CrossRef]
- Jiang, X.; Wu, C. A review: Geological feasibility and technological applicability of underground coal gasification. Coal Geol. Explor. 2022, 50, 1–12. [Google Scholar]
- Feng, L.; Zhou, S.; Xu, X.; Qin, B. Importance evaluation for influencing factors of underground coal gasification through ex-situ experiment and analytic hierarchy process. Energy 2022, 261, 125116. [Google Scholar] [CrossRef]
- Li, J.; Zhao, T.; Yang, Q.; Du, S.; Xu, L. A review of quantitative structure-activity relationship: The development and current status of data sets, molecular descriptors and mathematical models. Chemom. Intell. Lab. Syst. 2025, 256, 105278. [Google Scholar] [CrossRef]
- Zhu, Z.; Wu, Y.; Han, J. A prediction method of coal burst based on analytic hierarchy process and fuzzy comprehensive evaluation. Front. Earth Sci. 2022, 9, 834958. [Google Scholar] [CrossRef]
- Liu, X.; Liu, H.; Wan, Z.; Pei, H.; Fan, H. The comprehensive evaluation of coordinated coal-water development based on analytic hierarchy process fuzzy. Earth Sci. Inform. 2021, 14, 311–320. [Google Scholar] [CrossRef]
- Wu, D.; Yang, Z.; Wang, N.; Li, C.; Yang, Y. An integrated multi-criteria decision making model and AHP weighting uncertainty analysis for sustainability assessment of coal-fired power units. Sustainability 2018, 10, 1700. [Google Scholar] [CrossRef]
- Zhang, P.; Ye, Q.; Yu, Y. Research on farmers’ satisfaction with ecological restoration performance in coal mining areas based on fuzzy comprehensive evaluation. Glob. Ecol. Conserv. 2021, 32, e01934. [Google Scholar] [CrossRef]
- Han, J.; Fang, H.; Yu, Y.; Xu, X.; Wang, C.; Liu, M.; Liu, D. Main problems and countermeasures of underground coal gasification industrial and technological development. Oil Forum. 2020, 39, 50–59. [Google Scholar]
- Xu, H.; Chen, Y.; Xin, F.; Dong, Z.; Yin, Z.; Chen, S.; Wang, Q. Challenges faced by underground coal gasification and technical countermeasures. Coal Sci. Technol. 2022, 50, 265–274. [Google Scholar]
- Xu, F.; Hou, W.; Xiong, X.; Xu, B.; Wu, P.; Wang, H.; Feng, K.; Yun, J.; Li, S.; Zhang, L.; et al. The status and development strategy of coalbed methane industry in China. Pet. Explor. Dev. 2023, 50, 669. [Google Scholar] [CrossRef]
- Lozynskyi, V. Multi-criteria assessment of coal seams suitability for co-gasification using the preference selection index. Heliyon 2025, 11, e43368. [Google Scholar] [CrossRef]
- Killops, S.D.; Mills, N.; Johansen, P.E. Pyrolytic assessment of oil generation and expulsion from a suite of vitrinite-rich New Zealand coals. Org. Geochem. 2008, 39, 1113–1118. [Google Scholar] [CrossRef]
- Shi, Q.; Zhao, X.; Wang, S.; Zhao, H.; Ji, R.; Li, C.; Kou, B.; Zhao, J. Differences in pyrolysis behavior and volatiles of tar-rich coal with various origins. Fuel Process. Technol. 2025, 268, 108181. [Google Scholar] [CrossRef]
- Yang, D.; Koukouzas, N.; Green, M.; Sheng, Y. Recent development on underground coal gasification and subsequent CO2 storage. J. Energy Inst. 2016, 89, 469–484. [Google Scholar] [CrossRef]
- Nieć, M.; Sermet, E.; Chećko, J.; Chećki, J. Evaluation of coal resources for underground gasification in Poland. Selection of possible UCG sites. Fuel 2017, 208, 193–202. [Google Scholar] [CrossRef]
- Wang, S.; Shi, Q.; Sun, Q.; Cui, S.; Kou, B.; Qiao, J.; Geng, J.; Zhang, L.; Tian, H.; Jiang, P.; et al. Strategic value and scientific exploration of in-situ pyrolysis of tar-rich coals. Coal Geol. Explor. 2024, 52, 1–13. [Google Scholar]
- Liu, S.; Chang, Z.; Liu, J. Key technologies and prospect for in-situ gasification mining of deep coal resources. J. Min. Sci. Technol. 2021, 6, 261–270. [Google Scholar]

| Serial Number | First Classification | Secondary Classification | Classification Evaluation Level | |||||||
|---|---|---|---|---|---|---|---|---|---|---|
| Ⅰ (Excellent) | Ⅱ (Good) | Ⅲ (Medium) | Ⅳ (Poor) | |||||||
| 1 | Coal rock and coal quality conditions U1 | Types of coal U11 | HM | CY | SM | QM | FM | PM | WY | JM |
| 2 | Moisture content (%) U12 | 0–15 | 15–35 | 35–55 | >55 | |||||
| 3 | Ash content (%) U13 | 0–10 | 10–20 | 20–50 | >50 | |||||
| 4 | Volatile producibility (%) U14 | >37 | 37–20 | 10–20 | <10 | |||||
| 5 | Sulfur content (%) U15 | 0–1.00 | 1.01–3.00 | 3.01–4 | >4 | |||||
| 6 | Coal seam occurrence condition U2 | Coal seam thickness (m) U21 | 5 | 5–15 | 2–5 | >15; <2 | ||||
| 7 | Dip angle of coal seam (°) U22 | 35 | 12–35 | 35–70 | <12; >70 | |||||
| 8 | Burial depth of coal seam (m) U23 | 500–1000 | 100–500 | >1000 | <100 | |||||
| 9 | Gangue coefficient (%) U24 | <20 | 20–30 | 30–60 | >60 | |||||
| 10 | Gangue layers U25 | 0 | 1 | 2 | >2 | |||||
| 11 | Variation coefficient of coal Thickness (%) U26 | ≥95 | 85–95 | 75–85 | 75 | |||||
| 12 | Rock condition U3 | Roof lithologic U31 | SHY | NY | SZNY | FSY | XSY | ZSY | CSY | LY |
| 13 | Lithology of floor U32 | SHY | NY | SZNY | FSY | XSY | ZSY | CSY | LY | |
| 14 | Closure condition U4 | Distance from fault (km) U41 | <0.5 | 0.5–1 | 1–1.5 | ≥1.5 | ||||
| 15 | Hydrographic condition U5 | Relative water inflow (m3/t) U51 | <3 | 3–10 | 10–15 | >15 | ||||
| 16 | Environmental condition U6 | Fluorine (μg/g) U61 | ≤100 | 100–200 | 200–400 | >400 | ||||
| 17 | Arsenic (μg/g) U62 | ≤4 | 4–25 | 25–80 | >80 | |||||
| 18 | Chlorine (μg/g) U63 | ≤0.05 | 0.05–0.150 | 0.150–0.300 | >0.300 | |||||
| 19 | Phosphorus (μg/g) U64 | ≤0.010 | 0.010–0.050 | 0.050–0.100 | >0.100 | |||||
| Ak | B1 | B2 | Bn | |
|---|---|---|---|---|
| B1 | b11 | b12 | b1n | |
| B2 | b21 | b22 | b2n | |
| Bn | bn1 | bn2 | bnn |
| bij | Implication |
|---|---|
| 1 | Bi factor and Bj factor are equally important. |
| 3 | Bi factor and Bj factor are slightly important. |
| 5 | Bi factor and Bj factor are obviously important. |
| 7 | Bi factor and Bj factor are strongly important. |
| 9 | Bi factor and Bj factor are extremely important. |
| 2, 4, 6, 8 | Between the above two adjacent elements |
| Index | U1 | U2 | U3 | U4 | U5 | U6 |
|---|---|---|---|---|---|---|
| U1 | 1 | 0.5 | 1 | 1 | 0.5 | 1 |
| U2 | 2 | 1 | 2 | 2 | 1 | 2 |
| U3 | 1 | 0.5 | 1 | 1 | 0.5 | 1 |
| U4 | 1 | 0.5 | 1 | 1 | 0.5 | 1 |
| U5 | 2 | 1 | 2 | 2 | 1 | 2 |
| U6 | 1 | 0.5 | 1 | 1 | 0.5 | 1 |
| n | 1 | 2 | 3 | 4 | 5 | 6 | 7 | 8 | 9 |
|---|---|---|---|---|---|---|---|---|---|
| RI | 0 | 0 | 0.52 | 0.89 | 1.12 | 1.26 | 1.36 | 1.41 | 1.46 |
| Serial Number | Type | Weight | Detailed Evaluation | |
|---|---|---|---|---|
| Weight | ||||
| 1 | U1 | 0.1252 | U11 | 0.3048 |
| 2 | U12 | 0.1327 | ||
| 3 | U13 | 0.2310 | ||
| 4 | U14 | 0.2653 | ||
| 5 | U15 | 0.0663 | ||
| 6 | U2 | 0.2496 | U21 | 0.2886 |
| 7 | U22 | 0.1297 | ||
| 8 | U23 | 0.1911 | ||
| 9 | U24 | 0.1317 | ||
| 10 | U25 | 0.1479 | ||
| 11 | U26 | 0.1110 | ||
| 12 | U3 | 0.1252 | U31 | 0.6667 |
| 13 | U32 | 0.3333 | ||
| 14 | U4 | 0.1252 | U41 | 1 |
| 15 | U5 | 0.2496 | U51 | 1 |
| 16 | U6 | 0.1252 | U61 | 0.3333 |
| 17 | U62 | 0.3333 | ||
| 18 | U63 | 0.1667 | ||
| 19 | U64 | 0.1667 | ||
| Index Types | Excellent | Medium | Poor |
|---|---|---|---|
| cost-oriented | |||
| Types between cost-oriented and benefit-oriented | |||
| benefit-oriented |
| Serial Number | Evaluating Indicator | Type | Defined Value of Grading | Weight | ||||
|---|---|---|---|---|---|---|---|---|
| u1 | u′ | u2 | u″ | u3 | ||||
| 1 | U11 | Cost oriented | 2 | 4 | 5 | 0.3048 | ||
| 2 | U12 | Cost oriented | 15 | 35 | 55 | 0.1327 | ||
| 3 | U13 | Cost oriented | 10 | 20 | 50 | 0.2310 | ||
| 4 | U14 | Benefit oriented | 10 | 20 | 37 | 0.2653 | ||
| 5 | U15 | Cost oriented | 1 | 3 | 4 | 0.0663 | ||
| 6 | U21 | Types between cost oriented and benefit oriented | 2 | 5 | 15 | 20 | 25 | 0.2886 |
| 7 | U22 | 12 | 25 | 35 | 45 | 70 | 0.1297 | |
| 8 | U23 | 100 | 500 | 600 | 1000 | 2000 | 0.1911 | |
| 9 | U24 | Cost oriented | 0.2 | 0.3 | 0.6 | 0.1317 | ||
| 10 | U25 | Cost oriented | 1 | 3 | 4 | 0.1479 | ||
| 11 | U26 | Cost oriented | 0.15 | 0.25 | 0.35 | 0.1110 | ||
| 12 | U31 | Benefit oriented | 1 | 2 | 4 | 0.6667 | ||
| 13 | U32 | Benefit oriented | 1 | 2 | 4 | 0.3333 | ||
| 14 | U41 | Benefit oriented | 2 | 4 | 7 | 1 | ||
| 15 | U51 | Cost oriented | 3 | 10 | 15 | 1 | ||
| 16 | U61 | Cost oriented | 100 | 200 | 400 | 0.3333 | ||
| 17 | U62 | Cost oriented | 4 | 25 | 48 | 0.3333 | ||
| 18 | U63 | Cost oriented | 0.04 | 0.15 | 0.3 | 0.1667 | ||
| 19 | U64 | Cost oriented | 0.01 | 0.05 | 0.1 | 0.1667 | ||
| Type | Index | Scope of Literature Recommendations | Scope of Recommendations in This Article | The Scope Excluded in This Paper |
|---|---|---|---|---|
| Pyrolysis physical conditions | Coal tar yield (%) | >7% [39] | ≥7 | <7% |
| Permeability (mD) | ≥10 | ≥10 | <10 | |
| Porosity (%) | ≥15 | ≥15 | <15 | |
| Geological condition | Coal seam thickness (m) | ≥0.8 [40] or ≥1.5 [38] | ≥1.5 [38] | <1.5 |
| Depth of embedment (m) | ≥500 [38] | ≥500 | <500 | |
| Variation coefficient of coal thickness (%) | <15 [37] | ≥15 | >15 | |
| Distance from large normal fault (m) | ≥150 [37] | ≥200 | <200 |
Disclaimer/Publisher’s Note: The statements, opinions and data contained in all publications are solely those of the individual author(s) and contributor(s) and not of MDPI and/or the editor(s). MDPI and/or the editor(s) disclaim responsibility for any injury to people or property resulting from any ideas, methods, instructions or products referred to in the content. |
© 2025 by the authors. Licensee MDPI, Basel, Switzerland. This article is an open access article distributed under the terms and conditions of the Creative Commons Attribution (CC BY) license (https://creativecommons.org/licenses/by/4.0/).
Share and Cite
Jing, G.; Gao, X.; Feng, S.; Li, X.; Wang, W.; Zhang, T.; Li, C. Geological Evaluation of In-Situ Pyrolysis Development of Oil-Rich Coal in Tiaohu Mining Area, Santanghu Basin, Xinjiang, China. Energies 2025, 18, 4034. https://doi.org/10.3390/en18154034
Jing G, Gao X, Feng S, Li X, Wang W, Zhang T, Li C. Geological Evaluation of In-Situ Pyrolysis Development of Oil-Rich Coal in Tiaohu Mining Area, Santanghu Basin, Xinjiang, China. Energies. 2025; 18(15):4034. https://doi.org/10.3390/en18154034
Chicago/Turabian StyleJing, Guangxiu, Xiangquan Gao, Shuo Feng, Xin Li, Wenfeng Wang, Tianyin Zhang, and Chenchen Li. 2025. "Geological Evaluation of In-Situ Pyrolysis Development of Oil-Rich Coal in Tiaohu Mining Area, Santanghu Basin, Xinjiang, China" Energies 18, no. 15: 4034. https://doi.org/10.3390/en18154034
APA StyleJing, G., Gao, X., Feng, S., Li, X., Wang, W., Zhang, T., & Li, C. (2025). Geological Evaluation of In-Situ Pyrolysis Development of Oil-Rich Coal in Tiaohu Mining Area, Santanghu Basin, Xinjiang, China. Energies, 18(15), 4034. https://doi.org/10.3390/en18154034