1. Introduction
H
2–air and CH
4–air mixtures are gaining traction across multiple sectors of the process industry, including natural gas distribution networks, compressed natural gas (CNG) vehicle fueling stations, gas storage facilities, and combined cycle power plants, due to the fact that they can be applied as low-emission technologies while maintaining high energy density and combustion efficiency [
1,
2,
3]. However, the safe handling of these light gases throughout their entire lifecycle (production, storage, transport, and end use) remains a critical challenge [
4,
5]. This work investigates the deflagration dynamics for these mixtures at elevated temperatures (298–423 K) and provides measurements of key safety parameters, including laminar burning velocity (LBV), maximum explosion pressure (Pₘₐₓ), and deflagration index (K
G), that underpin explosion risk assessments and inform the design of mitigation measures such as the use of vent sizing, flame arrestors, and safe separation distances in process industries [
6,
7]. Building on this safety imperative, LBV emerges as a key fundamental parameter: it governs flames, influences deflagration indices, and underpins both CFD and kinetic mechanism validation [
8]. A clear, quantitative understanding of LBV as a function of temperature and fuel type is therefore essential for accurate risk assessment and model development in H
2- and CH
4-based systems.
The laminar burning velocity (LBV) of hydrogen–air as well as methane–air mixtures has been extensively studied, with a particular focus on the influence of various conditions, including equivalence ratios, initial pressures and temperatures [
9,
10] and the H
2–CH
4–air ratio [
11,
12]. Another investigation, employing both experimental and numerical approaches, has analyzed the LBV of mixtures of CH
4, NH
3, and air using various kinetic models [
13]. Other researchers have also explored the laminar burning velocity and burned gas Markstein length of CH
4–air mixtures diluted with N
2, H
2O, and CO
2 [
14]. Also, the effects of H
2 addition and CO
2 attenuation on LBV for CH
4–air mixtures have been studied experimentally and numerically [
15], highlighting the significant impacts of these additives [
16,
17]. There are also several studies that obtained experimental LBV results using the Bunsen flame method at 373 K, with kinetic models accurately predicting LBV for methane–air premixed flames containing DMMP [
18]. The correlation between the LBV and burned gas Markstein length of CH
4–air mixtures shows that LBV can increase by 23–29% with a temperature rise from 373 K to 423 K and by 22–34% from 423 K to 473 K [
19]. A comprehensive review highlighted the use of polynomial regression curves to fit LBV data from various publications, including those focused on CH
4–air mixtures [
6,
20,
21]. Akram et al. [
22] demonstrated that slightly richer CH
4–air mixtures exhibit a minimal temperature exponent and an increased adiabatic flame temperature. This behavior arises because the normalized sensitivity to methane in the dominant reactions increases with temperature for mixtures near the lean flammability limit, while it slightly decreases for stoichiometric mixtures. It is recommended to avoid assuming a linear change in the temperature exponent as a function of the equivalence ratio. The maximum flame speed has been observed in slightly richer methane–air mixtures, aligning with computational results. However, this contrasts with experimental findings, which indicate peak flame speeds for either lean or very rich mixtures at high temperatures. This discrepancy is attributed to the inaccuracy of and variability in the temperature exponent across different equivalence ratios. Finally, Ghosh et al. [
23] measured the LBV of H
2–air mixtures under stoichiometric conditions across a temperature range of 160 to 295 K. Their findings revealed that LBV decreased by 50% when the unburned mixture temperature was reduced by 100 K. This behavior followed a power law relationship with an exponent of 1.571, determined for temperatures above ambient conditions. In this study, the temperature dependence on the LBV of H
2–air mixtures as well as CH
4–air mixtures was up to 423.15 K [
24]. However, all of these above studies typically adhere to the following:
They cover only a narrow temperature range, where most focus on near-ambient conditions (298–323 K) and do not report LBV trends above 350 K, leaving high-temperature behavior underexplored.
They examine a single fuel in isolation, precluding direct cross-fuel comparisons under identical conditions.
They evaluate at most one or two kinetic mechanisms, limiting the ability to identify strengths and weaknesses across modern detailed and skeletal models.
Our work fills this gap by performing pressure-based LBV and deflagration index measurements for both fuels over 298–423 K in a 20 L bomb, coupled with kinetic modeling using the KiBo_MU, San Diego, and Lund mechanisms and providing the unified dataset for both H2 and CH4 combustion under elevated temperatures.
2. Experiments and Kinetic Modeling
The experimental measurements reported in this work were collected by means of the 20 L combustion vessel shown in
Figure 1. Also,
Table 1 shows a detailed description of the experimental set-up, which comprises the following components. The combustion chamber was designed as a spherical stainless steel container with a volume of 20 dm
3 (D = 340 mm), including two piezoelectric pressure transducers (±0.1% FS) and a type-K thermocouple (±1 K), water-jacketed with PID control (±0.5 K). Stainless steel was chosen for its corrosion resistance against reactive substances and combustion by-products, as well as its high-temperature durability, both crucial for combustion testing. The equipment was carefully selected to withstand pressures of up to 15 bar, ensuring durability and reliability under demanding experimental conditions. The spherical chamber is equipped with specialized ports for introducing and removing test gases and injecting or extracting the methane–air mixture. For mixture preparation we used partial pressure filling to
φ = 1.00 ± 0.005, evacuation to 50 mbar, and 120 s mechanical stirring for homogeneity. For ignition and data acquisition, we applied a 0.2 mm Ni–Cr wire at 1 kV for 20 µs, and pressure was sampled at 150 kHz. For a repetition and error analysis, we used five independent runs per condition; the reported P
max, (dP/dt)max, LBV, and K
G are means ± one standard deviation. Instrumental uncertainties (pressure ±0.1%, temperature ±0.3 K, timing ±0.02 ms) were propagated through the model, yielding combined uncertainties of ±3% for LBV and ±5% for K
G. This set-up allows for the precise control of the gas composition within the chamber, which is essential for accurate and reproducible experimental results. Such control ensures that the experimental conditions replicate real-world scenarios, facilitating the transfer of the findings to practical engineering applications. Temperature within the chamber is monitored using a thermocouple positioned to avoid interference with the flame path. Temperature readings are displayed on a monitor located at the base of the apparatus for immediate observation.
To minimize heat loss and maintain stable conditions, the chamber is equipped with a water jacket, which ensures uniform temperature distribution and enhances experimental precision and reliability. The water jacket also facilitates rapid cooling after experiments, expediting the research cycle. The ignition system, centrally located in the test volume, uses a 0.2 mm nickel–chromium (Ni-Cr) wire ignited by an electric arc to initiate combustion. Ni-Cr was chosen for its high heat resistance and chemical stability. The chamber also includes a mechanical mixer, which uses a partial pressure technique to prepare a homogeneous test mixture. This ensures an even distribution of components, critical for achieving consistent and reliable results. A heat-resistant quartz glass observation window allows for the direct inspection of the combustion process. Quartz glass was selected for its ability to withstand high temperatures, enabling long-term observation without the risk of damage. This visual access is invaluable for the qualitative analysis and verification of the combustion process. An advanced data acquisition system is integrated to collect key parameters during combustion. This system includes a calibrated pressure transducer, a signal amplifier, and a recording unit, ensuring precise measurements across a wide pressure range. The collected data is transferred to a connected computer with specialized software for comprehensive analysis. This software enables accurate data processing, identification of key trends, and modeling of combustion dynamics [
6].
This advanced system facilitates a detailed study of combustion dynamics, enabling an in-depth analysis of the experimental results and a more profound understanding of combustion processes. By leveraging these insights, predictive models can be developed to optimize real-world combustion systems, improve efficiency, and minimize environmental impact. The data collected also serves as a valuable resource for validating numerical models, enhancing their reliability and applicability in engineering practice. In this study, we meticulously adhered to experimental procedures using the described equipment to ensure accurate and reliable data collection. These efforts established a robust foundation for observations and subsequent analyses [
19].
The numerical investigations performed in this work include different strategies devoted to the analysis of the fuel reactivity in the closed vessel, based on empirical correlations and detailed chemical kinetic mechanisms. LBV was calculated as a function of the unburned properties of the mixtures, as described below. The operative conditions (intended as fuel composition, fuel-to-oxidant ratios, initial temperatures and pressures) included in the experimental procedure were tested numerically, as well. Kinetic calculations for the evaluation of LBV for H
2 and CH
4 were performed using 3 kinetic models: the first was developed by the University of Bologna (KiBo_MU) [
25], the second was from the University of San Diego (C.R. Group, 2016), and the third was from Lund University developed by Konnov et al. [
26]. Each of them derives from diverse assumptions and target species, resulting in a significantly different number of species and reactions, as reported in
Table 2.
Simulations of laminar burning velocity were performed using an open-source Cantera suite with appropriate reactor modules using a transient condition as a first-attempt solution for the steady-state conditions. In addition, acceptance criteria for residuals were considered once steady-state (ss) and transient-state (ts) problems were solved. More specifically, the following values were imposed: absolute tolerance(ss) = 1.0 × 10⁻⁸; relative tolerance(ss) = 1.0 × 10⁻¹⁵; absolute tolerance(ts) = 1.0 × 10⁻⁴; relative tolerance(ts) = 1.0 × 10⁻¹³. An adaptive grid was determined by using the following criteria: a maximum acceptable ratio among adjacent solutions (ratio) equal to 3, maximum first derivative for adjacent solutions (slope) equal to 0.06, and a maximum acceptable second derivative for adjacent solutions (curve) equal to 0.12. Additional details on the reported numerical methodology can be found elsewhere.
Our data were compared with results combining experimental ones collected in this work, following the procedure described in the previous section, with empirical correlations. For both fuel mixtures, LBV was calculated from the experimental P-t history using equations provided by Dahoe, Zevenbergen, Lemkowitz, and Scarlett (commonly written as the DZLS model, [
27] (Equation (1)).
where
is the flame radius defined in Equation (2),
V is vessel volume,
is the initial pressure,
P is the actual pressure,
Pmax is the maximum explosion pressure, and
is the adiabatic coefficient of the unburned gas. Considering the nature of the experiments, only the data related to the reactive phase were selected. Namely, pre-ignition and post-combustion data were neglected for the evaluation of LBV. In addition, since fuel reactivity is also a function of fuel composition in the fuel mixtures, LBV was also computed using a power law expression of fuel composition, using both temperature and pressure as reported by Dahoe et al. [
14], as shown in Equation (3).
where LBV
0 is the velocity at the reference pressure (i.e.,
P0) and temperature (i.e.,
T0),
is the coefficient for temperature dependence,
is the coefficient for pressure dependence, and
is the equivalence ratio.
Other than the reactivity expressed as LBV, the kinetic mechanism considered so far was also selected to assess the pressure profile, too. To this aim, a constant-volume zero-dimensional reactor simulation with adiabatic and chemically inert walls in Cantera [
23], using input pressures from experimental readings in closed vessels, was modeled. The investigation was performed at low initial temperatures (i.e., 298–423 K), which are lower than the auto-ignition temperature of the investigated mixtures. Hence, an ignition source needs to be considered in the numerical study, as well, to overcome the activation barrier and initiate the chemistry. To this end, in Cantera, spark ignition can be mimicked by artificially adding a pulsed flow of atomic hydrogen into the reaction mixtures. Once the reaction starts, it releases heat and produces highly reactive intermediates, apparently accelerating the reaction to produce ignition. Then, the igniter turns off once the system approaches steady burning. A pressure controller with a fixed volume is used for the simulation. Simulations were performed using the KiBo_MU detailed chemical kinetic model.
From the measured pressure–time P(t) histories, the deflagration index (K
G) was quantified according to the classical cubic root equation:
where V is the vessel volume, and (
dP/dt)
max is the maximum rate of pressure rise. As can be seen from Equation (5), the rate of pressure rise monotonically increases with explosion pressure, and hence the maximum rate of pressure rise is attained when
P =
Pex (explosion pressure). So, by multiplying both sides of Equation (4) by V
1/3, (
dP/dt)
max can be related to the laminar burning velocity as reported by Dahoe et al. [
28], considering the dependency of the parameter on the size and shape of the vessel in addition to the maximum pressure rise and volume. In the same way, as reported in the literature [
13,
24,
29,
30,
31], flame shape, structure, and flame speed are influenced by the size and shape of the testing chamber, eventually affecting the deflagration index
KG.
where
Pexp is the instantaneous explosion pressure at which the value of (
dP/dt)
max is reached.
P0 is the initial pressure, and
γ is the adiabatic coefficient of the unburned gas. Equation (5) was used to calculate the deflagration index for H
2–air and CH
4–air under the operative conditions tested experimentally in this work.
3. Results
The deflagrations of H
2 and CH
4 with air at the stoichiometric ratio (
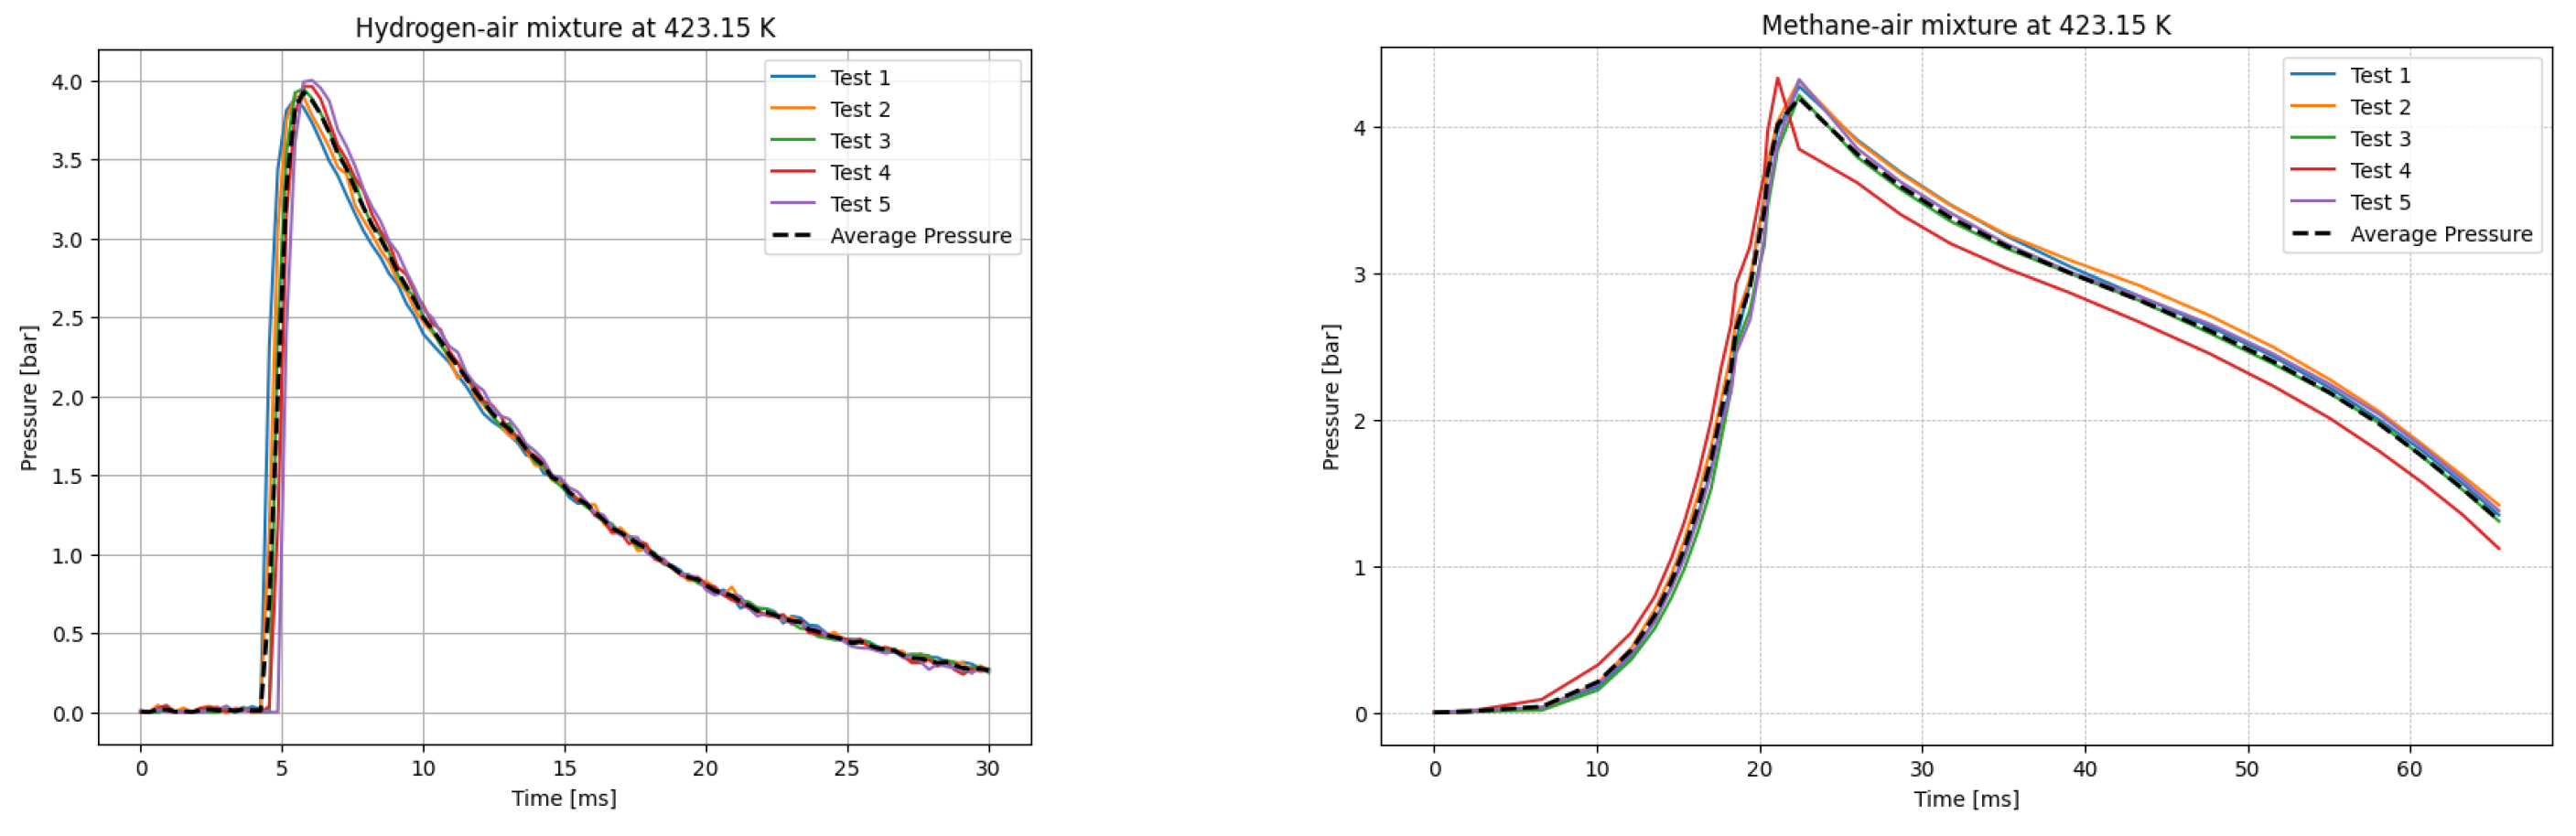
were carried out for six different initial temperatures of the mixtures. Five measurements were taken for each initial temperature
T0, each according to the test procedure presented. The recording frequency of the reaction explosion parameters was maintained at 150 kHz. The initial pressure for each trial was
P0 = 1 bar. The results of a single trial are plotted as a curve of explosion pressure increase over time. The summary curves of the five measurements for
T0 = 298.15 K are shown in
Figure 2, for
T0 = 323.15 K in
Figure 3, for
T0 = 348.15 K in
Figure 4, for
T0 = 373.15 K in
Figure 5, for
T0 = 398.15 K in
Figure 6, and for
T0 = 423.15 K in
Figure 7. The temperatures were chosen for the LBV test because they represent typical operating temperatures for many hydrogen- or methane-fueled systems. These temperatures are also easy to achieve and precisely controlled, making them ideal for laboratory testing.
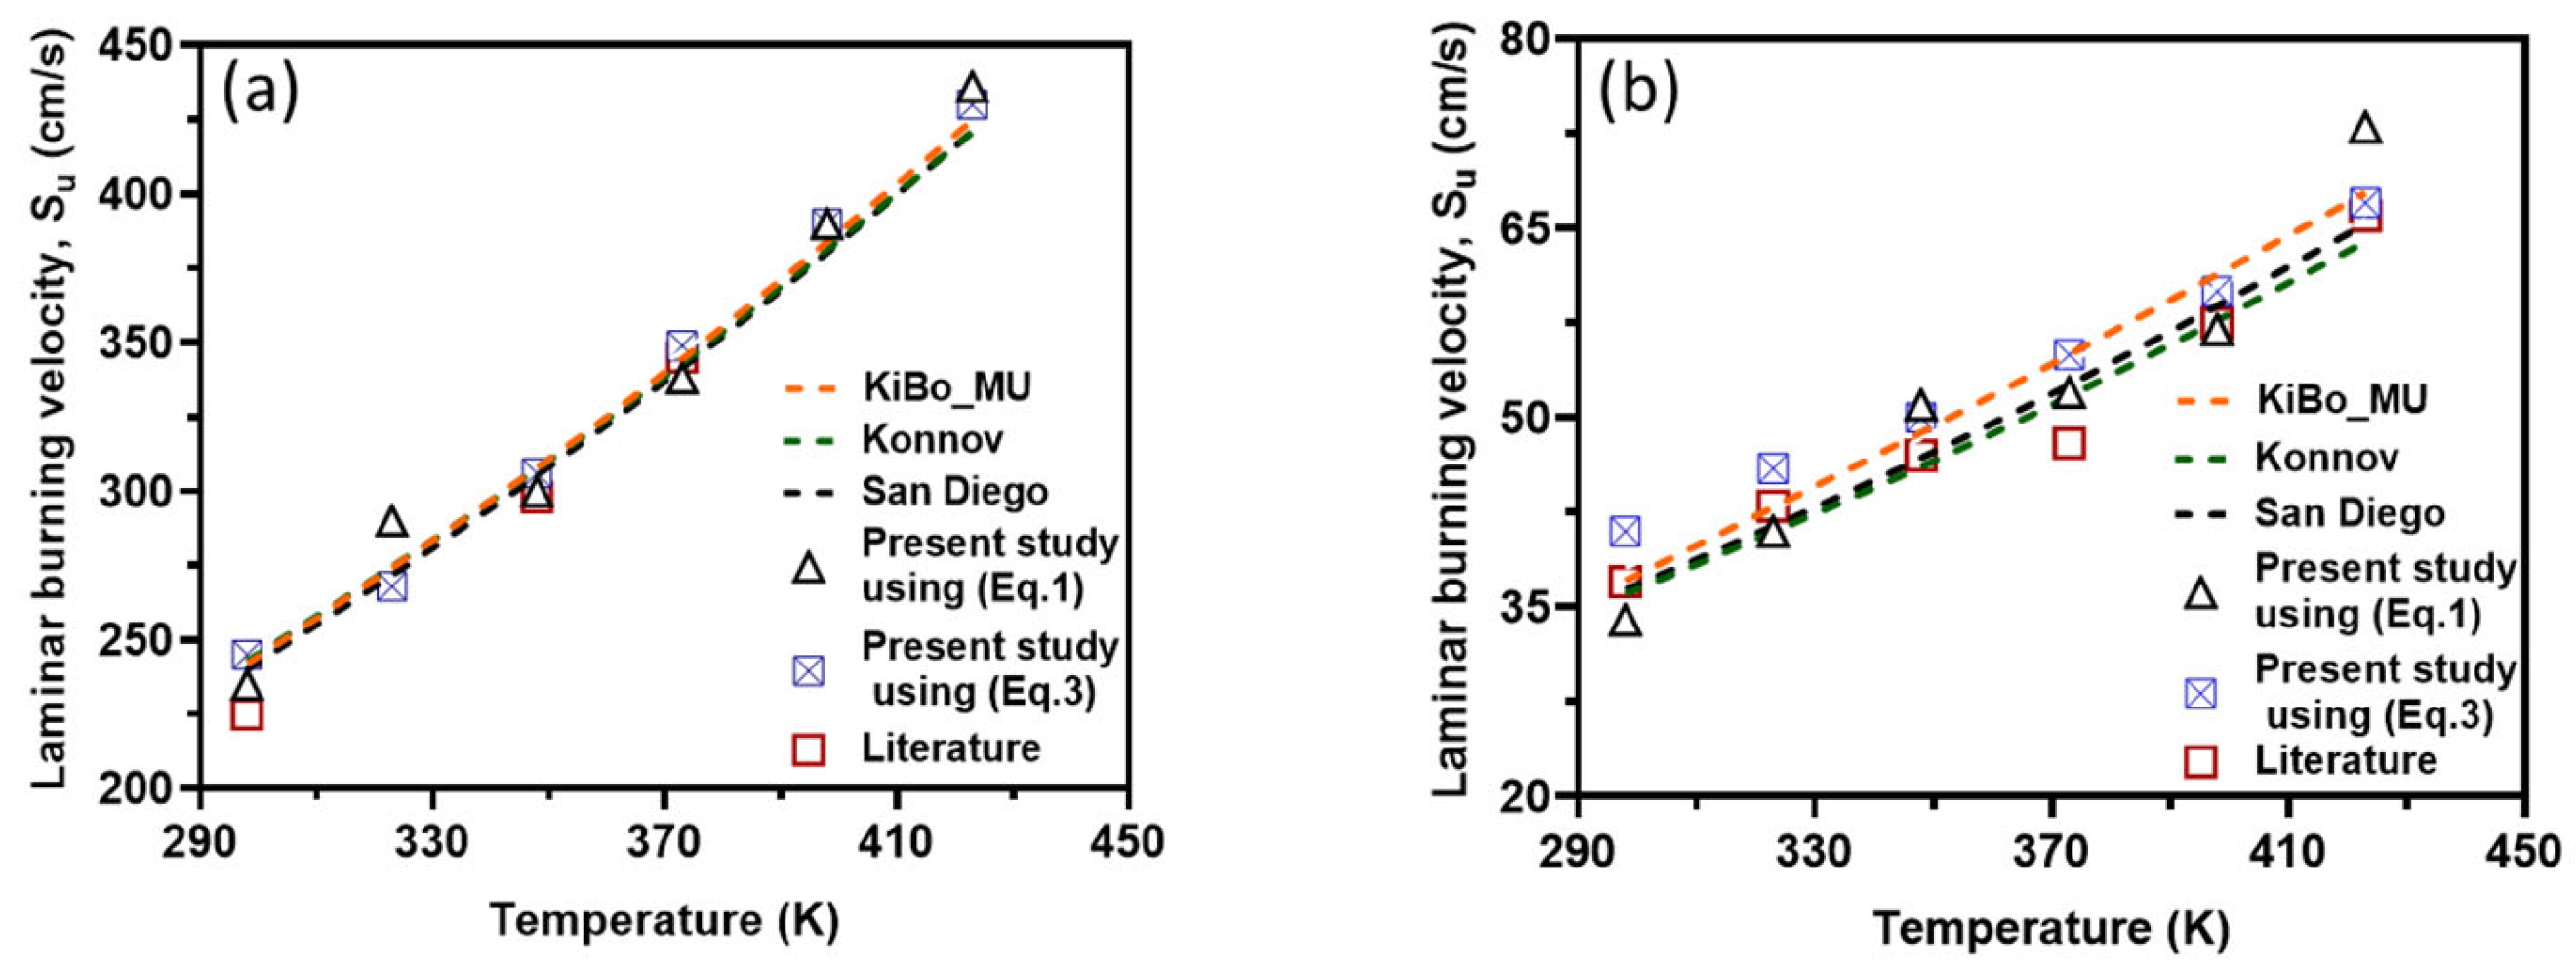
Figure 8 presents the variation in LBV at elevated reaction temperatures ranging from 298 to 423 K, as obtained from newly collected experimental data, numerical calculations using three kinetic mechanisms, and values reported in the literature.
As depicted in the figure, the results obtained using both approaches (i.e., correlations based on experimental data and numerical simulations) exhibit strong agreement for both fuel components. This consistency validates the accuracy of both methods for computing LBV. Additionally, the experimental pressure–time history recorded in this study aligns well with both the literature-reported experimental results and simulation outcomes.
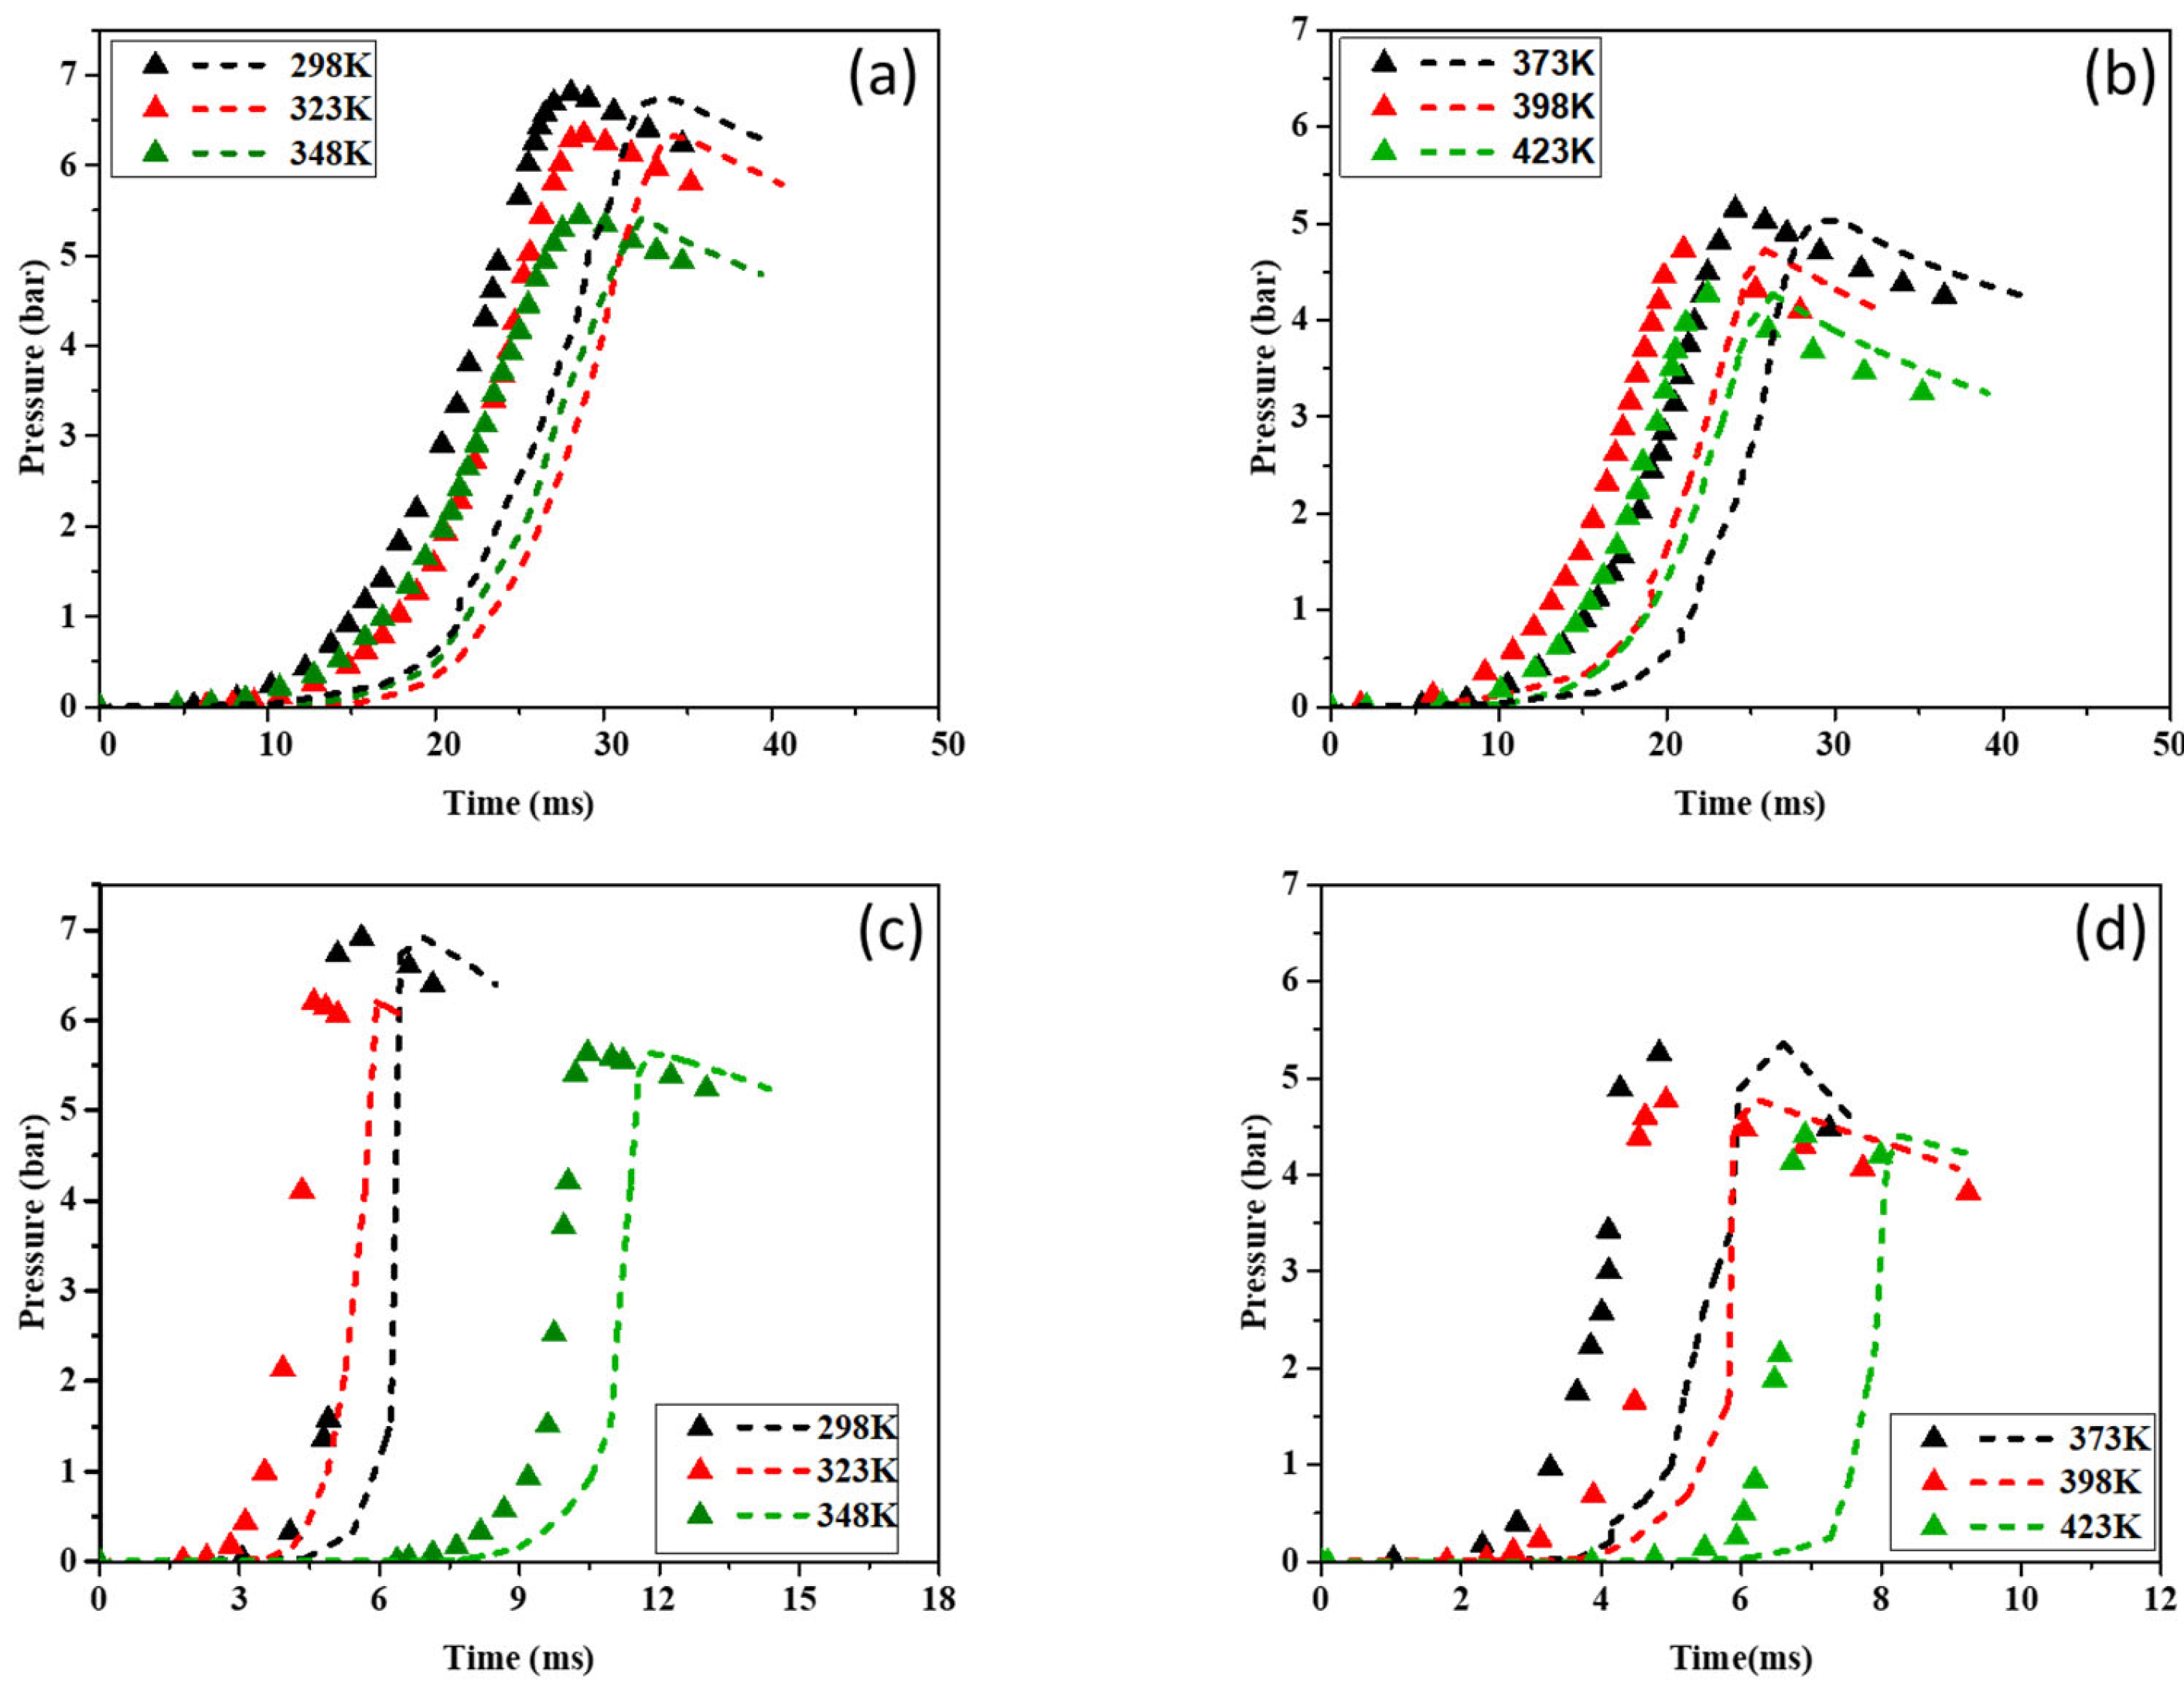
Figure 9 illustrates the P-t curves for CH
4–air and H
2–air mixtures over the studied temperature range (298–423 K). The simulated pressure–time histories generally follow the same trend as the experimental results across all tested temperatures, although minor deviations are observed. Notably, in graphs (a) and (b), ignition occurs later in the simulated cases compared to the experimental conditions.
In
Figure 9 and
Figure 10, the simulated ignition delays provided by all three mechanisms (KiBo_MU, San Diego, Lund) are systematically longer by approx. 5–15% than the experimental delays across 298–373 K. Several factors contribute to this offset:
The mechanisms differ in their third-body efficiencies and rate constants for key low-temperature branching reactions (e.g., H + O2 + M → HO2 + M). Underpredicting these rates leads to slower radical build-up and thus longer modeled delays, particularly below 323 K.
The closed-vessel configuration may induce slight residual motion after spark initiation, enhancing mixing and effectively seeding the flame with radicals. Our one-dimensional reactor cannot capture these hydrodynamic effects.
While our pressure transducers sample at 150 kHz, there remains a finite sensor lag (≈10–20 μs) that can marginally shift the experimental delay. We estimate that this contributes <2% uncertainty.
These factors explain most of the 5–15% ignition delay excess in the simulations. Future work could employ detailed ignition models and updated low temperature rate coefficients to reduce this discrepancy, improving the fidelity of ignition delay predictions in safety critical applications.
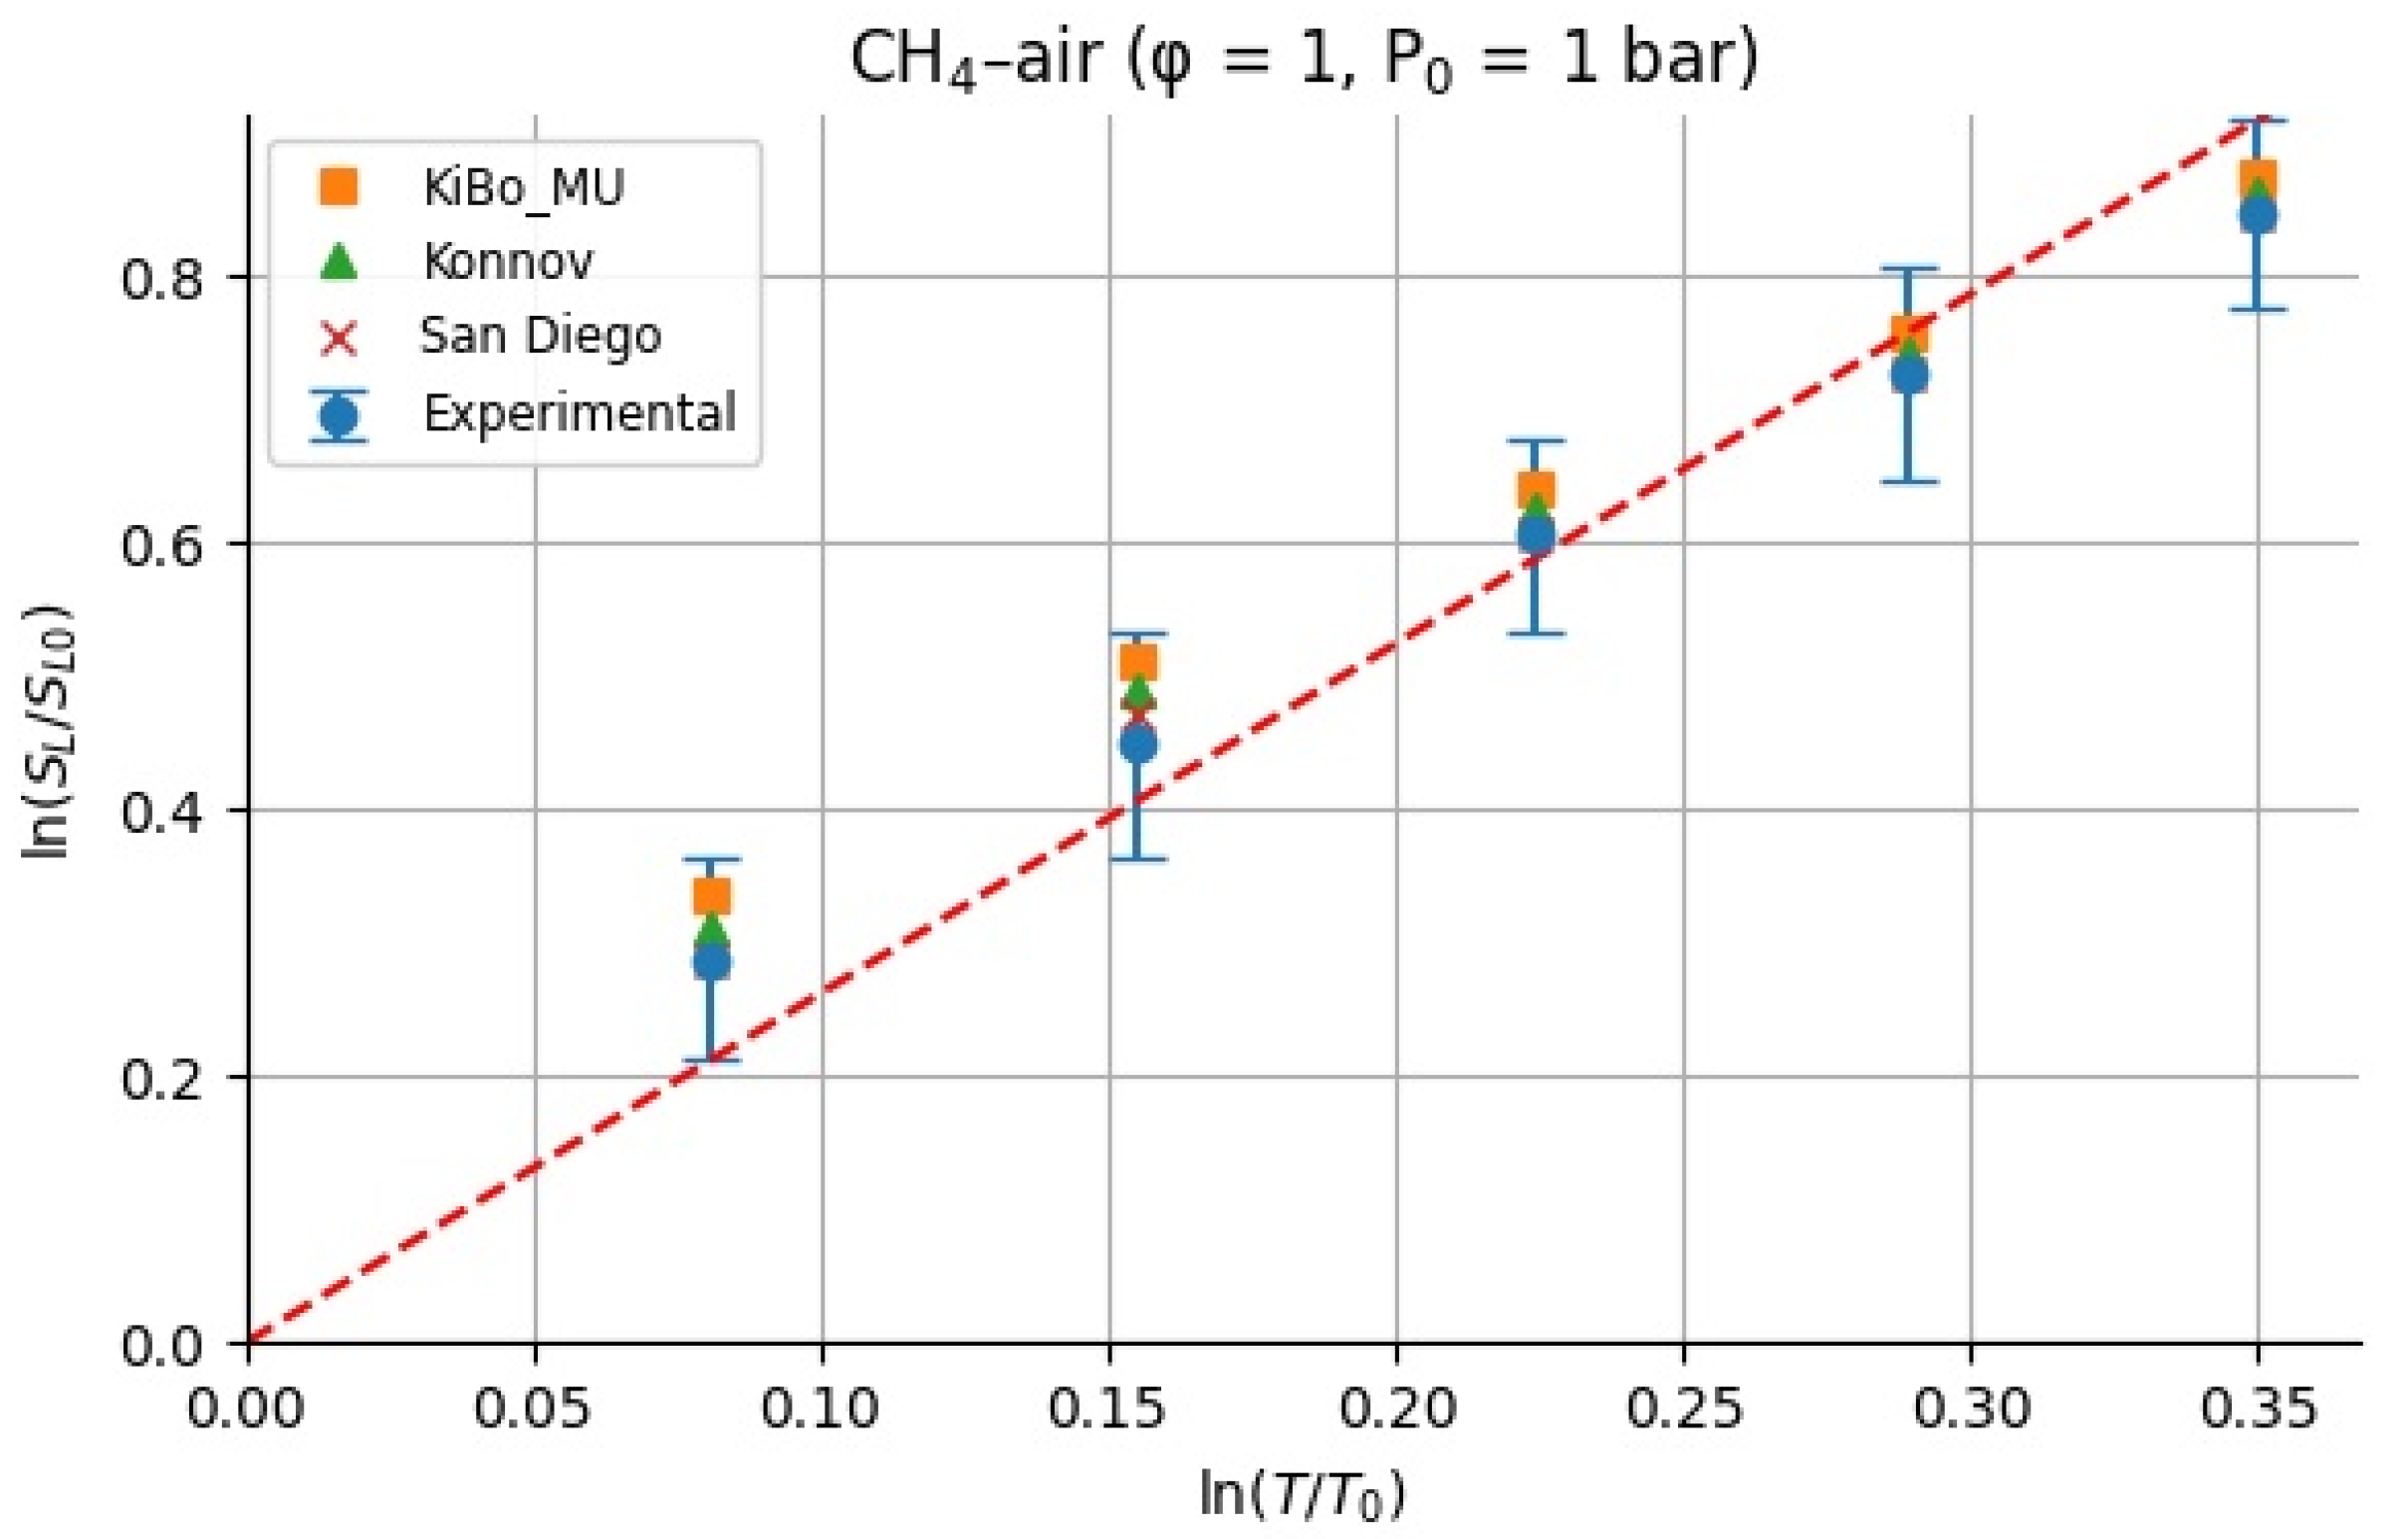
Because we only study the temperature dependence, the values of
were calculated having considered the unity for the equivalence ratio. For each fuel (H
2 and CH
4), we assembled LBV data as a function of the initial temperature from the measured experimental pressures at
φ = 1 and
p = 1 atm [
9] and computed LBV from three kinetic mechanisms (KiBo_MU, Konnov, San Diego) under the same conditions. We then chose a reference state at
T0 = 298.15 K with reference LBV
0 = LBV(
T0) from the experimental dataset. For each higher temperature
Ti in the set {323.15, 348.15, 373.15, 398.15, 423.15 K}, the local exponent
αi was computed via the log–log definition:
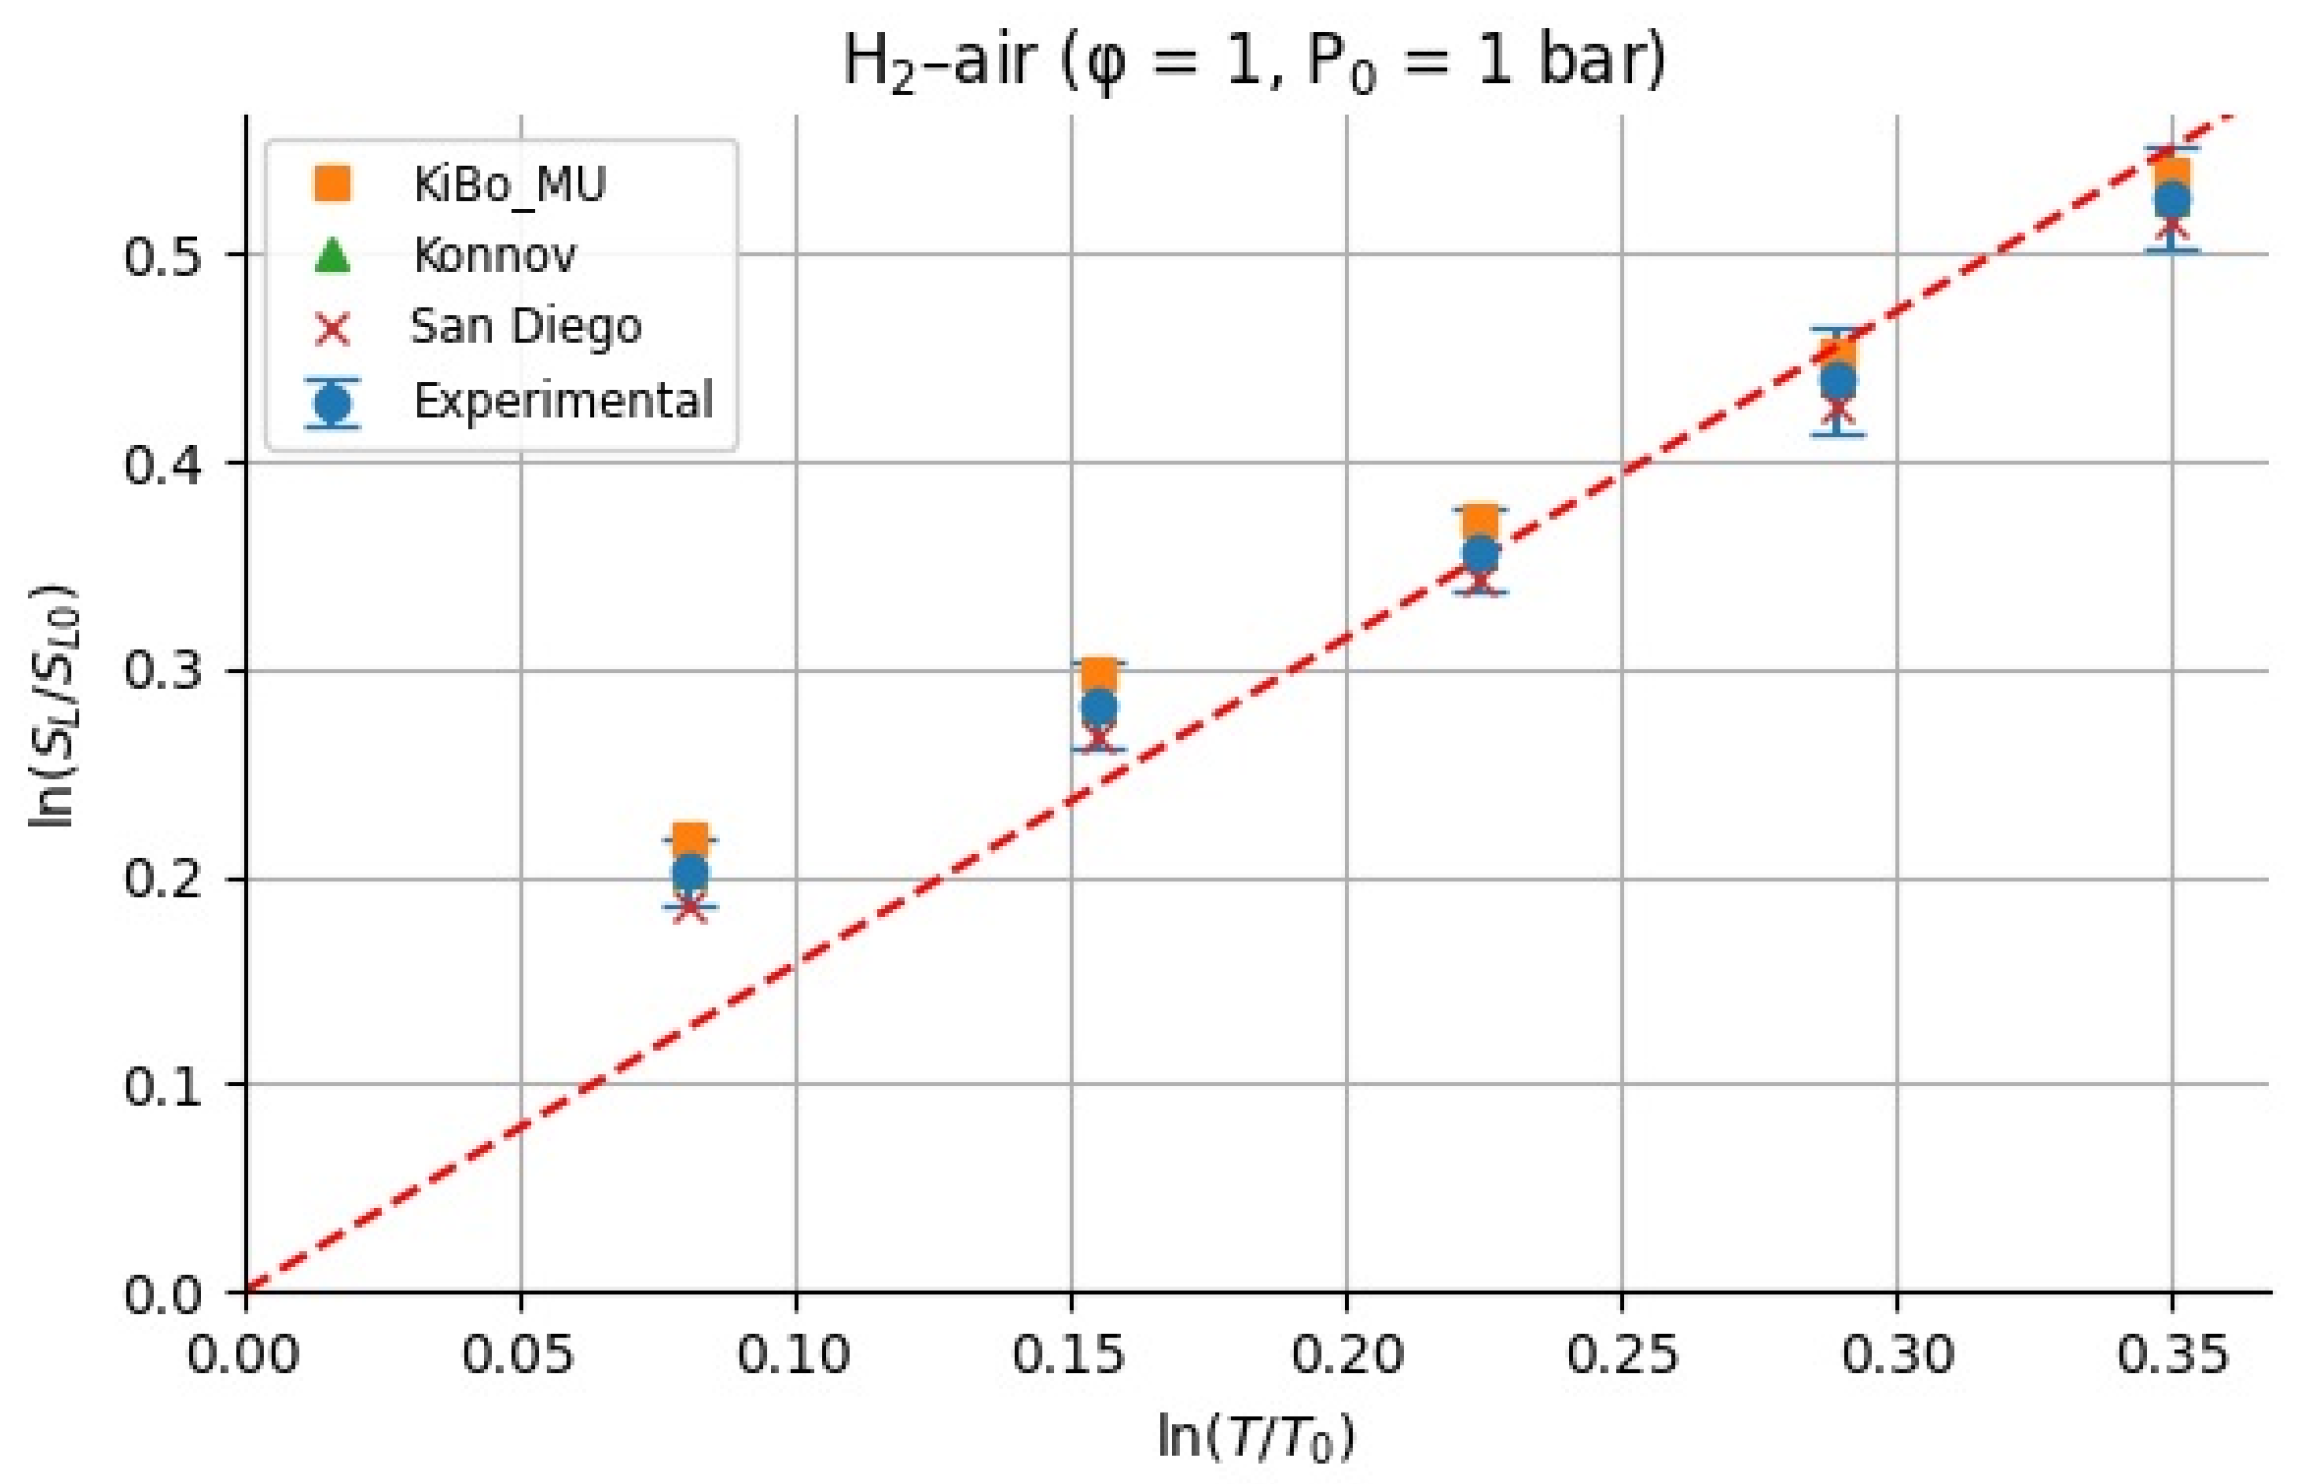
Figure 10 and
Figure 11 show the calculated
for H
2–air and CH
4–air mixtures at the same range of initial temperatures as that for experiments and numerical simulations.
All α values are shown in
Table 3 and
Table 4, where the average α and standard deviation σ over the temperature range are reported separately for the experiments and each mechanism. This provides insight into how the sensitivity exponent α varies (or remains approximately constant) with temperature.
For stoichiometric H
2–air mixtures at
φ = 1 and 1 atm, ref. [
32] compiled reported
α values around 1.54–1.72. Although some studies fit data over different temperature intervals and methods, a mid-range near ≈1.6 is common. In our study, from experimental data,
α may appear higher at lower T increments (e.g., 2.5 at 323 K) but declines toward 1.5 at 423 K; the resulting average over 323–423 K is 1.79 ± 0.38. Kinetic mechanisms (KiBo_MU, Konnov, San Diego) yield similar local averages, indicating consistency with experimental trends. A global ln–ln regression through zero over all combined points gives an effective exponent
αfit = 1.66, in line with the literature mid-range around 1.6. For stoichiometric CH
4–air mixtures at
φ = 1 and 1 bar, ref. [
32,
33] showed α values between roughly 1.58 and 2.0, with many well-controlled studies clustering near 1.7–1.9. Our calculated
α, derived from experimental data, decreases from higher values at moderate T to 1.5–1.6 at 423 K, yielding an average over 323–423 K around 1.7–1.8 with moderate scatter. Simulation mechanisms agree closely with the experiments at each temperature. In both fuels, the agreement between the literature-reported α ranges [
32] and our combined experimental/simulation exponents confirms that detailed kinetic models capture the temperature sensitivity of LBV well in 298–423 K. Using an average exponent (e.g., 1.66 for H
2–air, 1.75 for CH
4–air) is acceptable for moderate temperature spans, but one should be cautious when extrapolating beyond ~450 K, where fewer data exist, and
α may differ a lot. That means that more experimental studies are needed for higher initial temperatures.
A larger α implies that small temperature excursions (e.g., hot-day ambient conditions) can substantially accelerate flame spread and increase deflagration severity, underscoring the importance of using temperature-resolved LBV data when sizing vents or modeling accidental releases.
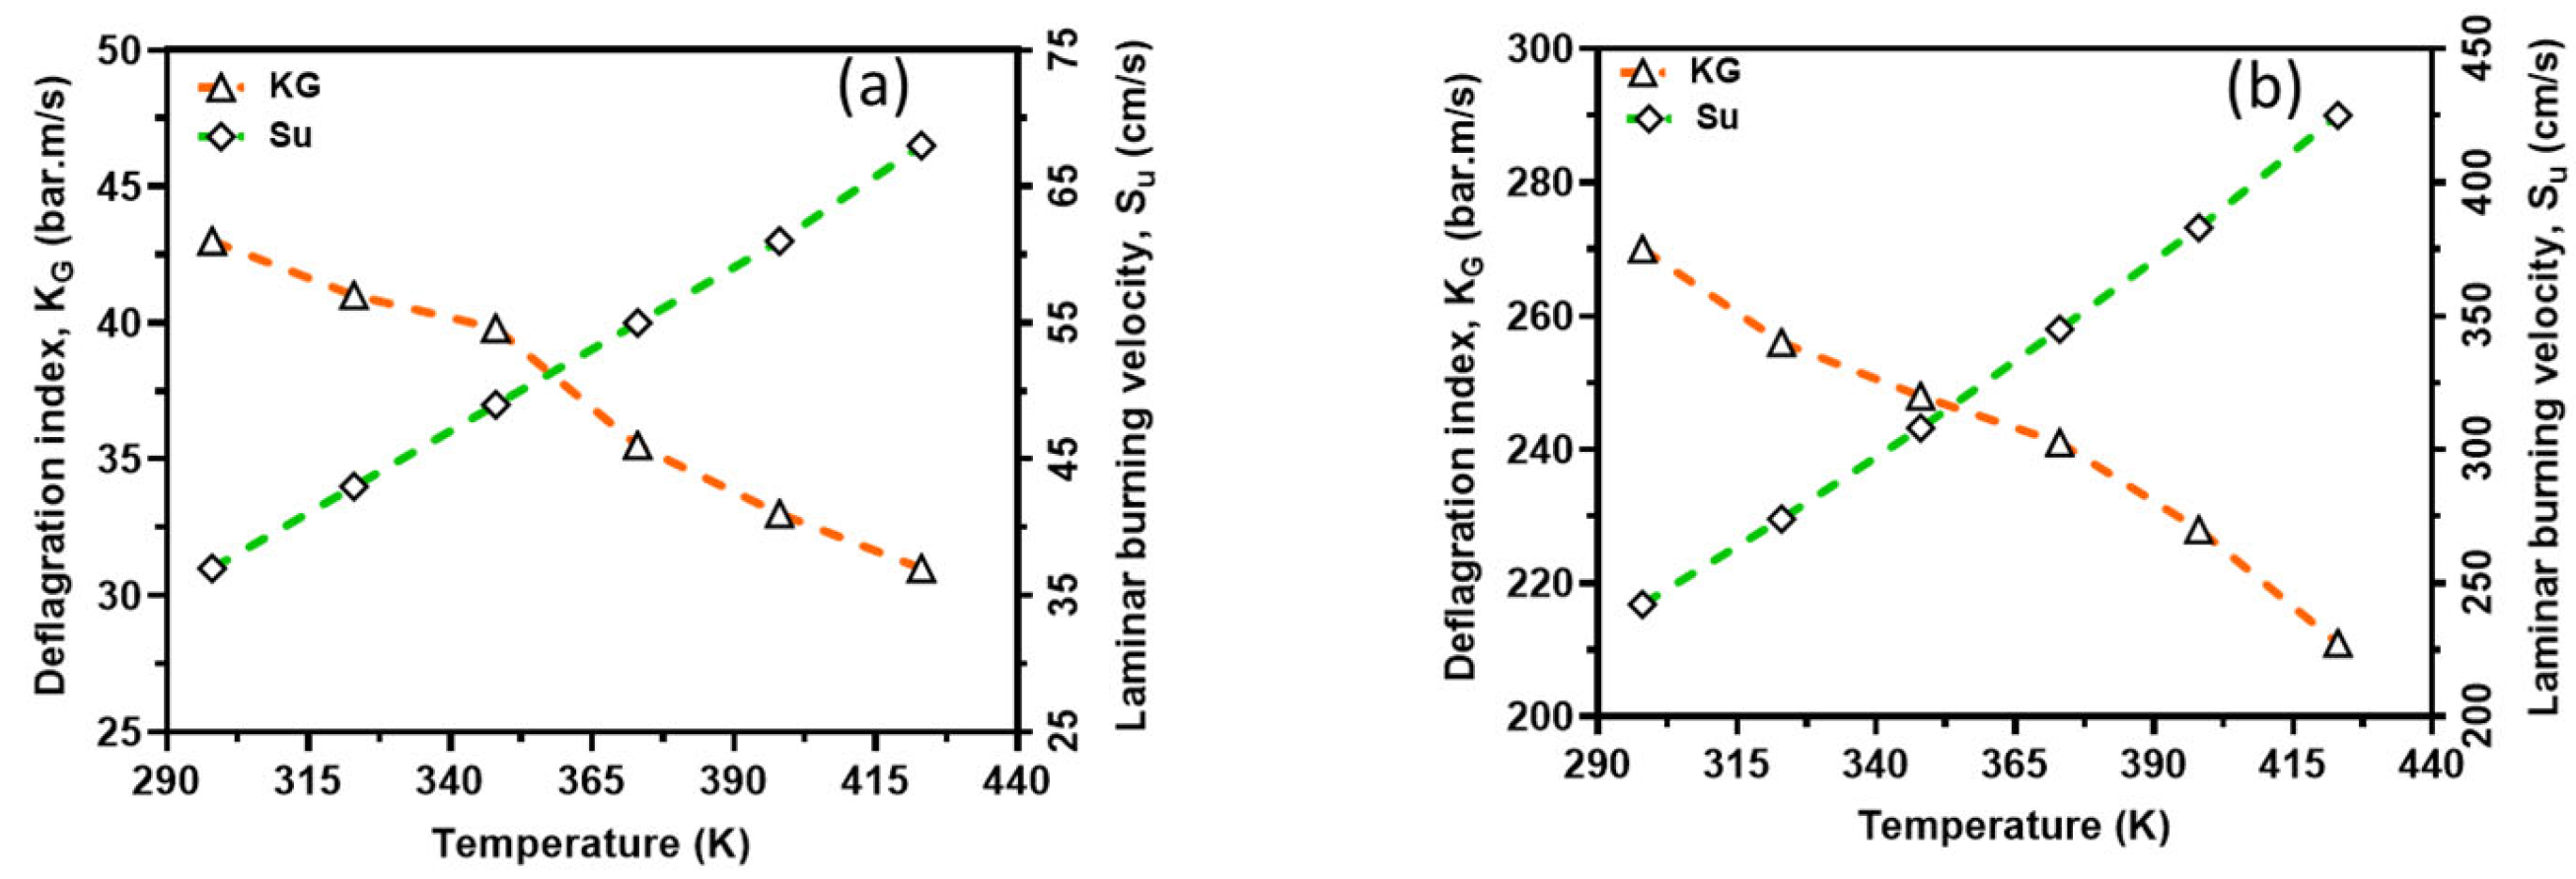
4. Discussion
In order to capture the intrinsic reactivity of CH
4–air and H
2–air mixtures, the deflagration index was obtained from the
P(
t) history of a 20 L closed explosion vessel together with LBV and is shown in
Figure 12. From this figure, the deflagration index showed an inverse relationship with the reaction temperatures, whereas laminar burning velocity showed a direct relationship with the reaction temperatures. This is because the initial temperature has a great influence on the explosion pressure, consequently dictating the maximum rate of pressure rise in the vessel and, therefore, the deflagration index. In other words, an increasing initial temperature has an inverse relationship with explosion pressure and thus K
G. However, there is too much inconsistency in the measured deflagration index, as reported by several authors [
34,
35,
36,
37], ranging from 30 to 86 bar*m/s for CH
4–air and 215 to 1100 bar*m/s for H
2–air mixtures under standard conditions. The present study’s index lies in the range experimentally reported in the literature. For instance, for methane, the closest experimental results reported in the literature to those calculated are from the project SAFEKINEX [
37]. From this observation, it can be said that the deflagration index and LBV are sensitive to initial temperatures, which are consistent with the literature. Overall, the deflagration index showed an inverse relationship with flame propagation. Furthermore, the relationship between the explosion pressure and the deflagration index is shown in
Figure 13 within the studied temperature ranges. It can be seen from this figure that the deflagration index has a direct relationship with the explosion pressure and the maximum pressure rise rate, because the maximum rate for pressure rise has a similar relationship with the maximum explosion pressure.
The investigation into the deflagration dynamics of H2 and CH4 mixtures provides valuable insights into the combustion characteristics and safety implications of using these gases as alternative energy sources. The results of this study highlight several critical aspects that can influence the efficiency, safety, and environmental impact of combustion processes involving H2 and CH4. One significant finding is the variation in LBV with temperature for both H2–air and CH4–air mixtures. The experimental data, supported by numerical calculations, demonstrate that LBV increases exponentially with temperature. This increase in LBV at higher temperatures suggests the enhanced reactivity of the fuel mixtures, which is crucial for optimizing combustion processes in practical applications. The agreement between the experimental results and numerical simulations further validates the reliability of the kinetic models used in this study.
The deflagration index was observed to have an inverse relationship with temperature, which contrasts with the direct relationship between LBV and temperature. This inverse relationship indicates that higher initial temperatures lead to a lower maximum rate of pressure rise during combustion, which could influence the design and safety measures of combustion systems. The deflagration index values obtained in this study are consistent with those reported in the literature, reinforcing the validity of the experimental approach and findings.
The P(t) histories for both H2–air and CH4–air mixtures provide a detailed understanding of the combustion dynamics. The observed trends in pressure rise and the time to ignition underscore the importance of precise control over the initial conditions, such as temperature and mixture composition, to achieve desired combustion outcomes. The discrepancies between experimental and numerical ignition times suggest potential areas for improving the accuracy of kinetic models, particularly in simulating the initial stages of combustion.
Moreover, Konnov et al. [
32] reported an α value in the range 1.54–1.72 for stoichiometric H
2–air over 298–423 K, obtained via planar flame heat flux burners. Our slightly higher value (
α = 1.79) can be attributed to differences because of the following:
Pressure-based extraction in a closed vessel may sample a slightly earlier, more stretched flame regime, enhancing the apparent T sensitivity;
Our mixtures at elevated T and P corrections can increase m in DT ∝ Tm;
Small discrepancies in radical pool modeling (e.g., third-body efficiencies) can shift the local activation energy.
Taken together, these factors account for the modest 5–15% difference between our α and Konnov’s range and confirm overall consistency within experimental uncertainty.
Also, the LBV and deflagration index (KG) data reported here carry value for industrial safety practice. In particular, the following can be found:
Current standards (e.g., NFPA 68, EN 14491) require knowledge of K
G to calculate the necessary vent area and panel design. Our temperature-resolved K
G(
T) curves (
Figure 13) allow engineers to select conservative vent dimensions for conditions up to 423 K, rather than relying on ambient-only data.
By providing LBV(T, ϕ = 1) for H2–air and CH4–air, safety engineers can more accurately assign equipment and facility zoning requirements under worst-case hot-day scenarios.
Quantitative LBV versus temperature functions enhance the fidelity of CFD-based deflagration models, improving the predictions of overpressure loads and flame acceleration phenomena in complex geometries.
An agreement of three independent mechanisms against our data builds confidence in using these models within process safety simulations.


 ,
, 


