Article

Fractal Characterization of Pore Structures in Marine–Continental Transitional Shale Gas Reservoirs: A Case Study of the Shanxi Formation in the Ordos Basin

1
School of Earth Sciences and Engineering, Xi’an Shiyou University, Xi’an 710065, China
2
Shaanxi Key Laboratory of Petroleum Accumulation Geology, Xi’an Shiyou University, Xi’an 710065, China
3
Research Institute of Petroleum Exploration and Development, Beijing 100083, China
4
No. 12 Oil Production Plant, PetroChina Changqing Oilfield Company, Qingyang 745000, China
*
Authors to whom correspondence should be addressed.
Energies 2025, 18(15), 4013; https://doi.org/10.3390/en18154013
Submission received: 18 May 2025 / Revised: 11 July 2025 / Accepted: 17 July 2025 / Published: 28 July 2025
(This article belongs to the Special Issue Sustainable Development of Unconventional Geo-Energy)

Abstract

Marine–continental transitional shale is a promising unconventional gas reservoir, playing an increasingly important role in China’s energy portfolio. However, compared to marine shale, research on marine–continental transitional shale’s fractal characteristics of pore structure and complete pore size distribution remains limited. In this work, high-pressure mercury intrusion, N2 adsorption, and CO2 adsorption techniques, combined with fractal geometry modeling, were employed to characterize the pore structure of the Shanxi Formation marine–continental transitional shale. The shale exhibits generally high TOC content and abundant clay minerals, indicating strong hydrocarbon-generation potential. The pore size distribution is multi-modal: micropores and mesopores dominate, contributing the majority of the specific surface area and pore volume, whereas macropores display a single-peak distribution. Fractal analysis reveals that micropores have high fractal dimensions and structural regularity, mesopores exhibit dual-fractal characteristics, and macropores show large variations in fractal dimension. Characteristics of pore structure is primarily controlled by TOC content and mineral composition. These findings provide a quantitative basis for evaluating shale reservoir quality, understanding gas storage mechanisms, and optimizing strategies for sustainable of oil and gas development in marine–continental transitional shales.

1. Introduction

As a significant unconventional energy resource in the global energy transition, shale gas is increasingly becoming one of the most important alternatives to traditional fossil fuels due to its clean and efficient characteristics [1,2]. In 2023, China’s shale gas production reached 250 × 108 m3, accounting for 10.9% of the country’s total natural gas production. With the progressive depletion of conventional oil and gas resources, shale gas exploration and development has accelerated significantly. The efficient development of shale gas not only strengthens domestic energy supply but also helps reduce dependence on imported natural gas [3,4,5]. Therefore, a deeper understanding of the geological characteristics and reservoir structures of different shale types—particularly those with strong heterogeneity and complex pore systems—is of great scientific and practical importance for improving the efficiency of unconventional gas resource development, enhancing the reliability of energy supply, and safeguarding national energy security.
Among the various shale types under exploration, marine–continental transitional shale has gained increasing attention due to its widespread distribution and substantial resource potential. In China, this shale type accounts for a significant proportion of the total favorable area and geological reserves, particularly within the Permian Shanxi Formation of the Ordos Basin [6]. However, compared with typical marine or continental shales, marine–continental transitional shales are deposited in more complex sedimentary environments and are often subject to stronger diagenetic alteration. These factors result in pronounced reservoir heterogeneity and intricate pore structure development, with pore sizes ranging from the micron to nanometer scale [7,8]. This multiscale pore structure presents significant challenges for reservoir fluid storage and gas exploitation [9,10]. Marine shales commonly develop wedge-shaped and slit-like pores, whereas marine–continental transitional shales are generally dominated by ink-bottle-shaped and slit-like pores [11]. However, factors such as tectonic evolution, organic matter, and mineral compositions all influence pore structure [12,13,14,15]. Wu et al. [16] found that mineral composition, organic matter content and type, pore types, and pore structure are key determinants of the intrinsic variability and complexity of marine–continental transitional shale reservoirs. He et al. [17] investigated the pore structure of Dalong Formation in northeastern Sichuan, revealing that the pore system is dominated by nanoscale organic pores. They also reported that organic matter abundance significantly affects pore structure: micropores and mesopores provide favorable conditions for gas storage and flow, whereas macropores exhibit greater heterogeneity. Therefore, gas adsorption in nanopores plays a crucial role in shale gas accumulation and retention [18]. Liu et al. [9] examined the pore structure of marine–continental transitional shale from the Shanxi Formation in the eastern Ordos Basin using N2 adsorption and fractal analysis. However, N2 adsorption is limited in characterizing both micropores and macropores, making it less accurate in capturing the full pore size distribution.
Currently, conventional single experimental techniques are inadequate for comprehensively and accurately characterizing shale pore structures. Quantitative and digital multi-scale characterization across the full pore size still requires further in-depth investigation [19]. Additionally, the application of fractal geometry to the analysis of shale pore structure has attracted considerable academic interest [20,21,22]. This study focuses on shale samples from the Shanxi Formation in the Ordos Basin, employing techniques such as total organic carbon (TOC) analysis, X-ray diffraction (XRD), gas adsorption, and high-pressure mercury intrusion to characterize the pore structures of micropores, mesopores, and macropores in marine–continental transitional shale. Furthermore, fractal models are utilized to examine the fractal characteristics and heterogeneity of these pore systems. Given the pivotal role of pore structure in shale gas development, accurately characterizing pore structure is of great significance for effective gas exploitation. This study would provide a clear understanding of the pore structure characteristics of marine–continental transitional shales for maximizing production potential of gas and enhancing recovery efficiency.

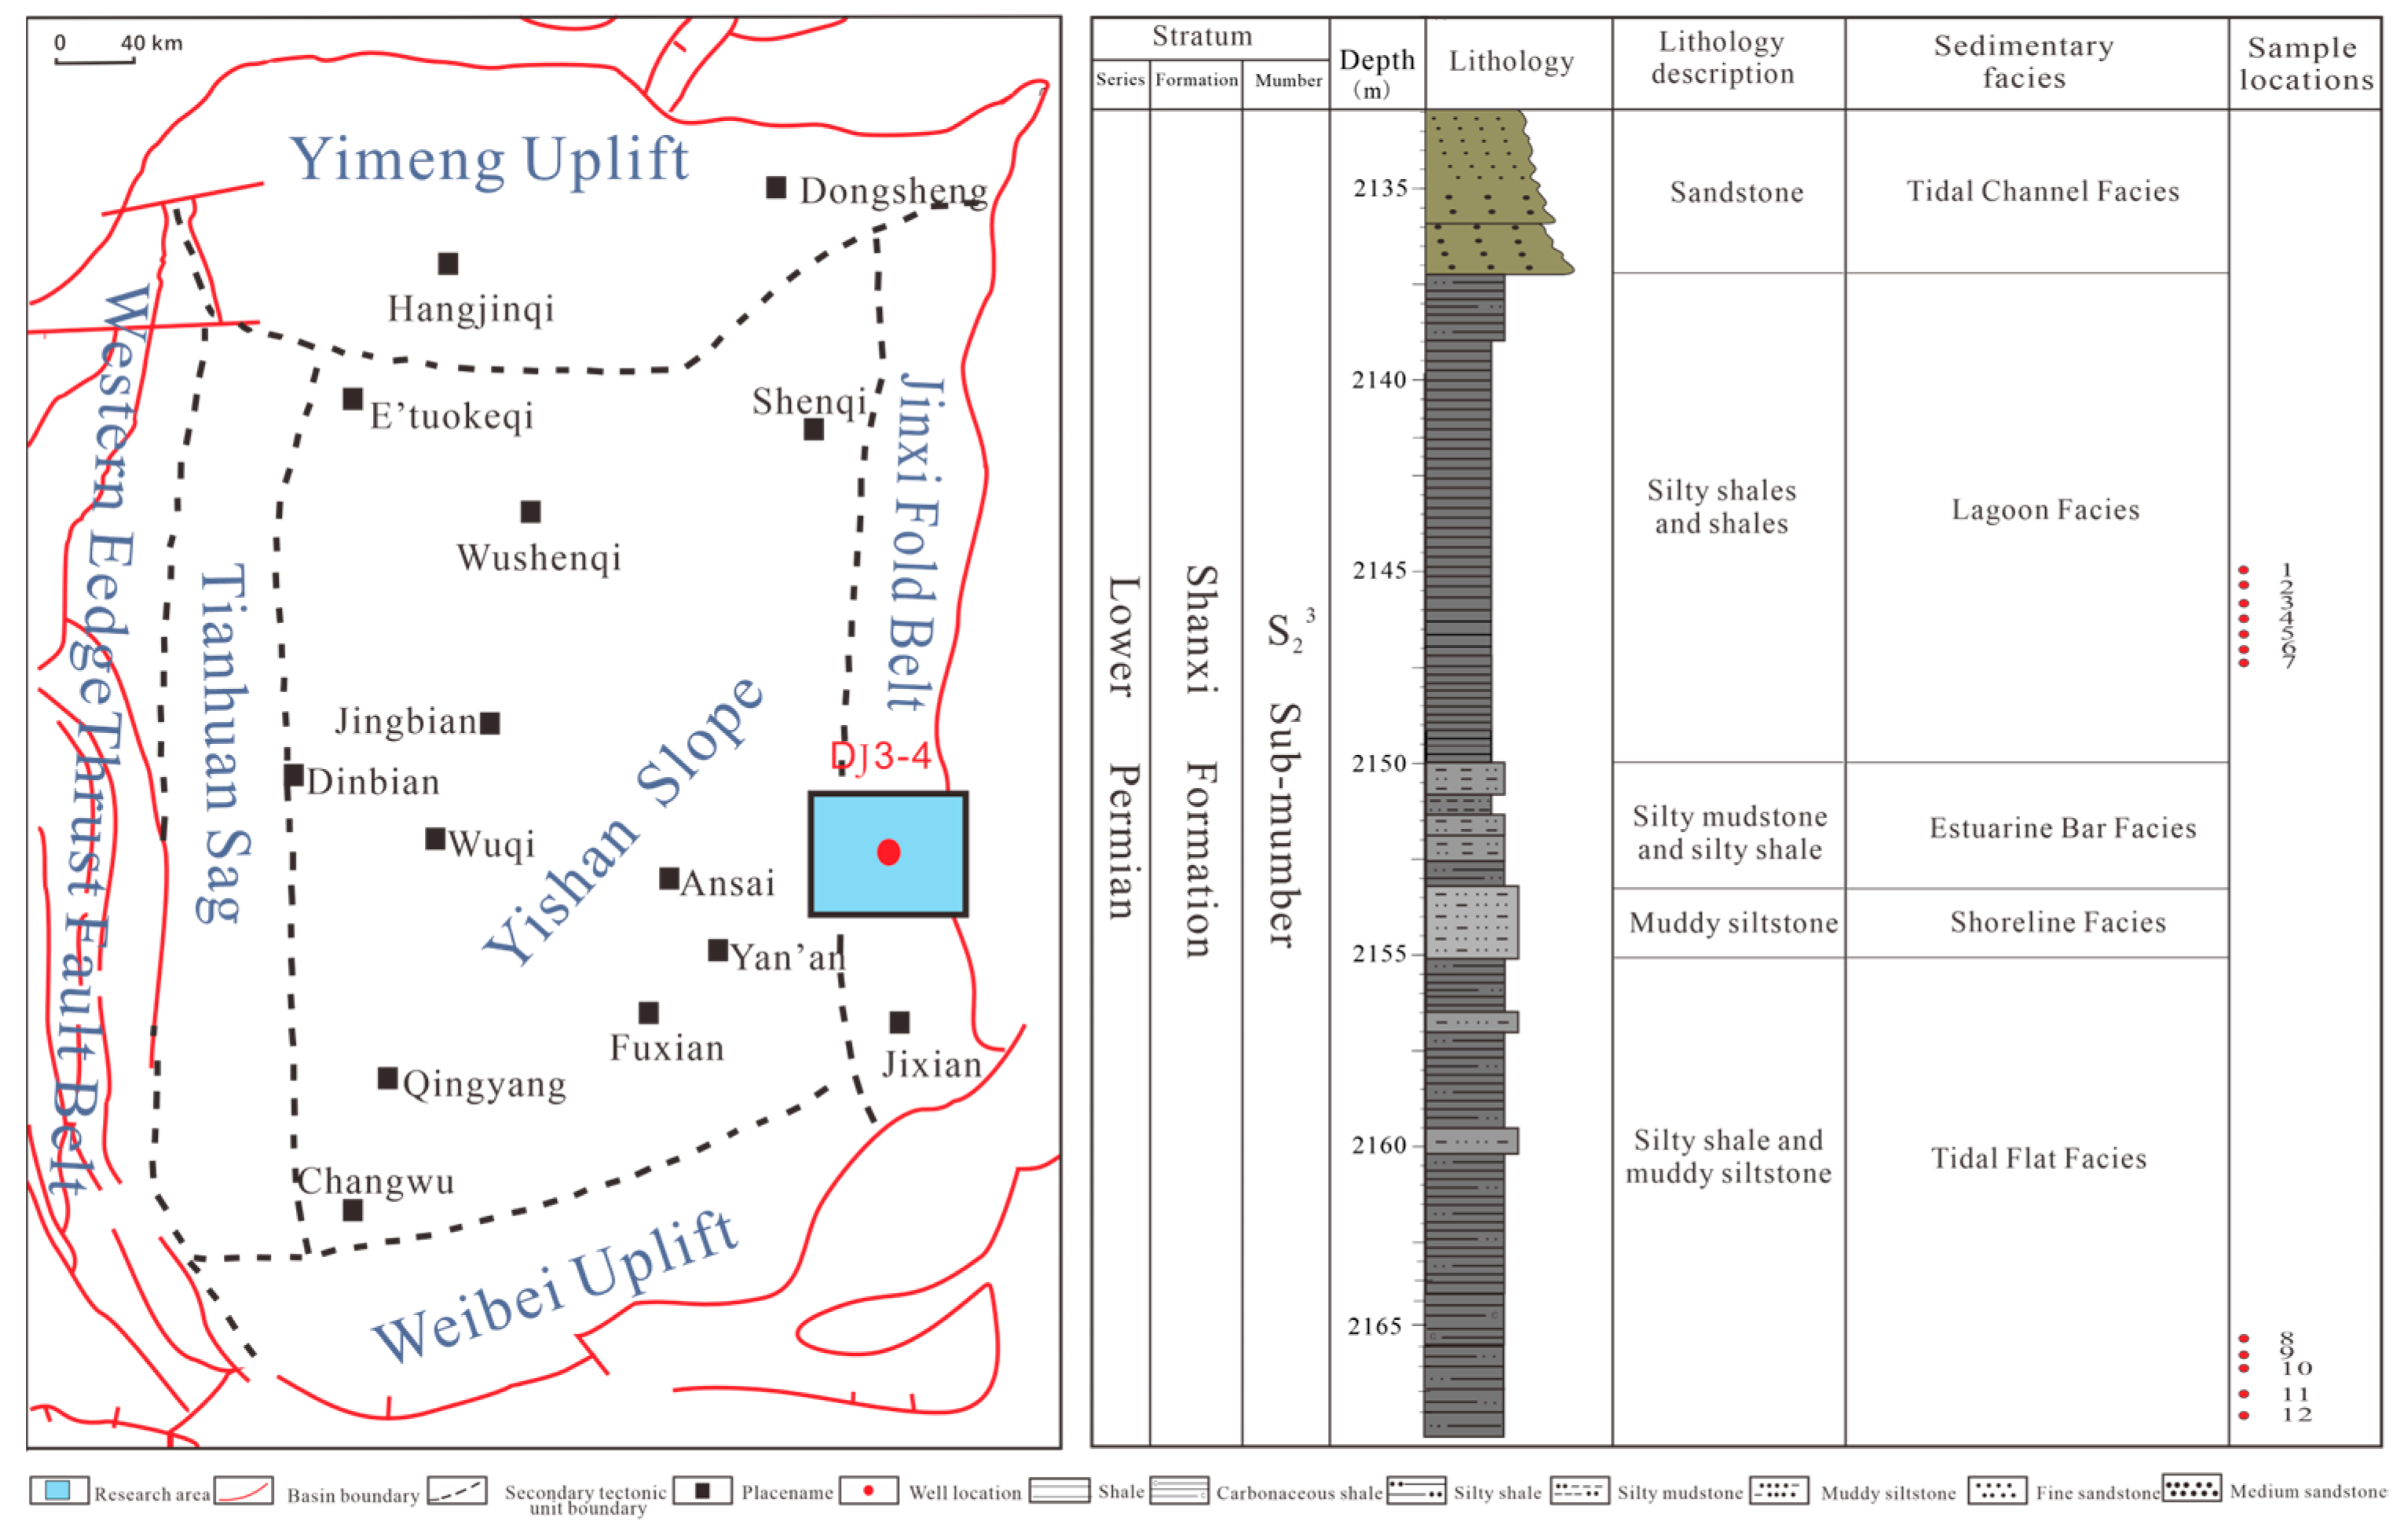
2. Geological Settings

The Ordos Basin, situated in the western part of the North China Craton, covers an area of approximately 45,000 km2. It serves as a key region for the study of marine–continental transitional shale. The basin is subdivided into six secondary tectonic units: the Northern Yimeng Uplift, Southern Weibei Uplift, Eastern Jinxi Fold Belt, Western Tianhuan Anticline, Western Reverse Fault Belt, and Yishan Slope [23].
The Daning–Jixian Block is located in the southeastern portion of the Jinxi Fold Belt, along the eastern margin of the Ordos Basin. It is bounded by the Lüliang Mountains to the east and the Yellow River to the west, with the landscape exhibiting a pattern of “one anticline, one depression, and two slopes”. The western slope zone is relatively gentle and exhibits weak fault development, making it a key area for shale gas exploration and development [24,25]. The study area is characterized by extensive deposition of Carboniferous–Permian strata, with the Shanxi Formation representing typical marine–continental transitional deposition. This formation primarily comprises interbedded tight sandstones, mudstones, and coal seams. The Shanxi Formation is further subdivided into the Shan1 and Shan2 members. The Shan2 member is marked by darker lithology, fewer and thinner interlayers, thicker shale beds, and a more laterally continuous distribution. Its lower part, the S23 submember, is the most developed and serves as the primary target for marine–continental transitional shale gas exploration [26,27]. The lithology of this formation is primarily composed of dark gray to black shale, carbonaceous shale, silty mudstone, sandstone, fine-grained sandstone, mudstone, and interbedded coal seams. The sedimentary environment encompasses lagoonal, swamp, estuarine bar, and tidal flat river channel facies, forming a composite sedimentary system [28]. This depositional system provides favorable geological conditions for the accumulation and preservation of shale gas.

3. Samples and Methods

3.1. Samples

The samples analyzed in this study were obtained from the Well Daji 3–4, located within the study area. A total of twelve samples were collected, all derived from the S23 submember. The lithology is primarily composed of laminated silty shale and muddy siltstone, with sedimentary facies corresponding to lagoonal and tidal flat environments (Figure 1). The experimental techniques employed include total organic carbon (TOC) analysis, X-ray diffraction (XRD), N2 and CO2 adsorption, and high-pressure mercury intrusion. Based on fractal theory, pore size distribution data obtained from these various methods were integrated to characterize the complexity of pore structures in marine–continental transitional shale.

3.2. Methods

3.2.1. TOC Content and X-Ray Diffraction

The TOC content mass fraction test was conducted using an American LECO CS230 Carbon-Sulfur Analyzer (LECO Corporation, St. Joseph, MI, USA), in accordance with the latest specification, “Determination of Total Organic Carbon in Sedimentary Rocks” (GB/T 19145-2022 [30]). XRD analysis was performed using a German D8AA25 X-ray diffractometer, in accordance with the latest standard “X-ray Diffraction Analysis Methods for Clay Minerals and Common Non-clay Minerals in Sedimentary Rocks” (SY/T 5163-2018 [31]), to detect the mineral composition of the whole rock samples.

3.2.2. Gas Adsorption

Gas adsorption analyses were performed utilizing the Auto-sorb IQ-MP surface area and pore structure analyzer manufactured by Quanta-chrome Instruments (USA) to precisely evaluate pore size distribution and specific surface area. Initially, shale samples were crushed and sieved to a particle size range of 80–100 mesh using a standard sieve. The oil removal method was used to eliminate interfering organic substances such as liquid hydrocarbons. Next, a 2–3 g portion of the pretreated shale powder was placed into a vacuum system and subjected to dehydration and degassing at 110 °C for 12 h to remove adsorbed moisture and other volatile impurities. After sample preparation, the adsorption–desorption tests were performed by progressively altering the relative pressure (P/P0). CO2 and N2 adsorption experiments were carried out at 273.1 K and 77.3 K, respectively, with relative equilibrium pressures (P/P0) ranging from 0 to 0.03 for CO2 and 0 to 1 for N2, to establish the adsorption isotherms. Then, the CO2 adsorption isotherms and N2 adsorption isotherms are interpreted by using DFT and BJH models, respectively, to obtain the structural information of pores ranging from 0 to 2 nm and 2 to 300 nm. The specific surface area is determined by using the multiple point BET method [32,33]. To minimize the effects of capillary condensation hysteresis, the adsorption branch was used to analyze the pore size distribution.

3.2.3. High-Pressure Mercury Intrusion

The high-pressure mercury intrusion experiments were conducted using a PoreMaster 60GT mercury intrusion porosimeter produced by Quanta-chrome Corporation (Boynton Beach, FL, USA), following the standard “Determination of Pore Size Distribution and Porosity of Solid Materials—Part 1: Mercury Intrusion Method” (GB/T 21650-2008 [34]). Shale samples from the S23 subsection of the marine–continental transitional shale were selected, with each sample placed in a constant temperature thermal drying chamber at 110 °C for 12 h. After the samples cooled to room temperature, they were transferred into the sample chamber of the mercury intrusion porosimeter. Pressure was progressively applied (a range of mercury intrusion pressures from 20 to 30,000 PSI and detectable pore size distribution spanning from 7 to 10,630 nm), allowing mercury to penetrate the pores of the samples. During the entire process, the volume of mercury intrusion at different pressures was recorded to analyze the pore structure of the samples.

3.2.4. Fractal Models

Fractal theory, proposed by Mandelbrot in 1983, is a mathematical method for studying complex and irregular shapes and structures [35]. This theory is used to describe the self-similarity phenomenon widely observed in nature [36]. Unlike traditional geometry, fractal theory can effectively describe and quantify irregular, disordered, and highly complex natural structures, such as rock fractures, pore networks, river branches, and plant morphology. In the study of porous media, fractal dimensions are commonly employed to characterize the surface roughness and structural intricacy of pores. The fractal model can reveal the scale distribution, connectivity, and heterogeneity of pores, providing an effective tool for a deeper understanding of reservoir physical properties and fluid migration mechanisms.
The fractal model derived from CO2 adsorption data is calculated employing the V-S model, with the formula expressed as follows [37]:
l n V 0 = 3 D C l n S + K
In the formula, V0 represents the cumulative pore volume, cm3/g; S represents the cumulative specific surface area, m2/g; DC denotes the fractal dimension of micropores, a dimensionless quantity; K is a constant.
The expression for the Frenkel–Halsey–Hill (FHH) model founded on N2 adsorption data is as follows [38]:
l n V = A ln l n P 0 P + C
A = D N 3
In the formula, V is the volume of adsorbed gas at equilibrium pressure P, cm3/g; C is a constant; A is the slope of the fitted line between lnV and ln[ln(P0/P)]; P0 is the saturation vapor pressure, MPa; DN denotes the fractal dimension of mesopores, a dimensionless quantity.
The type of pressure curve fractal geometry model based on high-pressure mercury intrusion data, the calculation formula is [39]
l g s = ( D M 3 ) l g r c + ( 3 D M ) l g r m a x
In the formula, rc is the pore radius, nm; rmax is the maximum pore radius corresponding to the minimum pressure, nm; s is the cumulative pore volume percentage corresponding to the pore radius r; DM denotes the fractal dimension of macropores, a dimensionless quantity.

4. Results

4.1. TOC Content and Mineral Composition
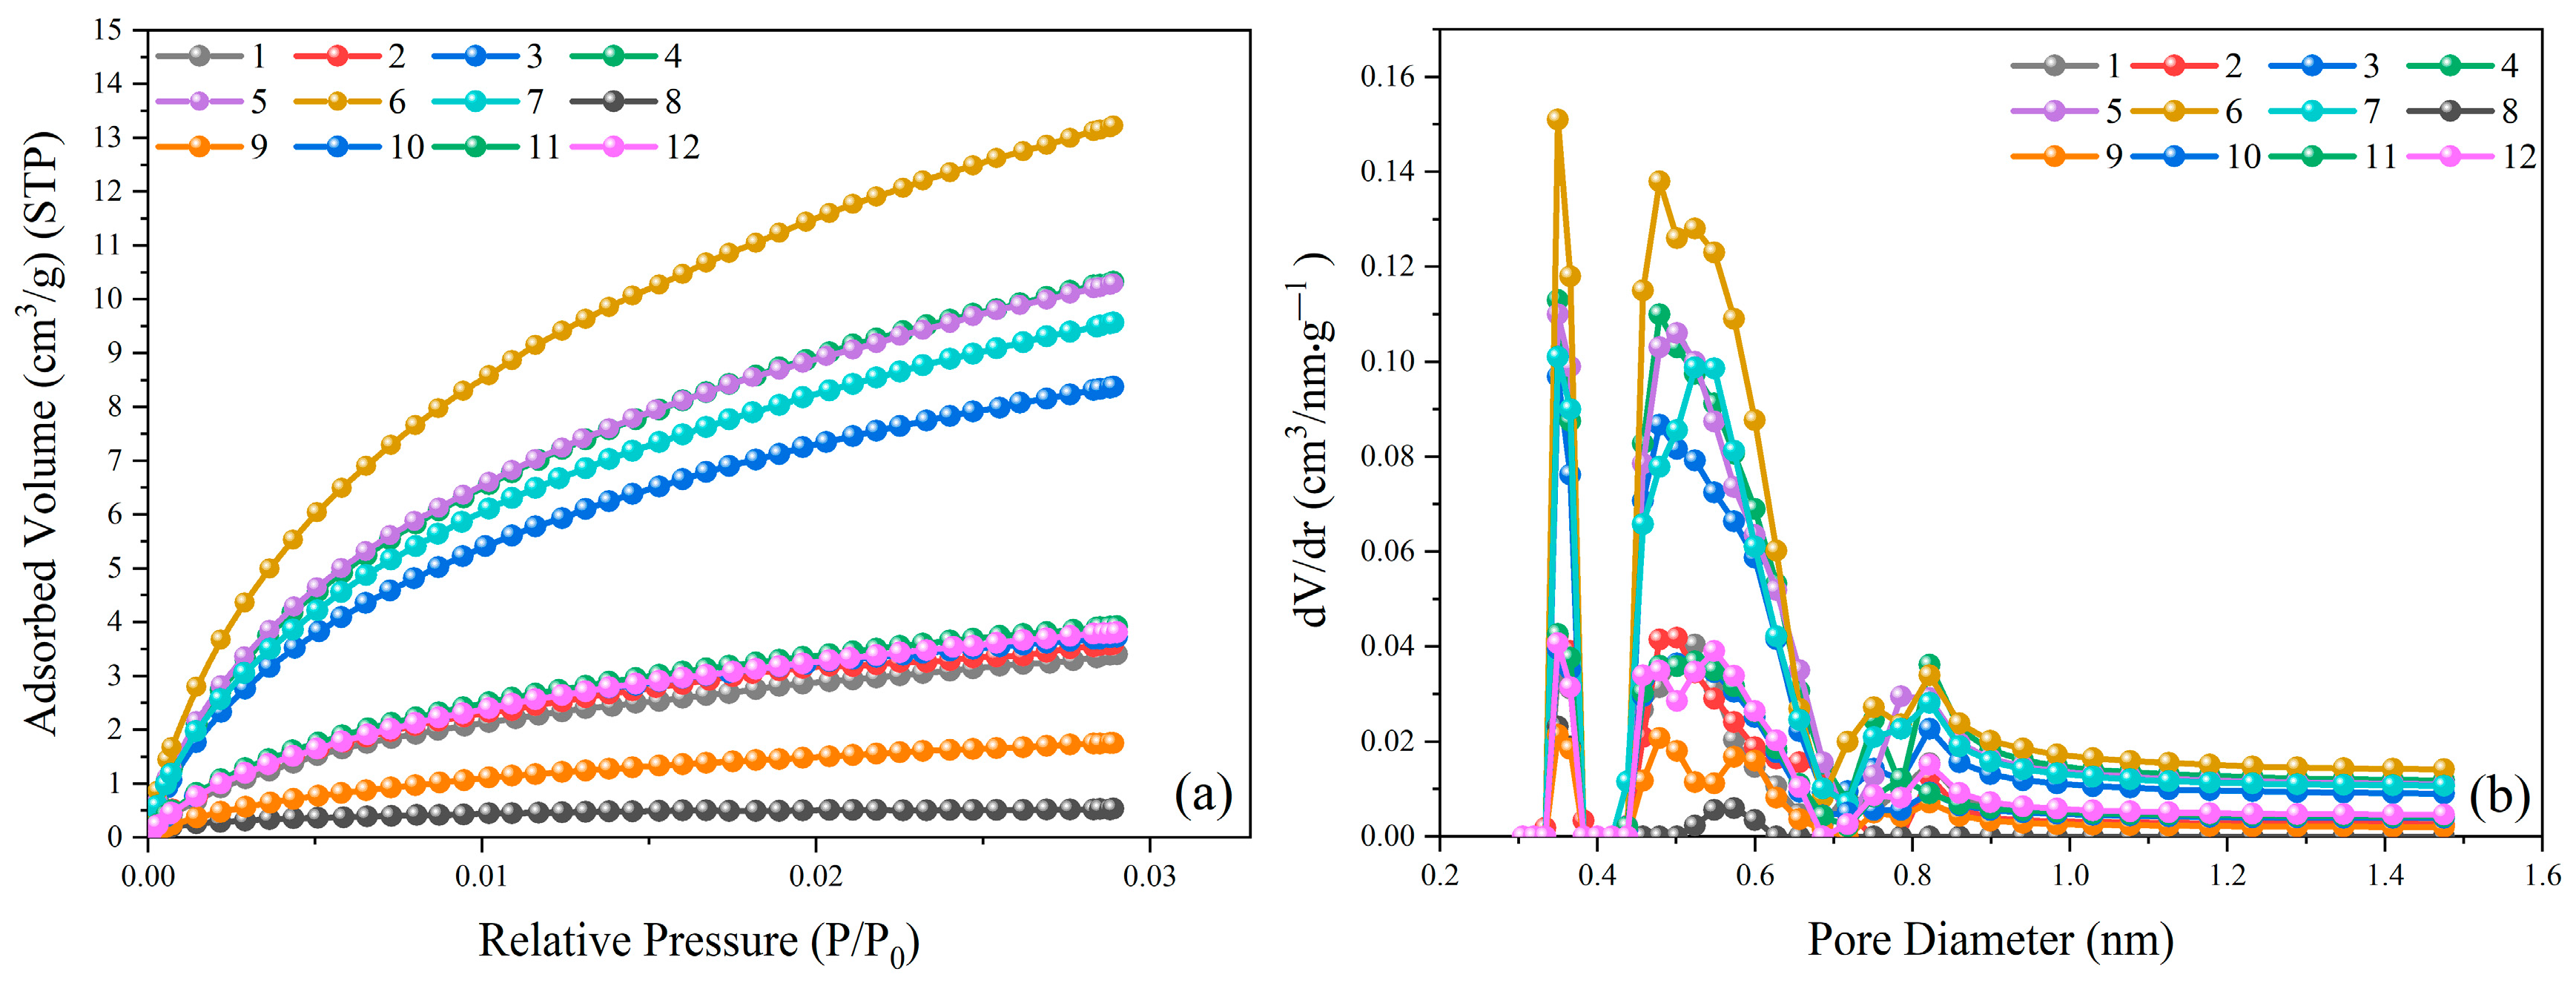
The TOC content and XRD experimental data (Table 1) reveal that the TOC content of the shale samples from the S23 subsection is notably high, ranging from 2.37% to 43.9%, with a mean value of 20.59%. The shale in this region is predominantly composed of clay minerals, quartz, and calcite. The clay mineral content spans from 44.3% to 75.30%, with an average of 57.75%; quartz content ranges from 15.8% to 38%, with an average of 25.86%; and calcite content varies from 0% to 26.8%, with an average of 6.05%. Additionally, trace amounts of feldspar, pyrite, siderite, and ferroan dolomite are also present, with average concentrations of 0.33%, 7.29%, 0.67%, and 2.03%, respectively. Among the clay minerals, kaolinite is dominant, with an average content of 52.01%, followed by illite at an average of 25.15%, while chlorite and illite–smectite mixed layers have average contents of 5.79% and 17.05%, respectively. However, the main minerals of marine shale are quartz, feldspar, dolomite, calcite, clay minerals and pyrite, among which the clay mineral content is low, mainly illite and chlorite [40,41]. Compared to marine shale, marine–continental transitional shale had low siliceous mineral but high clay mineral characteristics.

4.2. Pore Structure

The primary pore space in shale consists of nanopores, thus it is essential to adopt classification standards that specifically characterize these nanopores [42]. To systematically characterize the pore structure at different scales, this study integrates gas adsorption methods with high-pressure mercury intrusion. Micropores are characterized by CO2 adsorption, mesopores by N2 adsorption, and macropores by high-pressure mercury intrusion. By combining these three methods, a multi-scale description of the shale pore structure is achieved.
From the CO2 adsorption curve (Figure 2a), it is evident that the S23 subsection of the Shanxi Formation shale widely develops micropore structures. Among the tested samples, those labeled 9 exhibited CO2 adsorption values lower than 0.5, indicating that this samples has relatively low micropore development and fewer micropores. On the other hand, samples 3, 4, 5, 6 and 7 exhibited larger CO2 adsorption amounts, indicating that these samples have more well-developed micropores. According to the TOC content of the samples, the higher the TOC content, the higher the CO2 adsorption of the shale sample, which indicates that micropore development is related to the TOC content.
The pore size distribution graphs for these samples (Figure 2b) further highlight the development characteristics of the micropores in the S23 sub-member of the Shanxi Formation. The analysis reveals three distinct peaks in the pore size distribution: one in the 0.35–0.40 nm range, another in the 0.42–0.70 nm range, and a third in the 0.75–0.95 nm range. This suggests that the micropore development in the shale is most prominent within these pore size ranges. These findings strongly support the idea that micropores are well-developed in the Shanxi Formation shale, especially in the smaller pore size ranges.
Based on N2 adsorption experiments, the mesopore structure of the Shanxi Formation shale exhibits a broad, single-peak distribution, with the pore sizes mainly concentrated in the range of less than 50 nm (Figure 3b). The N2 adsorption–desorption isotherms and the shapes of the resulting hysteresis loops can provide insights into the pore morphology characteristics in the shale. For the twelve samples in this study, the N2 adsorption isotherms all exhibit shapes similar to Type II isotherms (Figure 3a), which represents multilayer adsorption [43]. In the ultra-low-pressure section (P/P0 < 0.05), monolayer adsorption occurs. As the relative pressure increases (0.05 < P/P0), the adsorption layer thickens, and capillary condensation begins, leading to increased adsorption. This indicates that the monolayer is fully covered, and multilayer adsorption starts. As illustrated in Figure 3a, it is observed that all of the samples’ N2 adsorption isotherms exhibit clear hysteresis loops. According to the classification of the International Union of Pure and Applied Chemistry [44], the hysteresis loops of these samples are classified as H3 type, which are narrow and show a nearly parallel relationship between the adsorption and desorption curves. Capillary condensation occurs as the relative pressure approaches the saturation vapor pressure, causing a rapid increase in the adsorption curve. Some samples also exhibit characteristics of H4 type hysteresis loops, suggesting the presence of narrow slit-like pores in the shale, with relatively good connectivity.
High-pressure mercury intrusion experimnts were predominantly employed to assess the macropore structural characteristics within the shale reservoirs. As the pressure increases, mercury first enters larger pores and then progressively fills smaller ones. The experimental results show that the Shanxi Formation shale reservoir in Well Daji 3-4 has relatively low porosity, ranging from 0.14% to 2.84%, with an average of 0.99%. The total pore volume ranges from 0.0005 to 0.0117 cm3/g, with an average of 0.004 cm3/g. The pore surface area varies between 0.008 and 2.95 m2/g, with an average of 1.0 m2/g (Table 2). These multiscale pore characteristics are crucial for understanding the storage space for free gas and adsorbed gas in shale reservoirs, which has significant implications for the evaluation of shale gas resources.
The mercury intrusion rate in the shale reservoirs of the study area can be classified into two typical types (Figure 4a). Type I is represented by samples 1, 2, 8, 10, 11 and 12. The mercury intrusion curve can be classified into three distinct phases. In the pressure range of 1 to 3 PSI, the mercury intrusion increases rapidly, and the curve has a steep slope, indicating the presence of large macropores in the shale samples. In the pressure range of 3 to 20,000 PSI, the mercury intrusion rate increases slightly, with a gentler slope, suggesting that macropores are less abundant. When the pressure exceeds 20,000 PSI, the mercury intrusion increases sharply again, indicating a substantial presence of mesopores in these shale samples. Type II is represented by samples 3, 4, 5, 6, 7, and 9. The intrusion curve is categorized into two distinct phases. In the pressure range of 1 to 4 PSI, the mercury intrusion increases rapidly, indicating the presence of large macropores in the shale. When the pressure exceeds 4 PSI, the intrusion rate slows down and the curve flattens, suggesting that mesopores are evenly distributed within the samples. Samples from Type I exhibit relatively flat mercury withdrawal curves and significant differences in the volumes of mercury intrusion and withdrawal. This suggests better pore connectivity, which is beneficial for the desorption, diffusion, and flow of shale gas. The pore size distribution shows a single-peak, primarily concentrated in the range of 7–113 nm, indicating poor development of macropores (Figure 4b).

4.3. Pore Fractal Characteristics

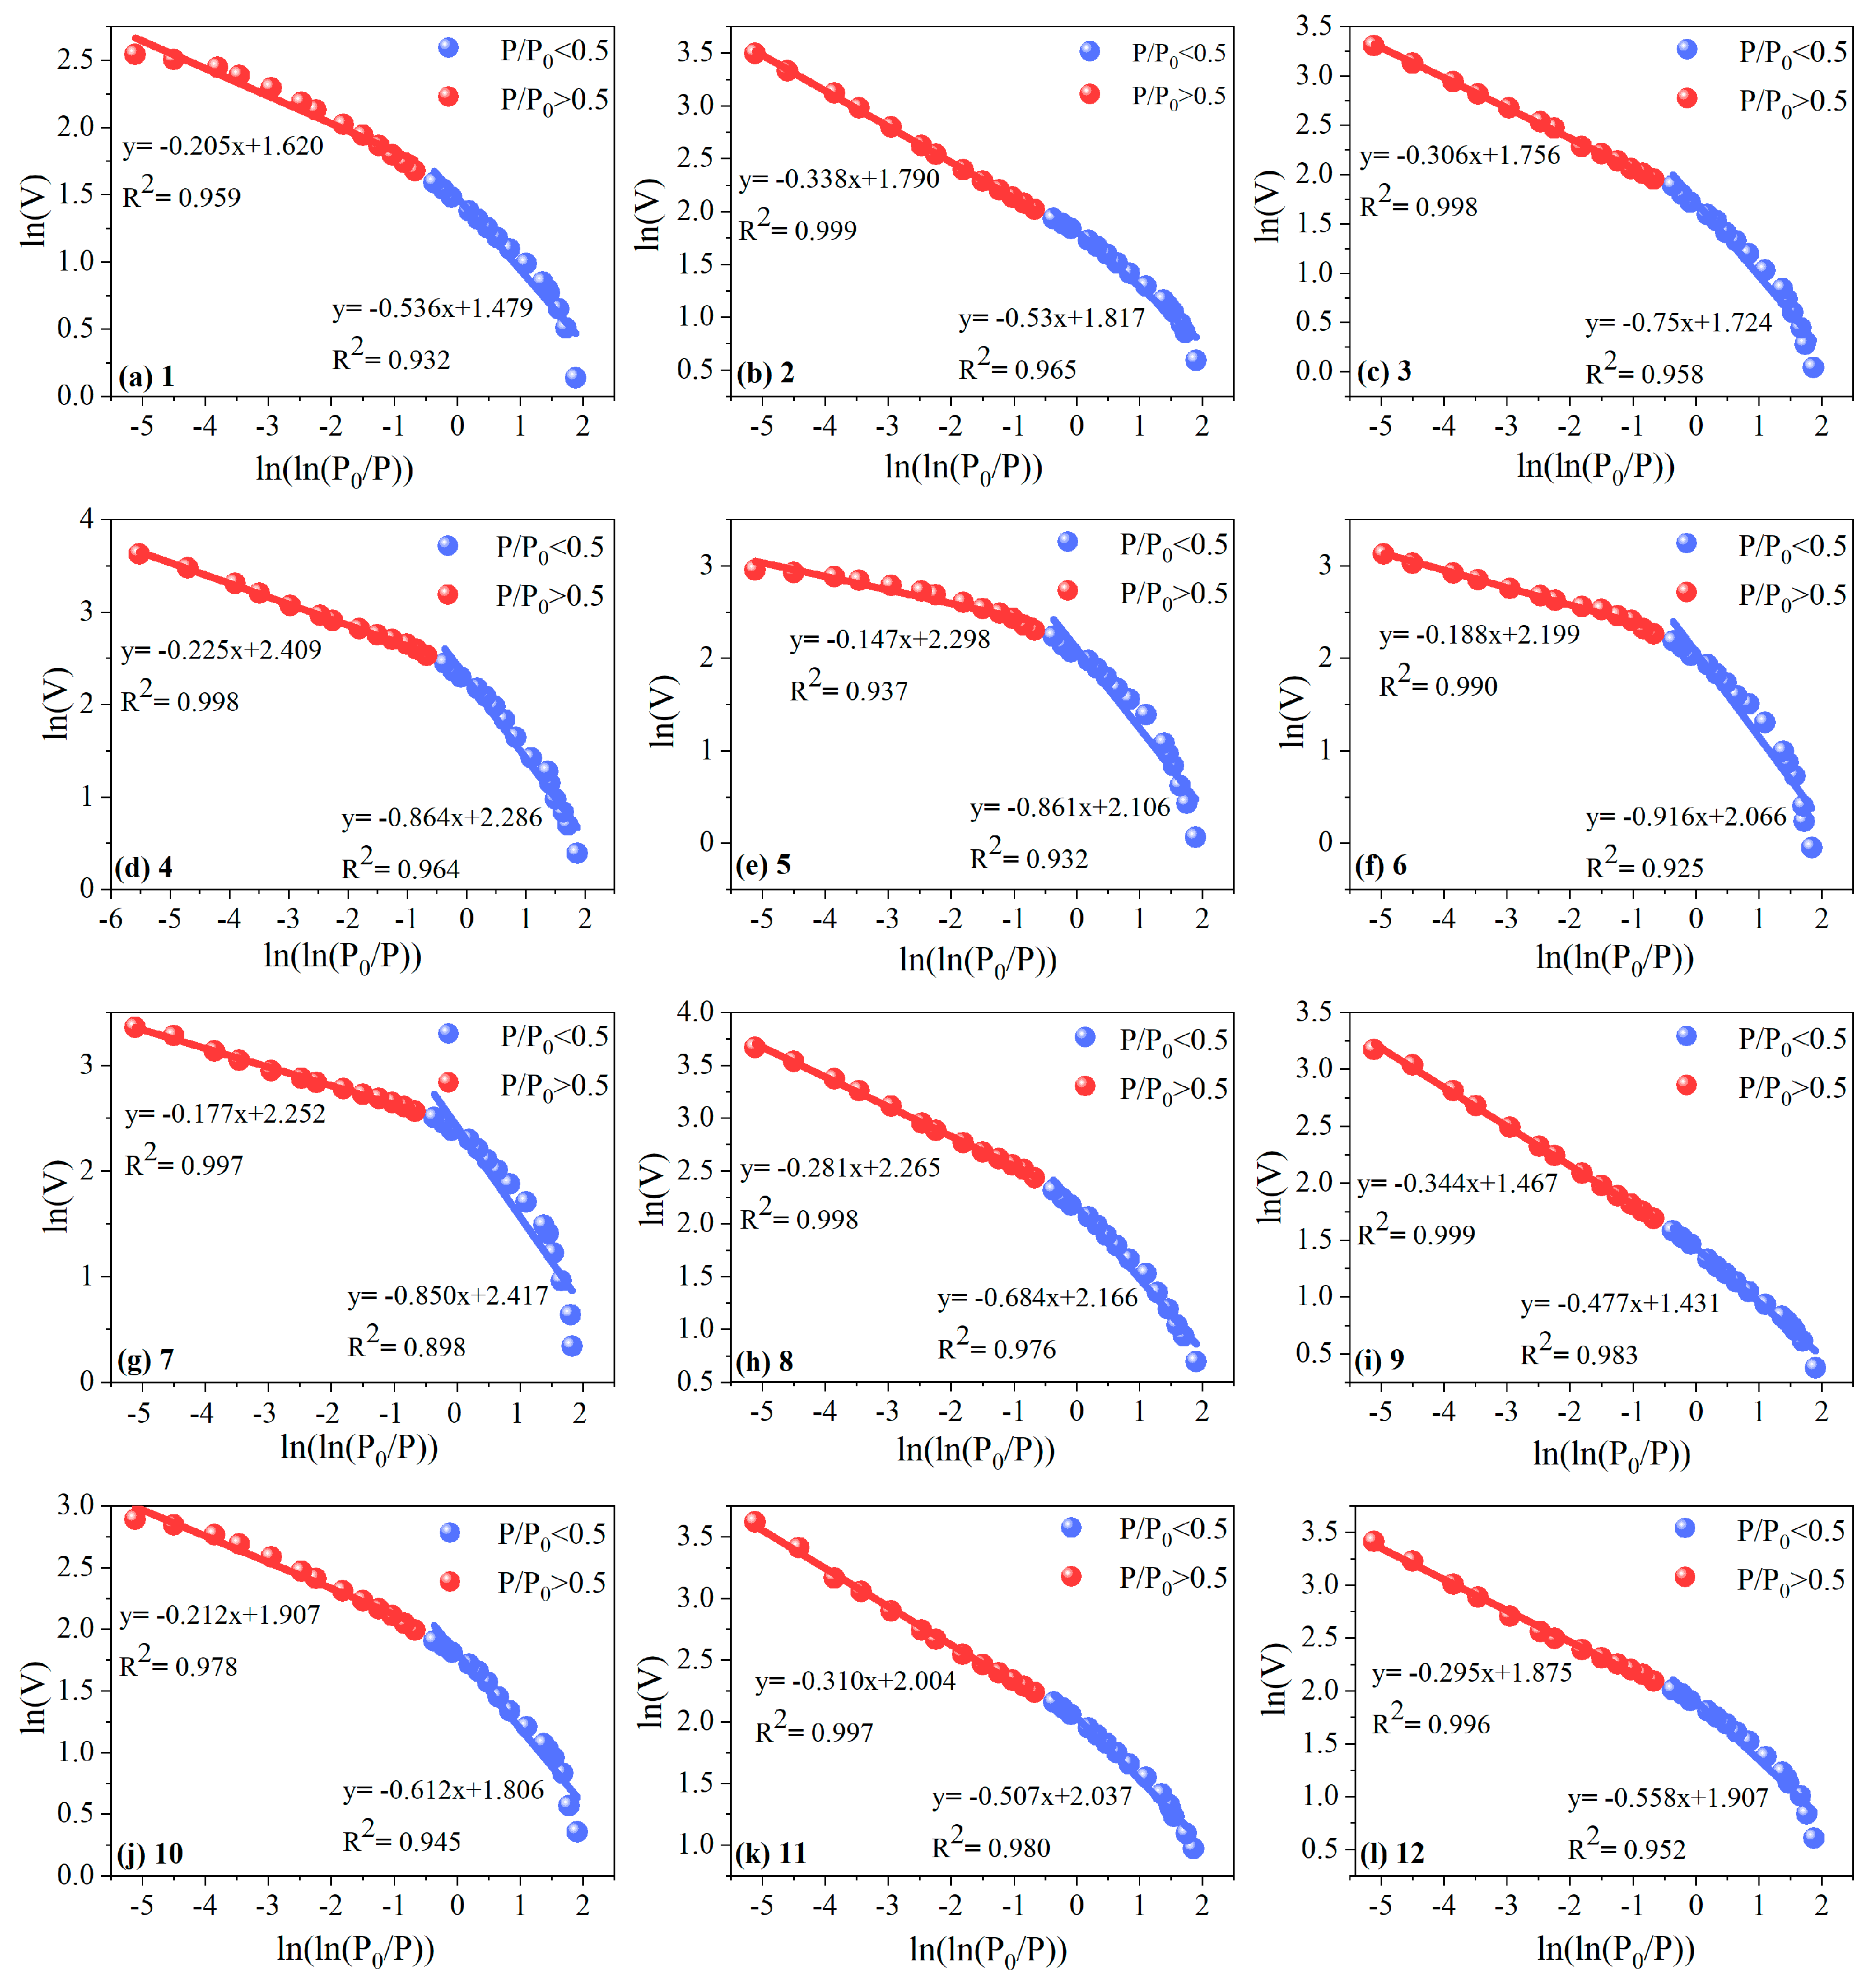
4.3.1. Micropore Fractal Characteristic

Micropores are one of the essential pore types in shale, playing a crucial role in the storage and migration of natural gas in reservoirs. To effectively characterize the fractal characteristics of micropores in shale, this study employed the V-S model. Although the application of the V-S model in the study of micropore fractal characteristics in shale is relatively limited, previous studies have demonstrated that the model provides high computational precision and excellent fitting performance, especially for the calculation of micropore fractal dimensions [17,41,45,46]. The application principle of the V-S model is suitable for shale and other porous sedimentary media. It analyzes gas adsorption data to obtain the fractal dimension of pores and further characterizes the complexity and surface roughness of pore structures. The model offers a quantitative approach to reveal the adsorption characteristics of micropores under different pressures, thus providing theoretical support for analyzing the distribution, connectivity, and heterogeneity of shale pores. The V-S model fitting curves for the Shanxi Formation shale in the study area are shown in Figure 5.
The linear regression presented in Figure 5 indicate that the fitting goodness is high, with 11 out of the 12 samples having a correlation coefficient R2 greater than 0.99. This indicates that the pore distribution in the shale of the study area follows fractal characteristics within a certain range and exhibits good geometric self-similarity. From the slope of the fitting equation, it can be seen that the fractal dimensions of the shale samples vary, reflecting differences in the complexity of the pore structure across different samples. An elevated fractal dimension signifies a more intricate and irregular pore surface morphology, potentially suggesting a greater distribution of micropores. Conversely, samples with smaller fractal dimensions imply a more uniform and smoother pore structure. The average value of Dc is approximately 2.5, which is close to the midpoint of the theoretical fractal dimension range of 2–3, indicating that the micropore surfaces in the marine–continental transitional shale of the Shanxi Formation are relatively smooth, with low roughness and a simpler pore structure.

4.3.2. Mesopore Fractal Characteristics

In exploring the pore size fractal characteristics of shale using N2 adsorption, the FHH model was employed. The N2 adsorption experimental data were incorporated into Formulas (2) and (3), and scatter plots of ln(ln(P0/P)) vs. ln(V) were generated for the samples from the study area. Upon observing the N2 adsorption–desorption isotherms, a distinct change was observed around a relative pressure of 0.5, where a turning point appeared. Therefore, the adsorption data were divided into low-pressure (0–0.5) and high-pressure (0.5–1.0) segments for further fitting. The FHH model fitting curves for the Shanxi Formation shale in the research domain are presented in Figure 6.
The fractal dimension fitting curves for the S23 subsection shale can be analyzed separately for the low-pressure and high-pressure stages. In the low-pressure stage (P/P0 < 0.5), van der Waals forces dominate, and gas adsorption is influenced by the surface irregularity of the shale. The fractal dimension DN1 represents the fractal characteristics of the pore surface [47,48]. The average fractal dimension in this stage is 2.321, with most correlation coefficients approaching 0.95, indicating a good fitting and a relatively smooth shale surface. During the high-pressure phase (P/P0 > 0.5), capillary condensation forces dominate, and the adsorption process is intimately connected with internal pore structure of the shale [49]. The fractal dimension DN2 represents the volumetric characteristics of the pore structure. Its average value is 2.748, with correlation coefficients exceeding 0.93, indicating a good fit and a more complex shale pore structure. A larger DN1 suggests a rougher shale surface, while a larger DN2 indicates a more complex internal pore structure. Generally, DN1 is smaller than DN2, indicating that the shale surface is smoother than the internal pore structure. The high-pressure stage shows higher fractal dimensions for smaller pores, signifying that the mesopore structure exhibits greater irregularity and structural complexity.

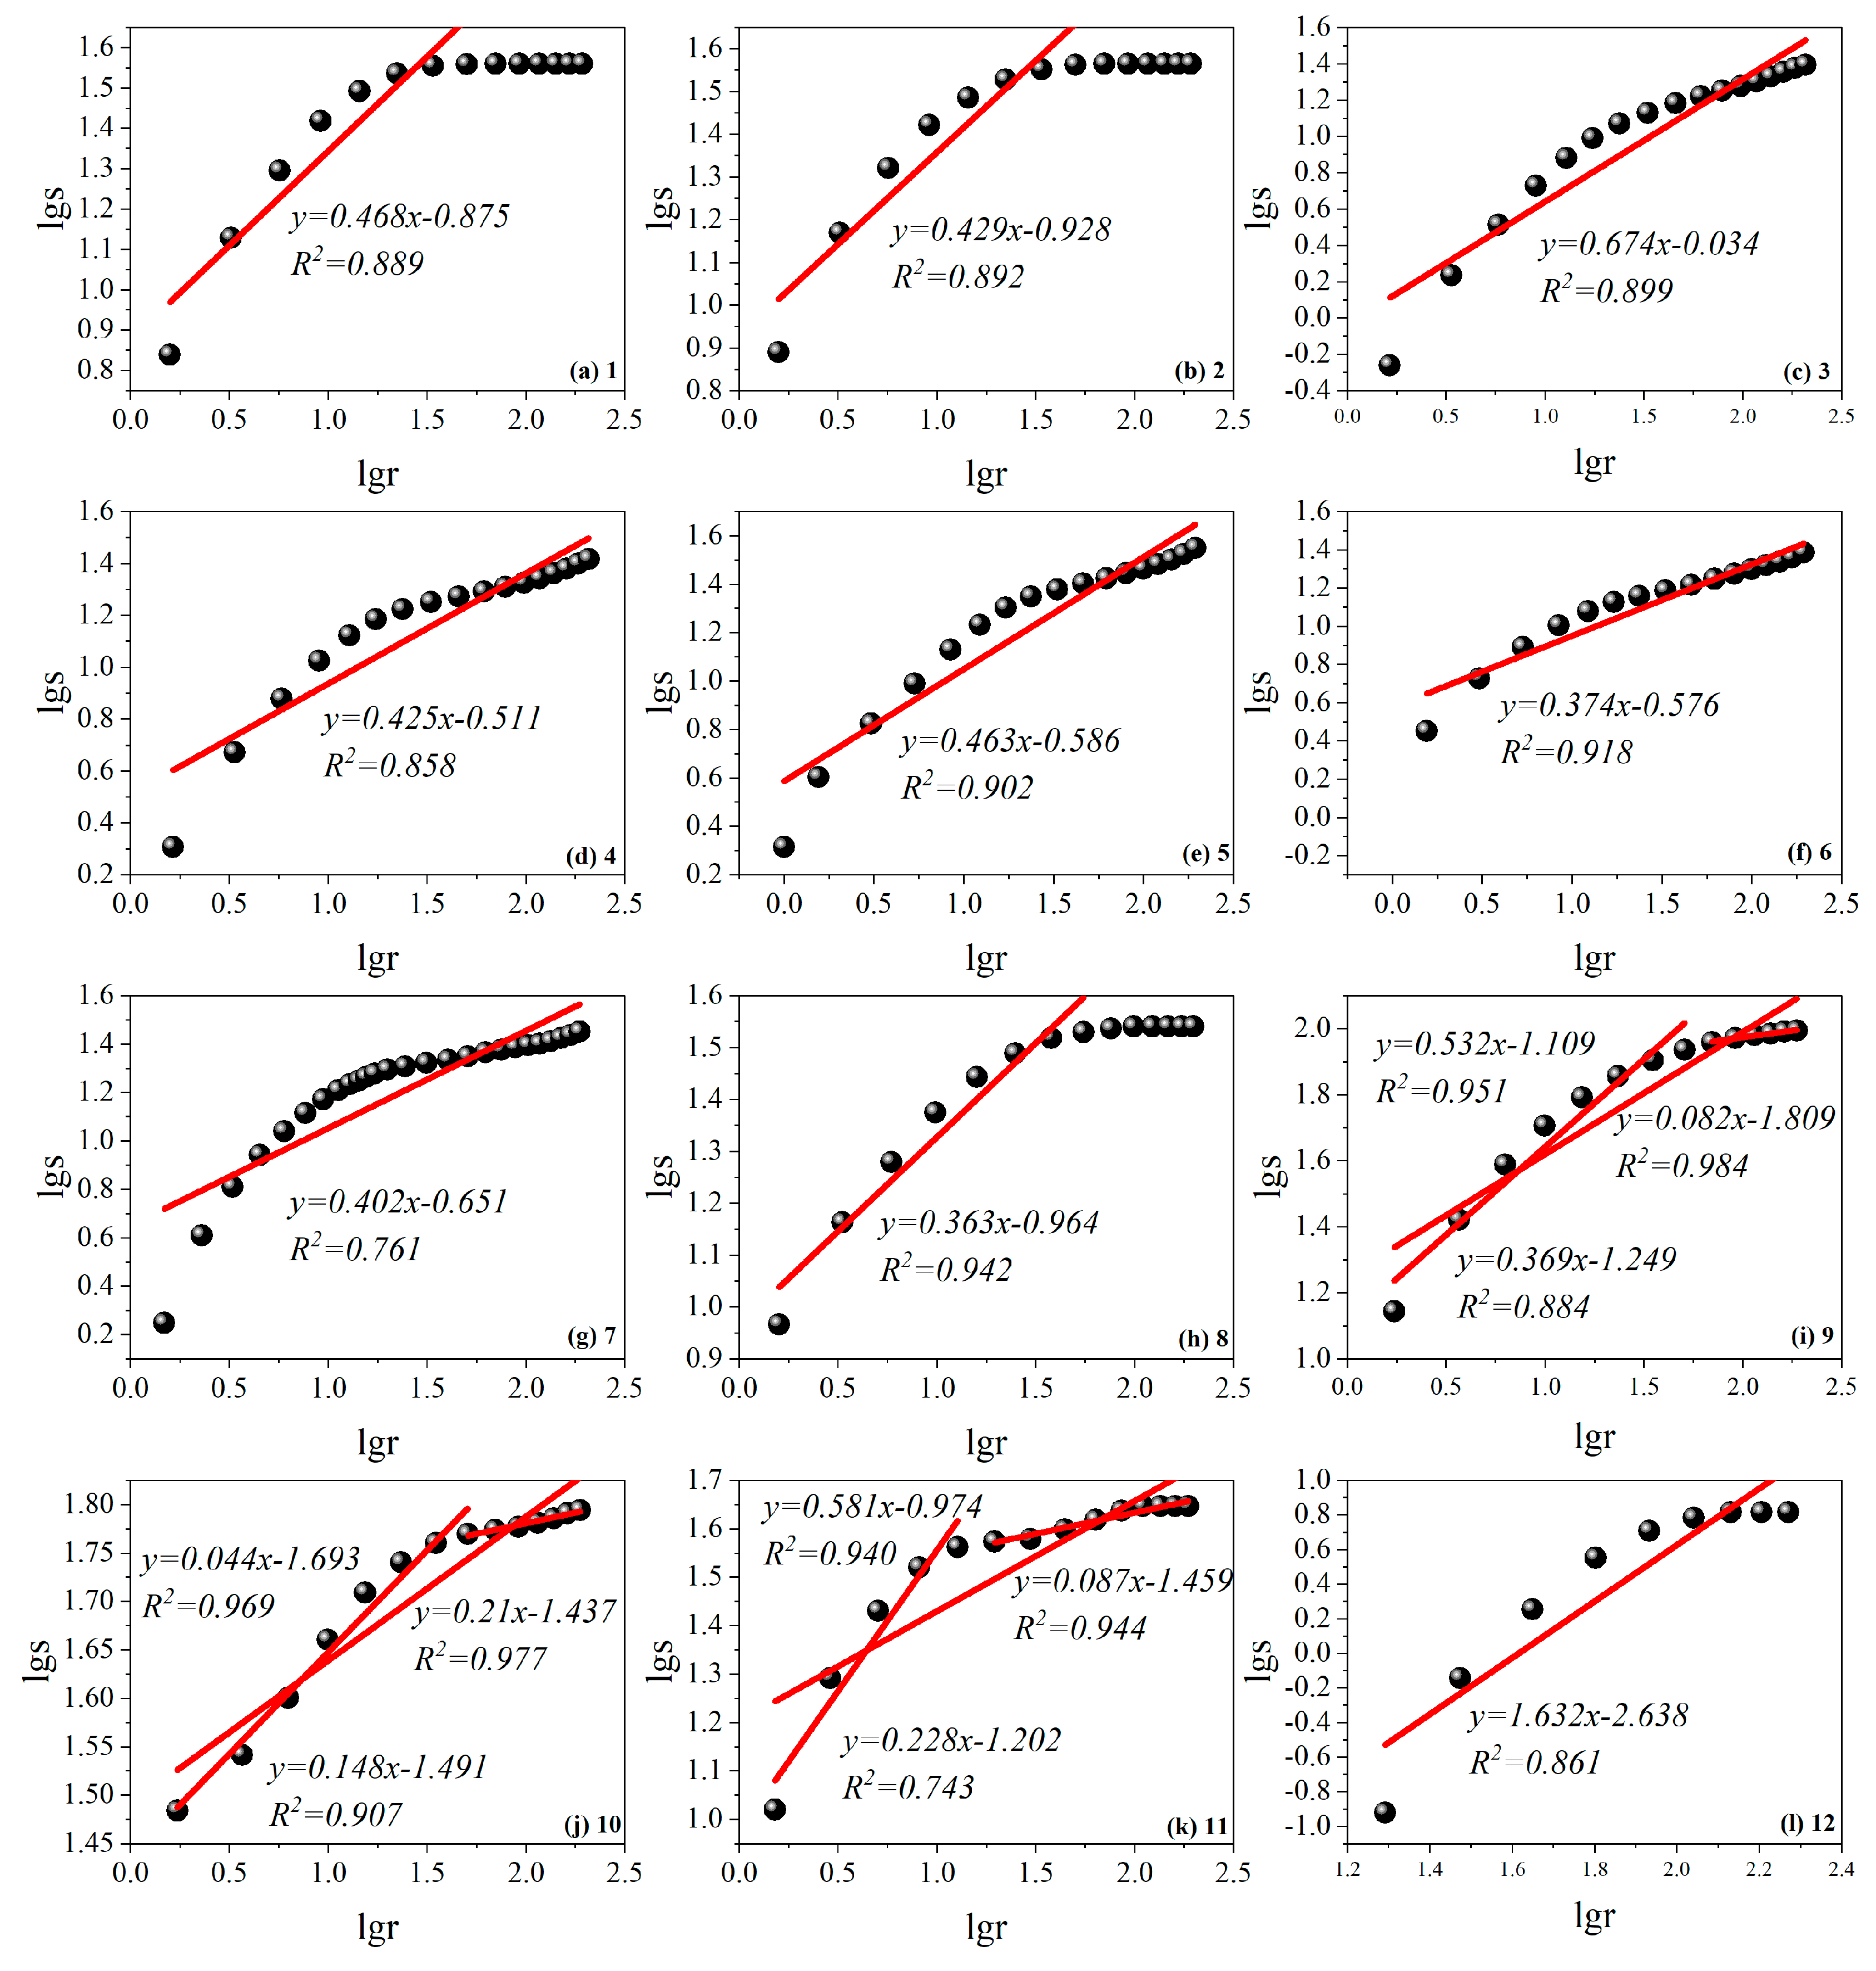
4.3.3. Macropore Fractal Characteristics

High-pressure mercury intrusion is a commonly used experimental method for characterizing the pore characteristics of porous materials. Its maximum theoretical testing range spans from 3.6 nm to 100 μm, making it particularly suitable for studying macropores in shale (pore diameter > 50 nm). This study adopted a pressure curve fractal geometry model based on high-pressure mercury intrusion data. When the pressure reaches a certain value, the pore volume percentage tends to saturate, making further application of the fractal model meaningless. As a result, data points corresponding to the saturation state were excluded during fitting for some samples. Based on the mercury intrusion experimental data, the linear fitting results of lg(s) and lg(r) were obtained, and the fractal dimension DM was calculated, yielding the fractal fitting curve for macropores in the shale samples (Figure 7).
From the fitting results in Figure 7, it can be observed that there are significant differences in the fractal dimensions of different samples. Samples 9 and 10 exhibit higher fractal dimensions and better fitting accuracy (R2), indicating that these samples have more complex pore surfaces with significant fractal characteristics. In contrast, samples 7 and 11 show lower fractal dimensions, suggesting that their pore surfaces are simpler.
The weaker correlation in the fitting curves may be related to non-ideal pore distribution structures. Some shale samples display distinct segmentations in their macropore fractal characteristics, with a boundary at a pore diameter of 200 nm. Although the overall fractal dimension correlation coefficient is relatively low (R2 < 0.91), after segmenting, the correlation coefficient for each segment exceeds 0.94, showing stronger fractal features. The macropore fractal dimensions of the shale samples span from 2.226 to 2.852, with sample 12 having a fractal dimension less than 2, indicating the absence of fractal characteristics. Most samples have fractal dimensions greater than 2.5, reflecting higher pore complexity. Only samples 3 and 6, have fractal dimensions less than 2.5, indicating that their pore surfaces are relatively smooth with lower complexity. Overall, most samples show high fitting accuracy, supporting the applicability of fractal theory in the study of shale macropore structure.

5. Discussions

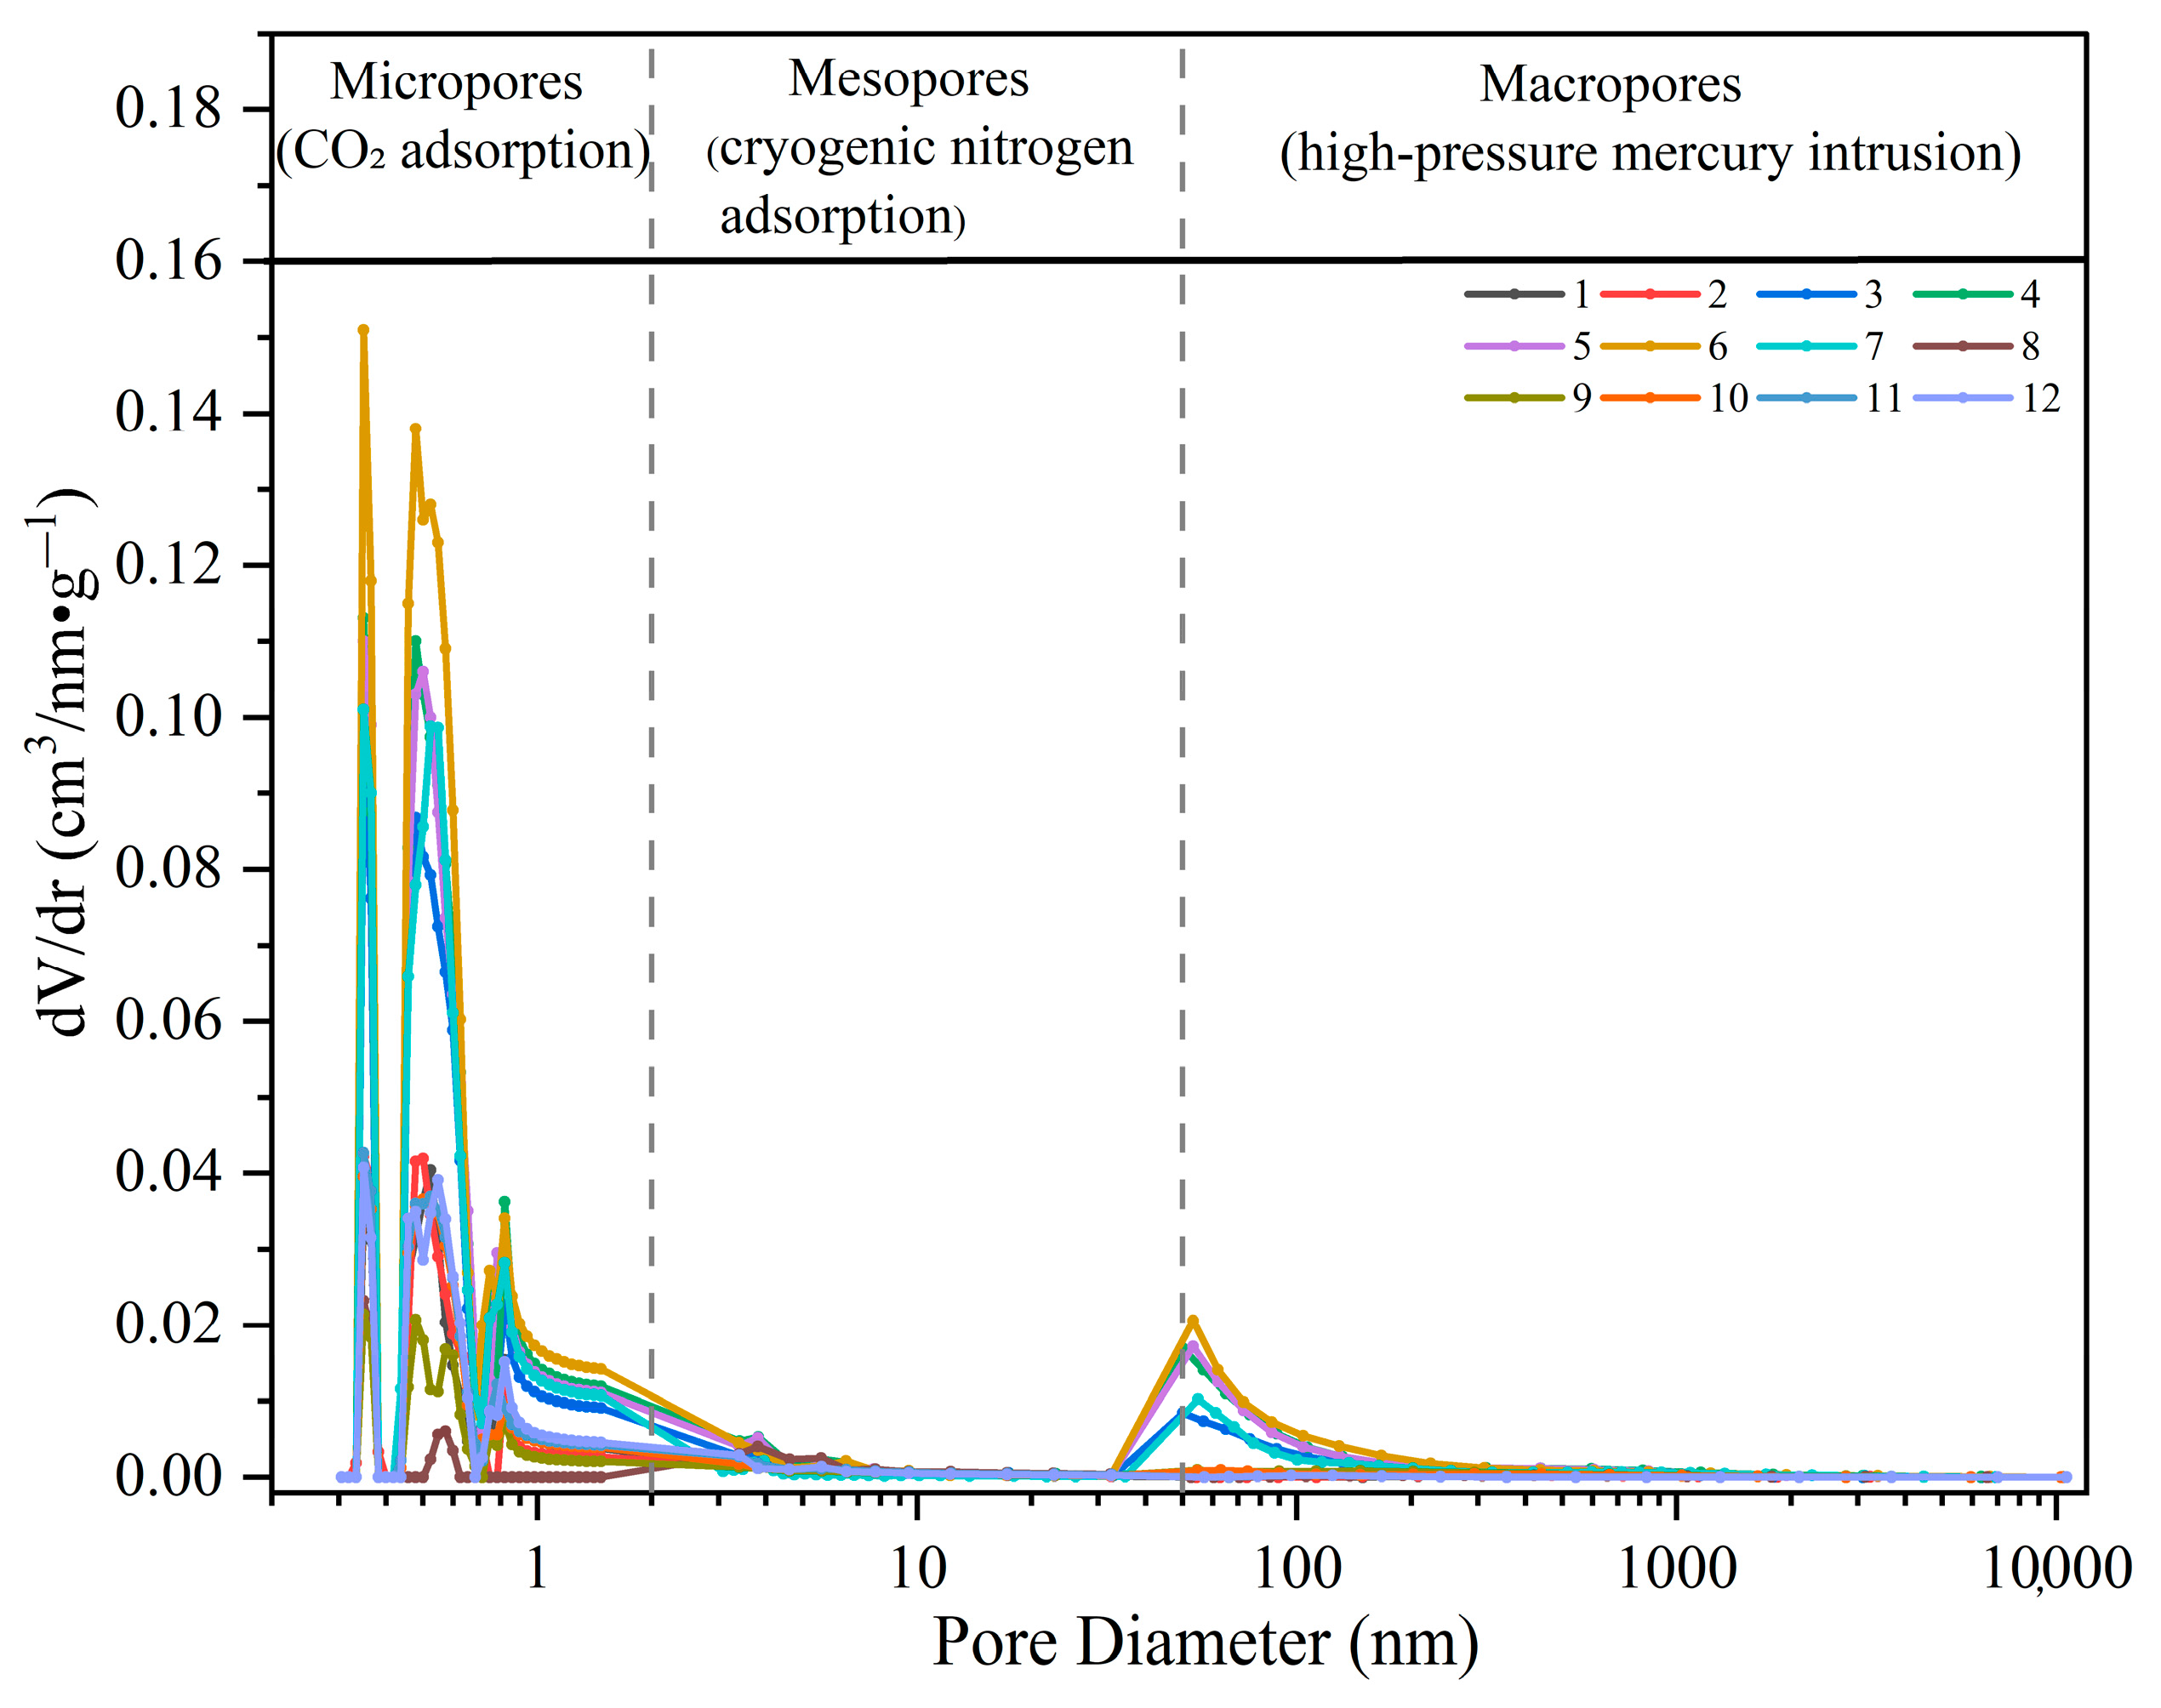
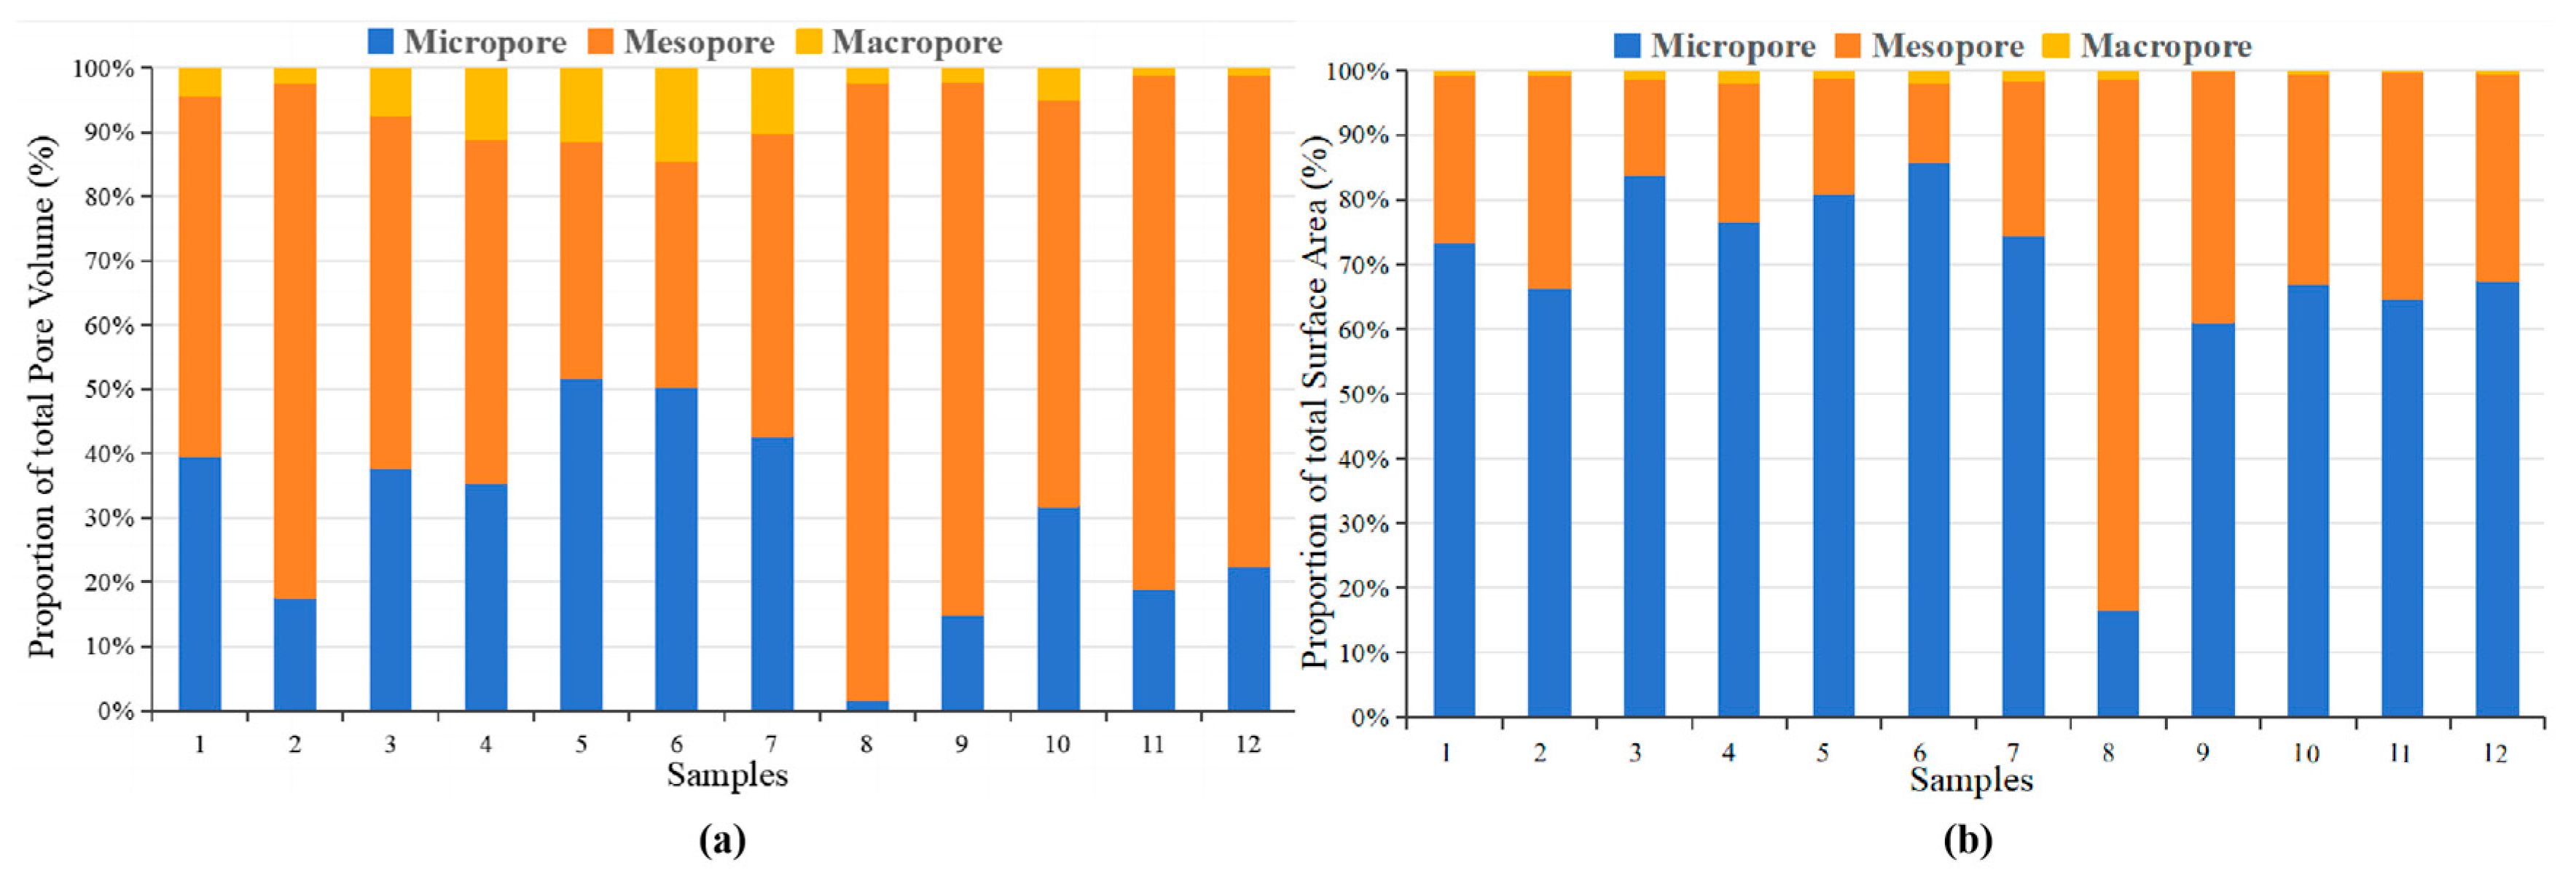
5.1. Full Pore Size Characterization

To accurately characterize the overall pore structure of shale reservoirs, the pore size characteristics of samples were characterized using all three testing methods (Figure 8). To maximize the advantages of each experimental method, the best results from each method were selected for analysis. Macropores (greater than 50 nm) were determined using high-pressure mercury intrusion, mesopores (2–50 nm) were determined using N2 adsorption, and micropores (less than 2 nm) were determined using CO2 adsorption. The combined pore size characterization results (Figure 8) show that the pore size distribution of shale samples is micropore- and mesopore-dominant, with a multimodal distribution. Micropores and mesopores dominate, providing a large specific surface area that is highly favorable for the storage of adsorbed shale gas. In contrast, macropores exhibit a unimodal distribution, characterized by minimal contributions to pore volume and specific surface area. Overall, the shale samples from the S23 subsection of the Daji area display a multimodal, a multiscale pore framework.
The contributions of these three types of pores to total pore volume and total pore surface area were calculated (Figure 9). The results show that all three pore types contribute to the pore volume, with mesopores making the most substantial contribution, with a pore volume range of 0.0155–0.0537 cm3/g, accounting for 35.23–96.07% of the total pore volume, averaging 63.52%. Micropores contribute slightly less than mesopores, with an average contribution of 30.5% to the total pore volume. The contribution of macropores is relatively low, averaging 5.98%. Micropores and mesopores provide the majority of the specific surface area, with micropores providing a specific surface area range of 5.241–138.304 m2/g, averaging 63.179 m2/g, and accounting for 16.78–85.77% of the total specific surface area, with an average of 68.30%. Followed by mesopores, contributing an average of 30.76% to the total specific surface area, while macropores contribute very little, averaging 0.94%. In conclusion, mesopores and micropores provide the majority of pore volume and control the total pore surface area of shale.
The shale samples in the study area exhibit pronounced fractal characteristics across the micropore, mesopore, and macropore ranges (Table 3), reflecting the complexity of pore structures at different pore size intervals. According to fractal theory, the fractal dimension of porous solids typically ranges between 2 and 3. A higher fractal dimension indicates a more complex storage space, poorer pore sorting, and stronger reservoir heterogeneity; in contrast, a lower fractal dimension suggests better storage properties, improved sorting, and weaker heterogeneity [50,51]. Given the inherent multiscale and heterogeneous nature of shale pore systems, different pore size intervals contribute unevenly to the overall structural complexity. Therefore, to better characterize the comprehensive complexity of shale pore structures, this study introduces a volume-weighted average fractal dimension (DS) based on the relative pore volume of each size interval. The comprehensive fractal dimension is calculated using the following equation [52]:
D s = i = 1 n V i V · D i
where DS is the comprehensive fractal dimension (dimensionless), Vi is the pore volume of the i-th pore size interval (cm3/g), V is the total pore volume (cm3/g), and Di is the fractal dimension of the corresponding interval (dimensionless).
As shown by the calculation results (Table 3), the comprehensive fractal dimension (DS) of the shale samples in the study area ranges from 2.436 to 2.594, with an average value of 2.523. These results suggest that the transitional shale in the study area is characterized by a complex pore system and pronounced reservoir heterogeneity.

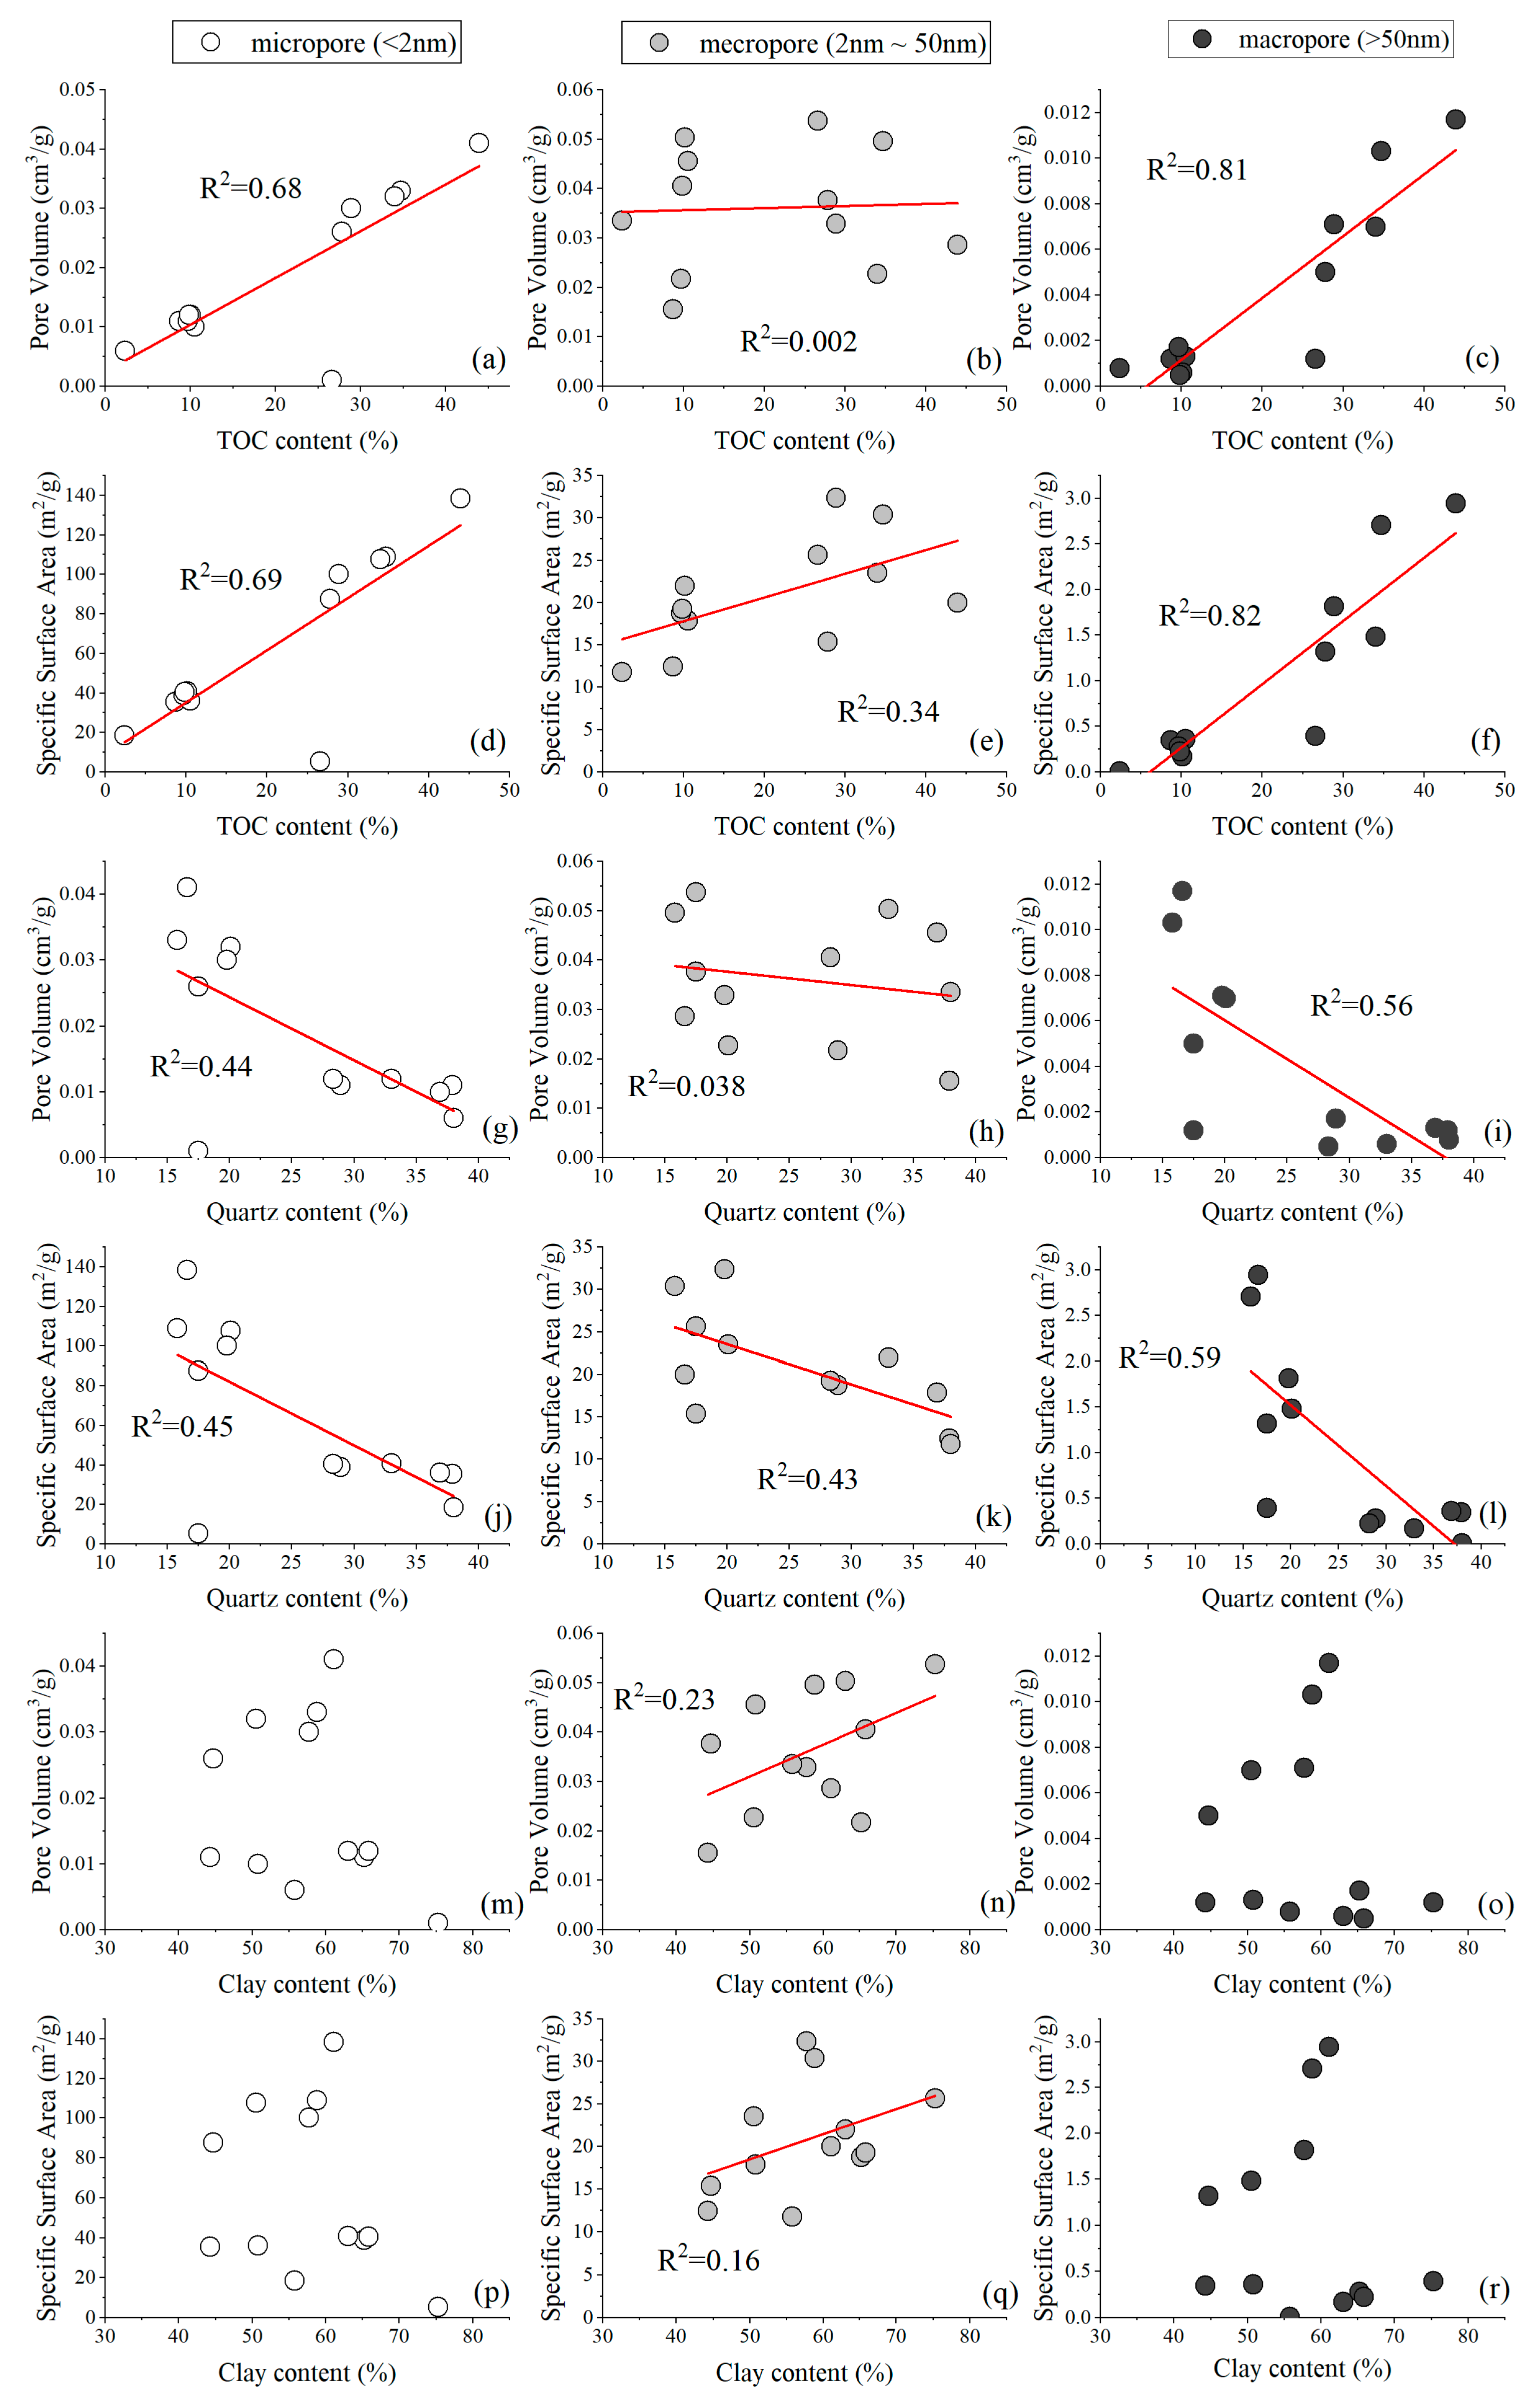
5.2. The Relevance of Pore Structure to Shale Composition

Previous studies have qualitatively described the relationships between shale pores and components such as organic matter, clay minerals, and quartz in marine shales [41,53,54]. This study found that in marine–continental transitional shales, pore volume and specific surface area are closely related to TOC content and quartz, while their correlation with clay minerals is relatively weak.
Correlation analysis demonstrates that TOC content is strongly positively correlated with both total specific surface area and total pore volume (Figure 10), indicating that organic matter pores are extensively developed in marine–continental transitional shales. Moreover, TOC content exhibits strong positive correlations with micropore and macropore volumes, suggesting that TOC is a primary factor controlling the development of these pore types (Figure 10a,c,d,f). This may be attributed to the formation of organic pores during the thermal evolution and decomposition of organic matter [55]. Clay mineral content shows a weak positive correlation with the total pore volume and specific surface area of mesopores, highlighting its certain influence on the mesopore structure. However, its correlation with micropores and macropores is not significant (Figure 10m,o,p,r), possibly due to the soft and plastic nature of organic matter, which may intrude into the intergranular spaces of inorganic minerals during compaction, thereby reducing inorganic pore volume [56]. Quartz content is negatively correlated with pore structure parameters, indicating that pore volume and specific surface area increase with the reduction of quartz content.

5.3. The Relevance of Shale Composition to Fractal Dimensions

Fractal dimension, as an important parameter for characterizing the complexity and heterogeneity of pore structures, can effectively reflect the structural intricacy of pores across different size ranges. The results indicate that the micropore fractal dimension (Dc) exhibits a weak negative correlation with TOC and clay mineral content (Figure 11) but exhibits a weak positive correlation with quartz. This suggests that the higher TOC content does not necessarily lead to a more complex pore structure in organic matter pores [11], the complexity of micropore structures is primarily influenced by the brittleness of quartz, which tends to generate numerous microfractures and fine pores [56]. Therefore, higher quartz content in the samples generally corresponds to an increased abundance of microfractures, leading to higher micropore fractal dimensions.
In contrast, the mesopore fractal dimension DN1 is strongly negatively correlated with TOC content, specific surface area, pore volume, and porosity. This implies that samples with higher organic matter content and well-developed pore systems exhibit lower DN1 values. A possible explanation is that abundant TOC content facilitates the formation of nanoscale organic pores and fine microfractures, significantly increasing specific surface area. However, these pores tend to be relatively uniform and lack large-scale irregular surfaces, resulting in reduced structural complexity and thus lower DN1 [57,58,59]. Conversely, DN2 is positively correlated with TOC, suggesting that intervals enriched in organic matter possess more complex nanoscale mesopore structures. Organic pores and clay-bound cementation introduce irregular pore walls, thereby increasing DN2 [53,60].
The macropore fractal dimension (DM) shows the weakest correlation with pore volume and specific surface area, likely because macropores are sparsely distributed in the shale of the study area and contribute minimally to overall pore structure.

6. Conclusions

The marine–continental transitional shale within the research area exhibits a generally elevated TOC content in comparison to marine shale, with values predominantly spanning from 2.37% to 43.9%, averaging at 20.59%. Regarding its mineralogical composition, clay minerals constitute a substantial mass fraction, predominantly ranging between 44.3% and 75.30%, with an average of 57.75%, signifying favorable hydrocarbon generation potential.
The pore system is primarily characterized by micropores and mesopores, which provide the majority of pore volume and specific surface area. These features are critical for gas storage and adsorption, while macropores contribute minimally.
Fractal analysis reveals well-organized and relatively smooth micropore surfaces, dual-scale structural complexity in mesopores, and variable heterogeneity in macropores, reflecting distinct reservoir qualities at different scales. This comprehensive pore structure and fractal analysis offers a robust foundation for informing strategies for sustainable and efficient development of marine–continental transitional shale gas resources.
The pore structure of marine–continental transitional shale is primarily influenced by organic matter and mineral composition. Parameters of pore structure—specific surface area and pore volume—show a positive correlation with TOC, a negative correlation with quartz content, and no obvious correlation with clay mineral content.

Author Contributions

Conceptualization, W.D. and J.Z.; data curation, J.Z., W.D., Q.Z. and Y.X.; formal analysis, J.Z., Q.Z., C.S. and Y.L.; funding acquisition, W.D. and Q.Z.; methodology, J.Z., W.D., Q.Z., X.W., G.D., C.S., Y.L., L.S. and Y.X.; Investigation, J.Z., X.W., G.D., C.S., Y.L., L.S. and X.Z.; supervision, W.D. and Q.Z.; visualization, J.Z. and W.D.; writing—original draft, J.Z.; writing—review and editing, W.D. and J.Z. All authors have read and agreed to the published version of the manuscript.

Funding

This study was funded by the National Natural Science Foundation of China (42202175), and the Forward-looking and Fundamental Technology Research Projects of the Science and Technology Management Department of PetroChina (2024DJ8701, 2021DJ2001).

Data Availability Statement

Further inquiries about the data in this study can be directed to the corresponding author.

Conflicts of Interest

Author Xiaofeng Wang was employed by No. 12 Oil Production Plant, PetroChina Changqing Oilfield Company. The remaining authors declare that the research was conducted in the absence of any commercial or financial relationships that could be construed as a potential conflict of interest.

References

  1. Adeyilola, A.; Nordeng, S.; Onwumelu, C.; Nwachukwu, F.; Gentzis, T. Geochemical, Petrographic and Petrophysical Characterization of the Lower Bakken Shale, Divide County, North Dakota. Int. J. Coal Geol. 2020, 224, 103477. [Google Scholar] [CrossRef]
  2. Zhang, J.C.; Shi, M.; Wang, D.S.; Tong, Z.Z.; Hou, X.D.; Niu, J.L.; Li, X.Q.; Li, Z.M.; Zhang, P.; Huang, Y.Q. Fields and Directions for Shale Gas Exploration in China. Nat. Gas Ind. B 2022, 9, 20–32. [Google Scholar] [CrossRef]
  3. Guo, X.S.; Wang, R.Y.; Shen, B.J.; Wang, G.P.; Wan, C.X.; Wang, Q.R. Geological Characteristics, Resource Potential, and Development Directionof Shale Gas in China. Pet. Explor. Dev. 2025, 52, 15–28. [Google Scholar] [CrossRef]
  4. Nie, H.K.; Dang, W.; Zhang, K.; Su, H.K.; Ding, J.H.; Li, D.H.; Liu, X.W.; Li, P.; Li, P.; Yang, S.Y.; et al. Two Decades of Shale Gas Research & Development in China: Review and Prospects. Nat. Gas Ind. 2024, 44, 20–52. [Google Scholar] [CrossRef]
  5. Wu, J.; Wang, H.Y.; Shi, Z.S.; Wang, Q.; Zhao, Q.; Dong, D.Z.; Li, S.X.; Liu, D.X.; Sun, S.S.; Qiu, Z. Favorable Lithofacies Types and Genesis of Marine-Continental Transitional Black Shale: A Case Study of Permian Shanxi Formation in the Eastern Margin of Ordos Basin, NW China. Pet. Explor. Dev. 2021, 48, 1315–1328. [Google Scholar] [CrossRef]
  6. Guo, W.; Gao, J.L.; Li, H.; Kang, L.X.; Zhang, J.W.; Liu, G.H.; Liu, Y.Y. The Geological and Production Characteristics of Marine-Continental Transitional Shale Gas in China:Taking the Example of Shale Gas from Shanxi Formation in Ordos Basin and Longtan Formation in Sichuan Basin. Miner. Explor. 2023, 14, 448–458. [Google Scholar] [CrossRef]
  7. Liu, W.; Zhao, Q.; Qiu, Z.; Zhao, P.H.; Li, S.X.; Dong, D.Z.; Liu, H.L.; Hou, W.; Zhang, Q.; Xiao, Y.F.; et al. Research Status and Prospect of Accumulation Conditions of Transitional Facies Shale Gas in the Eastern Margin of Ordos Basin. Nat. Gas Geosci. 2023, 34, 868–887. [Google Scholar] [CrossRef]
  8. Jiang, Y.Q.; Wen, S.M.; Cai, G.Y.; Li, S.X.; Xiong, X.Y.; Li, X.T.; Dong, D.Z.; Qiu, Z.; Gu, Y.F.; Wang, Z.L.; et al. Lithologic Assemblage Characteristics and Shale Gas Exploration Potential of Transitional Shale in the Ordos Basin. Nat. Gas Ind. 2023, 43, 62–75. [Google Scholar] [CrossRef]
  9. Liu, J.P.; Liu, D.X.; Hu, H.Y.; Jiao, P.F.; Wang, T.; Xie, Z.T.; Liu, L.H. Pore Structure Characteristics of Marine Continental Transitional Facies Shale of Shanxi Formation in the Eastern Margin of Ordos Basin. China Sci. 2022, 17, 21–30. [Google Scholar]
  10. Luo, L.Y.; Li, Y.; Li, S.X.; He, Q.B.; Chen, S.J.; Li, X.; Li, X.T.; Lu, J.G.; Xiao, Z.L.; Yin, X.D. Controlling Factors of Marine and Continental Transitional Shale Gas Enrichment in Shan23 Sub-Member, Daji Area, Eastern Margin of Ordos Basin. Nat. Gas Geosci. 2024, 36, 554–566. [Google Scholar] [CrossRef]
  11. Ning, S.T.; Xia, P.; Hao, F.; Tian, J.Q.; Fu, Y.; Wang, K. Pore Fractal Characteristics between Marine and Marine–Continental Transitional Black Shales: A Case Study of Niutitang Formation and Longtan Formation. Fractal Fract. 2024, 8, 288. [Google Scholar] [CrossRef]
  12. Gao, J.; Li, X.; Cheng, G.; Luo, H.; Zhu, H. Structural Evolution and Characterization of Organic-Rich Shale from Macroscopic to Microscopic Resolution: The Significance of Tectonic Activity. Adv. Geo-Energy Res. 2023, 10, 84–90. [Google Scholar] [CrossRef]
  13. Wang, L.; Liu, B.; Bai, L.; Yu, Z.; Huo, Q.; Gao, Y. Pore Evolution Modeling in Natural Lacustrine Shale Influenced by Mineral Composition: Implications for Shale Oil Exploration and CO2 Storage | Advances in Geo-Energy Research. Adv. Geo-Energy Res. 2025, 13, 218–230. [Google Scholar] [CrossRef]
  14. Cai, J.; Jiao, X.; Wang, H.; He, W.; Xia, Y. Multiphase Fluid-Rock Interactions and Flow Behaviors in Shale Nanopores: A Comprehensive Review. Earth-Sci. Rev. 2024, 257, 104884. [Google Scholar] [CrossRef]
  15. Fu, C.; Xu, X.; Du, Y.; Kou, X. Experimental Study on the Influence of Pore Structure on Spontaneous Imbibition in Marine Black Shale. Capillarity 2024, 10, 57–72. [Google Scholar] [CrossRef]
  16. Wu, J.; Xiao, Y.F.; Liu, D.; Liu, X.; Guo, W.; Li, S.X.; Gao, J.L.; Lin, W. Heterogeneity of Shale Gas Reservoirs in Marine-Continental Transitional Facies and Its Controlling Factors:An Example of Shanxi Formation in Daning-Jixian Block on Eastern Margin of Ordos Basin. J. Northeast. Pet. Univ. 2022, 46, 12–23+97+2. [Google Scholar] [CrossRef]
  17. He, C.C.; Zhao, Y.Q.; Yu, L.G.; Lu, L.F.; Liu, W.X.; Pan, A.Y.; Li, C.X. Pore Structure and Fractal Characteristics of Deep Shale Gas Reservoirs in the Permian Dalong Formation, Northeastern Sichuan Basin. Pet. Geol. Exp. 2024, 46, 263–277. [Google Scholar] [CrossRef]
  18. Xia, X.; Jiao, X.; Li, J.; Shen, W.; Xia, Y.; Wang, H. Gas Adsorption Behavior in Shale Reservoirs: Insights from Molecular Scale. Capillarity 2024, 13, 68–72. [Google Scholar] [CrossRef]
  19. He, X.P.; Cai, X.; Gao, Y.Q.; Ding, A.X.; Jiang, Z.G.; He, G.S.; Xia, W.; Zeng, J. Experimental Technologies of Shale Gas Exploration and Development: Research Progress and Development Direction. Nat. Gas Ind. 2024, 44, 12–26. [Google Scholar] [CrossRef]
  20. Dai, F.; Hu, H.; Zhang, A. Suitability Study on Fractal Model of Organic Shale Pore. Coal Sci. Technol. 2019, 47, 168–175. [Google Scholar] [CrossRef]
  21. Wang, Z.L.; Guo, B.; Jiang, C.; Qi, L.; Jiang, Y.Q.; Gu, Y.F.; Fu, Y.H.; Liang, D.M. Nanoscale Pore Characteristics of the Lower Permian Shanxi Formation Transitional Facies Shale, Eastern Ordos Basin, North China. Front. Earth Sci. 2022, 10, 842955. [Google Scholar] [CrossRef]
  22. Xia, Y.; Cai, J.; Perfect, E.; Wei, W.; Zhang, Q.; Meng, Q. Fractal Dimension, Lacunarity and Succolarity Analyses on CT Images of Reservoir Rocks for Permeability Prediction. J. Hydrol. 2019, 579, 124198. [Google Scholar] [CrossRef]
  23. Zhao, B.S.; Li, R.X.; Qin, X.L.; Wang, N.; Zhou, W.; Khaled, A.; Zhao, D.; Zhang, Y.N.; Wu, X.L.; Liu, Q. Geochemical Characteristics and Mechanism of Organic Matter Accumulation of Marine-Continental Transitional Shale of the Lower Permian Shanxi Formation, Southeastern Ordos Basin, North China. J. Pet. Sci. Eng. 2021, 205, 108815. [Google Scholar] [CrossRef]
  24. Li, Y.; Xu, L.F.; Wu, P.; Hu, W.Q.; Liu, C.; Li, M. Lithofacies Characteristics and Reservoir Differences of Marine-Continental Transitional Shale in the Eastern Margin of the Ordos Basin. Nat. Gas Ind. 2023, 43, 38–54. [Google Scholar] [CrossRef]
  25. Yang, C.; Zhang, J.C.; Wang, X.Z.; Tang, X.; Chen, Y.C.; Jiang, L.L.; Gong, X. Nanoscale Pore Structure and Fractal Characteristics of a Marine-Continental Transitional Shale: A Case Study from the Lower Permian Shanxi Shale in the Southeastern Ordos Basin, China. Mar. Pet. Geol. 2017, 88, 54–68. [Google Scholar] [CrossRef]
  26. Kuang, L.C.; Dong, D.Z.; He, W.Y.; Wen, S.M.; Sun, S.S.; Li, S.X.; Qiu, Z.; Liao, X.W.; Li, Y.; Wu, J.; et al. Geological Characteristics and Development Potential of Transitional Shale Gas in the East Margin of the Ordos Basin, NW China. Pet. Explor. Dev. 2020, 47, 435–446. [Google Scholar] [CrossRef]
  27. Lan, Z.L.; Guo, W.; Wang, Q.; Zhang, X. Shale Gas Accumulation Condition and Favorable Area Optimization of the Permian Shanxi Formation, Eastern Ordos Basin. Acta Geol. Sin. 2016, 90, 177–188. [Google Scholar]
  28. Xue, Y.K.; Dang, W.; Zhang, Q.; Liu, J.; Shangguan, L.D.; Lei, Y.Z.; Zhang, X.; Feng, Y.B.; Qiu, Z. Lithofacies and Its Reservoir Characteristics of Marine–Continental Transitional Shales: A Case Study of Shanxi Formation in Eastern Ordos Basin. Energy Fuels 2024, 38, 18441–18456. [Google Scholar] [CrossRef]
  29. Wang, Y.C.; Zhang, L.F.; Qiu, Z.; Peng, S.Z.; Feng, C.J.; Sun, M.S. Lithofacies types and reservoir characteristics of transitional shales of the Permian Shan23 sub-member, eastern Ordos Basin. Nat. Gas Geosci. 2022, 33, 418–430. [Google Scholar] [CrossRef]
  30. GB/T 19145-2022; Determination for Total Organic Carbon in Sedimentary Rock. State Administration for Market Regulation (SAMR) and Standardization Administration of China (SAC): Beijing, China, 2022.
  31. SY/T 5163-2018; X-Ray Diffraction Analysis Methods for Clay Minerals and Common Non-Clay Minerals in Sedimentary Rocks. National Energy Administration (NEA): Beijing, China, 2018.
  32. Dang, W.; Jiang, S.; Zhang, J.C.; Li, P.; Nie, H.K.; Liu, Y.; Li, F.; Sun, J.T.; Tao, J.; Shan, C.A.; et al. A Systematic Experimental and Modeling Study of Water Adsorption/Desorption Behavior in Organic-Rich Shale with Different Particle Sizes. Chem. Eng. J. 2021, 426, 130596. [Google Scholar] [CrossRef]
  33. Gu, Y.T.; Wan, Q.; Li, X.X. The Selection of Outgas Temperature for Shale in Low-Pressure N2 Adsorption: An Evidence from Thermogravimetry. Energy Explor. Exploit. 2021, 39, 1685–1696. [Google Scholar] [CrossRef]
  34. GB/T 21650-2008; Pore Size Distribution and Porosity of Solid Materials by Mercury Porosimetry and Gas Adsorption—Part 1: Mercury Porosimetry. Beijing Center for Physical and Chemical Analysis and Institute of Process Engineering, Chinese Academy of Sciences (IPE, CAS): Beijing, China, 2008.
  35. Mandelbrot, B.B. The Fractal Geometry of Nature; Revised and Enlarged Edition; Times Books: Singapore, 1983. [Google Scholar]
  36. Lowell, S.; Shields, J.E.; Thomas, M.A.; Thommes, M. Characterization of Porous Solids and Powders: Surface Area, Pore Size and Density; Springer Science & Business Media: Berlin/Heidelberg, Germany, 2012; Volume 16, ISBN 978-1-4020-2303-3. [Google Scholar]
  37. Wang, X.Q.; Zhu, Y.M.; Wang, Y. Fractal Characteristics of Micro- and Mesopores in the Longmaxi Shale. Energies 2020, 13, 1349. [Google Scholar] [CrossRef]
  38. Avnir, D.; Jaroniec, M. An Isotherm Equation for Adsorption on Fractal Surfaces of Heterogeneous Porous Materials. Langmuir 1989, 5, 1431–1433. [Google Scholar] [CrossRef]
  39. He, C.Z.; Hua, M.Q. Fractal Geometry Description of Reservoir Pore Structure. Oil Gas Geol. 1998, 19, 15–23. [Google Scholar]
  40. Wang, Y.; Zhong, B.Y.; Zhang, Y.S.; Zhu, Y.M.; Wang, M. Analysis of Nanostructures and Wettability of Marine Shale in Southern China, Based on Different Fractal Models. Fractal Fract. 2025, 9, 12. [Google Scholar] [CrossRef]
  41. Jiang, W.; Zhang, Y.; Ma, T.R.; Chen, S.; Hu, Y.; Wei, Q.; Zhuang, D.X. Pore Structure and Its Fractal Dimension: A Case Study of the Marine Shales of the Niutitang Formation in Northwest Hunan, South China. Fractal Fract. 2025, 9, 49. [Google Scholar] [CrossRef]
  42. Standard Methods for the Analysis of Oils, Fats and Derivatives. In Standard Methods for the Analysis of Oils, Fats and Derivatives; International Union of Pure and Applied Chemistry: Zurich, Switzerland, 1992.
  43. Sing, K.S.W. Reporting Physisorption Data for Gas/Solid Systems with Special Reference to the Determination of Surface Area and Porosity (Recommendations 1984). Pure Appl. Chem. 1985, 57, 603–619. [Google Scholar] [CrossRef]
  44. Everett, D.H.; Koopal, L.K. International Union of Pure and Applied Chemistry. Polymer 2001, 31, 1598. [Google Scholar]
  45. Wang, S.D.; Chen, F.Y.; Yue, S.H.; Hu, J.; Ding, H.R.; Lu, A.H. Multifractal Characterization of Pore Structure of Coals Using Gas Adsorption Experiment and Mercury Intrusion Porosimetry (MIP). Fractal Fract. 2025, 9, 183. [Google Scholar] [CrossRef]
  46. Xie, W.D.; Wang, M.; Wang, H.; Duan, H.Y. Multi-Scale Fractal Characteristics of Pores in Transitional Shale Gas Reservoir. Nat. Gas Geosci. 2022, 33, 451–460. [Google Scholar] [CrossRef]
  47. Li, Z. Characteristics and Influencing Factors of Shale Pore Structure in Zhangye 1 Well in Xuanhua Basin. Complex Hydrocarb. Reserv. 2025, 18, 152–159+166. [Google Scholar] [CrossRef]
  48. Zhang, P.; Zhang, X.; Wang, K. Study on Pore Characteristics of High Rank Coal in Shangqiu Area Based on Low-Temperature Nitrogen Adsorption Method. Coal Geol. China 2023, 35, 39–45. [Google Scholar] [CrossRef]
  49. Liu, J.J.; Zhang, Y.L.; Yang, D.; Gao, Z.Y.; Wang, D. Joint Characterization of Middle and Low Rank Coal Pores and Fracturesbased on Pressed Mercury-Nitrogen Adsorption-Nuclear Magnetic Resonance Method. J. Henan Polytech. Univ. 2024, 1–15. [Google Scholar] [CrossRef]
  50. Chandra, D.; Vishal, V.; Bahadur, J.; Sen, D. A Novel Approach to Identify Accessible and Inaccessible Pores in Gas Shales Using Combined Low-Pressure Sorption and SAXS/SANS Analysis. Int. J. Coal Geol. 2020, 228, 103556. [Google Scholar] [CrossRef]
  51. Hazra, B.; Wood, D.A.; Vishal, V.; Varma, A.K.; Sakha, D.; Singh, A.K. Porosity Controls and Fractal Disposition of Organic-Rich Permian Shales Using Low-Pressure Adsorption Techniques. Fuel 2018, 220, 837–848. [Google Scholar] [CrossRef]
  52. Li, P.; Chen, H.R.; Wang, Y.; Zhu, Y.M.; Jiang, Z.F.; Wang, Y. Pore Fractal Characteristics of marine-continental transitional shale of Shanxi Formation in Kaiping syncline. Nat. Gas Geosci. 2025, 1–20. [Google Scholar] [CrossRef]
  53. Wang, D.X.; Xie, Z.T.; Hu, H.Y.; Wang, T.; Deng, Z. Pore Structure and Fractal Characteristics of Marine–Continental Transitional Black Shales: A Case Study of the Permian Shanxi Formation in the Eastern Margin of the Ordos Basin. Processes 2023, 11, 1424. [Google Scholar] [CrossRef]
  54. Yang, M.P.; Pan, Y.Y.; Feng, H.Y.; Yan, Q.; Lu, Y.J.; Wang, W.X.; Qi, Y.; Zhu, H.J. Fractal Characteristics of Pore Structure of Longmaxi Shales with Different Burial Depths in Southern Sichuan and Its Geological Significance. Fractal Fract. 2024, 9, 2. [Google Scholar] [CrossRef]
  55. Zhang, J.Z.; Li, X.Q.; Zhang, G.W.; Zou, X.Y.; Wang, F.Y.; Tang, Y.J. Microstructural Investigation of Different Nanopore Types in Marine-Continental Transitional Shales: Examples from the Longtan Formation in Southern Sichuan Basin, South China. Mar. Pet. Geol. 2019, 110, 912–927. [Google Scholar] [CrossRef]
  56. Li, X. Controlling Factors and Evaluation of Storage Capacity in Marine Shale and Transitional Shale of South China. Ph.D. Thesis, China University of Petroleum, Beijing, China, 2020. [Google Scholar]
  57. Yang, Y.Y.; Zhang, J.C.; Xu, L.F.; Li, P.; Liu, Y.; Dang, W. Pore Structure and Fractal Characteristics of Deep Shale: A Case Study from Permian Shanxi Formation Shale, from the Ordos Basin. ACS Omega 2022, 7, 9229–9243. [Google Scholar] [CrossRef]
  58. Zhao, T.Y.; Li, X.F.; Ning, Z.F.; Zhao, H.W.; Zhang, J.L.; Zhao, W. Pore Structure and Adsorption Behavior of Shale Gas Reservoir with Influence of Maturity: A Case Study of Lower Silurian Longmaxi Formation in China. Arab. J. Geosci. 2018, 11, 353. [Google Scholar] [CrossRef]
  59. Tian, H.; Pan, L.; Xiao, X.M.; Wilkins, R.W.T.; Meng, Z.P.; Huang, B.J. A Preliminary Study on the Pore Characterization of Lower Silurian Black Shales in the Chuandong Thrust Fold Belt, Southwestern China Using Low Pressure N2 Adsorption and FE-SEM Methods. Mar. Pet. Geol. 2013, 48, 8–19. [Google Scholar] [CrossRef]
  60. Shi, S.; He, J.X.; Zhang, X.L.; Wu, H.C.; Yu, Z.Q.; Wang, J.; Yang, T.T.; Wang, W. Fractal Analysis of Pore Structures in Transitional Shale Gas Reservoirs in the Linxing Area, Ordos Basin. Front. Earth Sci. 2022, 10, 979039. [Google Scholar] [CrossRef]
Figure 1. Location of the study area and comprehensive lithological column of the Lower Permian [28,29].
Energies 18 04013 g001
Figure 2. CO2 adsorption curve and pore size distribution of the S23 subsection shale. (a) CO2 adsorption curve; (b) pore size distribution.
Energies 18 04013 g002
Figure 3. N2 adsorption–desorption curve and pore size distribution of the S23 subsection shale. (a) N2 adsorption–desorption curve; (b) pore size distribution.
Energies 18 04013 g003
Figure 4. High-pressure mercury intrusion curve and pore size distribution of the S23 subsection shale. (a) High-pressure mercury intrusion curve; (b) pore size distribution.
Energies 18 04013 g004
Figure 5. Fractal fitting curves of the V-S model for shale in the S23 subsection of the study area.
Energies 18 04013 g005
Figure 6. Fractal fitting curves of the FHH model for shale in the S23 subsection of the study area.
Energies 18 04013 g006
Figure 7. Fractal fitting curves of the pressure geometry model for shale in the S23 subsection of the study area.
Energies 18 04013 g007
Figure 8. Pore size characterization through combined high-pressure mercury intrusion, N2 adsorption, and CO2 adsorption.
Energies 18 04013 g008
Figure 9. Distribution of micropore–mesopore–macropore volume (a) and specific surface area (b) proportions in the S23 subsection shale of the study area.
Energies 18 04013 g009
Figure 10. The correlation between parameters of pore structure and mineral composition in different pore size. (af) Pore volume and specific surface area versus TOC content; (gl) pore volume and specific surface area versus quartz content; (mr) pore volume and specific surface area versus clay content.
Energies 18 04013 g010
Figure 11. The correlation matrix diagram of fractal dimension with mineral composition and pore structure parameters.
Energies 18 04013 g011
Table 1. TOC content and mineral compositions of shale samples in the study area.
Sample No.Depth (m)TOC(%)Quartz (%)Feldspar (%)Siderite (%)Ferroan Dolomite (%)Calcite (%)Pyrite (%)Clay Minerals (%)Illite–Smectite (I/S) (%)Illite (I) (%)Kaolinite (K) (%)Chlorite (C) (%)
12145.218.6637.9 002.5114.344.3 3226392
22145.3410.536.9 001.66.93.850.8 3330352
32145.5727.817.5 00026.811.044.7 2229409
42145.8634.715.8 03.02.46.713.358.8 1532485
52146.233420.1 00013.116.350.5 823627
62146.4843.916.6 002.36.014.061.1 1227547
72147.1128.919.8 01.29.62.09.757.7 920638
82165.6126.617.5 006.400.875.3 1013716
92165.872.3738.0 41.1001.155.8 2536354
102166.099.728.9 00005.965.2 1518608
112166.9510.133.0 00004.063.0 1023607
122167.239.8528.3 02.7003.265.8 1325594
Table 2. Mercury intrusion testing data of shale samples from subsection S23.
Sample No.Depth
(m)
Pore Volume
(cm3/g)
Surface Area
(m2/g)
Particle Density (g/cm3)Porosity (%)
12145.210.00120.352.500.31
22145.340.00130.362.510.31
32145.570.00501.322.471.24
42145.860.01032.702.442.52
52146.230.00701.482.461.72
62146.480.01172.952.442.84
72147.110.00711.822.461.76
82165.610.00120.402.500.31
92165.870.00080.012.500.21
102166.090.00170.282.500.41
112166.950.00060.172.500.15
122167.230.00050.232.510.14
Table 3. Pore fractal dimension characteristics of micropores, mesopores, macropores, and full pore size.
Sample No.MicroporesMesoporesMacroporesFull Pore Size
DCR2DN1R2DN2R2DMR2DS
12.4570.9962.4640.9322.7950.9592.5320.8892.557
22.5860.9962.470.9652.6620.9992.5710.8922.570
32.490.9962.250.9582.6940.9982.3260.8992.468
42.5020.9962.1360.9642.7750.9982.5750.8582.485
52.4720.9962.1390.9322.8530.9372.5370.9022.488
62.4870.9962.0840.9252.8120.9902.2260.9182.436
72.4660.9962.150.8982.8230.9972.5980.7612.489
82.2590.9872.3160.9762.7190.9982.6370.9422.515
92.6130.9952.5230.9832.6560.9992.6310.8842.594
102.4690.9962.3880.9452.7880.9782.8520.9072.563
112.4630.9962.4930.9802.690.9972.7720.7432.569
122.4630.9962.4420.9522.7050.9961.3680.8612.537
Disclaimer/Publisher’s Note: The statements, opinions and data contained in all publications are solely those of the individual author(s) and contributor(s) and not of MDPI and/or the editor(s). MDPI and/or the editor(s) disclaim responsibility for any injury to people or property resulting from any ideas, methods, instructions or products referred to in the content.

