Article

Enrichment and Exploration Potential of Shale Gas in the Permian Wujiaping Formation, Northeastern Sichuan Basin

1
PetroChina Southwest Oil & Gasfield Company, Chengdu 610051, China
2
Exploration and Development Research Institute, PetroChina Southwest Oil & Gasfield Company, Chengdu 610041, China
3
National Key Laboratory of Oil and Gas Reservoir Geology and Exploitation, Southwest Petroleum University, Chengdu 610500, China
4
Sichuan Natural Gas Geology Key Laboratories, Chengdu 610500, China
5
School of Geoscience and Technology, Southwest Petroleum University, Chengdu 610500, China
6
Shale Gas Research Institute, PetroChina Southwest Oil & Gasfield Company, Chengdu 610051, China
7
Sichuan Key Laboratory of Shale Gas Evaluation and Exploitation, Guanghan 618300, China
*
Author to whom correspondence should be addressed.
Energies 2025, 18(17), 4506; https://doi.org/10.3390/en18174506 (registering DOI)
Submission received: 22 July 2025 / Revised: 10 August 2025 / Accepted: 22 August 2025 / Published: 25 August 2025
(This article belongs to the Special Issue Sustainable Development of Unconventional Geo-Energy)

Abstract

The high-yield industrial gas from Sichuan Basin’s Wujiaping (P3w) shale reveals a new unconventional exploration play. Due to the strong heterogeneity of shale gas, its enrichment and exploration potential remain unclear. Geochemical and other experiments conducted on this layer have shown that: (1) The third member of the P3w (P3w3) shale has optimal quality, with large thickness and wide distribution. The average TOC value is 6.09%, and the organic matter type is II1~II2. (2) Shale gas in the P3w is supplied by organic-rich shale; enrichment is promoted by siliceous/clay shale interbedding, with storage in organic matter pores and fractures. (3) Comparative analyses with the Wufeng–Longmaxi shales (O3w-S1l) show that P3w3 is the layer with the greatest potential for shale gas exploration.

1. Introduction

Shale gas, as a kind of unconventional geological resource, has become a significant contributor to the global clean energy supply [1,2,3,4]. With the development of exploration and development technology, unconventional oil and gas have shown great resource potential [5,6,7,8,9]. Organic shales in particular have vast reserves, positioning them as a strategic frontier for China’s energy sector [1,2]. China’s shale gas has developed rapidly in the past two decades and has now become the world’s second-largest shale gas producer after the United States. China’s marine shale gas production has shown a rapid growth trend, which promotes the continuous growth of China’s shale gas reserves [5]. Currently, commercial shale gas extraction has been achieved in the middle–shallow strata of the Wufeng–Longmaxi Formation (O3w-S1l) in the Sichuan Basin [10]. As exploration and development efforts expand from shallow to deeper layers, notable achievements have been made. For instance, the risky exploration well HY1 yielded a test gas flow of 8.9 × 10⁴ m3/d from the deep Wujiaping Formation (P3w) in 2020 [10]. Similarly, the well D1 achieved a high-yield test gas flow of 32.06 × 10⁴ m3/d in 2022. These results underscore the promising exploration and development prospects of shale gas in P3w of the Sichuan Basin [11].
The P3w belongs to the marine sedimentary strata located within a trench tension zone. This formation has undergone frequent sea transgressions and regressions, resulting in longitudinally complex lithological assemblies, significant regional variations in shale thickness, and considerable burial depths [12]. At the same time, the P3w is located in the deep-water sedimentary zone, and the frequent fluctuation of sea level leads to abundant organic matter sources and sufficient deposition space. Repeated deposition eventually leads to the development of shale with high organic matter abundance, and high total organic carbon content (TOC) is an important sign of the good exploration potential of shale gas [13,14]. Currently, research on the P3w in northeastern Sichuan remains limited. However, due to the depositional influence of the Kaijiang–Liangping Trough, this formation developed deep-water shelf marine shale in northeastern Sichuan, exhibiting geological characteristics somewhat akin to those of the marine O3w-S1l shale [15]. Previous investigations primarily focused on hydrocarbon source rock traits, petrographic features, and reservoir spaces [16]. These studies revealed that the P3w predominantly consists of thin-layered shale deposits, with most areas exhibiting TOC exceeding 2%. Additionally, the development of beach-phase pore-type reservoir spaces is characterized by high porosity and gas content [17,18]. However, there are still many controversies about the understanding of the P3w. These include the use of a singular evaluation index for hydrocarbon source rocks, the assessment criteria for deep-water shelf marine shale, and the geological parallels drawn between it and the O3w-S1l shale [15]. In particular, a comprehensive evaluation of P3w source rocks is needed to characterize shale reservoir properties. This will clarify shale thickness/distribution patterns and identify key factors controlling gas enrichment, which are crucial for assessing exploration potential.
This study conducted organic geochemical analysis and reservoir property evaluation on the P3w shale. Based on the experimental data, such as TOC and porosity, as well as the logging data, combined with scanning electron microscopy and thin section observation, The controlling factors of shale gas enrichment were discussed, and the exploration potential of the P3w was analyzed. Eventually, the optimal exploration section of shale gas in the P3w was obtained. Comparative assessment with commercially developed O3w-S1l formations provides theoretical basis for Permian marine shale gas exploration in the northeastern Sichuan Basin.

2. Geological Setting

The Sichuan Basin evolved through polycyclic subsidence-uplift events, now manifesting as a foreland basin framed by orogenic belts [10,19,20]. Tectonic zonation reflects differential deformation intensities along major fault systems [21]. Late Permian Yangtze–Qinling plate convergence induced northern platform differentiation, creating the NW–SE trending Kaijiang–Liangping Trough, a Permian extensional regime-hosted deepwater carbonate depocenter [22,23].
The tectonic-sedimentary differentiation in the Permian study area was significant (Figure 1). Controlled by the evolution of the sedimentary environment, the lithology and mineral components in different phase areas have undergone significant differentiation. The bottom of the P3w in the study layer is in integrated contact with the Maokou Formation, with local sedimentary interruptions, and the top gradually transitions to the Dalong Formation. According to the differences in lithological composition, the P3w can be divided into three sections. As the depth of the sedimentary water body gradually deepens from the first member of the P3w (P3w1) to the third member of the P3w (P3w3), the shallow-water clay shale gradually transitions to the deep-water siliceous shale.

3. Materials and Methods

The core samples collected in this study are from the P3w of Well D1 in northeast Sichuan, which is the first Permian shale gas risk exploration well deployed in the Kaijiang–Liangping Trough, and the main exploration is the P3w.
In accordance with “Determination of Total Organic Carbon in Sedimentary Rocks”, the TOC in shale was measured with a Carbon and Sulphur Analyzer. After grinding and polishing, the organic petrographic observation was carried out by using reflected light of a polarizing microscope to identify the organic microscopic components. All operation analyses were conducted using the LECO carbon-sulfur analyzer from the United States, model CS230.
Microscopic observation was conducted using a high-resolution field emission scanning electron microscope (FE-SEM). The equipment model is FEI Quanta 650 FEG and it is produced in the United States. The specimens were placed under FE-SEM to observe the development of micropores and cracks.
The N2 adsorption analysis was performed at low pressure (<14 psia), and shale samples were crushed to the target size range of 60–80 mesh. After vacuum degassing at 110 °C for 12 h, the test was carried out with 77.3 K of high-purity nitrogen. The experiment was conducted using the Micromeritics ASAP 2460 fully automatic specific surface area and pore size analyzer from the United States for measurement, and the obtained test data were processed using the Barrett–Joyner–Halenda model.

4. Results

4.1. Identification and Distribution of Shales

Based on logging response patterns, the shale present in the P3w shows increased sensitivity, including to gamma ray (GR), acoustic (AC), density (DEN), compensated dual-spacing neutron log (CNL), and thorium (TH). Consequently, this study utilizes GR–DEN, GR–TH, and DEN–AC crossover diagrams as templates for deciphering lithology logging interpretations, thereby establishing logging lithology benchmarks. Within the CNL–DEN crossover diagram, shale DEN values consistently fall below 2.75 g/cm3, with CNL values clustering between 10% and 20% (Figure 2a). According to the CNL–GR crossover diagram, shale GR values typically exceed 65 API (Figure 2b). Moreover, in the AC–GR crossover diagram, shale AC values are above 65 µs/ft (Figure 2c). Analyzing the crossover plot templates reveals the following trends: shale exhibits GR > 65API, DEN < 2.6 g/cm3, and AC > 65 µs/ft; chert has DEN values ranging from 2.6 to 2.75 g/cm3, CNL < 10%, and GR < 65 API; basalt shows DEN > 2.75 g/cm3, GR < 65 API, and CNL > 10%; and fine sandstone DEN values are between 2.6 and 2.75 g/cm3, with GR values spanning from 65 to 110 API.
The marine shale of the P3w is predominantly found in the eastern and northern regions of Sichuan. This shale formation has developed along the Kaijiang–Liangping Trough and boasts an average shale thickness of 30 m. Notably, the sedimentary thickness progressively increases as it moves from the trough’s periphery towards its interior. In terms of hydrocarbon source rocks, the P3w1 extends northwards along the Dazhou–Bazhong Belt in Sichuan (Figure 3a). In this period, volcanic intrusion caused the thickness of strata to increase in some areas. The second member of the P3w (P3w2) exhibits a broader distribution of hydrocarbon source rocks, averaging a shale thickness of 12.19 m (Figure 3b). As for P3w3, its distribution continues to expand, averaging 15.38 m in thickness (Figure 3c). Evidently, the shale is thicker in the deep-water phase and thinner in the transitional phase. Among these sections, the P3w3 stands out with the thickest shale and the widest distribution range.

4.2. Geochemical Characteristics

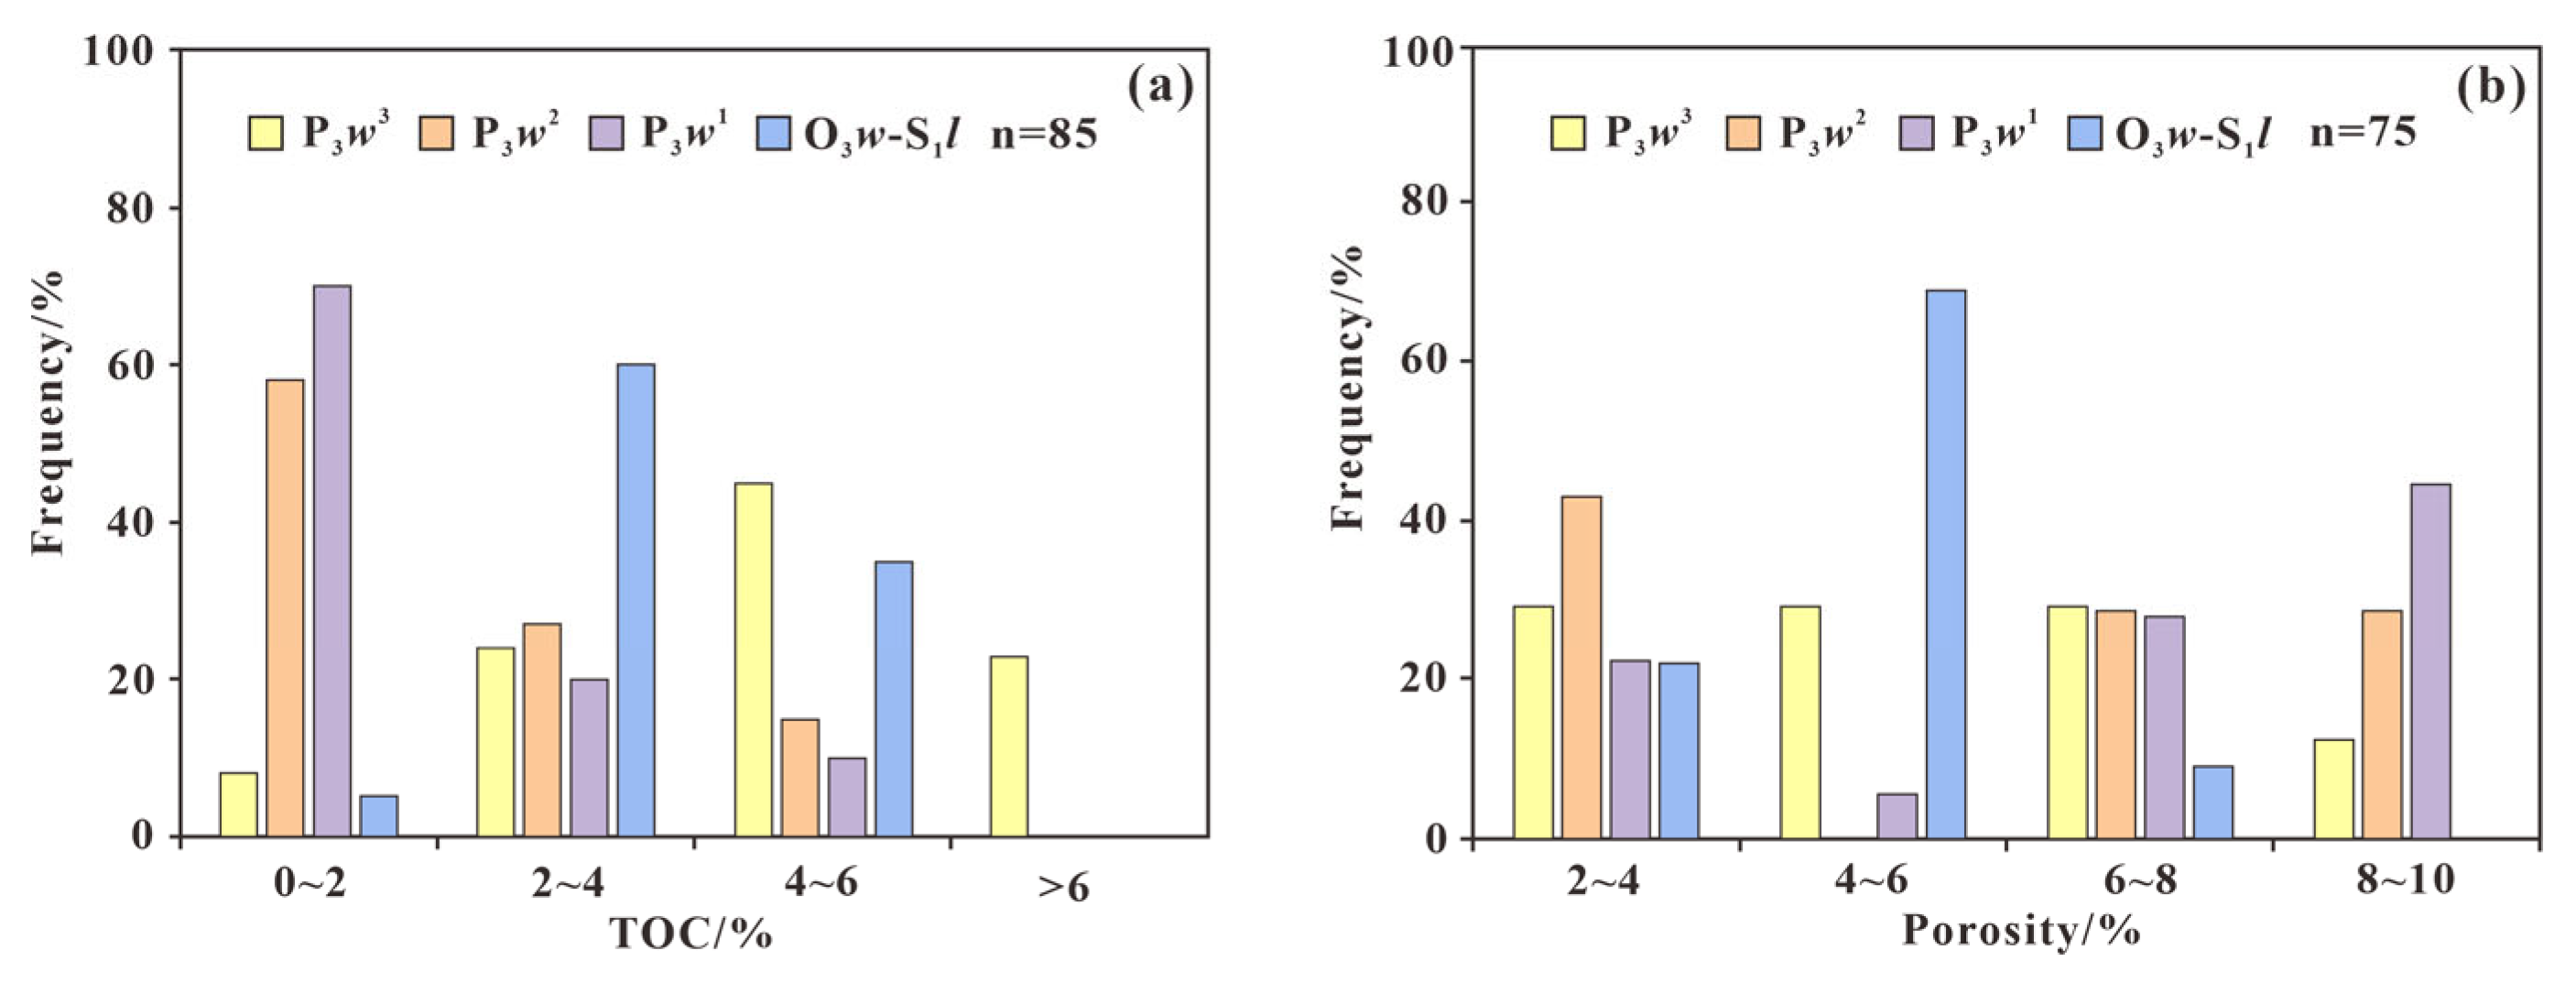
The shale of the P3w boasts high organic matter abundance, exhibiting a broad distribution range of TOC (Figure 4a). After measuring 67 samples, it was observed that the TOC ranged from 0.03% to 15.8%, averaging at 3.26%. TOC content varies with the sedimentary environment and is usually affected by sediment deposition, decomposition, and paleoclimate conditions [24]. The large distribution range of TOC content in P3w shale may be due to the frequent fluctuation of sea level in the study area. This leads to the complex change in sedimentary environment and thus affects the enrichment of organic matter. Notably, 60% of the samples qualified as effective hydrocarbon source rocks (with a TOC exceeding 1.0%). Furthermore, 55.8% of the samples proved to be high-quality hydrocarbon source rocks (TOC > 2.0%). Among the sections, the P3w3 showcased the highest TOC content, averaging at 6.04% and spanning from 0.03% to 15.8%. The P3w2 section followed, with an average TOC of 1.92%.
The maceral and carbon isotope of kerogen of the P3w primarily consist of filaments, humic amorphous bodies, vitrinite, and speckled plasma. Among these, humic amorphous bodies and filaments are prevalent, with filaments averaging at 35.25%. These filaments are formed by the carbonization of lignin from higher plants [25]. The highest content is found in humic amorphous bodies, averaging 34%, which originate from the degradation of lower aquatic zooplankton. Vitrinite, resulting from the gelatinization of lignin in higher plants, has an average content of 25.25% [26]. The kerogen-type index values, calculated based on the percentage of these macerals, mainly range from −40.25 to 20. Additionally, kerogen carbon isotopes, which are resistant to fractionation during thermal evolution, serve as a crucial basis for classifying organic matter types [27,28]. The kerogen carbon isotope values (δ13C) of the P3w range from −26.45‰ to −22.49‰, among which the value of P3w3 is from −27.26‰ to −25.80‰. In summary, the organic matter type of the P3w is predominantly type II1–III, of which the organic matter type of the shale in the P3w3 is II1~II2.
The shale of the P3w has progressed to the stage of over-matured dry gas production. Specifically, the vitrinite reflectance (Ro) for the P3w3 ranges from 2.57% to 3.0%, averaging at 2.71%. For the P3w2, Ro values span from 2.7% to 2.8%, with an average of 2.74%. Lastly, the P3w1 exhibits Ro values between 2.35% and 3.30%, averaging at 2.8%.

5. Discussion

5.1. Controlling Factors for Shale Gas Enrichment

5.1.1. Organic-Rich Shale Provides Sufficient Gas Source

High organic matter abundance in hydrocarbon source rocks is known to be an important prerequisite for natural gas production [29]. Enrichment of shale gas relies on organic-rich shale as its material foundation. In order to analyze the disparities between two distinct hydrocarbon source rocks, we compared the well-established and productive O3w-S1l. Our study reveals that the average TOC value of the O3w-S1l stands at 2.26% [30]. Notably, the TOC in the P3w3 surpasses that of the O3w-S1l (Figure 4a). The high TOC of the P3w shale might be due to the repeated enrichment of organic matter. During the sedimentary period of this layer, the sea level of the Kaijiang–Liangping Trough fluctuated frequently. The repeated rise and fall of sea levels provide sufficient nutrients and enrichment space for organic matter.
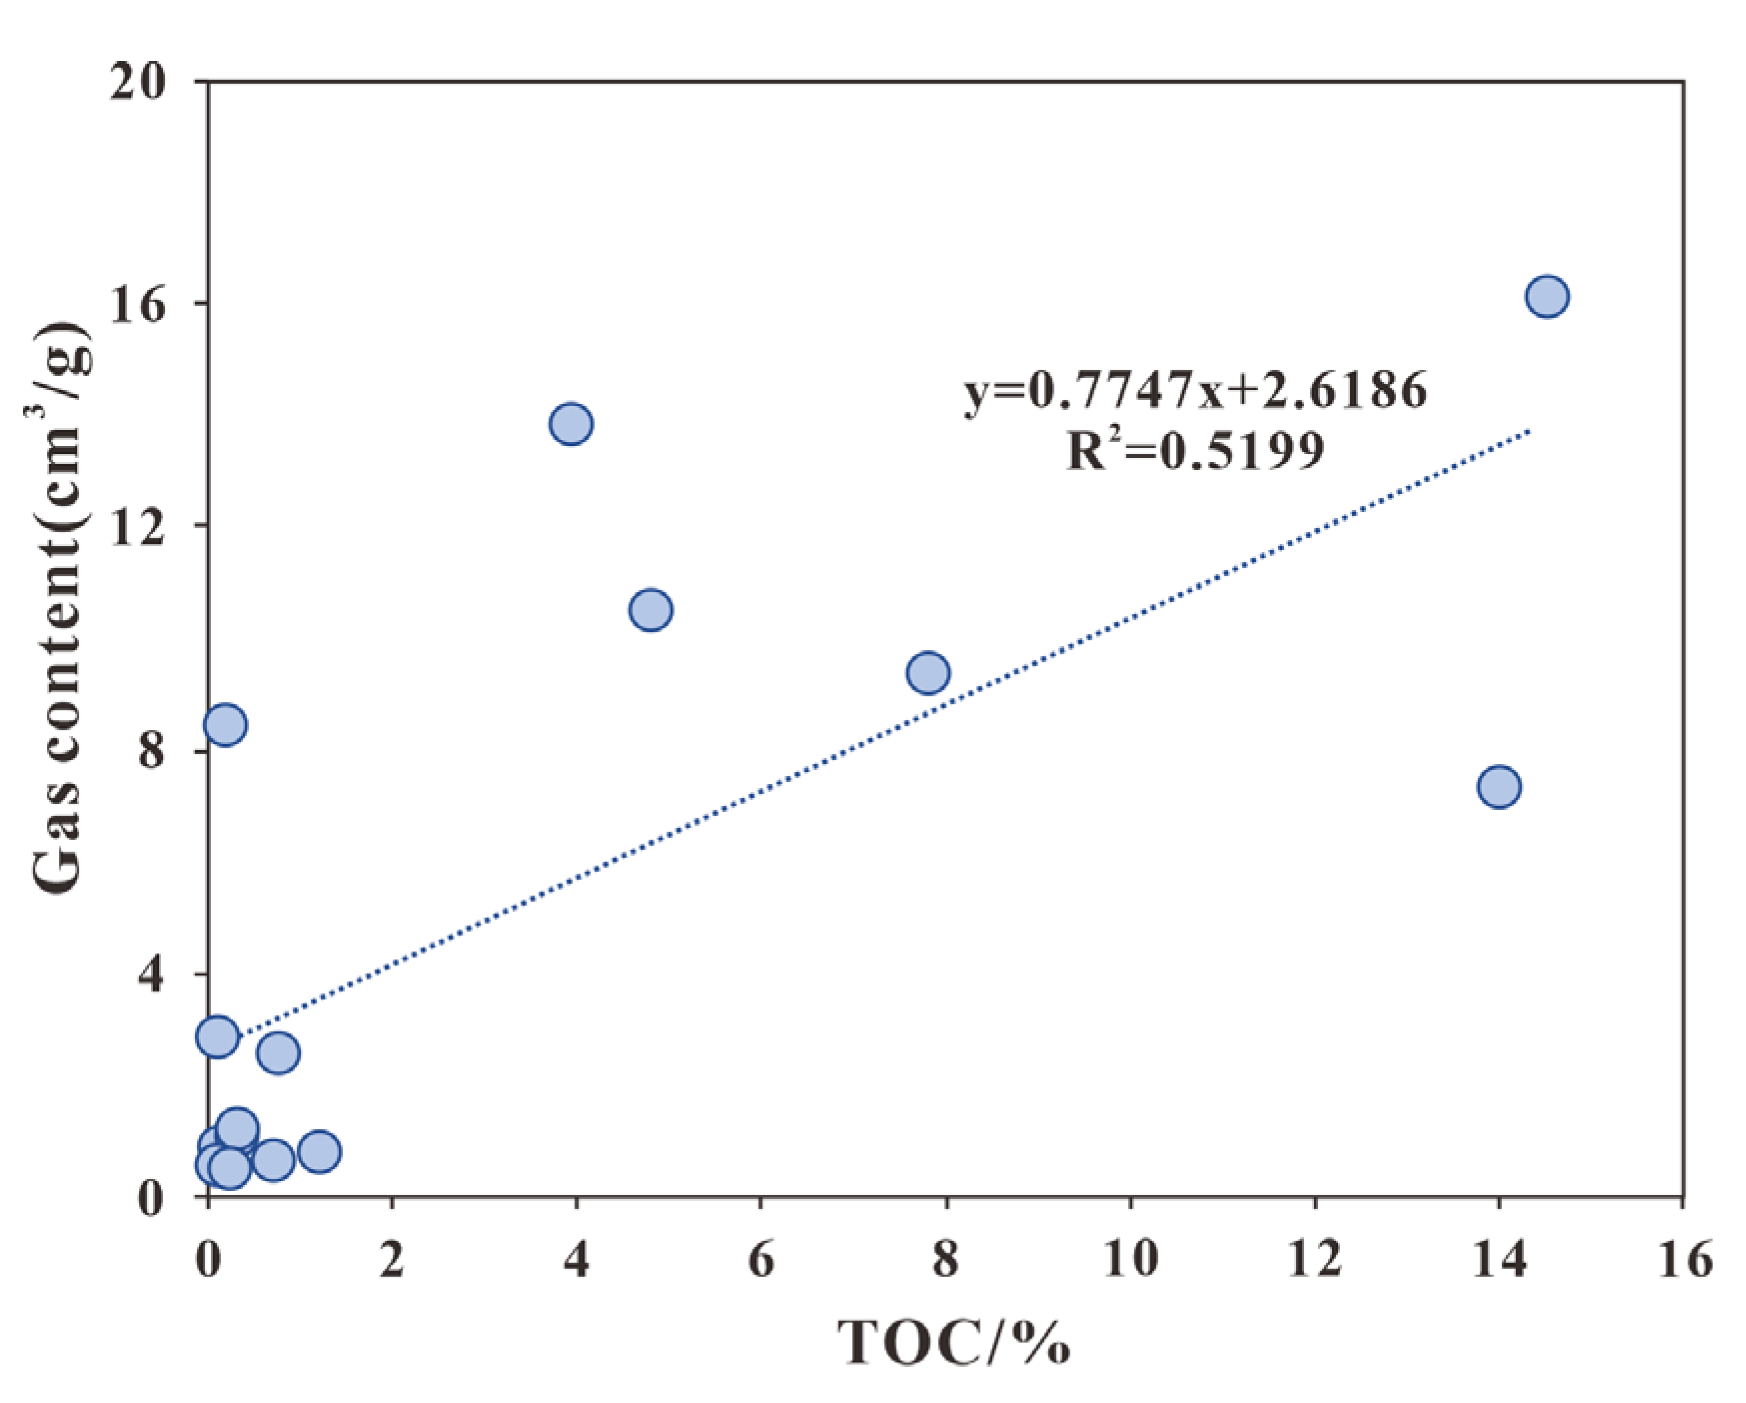
Furthermore, the TOC not only influences the shale’s hydrocarbon generation potential but also governs its gas content (Figure 5). Consequently, the P3w, boasting a higher TOC content, possesses a greater gas content as well. This formation exhibits vigorous oil and gas activity, with an average gas content of 10.39 cm3/g in the field-analyzed shale, exceeding the 5.34 cm3/g observed in the O3w-S1l.
Sea-level fluctuations control the development of Type II1~III organic matter in P3w shales. The optimal deep-water unit, the P3w3 shale, primarily contains Type II1~II2 organic matter. Unlike the Type I-dominated organic matter in O3w-S1l shales, this section exhibits distinct compositional characteristics [29]. Numerous studies indicate that once organic matter reaches a certain maturity level, its hydrocarbon generation capacity and storage space exist in a reciprocal relationship [29,30,31]. The optimal window for shale gas generation and storage corresponds to the high-maturity to over-maturity stage, where the Ro value ranges from 1.35% to 3.5% [28]. Both the P3w and the O3w-S1l shales are in the over-maturity phase [32,33], aligning with the optimal exploration period. In summary, when compared to the O3w-S1l, the P3w offers a higher TOC, superior gas content, a slightly inferior organic matter type, and resides within the same optimal organic matter maturity stage.
The thickness of hydrocarbon source rocks in the P3w peaks near the center of the Kaijiang–Liangping Trough (Figure 6) and the shale thickness are controlled by the trough boundary. This thickness remains consistent from north to south, reaching a maximum of 70 m. In terms of cumulative thickness, the P3w3 leads in the trough direction, closely followed by the P3w2. The P3w boasts a substantial thickness of hydrocarbon source rock deposition coupled with high organic matter abundance, indicating significant exploration potential. When compared to the O3w-S1l, the P3w may not have a substantial thickness of gas-bearing shale. However, most of its gas-bearing shale qualifies as high quality, with a TOC content exceeding 2%. Moreover, the distribution of organic-rich shale within the trough remains stable.
Both favorable sedimentary facies and frequent changes in sedimentary facies zones provide a good sedimentary environment for the development of shale with high organic matter abundance [34,35]. The frequent fluctuation of sea level results in frequent changes in shale lithofacies in the study area. The P3w located in eastern and northern Sichuan and existing within a deep-water setting is characterized by frequent shifts in sedimentary phase zones. Shale features are affected by the frequent shifts. Among them, P3w3 is dominated by siliceous shale, thick, clayey shale interspersed with thin siliceous shale in P3w2, with clayey shale being the primary component of P3w1. With vertical descent, the proportion of siliceous shale diminishes, while the clay shale content escalates.

5.1.2. Mineral Composition Control Reservoir Development

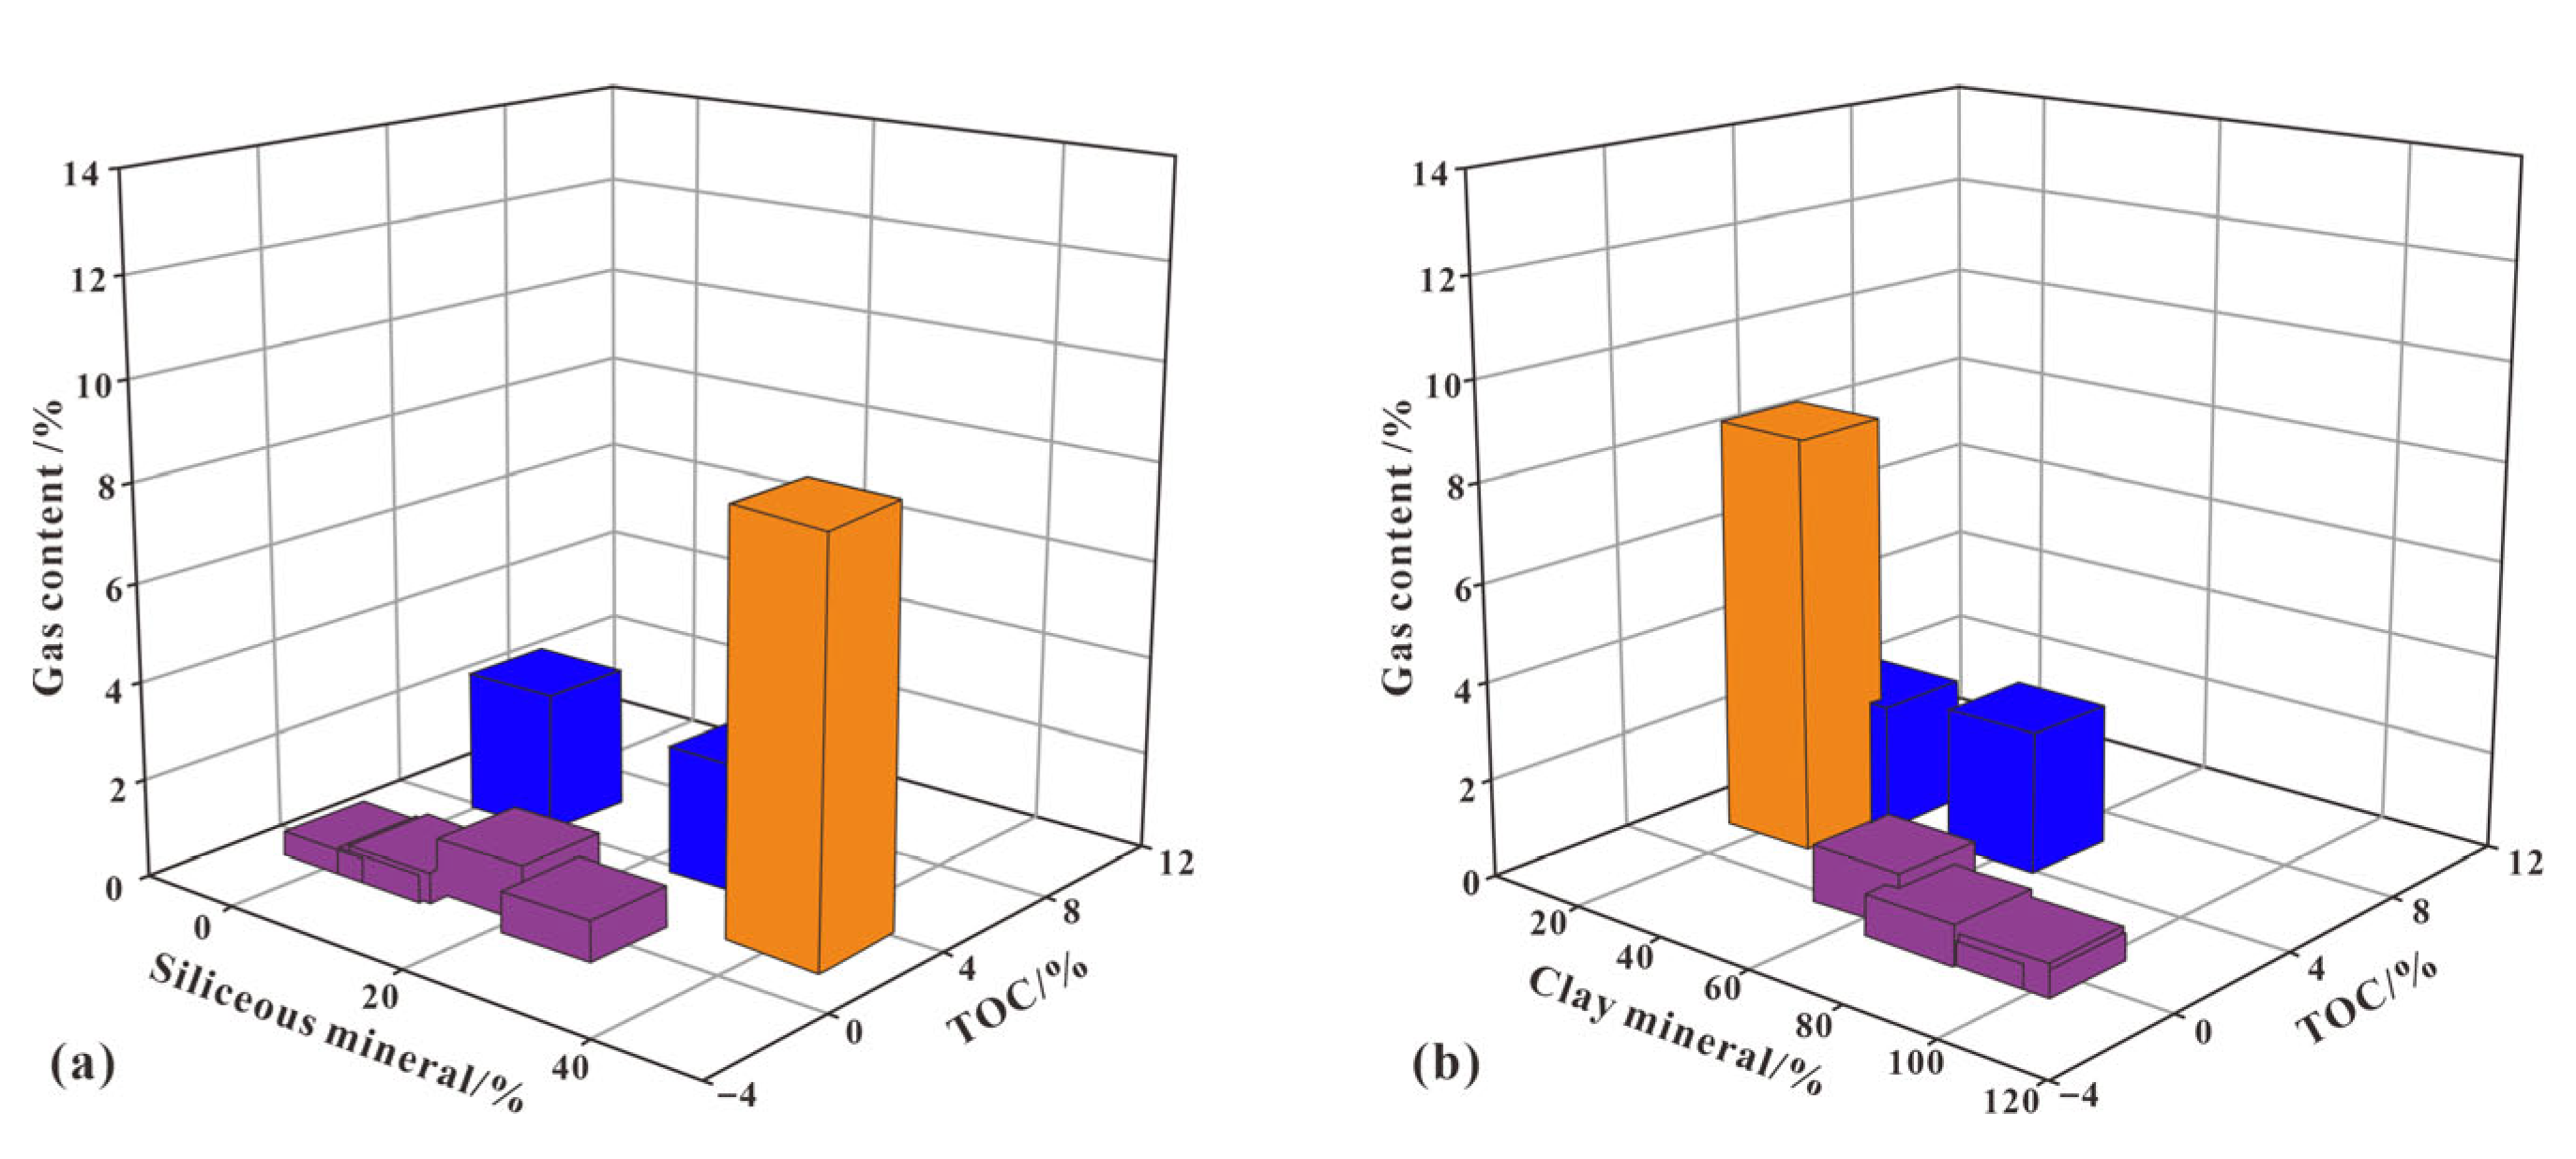
The clay mineral content in the P3w shale stands as the highest, varying between 13.3% and 95.8%, with a mean of 59.4%. The brittle mineral content ranks second, ranging from 4.2% to 97.5%, averaging at 39.6%. Carbonate minerals, particularly calcite and dolomite, are the least prevalent, averaging at 18.6%. In contrast, the O3w-S1l formation shows average contents of 48.1%, 7.6%, and 40.7% for brittle minerals, carbonate minerals, and clay minerals, respectively [36,37]. The mineral composition of the P3w is heterogeneous, with a higher clay mineral content compared to the O3w-S1l. This difference is primarily reflected in the proportions of brittle and clay minerals. To illustrate this, a statistical diagram correlating mineral fractions, TOC, and gas content was created using data from the D1 well (Figure 7). This diagram demonstrates that the P3w shale has a higher clay mineral fraction and TOC value.
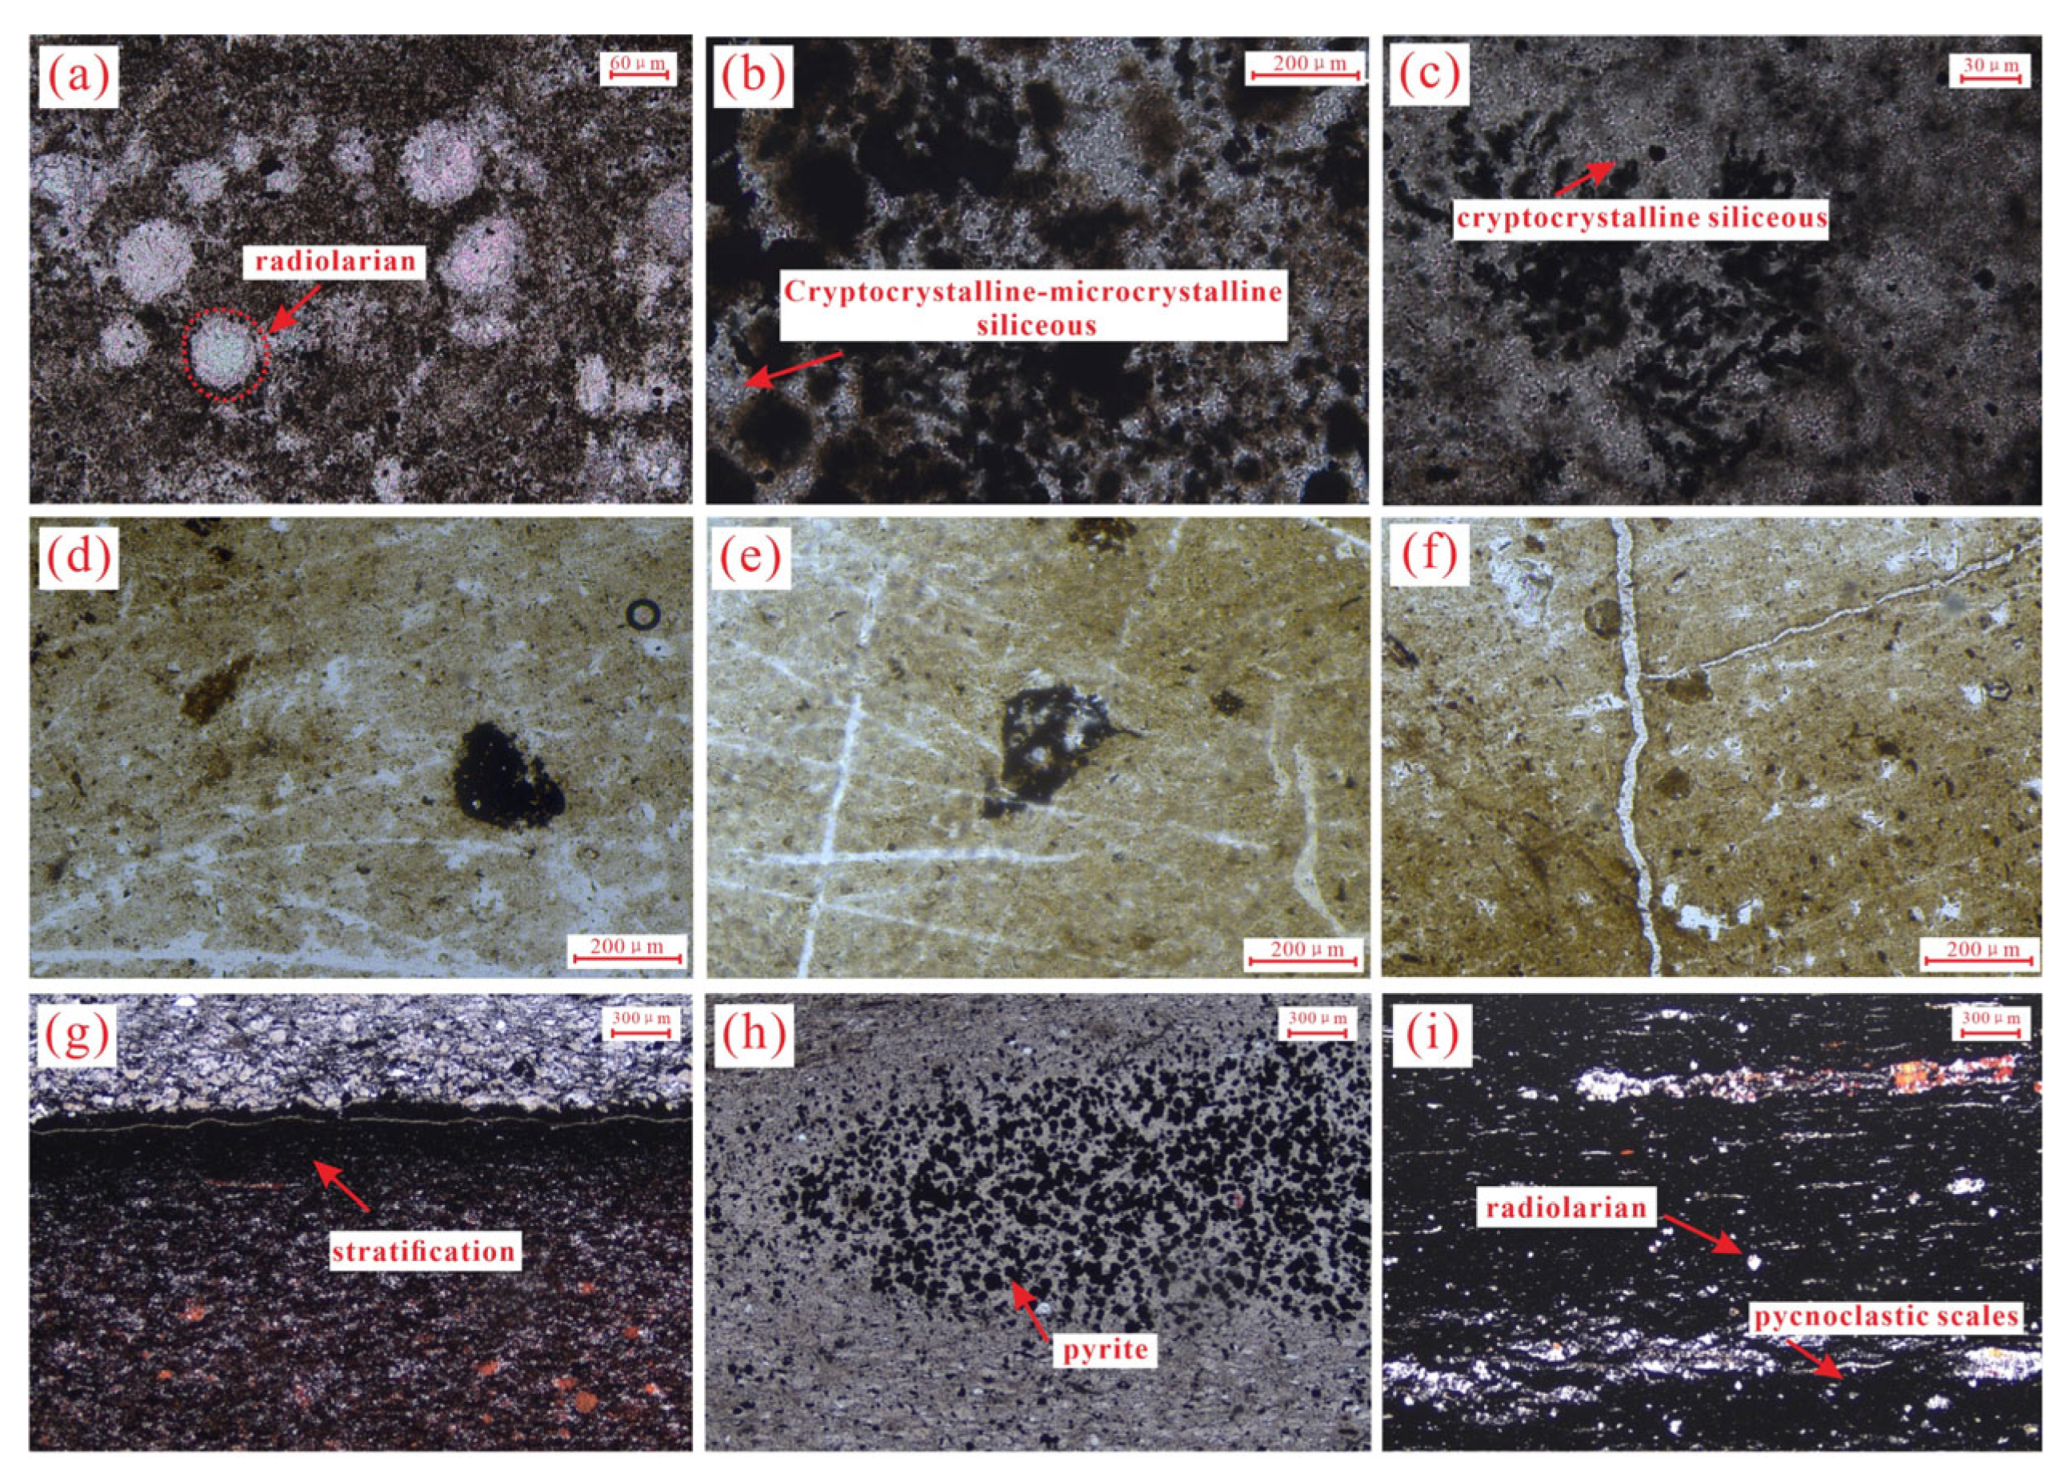
Under microscopic examination, calcareous shale is primarily composed of calcite and dolomite. Siliceous shale, on the other hand, is discernible through an abundance of brightly colored fine granules exhibiting an irregular rounded morphology. These granules consist predominantly of quartz, feldspar, and other minerals, with siliceous mineral content exceeding 50% (Figure 8a–c). Clay shale contains between 50% to 75% clay, and its microscopic granular material primarily manifests as flocculated grains, accompanied by calcite-filled or partially filled cracks (Figure 8d–f). In mixed-texture shale, the contents of siliceous minerals, carbonate minerals, and clay minerals are relatively balanced, lacking a discernible microscopic particle pattern (Figure 8g–i).
The P3w3 consists primarily of hard siliceous minerals and carbonates, with quartz exhibiting notable brittleness and high compressive strength. This rigid mineral framework preserves primary pore structures while providing mechanical support for organic pores generated during subsequent hydrocarbon cracking. Furthermore, the inherent brittleness facilitates natural fracture development and enhances susceptibility to induced fracturing. As we move to the P3w2 and P3w1, the clay mineral volume fraction increases. During diagenesis, dehydration and contraction of clay minerals cause sediment volume reduction, leading to dehydration cracks. Clay mineral transformations can also induce local fluid pressure anomalies, resulting in laminar cracks in well-developed shale textures. These cracks provide space for shale gas enrichment [38]. Additionally, frequent phase transformations in the P3w shale leads to mineral phase transformation cracks due to clay mineral phase changes [38]. The strong adsorption force of clay minerals offers additional storage space for shale gas, favoring its enrichment and increasing shale gas content [39]. Clay minerals’ adsorption can bind some organic matter to form “clay organic matter aggregates” around pyrite, creating pore spaces [40,41].
The P3w has a higher pyrite content than the O3w-S1l, indicating a more stable and reduced marine depositional environment favorable for organic matter preservation [12]. Although the O3w-S1l has a higher siliceous mineral content, the P3w’s fracability is relatively poorer compared to the O3w-S1l. However, in thin layers of brittle or calcareous minerals adjacent to clay minerals, the P3w’s organic carbon content is lower, while quartz and carbonate contents are higher, favoring fracturing.

5.1.3. Pore Fracture Development Is the Key to Shale Gas Enrichment

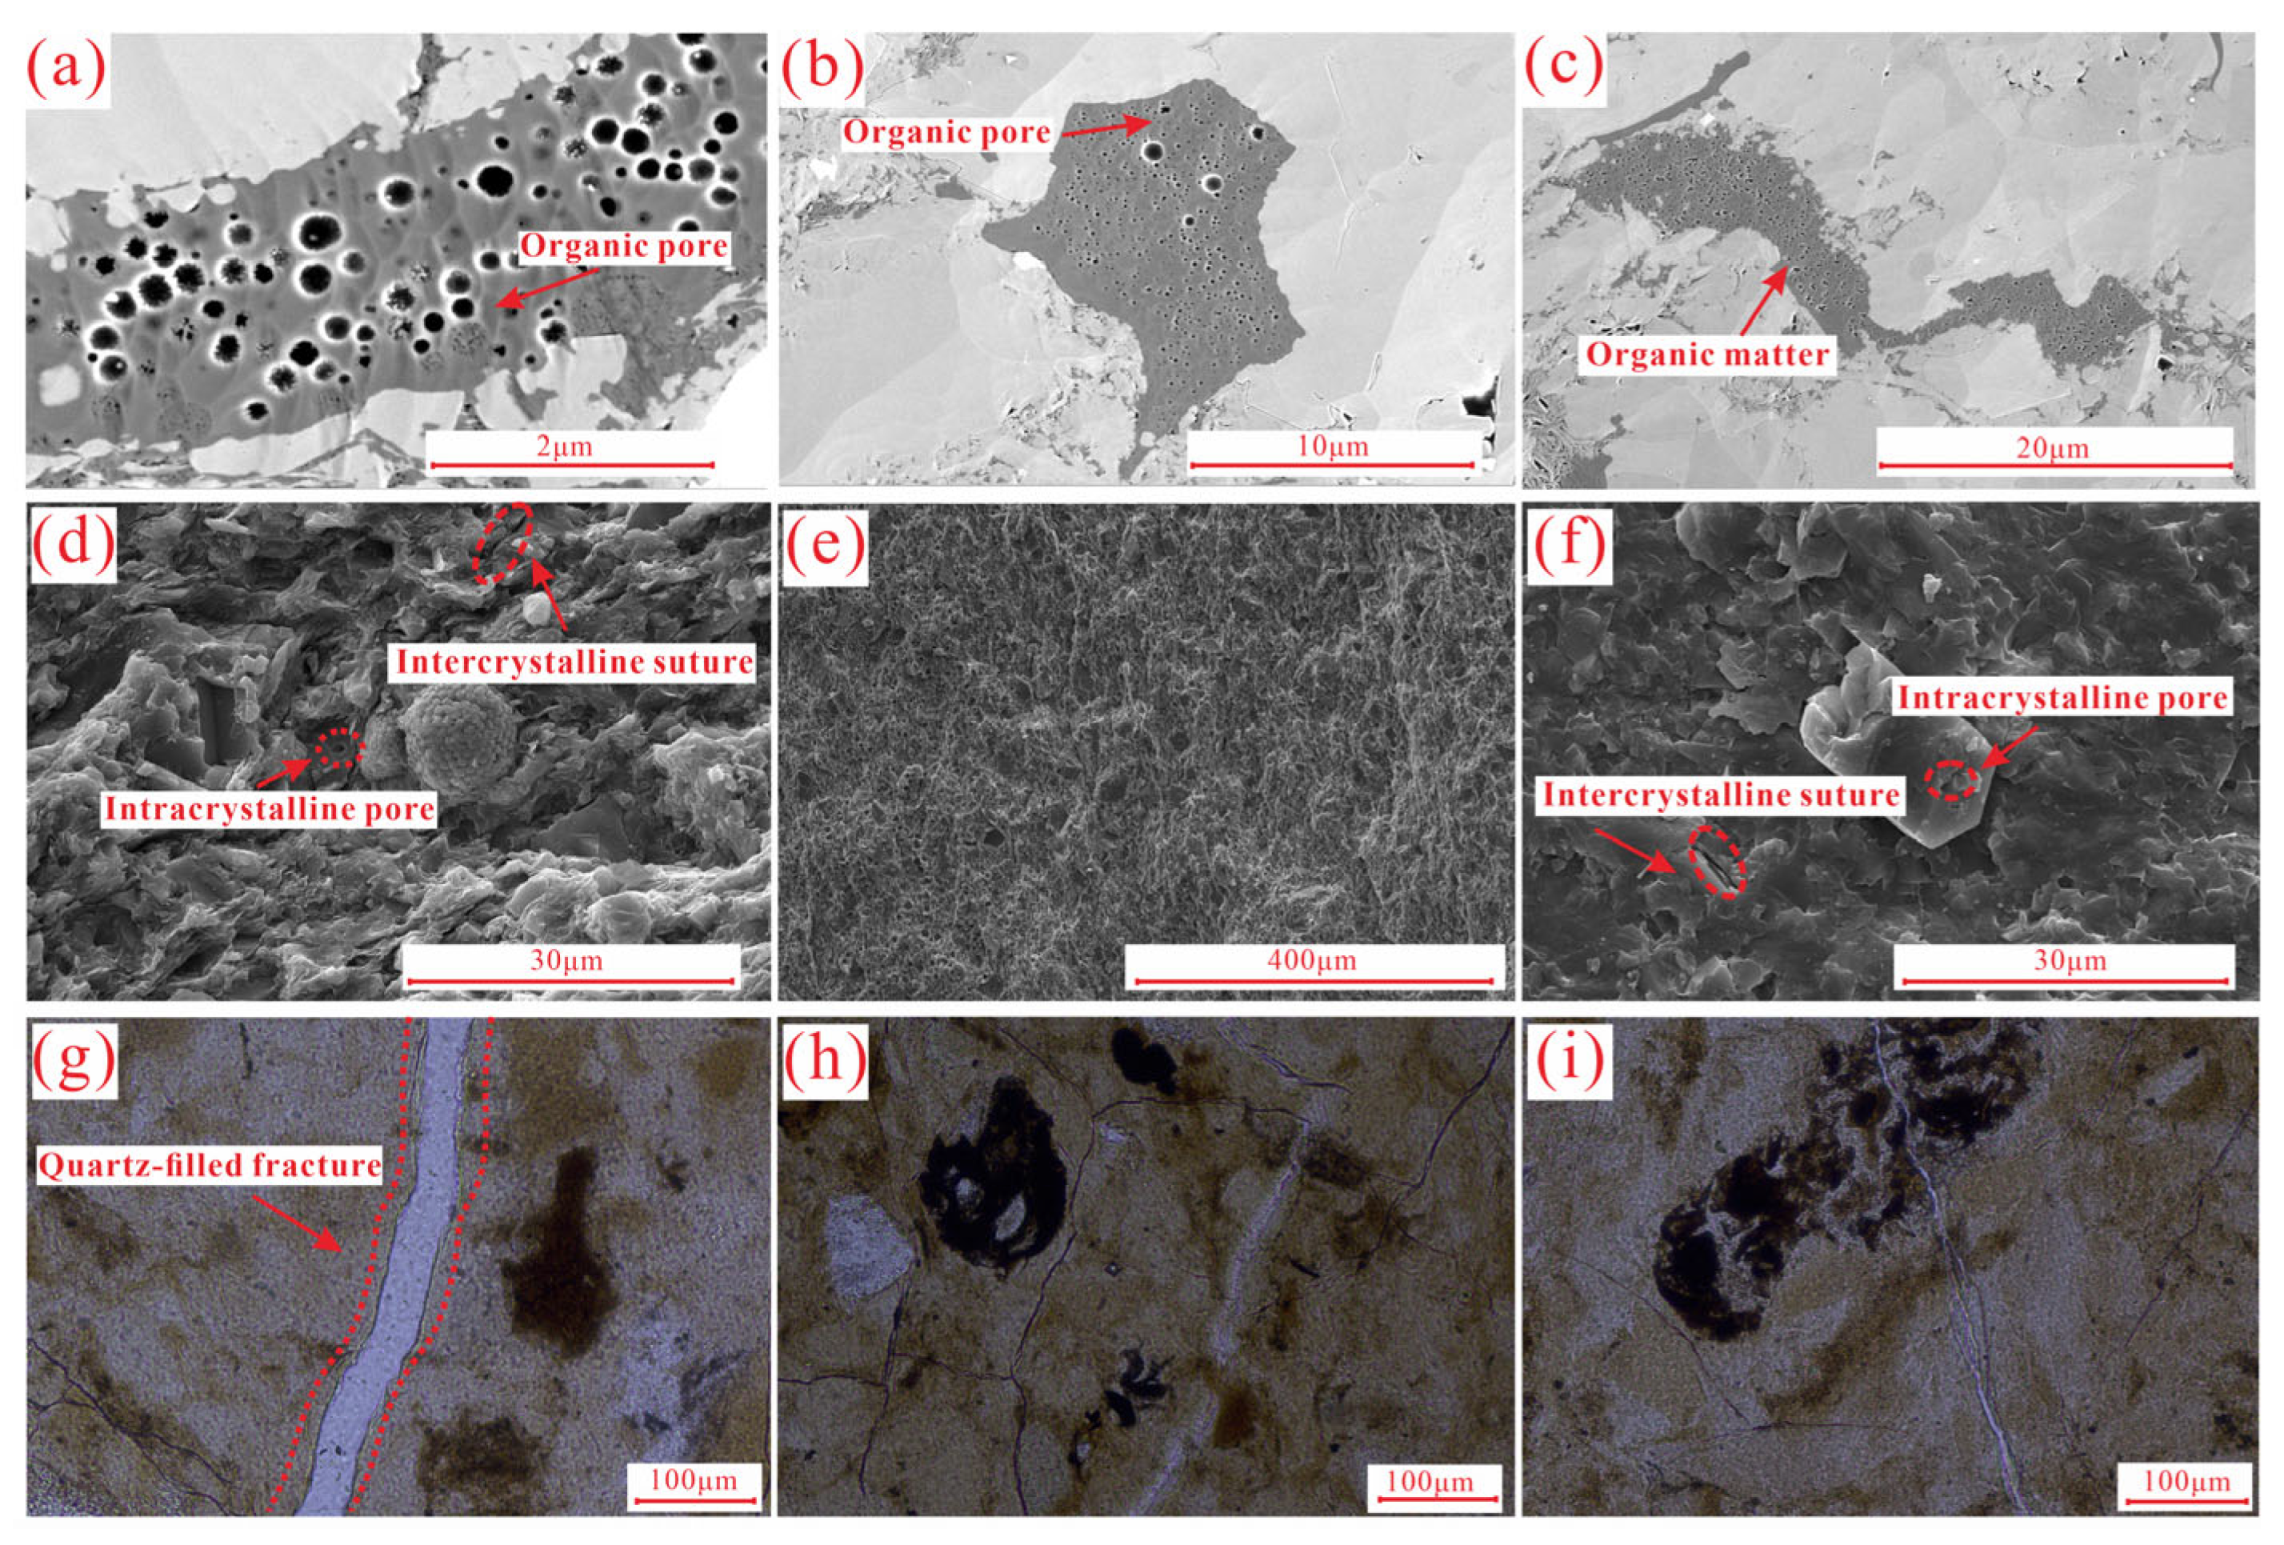
The shale reservoir properties are directly affected by the degree of pore-seam development [42,43]. SEM shows that the organic matter pores in the shale reservoirs of the P3w are developed with a honeycomb distribution, dominated by round and oval shapes. The maximum pore diameter can reach about 500 nm, which is mainly formed in the process of organic matter hydrocarbon generation (Figure 9a,b). The organic matter is dispersed among the inorganic minerals in an independent manner and is basically not connected with each other (Figure 9c). In addition, the intense tectonic activity during the Permian period in the eastern and northern Sichuan regions contributed to the pronounced cracking of the shale in the P3w. Through observation and counting, it was discovered that tectonic cracks are particularly well-developed in the organic shale that formed in a deep-water depositional environment [44,45,46]. The longitudinal lithology of the P3w is intricate, with layer segments prone to cracking due to lithological variations. These shale laminar joints are predominantly filled with minerals like calcite and quartz (Figure 9g–i), and these small-scale cracks can play a role in improving the shale reservoir space (Figure 9d–f) so that the different gas-bearing layer segments are communicated and connected. Notably, these cracks are predominantly found at the base of the P3w2. Furthermore, the presence of soil-yellow stains on the shale surface often indicates traces of liquid hydrocarbons (Figure 9g–i). This suggests that the liquid hydrocarbons initially generated in the shale of the P3w underwent thermal cracking, releasing gases. During the liquid-to-gas conversion process, organic acids were produced, which dissolved the feldspars, ultimately forming dissolution pores. These pores are predominantly located at the base of the P3w1. In summary, the shale reservoir space of the P3w primarily consists of cracks, dissolution pores, and organic matter pores.
The vast majority of shale pores in the P3w have a porosity greater than 4%, with an average porosity of 7.15%. Compared with the O3w-S1l [28] (with an average porosity of 4.90%), it has higher porosity and better reservoir physical properties (Figure 4b). Among them, the P3w2 has the highest porosity and is dominated by clay minerals, followed by siliceous minerals with a small amount of carbonate minerals and pyrite. In addition, the shale reservoir is dominated by the development of micropores and mesopores, and some macropores are transformed into mesopores or micropores by compaction.
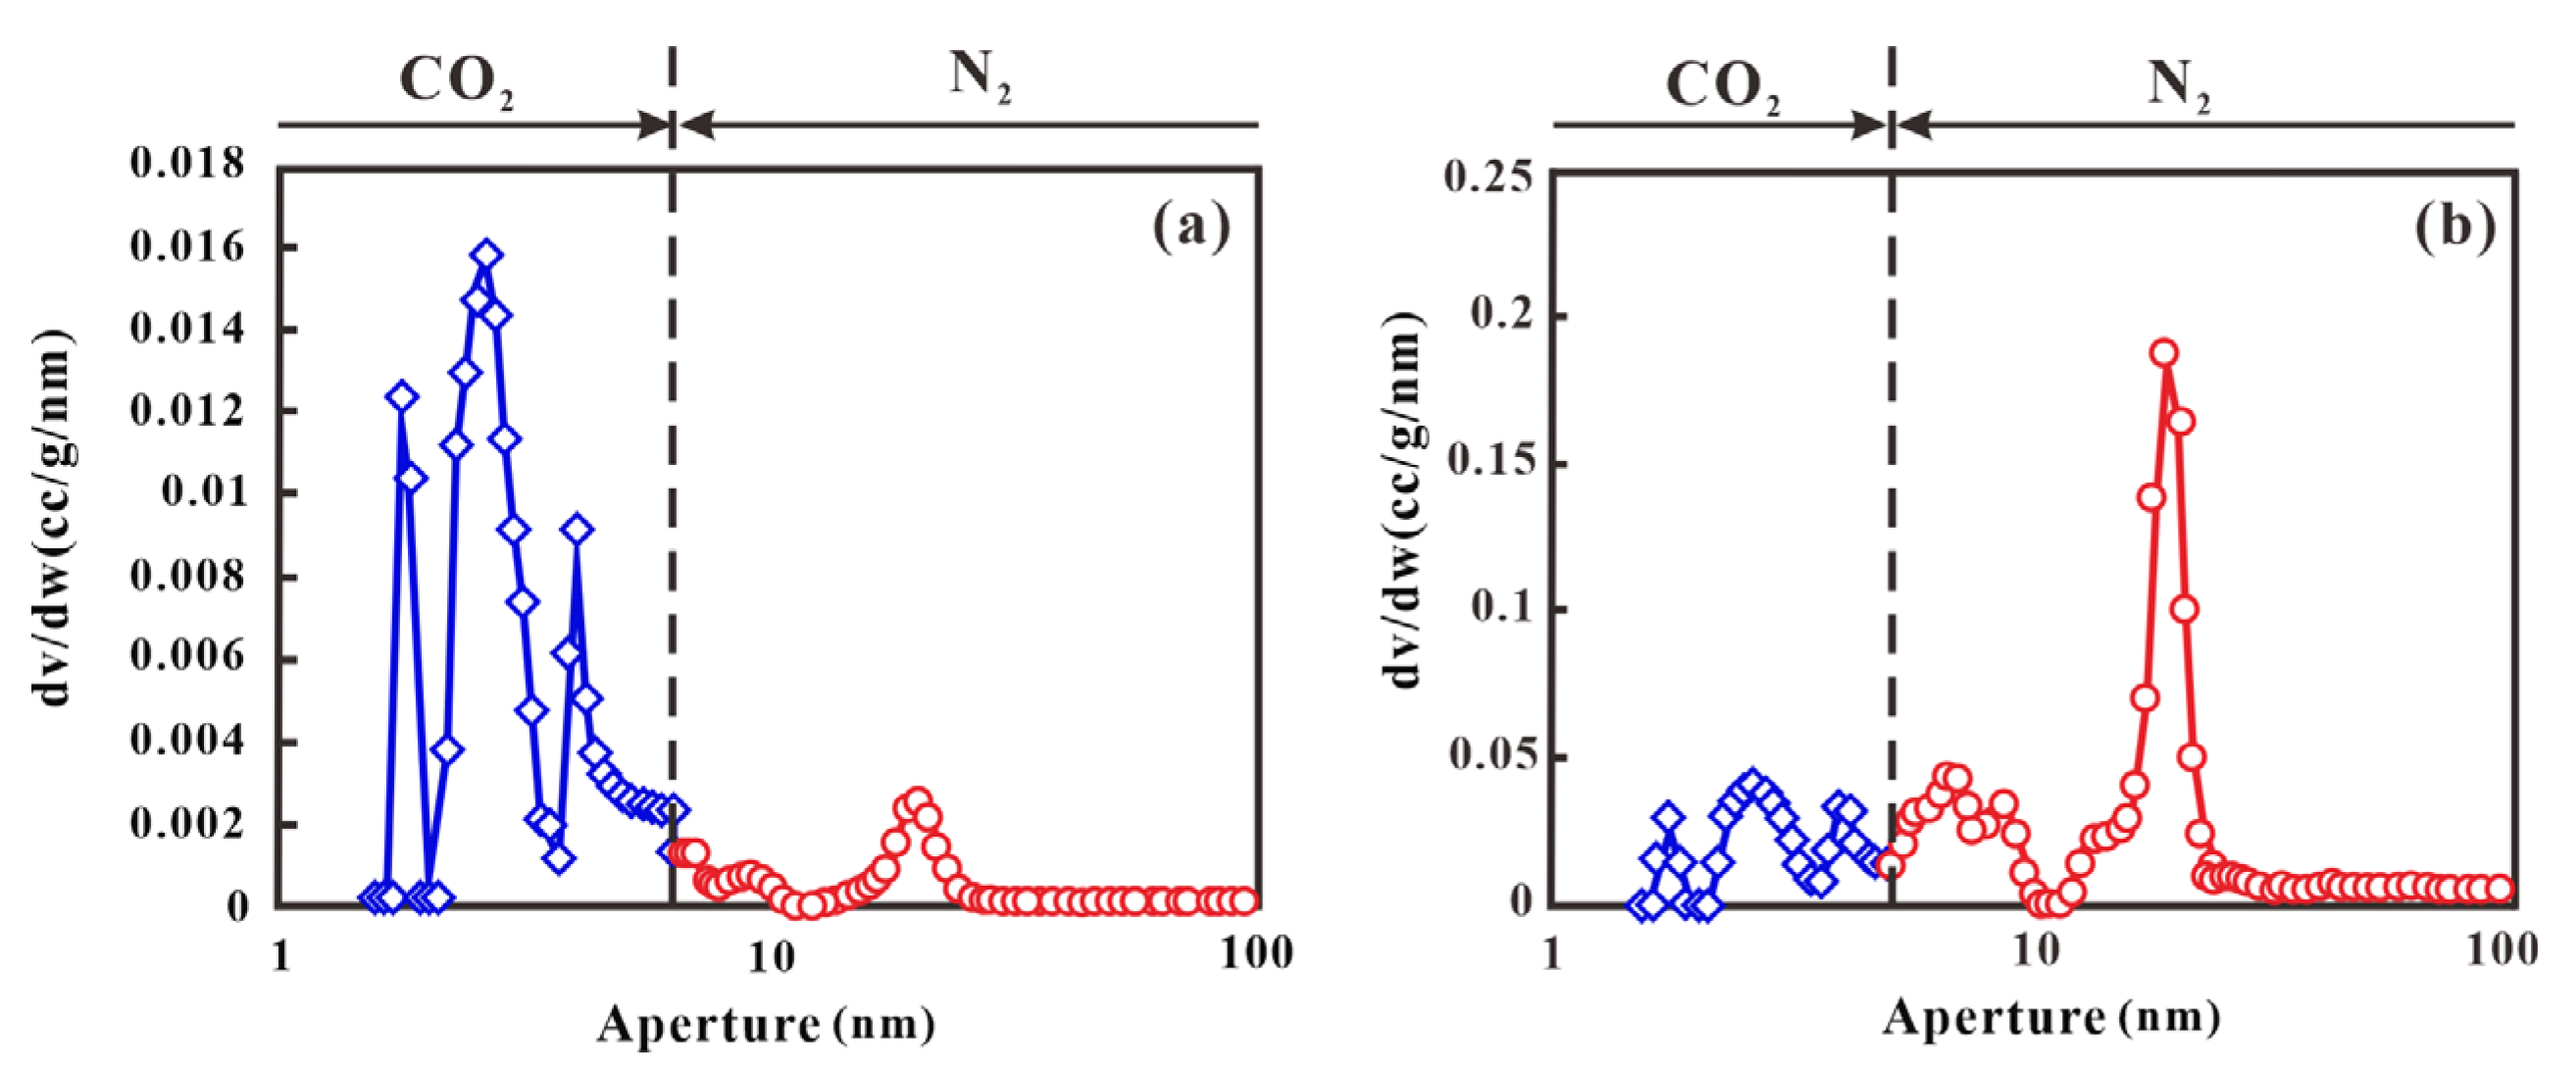
Comprehensive nitrogen adsorption and carbon dioxide adsorption experiments provided a rough characterization of the shale pore range (Figure 10). The shale samples from the P3w exhibited a distinct pore size distribution, peaking at 6 nm. The prevalent pore size in clay shale was approximately between 2 to 3.5 nm, whereas in siliceous shale, it ranged from 15.14 to 16 nm. This suggests that siliceous shale pore spaces offer ample room for shale gas storage. Despite the high clay mineral content in the P3w, its primary storage compartments are cracks and dissolution pores resulting from the dehydration and contraction of clay minerals. This unique combination serves as a rich reservoir for the shale of the P3w. Conversely, due to variations in mineral composition, the primary high-quality storage spaces in the O3w-S1l shale are organic pores, closely followed by inorganic mineral pores [21,46].

5.2. Exploration Prospect of the P3w Shales

The P3w in the eastern and northern parts of the Sichuan Province is distributed in the area of Guangyuan–Bazhong–Liangping. It has deep-water deposits and black shale development, showing the characteristics of thin monolayer thickness and strong hydrocarbon generation capacity. Compared with the shale samples of the O3w-S1l formation that have been developed on a large scale (Table 1), the P3w shales reveal superior geochemical parameters, despite their reduced thickness. These characteristics include enhanced TOC, moderate thermal maturity, and favorable porosity, demonstrating excellent potential for shale gas exploration.
Among P3w shale, the longitudinal P3w3 of shale has the best quality, which provides a good material basis for the enrichment of shale gas, and the rise in sea level provides a good anoxic environment and sufficient enrichment space for organic matter. Its average TOC is as high as 6.04%, which is 2.7 times that of the O3w-S1l shale (2.26%), and the gas content of P3w3 (10.39 cm3/g) is almost 4 times higher than O3w-S1l (2.46 cm3/g). Meanwhile, the extensive development of organic pores and the high content of siliceous minerals in the P3w3 provide abundant space for the occurrence of shale gas. In conclusion, the P3w3 is the main exploration target layer section of the P3w.

6. Conclusions

The P3w shale in eastern Sichuan demonstrates pronounced heterogeneity, with shale gas accumulation governed by three interdependent elements: high-quality source rocks with high TOC ensure continuous hydrocarbon generation, complex sedimentary dynamics induce vertical variability in organic enrichment, and over-maturation processes drive transitional hydrocarbon phases characterized by gas-dominant expulsion patterns.
The P3w formation exhibits stratigraphic heterogeneity, with clay-dominated P3w1–P3w2 contrasting quartz-enriched P3w3. Elevated clay content facilitates hydration-induced fractures and enhances gas adsorption capacity, whereas brittle minerals preserve primary pores through rigid frameworks while supporting secondary porosity development. Organic pore networks further optimize the system’s storage efficiency through three-dimensional spatial connectivity.
Compared with the O3w-S1l, which has better economic benefits, the organic matter abundance, porosity, and gas content of the shale in the P3w are 2.6% higher, 2.25% higher, and 0.84% higher. On the whole, the marine shale of the P3w is of high quality and has great exploration potential. As a favorable area for shale gas exploration, the P3w3 is taken as the optimal section for shale gas exploration in the study area.

Author Contributions

Conceptualization, L.W.; writing—original draft preparation, L.W. and L.D.; writing—review and editing, L.W., J.X., B.Z., J.L., C.X., L.X. and L.Y.; project administration, B.Z.; funding acquisition, J.L.; validation, Y.M., X.C. and C.X.; investigation, H.M., L.X. and L.Y.; resources, J.X.; data curation, H.S. and Y.M.; supervision, J.X.; formal analysis, H.S., Y.M., H.M. and X.C.; visualization, H.S., H.M. and X.C. All authors have read and agreed to the published version of the manuscript.

Funding

This research was funded by the National Natural Science Foundation of China, grant number 42072185.

Data Availability Statement

The original contributions presented in this study are included in the article. Further inquiries can be directed to the corresponding author.

Conflicts of Interest

Author Long Wen, Lurui Dang, Jirong Xie and Hualing Ma were employed by the company PetroChina Southwest Oil & Gasfield. Author Benjian Zhang, Haofei Sun, Ying Ming, Xiao Chen and Chang Xu were employed by the company Exploration and Development Research Institute, PetroChina Southwest Oil & Gasfield. Author Liang Xu was employed by the company Shale Gas Research Institute, PetroChina Southwest Oil & Gasfield. The remaining authors declare that the research was conducted in the absence of any commercial or financial relationships that could be construed as a potential conflict of interest.

Abbreviations

The following abbreviations are used in this manuscript:
P3wThe Upper Permian Wujiaping
P3w3The third member of the P3w
P3w2The second member of the P3w
P3w1The first member of the P3w
O3w-S1lThe Wufeng and Longmaxi shales
TOCTotal organic carbon content
FE-SEMField emission scanning electron microscope

References

  1. Wang, Q.Y.; Yang, W.; Li, Y.H.; Jiang, Z.X.; Wen, M.; Zuo, R.S.; Wang, X.; Xue, Z.X.; Wang, Y. In-situ Fluid Phase Variation along the Thermal Maturation Gradient in Shale Petroleum Systems and Its Impact on Well Production Performance. J. Earth Sci. 2023, 34, 985–1001. [Google Scholar] [CrossRef]
  2. Gatfaoui, H. On the relationship between U.S. crude oil and natural gas for economic resilience prospects. Ann. Oper. Res. 2024, 1–28. [Google Scholar] [CrossRef]
  3. Adedayo-Ojo, A.A.; Shad, M.K.; Poon, W.C. Circular Economy in the Oil and Gas Industry: A Data-Driven Bibliometric Analysis. Circ. Econ. Sustain. 2025, 1–63. [Google Scholar] [CrossRef]
  4. Talbi, R.; Amri, A.; Hermi, A.; Spiller, R.; Levey, R. Barremian–Albian unconventional shale oil and wet gas resource systems in northeastern Tunisia. Euro-Mediterr. J. Environ. Integr. 2025, 10, 933–947. [Google Scholar] [CrossRef]
  5. Zou, C.N.; Yang, Z.; Zhang, G.S.; Zhu, R.K.; Tao, S.Z.; Yuan, X.J.; Hou, L.H.; Dong, D.Z.; Guo, Q.L.; Song, Y.; et al. Theory, Technology and Practice of Unconventional Petroleum Geology. J. Earth Sci. 2023, 34, 951–965. [Google Scholar] [CrossRef]
  6. Asare, K.; Ejike, C.; Okere, C.J. Numerical Evaluation of Multi-well Cyclic Gas Injection Technique for Enhanced Oil Recovery in Composite Tight Oil Reservoirs. Arab. J. Sci. Eng. 2025, 50, 5037–5054. [Google Scholar] [CrossRef]
  7. Taheri, K.; Ansari, A.H.; Kaveh, F.; Torab, F.M.; Askari, R. The impact of shale beddings on the petrophysical response of the Kangan and Dalan formations in the gas field. J. Sediment. Environ. 2025, 1–17. [Google Scholar] [CrossRef]
  8. Khan, N.; Littke, R.; Weltje, G.J.; Swennen, R. Black shale deposition during the Paleocene–Eocene thermal maximum: Shale-gas potential of the Patala Formation, Himalayan fold-and-thrust belt, Pakistan (eastern Tethys). Int. J. Earth Sci. 2024, 113, 2189–2205. [Google Scholar] [CrossRef]
  9. El-Desoky, H.M.; Alsayed, I.M.; El Gawad, E.A.A.; El-Rahman, A.Y.A.; Abdullah, I.S. Mineralogic and geochemical characteristics of Duwi Formation black shale, Safaga District, Central Eastern Desert, Egypt. Carbonates Evaporites 2024, 39, 101. [Google Scholar] [CrossRef]
  10. Wu, W.; Cheng, P.; Liu, S.; Luo, C.; Gai, H.; Gao, H.; Zhou, Q.; Li, T.; Zhong, K.; Tian, H. Gas-in-Place (GIP) Variation and Main Controlling Factors for the Deep Wufeng-Longmaxi Shales in the Luzhou Area of the Southern Sichuan Basin, China. J. Earth Sci. 2023, 34, 1002–1011. [Google Scholar] [CrossRef]
  11. Bao, H.Y.; Zhao, S.; Liang, B.; Zhou, L.; Liu, H.T. Enrichment and high yield of shale gas in the Permian Wujiaping Formation in Hongxing area of eastern Sichuan and its exploration implications. China Pet. Explor. 2023, 28, 71–82. [Google Scholar]
  12. Liu, S.; Jiang, L.; Liu, B.; Zhao, C.; Tang, S.; Tan, F. Investigation of Organic Matter Sources and Depositional Environment Changes for Terrestrial Shale Succession from the Yuka Depression: Implications from Organic Geochemistry and Petrological Analyses. J. Earth Sci. 2023, 34, 1577–1595. [Google Scholar] [CrossRef]
  13. Fang, X.; Zhang, Q.; Wu, L.; Geng, A.; Liu, S.; Wang, P.; Liang, X. Origin and preservation mechanisms of organic matter in carbonate concretions from Lower Cambrian black shales in South China. Org. Geochem. 2024, 197, 104876. [Google Scholar] [CrossRef]
  14. Syczewski, M.D.; Panajew, P.; Marynowski, L.; Waliczek, M.; Borkowski, A.; Rohovec, J.; Matoušková, Š.; Sekudewicz, I.; Liszewska, M.; Jankiewicz, B.; et al. Geochemical implications of uranium-bearing thucholite aggregates in the Upper Permian Kupferschiefer shale, Lubin district, Poland. Miner. Depos. 2024, 59, 1595–1618. [Google Scholar] [CrossRef]
  15. Ming, Y.; Sun, H.F.; Ye, Y.H.; Wang, J.X.; Song, J.M.; Wang, X.F.; Qiu, Y.C.; Chen, W.; Dai, X. Geolocical conditions and exploration potential of shale gas in northeastern Sichuan Basin: A case study of Upper Permian Wujiaping Formation in Well Fengtan 1. Nat. Gas Explor. Dev. 2023, 46, 133–147. [Google Scholar]
  16. Gu, Y.; Wan, Q.; Li, X.; Han, T.; Yang, S.; Hu, Q. Structure and Evolution of Clay-Organic Nanocomposites in Three Leading Shales in China. J. Earth Sci. 2023, 34, 824–837. [Google Scholar] [CrossRef]
  17. Nie, H.; He, Z.; Liu, G.; Du, W.; Wang, R.; Zhang, G. Genetic mechanism of high-quality shale gas reservoirs in the Wufeng–LongmaxiFms in the Sichuan Basin. Nat. Gas Ind. B 2021, 8, 24–34. [Google Scholar] [CrossRef]
  18. Xie, W.R.; Wen, L.; Wang, Z.C.; Hao, Y.; Xin, Y.G.; Wu, S.J.; Li, W.Z.; Yao, Q.Y.; Ma, S.Y.; Chen, Y.N. Types of Unconventional Marine Resources and Favorable Exploration Directions in the Permian Middle Triassic of the Sichuan Basin. Nat. Gas Geosci. 2024, 35, 961–971. [Google Scholar]
  19. Karim, N.; Dar, S.A.; Wani, H.; Mir, K.M.; Ahmad, R. Permian-Triassic Fossil Parks of Kashmir Himalaya, India: Geological and Paleontological Characterization, and Potential Interest for Geotourism. Geoheritage 2025, 17, 10. [Google Scholar] [CrossRef]
  20. Awan, R.S.; Liu, C.; Khan, A.; Iltaf, K.H.; Zang, Q.; Wu, Y.; Ali, S.; Gul, M.A. Geochemical Characterization of Organic Rich Black Rocks of the Niutitang Formation to Reconstruct the Paleoenvironmental Settings during Early Cambrian Period from Xiangxi Area, Western Hunan, China. J. Earth Sci. 2023, 34, 1827–1850. [Google Scholar] [CrossRef]
  21. Cao, T.T.; Deng, M.; Liu, G.X.; Cao, Q.G.; Liu, H.; Huang, Y.R. Reservoir characteristics of organic-rich siliceous shale of Permian Wujiaping Formation in Lichuan area, western Hubei Province. Mar. Orig. Pet. Geol. 2018, 23, 32–42. [Google Scholar]
  22. Du, Y.; Wang, X.; Tang, R.; Zhu, Y.; Yang, C.; Zhou, H.; Pang, Q. Extraordinarily High Organic Matter Enrichment in Upper Permian Wujiaping Formation in the Kaijiang-Liang Trough, Sichuan Basin. Energies 2022, 16, 349. [Google Scholar] [CrossRef]
  23. Xu, S.Y.; Xia, M.L.; Zhu, Y.; Li, T.J.; Lin, Y. Evolution stage and tectonic sedimentary characteristics of the Kaijiang-Liangping Trough. Fault-Block Oil Gas Field 2023, 30, 963–974. [Google Scholar]
  24. Boruah, A.; Ganapathi, S. Organic richness and gas generation potential of Permian Barren Measures from Raniganj field, West Bengal, India. J. Earth Syst. Sci. 2015, 124, 1063–1074. [Google Scholar] [CrossRef]
  25. Liu, S.; Gao, G.; Gang, W.; Xiang, B.; Wang, M.; Wang, C. Comparison of Formation Conditions of Source Rocks of Fengcheng and Lucaogou Formations in the Junggar Basin, NW China: Implications for Organic Matter Enrichment and Hydrocarbon Potential. J. Earth Sci. 2023, 34, 1026–1040. [Google Scholar] [CrossRef]
  26. Liu, Z.; Yan, D.; Niu, X. Pyrite Concretions in the Lower Cambrian Niutitang Formation, South China: Response to Hydrothermal Activity. J. Earth Sci. 2023, 34, 1053–1067. [Google Scholar] [CrossRef]
  27. Liu, S.Y.; Gao, P.; Xiao, X.M.; Liu, R.B.; Qin, Q.; Yuan, Y.; Wang, X. Study on Organic Petrology Characteristics of the Wufeng-Longmaxi Formation Black Shale, Sichuan Basin. Geoscience 2022, 36, 1281–1291. [Google Scholar]
  28. Liu, Z.Y.; Jiang, M.; Zhou, F.; Selby, D.; Qiu, Z. The role of terrestrial organic matter in Re and Os uptake: Insights for Re-Os dating of organic-bearing sedimentary rocks and weathering of organic carbon. J. Earth Sci. 2025, 1–8. [Google Scholar] [CrossRef]
  29. Zhao, W.Z.; Jia, A.L.; Wei, Y.S.; Wang, J.L.; Zhu, H.Q. Progress in shale gas exploration in China and prospects for future development. China Pet. Explor. 2020, 25, 31–44. [Google Scholar]
  30. Xiang, K.M.; Shi, H.L.; Wang, X.M.; Zhao, Y.; Dong, X.X.; Pang, H.Q.; Zhang, Y.Y. Reservoir characteristics and main controlling factors of gas content of deep shale gas in Southern Sichuan Basin. J. Northeast Pet. Univ. 2023, 47, 44–55. [Google Scholar]
  31. Liu, Z.C.; Zhou, Q.; Liu, K.; Wang, Y.; Chen, D.; Chen, Y.; Xiao, L. Sedimentary Features and Paleogeographic Evolution of the Middle Permian Trough Basin in Zunyi, Guizhou, South China. J. Earth Sci. 2023, 34, 1803–1815. [Google Scholar] [CrossRef]
  32. Knies, J.; Schönenberger, J.; Zwingmann, H.; van der Lelij, R.; Smelror, M.; Vullum, P.E.; Brönner, M.; Vogt, C.; Fredin, O.; Müller, A.; et al. Continental weathering and recovery from ocean nutrient stress during the Early Triassic Biotic Crisis. Commun. Earth Environ. 2022, 3, 161. [Google Scholar] [CrossRef]
  33. Hu, Z.Q.; Du, W.; Zhu, T.; Liu, Z.Q. Sequence stratigraphy and lithofacies characteristics of fine-grained deposits of Wufeng-Longmaxi Formations in the Sichuan Basin and on its periphery. Oil Gas Geol. 2022, 43, 1024–1038. [Google Scholar]
  34. Xiang, W.; Yingdong, Z.; Wenpan, C.E.; Haiwu, C.; Laijun, W.; Jiyu, C. Exploration potential of Lower Carboniferous Luzhai Formation shale gas in Guizhong Depression, Dian-Qian-Gui Basin. Nat. Gas Geosci. 2023, 34, 1515–1534. [Google Scholar]
  35. Tahir, M.; Hanif, M.; Khan, S.; Radwan, A.E.; Ullah, S. Shale gas potential evaluation based on well-logs and basin modeling of the Cretaceous-Paleocene succession of the Kohat Plateau, Pakistan: Implication for shale gas exploration. Geomech. Geophys. Geo-Energy Geo-Resour. 2024, 10, 126. [Google Scholar] [CrossRef]
  36. Guo, X.; Luo, T.; Dong, T.; Yang, R.; Han, Y.; Yi, J.; He, S.; Shu, Z.; Bao, H. Quantitative Estimation on Methane Storage Capacity of Organic-Rich Shales from the Lower Silurian Longmaxi Formation in the Eastern Sichuan Basin, China. J. Earth Sci. 2023, 34, 1851–1860. [Google Scholar] [CrossRef]
  37. Awejori, G.A.; Dong, W.; Doughty, C.; Spycher, N.; Radonjic, M. Mineral and fluid transformation of hydraulically fractured shale: Case study of Caney Shale in Southern Oklahoma. Geomech. Geophys. Geo-Energy Geo-Resour. 2024, 10, 128. [Google Scholar] [CrossRef]
  38. Ding, W.; Xu, C.; Jiu, K.; Li, C.; Zeng, W.; Wu, L. The Research Progress of Shale Fractures. Adv. Earth Sci. 2011, 26, 135–144. [Google Scholar]
  39. Lu, L.F.; Cai, J.G.; Liu, W.H.; Teng, G.E.; Wang, J. Occurrence and thermostability of absorbed organic matter on clay minerals in mudstones and muddy sediments. Oil Gas Geol. 2013, 34, 16–26. [Google Scholar]
  40. Enemo, D.C.; Onah, M.C.; Obalum, S.E.; Njoku, O.M.; Lgwe, C.A. Organic matter influence on particle density of low-activity-clay tropical soils and the implications for their porosity assessment. Int. J. Environ. Sci. Technol. 2025, 22, 12507–12516. [Google Scholar] [CrossRef]
  41. Pu, B.L.; Dong, D.Z.; Wu, S.T.; Huang, J.L.; Wang, Y.M. Microscopic space types of Lower Paleozoic marine shale in southern Sichuan Basin. J. China Univ. Pet. 2014, 38, 19–25. [Google Scholar]
  42. Wang, R.; Liu, Y.; Li, Z.; Wang, D.; Wang, G.; Lai, F.; Li, Z.; He, J. Microscopic pore structure characteristics and controlling factors of marine shale: A case study of Lower Cambrian shales in the Southeastern Guizhou, Upper Yangtze Platform, South China. Front. Earth Sci. 2024, 12, 1368326. [Google Scholar] [CrossRef]
  43. Bal, A.; Misra, S.; Sen, D. Nanopore Heterogeneity and Accessibility in Oil and Gas Bearing Cretaceous KG (Raghampuram) Shale, KG Basin, India: An Advanced Multi-analytical Study. Nat. Resour. Res. 2024, 33, 1131–1154. [Google Scholar] [CrossRef]
  44. Wu, Z.; Li, T.; Ji, S.; Zhou, Q.; Tian, H. Gas Generation from Coal and Coal-Measure Mudstone Source Rocks of the Xujiahe Formation in the Western Sichuan Depression, Sichuan Basin. J. Earth Sci. 2023, 34, 1012–1025. [Google Scholar] [CrossRef]
  45. Martirosyan, A.; Ilyushin, Y.; Afanaseva, O.; Kukharova, T.; Asadulagi, M.; Khloponina, V. Development of an Oil Field’s Conceptual Model. Int. J. Eng. Trans. B Appl. 2025, 38, 381–388. [Google Scholar] [CrossRef]
  46. Wu, J.; Hu, Z.; Xie, J.; Liu, Z.; Zhao, J. Macro-micro occurrence mechanism of organic matters in Wufeng-Longmaxi shale in the Sichuan Basin and its peripheral areas. Nat. Gas Ind. 2018, 38, 23–32. [Google Scholar]
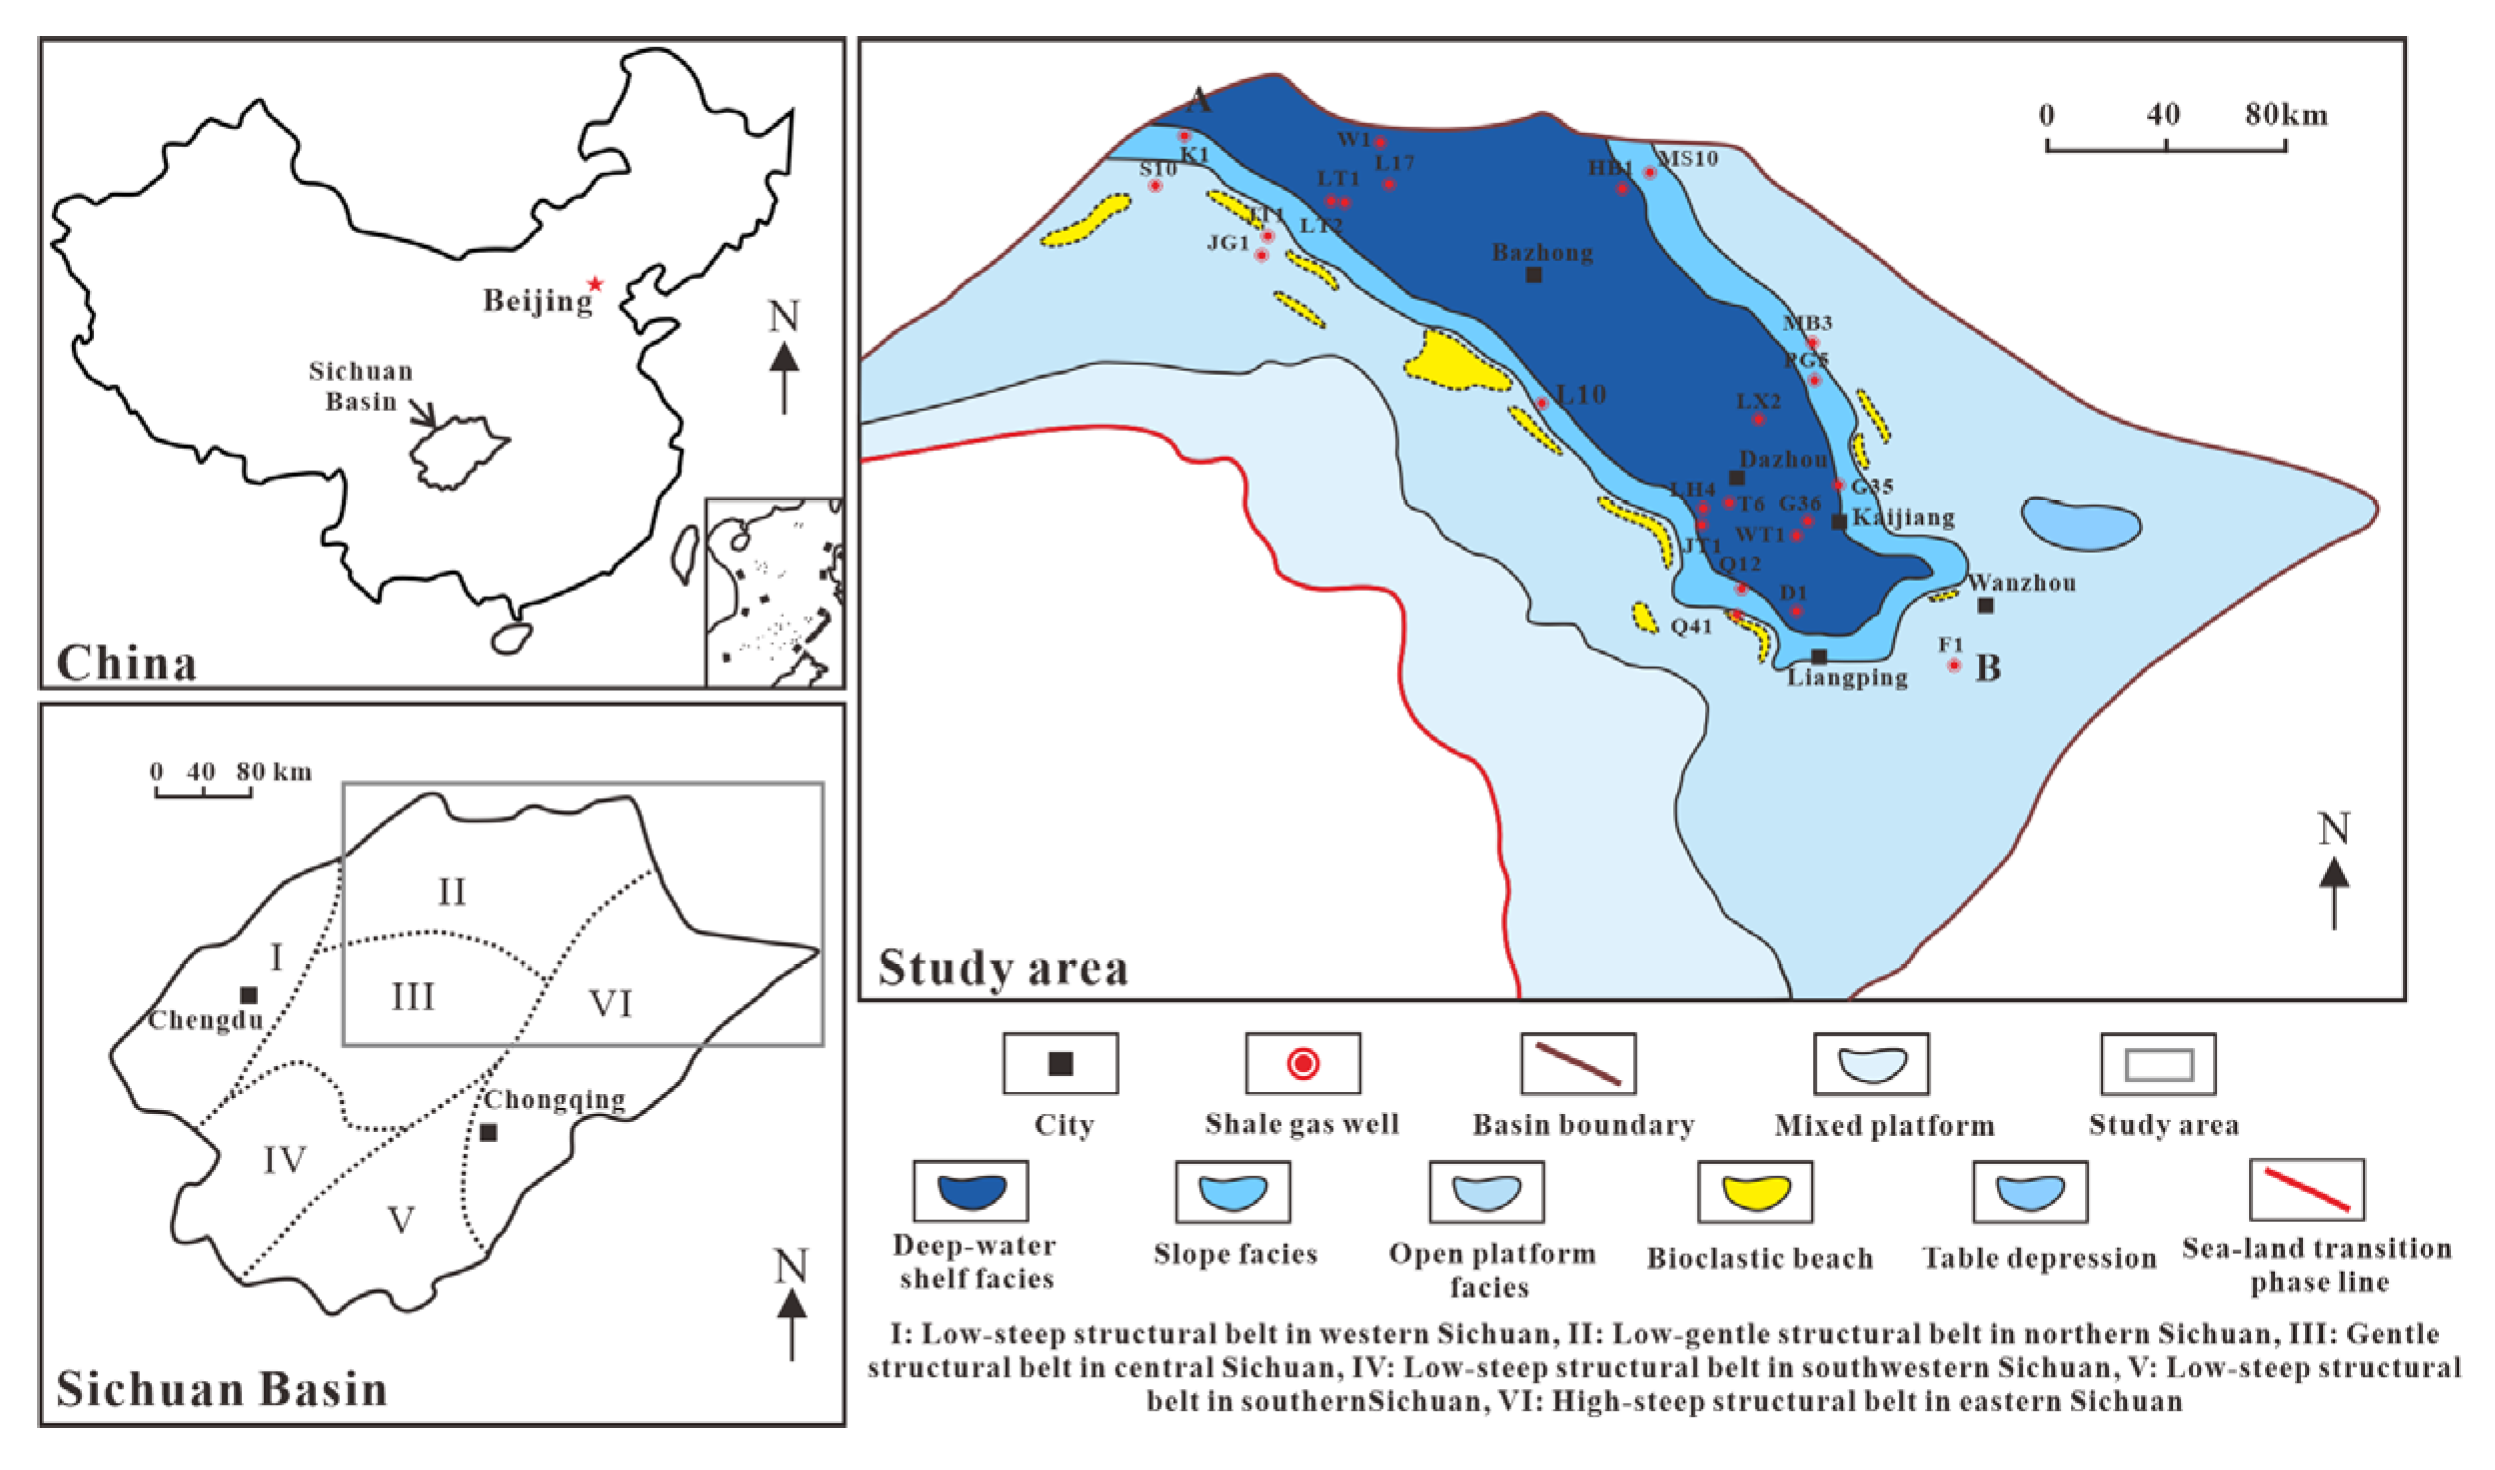
Figure 1. Location of study area and sedimentary facies distribution during the deposition period of the P3w.
Energies 18 04506 g001
Figure 2. Shale identification based on the cross-plot of logging curves. (a) Intersection diagram of CNL and DEN; (b) Intersection diagram of CNL and GR; (c) Intersection diagram of AC and GR.
Energies 18 04506 g002
Figure 3. Distribution of shales in the P3w1 (a), P3w2 (b), and P3w3 (c) of northeastern Sichuan Basin.
Energies 18 04506 g003
Figure 4. Comparison of shale TOC (a) and porosity (b) between P3w of the study area and O3w-S1l of the Weirong shale gas field in the southern Sichuan Basin.
Energies 18 04506 g004
Figure 5. Relationship between gas content and TOC of P3w shale.
Energies 18 04506 g005
Figure 6. SE-trending shale thickness joint well profile of P3w in the Sichuan Basin. A and B are the starting and ending well positions of this well profile, and the specific locations can be found in the Study area of Figure 1.
Energies 18 04506 g006
Figure 7. Relationship between volume fraction, TOC, and gas content of different mineral components in P3w in northeastern Sichuan. (a) Three-dimensional bar chart of siliceous mineral, TOC and gas content; (b) Three-dimensional bar chart of clay mineral, TOC and gas content.
Energies 18 04506 g007
Figure 8. Microscopic characteristics of shale lithofacies of the P3w in the northeastern Sichuan Basin. (a) Siliceous shale, Well D1, 4334.12 m; (b) Siliceous shale, Well D1, 4391.92 m; (c) Siliceous shale, Well D1, 4391.92 m; (d) Clay shale, Well D1, 4366.92 m; (e) Clay shale, Well D1, 4364.67 m; (f) Clay shale, Well D1, 4362.41 m; (g) Mixed shale, Well D1, 4334.68 m; (h) Mixed shale, Well D1, 4334.68 m; (i) Mixed shale, Well D1, 4334.68 m.
Energies 18 04506 g008
Figure 9. SEM and thin sections of shale reservoirs in the P3w. (a) Well D1, 4339.17 m, organic matter pore; (b) Well D1, 4334.12 m, organic matter pore; (c) Well D1, 4331.12 m, irregular organic matter; (d) Well D1, 4367.30 m, strawberry-like pyrite; (e) Well D1, 4346.23 m, silty sand particles are distributed in the striated mudstone, with occasional cracks. (f) Well D1, 4370.64 m, fracture; (g) Well D1, 4384 m, Oil immersion, fracture, Irregular organic matter; (h) Well D1, 4384.56 m, oil-impregnated, fractures filled with minerals; (i) Well D1, 4385.12 m, oil immersion, fracture.
Energies 18 04506 g009
Figure 10. Pore size distribution based on CO2 and N2 adsorption experiments. (a) Clay shale; (b) Siliceous shale.
Energies 18 04506 g010
Table 1. Comparison of geochemical characteristics and reservoir conditions between shales from the P3w and O3w-S1l.
IntervalP3w3P3w2P3w1O3w-S1l
Shale thickness, m4–463–364–2721–283
TOC, %6.042.520.292.26
Organic matter typeII1~II2IIIIIII~II1
Ro, %2.712.742.82.34
Gas content, cm3/g10.392.210.622.46
Porosity, %5.869.438.873.74
Reservoir typeCracks, dissolution holes, organic holesOrganic pore, inorganic pore
Disclaimer/Publisher’s Note: The statements, opinions and data contained in all publications are solely those of the individual author(s) and contributor(s) and not of MDPI and/or the editor(s). MDPI and/or the editor(s) disclaim responsibility for any injury to people or property resulting from any ideas, methods, instructions or products referred to in the content.