Abstract
In comparison to shallow coal seams, deep coal seams exhibit characteristics of high temperature, pressure, and in-situ stress, leading to significant differences in reservoir properties that constrain the effective development of deep coalbed methane (CBM). This study takes the Carboniferous deep 8# coal seam in the Yulin area of Ordos basin as the research subject. Based on the test results from core drilling wells, a comprehensive analysis of the characteristics and variation patterns of coal reservoir properties and a comparative analysis of the exploration and development potential of deep CBM are conducted, aiming to provide guidance for the development of deep CBM in the Ordos basin. The research results indicate that the coal seams are primarily composed of primary structure coal, with semi-bright to bright being the dominant macroscopic coal types. The maximum vitrinite reflectance (Ro,max) ranges between 1.99% and 2.24%, the organic is type III, and the high Vitrinite content provides a substantial material basis for the generation of CBM. Longitudinally, influenced by sedimentary environment and plant types, the lower part of the coal seam exhibits higher Vitrinite content and fixed carbon (FCad). The pore morphology is mainly characterized by wedge-shaped/parallel plate-shaped pores and open ventilation pores, with good connectivity, which is favorable for the storage and output of CBM. Micropores (<2 nm) have the highest volume proportion, showing an increasing trend with burial depth, and due to interlayer sliding and capillary condensation, the pore size (<2 nm) distribution follows an N shape. The full-scale pore heterogeneity (fractal dimension) gradually increases with increasing buried depth. Macroscopic fractures are mostly found in bright coal bands, while microscopic fractures are more developed in Vitrinite, showing a positive correlation between fracture density and Vitrinite content. The porosity and permeability conditions of reservoirs are comparable to the Daning–Jixian block, mostly constituting oversaturated gas reservoirs with a critical depth of 2400–2600 m and a high proportion of free gas, exhibiting promising development prospects, and the middle and upper coal seams are favorable intervals. In terms of resource conditions, preservation conditions, and reservoir alterability, the development potential of CBM from the Carboniferous deep 8# coal seam is comparable to the Linxing block but inferior to the Daning–Jixian block and Baijiahai uplift.
1. Introduction
China possesses vast coalbed methane (CBM) reserves, but due to complex geological conditions, coal reservoirs typically exhibit characteristics of low porosity, low permeability, low gas saturation, and high heterogeneity [1]. This results in challenges such as low well productivity, long production cycles, and low development efficiency in the development of CBM in the middle and shallow layers [2]. Only in a few areas can economically viable development be achieved, severely constraining the development of the CBM industry in China [3]. With the deepening of drilling depths, deep CBM has gradually become a research hotspot in recent years. The deep (>2000 m) CBM resources in China are estimated to be around 40 × 1012 m3, far exceeding the resources in the middle and shallow layers. They have vast prospects for exploration and development [4]. However, deep CBM is still in its early stages, and both mechanistic research and development methods face significant challenges [5]. With increasing burial depth, in-situ stress, formation temperature, and reservoir pressure gradually rise, leading to significant differences in the physical properties of deep coal reservoirs compared to those in the middle and shallow layers. As a result, theories and designs applicable to the development of CBM in the middle and shallow layers cannot be directly applied to deep coal seams.
The physical properties of coal reservoir primarily encompass pore-fracture structure, porosity, permeability, and gas-bearing characteristics (including gas content and adsorption behaviors), which collectively influence the entire process of CBM desorption, diffusion, seepage, and production. Currently, these physical characteristics are predominantly studied through experimental analysis methods. Many scholars have conducted extensive research on the physical properties of deep coal reservoirs. Under the high pressure exerted by overlying strata, the pores in deep coal reservoirs of the Ordos basin are compressed, leading to a decrease in porosity and the formation of irregular shapes such as wedge-shaped or narrow slit shapes. The pore types are predominantly micropores and small pores, with both the pore volume and specific pore surface area being mainly contributed by micropores. Additionally, the pore connectivity is poor, and the complexity is moderate [6,7,8]. The permeability of deep coal seams is influenced by a combination of factors, including temperature, reservoir pressure, and geostress, with geostress being the most significant factor. Some scholars believe that high geostress reduces coal reservoir permeability by decreasing porosity and closing fractures, while others argue that new fractures can be created under the high geostress in deep coal seams, thereby enhancing the reservoir permeability [9,10]. Additionally, some scholars point out that the change in coal seam permeability with depth follows a pattern of initial increase and subsequent decrease, corresponding to changes in geostress [11]. In terms of gas-bearing characteristics, as the burial depth of the coal seam increases, the negative effect of temperature on CBM adsorption gradually overrides the positive influence of pressure, reaching a critical depth, below which the adsorption capacity of CBM decreases and free gas gradually becomes dominant. However, some scholars think that despite the increase in free gas in deep coal seams, the occurrence state of CBM is still mainly in the adsorption state [12]. Furthermore, the total gas content in deep coal seams of the Ordos basin exhibits a trend of initial increase followed by decrease with increasing depth, constrained by temperature, pressure, and water saturation [4,13]. The study of reservoir property characteristics is a crucial component of CBM exploration and development. It serves as the foundation for assessing the development potential of CBM, selecting exploration areas, choosing well locations and designs, planning well networks, and determining completion schemes [14].
The Ordos basin is a vital coal-bearing basin in China, with a coalbed gas-bearing area covering 2.5 × 10⁵ km2 and coal seam gas reserves totaling 10.72 × 10¹² m3. The main gas-bearing layers include the 5# coal of the Shanxi Formation in the Permian and the 8# coal of the Benxi Formation in the Carboniferous [15,16,17]. Among these, the 8# coal is characterized by its considerable thickness, widespread distribution, and good continuity, making it a focal layer for CBM exploration and development. As of now, breakthroughs have been achieved in the development of deep CBM or coal series gas in the eastern part of the Ordos basin. For instance, the Daning–Jixian block has achieved daily vertical well production exceeding 2 × 10⁴ m3, horizontal well production exceeding 10 × 104 m3, and stable daily gas production above 104 m3. In the Yanchuan South block, the daily gas production from a production well reaches 2.6 × 10⁴ m3. However, the central and eastern regions of the basin have yet to establish productive blocks and are still in the early stages of exploration. Although preliminary exploration results indicate favorable gas content in the deep 8# coal in the central and eastern regions of the basin, the reservoir property characteristics are not clearly understood, posing a challenge to the effective development of CBM.
This study focuses on the Carboniferous deep 8# coal seam in the Yulin area of the Ordos basin. Based on the characteristics of coal quality, gas content, pores, fractures, structures, and the theory of fractal theory, this study systematically analyzes the reservoir geological characteristics of the coal seam. A comprehensive comparison is made with the well-explored pilot areas such as Daning–Jixian, Linxing in the eastern margin of Ordos basin, and the Baijiahai uplift in the Junggar basin, considering their favorable production outcomes. This comparative analysis aims to assess the exploration and development potential of CBM resources. The objective is to provide a foundation for the later stages of increased storage and production of CBM in the Ordos basin. Additionally, it provides essential references for the exploration and development of CBM in adjacent blocks.
2. Geological Setting
2.1. Tectonic Characteristics
The Ordos basin is in the central–western region of China, belonging to the North China Craton (Figure 1a). Surrounded by mountains, it is a typical multi-cycle cratonic superimposed basin undergoing long-term tectonic subsidence. The basin includes six major secondary tectonic units: the Yimeng Uplift, Western Shanxi Flexure Belt, Northern Weihe Uplift, Western Margin Thrust Belt, Tianhuan Depression, and Yishan Slope [18,19,20] (Figure 1a).
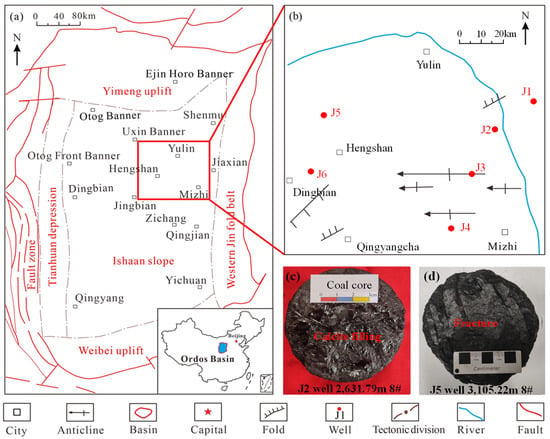
Figure 1.
(a) The location and major secondary tectonic units of the Ordos basin; (b) tectonic outline of the Yulin area and distribution of coring well locations; (c) the deep 8# coal core of a typical well shows directional fracture development and (d) a calcite filling phenomenon.
The Yulin area, situated within the Shaanxi province of the Ordos basin, is in the northeastern part of the Yishan Slope, characterized by a gently dipping monocline structure trending NNE-NW. Overall, the structural movement is limited, with minimal development of folds and anticlines, occurring only in the Jingbian–Qingyangcha–Wubu area, and a few normal faults in the Shenmu area (Figure 1b).
2.2. Stratigraphic and Sedimentary Characteristics
In the Yulin area, the sedimentary strata developed from bottom to top include the Ordovician Majiagou Formation, Upper Carboniferous Benxi Formation, Lower Permian Taiyuan and Shanxi Formations, Middle Permian Upper Shihezi and Lower Shihezi Formations, Upper Permian Shiqianfeng Formation, and Lower Triassic Liujiagou Formation. There is an absence of the Ordovician Middle-Upper Series, Silurian, Devonian, and Lower Carboniferous strata, and the contact between the Benxi Formation and the Taiyuan Formation is unconformable. From northeast to southwest, the thickness of the strata gradually decreases, showing a relatively gentle dip, with thicknesses ranging from 10 to 100 m. The coal-bearing formations mainly include the Shanxi Formation, Taiyuan Formation, and Benxi Formation, comprising a total of nine coal seams. Among them, the target interval, the 8# coal seam, is located at the top of the Benxi Formation, characterized by its large thickness (average 6.82 m), wide distribution, and good continuity [21]. Beneath it, multiple sets of mudstone, limestone, and sandstone are primarily developed (Figure 2a), including mainly the Wujiayu Limestone, Jinci Sandstone, Pangou Limestone, and Pangou Sandstone. Additionally, the iron–aluminum strata are developed at the bottom of Benxi Formation.
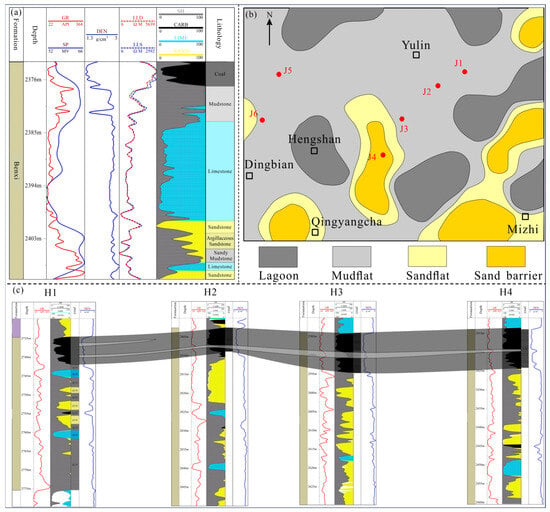
Figure 2.
(a) The stratigraphic development of Benxi Formation of J2 well in the Ordos basin; (b) the distribution characteristics of sedimentary microfacies of C1b; (c) the distribution of coal seam in north–south direction. SH represents mudstone; CARB represents coal; LIME represents limestone; SAND represents sandstone.
In the Late Paleozoic era, the Ordos basin underwent a series of sedimentary environmental evolutions, including uplift and erosion, transgression, and regression. These processes led to a relatively comprehensive development of various types of strata. The Benxi Formation marks a crucial transitional period in the basin’s evolution. During this time, seawater invaded from both the east and west. The eastern side, which belonged to the North China Sea, had a flat topography and an expansive sea area. It featured a tidal flat—tidal lagoon—barrier island—shallow water shelf sedimentary system and the sedimentary microfacies developed in the C1b Formation mainly include lagoon, mudflat, sandflat, and sand barrier microfacies (Figure 2b). Towards the west, there was overlying deposition, resulting in the Benxi Formation having a thicker deposit in the east and a thinner deposit in the west. At the end of the Carboniferous period, peat swamps were widely distributed. The extensive 8# coal seam occurred during this time, making it a significant stratigraphic marker and hydrocarbon source in the Ordos basin [22].
In the north–south direction, the coal seam exhibits relatively stable and continuous development, with an average thickness of 7.63 m, and the thickness gradually increases from south to north, consistent with the overall coal seam thickness development trend in the study area. Furthermore, a continuous set of partings develops within the coal, with an increase in the number of partings in the southern region, interpreted as the depositional system approaching the sea, resulting in deepening water bodies and an increase in muddy sediments (Figure 2c).
3. Coal Petrology and Quality
3.1. Experiments and Methodology
We conducted experiments such as vitrinite reflectance, microscopic composition, XRD, TOC, proximate analysis, and elemental analysis to analyze the coal petrology and quality characteristics of the deep coal. Field emission scanning electron microscopy (FESEM) observation, low-temperature liquid nitrogen adsorption (LNA), high-pressure mercury intrusion (MIP), low-temperature CO2 adsorption, microscopic fissure observation, as well as porosity and permeability testing experiments were carried out to investigate the pore-fracture structure, porosity, and permeability characteristics of the deep coal. Combining on-site desorption experiments of coal with high-temperature and high-pressure isothermal adsorption experiments, the gas content and adsorption characteristics of the deep coal seam were analyzed. The main methods are as follows:
The value of vitrinite reflectance (Ro,max) is obtained under white light, using a photometer system to observe the polished coal magnified 500 times in an oil immersion device for petrological observation (500 points). Microscopic composition involves preparing coal samples into coal powder slides, immersing them in oil, and observing them under a reflected plane-polarized light microscope. The XRD experiment involves drying the coal sample at low temperature, crushing it to a particle size smaller than 40 μm, making powder pellets, initiating X-ray diffraction (XRD) testing, obtaining X-ray diffraction spectra, and calculating peak intensities. Total organic carbon (TOC) testing involves crushing the coal sample to 200 mesh, combusting it thoroughly in a high-temperature oxygen flow in a carbon-sulfur analyzer, and determining the total organic carbon content using an infrared detector manufactured by Changsha Youxing Optoelectronic Technology Co., Ltd., Changsha, China. The N content in coal is determined by adding a mixed catalyst and sulfuric acid to the dried coal sample, converting nitrogen to ammonium sulfate. Excess sodium hydroxide solution is then added to vaporize ammonia, which is absorbed in a boric acid solution, and the nitrogen content in the sample is calculated by titration with a standard sulfuric acid solution. The C and H content in coal is determined by combusting coal powder in an oxygen stream, absorbing the generated water and CO2 with water-absorbent and CO2-absorbent, and calculating the mass fractions of carbon and hydrogen based on the increase in absorbents. The S content in coal is determined by mixing the coal sample with Eschka reagent and burning it, converting the sulfur in coal to sulfate. Then, sulfate ions are precipitated as barium sulfate, and the total sulfur content in coal is calculated based on the mass of barium sulfate.
The FESEM experiment involves observing the pore types and pore size characteristics of block coal (0.5 cm × 1 cm × 1 cm) after physical and argon ion polishing using a high-resolution scanning electron microscopy system. The MIP experiment utilizes the non-wetting and capillary principles of mercury. Under external pressure, liquid mercury enters and exits the pores of coal. The larger the pressure, the smaller the pores that can be invaded by mercury. The LNA and CO2 adsorption experiment is based on the functional relationship between the amount of gas adsorbed on the surface of coal pores and the relative pressure of gas. Adsorption isotherms are plotted based on the relationship between relative pressure and adsorption amount to calculate the pore surface area and volume. Microscopic fissure observation involves preparing coal samples through reinforcement, slicing, grinding, and polishing in four steps to produce block coal slices with dimensions of 30 × 30 mm2. The block coal slices are then divided into nine fields of view of 10 × 10 mm2, and the developed micro-fissures in each field of view are observed and statistically analyzed. Coal porosity is determined by drying and sealing the coal sample after measurement, suspending it in water, measuring its weight using a balance, and calculating the porosity of the coal using a formula. Permeability testing involves preparing coal samples as plunger samples of dimensions 25 mm × 50 mm and drying them. Under different confining pressure conditions, He is applied to one end of the plunger sample with a certain displacement pressure, and the permeability values are recorded.
Gas content testing involves placing the coal core extracted from the core barrel into a desorption tank and conducting desorption gas volume testing at 70 °C using a graduated cylinder or flowmeter in a constant-temperature water bath manufactured by Changsha Youxing Optoelectronic Technology Co., Ltd., China. When the desorbed gas volume is less than 10 mL continuously for seven days, the desorption tank is opened, and the remaining gas volume is calculated by grinding the core using a ball mill. It is worth noting that the pressure-maintained coring method involves measuring the gas volume in the core barrel using a flowmeter before opening the core barrel, while the conventional coring and sealed coring methods use the USBM method to calculate the lost gas volume, thereby obtaining the total gas content of coal. The method used for high-temperature and high-pressure isothermal adsorption experiments on the coal rock is the mass method, which involves measuring the mass change of coal samples due to methane adsorption at different pressures using a magnetic suspension balance, obtaining the adsorption capacity of coal for methane at various pressure points, and then plotting the isothermal adsorption curve. The experimental temperature is set according to the actual temperature of the coal seam, and the maximum experimental pressure is 30 MPa.
3.2. Coal Petrological Characteristics
Core observations were conducted of the 8# coal of the Benxi Formation from six core drilling wells, with a total thickness of 33.31 m. The macroscopic boundaries of all cored wells were relatively clear, and coal components were distinguishable. Semi-anthracite dominated the macroscopic coal types, accounting for 70.44%, while bright coal and semi-dull coal were similar, accounting for 10.65% and 11.99%, respectively. Dull coal developed the least, constituting only 6.91%. Overall, both bright coal and semi-anthracite developed, while semi-dull coal and dull coal were more prevalent in the western and northwestern parts of the study area.
The formation of macroscopic coal types is closely related to the coal-forming environment. At the end of the Carboniferous period, seawater invaded the eastern side of the Ordos basin, leading to the widespread distribution of peat swamps. The source material was mainly woody plants. In the eastern and southeastern parts of the study area, where the water was deeper, a deep-covered water state prevailed. Plant debris in these areas experienced a stronger reducing environment, leading to more complete gelatinization processes. As a result, the dominant macroscopic coal types in the coal seams were bright and semi-bright coal. In terms of coal body structure, it exhibited overall stable tectonics, with predominantly original structure coal accounting for 73.70%. The second most prevalent structure was granular-fissured structure coal, but its distribution was limited, only present in J2 well. According to core photographs, the coal seams at the location of J2 well experienced folding due to tectonic movements. Additionally, there was a small amount of fractured structure coal, constituting only 9.22%, and it was scattered between the primary coals (Figure 3).
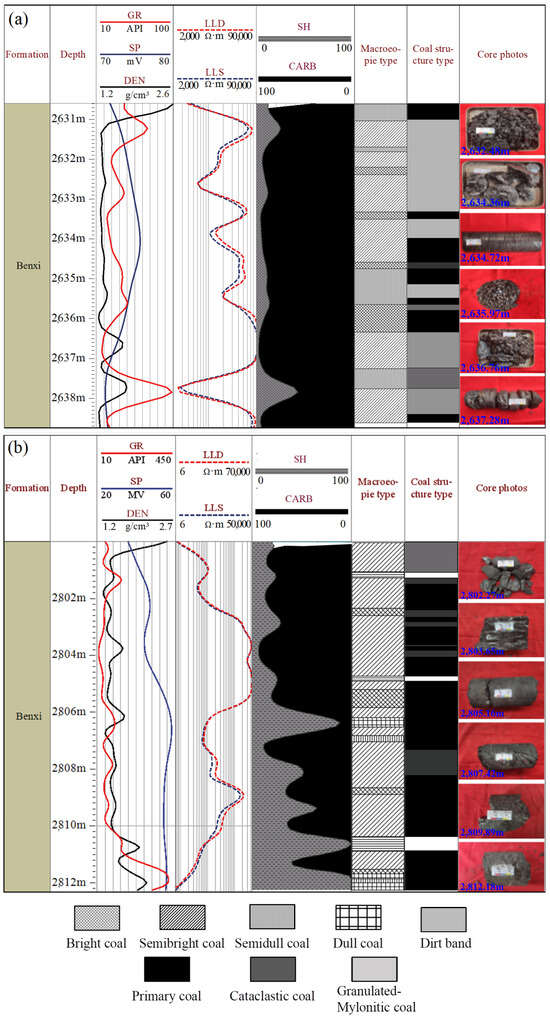
Figure 3.
Logging response characteristics, macroscopic type, coal structure type, and core photographs of deep 8# coal of Benxi Formation in J2 (a) and J3 (b) wells.
The macroscopic coal types and coal structure are crucial factors influencing the degree of fracture development in coal and the subsequent reservoir transformation effect. During the coal-forming process, bright coal, due to its lower moisture and ash content, experiences stronger matrix shrinkage effects and brittleness, facilitating the development of cleat structures within the coal. Therefore, a higher proportion of bright coal to semi-bright coal may indicate a higher degree of fracture development in the coal. Original structure coal and fractured structure coal have more intact structures and better mechanical strength, making them prone to forming a more complex network of pores and fractures during hydraulic fracturing, thus enhancing the recovery rate. In contrast, granular-fissured structure coal is too fragmented and difficult to support, leading to the collapse of wellbores and hindering large-scale volume fracturing [23]. Overall, the deep 8# coal reservoir exhibits good modifiability, providing necessary conditions for coal seam gas development.
The Ro,max is a crucial indicator for evaluating the hydrocarbon-generating ability of coals. The Ro,max of the 8# coal ranges from 1.99% to 2.24%, indicating a medium to high degree of metamorphism, reaching the thermal cracking gas generation stage, and possessing a strong gas-generating capability. On a planar scale, the thermal evolution of coals gradually increases from east to west, indicating a stronger gas-generating capacity in the southwestern part of the 8# coal. Additionally, influenced by the geothermal gradient, the variation pattern of Ro,max in the 8# coals is consistent with the changes in coal depth (Figure 4a).
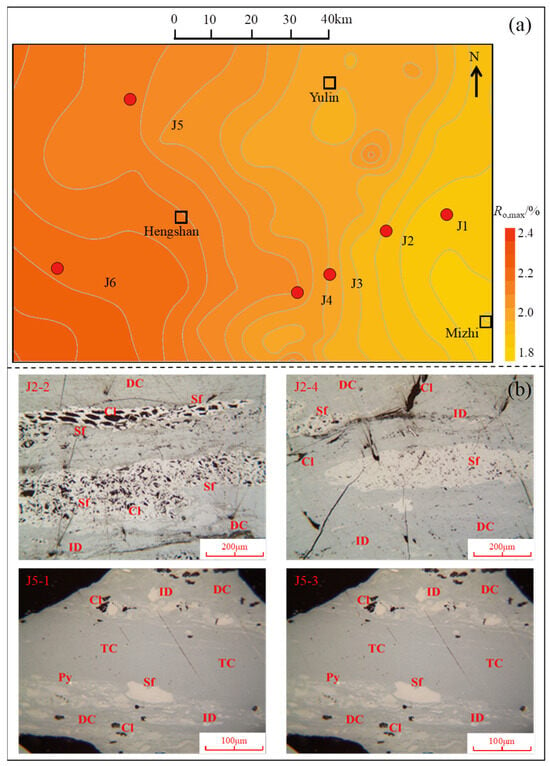
Figure 4.
(a) The Ro,max distribution and (b) characterization of macerals of the deep 8# coal, J2-2, Ro,max = 2.02%; J2-4, Ro,max = 2.14%; J5-1, Ro,max = 2.08%; J5-3, Ro,max = 1.96%. DC—Matrix vitrinite;; Sf—Semifusinite; Py—Pyrite; Cl—Clay; ID—Inertodetrinite.
Organic microscopic components are the fundamental constituents of coal, formed through the sedimentary metamorphism of ancient plant organic matter. These components are the source of material for CBM generation and can be classified into Vitrinite, Inertinite, and Liptinite [24] (Figure 4b). Vitrinite, the main adsorbent in coal, dominates the microscopic components, with a content of 66.80–89.80%, averaging 80.39%. Inertinite is the second most abundant, with a content ranging from 10.20% to 33.20%, averaging 19.61% [25,26,27,28], and the higher Vitrinite content in the 8# coal imparts strong gas storage. Overall, the deep 8# coal exhibits significant hydrocarbon generation potential and gas storage capacity, laying a solid foundation for the enrichment and later economic development of coal seam gas.
3.3. Coal Quality Characteristics
The proximate analysis of coal is the primary method for obtaining coal quality characteristics and serves as the foundation for coal quality assessment. The proximate analysis data of raw coal mainly include moisture (Mad), ash (Aad), volatile matter (Vad), and fixed carbon (FCad), which are fundamental data for evaluating coal quality. Additionally, the elemental composition in coal, total sulfur, and the CO2 content in carbonates are important indicators for analyzing coal quality characteristics. Proximate test results show that the content of fixed carbon, ash, volatile matter, and moisture in coal ranges from 72.66% to 84.56%, 4.85% to 16.42%, 8.80% to 13.39%, and 0.61% to 1.00%, respectively. The averages are 76.92%, 11.49%, 10.79%, and 0.80%, indicating that the deep 8# coal belongs to the category of very low to low volatile matter, low to medium ash, and medium to high fixed carbon, demonstrating favorable coal quality conducive to the generation and accumulation of coal seam gas (Figure 5a).
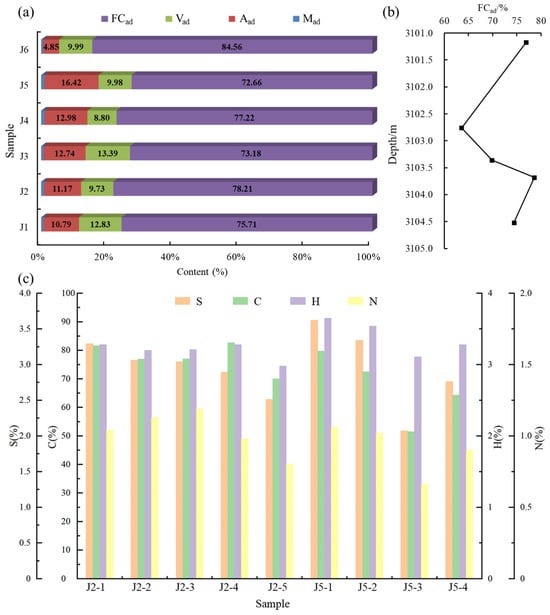
Figure 5.
Proximate analysis results of deep 8# coal in the coring well (a), vertical change of FCad in J5 well (b), and the total sulfur content (S) and mainly elemental analysis results (C, H, N) of deep 8# coal (c). Mad: moisture content, Aad: ash content, Vad: volatile matter content, and FCad: fixed carbon content.
On a planar scale, there is no apparent pattern in the distribution of proximate components in the 8# coal. However, in the northwest region, J5 well exhibits higher ash content than other areas, possibly due to its proximity to the source direction. Vertically, taking J5 well as an example, the increase in water level and deepening of water coverage enhance the reducing conditions in the coal-forming environment. Combined with the reduction of woody plants and an increase in herbaceous plants in the coal-forming environment, the decrease in lignin content in sediments leads to a higher fixed carbon content in the lower part of the coal seam (Figure 5b).
In the deep 8# coal of the Benxi Formation, the total sulfur content ranges from 2.07% to 3.62%, with an average of 2.95%. The carbonate rock carbon dioxide content is between 0.08% and 0.39%, averaging 0.33%. The carbon, hydrogen, and nitrogen elemental contents are 51.46–81.67%, 2.98–3.65%, and 0.66–1.19%, with averages of 72.92%, 3.28%, and 0.98%, respectively (Figure 5c). The elemental composition in coal is closely related to the generation and enrichment of coal seam gas. Based on the analysis of carbon, hydrogen, and nitrogen elements, the organic matter type in the deep 8# coal is identified as type III kerogen, dominated by gas-prone organic matter. The high degree of metamorphism indicates strong gas generation potential, providing ample gas sources for the accumulation of coal seam gas. Additionally, influenced by sediment transport distance, the J2 well exhibits higher carbon content in the coal seam, indicating a higher organic matter content, consistent with the TOC test results. The formation of sulfur in coal is a complex geological process, and total sulfur content is directly influenced by the depositional environment during coal formation. High total sulfur content is associated with marine deposits or coal influenced by seawater, as seawater contains sulfate ions. Conversely, low total sulfur content is characteristic of coal formed in swampy environments, inheriting sulfur mainly from plants within the swamp. The deep 8# coal is classified as medium (1% ≤ S < 3%)-high sulfur (S ≥ 3%) coal, indicating a depositional environment of marine-terrestrial transitional phase (barrier beach–tidal flat facies) deposition. The higher total sulfur content in the coal seam of the J2 well compared to the J5 well suggests seawater intrusion from the east and southeast directions during the Carboniferous period.
4. Physical Properties of Deep Coal Reservoir
Coal is a highly heterogeneous porous solid medium with a complex pore–fracture structure [29]. The pore–fracture system within coal plays a crucial role as the essential storage space and migration channel for the accumulation and production of coal seam gas. A well-developed pore–fracture network enhances the adsorption capacity and permeability of coal, which is vital for increasing the extraction rate and economic efficiency of coal seam gas [30,31,32].
4.1. Pore Structure Characteristics
4.1.1. Pore Structure Characterization Based on Field Emission Scanning Electron Microscopy
The pores in coal can be classified as primary or secondary pores, and their formation occurs through various processes, resulting in a complex morphological variety. FESEM is an effective method for visually understanding pore morphology. Under FESEM, the coals are primarily composed of Vitrinite, with occasional occurrences of Inertinite. The organic and inorganic components are intercalated. In coal with a primary structure, the development of pores is generally moderate, featuring isolated or interconnected gas pores, intergranular pores, microfractures, and pores between clay mineral flakes. Discontinuous band-like pores and mineral filling phenomena are also observed. In coal with a fractured-granular structure, the pores are more developed, including numerous rounds or irregularly shaped gas pores, intergranular pores in kaolinite aggregates, microfractures (or fractures filled with gypsum), and dissolution pores in pyrite particles. Additionally, as the distance from the source increases, the coal exhibits higher ash content, and mineral filling in the pores becomes more pronounced.
Quantitative analysis and characterization of the FESEM images were performed using Image J 1.54k software (Figure 6), and the characterization results are presented in Table 1. The coal pores exhibit diameters ranging from 5.00 to 919.27 nm, pore areas between 100.00 and 101,562.5 nm2, and pore perimeters between 60.2 and 3101.38 nm. Regarding pore size distribution, due to the resolution limitations of SEM and FESEM, micro-pores (<10 nm) in coal are almost impossible to observe. The dominant pore type is mesopores (100–1000 nm), accounting for 74.69–93.06%, followed by small pores (10–100 nm) at 6.94–24.70%. Additionally, influenced by burial depth, the J2 well exhibits a higher proportion of micro-pores in the coal seam.
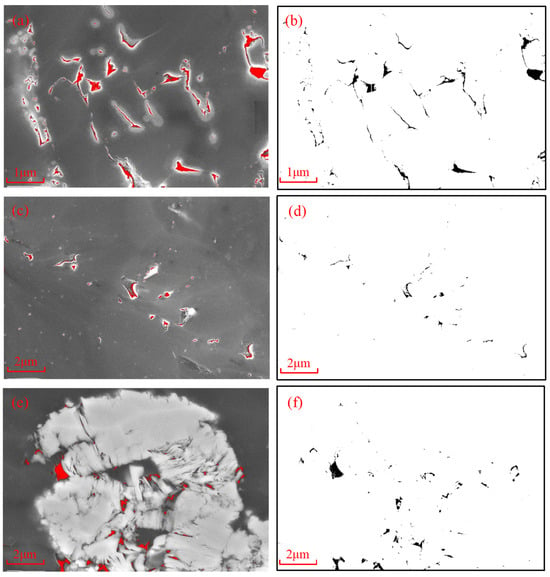
Figure 6.
(a,c,e) Photographs under FESEM and (b,d,f) binarized images of different types, sizes, and shapes of pores in deep 8# coal. (a,b) represent gas pores and irregular-shaped pores in organic matter in the J2 well; (c,d) represent round and irregular-shaped gas pores in the J5 well; (e,f) represent intercrystallite pores in the J5 well.

Table 1.
Coal pore parameters based on FESEM.
4.1.2. Pore Structure Characterization Based on Low-Temperature Liquid Nitrogen Adsorption
LNA experiments are currently one of the essential methods for characterizing the structural relationship of porous media. Analyzing the adsorption isotherms and the gas volume changes over time during desorption allows for the determination of parameters such as pore size, shape, specific surface area, and pore volume [33,34,35]. According to the classification standards set by IUPAC for adsorption/desorption curves, the deep 8# coal samples selected mainly exhibit three types of curves: H1, H2, and H4 [36].
Specifically, the curves for the 8# coal from wells J4 and J5 belong to the H4 type, characterized by nearly coincident adsorption/desorption curves without hysteresis loops. The represented pore morphology includes end-closed parallel plate-shaped pores and narrow slit-type pores. The existence of such pores is favorable for gas production but not conducive to storage. The curves for the 8# coal from wells J2 and J6 belong to the H1 type, featuring a small hysteresis loop. These curves suggest that the predominant pore morphology consists of open cylindrical pores or parallel plate pores, with the presence of narrow-necked bottle pores. Such pores are beneficial for both gas storage and production, although the production efficiency is lower than that of the H4 type (Figure 7). In addition, there are also a small number of sample curves present—the H2 type—showing a distinct hysteresis loop. Within the range of relative pressure less than 0.5, the desorption and adsorption curves nearly overlap. However, when the relative pressure is higher than 0.5, the curves separate. This type of curve indicates that the predominant pore morphology is ink bottle pores (narrow-necked bottle pores), with a few wedge-shaped pores and parallel plate-shaped pores. This morphology is advantageous for gas storage but less favorable for production. Additionally, the predominant pore morphology of the deep 8# coal includes end-closed parallel plate-shaped pores or narrow slit-type pores and open-type breathable pores. The low proportion of ink bottle pores may be attributed to the increasing burial depth of the coal seam, enhanced compaction, rising temperature, decreased mechanical strength of the coal matrix, and closure of the outlet end of ink bottle pores due to compression. In summary, the pore morphology of the deep 8# coal is highly favorable for both gas storage and efficient production in the later stages.
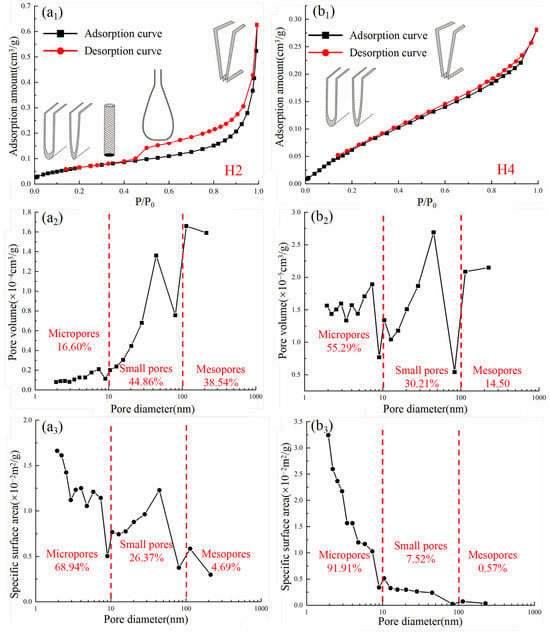
Figure 7.
The pore size distribution characteristics of deep 8# coal based on the LNA experiment. (a1,b1) The adsorption and desorption curves of liquid nitrogen and the main pore morphology; (a2,b2) the pore volume distribution and proportion of different pore size stages; (a3,b3) the development and proportion of pore specific surface area in different pore size sections. P/P0 represents the ratio of the partial pressure of the adsorbed gas to the saturated vapor pressure of the adsorbate at this temperature in the LNA experiment.
In terms of pore size distribution, the LNA experiments cover a range of 1.7 nm to 300 nm, including micropores, small pores, and a small proportion of mesopores. The test results show that the average pore diameter of the deep 8# coal ranges from 6.20 nm to 15.41 nm, with an average of 9.79 nm. The pore volume varies from 2.92 × 10⁻⁴ cm3/g to 1.17 × 10⁻³ cm3/g, with an average of 7.34 × 10⁻⁴ cm3/g. The specific surface area ranges from 0.24 m2/g to 0.54 m2/g, with an average of 0.37 m2/g (Table 2).

Table 2.
Specific surface area, pore volume, aperture diameter, and pore size distribution of coal.
Micropores play a dominant role in specific surface area, providing numerous adsorption sites for coal seam gas. Small and mesopores contribute significantly to pore volume, offering ample space for the presence of free gas (Figure 7). Under the influence of compaction and thermal metamorphism with increasing burial depth, temperature, and pressure, coal pores are compressed and reduced in size. Simultaneously, the release of gaseous substances formed by the dissociation of unstable side chains and oxygen functional groups in coal molecules leaves numerous micropores. This comprehensive effect leads to a gradual decrease in the average pore diameter and pore volume of coal, with an increase in the proportion of micropore volume. Additionally, the total pore surface area and the proportion of micropore surface area gradually increase, indicating that micropores contribute the most to the coal’s pore surface area.
4.1.3. Pore Structure Characterization Based on High-Pressure Mercury Intrusion
MIP experiments are also one of the most commonly used methods for analyzing the pore structure characteristics of coal. Compared to low-temperature liquid nitrogen adsorption/desorption experiments, the advantage of high-pressure mercury intrusion experiments lies in the testing range of mesopores and macropores. The experiment involves injecting mercury into a vacuum-pumped coal, gradually increasing the mercury pressure to make mercury enter smaller pores. By comparing the efficiency of mercury intrusion and extrusion, information such as pore volume, pore size distribution, and pore connectivity can be obtained [37,38]. Based on the classification of mercury intrusion–extrusion curve shapes by previous researchers, the deep 8# coal exhibits three main types of curves, namely type I, type III, and type IV [39].
Among them, the coal from wells J4, J5, and J6 is of type I, accounting for 60%. This type of curve has mercury intrusion saturation exceeding 80%, and the mercury extrusion efficiency is also above 90%. The pore structure is uniformly developed, with a high content of micropores and a low degree of development of meso- to macropores. The pore connectivity is good, which is favorable for the enrichment and production of coal seam gas. The coal from the J1 well exhibits a type III curve, accounting for 20%. This curve has mercury intrusion saturation above 80%, but the extrusion efficiency is relatively low, around 75%. The pore development is uneven, with a high degree of development of large pores and fractures, and good connectivity, which is conducive to the enrichment and production of coal seam gas. The coal from the J2 well belongs to type IV, accounting for 20%. The mercury intrusion curve is stable, with intrusion saturation below 40%, extrusion efficiency above 75%, and a relatively uniform pore development. The pore volume distribution shows a multi-peak distribution, with a high proportion of micropores, and good connectivity of meso- to macropores, which is favorable for gas enrichment but less favorable for production (Figure 8). Overall, the deep 8# coal is mainly characterized by type I curves in mercury intrusion–extrusion, with high intrusion and extrusion efficiency and good pore connectivity, making it highly favorable for the efficient development of deep coal seam gas resources.
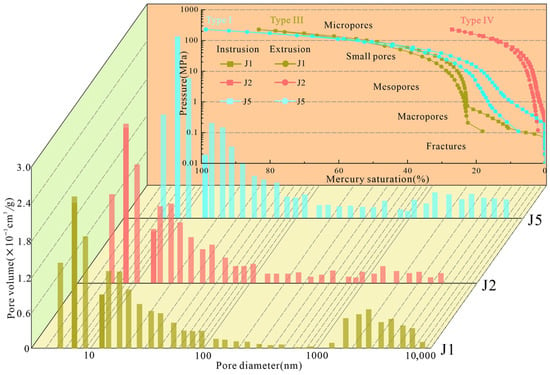
Figure 8.
Typical intrusion–extrusion mercury curve and pore volume distribution characteristics of deep 8# coal.
4.1.4. Full-Scale Pore Joint Characterization
The LNA experiment and MIP experiment can accurately characterize only the advantageous pore size range, with limited capability to characterize other pore sizes. In this study, the results of LNA and MIP experiments on coal pore structures, combined with CO2 adsorption experiments that characterize pores <2 nm, were used. The critical values at the intersection points of the dominant segments from different measurement methods were used to achieve a comprehensive characterization of the full-scale pore structure of the coal samples. The LNA experiment can characterize pore structures in the range of 1.7–300 nm. When the pore size exceeds 100 nm, the measured pore volume significantly increases, reducing data reliability. The MIP experiment tests pore sizes from 60–10,000 nm, but due to the compressibility of coal, pressures exceeding 10 MPa may cause pore destruction, leading to errors. In conclusion, this study connects the data obtained from the three testing methods at 2 nm and 100 nm, revealing the distribution of coal pore volume as shown in Figure 9a–e.
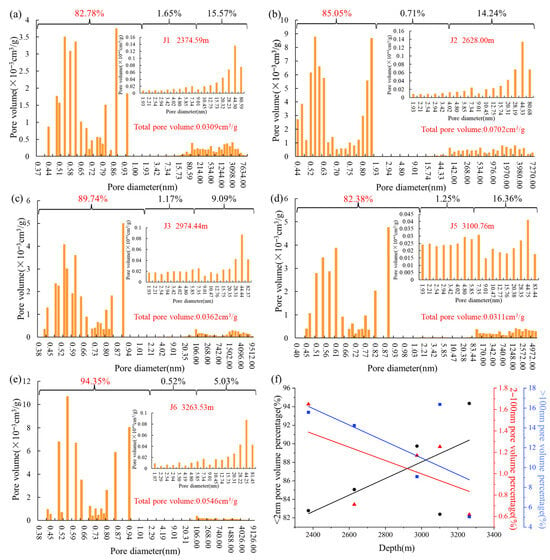
Figure 9.
Joint characterization of pore size distribution (a–e) with CO2 adsorption, LNA and MIP methods and pore volume ratio of different pore size segments (f) of deep 8# coal.
In the deep 8# coal reservoir, the development of micropores (<2 nm) is highest, with pore volume percentages all exceeding 80%. With the gradual increase in pore size, the increment in pore volume exhibits an N-shaped variation, with two peaks at 0.5–0.6 nm and 0.9–1.0 nm. This phenomenon is attributed to CO2 molecules preferentially adsorbing or filling smaller micropores under low pressure, constrained by the size of CO2 molecules, leading to the highest accumulation of 0.5–0.6 nm pores. As pressure increases, the occurrence of interlayer sliding results in a decrease in adsorption, and further pressure increase may cause CO2 molecules to undergo capillary condensation, similar to N2 molecules, leading to a subsequent increase in adsorption [40]. The contribution of large pores (>100 nm) is next, accounting for 10–20% of pore volume, while the development of micropores and small pores (2–100 nm) is the least pronounced.
Additionally, with increasing burial depth, the pore volume of coal exhibits a pattern of initially increasing, then decreasing, and finally increasing again. In the case of the J2 well, the 8# coal experiences structural movement leading to increased secondary pores, resulting in an unusually high total pore volume. For the J5 well, the 8# coal possibly undergoes high metamorphism, generating numerous micrometer-sized gas pores, contributing to the increase in micropore and total pore volumes. However, influenced by the compaction effect, the volume percentage of micropores (<2 nm) in coal overall exhibits an increasing trend, while the volume percentages of micropores (2–100 nm) and large pores (>100 nm) gradually decrease (Figure 9f).
4.1.5. Heterogeneity Characteristics
Coal is an organic reservoir with strong heterogeneity, and its degree of heterogeneity has a crucial impact on the gas content, permeability, and modifiability of the reservoir, which also constrains the formulation of fracturing plans. Fractal dimension is an important quantitative measure for characterizing the microscopic surface and structural heterogeneity of reservoirs, and it has been widely used in analyzing pore geometric structural features. The surface fractal dimension (Dm) of micropores (<2 nm) in coal can be calculated by analyzing the relationship between CO2 adsorption capacity and relative pressure (P/P0), with the calculation formula as follows (Figure 10a) [41]:
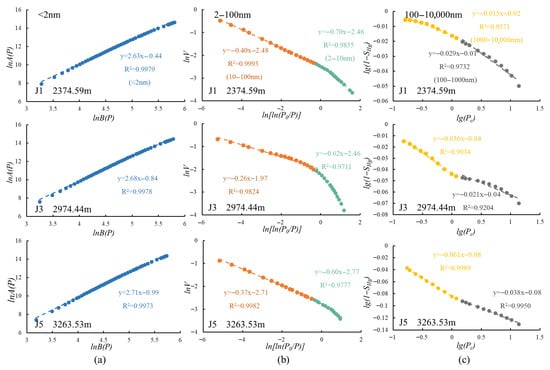
Figure 10.
The fractal characteristics of different pore size ranges of deep 8# coal in a typical coring well based on CO2 adsorption (a), LNA (b), and MIP (c) methods.
P is relative pressure; Dm is fractal dimension of micropores (<2 nm); C is a constant; Nmax is the adsorption capacity of CO2 at maximum relative pressure, cm3/g; N(P) is the adsorption capacity of CO2 at P, cm3/g; r(P) is the average aperture of coal at P, nm; σ is the surface tension of adsorbed CO2; Vm is molecular volumes, 22.4 L/mol; R is ideal gas constant, 8.314 J/(mol·K); and T is absolute temperature, K.
For small pores (2–100 nm), the fractal dimension can be calculated according to the FHH model using LNA data. The calculation formula is as follows (Figure 10b):
D = A + 3
V/V0 is the relative adsorption amount of N2 at adsorption equilibrium; A and C is the slope and intercept of V/V0 with ln(ln(P0/P)); P0 is saturated vapor pressure, MPa; D is the fractal dimension of small pores.
The fractal dimension of mesopores (100–10,000 nm) in coal can be obtained by using the Washbum equation to construct the linear regression relationship between the mercury saturation and capillary pressure based on the HIP. The expression is as follows (Figure 10c):
Pc is capillary pressure, MPa; SHg is mercury saturation when capillary pressure is Pc, %; Pmin is the capillary pressure entrance of mesopores (the capillary pressure corresponding to the maximum pore diameter), MPa; D is the fractal dimension of small pores.
The research results indicate that the Dm and D2 are similar, with comparable complexity in pore structure and smoother surfaces. The D1 is smaller, while the D3 and D4 increases significantly. This is because pores with a size of 2–10 nm in coal have a relatively small pore volume fraction and a narrower pore size range, resulting in a lower fractal dimension. Pores with aperture of >100 nm, which are predominantly secondary pores, are larger in scale and their pore morphologies are strongly controlled by tectonic deformation, leading to overall more complex pore structures (Table 3). As the burial depth increases, the Dm of micropores in coal shows an overall upward trend, while D3 and D4 exhibit a gradual decrease, which may be due to the combined action of compaction and hydrocarbon generation with increasing burial depth and the enhancement of coal metamorphism, leading to an increase in micropore content, changes in the chemical structure of the coal surface, and exacerbation of the irregularity of the pore surface. The content of mesopores and macropores (>100 nm) decreases, and fractures close, resulting in smoother pore surfaces in this pore size range. There is no obvious pattern in the change of D1 and D2, which may be due to the small proportion and low degree of development of these pores.

Table 3.
The fractal dimension of different pore sizes and full-scale pores of coal.
Additionally, based on the proportion of pore volume in different pore size ranges, the full-scale fractal dimension (D) of coal pores at different burial depths was calculated. This study found that as the burial depth increases, the D of coal gradually increases, indicating that, on the one hand, micropores (<2 nm) are the main factor controlling the complexity of pore structure in deep coal. On the other hand, it also suggests that the pore and fracture structure of deep coal is more complex, making later fracturing and stimulation more challenging. The coal in the J2 well is predominantly cataclastic-granulated coal caused by tectonic movements, with a significant development of secondary pores, which exhibits an abnormal increase in D, making it unfavorable for reservoir stimulation and efficient development.
4.2. Fracture Structure Characteristics
4.2.1. Fracture Development Characteristics
Coal fractures can be classified as endogenous fractures or exogenous fractures. Endogenous fractures refer to the fractures formed during the process of coalification, where the gelatinization components of coal undergo compaction, dehydration, and devolatilization, leading to matrix shrinkage and the formation of fractures [42,43]. Exogenous fractures, on the other hand, are those formed in coal seams after formation due to tectonic influences. The development of fractures is typically characterized by macroscopic fracture features observed from core samples and microscopic fracture features identified using an optical microscope at China University of Geosciences (Beijing, China) using a microscope made by Zeiss (Oberkochen, Germany). In this study, macroscopic fracture statistics were conducted on selected cores from the deep 8# coal in six wells. The observations indicate that the deep 8# coal in the J2 well is significantly affected by tectonic forces, resulting in a fractured coal structure with a high macroscopic fracture density averaging about 18 fractures per 5 cm. Moreover, the fractures in J2 exhibit a curved and even spiral extension. In the other wells, the deep 8# coal is predominantly composed of primary structure coal, with varying degrees of macroscopic fracture development. Multiple sets of fractures are observed, with an average fracture density ranging from 5 to 10 fractures per 5 cm. In some areas, the density of fractures in the semi-bright coal or bright coal can reach a maximum of 20 fractures per 5 cm, and some fractures are filled with calcite veins.
Microscopic fractures can be classified into four types based on their width and extension length: type A (width ≥ 5 μm and length ≥ 10 mm, good continuity, extensive extension), type B (width ≥ 5 μm and length < 10 mm, similar to the main part of a tree branch-like fracture), type C (width < 5 μm and length ≥ 300 μm, relatively thin, extensive extension), and type D (width < 5 μm and length < 300 μm, poor directional and connectivity characteristics). The identification and classification of microscopic fractures in the deep 8# coal in wells J2 and J5 were conducted, and the statistical results are presented in Figure 11a.
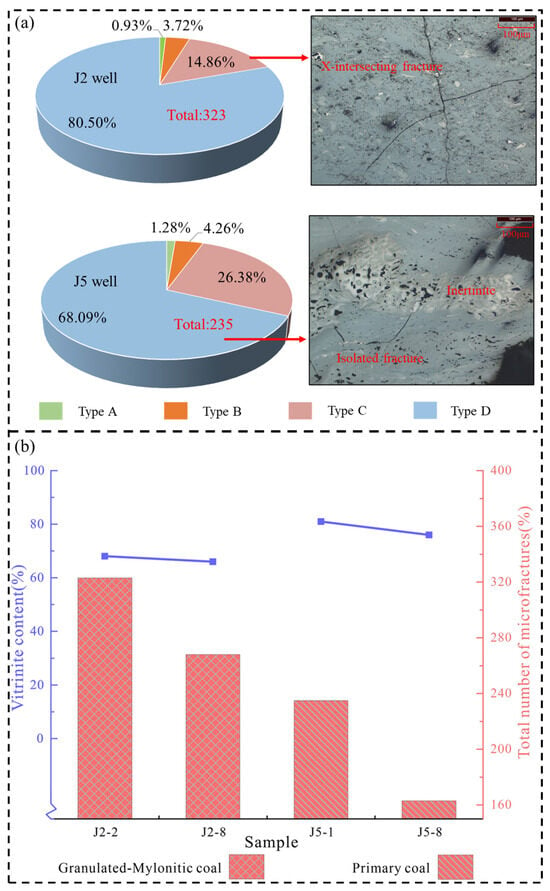
Figure 11.
The development of microfractures and its influencing factors. Percentage of different types of microfractures and typical morphological characteristics of type C and type D; (a) the relationship between microfracture density with coal structure and Vitrinite content (b).
Due to the influence of the coal body structure, the microscopic fracture density in the deep 8# coal of the J2 well is 323 fractures/9 cm2 and 268 fractures/9 cm2, while in the deep 8# coal of the J5 well, the microscopic fracture density is only 235 fractures/9 cm2 and 163 fractures/9 cm2. Microscopic fractures in the coal are predominantly of type D, with a higher proportion in the J2 well, indicating that coal body structure is an important factor influencing the development of coal fractures. Additionally, the morphology of microscopic fractures is mainly characterized by dendritic-netted, X-intersecting, or isolated patterns, predominantly developed in Vitrinite-rich groups. There is a positive correlation between the development density and the Vitrinite content in these groups (Figure 11b). This is because during the coalification process, Vitrinite undergoes more dehydration, resulting in higher fluid pressure in the developed pores, noticeable matrix contraction, and weaker mechanical strength, making it prone to fracture. In contrast, inertinite and exinite undergo less dehydration, have greater mechanical strength, and are less prone to fracture [44]. Despite the predominance of type D microscopic fractures in coal, their high development density lays the foundation for the formation of a complex network of pores and fractures during fracturing.
4.2.2. Fracture Connectivity Analysis
Fractures, as crucial pathways for the migration and production of CBM, play a significant role in determining the effectiveness of hydraulic fracturing and extraction efficiency [45]. To clarify the distribution characteristics of micrometer-scale fractures in the deep 8# coal reservoir, this study employed X-ray μ-CT scanning technology (with a scanning accuracy of 22 μm) at Kezheng Testing (Suzhou, China) Co., Ltd. for three-dimensional reconstruction analysis of the development and connectivity of micrometer-scale fractures in coal.
The reconstructed results reveal that in the J2 well, the deep 8# coal, influenced by the coal body structure, exhibits highly developed fractures with a volume percentage of 2.16% for fractures larger than 22 μm in a coal plug sample (25 mm × 25 mm). Additionally, these fractures demonstrate excellent connectivity, with connected fractures constituting over 80% of the total fractures, indicating outstanding connectivity. In contrast, the coal in the J5 well, primarily composed of original structures, shows fractures accounting for only 0.27% of the total reconstructed volume. However, connected fractures still constitute approximately 60% of the total fractures. In summary, the development and connectivity of fractures larger than 22 μm in the deep 8# coal reservoir are favorable, facilitating the permeation and production of CBM (Figure 12).
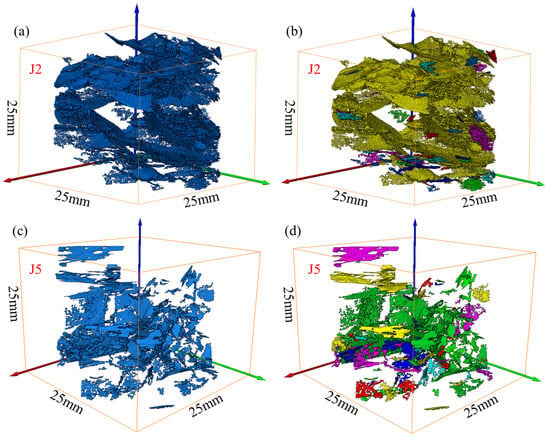
Figure 12.
Three-dimensional reconstruction model (a,c) of microfracture of deep 8# coal (resolution is 22 μm) and identification (b,d) of connecting fractures (fractures of the same color are connecting).
4.3. Permeability and Porosity of Deep Coal
The porosity and permeability of coal are crucial indicators for evaluating coal reservoir properties. In this study, deep 8# coal plug samples (25 mm × 50 mm) were subjected to a maximum confining pressure of 40 MPa to simulate the stress conditions under geological formations, aiming to obtain in-situ porosity and permeability of the coal reservoir. Under overburden conditions, as the confining pressure increases, both coal permeability and porosity gradually decrease. The strong compressibility of coal matrix and well-developed fractures lead to a rapid decline in permeability and porosity during the initial stage of confining pressure loading due to the combined effects of matrix compression and fracture closure. However, as the confining pressure further strengthens, the rate of decline in permeability and porosity gradually slows down until it reaches a plateau. At the maximum confining pressure, the permeability of the deep 8# coal ranges from 0.0054 mD to 0.0163 mD, and the porosity varies from 1.72% to 2.69%. The permeability decreases with porosity in a power-law form (Figure 13). The original reservoir pressure is 24–30 MPa, corresponding to permeability and porosity values of 0.0330–0.0700 mD and 2.19–3.29%, respectively. This is comparable to the permeability (0.0150–0.0535 mD) and porosity (3.13–5.39%) of nearby blocks that have achieved preliminary commercial exploitation, indicating a promising development outlook for CBM. Moreover, the deep 8# coal sample in the J5 well, with numerous cracks generated during the drying process before the experiment, does not reach the minimum permeability and porosity even under a confining pressure of 40 MPa. As the confining pressure decreases, the permeability gradually increases, but it cannot recover to the permeability value during the loading process. In other words, loading and unloading processes result in a certain loss of permeability due to the plastic deformation of coal.
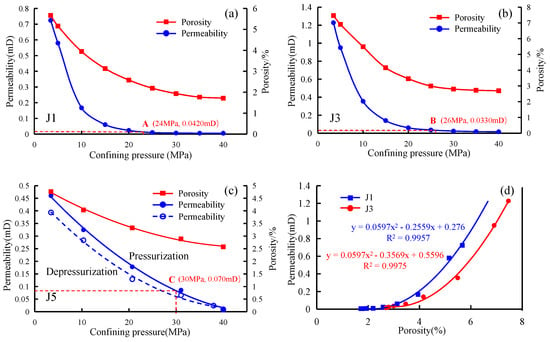
Figure 13.
The variation characteristics of permeability and porosity with confining pressure (a–c) and the relationship between permeability and porosity (d). The A, B, and C points represent the permeability characteristics of deep 8# coal under the original formation pressure.
5. Gas-Bearing Characteristics and Development Potential Evaluation
5.1. Gas Content and Adsorption Behaviors Characteristics
The gas content characteristics of coal reservoirs are crucial elements for CBM accumulation and play a significant role in assessing development potential, delineating favorable areas, and formulating development strategies. These characteristics encompass not only the gas content of coal seams but also the evaluation of the adsorption performance of coal.
The adsorption performance of coal is a crucial parameter for quantitatively evaluating the coal seam gas storage capacity, and high-temperature, high-pressure isothermal adsorption experiments provide a direct means to understand the adsorption capacity of coal [46,47]. In this study, high-temperature (70–85 °C) and high-pressure (30 MPa) isothermal adsorption experiments were conducted on the deep 8# coal from wells J2, J5, and J6, with temperature and pressure settings based on the original geological conditions. The Langmuir volume (VL) of the deep 8# coal ranges from 12.36 cm3/g to 25.06 cm3/g, averaging at 20.78 cm3/g, and the Langmuir pressure (PL) ranges from 1.9 MPa to 4.17 MPa, averaging at 2.74 MPa (Figure 14a–c). The adsorption capacity of 8# coal in the J2 and J5 wells is strong, with an average maximum adsorption capacity of 23.69 cm3/g, and the VL of coal within the same well is similar. As burial depth increases, the positive effect of increased Ro,max on adsorption capacity is weaker than the negative effect of rising reservoir temperature, resulting in weaker adsorption capacity of coal at deeper coal seams. There is a significant difference in the adsorption capacity of coal at various locations in the J6 well, and under the same temperature, the VL of coal is lower than that of 8# coal in the J2 well, which is because the ash in coal is also an important factor affecting the adsorption capacity of coal. Ash cannot adsorb CH4, so as its content increases, the adsorption capacity of coal for methane decreases. That is, there is a negative correlation between the adsorption amount of coal in CH4 and Aad (Figure 14d). Additionally, the PL of coal gradually increases with increasing burial depth, indicating that as coal seams are buried deeper, gas appears faster during the process of dewatering and pressure reduction, which is beneficial for the development of deep CBM.
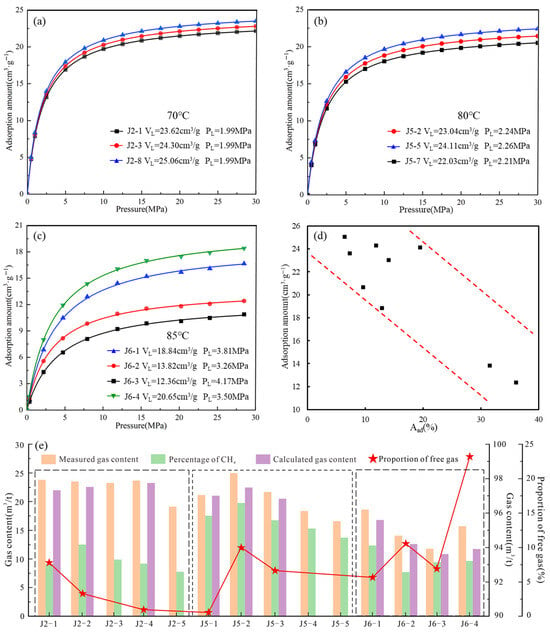
Figure 14.
The isothermal adsorption curves of deep coal in a typical well (a–c), the relationship between adsorption volume of CH4 and Aad (d), the characteristics of gas content and methane proportion, and the comparison between measured gas content and theoretical gas content (e).
Gas content tests were conducted in three wells using different coring methods, including conventional coring (J6 well), sealed coring (J5 well), and pressure-maintenance coring (J2 well). The desorption results indicate that the total gas content in the coal seams of the three wells ranges from 11.71 m3/t to 24.93 m3/t, with an average of 19.83 m3/t, indicating the 8# coal seam has commercial exploitation potential. Vertically, the deep 8# coal in J2 and J5 wells shows lower gas content at the bottom and higher at the top, which is attributed to higher clay content at the bottom of the coal seam during sedimentary evolution, leading to lower gas generation capacity. Additionally, the free gas in the deep coal migrates upward, causing gas accumulation in the top coal seams, resulting in higher gas content at the top (Figure 14e).
Furthermore, based on the isothermal adsorption experiments of coal at different temperatures, it was established that the VL and PL exhibit an exponential functional relationship with experimental temperature. By integrating the measured geothermal gradients and reservoir pressure gradients in the study area, a theoretical model for calculating CBM adsorption capacity was developed using the Langmuir equation. The variation characteristics of theoretical adsorption capacity with burial depth in the deep 8# coal seam were determined. Additionally, incorporating previous isothermal adsorption test results under in-situ temperature and reservoir pressure conditions of the deep 8# coal seam from other wells in the study area, the variation patterns of adsorbed gas content with burial depth in the deep 8# coal seam of the Yulin region were elucidated (Figure 15). The results show that as the burial depth of the coal seam increases, there exists a critical depth for deep gas content in the study area. By combining the adsorbed gas content and total gas content, it is determined that the critical depth lies between 2400 and 2600 m. Above the critical depth, reservoir pressure plays a dominant role in the occurrence state of gas. However, below the critical depth, the influence of reservoir temperature becomes stronger, which is consistent with previous analysis.
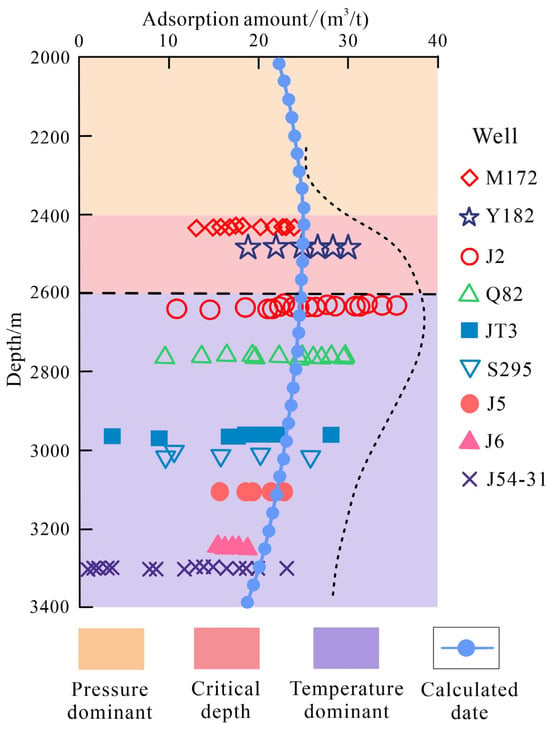
Figure 15.
The various total gas contents, theoretical adsorption amounts with buried depth, and critical deep divisions of the deep 8# coal seam [48].
Gas composition test results indicate that methane content in coal seam gas ranges from 10.83 m3/t to 24.23 m3/t, with a volume fraction of 92.57% to 95.59%, averaging at 94.06%. This suggests a dry gas reservoir with trace amounts of heavier hydrocarbons and a small quantity of non-hydrocarbon gases. Additionally, the methane proportion in the gas samples taken at different time intervals during the desorption process generally exhibits an initial increase followed by a decrease. This trend is attributed to the initial low methane content due to the introduction of air during the loading process. As the desorption progresses, gases are gradually expelled, leading to an increase in methane proportion. However, as the desorption process continues, heavier gases like CO2 and N2 are expelled, causing the methane proportion to decrease again (Figure 16).
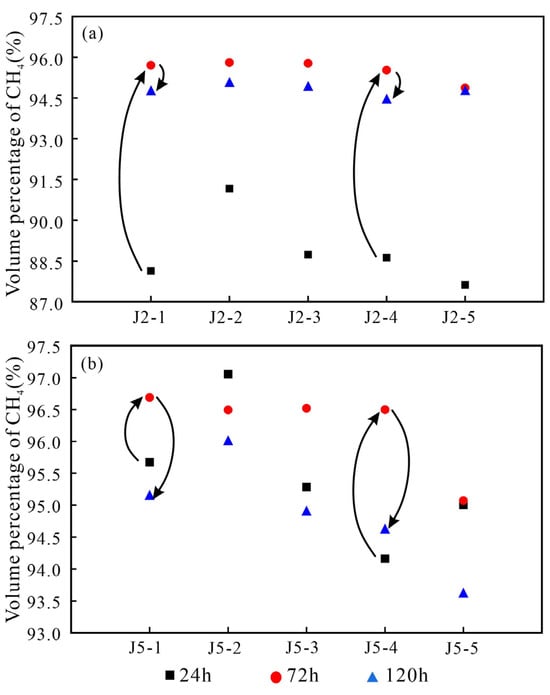
Figure 16.
Variation characteristics of CH4 content in CBM during desorption process (24 h, 72 h, and 120 h) of the deep 8# coal of the Benxi Formation in J2 (a) and J5 (b) wells.
Carbon and hydrogen isotopes are crucial indicators for analyzing the origin of CBM. The δ13C of methane in the J2 well coal seam gas ranges from −30.7‰ to −21.0‰, with an average of −26.36‰, and the δD values range from −163.8‰ to −155.7‰, averaging at −161.35‰. This categorizes the gas as thermogenic, aligning with the degree of metamorphism in the 8# coal. However, compared to the J5 well (3100 m), the J2 well (2600 m) coal seam exhibits lighter carbon isotopes, consistent with the pattern of increasing isotopic values with burial depth.
5.2. Development Potential Analysis and Evaluation
The development potential of coal reservoirs is comprehensively determined by resource conditions, preservation conditions, and reservoir adaptability, where resource conditions form the material basis for the productivity of CBM wells, preservation conditions are prerequisites for the preservation of coal seam gas reservoirs, and reservoir adaptability is closely related to coal seam gas engineering development, directly influencing development efficiency [49,50]. We employed an analogical method to estimate the total amount of CBM resources in the deep 8# coal reservoir and investigate the characteristics of deep coal reservoirs in pilot test areas for deep CBM, such as the Daning–Jixian Block, Linxing Block (east of Ordos basin), and Baijiahai Block (Junggar basin) (Table 4), from resource conditions, preservation conditions, and reservoir modifiability aspects. Based on the characteristics of deep coal reservoirs in the Yulin area, a comprehensive analysis of its development potential and favorable intervals was conducted. The estimation results show that the total amount of CBM resources in deep 8# coal in Yulin area is approximately 2.77 trillion cubic meters.

Table 4.
The evaluation parameters for the exploration and development potential of the deep CBM development pilot areas (Daning–Jixian block, Linxing block in the astern Ordos basin, and Baijiahai uplift in the Junggar basin).
The deep 8# coal seam in the Yulin area was formed in a lagoon environment during the regression cycle of a transgressive-regressive sequence under a marine-terrestrial transitional setting. As the transgression progressed, during the maximum flooding surface interval, lagoon deposits predominantly developed on the landward side of the sand barrier. During the regression period, the sand barrier acted as a dam, allowing the vegetation accumulation rate and water depth changes in the lagoon to reach equilibrium, leading to large-scale coal accumulation. Subsequently, with the rise in sea level, hydrodynamic conditions weakened, and organic matter was gradually covered by mudstone or limestone, initiating the coalification process (Figure 17a). As the main coal seam, 8# coal is widely and stably distributed, exhibiting a thick central–western region and thinning towards both ends, with an average thickness of 6.18 m, which provides a rich material basis for the generation and accumulation of CBM (Figure 17b).
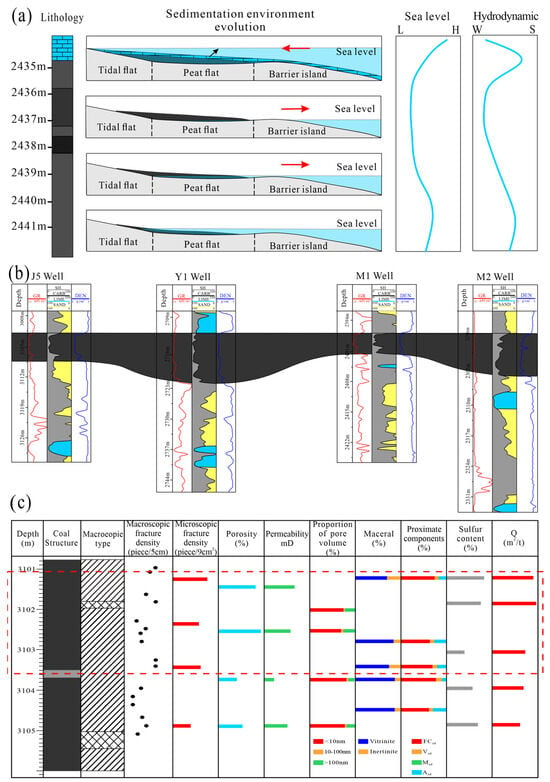
Figure 17.
Accumulation mode, changes in sea level, and hydrodynamics of deep 8# coal in the J1 well (a); the east–west coal seam connecting well profile (b); the coal quality, physical properties, gas-bearing intra-layer variation characteristics, and favorable intervals of 8# coal reservoir in the J5 well (c).
Comparing with the deep coal seam gas pilot zones, in terms of resource conditions, the thickness of the deep 8# coal reservoir in the research area is slightly thicker than in Daning–Jixian and Linxing blocks, comparable to Baijiahai uplift, indicating a more substantial material foundation [59]. The degree of coal metamorphism and Vitrinite content are higher than in Linxing and Baijiahai uplift but lower than in Daning–Jixian, resulting in inferior gas content and coal adsorption capacity compared to Daning–Jixian, similar to Linxing, and better than Baijiahai uplift. Resource conditions are relatively abundant. Regarding preservation conditions, the coal reservoir in the research area is buried deeper, increasing drilling difficulty; however, the higher temperature and pressure provide conditions for increased free gas [60]. The sealing capacity of the coal roof is similar to that of Daning-Jixian, and it is stronger than the other two blocks, effectively sealing free gas in the coal reservoir. In terms of adaptability for redevelopment, the targeted coal beds in all four blocks are primarily composed of sub-bituminous to bituminous coal, with favorable structures for the development of fractures, coal seam gas migration, and the formation of volumetric fracturing networks [61]. Linxing has a shallower burial depth, while Baijiahai uplift has a higher coal rank, resulting in higher porosity and permeability. In the research area, porosity and permeability are similar to those of Daning–Jixian, suggesting that the deep coal reservoir in the research area has strong adaptability for commercial development. There are significant differences in coal reservoir characteristics along the vertical direction, but the macro and micro fractures in the middle and upper sections of the coal seam are more developed, resulting in better pore permeability. With a higher proportion of meso-macropores and a material composition that is more favorable for the generation and storage of CBM, these sections exhibit higher gas content, making them a favorable layer for deep 8# coal (Figure 17c). Overall, the scaled development of the deep 8# coal seam gas reservoir in Yulin, Ordos basin, holds promising prospects.
6. Conclusions
A detailed analysis of the geological properties of the deep 8# coal reservoir in Yulin, Ordos basin, was conducted, focusing on coal quality characteristics, gas-bearing characteristics, pore–fracture structure development, and pore–permeability patterns. A comprehensive evaluation of the development prospects of the deep 8# coal seam gas reservoir in the research area was carried out by comparing it with the deep coal seam gas development pilot zone. The main conclusions are as follows:
- The pores in the deep 8# coal are mostly closed-end slit/parallel plate-shaped pores and open-type breathable pores, which are conducive to the desorption and production of CBM. Micro-pores of <2 nm are the most developed, and the increase in pore volume shows an ‘N’ shaped change. The total pore volume of coal first increases, then decreases, and then increases with burial depth, but the proportion of micro-pores with a size of <2 nm gradually increases. The full-scale pore heterogeneity (fractal dimension) increases from 2.6829 to 2.7302 with increasing burial depth.
- Fractures are well-developed in coal reservoirs, with macroscopic fractures mostly found in bright coal bands, which are significantly influenced by tectonic movements. Microscopic fractures are more developed in Vitrinite-rich bands with higher dehydration and obvious matrix shrinkage. There is a positive correlation between fracture density and Vitrinite content. Three-dimensional reconstruction results indicate good fracture connectivity (>60%), facilitating the permeation and production of coal seam gas.
- The permeability and porosity of coal decrease with increasing confining pressure and undergo irreversible damage due to plastic deformation. Under reservoir conditions, the porosity (1.72% to 2.69%) and permeability (0.0054 mD to 0.0163 mD) of the 8# coal are comparable to those in the Daning–Jixian block. The coal seam has a high gas content (11.71 m3/t to 24.93 m3/t) but is mostly in a supersaturated state, with a significant proportion of free gas, demonstrating good development prospects. During the desorption process, the methane volume proportion initially increases and then decreases, with carbon isotope ratios gradually increasing with burial depth.
- There is a critical depth of gas-bearing characteristics in deep CBM reservoirs, which is between 2400 and 2600 m. Comparative results of resource conditions, preservation conditions, and reservoir adaptability show that the development potential of the deep 8# coal seam gas reservoir in the research area is comparable to that of the Linxing block but weaker than that of the Daning–Jixian block and Baijiahai uplift. Vertically, the upper and middle parts of the coal seam are favorable intervals, and overall, it exhibits promising prospects for scaled development.
Author Contributions
Conceptualization, X.F.; Methodology, Y.C.; Investigation, X.F.; Resources, Y.C.; Writing—original draft, X.F.; Writing—review & editing, F.Q., L.S., Z.H. and Z.L.; Supervision, Y.C.; Funding acquisition, L.S. and Y.C. All authors have read and agreed to the published version of the manuscript.
Funding
This work was funded by National Key R&D Program of China (Grant no. 2024YFC2909400, 2023YFC3009004), National Natural Science Foundation of China (Grant no. 42130806, 42372195, 42402180, 52174187, 52304224), Scientific Research Innovation Capability Support Project for Young Faculty (Grant no. ZYGXQNJSKYCXNLZCXM-E14), the Fundamental Research Funds for the Central Universities (Grant no. 2652023001) and Science and Technology Innovation Teams of Shanxi Province (Grant no. 202304051001028).
Data Availability Statement
The data are included in the article.
Conflicts of Interest
The authors declare that they have no known competing financial interests or personal relationships that could have appeared to influence the work reported in this paper.
References
- Zhai, C.; Yu, X.; Xiang, X.; Li, Q.; Wu, S.; Xu, J. Experimental study of pulsating water pressure propagation in CBM reservoirs during pulse hydraulic fracturing. J. Nat. Gas Sci. Eng. 2015, 25, 15–22. [Google Scholar] [CrossRef]
- Zhang, X.D.; Du, Z.G.; Li, P.P. Physical characteristics of high-rank coal reservoirs in different coal-body structures and the mechanism of coalbed methane production. Sci. China Earth Sci. 2017, 60, 246–255. [Google Scholar] [CrossRef]
- Lu, W.; Chen, X.; Ho, D.C.W.; Wang, H. Recent advances and prospects in polymeric nanofluids application for enhanced oil recovery. J. Ind. Eng. Chem. 2018, 66, 1306. [Google Scholar] [CrossRef]
- Li, S.; Tang, S.H.; Pan, Z.J.; Xu, H.; Tao, S.; Liu, Y.F.; Ren, P.F. Geological conditions of deep coalbed methane in the eastern margin of the Ordos Basin, China: Implications for coalbed methane development. J. Nat. Gas. Sci. Eng. 2018, 53, 394–402. [Google Scholar] [CrossRef]
- Li, G.Y.; Yao, Y.B.; Wang, H.; Meng, L.; Li, P.; Zhang, Y.; Wang, Y.; Ma, L. Geological characteristics and development potential of deep CBM resources in Shenmu–Jiaxian Block, Ordos Basin, China. Coal Geol. Explor. 2023, 52, 70–80. (In Chinese) [Google Scholar] [CrossRef]
- Wang, T.; Tian, F.; Deng, Z.; Hu, H. The characteristic development of micropores in deep coal and its relationship with adsorption capacity on the eastern margin of the Ordos Basin, China. Minerals 2023, 13, 302. [Google Scholar] [CrossRef]
- Zhang, L.; Bian, L.H.; Hou, W.; Li, Y.; Li, Y.; Wu, P.; Li, W.; Li, X.; Li, C. Pore structure characteristics and exploration significance of deep coal reservoirs: A case study of Daning–Jixian block in the eastern margin of Ordos Basin. Acta Pet. Sin. 2023, 44, 1867–1878. (In Chinese) [Google Scholar] [CrossRef]
- Li, S.; Tang, D.Z.; Pan, Z.J.; Xu, H.; Huang, W. Characterization of the stress sensitivity of pores for different rank coals by nuclear magnetic resonance. Fuel 2013, 111, 746–754. [Google Scholar] [CrossRef]
- Wu, S.; Tang, D.; Li, S.; Wu, H.; Hu, X.; Zhu, X. Effects of geological pressure and temperature on permeability behaviors of middle-low volatile bituminous coals in eastern Ordos Basin, China. J. Pet. Sci. Eng. 2017, 153, 372–384. [Google Scholar] [CrossRef]
- Ma, D.; Miao, X.X.; Chen, Z.Q.; Mao, X.B. Experimental investigation of seepage properties of fractured rocks under different confining pressures. Rock Mech. Rock Eng. 2013, 46, 1135–1144. [Google Scholar] [CrossRef]
- Li, S.; Qin, Y.; Tang, D.; Shen, J.; Wang, J.; Chen, S. A comprehensive review of deep CBM and recent developments in China. Int. J. Coal Geol. 2023, 279, 104369. [Google Scholar] [CrossRef]
- Liu, A.; Fu, X.; Wang, K.; An, H.; Wang, G. Investigation of CBM potential in low-rank coal reservoirs –free and soluble gas contents. Fuel 2013, 112, 14–22. [Google Scholar] [CrossRef]
- Liu, D.; Jia, Q.; Cai, Y.; Gao, C.; Qiu, F.; Zhao, Z.; Chen, S. A new insight into CBM occurrence and accumulation in the Qinshui Basin, China. Gondwana Res. 2022, 111, 280–297. [Google Scholar] [CrossRef]
- Gao, P.; Xiao, X.; Hu, D.; Lash, G.G.; Liu, R.; Cai, Y.; Wang, Z.; Zhang, B.; Yuan, T.; Liu, S. Effect of silica diagenesis on porosity evolution of deep gas shale reservoir of the Lower Paleozoic Wufeng-Longmaxi formations, Sichuan Basin. Mar. Pet. Geol. 2022, 145, 105873. [Google Scholar] [CrossRef]
- Wang, J.M.; Wang, J.Y. Low-amplitude structures and oil-gas enrichment on the Yishaan Slope, Ordos Basin. Pet. Explor. Dev. 2013, 40, 52–60. [Google Scholar] [CrossRef]
- Chen, Y.; Tang, D.; Xu, H.; Li, Y.; Meng, Y. Structural controls on CBM accumulation and high production models in the eastern margin of Ordos Basin, China. J. Nat. Gas Sci. Eng. 2015, 23, 524–537. [Google Scholar] [CrossRef]
- Zhang, R.; Wang, P.; Cheng, Y.; Shu, L.; Liu, Y.; Zhang, Z.; Zhou, H.; Wang, L. A new technology to enhance gas drainage in the composite coal seam with tectonic coal sublayer. J. Nat. Gas Sci. Eng. 2022, 106, 104760. [Google Scholar] [CrossRef]
- Xu, H.; Tang, D.; Liu, D.; Tang, S.; Yang, F.; Chen, X.; He, W.; Deng, C. Study on CBM accumulation characteristics and favorable areas in the Binchang area, southwestern Ordos Basin, China. Int. J. Coal Geol. 2012, 95, 1–11. [Google Scholar] [CrossRef]
- Cao, D.; Wang, A.; Ning, S.; Li, H.; Guo, A.; Chen, L.; Liu, K.; Tan, J.; Zheng, Z. Coalfield structure and structural controls on coal in China. Int. J. Coal Sci. Technol. 2020, 7, 220–239. [Google Scholar] [CrossRef]
- Zhang, Y.; Li, S.; Tang, D.; Liu, J.; Lin, W.; Feng, X.; Ye, J. Geological and engineering controls on the differential productivity of CBM wells in the Linfen block, southeastern Ordos Basin, China: Insights from geochemical analysis. J. Pet. Sci. Eng. 2022, 211, 110159. [Google Scholar] [CrossRef]
- Guan, Y.; Guo, Q.; Pu, R.; Gao, X.; Chen, S.; Ji, T. Distribution of upper paleozoic coal seams in the southeastern Ordos Basin. Energies 2022, 15, 5110. [Google Scholar] [CrossRef]
- Niu, X.B.; Zhao, W.B.; Shi, Y.H.; Hu, X.; Du, X. Natural gas accumulation conditions and exploration potential of Benxi Formation in Ordos Basin. Acta Pet. Sin. 2023, 44, 1240–1257. [Google Scholar] [CrossRef]
- Wang, X.; Pan, J.; Wang, K.; Mou, P.; Li, J. Fracture variation in high–rank coal induced by hydraulic fracturing using X–ray computer tomography and digital volume correlation. Int. J. Coal Geol. 2020, 252, 103942. [Google Scholar] [CrossRef]
- Mishra, D.P.; Verma, S.K.; Bhattacharjee, R.M.; Upadhyay, R.; Sahu, P. Geological and microstructural characterisation of coal seams for methane drainage from underground coal mines. Bull. Eng. Geol. Environ. 2023, 82, 341. [Google Scholar] [CrossRef]
- Palmer, I. CBM completions: A world view. Int. J. Coal Geol. 2010, 82, 184–195. [Google Scholar] [CrossRef]
- Salmachi, A.; Rajabi, M.; Reynolds, P.; Yarmohammadtooski, Z.; Wainman, C. The effect of magmatic intrusions on CBM reservoir characteristics: A case study from the Hoskissons coalbed, Gunnedah Basin, Australia. Int. J. Coal Geol. 2016, 165, 278–289. [Google Scholar] [CrossRef]
- Song, D.; Wang, T.; Li, P.; Yan, J.; Zheng, X. Petrology and geochemistry of the Carboniferous cutinite-rich coals from the Hequ area of Shanxi Province, China. Sci. China Earth Sci. 2022, 65, 2018–2032. [Google Scholar] [CrossRef]
- Hou, H.H.; Shao, L.Y.; Tang, Y.; Li, Z.; Zhao, S.; Yao, M.; Wang, X.; Zhang, J. Pore structure characterization of middle and high ranked coal reservoirs in northern China. AAPG Bull. 2023, 107, 213–241. [Google Scholar] [CrossRef]
- Cai, Y.; Liu, D.; Pan, Z.; Yao, Y.; Li, J.; Qiu, Y. Pore structure and its impact on CH4 adsorption capacity and flow capability of bituminous and subbituminous coals from Northeast China. Fuel 2013, 103, 258–268. [Google Scholar] [CrossRef]
- Zhang, D.; Li, C.; Zhang, J.; Lun, Z.; Jia, S.; Luo, C.; Jiang, W. Influences of dynamic entrainer–blended supercritical CO2 fluid exposure on high–pressure methane adsorption on coals. J. Nat. Gas Sci. Eng. 2019, 66, 180–191. [Google Scholar] [CrossRef]
- Lu, Y.; Wang, L.; Ge, Z.; Zhou, Z.; Deng, K.; Zuo, S. Fracture and pore structure dynamic evolution of coals during hydraulic fracturing. Fuel 2020, 259, 116272. [Google Scholar] [CrossRef]
- Zhao, Y.; Zhao, Y.; Liu, J.; Wei, M.; Cui, D.; Gao, S. Coal permeability behaviors and non–uniform deformations under various boundary conditions: Part 1–experimental observations. Fuel 2023, 341, 127649. [Google Scholar] [CrossRef]
- Yan, J.W.; Meng, Z.P.; Zhang, K.; Yao, H.; Hao, H. Pore distribution characteristics of various rank coals matrix and their influences on gas adsorption. J. Pet. Sci. Eng. 2020, 189, 107041. [Google Scholar] [CrossRef]
- Wen, H.-T.; Yang, R.-Y.; Jing, M.-Y.; Huang, Z.-W.; Hong, C.-Y.; Chen, J.-X.; Cong, R.-C. Rock mechanical properties of coal in cryogenic condition. Pet. Sci. 2023, 20, 407–423. [Google Scholar] [CrossRef]
- Wang, T.; Deng, Z.; Hu, H.; Ding, R.; Tian, F.; Zhang, T.; Ma, Z.; Wang, D. Pore structure of deep coal of different ranks and its effect on coalbed methane adsorption. Int. J. Hydrogen Energy 2024, 59, 144–158. [Google Scholar] [CrossRef]
- Sing, K. Reporting physisorption data for gas/solid systems with special reference to the determination of surface area and porosity (Provisional). Pure Appl. Chem. 1982, 54, 2201–2218. [Google Scholar] [CrossRef]
- Guo, X.Q.; Yao, Y.B.; Liu, D.M. Characteristics of Coal Matrix Compressibility: An investigation by mercury intrusion porosimetry. Energy Fuels 2014, 28, 3673–3678. [Google Scholar] [CrossRef]
- Cai, Y.D.; Li, Q.; Liu, D.M.; Zhou, Y.; Lv, D. Insights into matrix compressibility of coals by mercury intrusion porosimetry and N2 adsorption. Int. J. Coal Geol. 2018, 200, 199–212. [Google Scholar] [CrossRef]
- Li, J.; Liu, D.; Yao, Y.; Cai, Y.; Guo, X. Physical characterization of the pore-fracture system in coals, Northeastern China. Energy Explor. Exploit. 2013, 31, 267–285. [Google Scholar] [CrossRef]
- Fu, H.; Tang, D.; Xu, T.; Xu, H.; Tao, S.; Li, S.; Yin, Z.; Chen, B.; Zhang, C.; Wang, L. Characteristics of pore structure and fractal dimension of low–rank coal: A case study of Lower Jurassic Xishanyao coal in the southern Junggar Basin, NW China. Fuel 2017, 193, 254–264. [Google Scholar] [CrossRef]
- Wang, F.M.; Li, S.F. Determination of the Surface Fractal Dimension for Porous Media by Capillary Condensation. Ind. Eng. Chem. Res. 1997, 36, 1609–1613. [Google Scholar] [CrossRef]
- Laubach, S.; Marrett, R.; Olson, J.; Scott, A. Characteristics and origins of coal cleat: A review. Int. J. Coal Geol. 1998, 35, 175–207. [Google Scholar] [CrossRef]
- Xin, F.; Fang, C.; Wang, S.; Xiong, B.; Cao, C.; Liu, D.; Tang, D.; Xu, H. Influence of composition on differential evolution of pore–fracture systems and micro–mechanical properties of lignite during drying–wetting cycles. Nat. Resour. Res. 2024, 33, 365–388. [Google Scholar] [CrossRef]
- Wang, A.; Wei, Y.; Yuan, Y.; Li, C.; Li, Y.; Cao, D. Coalbed methane reservoirs pore–structure characterization different macrolithotypes in the southern Junggar Basin of Northwest China. Mar. Pet. Geol. 2017, 86, 675–688. [Google Scholar] [CrossRef]
- Liu, S.-Q.; Sang, S.-X.; Hu, Q.-J.; Fang, H.-H. Characteristics of high-rank coal structure parallel and perpendicular to the bedding plane via NMR and X-ray CT. Pet. Sci. 2020, 17, 925–938. [Google Scholar] [CrossRef]
- Liu, J.; Kang, Y.; Chen, M.; You, L.; Cao, W.; Li, X. Effect of high-temperature treatment on the desorption efficiency of gas in coalbed methane reservoirs: Implication for formation heat treatment. Int. J. Hydrogen Energy 2022, 47, 10531–10546. [Google Scholar] [CrossRef]
- Li, H.; Chen, S.; Tang, D. Coal pore size distribution and adsorption capacity controlled by the coalification in China. Int. J. Hydrogen Energy 2024, 88, 594–603. [Google Scholar] [CrossRef]
- Li, S.G.; Wang, C.S.; Wang, H.N.; Wang, Y.; Xu, F.; Guo, Z.; Liu, X. Reservoir forming characteristics and favorable area evaluation of deep coalbed methane in Daning-Jixian Block. Coal Geo. Explor. 2022, 50, 59–67. (In Chinese) [Google Scholar] [CrossRef]
- Zhang, S.H.; Tang, S.H.; Qian, Z.; Pan, Z.; Guo, Q. Evaluation of geological features for deep CBM reservoirs in the Dacheng Salient, Jizhong Depression, China. Int. J. Coal Geol. 2014, 133, 60–71. [Google Scholar] [CrossRef]
- Wang, Y.J.; Liu, D.M.; Cai, Y.D.; Yao, Y.; Pan, Z. Constraining CBM reservoir petrophysical and mechanical properties through a new coal structure index in the southern Qinshui Basin, northern China: Implications for hydraulic fracturing. AAPG Bull. 2020, 104, 1817–1842. [Google Scholar] [CrossRef]
- Kang, S.Y.; Yan, X.; Huangfu, Y.H.; Zhang, B.; Deng, Z. Concept and main characteristics of deep oversaturated CBM reservoir. Acta Pet. Sin. 2023, 44, 1781–1790. (In Chinese) [Google Scholar] [CrossRef]
- Wang, C.W.; Zhen, H.B.; Chen, G.J.; Chen, C.; Zhang, Y. Assessment of coal No. 8 reservoir features and fracturability in Da’ning-Jixian block deep part. Coal Geol. China 2022, 34, 1674–1803. (In Chinese) [Google Scholar] [CrossRef]
- Xu, F.; Wang, C.; Xiong, X.; Li, S.; Wang, Y.; Guo, G.; Yan, X.; Chen, G.; Yang, Y.; Wang, H.; et al. Deep (layer) CBM reservoir forming modes and key technical countermeasures-Taking the eastern margin of Ordos Basin as an example. China Offshore Oil Gas 2022, 34, 30–42. (In Chinese) [Google Scholar] [CrossRef]
- Ni, X.M.; Wang, Y.B.; Han, W.L.; Liu, D.; Li, Y.; Tao, C.; Gao, X.; Yhao, S. Division and application of development geological units for CBM. J. China Coal Soc. 2020, 45, 2562–2574. (In Chinese) [Google Scholar] [CrossRef]
- Tao, C.Q.; Li, Y.; Wang, Y.B.; Ni, X.; Wu, X.; Yhao, S. Characteristics of deep coal reservoir and key control factors of CBM accumulation in Linxing Area. Energies 2023, 16, 6085. [Google Scholar] [CrossRef]
- Chen, G.; Qin, Y.; Hu, Z.G.; Li, W. Characteristics of reservoir assemblage of deep CBM-bearing system in Baijiahai dome of Junggar Basin. J. China Coal Soc. 2016, 41, 80–86. (In Chinese) [Google Scholar] [CrossRef]
- Yang, M.F.; Sun, B.; Lu, J.; Tian, W. Comparative analysis on the enrichment patterns of deep and shallow CBM in Junggar Basin. J. China Coal Soc. 2019, 44, 601–609. (In Chinese) [Google Scholar] [CrossRef]
- Yu, Y.J.; Wang, Y.H. Characteristics of low-rank coal reservoir and exploration potential in Junggar Basin: New frontier of low-rank CBM exploration in China. J. Pet. Explor. Prod. Technol. 2020, 10, 2207–2223. [Google Scholar] [CrossRef]
- Fu, X.; Meng, Y.; Li, Z.; Kong, P.; Chang, S.; Yan, T.; Liu, Y.; Liang, C. CBM Potential Evaluation and Development Sweet Spot Prediction Based on the Analysis of Development Geological Conditions in Yangjiapo Block, Eastern Ordos Basin, China. Geofluids 2021, 2021, 8728005. [Google Scholar] [CrossRef]
- Li, J.; Lu, S.; Zhang, P.; Cai, J.; Li, W.; Wang, S.; Feng, W. Estimation of gas-in-place content in coal and shale reservoirs: A process analysis method and its preliminary application. Fuel 2020, 259, 116266. [Google Scholar] [CrossRef]
- Fu, H.; Tang, D.; Xu, T.; Xu, H.; Tao, S.; Zhao, J.; Chen, B.; Yin, Z. Preliminary research on CBM enrichment models of low-rank coal and its geological controls: A case study in the middle of the southern Junggar Basin, NW China. Mar. Pet. Geol. 2017, 83, 97–110. [Google Scholar] [CrossRef]
Disclaimer/Publisher’s Note: The statements, opinions and data contained in all publications are solely those of the individual author(s) and contributor(s) and not of MDPI and/or the editor(s). MDPI and/or the editor(s) disclaim responsibility for any injury to people or property resulting from any ideas, methods, instructions or products referred to in the content. |
© 2025 by the authors. Licensee MDPI, Basel, Switzerland. This article is an open access article distributed under the terms and conditions of the Creative Commons Attribution (CC BY) license (https://creativecommons.org/licenses/by/4.0/).