

Hybrid Wind–Solar Generation and Analysis for Iberian Peninsula: A Case Study


Abstract
1. Introduction
2. Materials and Methods
2.1. Meteorological Data
2.2. Methodology
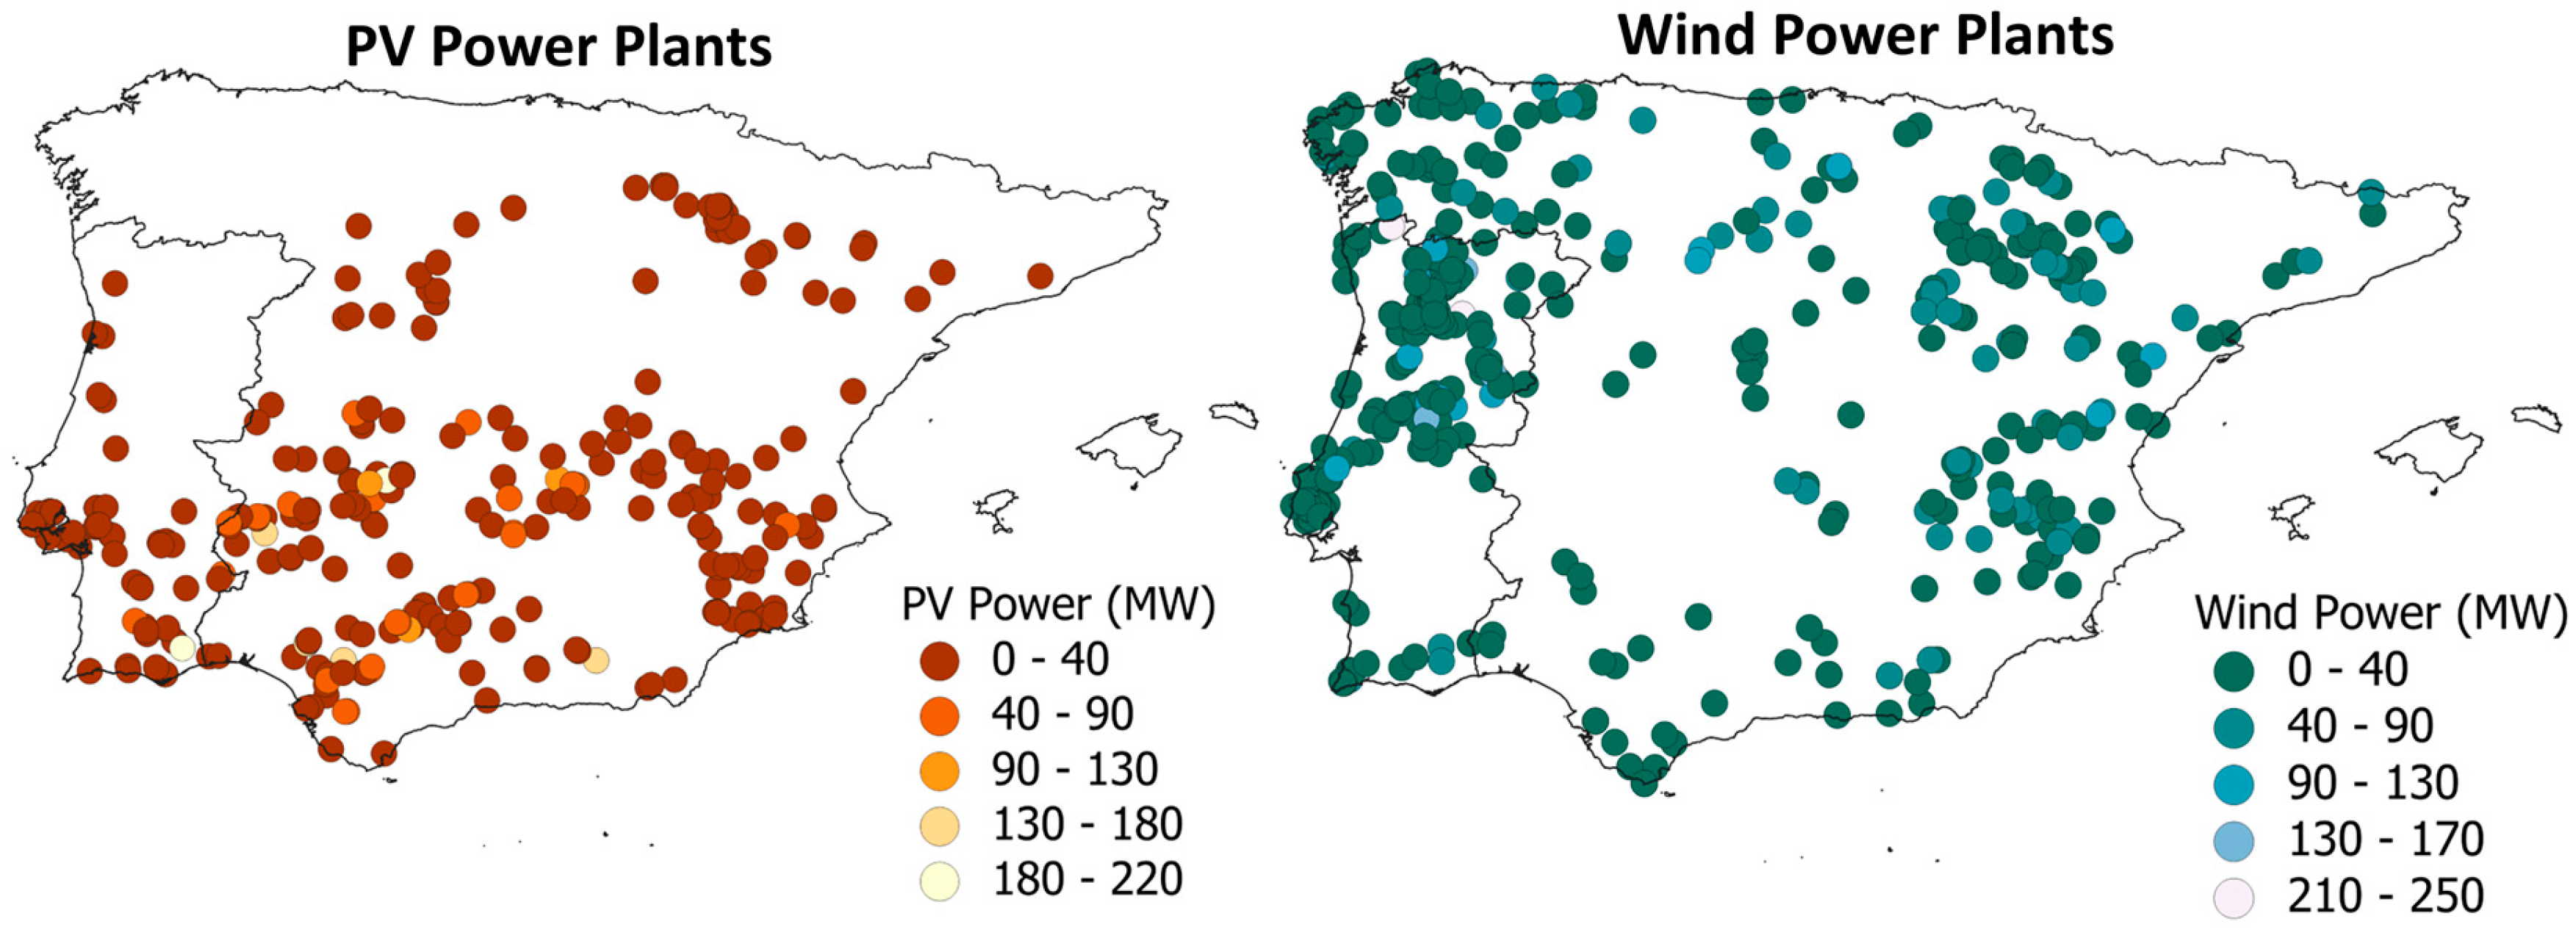
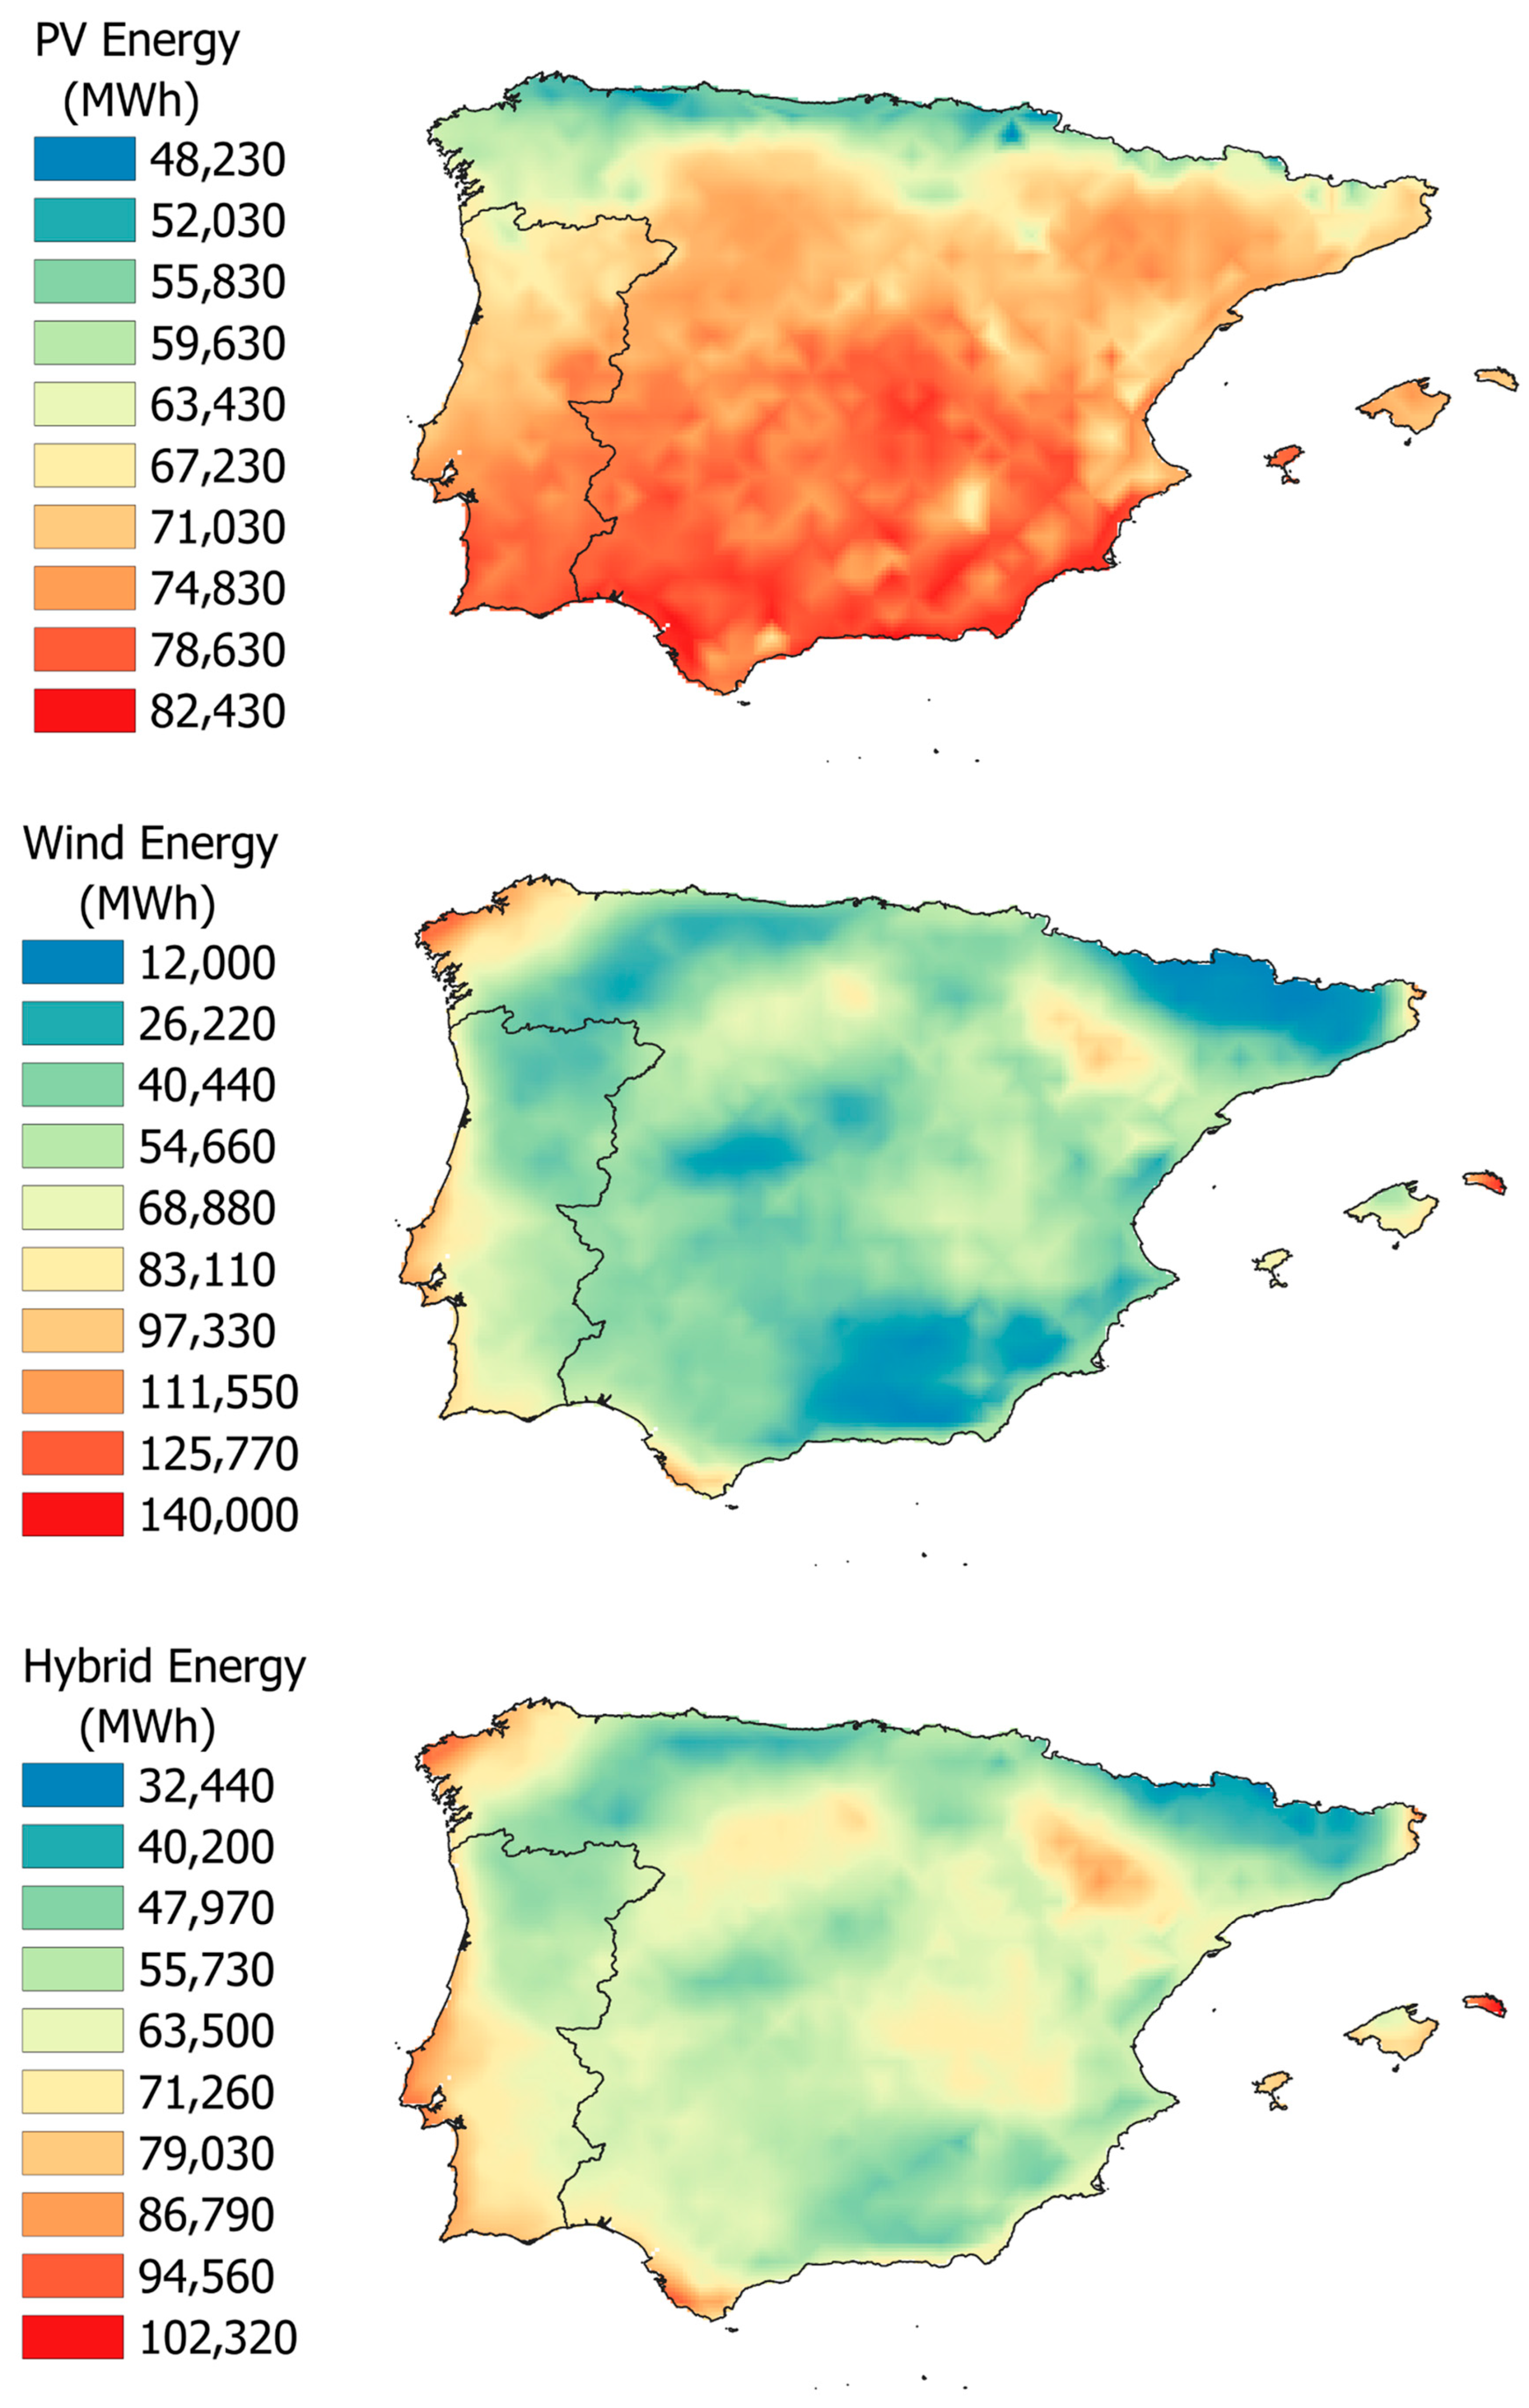
3. Results
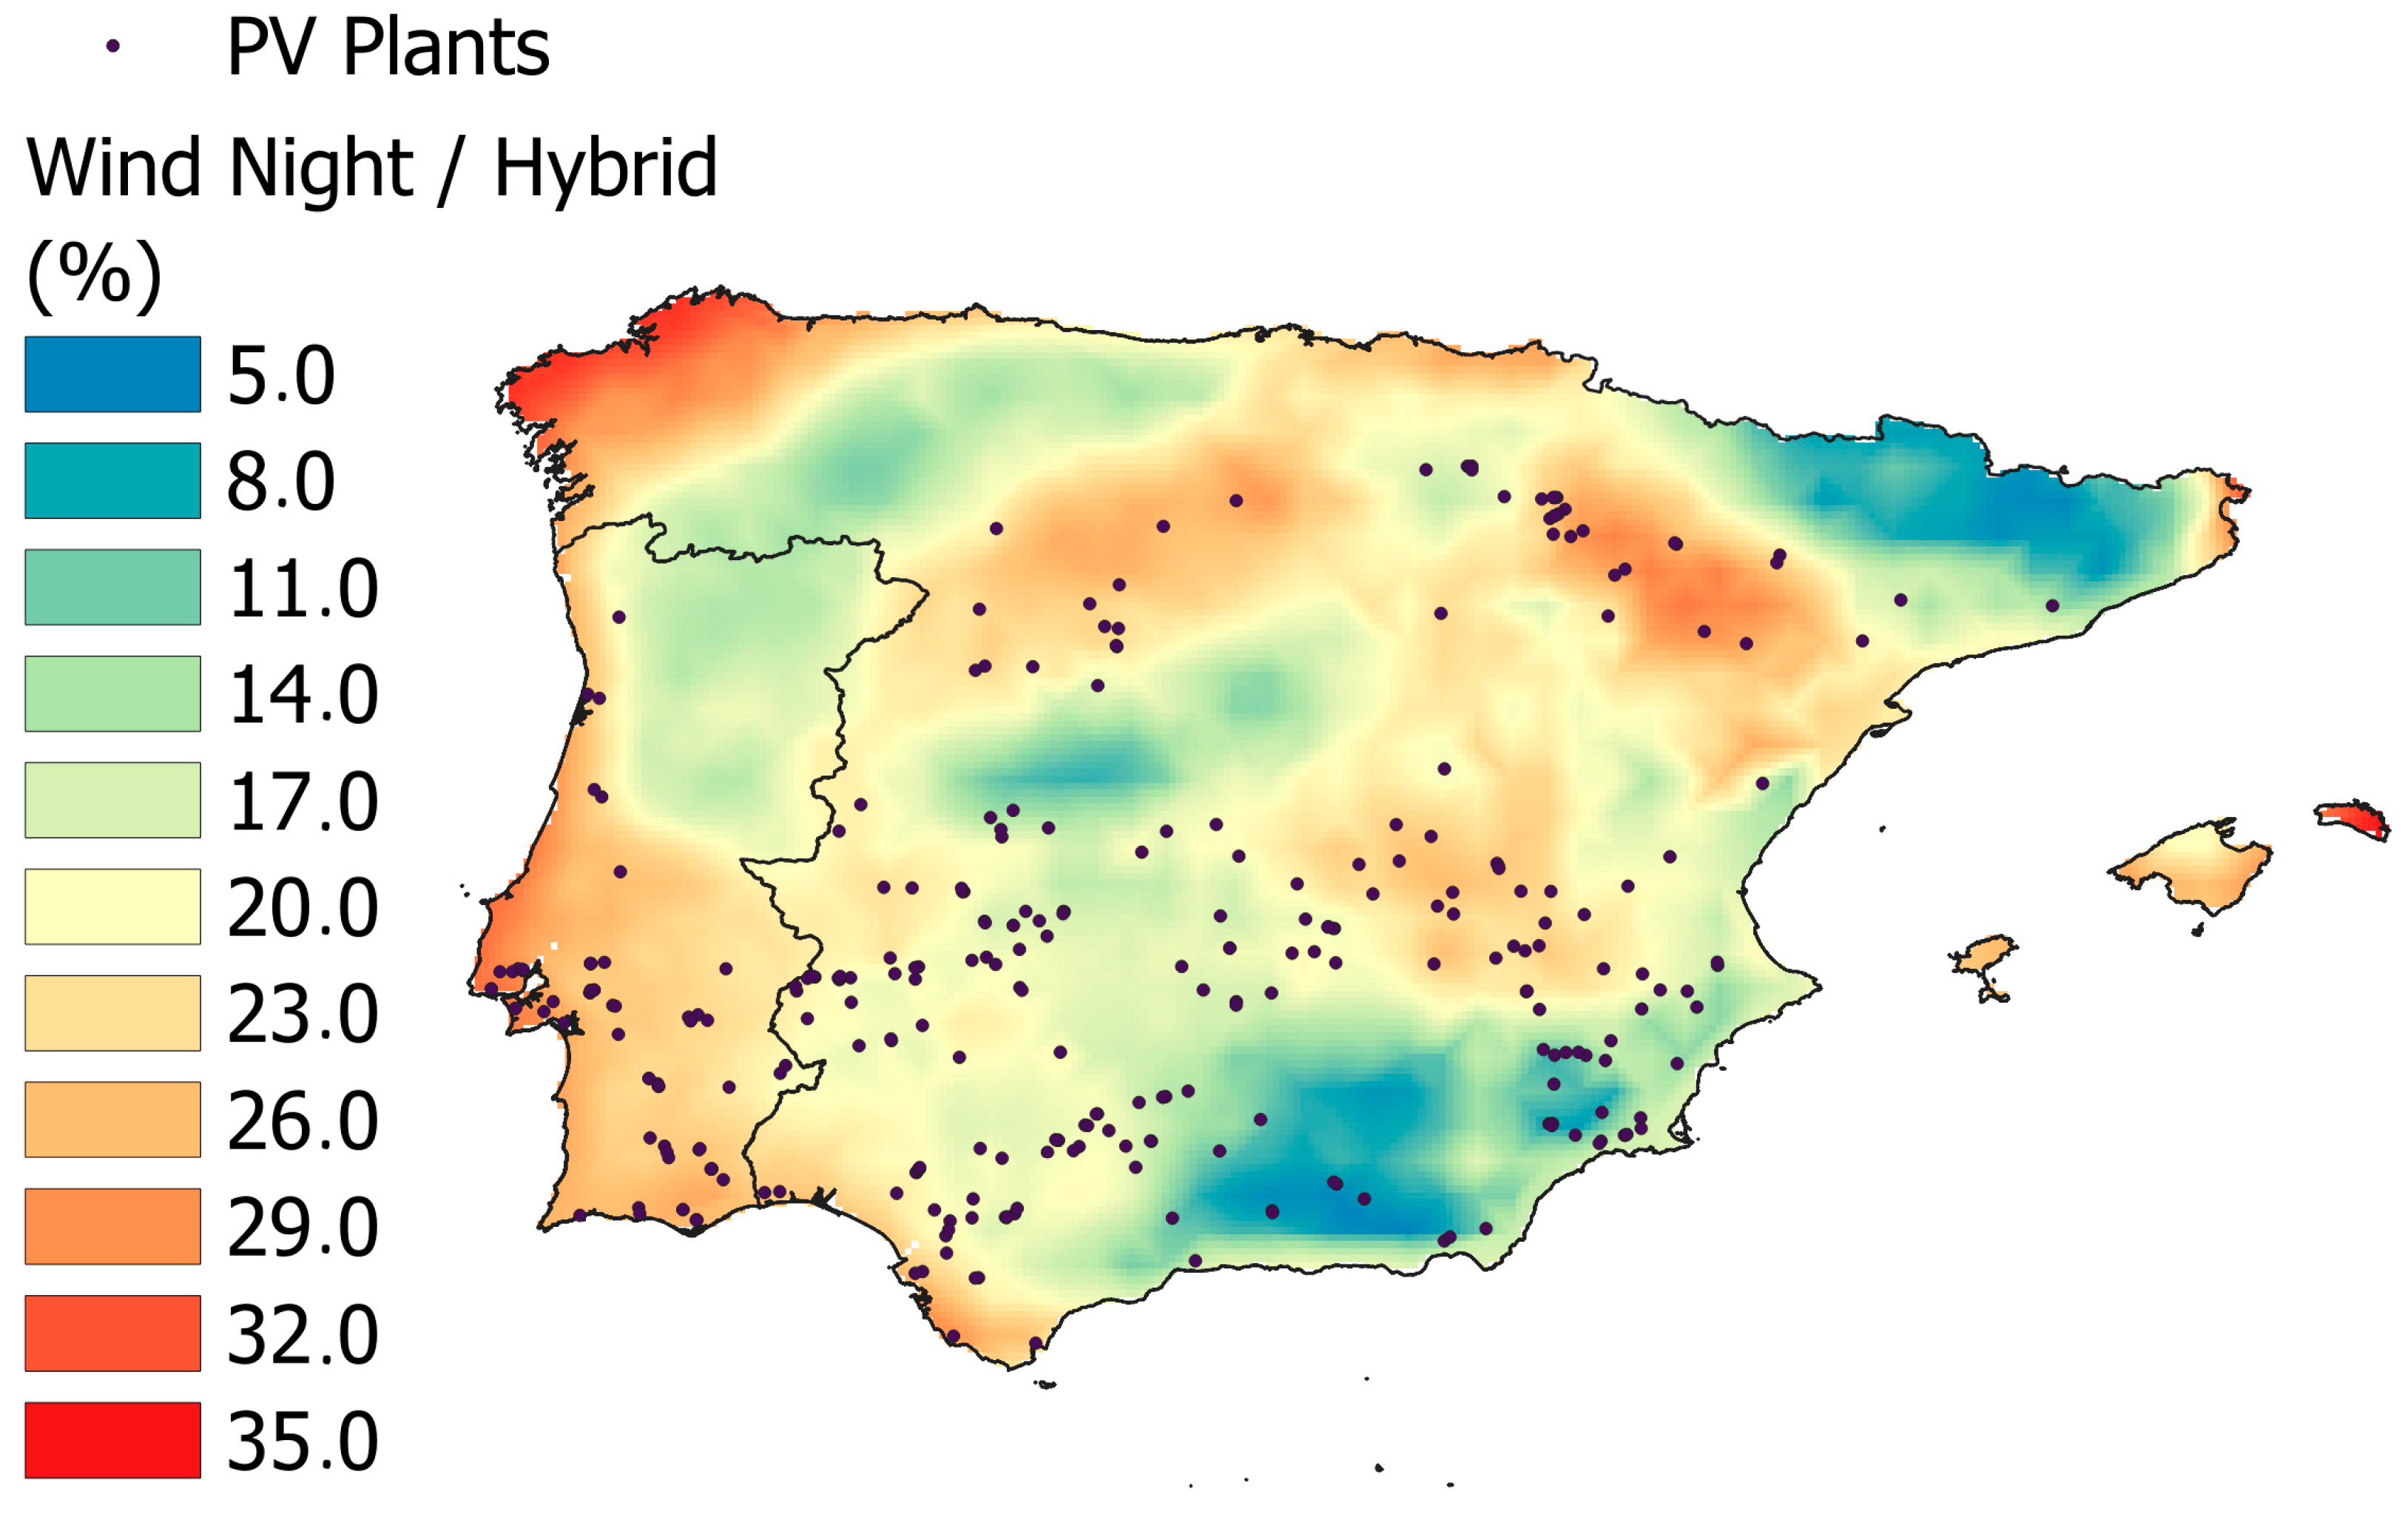
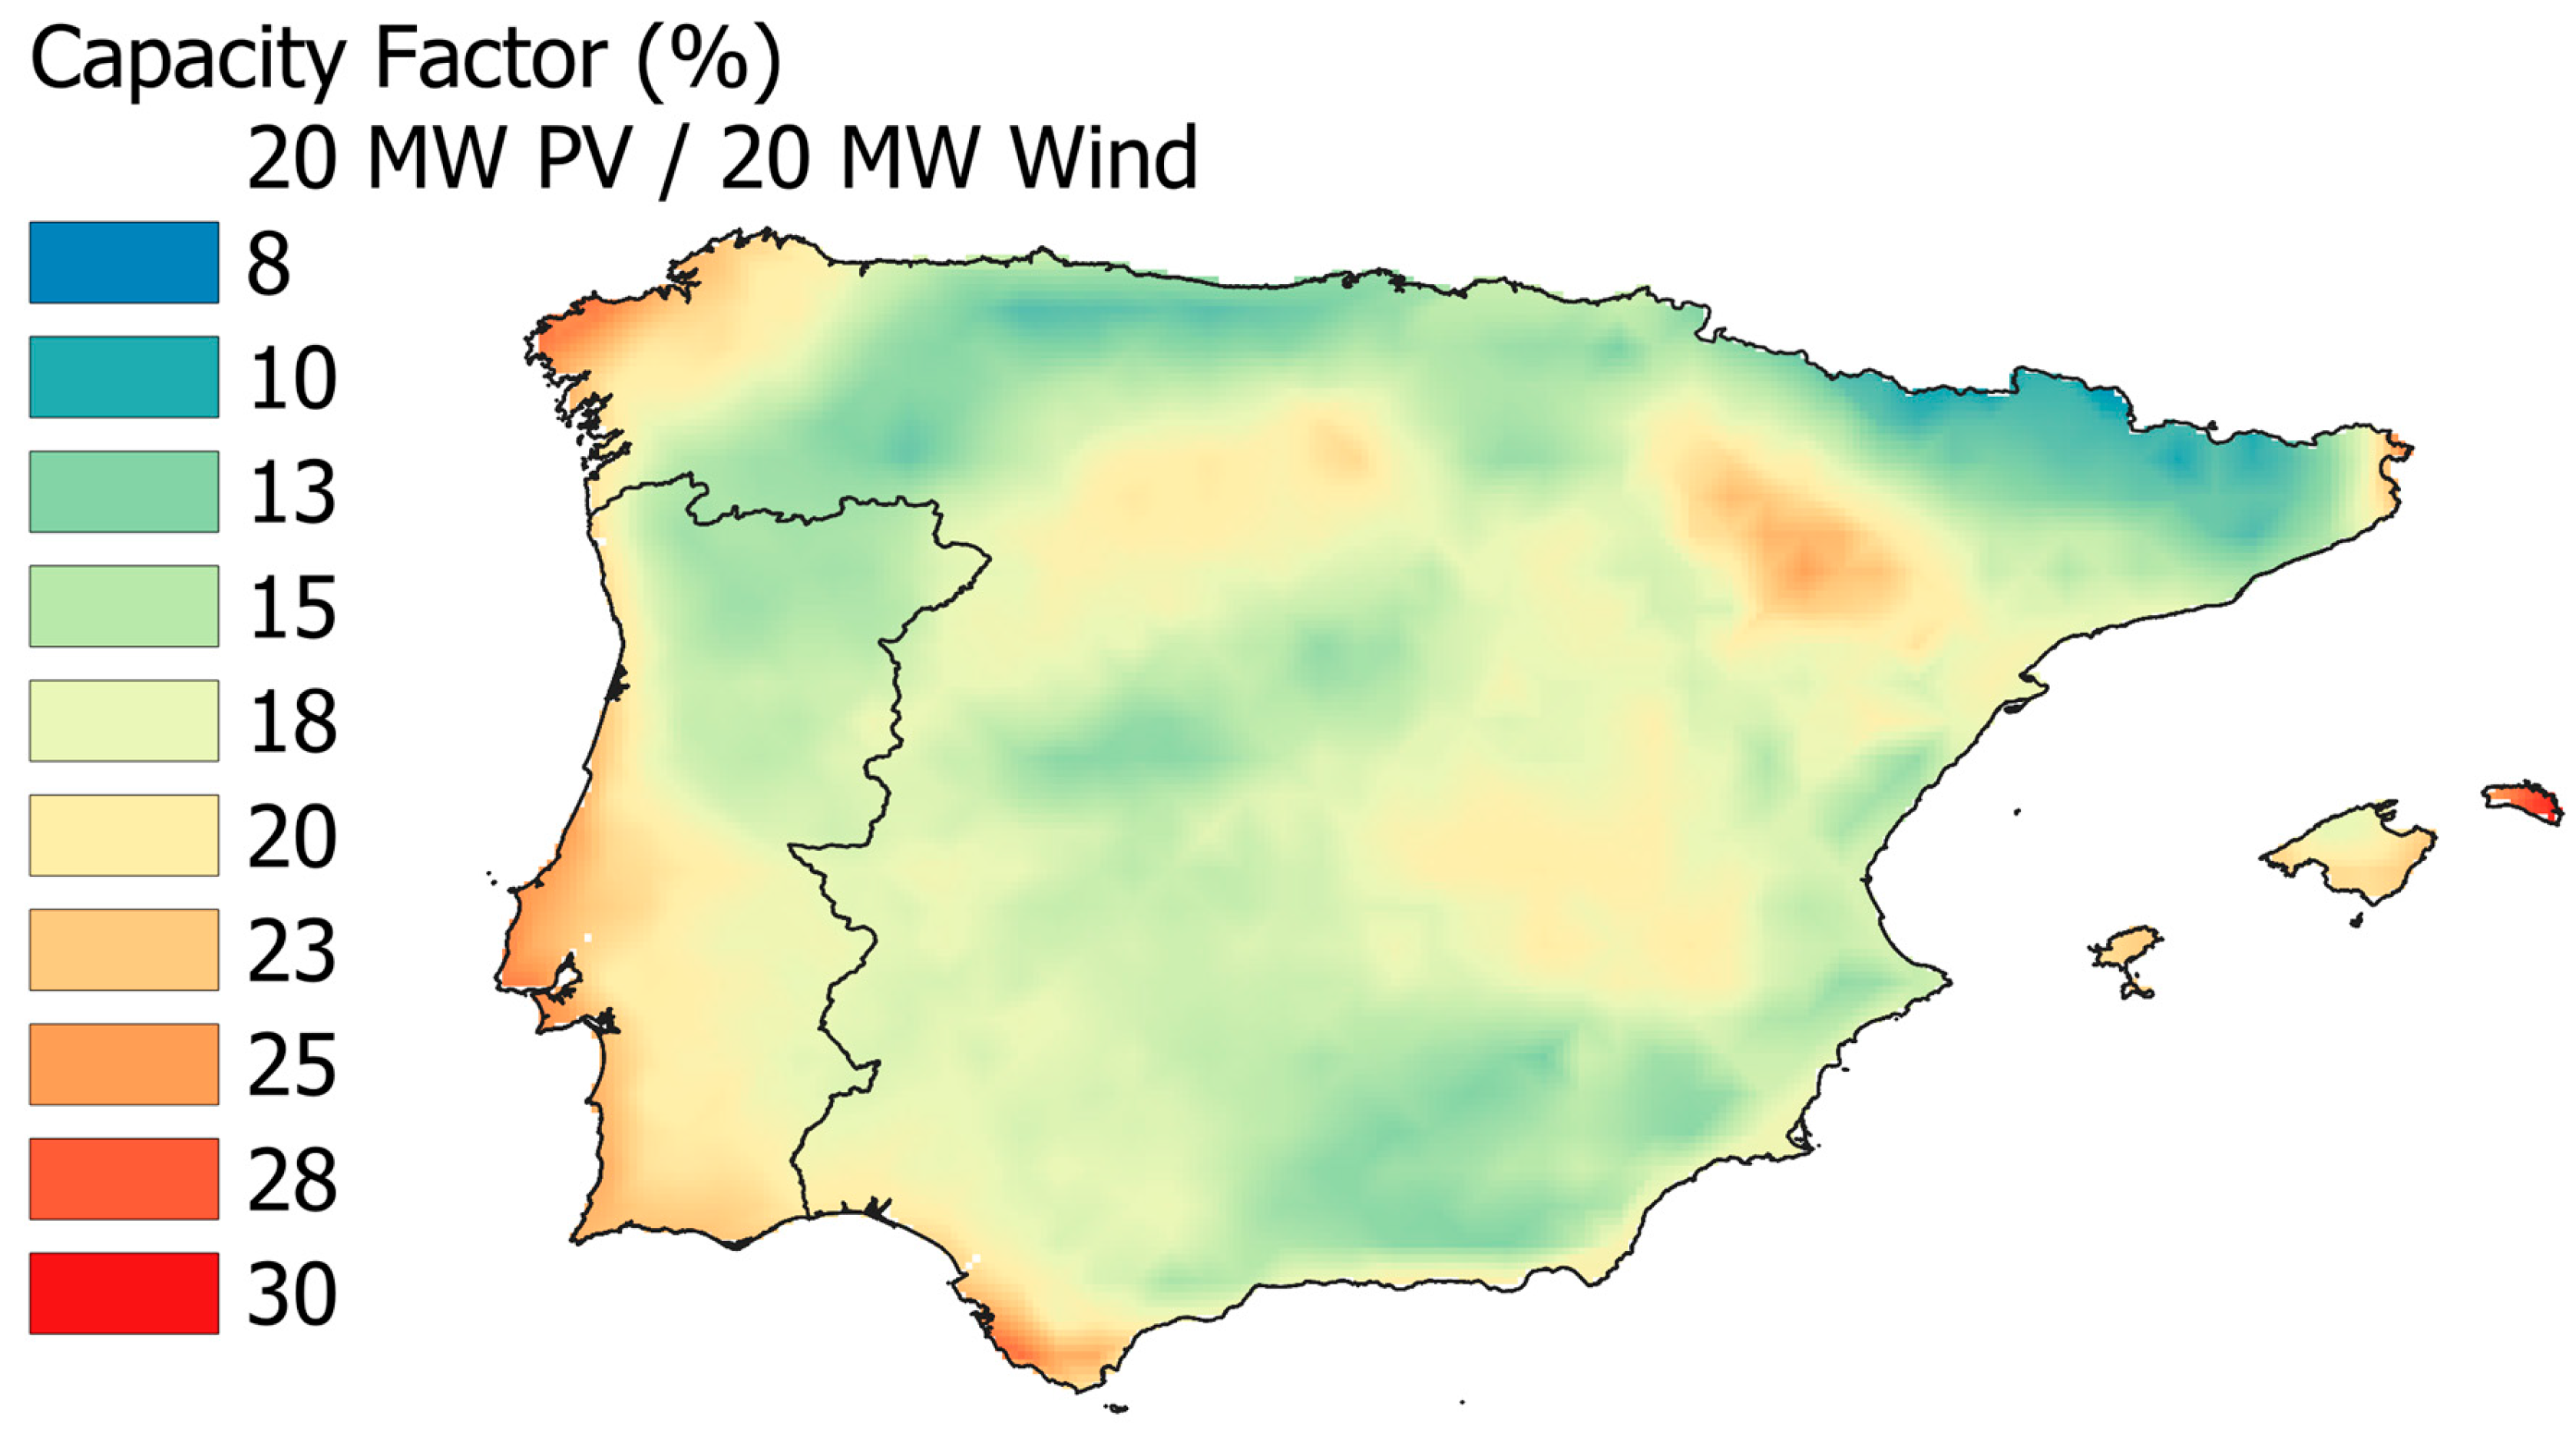
3.1. Energy Generation
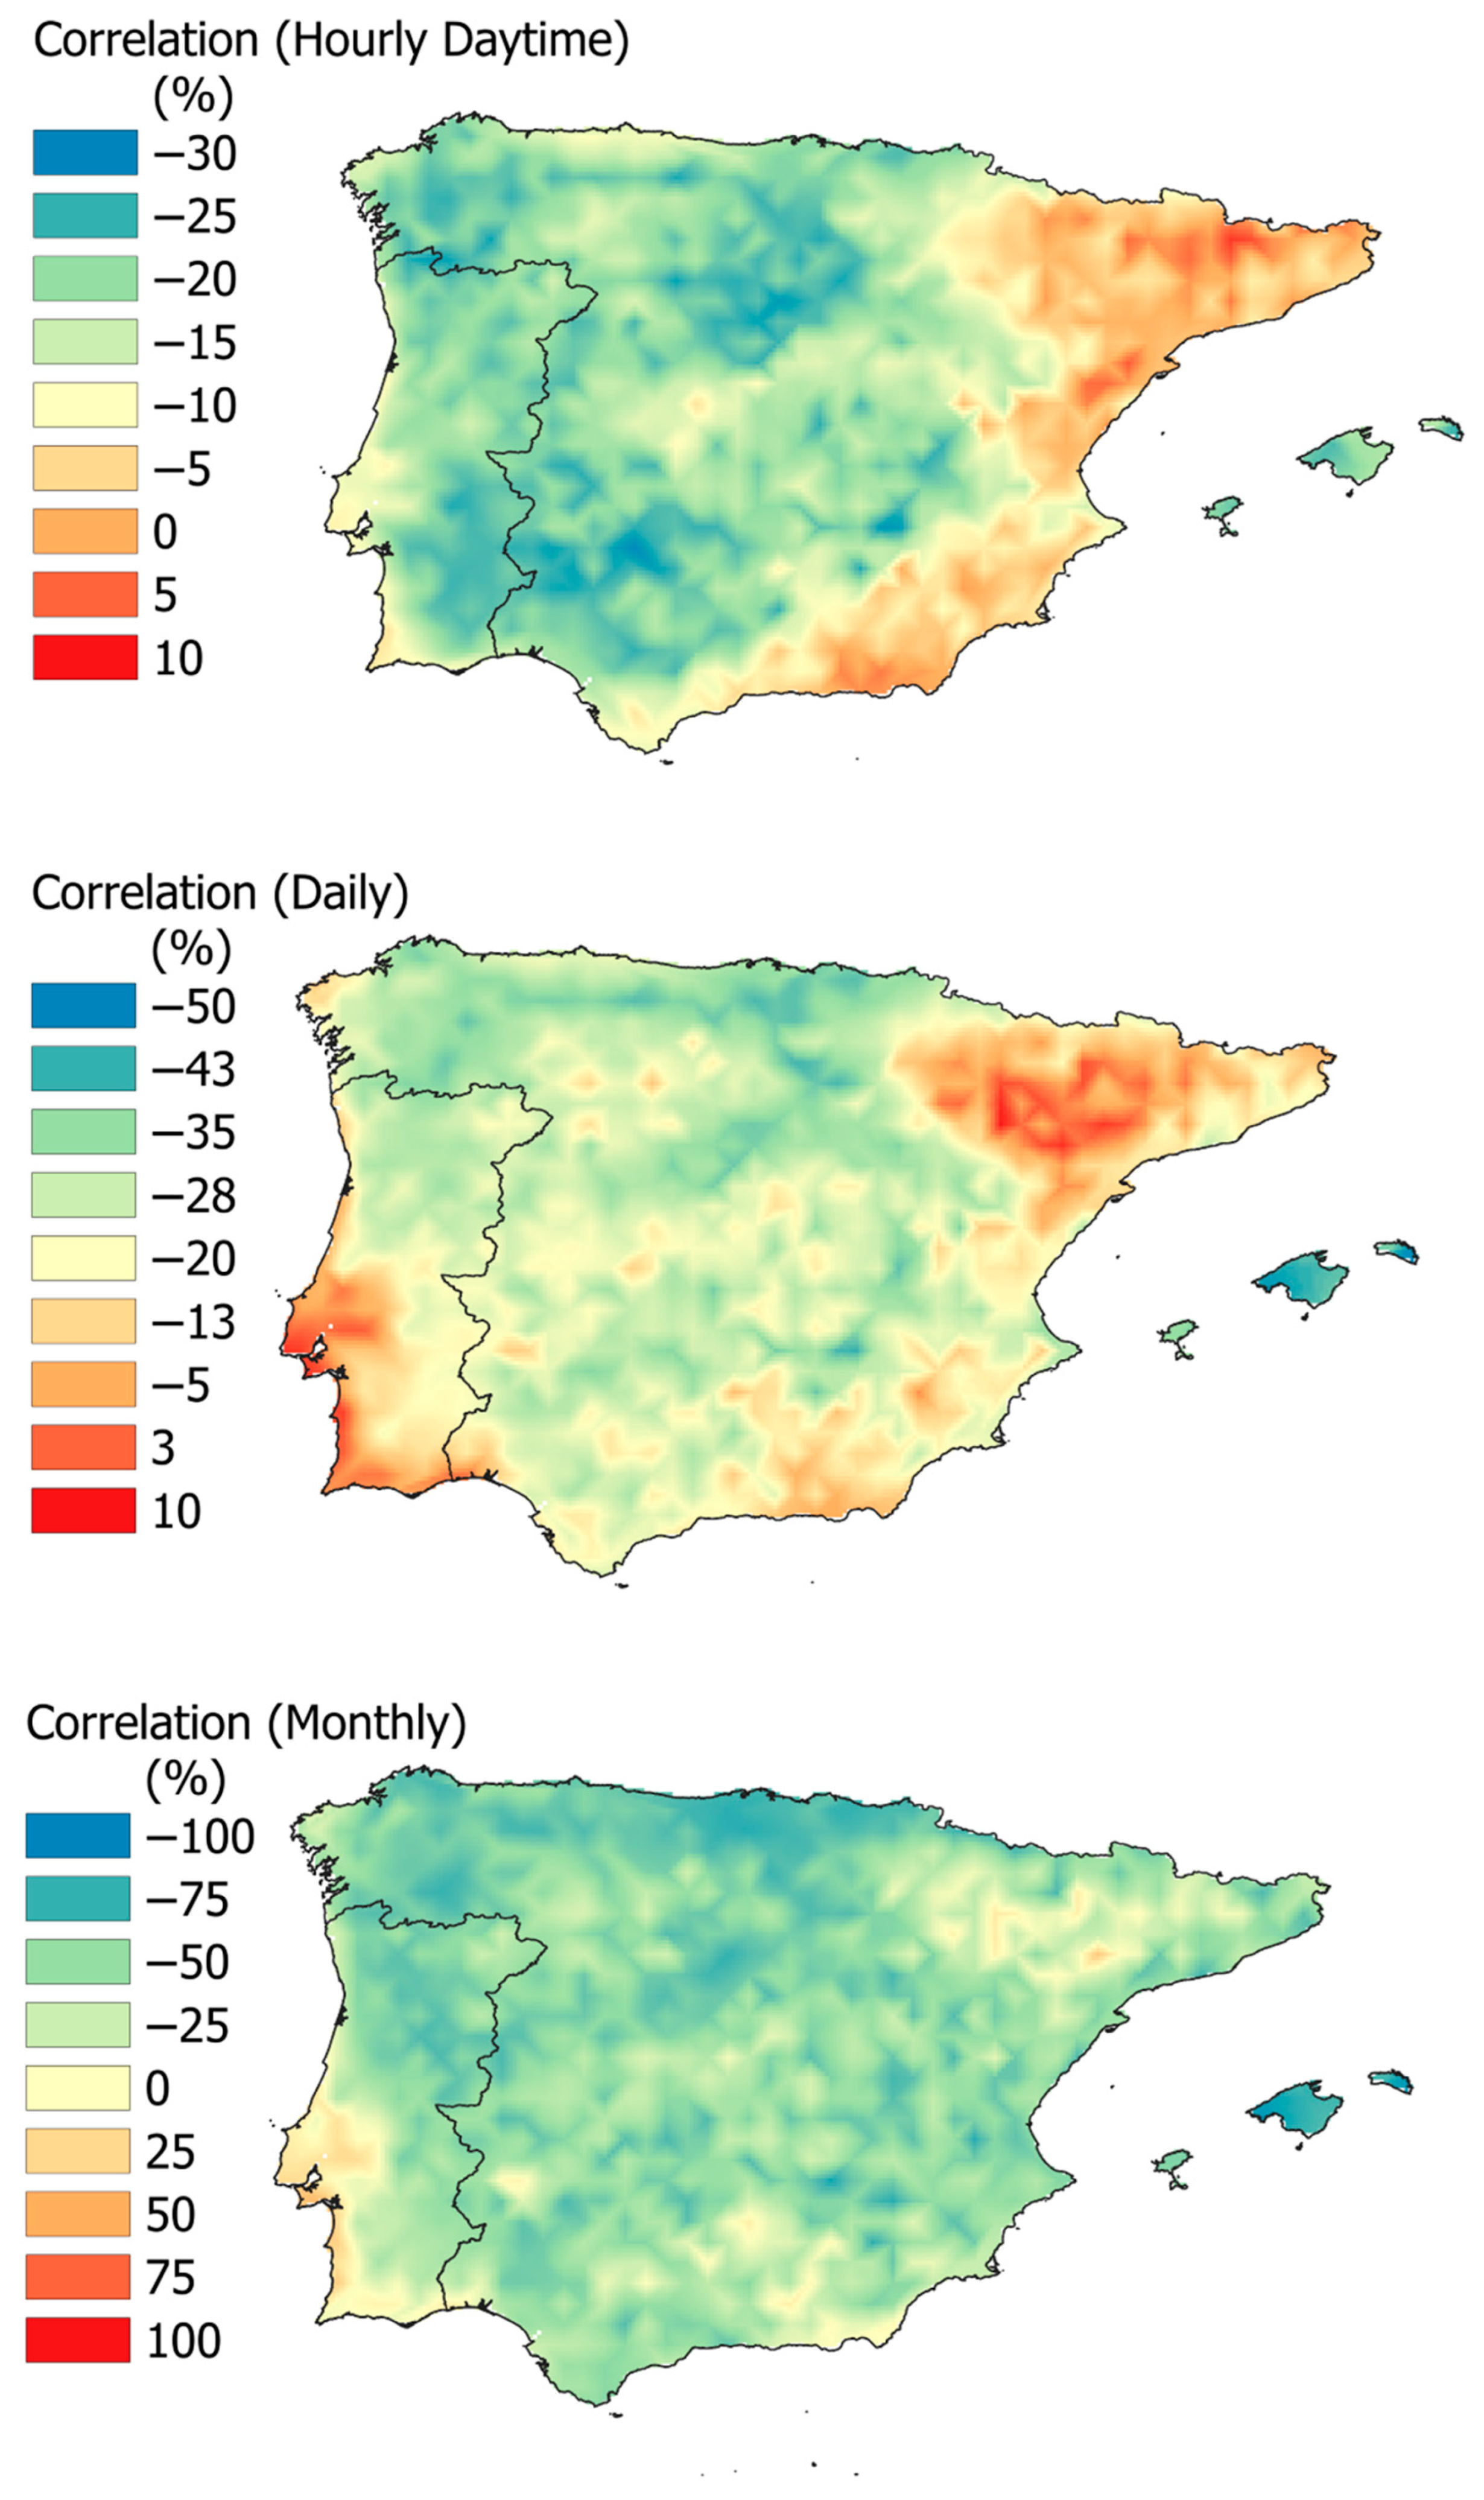
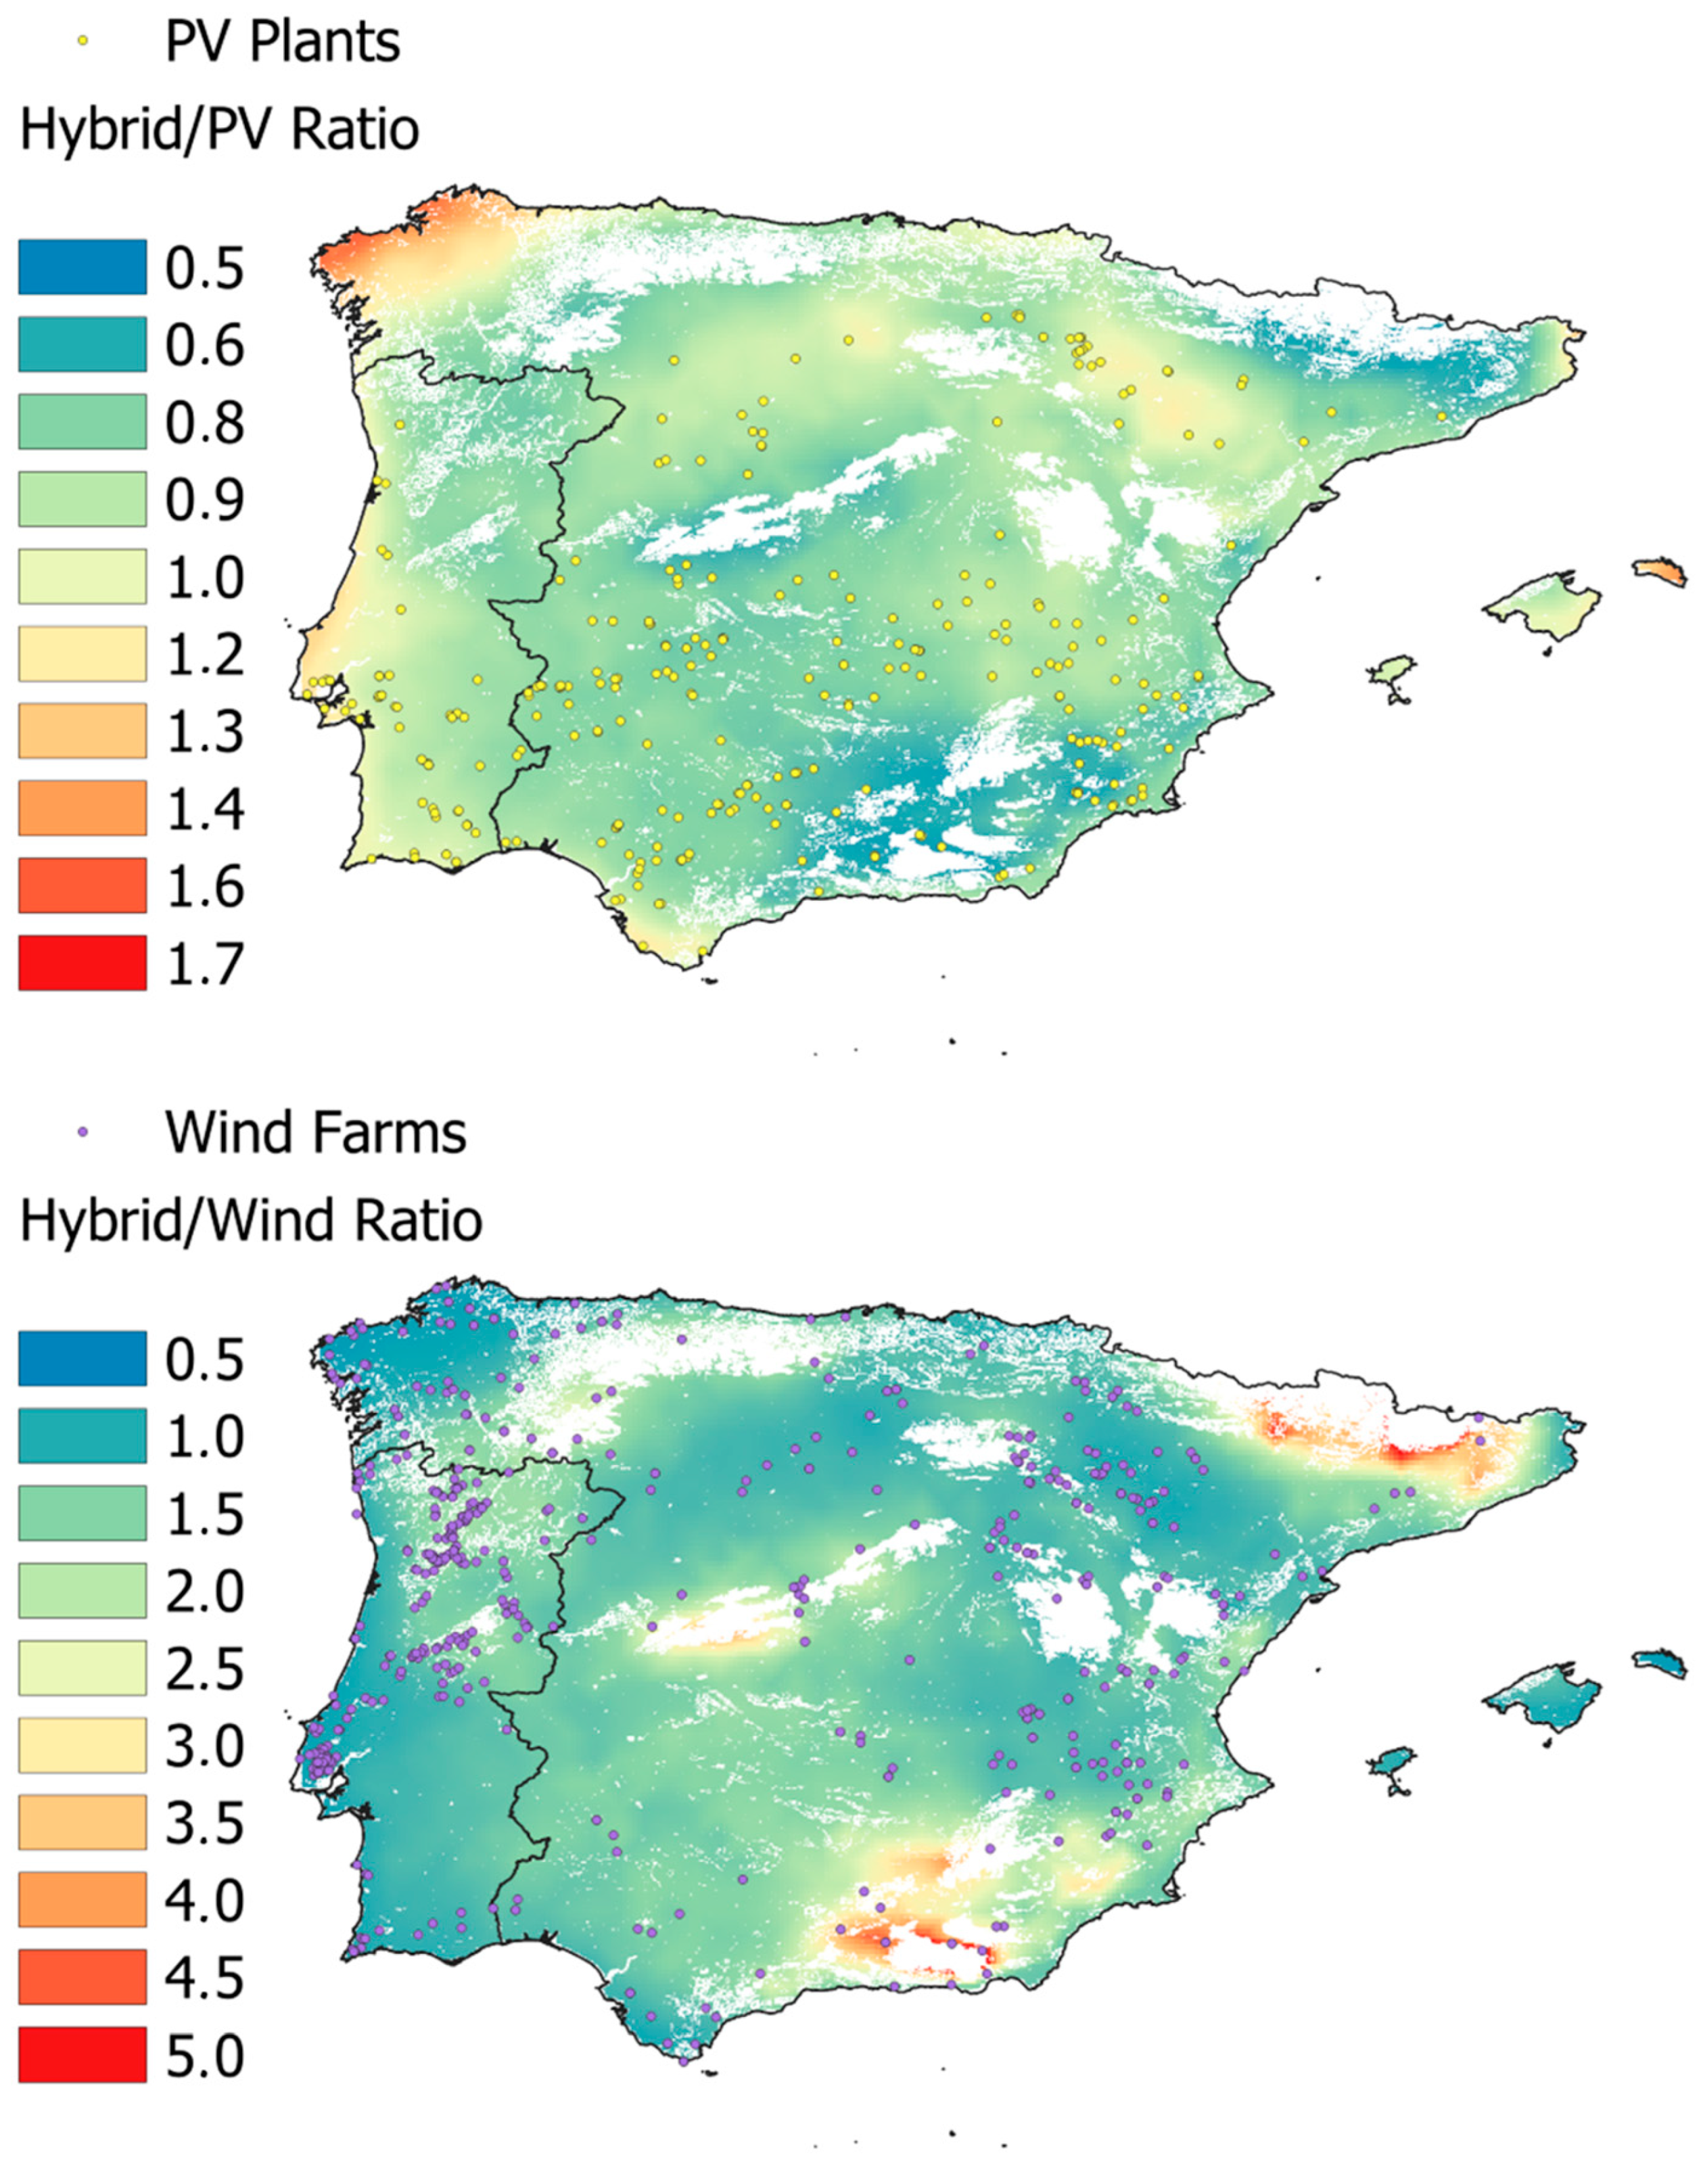
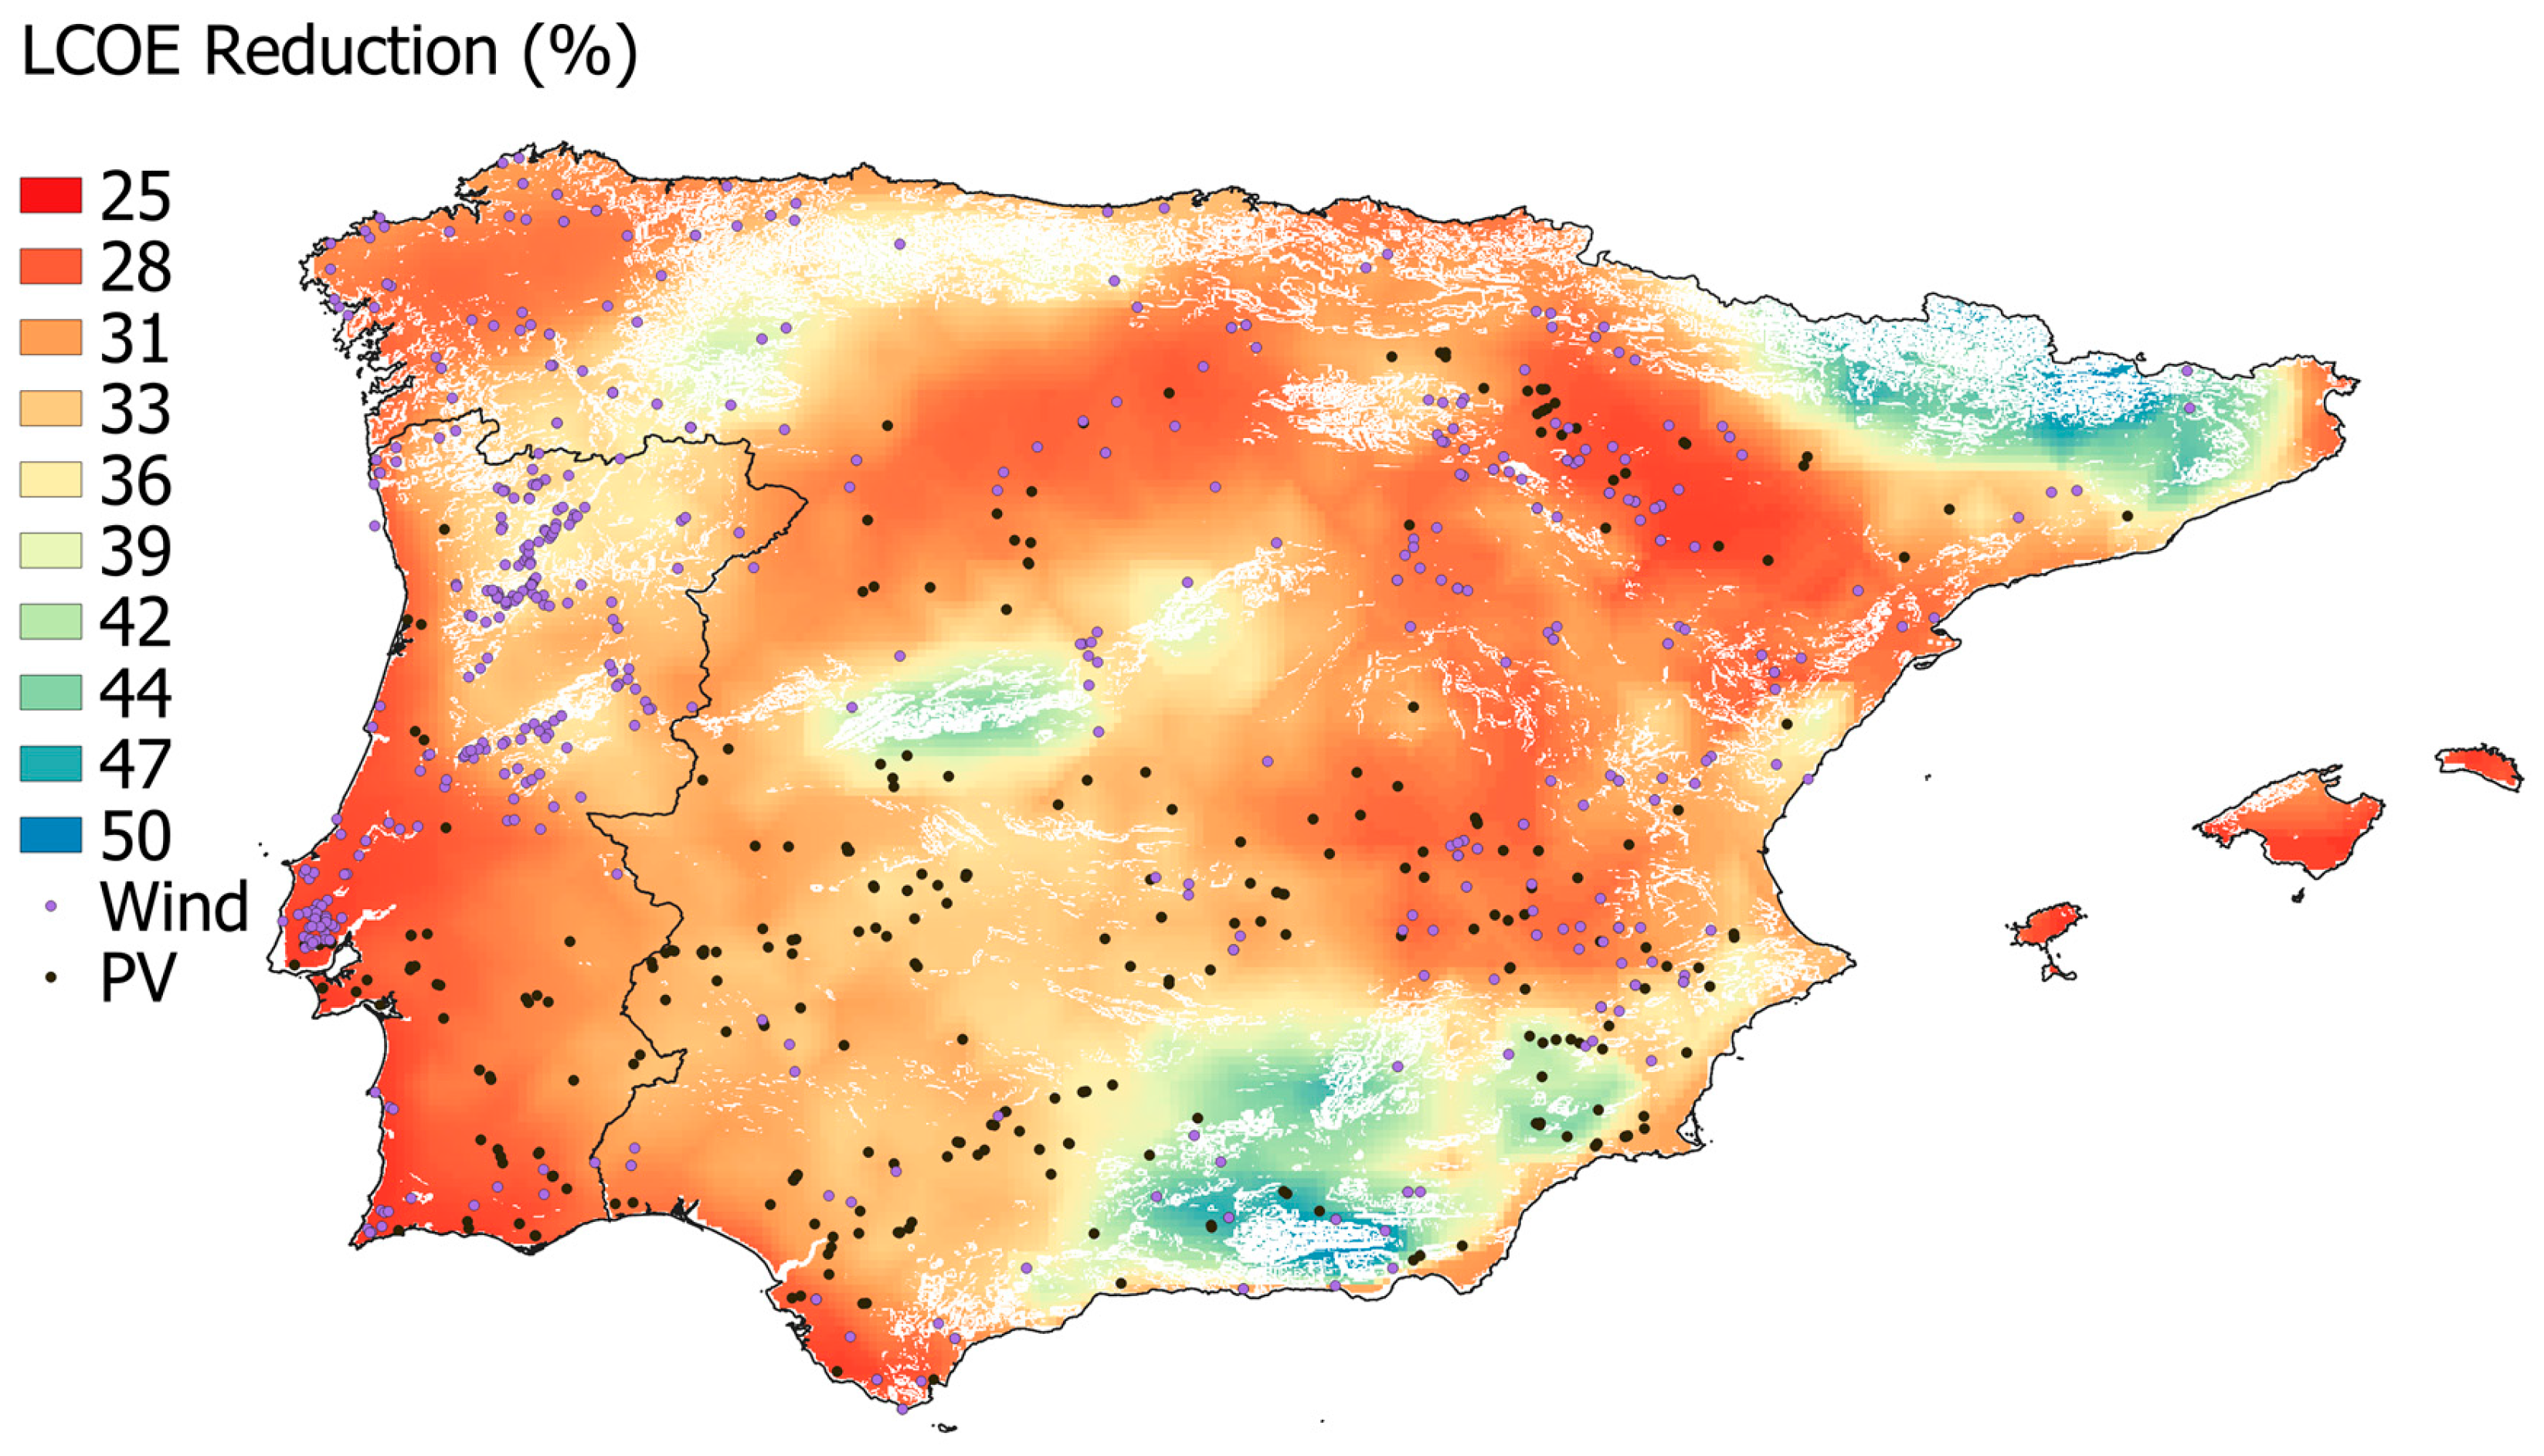
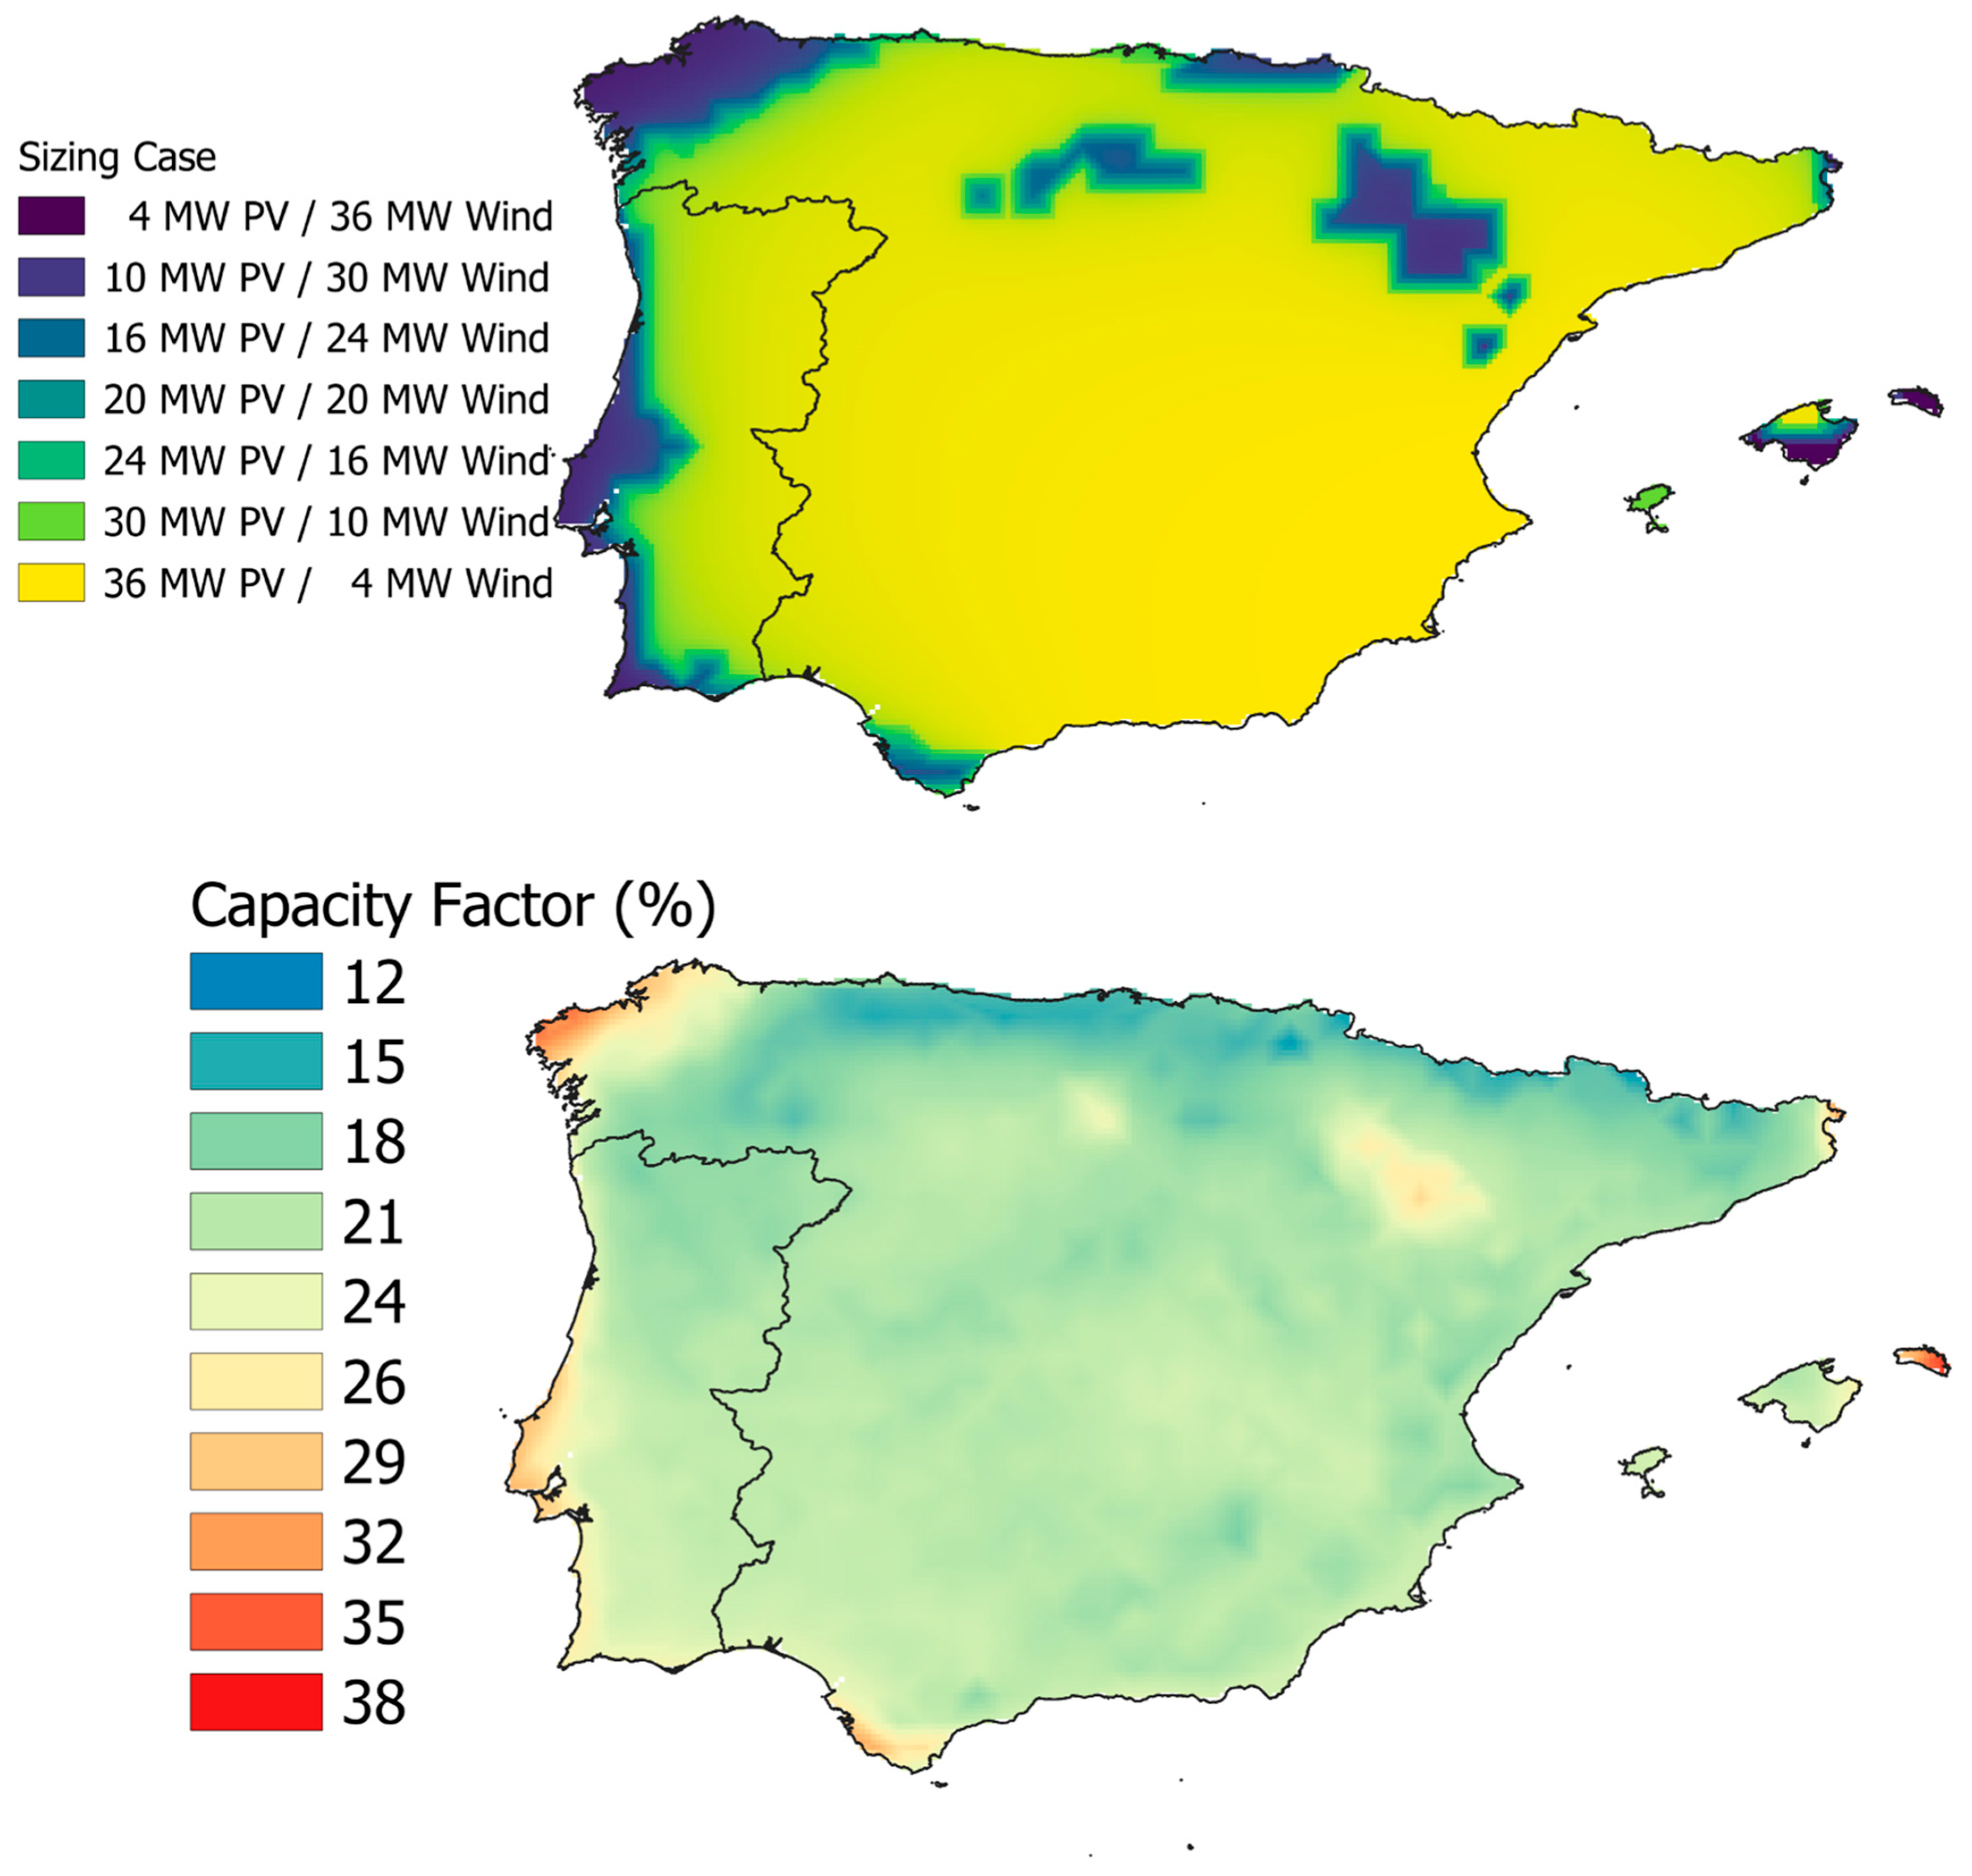
3.2. Analysis of Hybrid Potential
4. Discussion
5. Conclusions
Funding
Data Availability Statement
Acknowledgments
Conflicts of Interest
Abbreviations
| BESS | Battery Energy Storage System |
| CF | Capacity Factor |
| GW | Gigawatt |
| ERA5 | ECMWF Reanalysis |
| IEA | International Energy Agency |
| LCOE | Levelized Cost of Energy |
| MW | Megawatt |
| PV | Photovoltaics |
| PVGIS | Photovoltaic Geographical Information System |
| SAM | System Advisor Model |
| TMY | Typical Meteorological Year |
References
- IEA Renewables 2024. Analysis and Forecast to 2030, Paris. 2024. Available online: https://www.iea.org/reports/renewables-2024 (accessed on 20 February 2025).
- Chinaris, P.P.; Psarros, G.N.; Papathanassiou, S.A. Hybridization of Wind Farms with Co-Located PV and Storage Installations. Renew. Energy 2024, 240, 122057. [Google Scholar] [CrossRef]
- Pérez Uc, D.A.; de León Aldaco, S.E.; Aguayo Alquicira, J. Trends in Hybrid Renewable Energy System (HRES) Applications: A Review. Energies 2024, 17, 2578. [Google Scholar] [CrossRef]
- Giedraityte, A.; Rimkevicius, S.; Marciukaitis, M.; Radziukynas, V.; Bakas, R. Hybrid Renewable Energy Systems—A Review of Optimization Approaches and Future Challenges. Appl. Sci. 2025, 15, 1744. [Google Scholar] [CrossRef]
- Shahnazian, F.; Das, K.; Yan, R.; Sørensen, P. Aspects of Relevance of Hybrid Power Plants in Control and Stability of Weak Grids. Energies 2024, 17, 6353. [Google Scholar] [CrossRef]
- Ferreira, M.M.; Santos, J.A.; da Silva, L.R.; Abrahao, R.; Gomes, F.d.S.V.; Braz, H.D.M. A New Index to Evaluate Renewable Energy Potential: A Case Study on Solar, Wind and Hybrid Generation in Northeast Brazil. Renew. Energy 2023, 217, 119182. [Google Scholar] [CrossRef]
- Winsly, B.W.; Ramalingam, V.K.; Santhappan, J.S.; Maria, A.J.; Chokkalingam, M.P.; Rajendran, V. Optimal Sizing and Techno-Economic-Environmental Evaluation of Biomass-Solar-Wind-Grid Hybrid Energy System: A case study of an institute in South India. Energy Convers. Manag. 2025, 325, 119352. [Google Scholar] [CrossRef]
- Lv, F.; Tang, H. Assessing the Impact of Climate Change on the Optimal Solar–Wind Hybrid Power Generation Potential in China: A Focus on Stability and Complementarity. Renew. Sustain. Energy Rev. 2025, 212, 115429. [Google Scholar] [CrossRef]
- Zhou, Q.; Li, H. Knowledge Mapping of Hybrid Solar PV and Wind Energy Standalone Systems: A Bibliometric Analysis. Energy Eng. J. Assoc. Energy Eng. 2024, 121, 1781–1803. [Google Scholar] [CrossRef]
- Hassan, Q.; Algburi, S.; Sameen, A.Z.; Salman, H.M.; Jaszczur, M. A Review of Hybrid Renewable Energy Systems: Solar and Wind-Powered Solutions: Challenges, Opportunities, and Policy Implications. Results Eng. 2023, 20, 101621. [Google Scholar] [CrossRef]
- Hajou, A.; El Mghouchi, Y.; Chaoui, M. A New Solar-Wind Complementarity Index: An Application to the Climate of Morocco. Renew. Energy 2024, 227, 120490. [Google Scholar] [CrossRef]
- Harrison-Atlas, D.; Murphy, C.; Schleifer, A.; Grue, N. Temporal Complementarity and Value of Wind-PV Hybrid Systems across the United States. Renew. Energy 2022, 201, 111–123. [Google Scholar] [CrossRef]
- Hajou, A.; El Mghouchi, Y.; Chaoui, M. Novel Approaches for Wind Speed Evaluating and Solar-Wind Complementarity Assessing. Renew. Energy Focus 2024, 48, 100547. [Google Scholar] [CrossRef]
- Arribas, L.; Cano, L.; Cruz, I.; Mata, M.; Llobet, E. PV-Wind Hybrid System Performance: A New Approach and a Case Study. Renew. Energy 2010, 35, 128–137. [Google Scholar] [CrossRef]
- Denis, A.; Xydis, G. Exploring the Feasibility of Solar and Wind Energy Utilization in Poland: A Hybrid Energy Mapping Approach. Tech. Ann. 2023, 1. [Google Scholar] [CrossRef]
- Asadi, M.; Pourhossein, K.; Noorollahi, Y.; Marzband, M.; Iglesias, G. A New Decision Framework for Hybrid Solar and Wind Power Plant Site Selection Using Linear Regression Modeling Based on GIS-AHP. Sustainability 2023, 15, 8359. [Google Scholar] [CrossRef]
- Effat, H.A.; El-Zeiny, A.M. Geospatial Modeling for Selection of Optimum Sites for Hybrid Solar-Wind Energy in Assiut Governorate, Egypt. Egypt. J. Remote Sens. Space Sci. 2022, 25, 627–637. [Google Scholar] [CrossRef]
- Martinez, A.; Iglesias, G. Hybrid Wind-Solar Energy Resources Mapping in the European Atlantic. Sci. Total Environ. 2024, 928, 172501. [Google Scholar] [CrossRef]
- Costoya, X.; deCastro, M.; Carvalho, D.; Gómez-Gesteira, M. Assessing the Complementarity of Future Hybrid Wind and Solar Photovoltaic Energy Resources for North America. Renew. Sustain. Energy Rev. 2023, 173, 113101. [Google Scholar] [CrossRef]
- Monforti, F.; Huld, T.; Bódis, K.; Vitali, L.; D’Isidoro, M.; Lacal-Arántegui, R. Assessing Complementarity of Wind and Solar Resources for Energy Production in Italy. A Monte Carlo approach. Renew. Energy 2014, 63, 576–586. [Google Scholar] [CrossRef]
- Couto, A.; Estanqueiro, A. Assessment of Wind and Solar PV Local Complementarity for the Hybridization of the Wind Power Plants Installed in Portugal. J. Clean. Prod. 2021, 319, 128728. [Google Scholar] [CrossRef]
- Santos-Alamillos, F.J.; Jiménez-Garrote, A.; Pozo-Vázquez, D. Meteorological Assessment of Coupled Wind–Solar Power Generation Regimes in Spain. Complement. Var. Renew. Energy Sources 2022, 215–243. [Google Scholar] [CrossRef]
- Graça Gomes, J.; Jiang, J.; Chong, C.T.; Telhada, J.; Zhang, X.; Sammarchi, S.; Wang, S.; Lin, Y.; Li, J. Hybrid Solar PV-Wind-Battery System Bidding Optimisation: A Case Study for the Iberian and Italian Liberalised Electricity Markets. Energy 2023, 263, 126043. [Google Scholar] [CrossRef]
- Robaina, M.; Oliveira, A.; Lima, F.; Ramalho, E.; Miguel, T.; López-Maciel, M.; Roebeling, P.; Madaleno, M.; Ferreira Dias, M.; Meireles, M.; et al. Analysis of NECP-based Scenarios for the Implementation of Wind and Solar Energy Facilities in Portugal. Energy 2025, 324, 135734. [Google Scholar] [CrossRef]
- Arribas, L.; Domínguez, J.; Borsato, M.; Martín, A.M.; Navarro, J.; Bustamante, E.G.; Zarzalejo, L.F.; Cruz, I. The Potential of Utility-Scale Hybrid Wind–Solar PV Power Plant Deployment: From the Data to the Results. Wind 2025, 5, 16. [Google Scholar] [CrossRef]
- Blair, N.; Dobos, A.P.; Freeman, J.; Neises, T.; Wagner, M.; Ferguson, T.; Gilman, P.; Janzou, S. System Advisor Model, SAM, 2014.1.14: General Description; Technical Report NREL/TP-6A20-61019; NREL: Golden, CO, USA, 2014.
- Bahramara, S.; Moghaddam, M.P.; Haghifam, M.R. Optimal Planning of Hybrid Renewable Energy Systems Using HOMER: A Review. Renew. Sustain. Energy Rev. 2016, 62, 609–620. [Google Scholar] [CrossRef]
- Huld, T.; Paietta, E.; Zangheri, P.; Pinedo Pascua, I. Assembling Typical Meteorological Year Data Sets for Building Energy Performance Using Reanalysis and Satellite-Based Data. Atmosphere 2018, 9, 53. [Google Scholar] [CrossRef]
- Müller, R.; Pfeifroth, U.; Träger-Chatterjee, C.; Cremer, R.; Trentmann, J.; Hollman, R. Surface Solar Radiation Data Set -Heliosat (SARAH)-Edition 1; Satellite Application Facility on Climate Monitoring: Frankfurt, Germany, 2015. [Google Scholar] [CrossRef]
- Amillo, A.; Huld, T.; Müller, R. A New Database of Global and Direct Solar Radiation Using the Eastern Meteosat Satellite, Models and Validation. Remote Sens. 2014, 6, 8165–8189. [Google Scholar] [CrossRef]
- Huld, T.; Müller, R.; Gambardella, A. A New Solar Radiation Database for Estimating PV Performance in Europe and Africa. Sol. Energy 2012, 86, 1803–1815. [Google Scholar] [CrossRef]
- Urraca, R.; Gracia-Amillo, A.M.; Koubli, E.; Huld, T.; Trentmann, J.; Riihelä, A.; Lindfors, A.V.; Palmer, D.; Gottschalg, R.; Antonanzas-Torres, F. Extensive Validation of CM SAF Surface Radiation Products over Europe. Remote Sens. Environ. 2017, 199, 171–186. [Google Scholar] [CrossRef]
- Urraca, R.; Gracia-Amillo, A.M.; Huld, T.; Martinez-de-Pison, F.J.; Trentmann, J.; Lindfors, A.V.; Riihelä, A.; Sanz-Garcia, A. Quality Control of Global Solar Radiation Data with Satellite-Based Products. Sol. Energy 2017, 158, 49–62. [Google Scholar] [CrossRef]
- Jensen, A.R.; Anderson, K.S.; Holmgren, W.F.; Mikofski, M.A.; Hansen, C.W.; Boeman, L.J.; Loonen, R. Pvlib Iotools—Open-Source Python Functions for Seamless Access to Solar Irradiance Data. Sol. Energy 2023, 266, 112092. [Google Scholar] [CrossRef]
- Hersbach, H.; Bell, B.; Berrisford, P.; Hirahara, S.; Horányi, A.; Muñoz-Sabater, J.; Nicolas, J.; Peubey, C.; Radu, R.; Schepers, D.; et al. The ERA5 Global Reanalysis. Q. J. R. Meteorol. Soc. 2020, 146, 1999–2049. [Google Scholar] [CrossRef]
- Gualtieri, G. Analysing the Uncertainties of Reanalysis Data Used for Wind Resource Assessment: A Critical Review. Renew. Sustain. Energy Rev. 2022, 167, 112741. [Google Scholar] [CrossRef]
- Olauson, J. ERA5: The New Champion of Wind Power Modelling? Renew. Energy 2018, 126, 322–331. [Google Scholar] [CrossRef]
- Masoud, A.A. Hybrid Wind-Solar Energy Potential Modeling Using ERA5 and Solar Irradiation Data in Google Earth Engine. Renew. Energy 2024, 232, 121042. [Google Scholar] [CrossRef]
- Byers, L.; Friedrich, J.; Hening, R.; Kressig, L.X.; McCormick, C.; Malaguzzi Valeri, L. A Global Database of Power Plants; World Resources Institute: Washington, DC, USA, 2021; Available online: https://www.wri.org/research/global-database-power-plants (accessed on 22 July 2025).
- Freeman, J.; Jorgenson, J.; Gilman, P.; Ferguson, T. Reference Manual for the System Advisor Model’s Wind Power Performance Model; National Renewable Energy Laboratory: Golden, CO, USA, 2014.
- Dobos, A.P. PVWatts Version 5 Manual-Technical Report NREL/TP-6A20-62641; National Renewable Energy Laboratory: Golden, CO, USA, 2014.
- PySAM Version 5.1.0. Available online: https://github.com/nrel/pysam (accessed on 22 January 2025).
- Nebey, A.H.; Taye, B.Z.; Workineh, T.G. Site Suitability Analysis of Solar PV Power Generation in South Gondar, Amhara Region. J. Energy 2020, 2020, 3519257. [Google Scholar] [CrossRef]
- de Luis-Ruiz, J.M.; Salas-Menocal, B.R.; Pereda-García, R.; Pérez-Álvarez, R.; Sedano-Cibrián, J.; Ruiz-Fernández, C. Optimal Location of Solar Photovoltaic Plants Using Geographic Information Systems and Multi-Criteria Analysis. Sustainability 2024, 16, 2895. [Google Scholar] [CrossRef]
- Ren, G.; Wan, J.; Liu, J.; Yu, D. Spatial and Temporal Assessments of Complementarity for Renewable Energy Resources in China. Energy 2019, 177, 262–275. [Google Scholar] [CrossRef]
- Liu, L.; Wang, Z.; Wang, Y.; Wang, J.; Chang, R.; He, G.; Tang, W.; Gao, Z.; Li, J.; Liu, C.; et al. Optimizing Wind/Solar Combinations at Finer Scales to Mitigate Renewable Energy Variability in China. Renew. Sustain. Energy Rev. 2020, 132, 110151. [Google Scholar] [CrossRef]


| Parameter | Value |
|---|---|
| PV nameplate capacity | 20 MW |
| PV DC to AC ratio | 1.3 |
| PV Rated Inverter size | 15.38 MW |
| PV orientation and tracking | 1-axis tracking south-oriented |
| Total PV losses (soiling, shading, wiring, …) | 14% |
| PV Bifaciality | 0.7 |
| Wind Power | 20 MW |
| Number of turbines | 10 |
| Turbine model | Gamesa G114 2.0 MW |
| Coordinates | LCOE Hybrid (cent/kWh) | LCOE Individual (cent/kWh) |
|---|---|---|
| 37.5° N, −8.0° E | 7.30 | 10.43 |
| 39.0° N, −1.5° E | 7.43 | 10.76 |
| 41.5° N, −0.5° E | 6.28 | 8.57 |
| 42.0° N, −5.0° E | 7.30 | 10.34 |
| 43.5° N, −5.5° E | 11.80 | 18.38 |
Disclaimer/Publisher’s Note: The statements, opinions and data contained in all publications are solely those of the individual author(s) and contributor(s) and not of MDPI and/or the editor(s). MDPI and/or the editor(s) disclaim responsibility for any injury to people or property resulting from any ideas, methods, instructions or products referred to in the content. |
© 2025 by the author. Licensee MDPI, Basel, Switzerland. This article is an open access article distributed under the terms and conditions of the Creative Commons Attribution (CC BY) license (https://creativecommons.org/licenses/by/4.0/).
Share and Cite
Polo, J. Hybrid Wind–Solar Generation and Analysis for Iberian Peninsula: A Case Study. Energies 2025, 18, 3966. https://doi.org/10.3390/en18153966
Polo J. Hybrid Wind–Solar Generation and Analysis for Iberian Peninsula: A Case Study. Energies. 2025; 18(15):3966. https://doi.org/10.3390/en18153966
Chicago/Turabian StylePolo, Jesús. 2025. "Hybrid Wind–Solar Generation and Analysis for Iberian Peninsula: A Case Study" Energies 18, no. 15: 3966. https://doi.org/10.3390/en18153966
APA StylePolo, J. (2025). Hybrid Wind–Solar Generation and Analysis for Iberian Peninsula: A Case Study. Energies, 18(15), 3966. https://doi.org/10.3390/en18153966