Abstract
In the energy sector and in other types of industries (cement, iron/steel, chemical and petrochemical), highly roasted coffee ground residue can be used as a source material for producing bioadsorbents suitable for CO2 capture. In this study, a bioadsorbent was produced in a two-step process involving biowaste carbonization and biocarbon activation within a KOH solution. The physicochemical properties of the bioadsorbent were assessed using LECO, TG, SEM, BET and FT-IR methods. Investigating the CO2, O2 and N2 equilibrium adsorption capacity using an IGA analyzer allowed us to calculate CO2 selectivity factors. We assessed the influence of exhaust gas carbon dioxide concentration (16%, 30%, 81.5% and 100% vol.) and adsorption step temperature (25 °C, 50 °C and 75 °C) on the CO2 adsorption capacity of the bioadsorbent. We also investigated its stability and regenerability in multi-step adsorption–desorption using a TG-Vacuum system, simulating the VSA process and applying different pressures in the regeneration step (30, 60 and 100 mbarabs). The tests conducted assessed the possibility of using a produced bioadsorbent for capturing CO2 using the VSA technique.
1. Introduction
Reducing greenhouse gas emissions, including carbon dioxide, alongside transitioning to a circular economy, is the primary action needed to slow down climate change. One of the solutions proposed for reducing carbon dioxide emissions is implementing CCS (Carbon Capture and Storage) and CCU (Carbon Capture and Utilization) technologies. Interest in these technologies stems from the need to reduce the enormous CO2 waste streams, mainly originating from power plants and combined heat and power plants but also from other energy-intensive sectors such as the cement, iron/steel, chemical and petrochemical industries. The initial process in both CCS and CCU technologies is CO2 capture. The exhaust gas streams from various industrial and energy sectors differ in terms of CO2 content. For example, coal-fired power plants emit flue gases with a CO2 content of 12–16% vol.; cement production produces 14–33% vol.; the iron/steel industry produces 20–27% vol.; the petrochemical industry produces varying levels, depending on the product—8% (ethylene), 12% (methanol), 18% (ammonia); refineries produce 3–13% vol.; and the chemical industry produces up to 100% [1,2]. These concentrations are important in the capture process, as carbon dioxide is easier and less expensive to separate from streams with a high concentration.
Carbon dioxide capture can be conducted in various ways. The most technologically developed method is based on liquid absorbents such as amine solutions, though that based on solid adsorbents is another worth taking into account. This method can be divided into the following techniques: PSA (Pressure Swing Adsorption), VSA (Vacuum Swing Adsorption) and TSA (Temperature Swing Adsorption). These techniques can also be combined, as exemplified by PTSA (Pressure Temperature Swing Adsorption), VPSA (Vacuum Pressure Swing Adsorption) and VTSA (Vacuum Temperature Swing Adsorption). The advantages of the adsorption method include its simple operation, absence of corrosion, low-cost adsorbents, high efficiency and low energy consumption. The VPSA method, based on gas separation through cyclic pressure changes, is proposed for capturing carbon dioxide from the energy sector and other industries [3,4]. In the case of the adsorption method, the type of adsorbent used plays a significant role in CO2 separation efficiency and energy demand. The adsorbent proposed for use in VPSA installations should be characterized by a high carbon dioxide adsorption capacity, as well as selectivity. Moreover, the adsorbent should be fully regenerable without adsorption capacity loss and without any influence on its structure or physicochemical properties, since the adsorption process operates in multi-step cycles. The adsorbent’s stability is also of crucial importance, as this directly affects the material’s lifespan and therefore the need to replace it in adsorption installation. Another important factor influencing the durability of the adsorbent is its mechanical strength. Additionally, the adsorbent should exhibit tolerance to moisture and other contaminants found in flue gases, such as SOₓ and NOₓ [4,5].
Currently, the main types of adsorbents proposed for CO2 capture installations are zeolites [6,7], activated carbons [5,8,9] and metal–organic frameworks (MOFs) [10]. Recent reports in the literature [11,12,13,14,15,16,17,18,19,20,21,22,23,24,25,26,27,28,29,30,31] indicate a growing interest in the use of adsorbents derived from various types of biowaste for CO2 capture. The utilization of waste materials, including food waste, to produce adsorbents not only offers inherent environmental benefits but also constitutes a means of valorizing these waste streams.
Bioadsorbents can be produced from inexpensive and commonly available raw materials, such as biomass and industrial by-products from sectors including forestry, agriculture and the food industry. In particular, valorizing spent coffee grounds appears highly promising, since coffee is one of the most popular beverages globally and the market has steadily been expanding [23,24,25,26,27,28,29,30,31]. Global coffee production has increased from 151.3 mil. 60 kg bags in 2015/2016 [23] to 168.4 mil. 60 kg bags in 2019/2020 and 178.0 mil. 60 kg bags in 2023/2024 [32]. The residue generated during the brewing process (spent coffee grounds) constitutes about 45% w/w [33]. Therefore, recycling or upcycling this coffee ground waste can significantly reduce disposal costs and contribute to the development of a circular economy.
Carbon adsorbents can be obtained from spent coffee grounds via carbonization and chemical activation using agents such as zinc chloride, phosphoric acid, mixtures of zinc chloride and phosphoric acid, or potassium hydroxide, as well as through physical activation using CO2, steam, or air. The resulting bioadsorbents are carbon-rich materials exhibiting hydrophobic properties, which can be further activated to develop high porosity, while still allowing for mild regeneration conditions. The selection of porous carbon precursors and the specific preparation method have a significant impact on the structure and porosity of the resulting carbon material. Carbon materials derived from spent coffee grounds find applications in various fields, including in reducing carbon dioxide emissions. Of particular interesting is the utilization of spent coffee grounds to produce adsorbents for CO2 capture [24,25,26,27,28,29,30,31]. The appropriate processing of this biomass enables the production of biocarbon with tailored properties, such as a specific microstructure and surface area, optimized for efficient carbon dioxide adsorption. Data in the literature [24,25,26,27,28,29,30,31] indicate that bioadsorbents derived from spent coffee grounds exhibit a considerable CO2 adsorption capacity. Plaza et al. [26,27] have already produced biocarbons from spent coffee grounds through both physical and chemical activation methods. Their preliminary studies demonstrated the significant potential of this waste material for CO2 capture. The obtained carbon materials exhibited CO2 adsorption capacities of up to 215.6 mgCO2 gA−1 at 273 K and 132 mgCO2 gA−1 at 298 K, which are higher than those of commercially activated carbons. KOH-activated samples showed improved textural development compared to those activated using CO2. In the case of KOH activation, it was observed that increasing the activation temperature enhanced the development of micro- and mesopores at the expense of ultra-microporosity. Using a fixed-bed reactor under ambient pressure and a constant CO2 concentration (30% vol.), Mukherjee et al. [19] investigated the CO2 capture performance of adsorbents derived from spent coffee grounds at various activation temperatures (300–900 °C). The highest adsorption capacity, 123.2 mgCO2 gA−1, was recorded at 300 °C. A comparable adsorption performance (117.5 mgCO2 gA−1) at 35 °C and under pure CO2 was reported by Liu S.H. and Huang Y.Y. [25], who studied the temperature-dependent CO2 capture performance (35–50 °C), as well as the cyclic stability and selectivity of coffee-derived adsorbents.
Numerous studies [11,12,13,14,15,16,17,18,19,20,21,22,23,24,25,26,27,28,29,30,31] on the use of spent coffee ground-derived bioadsorbents present CO2 adsorption capacity results at atmospheric pressure using the thermogravimetric method for pure carbon dioxide [25,27,30] or a gas mixture [26,27], as well as adsorption isotherms using the volumetric method [24,26,28,29,30]. There are few data on investigations of such materials in VSA systems in adsorption–desorption cycles [26], as well as few works presenting an analysis of the material parameters at each stage of their transformation [27], i.e., from biowaste, through biochar, to bioadsorbent.
Therefore, the present study of coffee-based bioadsorbent focuses on three aspects: (1) showing the changes in physicochemical properties at each stage of obtaining the product, starting from the raw material; (2) studies of the adsorbent selectivity and CO2 adsorption capacity for different carbon dioxide concentrations in simulated gases, as well as variable temperatures showing their possible applications; and (3) multiple adsorption–desorption investigations to prove the bioadsorbent’s stability and confirm its suitability in CO2 capture VSA installations.
2. Materials and Methods
2.1. Bioadsorbent Preparation Method
The method of preparing bioadsorbent from food waste is detailed in Figure 1.
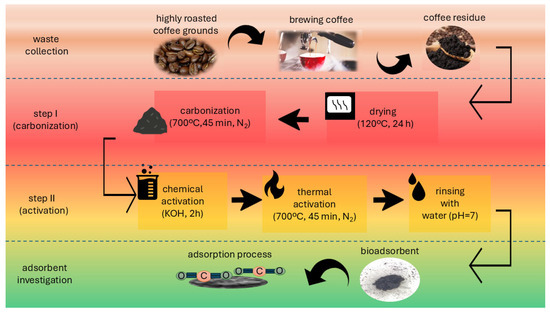
Figure 1.
Coffee-based bioadsorbent preparation method.
The bioadsorbent (AHRoCG—Activated Highly Roasted Coffee Grounds) was produced in a two-step process. In step I (carbonization), highly roasted coffee ground post-brewing residue (HRoCG—Highly Roasted Coffee Grounds) was pre-dried at room temperature and then dried at 120 °C for 24 h to remove moisture. Next, the material was carbonized at 700 °C for 45 min in a nitrogen atmosphere (the high temperature contributed to the decomposition of organic matter and the nitrogen prevented oxidation). The final product was porous carbon structures characteristic of biocarbon (CHRoCG—Carbonized Highly Roasted Coffee Grounds). In stage II (modification), the chemical activation of the CHRoCG was carried out using KOH. For this purpose, solid KOH was mixed with the CHRoCG in a mass ratio of 2:1 and moisturized for 2 h. Next, the mixture was dried at 105 °C in an air dryer for 24 h. After this, it was heated in a muffle furnace at a rate of 5 °C min−1 up to 700 °C in a nitrogen atmosphere. After 45 min of thermal activation at 700 °C, the mixture was cooled and washed with distilled water until pH = 7 to remove residual KOH. Finally the sample was dried at 105 °C in an air dryer for 12 h and denoted as AHRoCG.
The particles sizes of the biowaste subjected to the carbonization process, the biochar used in the activation process and the final product—the bioadsorbent—are presented in Figure 2.

Figure 2.
Particles images of (a) biowaste (HRoCG), (b) biocarbon (CHRoCG) and (c) bioadsorbent (AHRoCG).
Most HRoCG particles (Figure 2a) are in the range of 0.75–1.25 mm (the largest do not exceed 1.75 mm), CHRoCG (Figure 2b) are 0.5–1.0 mm (the maximum 1.75 mm), and, after activation, the bioadsorbent particles are (Figure 2c) 0.25–0.5 mm (the maximum ca. 1.25 mm). This confirms that the bioadsorbent production process reduces the size of the material at each step; however, from the point of view of application in fix beds, pelletization is required.
2.2. Material Characterization Methods
The physicochemical properties of the biowaste, biocarbon and bioadsorbent were characterized by a wide range of analyses. The chemical composition, including the carbon, hydrogen, nitrogen and sulfur contents in the sample, was ascertained using a CHNS analyzer (LECO TruSpec CHNS, LECO Corporation, St. Joseph, MI, USA). The thermal properties of the samples were characterized via thermogravimetric analysis (TGA/DSC1, Mettler Toledo, Greifensee, Switzerland). Each sample was heated at 10 °C min−1 from 25 to 800 °C under a nitrogen flow (50 cm3 min−1). The samples’ morphological features were investigated by scanning electron microscopy (S-3400N, Hitachi, Tokyo, Japan). Their porosity was determined via N2 adsorption–desorption isotherm performed at −196 °C using a sorptometer (ASAP 2010, Micromeritics, Norcross, GA, USA). The specific surface area was calculated via the BET method from the linear part of the BET plot according to the IUPAC (International Union of Pure and Applied Chemistry) recommendations using the adsorption isotherm (relative pressure (p/po) = 0.05–0.23). The total pore volume (Vp) was determined based on the maximum amount of N2 adsorbed within the pores of the samples at p/po of 0.99. The pore size distribution was calculated using the DFT method. The micropore volume (Wo) was determined based on N2 adsorption isotherms using the Dubin–Raduszkiewicz equation and assuming an adsorbed phase density of 0.808 cm3 g−1 and cross-sectional area of 0.162 nm2 [34]. The average pore width (Lo) was calculated using the Stoeckli–Ballerini equation [35]. Prior to adsorption, the samples were degassed at 300 °C overnight in a high vacuum. The changes in spectral functional groups during the transformation of biowaste into biochar—and then into bioadsorbent—were shown using FT-IR analysis in the spectral range of 4000–400 cm−1 (Nicolet iS10, ThermoFischer Scientific, Waltham, MA, USA).
2.3. Adsorption Capacity Investigations
2.3.1. Isotherms of CO2, O2, and N2
The adsorption equilibriums of three pure gases (99.999%), CO2, O2 and N2, on AHRoCG were ascertained using a gravimetric analyzer (IGA, Hiden Isochema, Warrington, UK). Before testing, the sample was regenerated by degassing for 24 h at 150 °C. Next, it was cooled to 25 °C and the adsorption process was started. Six equilibrium points were determined by stepwise pressure changes in the range of 0–1 bar. The measurement of a given isotherm point ended when the fluctuation of the sample mass reached 99.5% of the predicted asymptotic value. Based on the determined adsorption equilibrium points, the adsorption isotherms of the individual gases were plotted.
2.3.2. Thermogravimetry CO2 Adsorption Tests Using Different Gas Mixtures
The CO2 adsorption capacity of the bioadsorbent was examined using thermogravimetric analysis (TGA/SDTA 851e, Mettler Toledo, Greifensee, Switzerland). The investigation was conducted according to the isothermal adsorption test. Before the adsorption process, the sample of AHROcG was regenerated by (1) heating from 30 to 120 °C in a N2 atmosphere at a heating rate of 20 °C min−1, (2) baking at this temperature for 30 min in a N2 atmosphere (until a constant sample mass was achieved) and (3) cooling from 120 to 25 °C in a N2 atmosphere with a cooling rate of −5 °C min−1. Then, (4) the CO2 adsorption process was conducted isothermally at a temperature of 25 °C/50 °C/75 °C for 60 min under atmospheric pressure and a flow rate of 100 cm3 min−1, using four different gas compositions (expressed in % vol.): (1) 16.0% CO2; 80.5% N2; 3.5% O2 (characteristic for flue gases from conventional coal-fired plants); (2) 30% CO2; 60% N2; 10% O2 (in the case of exhaust gas from cement plants); (3) 81.5% CO2; 14.5% N2; 4.0% O2 (a concentration of flue gas from coal oxy-combustion or a concentration of CO2 in the enriched gas before the second stage of adsorption purification); and (4) 100% CO2 (as a reference, for which the adsorption capacity is as reported in the literature).
2.3.3. Cyclic Adsorption–Desorption Test
The several adsorption–desorption cycles were assessed using a TG-Vacuum system consisting of a (1) thermogravimetry analyzer TGA/SDTA 851e (Mettler Toledo, Greifensee, Switzerland), a (2) pressure control system (RVC 300, Pfeiffer, Aßlar, Germany), and a series of valves and a vacuum pump (Duo 5 M, Pfeiffer, Aßlar, Germany). In this way, we simulated the VSA CO2 capture process in order to estimate the regenerability and stability of the bioadsorbent. This system (shown in Figure 3) can be used as a fast laboratory method for assessing the ability of adsorbents to work in multi-stage adsorption–desorption cycles and thus determining their suitability for CO2 separation in VSA units.
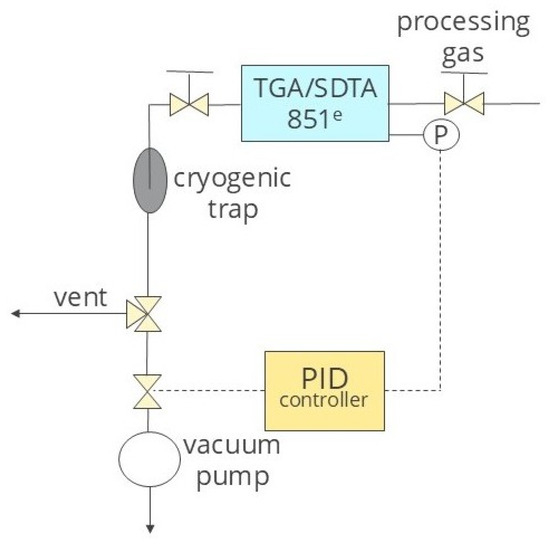
Figure 3.
Scheme of TG-Vacuum system.
Before each cyclic adsorption–desorption test, the bioadsorbent sample was prepared in four steps: (rI) heating from 30 to 120 °C at a rate of 20 °C min−1 in a N2 atmosphere and at a gas flow rate of 100 cm3 min−1, (rII) baking for 30 min at 120 °C in a N2 atmosphere and at a gas flow rate of 100 cm3 min−1 in order to degas (remove any moisture and volatile substances), (rIII) cooling to 25 °C at a rate of −5 °C min−1 in a N2 atmosphere and at a gas flow rate of 100 cm3 min−1, and (rIV) vacuum degassing at 25 °C for 15 min with no gas flow under the same pressure as applied during the cyclic desorption process, i.e., 30, 60 or 100 mbarabs. This step was conducted to remove the N2 from the measurement cell of the thermogravimetric analyzer, as well as the adsorbent pores. Then, after sample regeneration, a four-cycle adsorption–desorption test (ads I–IV/des I–IV) was carried out. The adsorption step was conducted in a CO2 atmosphere (100% vol.) for 15 min and at a flow rate of 100 cm3 min−1. This step was characterized by a gradual increase in pressure (from the set pressure in the desorption step to atmospheric pressure) in the measurement cell of the thermogravimetric analyzer in which the sample was placed. After CO2 sorption, a desorption process took place. The adsorbent was regenerated at three different vacuum levels, i.e., 30, 60 or 100 mbarabs, and maintained for 15 min without N2 flow. During cycles, the temperature was constant at 25 °C (the optimal temperature for CO2 sorption–desorption on physical sorbents). Based on the mass change, the following indicators were determined: CO2 adsorption capacity during the adsorption step (mass increase) and regeneration capability in the desorption step (mass decrease). The values were recorded in mgCO2 gA−1.
3. Results and Discussion
3.1. Physicochemical Properties of Bioadsorbent
The chemical composition of the HRoCG, as well as that of the obtained CHRoCG and AHRoCG, in the two-stage treatment process is shown in Figure 4. The initial biowaste had a carbon content of 44.8% w/w, which increased up to 66.7% w/w in the biochar and 68.9% w/w in the final bioadsorbent. This confirms the high-carbon content of the obtained material as a result of the carbonization of the HRoCG and following the activation of the CRoCG by KOH. The AHRoCG is characterized by higher nitrogen and lower hydrogen and oxygen contents compared to the HRoCG and CHRoCG. During the investigation, no sulfur was found in all three samples and, as such, these values are not included in the figure.
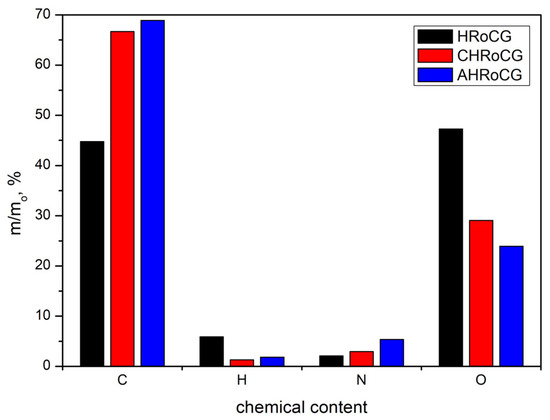
Figure 4.
The elemental composition of the biowaste (HRoCG) and its derived modification products, i.e., biochar (CHRoCG) and bioadsorbent (AHRoCG).
The three investigated materials’ thermal decomposition (TG curve) profiles and derivatives (DTG curve) during heating in an inert atmosphere (N2) at a rate of 10 °C min−1 are shown in Figure 5.
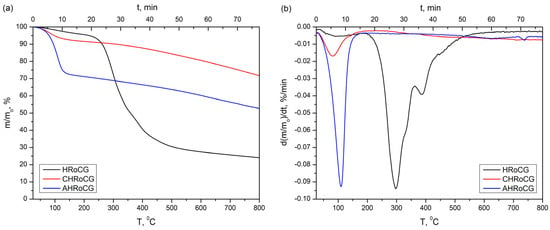
Figure 5.
Profiles of (a) TG and (b) DTG of the initial biowaste (HRoCG) and biochar (CHRoCG), as well as the bioadsorbent (AHRoCG) obtained as a result of its modification.
In the case of HRoCG, a twofold weight decrease can be observed. The first mass decrease (in the temperature range of 25–150 °C) results from the desorption of physically adsorbed water and amounts to about 3.2%. The second mass loss (220–550 °C) amounts to about 66.3% and is the result of the thermochemical biopolymer fraction conversion process. This includes cellulose and hemicellulose decomposition (the maximum peak observed on the DTG curve at 300 °C) and probably lignin degradation (at about 400 °C) [19]. In the case of CHReCG and AHReCG, significant dehydration-related mass loss (25–150 °C) can be observed; this was 7.5% in the first case, and 27.5% in the second.
The structure of the initial HRoCG, as well as that of the CHRoCG and AHRoCG obtained as a result of its modification, is shown through SEM photography in Figure 6.

Figure 6.
SEM images of (a) biowaste (HRoCG), (b) biocarbon (CHRoCG) and (c) bioadsorbent (AHRoCG).
An SEM image of the HRoCG (Figure 6a) shows a compact structure with a small number of visible primary pores, resulting from its lignocellulosic composition. The CHRoCG obtained through carbonization (Figure 6b) exhibits porosity (the presence of macropores), as formed by the removal of volatile components and the degradation of the lignin structure. Significant porosity developed after the biocarbon modification stage using KOH solution. The SEM image of AHRoCG (Figure 6c) reveals the presence of numerous fine micropores forming a highly regular network, which confirms the substantial microporosity of the bioadsorbent and, consequently, its potential for CO2 capture. Table 1 summarizes the textural parameters and specific surface area of raw biowaste, biocarbon and bioadsorbent.

Table 1.
Porous structure properties of biowastes, biocarbon, and bioadsorbents.
As presented in Table 1, the specific surface area of the HRoCG (0.21 m2/g) increased to 18 m2/g for the CHRoCG. Although carbonization effectively removes some volatile compounds and initiates pore development [15], only chemical activation using KOH (the most frequently studied method for activated carbon synthesis due to its ability to form a large quantity of micropores inside activated carbon [13]) leads to a significant increase in the specific surface area (up to 1580 m2/g) of the AHRoCG. During this process, micropores are created and expanded, and blocking organic fractions are removed, which significantly increases the availability of the sorption surface of the material [15]. The modification process not only enhances the surface area, but also leads to increased total pore (0.84 cm3/g) and micropore volumes (0.5 cm3/g), and a decrease in the average pore diameter of the AHRoCG to 0.96 nm.
Figure 7 presents the N2 adsorption–desorption isotherms for the AHRoCG (Figure 7a), as well as for the HRoCG and CHRoCG obtained through its modification (Figure 7b).
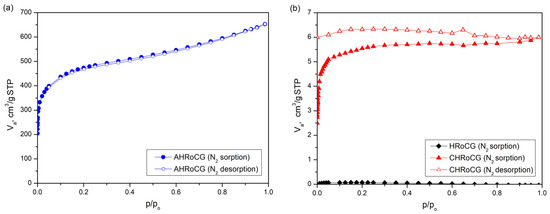
Figure 7.
N2 adsorption isotherms at −196 °C for (a) bioadsorbent (AHRoCG), (b) biocarbon (CHRoCG) and biowaste (HRoCG).
The AHRoCG (Figure 6a) exhibits a Type I isotherm according to the IUPAC, indicating that most of the N2 is adsorbed at low pressures without the presence of a hysteresis loop. A Type I isotherm suggests that the adsorbent is predominantly microporous [34]. In the case of the CHRoCG (Figure 7b), the presence of a Type IV isotherm indicates the existence of micropores as well as mesopores [36]. A noticeable H2-type hysteresis loop is also observed, which is characteristic of pore structures with narrow necks and wider bodies, causing diffusion limitations. At low relative pressures, adsorbate layer formation on the adsorbent surface occurs. The low pore volume also supports the mesoporous nature of this material. The raw HRoCG (Figure 7b) exhibits minimal N2 adsorption at high vapor pressures, which suggests a homogeneous structure with a negligible specific surface area and no porosity. The pore volume distributions by pore diameter of AHRoCG, CHRoCG and HRoCG are presented in Figure 8a,b.
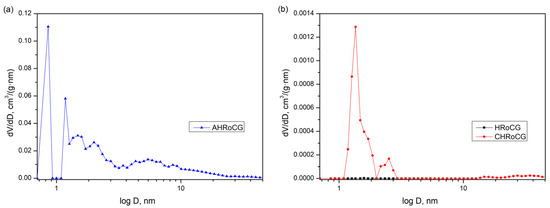
Figure 8.
Pore volume distribution by pore diameter for (a) bioadsorbent (AHRoCG), (b) biocarbon (CHRoCG) and biowaste (HRoCG).
As shown in Figure 8a, the majority of the total pore volume in AHRoCG is attributed to pores with a diameter of 0.86 nm, which classifies them as micropores (diameter < 2 nm). This confirms the dominant contribution of micropores in the structure of the resulting bioadsorbent. In turn, the CHRoCG (Figure 8b) is characterized by a total pore volume at a diameter of 1.36 nm (diameter < 2 nm), a small contribution at a diameter of 2.52 nm (diameter > 2 nm) and a negligible volume above 14 nm. This classifies the CHRoCG material as both microporous and mesoporous. In contrast, the raw HRoCG exhibits no porosity. In summary, the physicochemical properties, particularly the porous structure parameters of the obtained AHRoCG, indicate its significant potential for CO2 capture.
FT-IR analyses conducted (Figure 9) show spectrum changes in biowaste after the carbonization and activation processes.
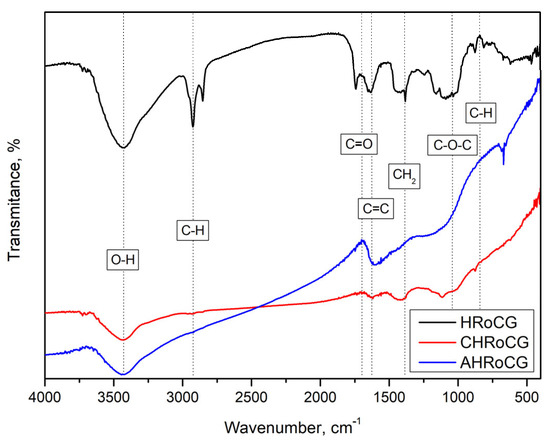
Figure 9.
FTIR of bioadsorbent (AHRoCG), biocarbon (CHRoCG) and biowaste (HRoCG).
The 850, 1050 and 1350 cm−1 bands correspond to the C-H, C-O-C and C-H2 bonds, which indicate the presence of cellulose and hemicellulose aromatics and disappear after thermal treatment. The 1600 cm−1 band is characteristic of lignin occurring in biomass, whereas in the case of biochar and bioadsorbent it indicates the appearance of a graphite-like structure. The bands in the 1700 cm−1 range represent the C=O stretching of carbonyl groups. The 2900 cm−1 band corresponds to the vibrations of C-H bonds in the aliphatic-chain structure and is not observed after the carbonization and activation processes. The last one at 3400 cm−1 is specific for -OH bonds of chemisorbed water. These FTIR spectrum results are similar to those reported by Ramos et al. [8].
3.2. CO2 Capture
3.2.1. Adsorption Isotherms of CO2, O2 and N2
The adsorption isotherms (Figure 10) show the relationship between the pure gas pressure in the bulk phase (in bar) and its concentration in the adsorbed phase (in mg g−1A).
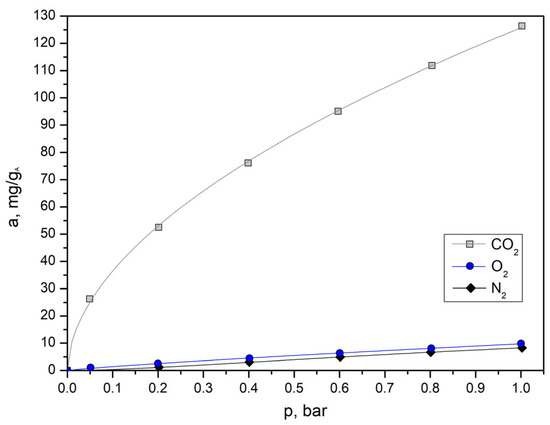
Figure 10.
Adsorption isotherms of CO2, O2, and N2.
The CO2 isotherm is characterized by nonlinearity and a sharp increase in carbon dioxide adsorption at low pressures. With increasing pressure, the capacity gradually decreases; however, it is still much greater than in O2 and N2 isotherms, which feature characteristic linearity and low adsorption of these gases.
In the case of a gas mixture, the parameter that determines the separation efficiency of one gas component with respect to another is the selectivity coefficient, which can be determined according to the following formula [7]:
where is the molar fractions of separated components in the adsorbed phase, is the molar fractions of another existing components in the adsorbed phase, is the molar fractions of separated components in the bulk phase and is another existing components in the bulk phase.
This is important for the studies described in Section 3.2.2 and Section 3.2.3. The selectivity coefficients of CO2/O2 and CO2/N2 for three gas mixtures are listed in Table 2.

Table 2.
CO2 selectivity coefficient of components.
As can be seen from Table 2, the selectivity coefficient depends on the partial pressures of CO2, O2, and N2 in gas mixtures. An increase in the partial pressure of one gas, e.g., CO2 (from 16.0 to 81.5%), at an almost constant partial pressure with the second gas (e.g., O2) increases the selectivity by more than double (from 12.7 to 27.1); in the case of a simultaneous reduction in the partial pressure of the second gas (e.g., N2 from 80.5 to 14.5%), a very significant increase—more than 22-fold (from 22.3 to 491.9)—is observed. Coffee-derived bioadsorbents presented in the literature show similar CO2/N2 selectivity coefficients. The coffee adsorbent obtained by Plaza M.G et al. [26] showed CO2/N2 selectivity ranging from 15 to 25 at 50 °C and 130 kPa for CO2 concentrations from 9% to 31%. In turn, the coffee-based bioadsorbent CAC-2–800 obtained by Wang et al. [29] showed a CO2/N2 coefficient equal to 33.
3.2.2. Effect of Temperature and CO2 Concentration on Carbon Dioxide Adsorption Capacity of Bioadsorbent
Figure 11, Figure 12, Figure 13 and Figure 14 present the carbon dioxide adsorption profiles of bioadsorbent at different feed gas CO2 concentrations (simulating the exhaust gases from various types of industries (16 vol.% CO2, 30 vol.% CO2, 81.5 vol.% CO2 and, for reference, 100 vol.% CO2), and at three different adsorption temperatures (25 °C, 50 °C and 75 °C). The initial sample weight of about 6.2 mg was subjected to temperature regeneration (comprising three steps: heating, baking and cooling). Next, the carbon dioxide adsorption process was carried out within 60 min at atmospheric pressure. The mass change during the whole process is indicated with a solid black line and the temperature change with a dashed red line. To better illustrate the adsorption capacity of the applied adsorbent (mgCO2 gA−1) in terms of unit mass, the main graph was supplemented with a nested graph (blue one).
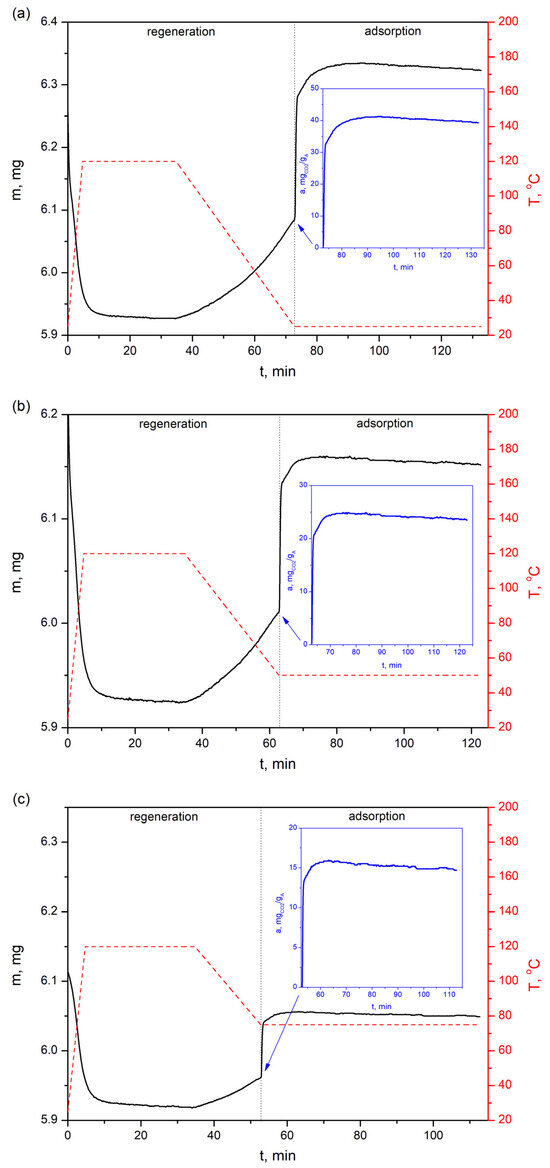
Figure 11.
CO2 sorption profiles of the bioadsorbent at three different temperatures—(a) 25 °C, (b) 50 °C and (c) 75 °C—with a feed gas of 16% vol. CO2.
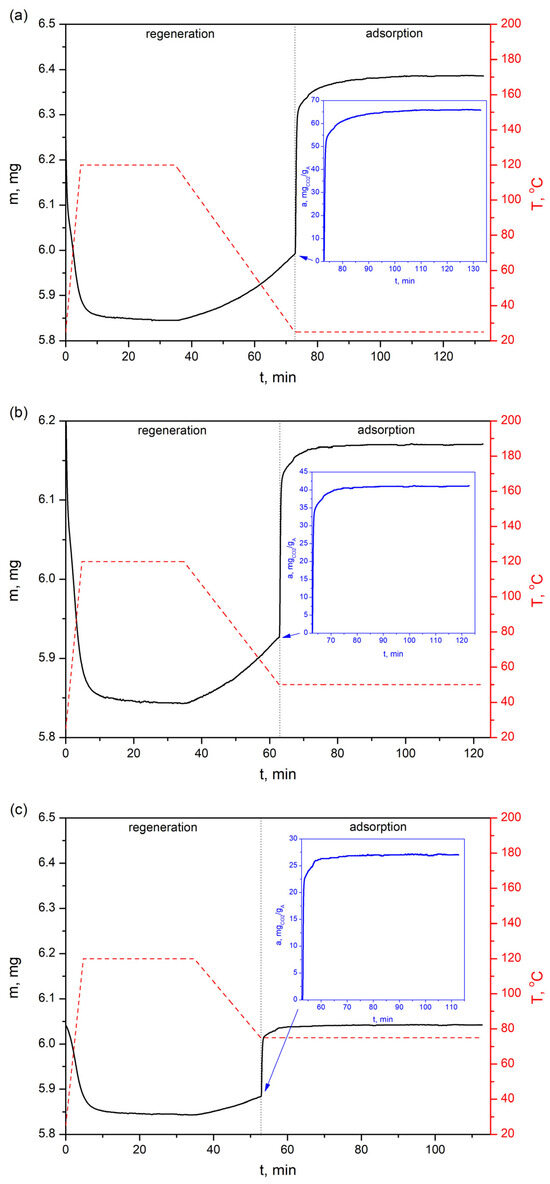
Figure 12.
CO2 sorption profiles of the bioadsorbent at three different temperatures—(a) 25 °C, (b) 50 °C and (c) 75 °C—with a feed gas of 30% vol. CO2.
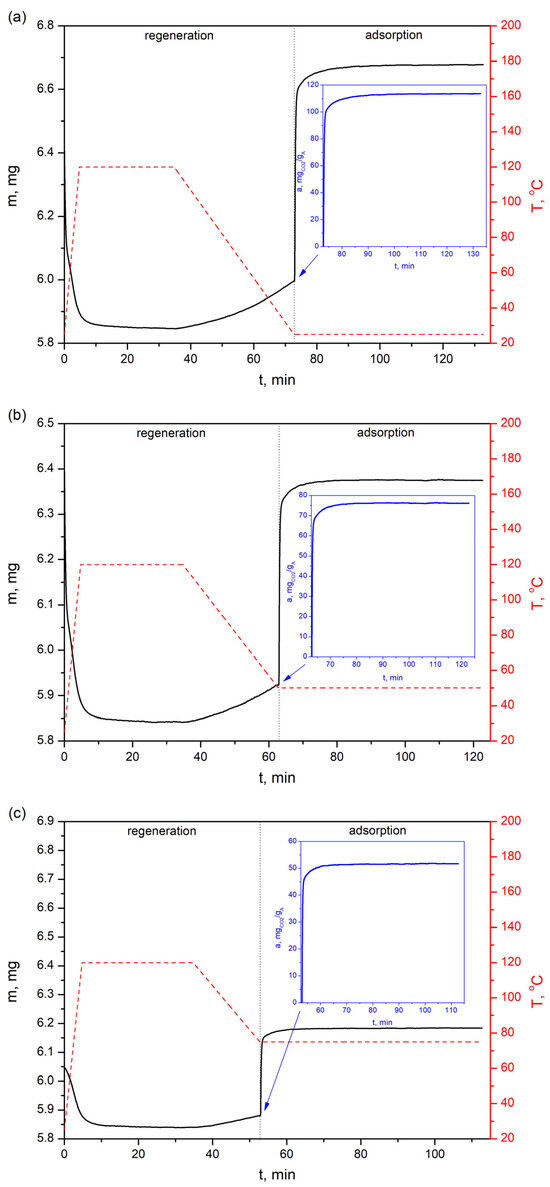
Figure 13.
CO2 sorption profiles of the bioadsorbent at three different temperatures—(a) 25 °C, (b) 50 °C and (c) 75 °C—with a feed gas of 81.5% vol. CO2.
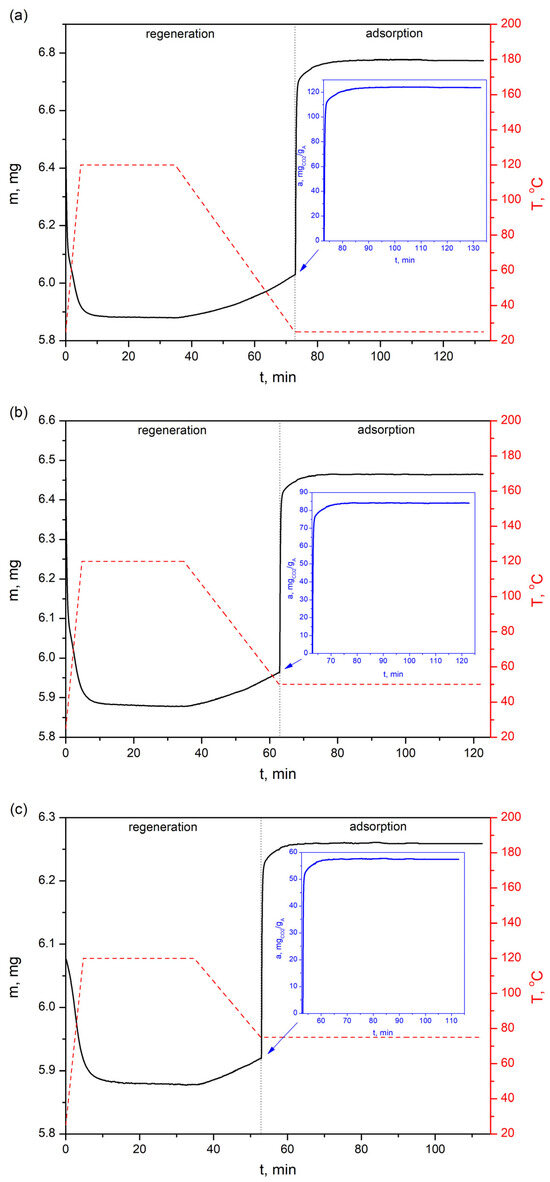
Figure 14.
CO2 sorption profiles of the bioadsorbent at three different temperatures—(a) 25 °C, (b) 50 °C and (c) 75 °C—with a feed gas of 100% vol. CO2.
The CO2 adsorption profiles in Figure 11 show that the adsorption capacity of AHRoCG at 16% vol. CO2 in the simulated gas mixture is 39.3 mgCO2 gA−1 at 25 °C (Figure 11a). This decreases with rising temperature to 23.5 mgCO2 gA−1 at 50 °C (Figure 11b) and 14.7 mgCO2 gA−1 at 75 °C (Figure 11c). The adsorption curves shown in Figure 11a–c indicate that the sorption process proceeds similarly and relatively quickly at each tested temperature. Plaza M.G et al. [26] studied the CO2 adsorption of coffee adsorbents and also showed fast adsorption kinetics, indicating their suitability as candidates for rapid swing adsorption cycles.
The CO2 adsorption profiles presented in Figure 12 show that the adsorption capacity on the AHRoCG at 30 vol.% CO2 is 65.8 mgCO2 gA−1 at 25 °C (Figure 12a), 41.2 mgCO2 gA−1 at 50 °C (Figure 12b) and 27.0 mgCO2 gA−1 at 75 °C (Figure 12c), decreasing with increasing temperature. A similar situation occurs for the highest analyzed CO2 concentrations in processing gases, i.e., for 81.5% vol. CO2 the adsorption capacity is 113.7 mgCO2 gA−1 at 25 °C (Figure 13a), 76.1 mgCO2 gA−1 at 50 °C (Figure 13b) and 51.7 mgCO2 gA−1 at 75 °C (Figure 13c), while for 100% vol. CO2: 123.6 mgCO2 gA−1 at 25 °C (Figure 14a), 84.0 mgCO2 gA−1 at 50 °C (Figure 14b) and 57.4 mgCO2 gA−1 at 75 °C (Figure 14c).
Figure 15 and Figure 16 summarize the CO2 adsorption capacity of the bioadsorbent depending on the temperature during the adsorption process and the concentration of carbon dioxide in the feed gas.
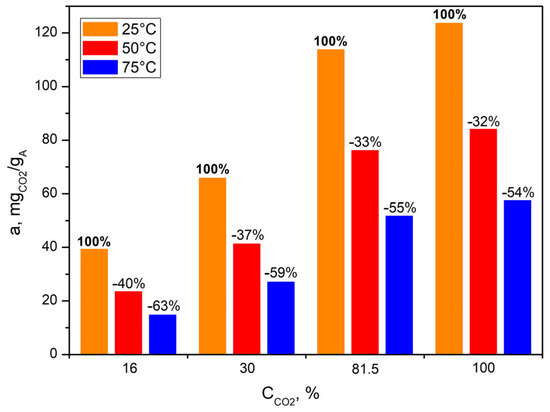
Figure 15.
CO2 uptake by bioadsorbent at four different feed gas carbon dioxide concentrations and under three different temperatures.
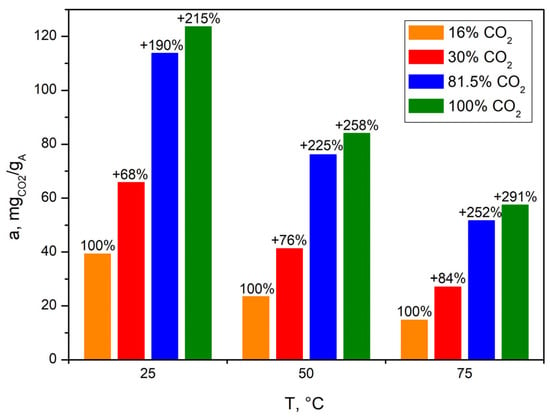
Figure 16.
CO2 uptake by bioadsorbent at three different temperatures and under four different feed gas carbon dioxide concentrations.
In the case of all tested CO2 concentrations in the simulated gases, the adsorption capacity of the bioadsorbent decreased with increasing process temperature, which is typical for physical adsorbents (Figure 15). This indicates that the most favorable temperature for the adsorption process is the lowest set, i.e., 25 °C.
Increases in temperature (from 25 °C to 50 °C and then to 75 °C) caused decreases in adsorption capacity of −40% and −63% w/w, respectively, in the case of 16% vol. CO2 in the exhaust gas. The higher the concentration of CO2 in the feed gas subjected to separation, the smaller the observed decrease in adsorption capacity: −37% and −59% in the case of 30% vol. CO2, −33% and −55% in the case of 81.5% vol. CO2 and −32% and −54% in the case of 100% vol. CO2.
Similar conclusions were drawn by Mukherjee et al. [19], who studied the CO2 capture of coffee adsorbents at different temperatures (from 30 °C to 90 °C) at a constant CO2 concentration (30 vol.%) under ambient pressure in a fixed-bed reactor. The authors found that the CO2 adsorption capacity decreased significantly with increasing temperature (from 30 °C to 90 °C), which is typical for physical adsorption. The coffee adsorbent they studied had the highest CO2 adsorption capacity of 123.2 mgCO2/gA−1 at 30 °C.
An increase in CO2 concentration in the feed gas increased the adsorption capacity of bioadsorbents (Figure 16). This is due to the higher concentration gradient between the gas molecules and the adsorbent surface, which results in a higher mass transfer coefficient. However, the decisive influence on mass transfer is, ultimately, adsorbent pore diffusion, which limits its rate [37].
Increasing the CO2 concentration from 16 to 30% vol. CO2, then to 81.5% vol. CO2, and finally to 100% vol. CO2 increased the bioadsorbent adsorption capacity by 68% w/w, 190% w/w and 215% w/w at 25 °C. However, the higher the temperature in the adsorption step, the more and more noticeable the mass increase becomes (76%, 225%, 258% w/w at 50 °C and 84%, 252%, 291% w/w at 75 °C); however, the capacities achieved in relation to 25 °C were lower.
The AHRoCG already showed a significant adsorption capacity of 39.3 mgCO2 gA−1 at 16% vol. CO2 in the feed gas and a temperature 25 °C. This indicates that it can be applied for gases with low CO2 concentrations such as flue gas from the power industry (10–16% vol. CO2). However, the higher the CO2 concentration in the feed gas, the greater capacity, which is seen at 30% vol. CO2 (65.8 mgCO2 gA−1 at 25 °C); this concentration is characteristic of the cement industry (20–30% vol. CO2).
3.2.3. VSA Process Simulation Tests
CO2 capture was simulated using the VSA technique and a TG-Vacuum system. After the adsorbent regeneration process (comprising four steps: (Ir) heating, (IIr) baking, (IIIr) cooling, (IVr) vacuum degassing), a sample with an initial weight of about 6 mg was subjected to four cyclic steps of carbon dioxide adsorption and desorption (ads I–IV/des I–IV). The results are presented in Figure 17, Figure 18 and Figure 19. In addition to the main graph presenting the mass changes in the sample during the whole experiment (solid black line), as well as the temperature changes (dashed red line), the nested graph (blue one) was also included, which shows the CO2 adsorption capacity of the adsorbent for four adsorption–desorption cycles, normalized to the initial value. The adsorption steps (ads I–IV) were carried out by slowly compressing the thermogravimeter measurement cell using pure CO2 from the set negative pressure (in the regeneration step) to ambient pressure (in the adsorption step). The ambient pressure was usually reached 4 min before the end of the adsorption step. The results were illustrated in the form of growing mass curves, reaching equilibrium before the end of the step. In turn, the desorption steps (des I–IV) were conducted by quickly depressurizing the thermogravimeter measurement cell to the set negative pressure, usually within about 3 min, and maintaining this at constant level until the end of the step with no purge gas flow. This process shows a rapid decrease in mass until the set vacuum pressure is reached, after which the mass decrease slows down significantly; this is related to the rate at which the component diffuses out of the adsorbent. In adsorbent use for industrial installations, it is not necessary to conduct full regeneration (which may take longer). In this way, these tests allow us to estimate adsorbent stability and provide information about its suitability for continuous operation in industrial installations.
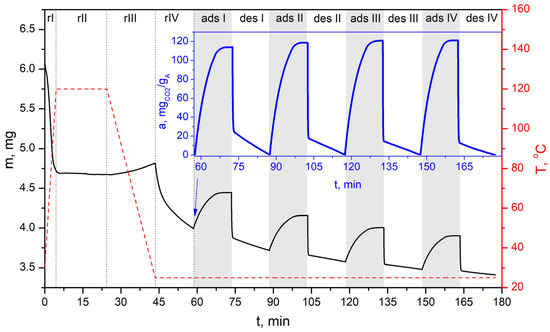
Figure 17.
TG-Vacuum test of simulated cyclic VSA process for CO2 capture of bioadsorbent (AHRoCG) using a pressure of 30 mbarabs in the desorption step.
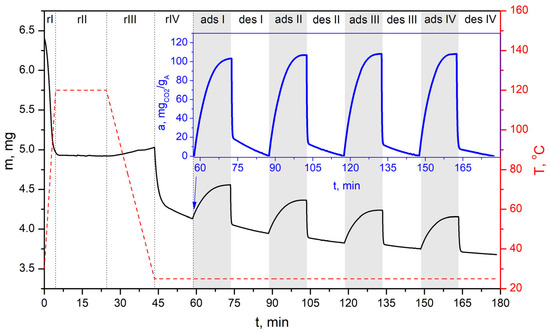
Figure 18.
TG-Vacuum test of simulated cyclic VSA process for CO2 capture of bioadsorbent (AHRoCG) using a pressure of 60 mbarabs in the desorption step.
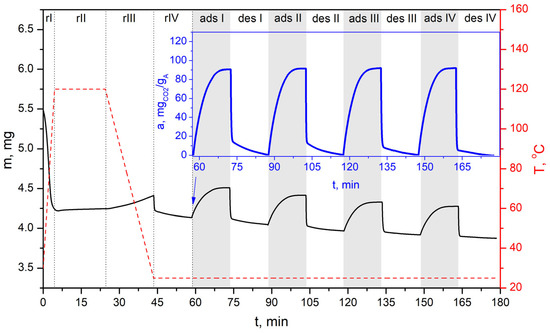
Figure 19.
TG-Vacuum test of simulated cyclic VSA process for CO2 capture of bioadsorbent (AHRoCG) using a pressure of 100 mbarabs in the desorption step.
The tests conducted using the TG-Vacuum system, simulating the VSA process, confirmed the very good sorption–desorption performance of the investigated bioadsorbent (Figure 17, Figure 18 and Figure 19). The resulting profiles indicate that stable adsorption–desorption cycle was gradually reached, demonstrating decreasing differences between the initial and final mass of the adsorbent in a particular cycle (solid black line). However, the working CO2 adsorption capacities (solid blue lines) remain at a similar level across successive cycles (starting from cycle 3). This demonstrates the bioadsorbent’s achieved stability. The working CO2 adsorption capacity is equal ca. 121 mgCO2 gA−1 at a desorption pressure of 30 mbarabs, ca. 108 mgCO2 gA−1 at 60 mbarabs, and ca. 92 mgCO2 gA−1 at 100 mbarabs. As shown in Figure 17, Figure 18 and Figure 19, no reduction in the working CO2 adsorption capacity was observed, which confirms the adsorbent’s good stability and potential for use in multicyclic processes. The possibility of using coffee-based adsorbents in VSA systems was investigated by Plaza M.G et al. [26]. They tested various VSA cycle configurations at 50 °C in a fixed-bed adsorption unit to evaluate the adsorbent’s performance under cyclic operation. The tested coffee-derived adsorbent showed no signs of deactivation during extended operation in the VSA system.
A preliminary evaluation of the bioadsorbent using the TG-Vacuum system to simulate the VSA process determined the stability of the obtained material during adsorption–desorption cycles (Figure 20). This feature is of key importance in practical applications, i.e., for filling adsorption columns in VSA installations. Table 3 presents a comparison of the CO2 sorption capacities of different coffee ground-derived bioadsorbents, as presented both in this work and in the literature.
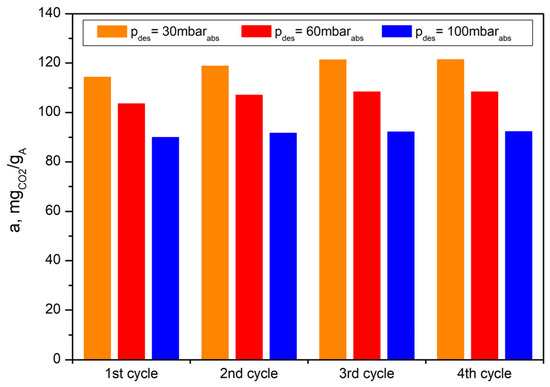
Figure 20.
Working CO2 adsorption capacities of bioadsorbent (AHRoCG) in four subsequent cycles of the simulated VSA process using TG-Vacuum system.

Table 3.
Comparison of CO2 adsorption capacity of selected bioadsorbents obtained from coffee grounds.
In this work, the CO2 adsorption capacity of the coffee ground-derived bioadsorbent (at 25 °C) was close to the values reported in the literature, ranging from 92.4 mgCO2 gA−1 [27] to 199.8 mgCO2 gA−1 [31]. The high adsorption capacity, combined with its good regenerability and stability in multi-stage adsorption–desorption processes, indicates these adsorbents’ significant potential for CO2 capture in the power industry and other sectors.
4. Conclusions
CO2 adsorption studies conducted on bioadsorbent derived from highly roasted coffee grounds showed that, due to the porous structure developed (large specific surface area and large pore volume, particularly including micropores), the adsorbent is suitable for carbon dioxide removal in the power industry and other sectors in VSA installations. The pore structure developed, particularly the existence of narrow micropores, confers high adsorption potential and is the basis for effective CO2 adsorption. In addition to its high CO2 adsorption capacity, the bioadsorbent demonstrated high selectivity in terms of CO2, regenerability and stability. The CO2 adsorption capacity of the bioadsorbent rose with increasing feed gas CO2 concentration and decreased with increasing temperature. The use of the bioadsorbent in several subsequent adsorption–desorption cycles did not reduce its working adsorption capacity. Tests using the TG-Vacuum system confirmed that the use of a vacuum at the desorption step is beneficial due to the bioadsorbent’s rapid regeneration.
Author Contributions
Conceptualization, M.S. and I.M.-K.; methodology, M.S.; investigation, D.W. and M.S.; data curation, D.W., M.S. and I.M.-K.; writing—original draft preparation, M.S.; writing—review and editing, I.M.-K. and D.W.; visualization, D.W. and M.S.; supervision, I.M.-K. and D.W. All authors have read and agreed to the published version of the manuscript.
Funding
The scientific research was funded by the statute subvention of Czestochowa University of Technology, Faculty of Infrastructure and Environment.
Data Availability Statement
The data are contained within the article.
Conflicts of Interest
The authors declare no conflicts of interest.
Abbreviations
The following abbreviations are used in this manuscript:
| a | Adsorption capacity, mgCO2 gA−1 |
| ads I-IV | Adsorption steps |
| AHRoCG | Activated highly roasted coffee grounds |
| BET | Brunner–Emmett–Teller method |
| CCO2 | Carbon dioxide concentration, % vol. |
| CHRoCG | Carbonized highly roasted coffee grounds |
| CCS | Carbon Capture and Storage |
| CCU | Carbon Capture and Utilization |
| des I-IV | Desorption steps |
| HRoCG | Highly roasted coffee grounds |
| IUPAC | International Union of Pure and Applied Chemistry |
| m | Mass, mg |
| Lo | Average pore width, nm |
| MOFs | Metal–organic frameworks |
| PSA | Pressure swing adsorption |
| PTSA | Pressure temperature swing adsorption |
| S | Selectivity coefficient |
| SBET | Specific surface area calculated using the BET method, m2 g−1 |
| SEM | Scanning electron microscope |
| t | Time, min |
| T | Temperature, °C |
| TG | Thermogravimetry |
| TSA | Temperature Swing Adsorption |
| VSA | Vacuum swing adsorption |
| Vp | Total pore volume, cm3 g−1 |
| VPSA | Vacuum pressure swing adsorption |
| VTSA | Vacuum temperature swing adsorption |
| Wo | Micropore volume, cm3 g−1 |
| x | Molar fraction of separated component in the adsorbed phase |
| y | Molar fraction of component in the bulk phase |
| Ir | Heating |
| IIr | Baking |
| IIIr | Cooling |
| IVr | Vacuum degassing |
References
- Ghiat, I.; Al Ansari, T. A review of carbon capture and utilisation as a CO2 abatement opportunity within the EWF nexus. J. CO2 Util. 2021, 45, 101432. [Google Scholar] [CrossRef]
- Brown, T.; Gambhir, A.; Florin, L.; Fennel, P. Reducing of CO2 Emissions from Heavy Industry: A Review of Technologies and Considerations for Policy Makers. Ph.D. Thesis, Imperial College London, London, UK, 2012. Available online: https://www.imperial.ac.uk/media/imperial-college/grantham-institute/public/publications/briefing-papers/Reducing-CO2-emissions-from-heavy-industry---Grantham-BP-7.pdf (accessed on 19 May 2025).
- Wawrzyńczak, D. Adsorption technology for CO2 capture. In The Carbon Chain in Carbon Dioxide Industrial Utilization Technologies: A Case Study, 1st ed.; Wawrzyńczak, D., Majchrzak-Kucęba, I., Pevida, C., Bonura, G., Nogueira, R., De Falco, M., Eds.; CRC Press: Boca Raton, FL, USA, 2022; pp. 37–62. [Google Scholar]
- Wawrzyńczak, D.; Majchrzak-Kucęba, I.; Srokosz, K.; Kozak, M.; Nowak, W.; Zdeb, J.; Smółka, W.; Zajchowski, A. The pilot dual-reflux vacuum pressure swing adsorption unit for CO2 capture from flue gas. Sep. Purif. Technol. 2019, 209, 560–570. [Google Scholar] [CrossRef]
- Majchrzak-Kucęba, I.; Wawrzyńczak, D.; Zdeb, J.; Smółka, W.; Zajchowski, A. Treatment of flue gas in a CO2 capture pilot plant for a commercial CFB boiler. Energies 2021, 14, 2458. [Google Scholar] [CrossRef]
- Ciora, R.J.; Sengupta, B.; Wang, F.; Li, S.; Yu, M. Direct modification of pelletized 13X zeolite by atomic layer deposition toward effective CO2 capture from flue gas. Chem. Eng. J. 2024, 497, 154733. [Google Scholar] [CrossRef]
- Kostkova, N.; Vorokhta, M.; Kormunda, M.; Pilar, R.; Sadovska, G.; Honcova, P.; Mikyskova, E.; Moravkova, J.; Sazama, P. Controlling the structure of nitrogen-doped zeolite-templated carbon for CO2 capture based on the synthesis conditions. Microporous Mesoporous Mater. 2024, 379, 113286. [Google Scholar] [CrossRef]
- Ramos, P.B.; Jerez, F.; Erans, M.; Mamaní, A.; Ponce, M.F.; Sardella, M.F.; Sanz-Pérez, E.S.; Sanz, R.; Arencibia, A.; Bavio, M.A. Environmentally valorization of olive tree pruning residue: Activated carbons for CO2 capture and energy storage in supercapacitors. Biomass Bioenergy 2025, 194, 107669. [Google Scholar] [CrossRef]
- Cen, Q.; Fang, M.; Wang, T.; Majchrzak-Kucęba, I.; Wawrzyńczak, D.; Luo, Z. Thermodynamics and regeneration studies of CO2 adsorption on activated carbon. Greenh. Gases Sci. Technol. 2016, 6, 787–796. [Google Scholar] [CrossRef]
- Majchrzak-Kucęba, I.; Ściubidło, A. Shaping metal-organic frameworks (MOFs) powder materials for CO2 capture applications—Thermogravimetric study. J. Therm. Anal. Calorim. 2019, 138, 4139–4144. [Google Scholar] [CrossRef]
- Dissanayake, P.D.; You, S.; Igalavithana, A.D.; Xia, Y.; Bhatnagar, A.; Gupta, S.; Kua, H.W.; Kim, S.; Kwon, J.-H.; Tsang, D.C.W.; et al. Biochar-based adsorbents for carbon dioxide capture: A critical review. Renew. Sustain. Energy Rev. 2020, 119, 109582. [Google Scholar] [CrossRef]
- Ochedi, F.O.; Liu, Y.; Adewuyi, Y.G. State-of-the-art review on capture of CO2 using adsorbents prepared from waste materials. Process. Saf. Environ. Prot. 2020, 139, 1–25. [Google Scholar] [CrossRef]
- Ghafar, N.A.; Harimisa, G.E.; Jusoh, N.W.C. Biowaste-based porous adsorbent for carbon dioxide adsorption. IOP Conf. Ser. Mater. Sci. Eng. 2021, 1051, 012081. [Google Scholar] [CrossRef]
- Xu, Y.; Yang, Z.; Zhang, G.; Zhao, P. Excellent CO2 adsorption performance of nitrogen-doped waste biocarbon prepared with different activators. J. Clean. Prod. 2020, 264, 121645. [Google Scholar] [CrossRef]
- Singh, G.; Ruban, A.M.; Geng, X.; Vinu, A. Recognizing the potential of K-salts, apart from KOH, for generating porous carbons using chemical activation. Chem. Eng. J. 2023, 451, 139045. [Google Scholar] [CrossRef]
- Mallesh, D.; Anbarasan, J.; Kumar, P.M.; Upendar, K.; Chandrashekar, P.; Rao, B.V.S.K.; Lin-gaiah, N. Synthesis, characterization of carbon adsorbents derived from waste biomass and its ap-plication to CO2 capture. Appl. Surf. Sci. 2020, 530, 147226. [Google Scholar] [CrossRef]
- Sreńscek-Nazzal, J.; Kamińska, A.; Serafin, J.; Michalkiewicz, B. Chemical activation of banana peel waste-derived biochar using KOH and urea for CO2 capture. Materials 2024, 17, 872. [Google Scholar] [CrossRef] [PubMed]
- Adan-Mas, A.; Alcaraz, L.; Arévalo-Cid, P.; López-Gómez, F.A.; Montemor, F. Coffee-derived activated carbon from second biowaste for supercapacitor applications. Waste Manag. 2021, 120, 280–289. [Google Scholar] [CrossRef] [PubMed]
- Mukherjee, A.; Borugadda, V.B.; Dynes, J.J.; Niu, C.; Dalai, A.K. Carbon dioxide capture from flue gas in biochar produced from spent coffee grounds: Effect of surface chemistry and porous structure. J. Environ. Chem. Eng. 2021, 9, 106049. [Google Scholar] [CrossRef]
- Igalavithana, A.D.; Choi, S.W.; Dissanayake, P.D.; Shang, J.; Wang, C.-H.; Yang, X.; Kim, S.; Tsang, D.C.; Lee, K.B.; Ok, Y.S. Gasification biochar from biowaste (food waste and wood waste) for effective CO2 adsorption. J. Hazard. Mater. 2020, 391, 121147. [Google Scholar] [CrossRef] [PubMed]
- Querejeta, N.; Gil, M.V.; Rubiera, F.; Pevida, C.; Wawrzyńczak, D.; Panowski, M.; Majchrzak-Kucęba, I. Bio-engineering of carbon adsorbents to capture CO2 from industrial sources: The cement case. Sep. Purif. Technol. 2024, 330, 125407. [Google Scholar] [CrossRef]
- Zhang, B.; Jiang, Y.; Balasubramanian, R. Synthesis of biowaste-derived carbon foam for CO2 capture. Resour. Conserv. Recycl. 2022, 185, 106453. [Google Scholar] [CrossRef]
- Kourmentza, C.; Economou, C.N.; Tsafrakidou, P.; Kornaros, M. Spent coffee grounds make much more than waste: Exploring recent advances and future exploitation strategies for the valorization of an emerging food waste stream. J. Clean. Prod. 2018, 172, 980–992. [Google Scholar] [CrossRef]
- Travis, W.; Gadipelli, S.; Guo, Z. Superior CO2 adsorption from waste coffee ground derived carbons. RSC Adv. 2015, 5, 29558–29562. [Google Scholar] [CrossRef]
- Liu, S.H.; Huang, Y.Y. Valorization of coffee grounds to biochar-derived adsorbents for CO2 adsorption. J. Clean. Prod. 2018, 175, 354–360. [Google Scholar] [CrossRef]
- Plaza, M.G.; González, A.Z.; Pevida, C.; Rubiera, F. Green coffee based CO2 adsorbent with high performance in post-combustion conditions. Fuel 2015, 140, 633–648. [Google Scholar] [CrossRef]
- Plaza, M.G.; González, A.; Pevida, C.; Pis, J.J.; Rubiera, F. Valorization of spent coffee grounds as CO2 adsorbents for post- combustion capture applications. Appl. Energy 2012, 99, 272–279. [Google Scholar] [CrossRef]
- González, A.S.; Plaza, M.G.; Pis, J.J.; Rubiera, F.; Pevida, C. Post-combustion CO2 capture adsorbents from spent coffee grounds. Energy Procedia 2013, 37, 134–141. [Google Scholar] [CrossRef][Green Version]
- Wang, H.; Li, X.; Cui, Z.; Fu, Z.; Yang, L.; Liu, G.; Li, M. Coffee grounds derived N enriched microporous activated carbons: Efficient adsorbent for post-combustion CO2 capture and conversion. J. Colloid Interface Sci. 2000, 578, 491–499. [Google Scholar] [CrossRef] [PubMed]
- Querejeta, N.; Gil, M.V.; Rubiera, F.; Pevida, C. Sustainable coffee-based CO2 adsorbents: Toward a greener production via hydrothermal carbonization. Greenh. Gases Sci. Technol. 2018, 8, 309–323. [Google Scholar] [CrossRef]
- Kim, M.J.; Choi, S.W.; Kim, H.; Mun, S.; Lee, K.B. Simple synthesis of spent coffee ground-based microporous carbons using K2CO3 as an activation agent and their application to CO2 capture. Chem. Eng. J. 2020, 397, 125404. [Google Scholar] [CrossRef]
- Boonchuay, A.; Worathanakul, P. The diffusion behavior of CO2 adsorption from a CO2/N2 gas mixture on zeolite 5A in a fixed-bed column. Atmosphere 2022, 13, 513. [Google Scholar] [CrossRef]
- Zhao, N.; Liu, Z.; Yu, T.; Yan, F. Spent coffee grounds: Present and future of environmentally friendly applications on industries-A review. Trends Food Sci. Technol. 2024, 143, 104312. [Google Scholar] [CrossRef]
- Mcenanev, B. Estimation of the dimensions of micropores in active carbons using the Dubinin—Radushkevich equation. Carbon 1987, 25, 69–75. [Google Scholar] [CrossRef]
- Carrott, P.J.M.; Carrott, M.R. Evaluation of the Stoeckli method for the estimation of micropore size distributions of activated charcoal cloths. Carbon 1999, 37, 647–656. [Google Scholar] [CrossRef]
- Gregg, S.J.; Sing, K.S.W. Adsorption, Surface Area and Porosity, 2nd ed.; Academic Press: London, UK, 1982. [Google Scholar]
- Coffee Report and Outlook. International Coffee Organization. December 2023. Available online: https://icocoffee.org/documents/cy2023-24/Coffee_Report_and_Outlook_December_2023_ICO.pdf (accessed on 23 June 2025).
Disclaimer/Publisher’s Note: The statements, opinions and data contained in all publications are solely those of the individual author(s) and contributor(s) and not of MDPI and/or the editor(s). MDPI and/or the editor(s) disclaim responsibility for any injury to people or property resulting from any ideas, methods, instructions or products referred to in the content. |
© 2025 by the authors. Licensee MDPI, Basel, Switzerland. This article is an open access article distributed under the terms and conditions of the Creative Commons Attribution (CC BY) license (https://creativecommons.org/licenses/by/4.0/).