
A Discrete-Event Based Power Management System Framework for AC Microgrids

 ,
,  ,
,  , ,
, ,  and
and 
Abstract
1. Introduction
- Step-by-step implementation guide: a detailed step-by-step methodology is provided, which defines discrete events, microgrid component models, supervisory controller synthesis, and its realization in MATLAB Stateflow. This practical guide ensures that researchers and practitioners can replicate and adapt the proposed methodology to their specific microgrid configurations.
- Development of an improved PMS based on SCT with the following new functionalities: (i) grid-connected and islanded operation; (ii) peak shaving; (iii) voltage support; (iv) load shedding function.
- Integration of two types of renewable energy resources: a PV and a Wind power Plant operating simultaneously, controlled by an SCT-based PMS.
2. Supervisory Control Theory for Discrete Event Systems
2.1. Background of Discrete-Event Systems
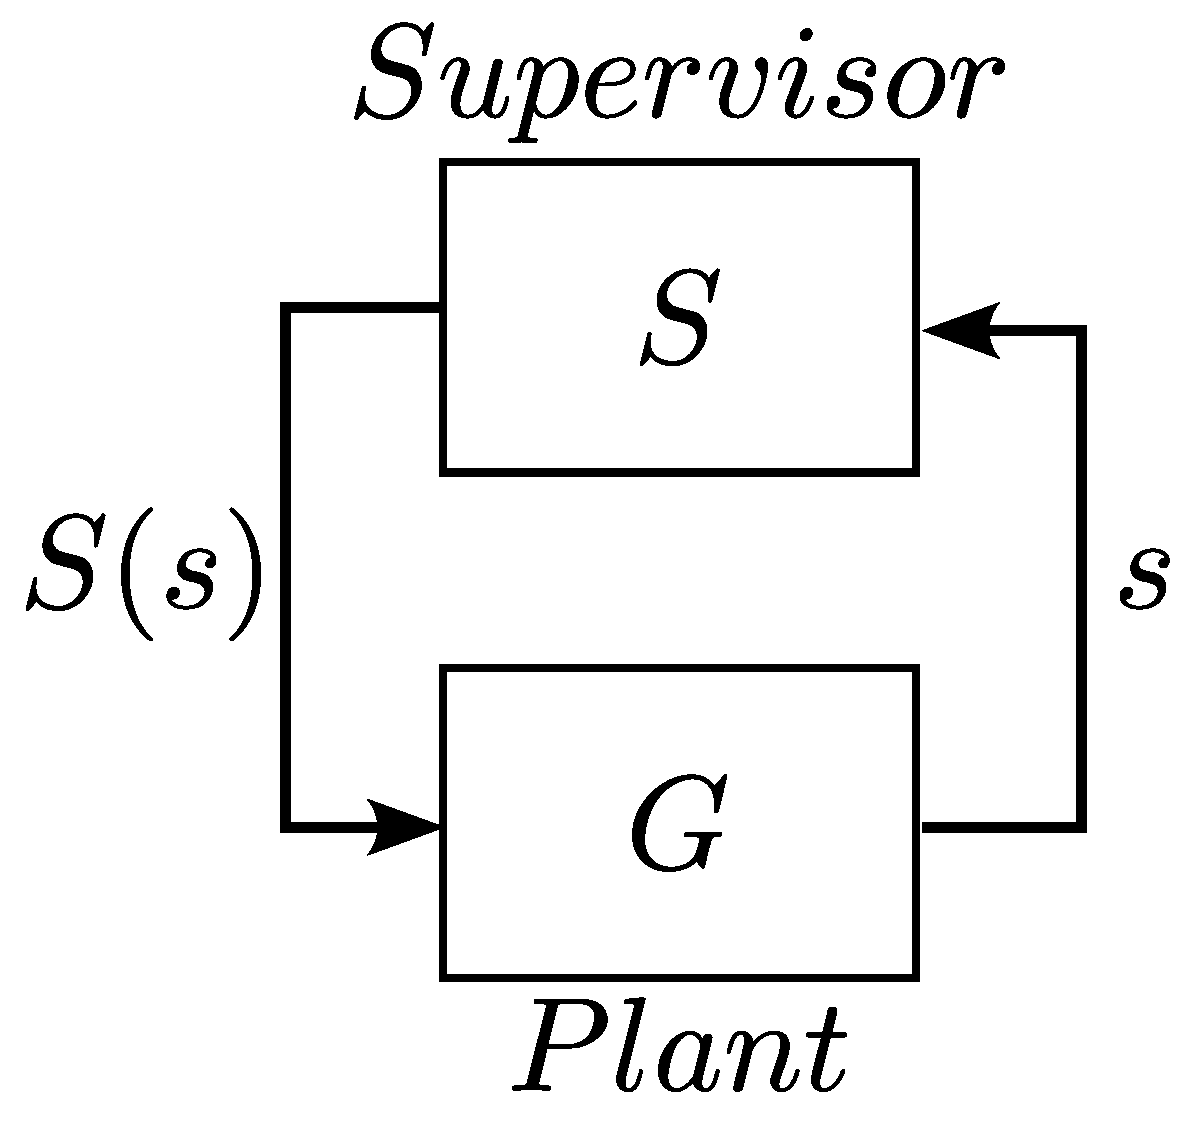
2.2. Supervisory Control Theory of DES
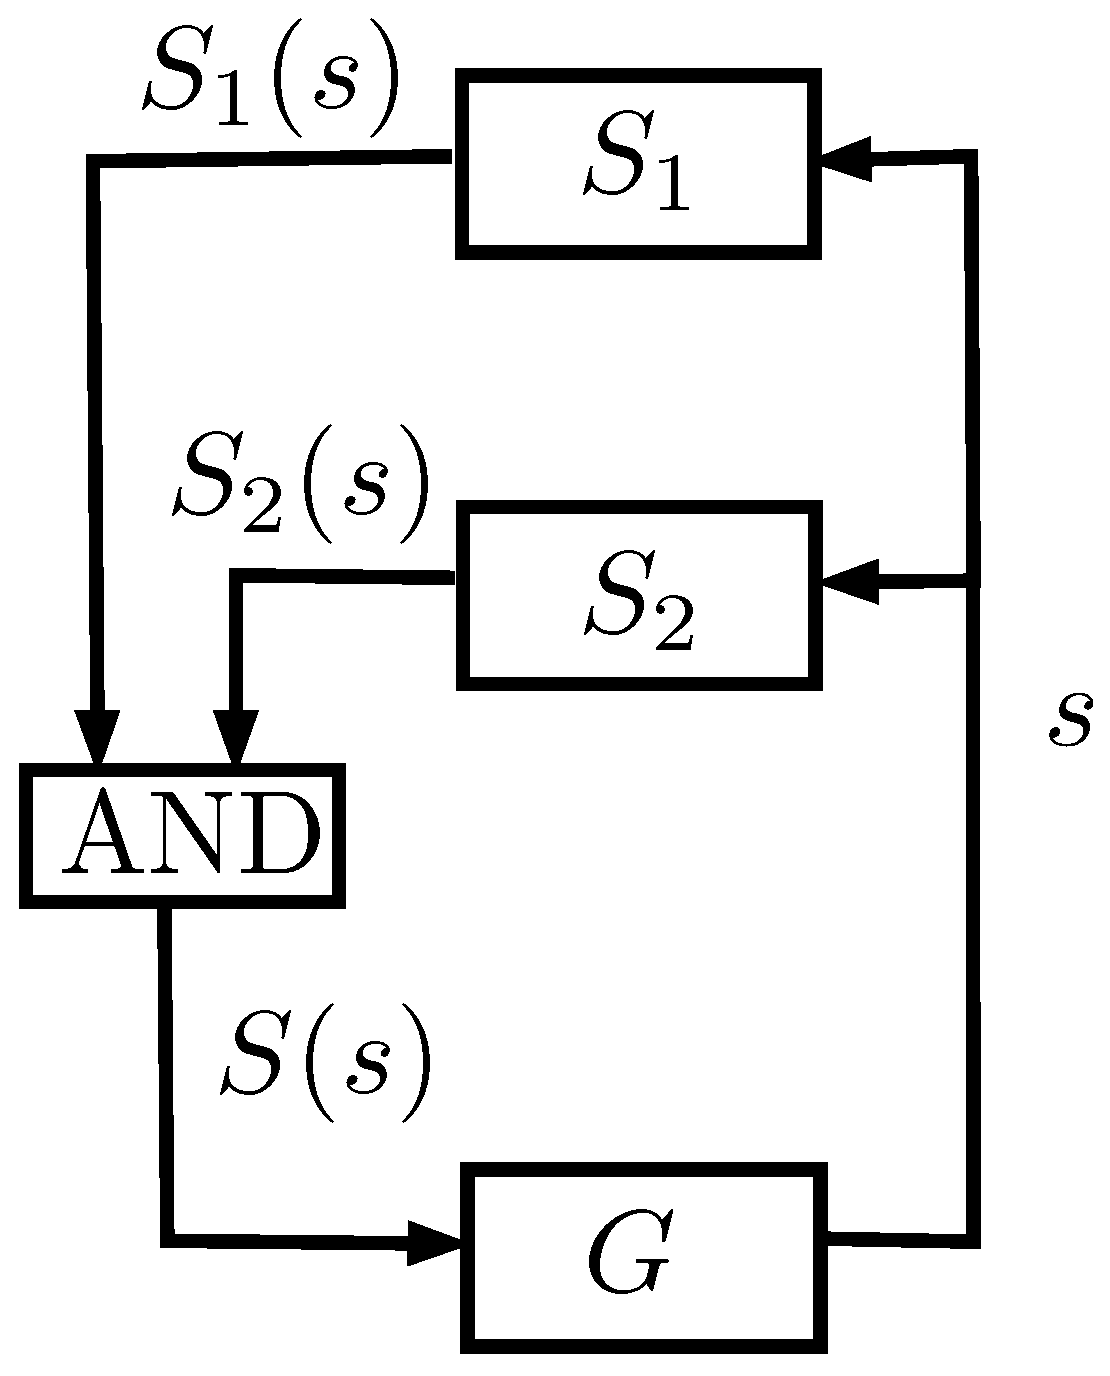
2.3. Decentralized Supervisory Control
3. A Framework for PMS Design Based on Supervisory Control Theory
- (i)
- Define events for PMS modeling;
- (ii)
- Model microgrid components;
- (iii)
- Model microgrid requirements;
- (iv)
- Synthesis of PMS decentralized supervisors;
- (v)
- PMS supervisor realization in MATLAB Stateflow.
3.1. Define Events for PMS Modeling
3.2. Model Microgrid Components
3.3. Model Microgrid Requirements
3.4. Synthesis of PMS Decentralized Supervisors
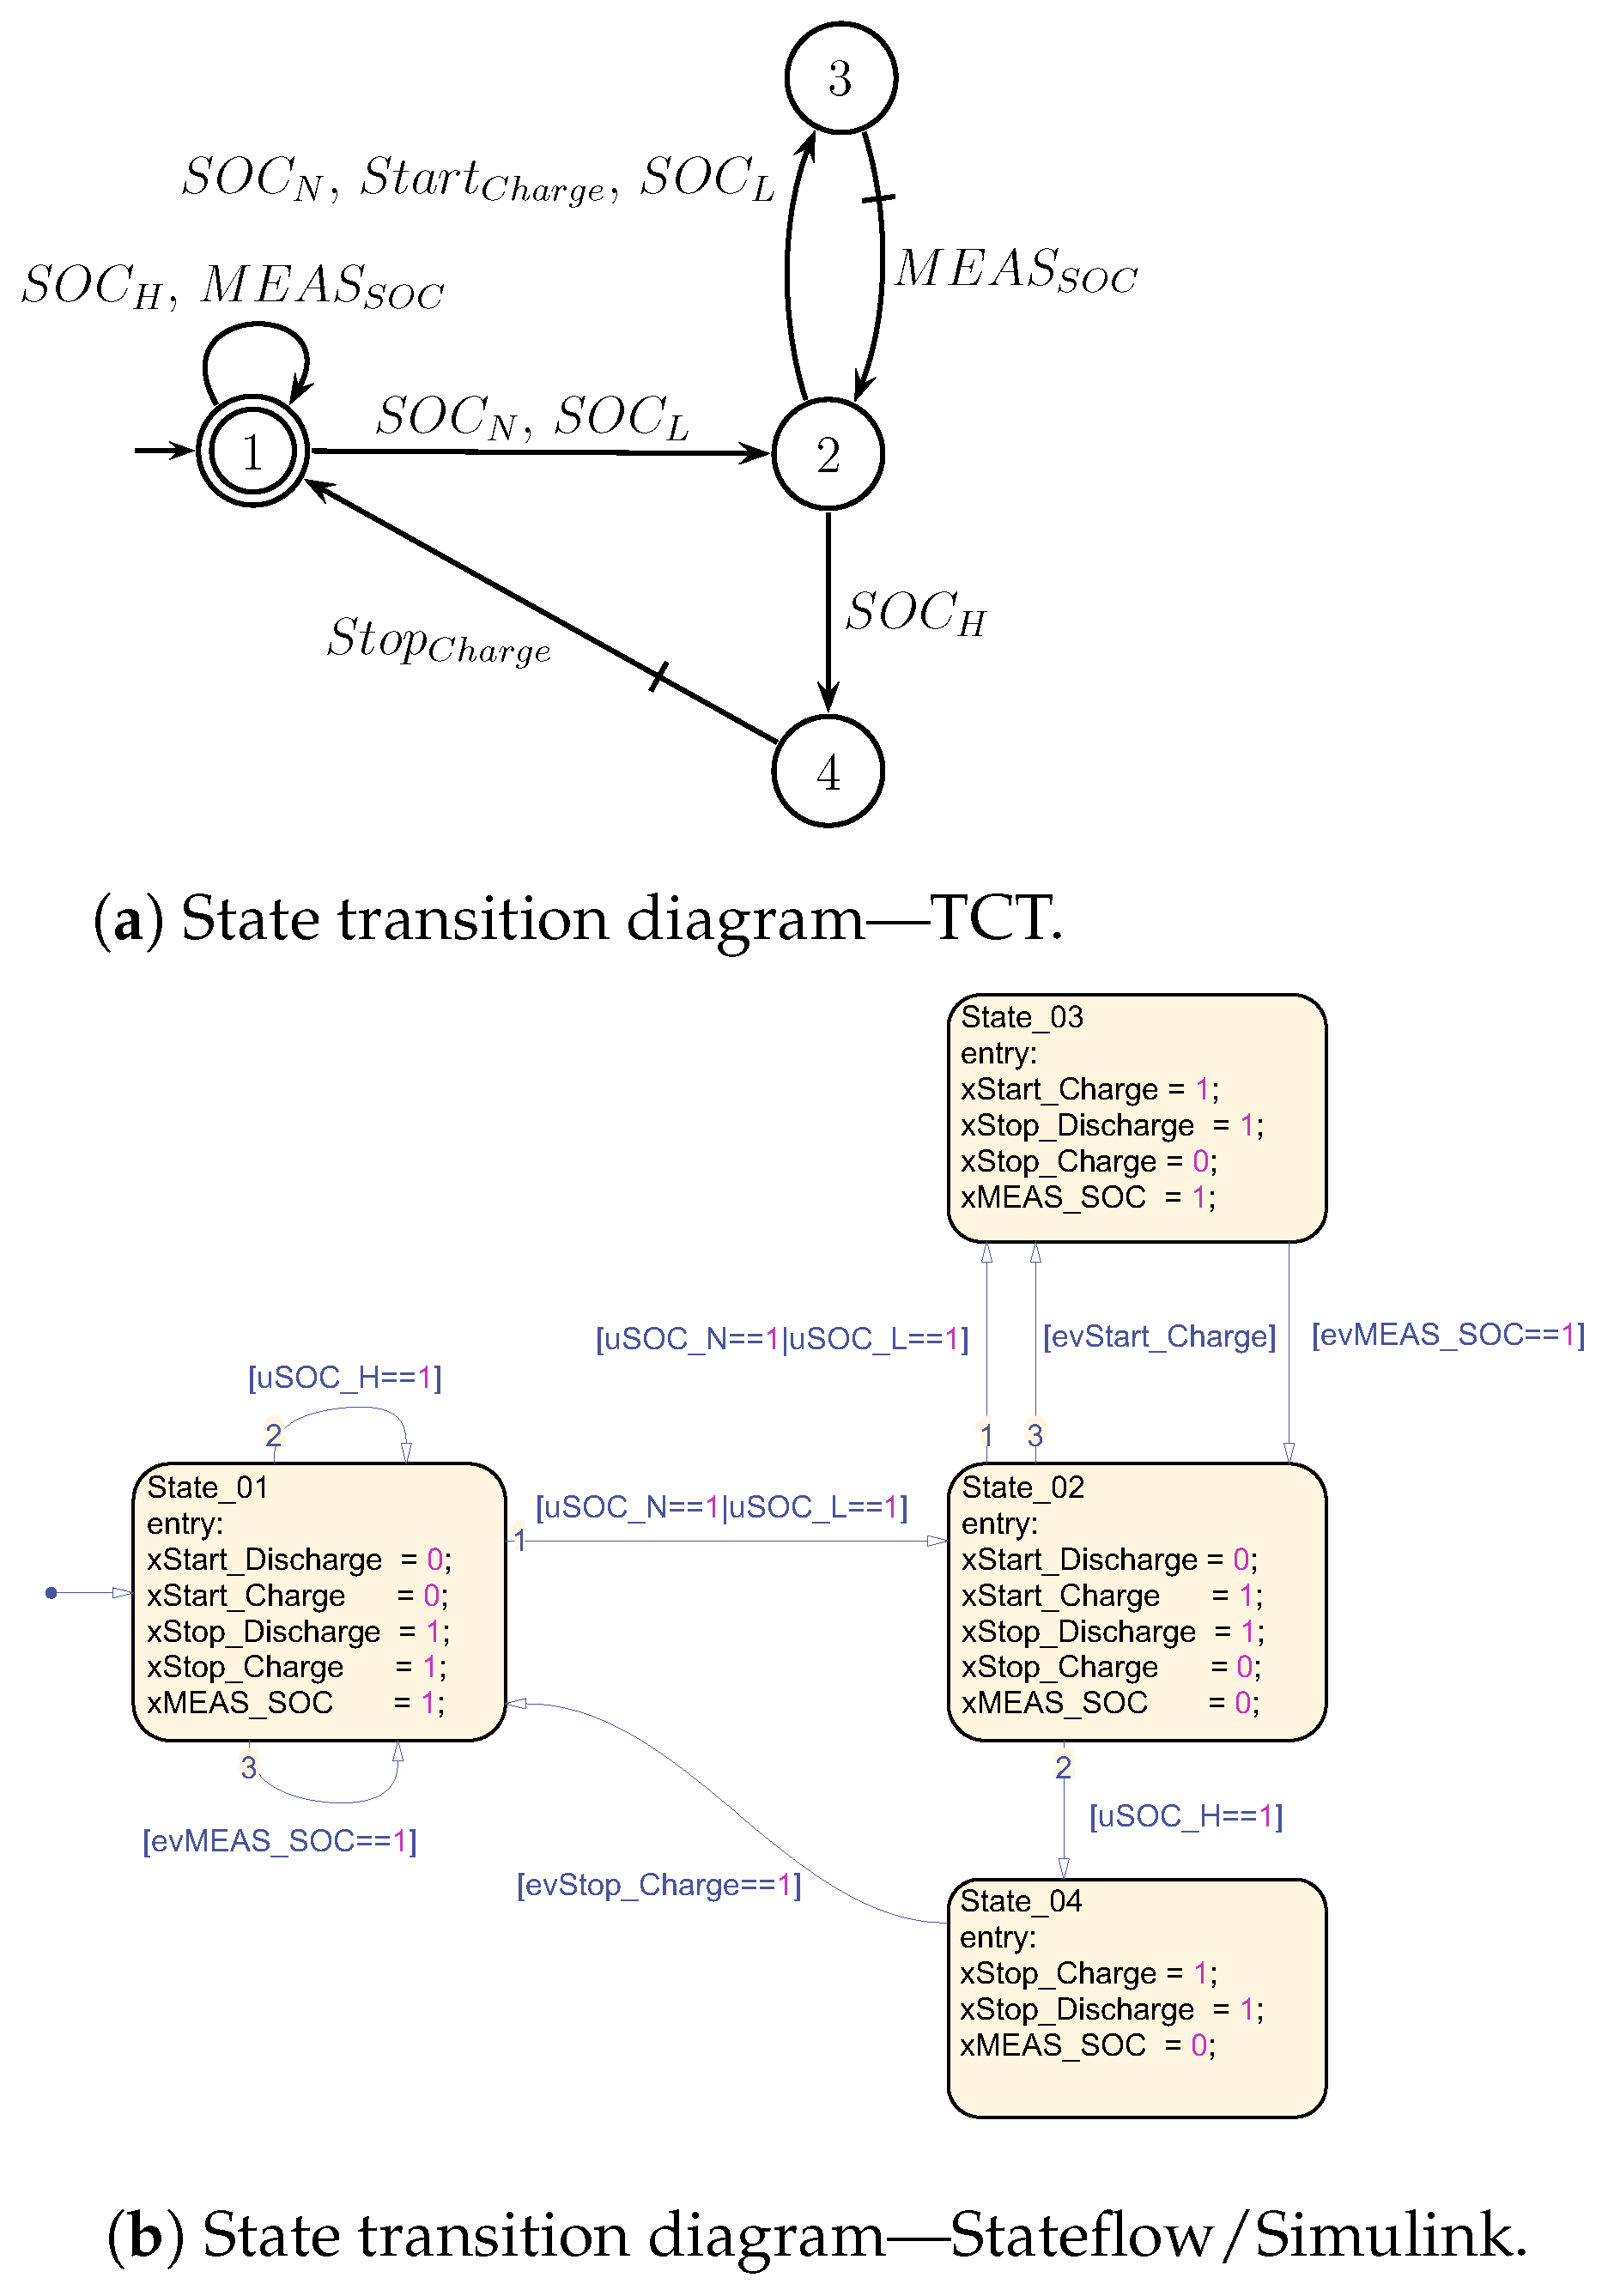
3.5. PMS Supervisors Realization in MATLAB Stateflow
- For each state of the reduced decentralized supervisor , a corresponding state state_x must be defined in a Stateflow state machine;
- Define the initial state state_ in Stateflow state machine;
- For each event , if define in MATLAB Stateflow an input variable ; otherwise, define and as input and output variables in MATLAB Stateflow, respectively.
- For each state , uncontrollable event and state , define the transition state_ state_;
- For each state , controllable event and and state , define the transition state_ state_;
- Let , G be the plant model, a state of G and the set of states of . For each state of the supervisor, the output of the state machine is defined as follows. Define for all ; for all events disabled by supervisor in state x, otherwise (keeping the last value of the variable ).
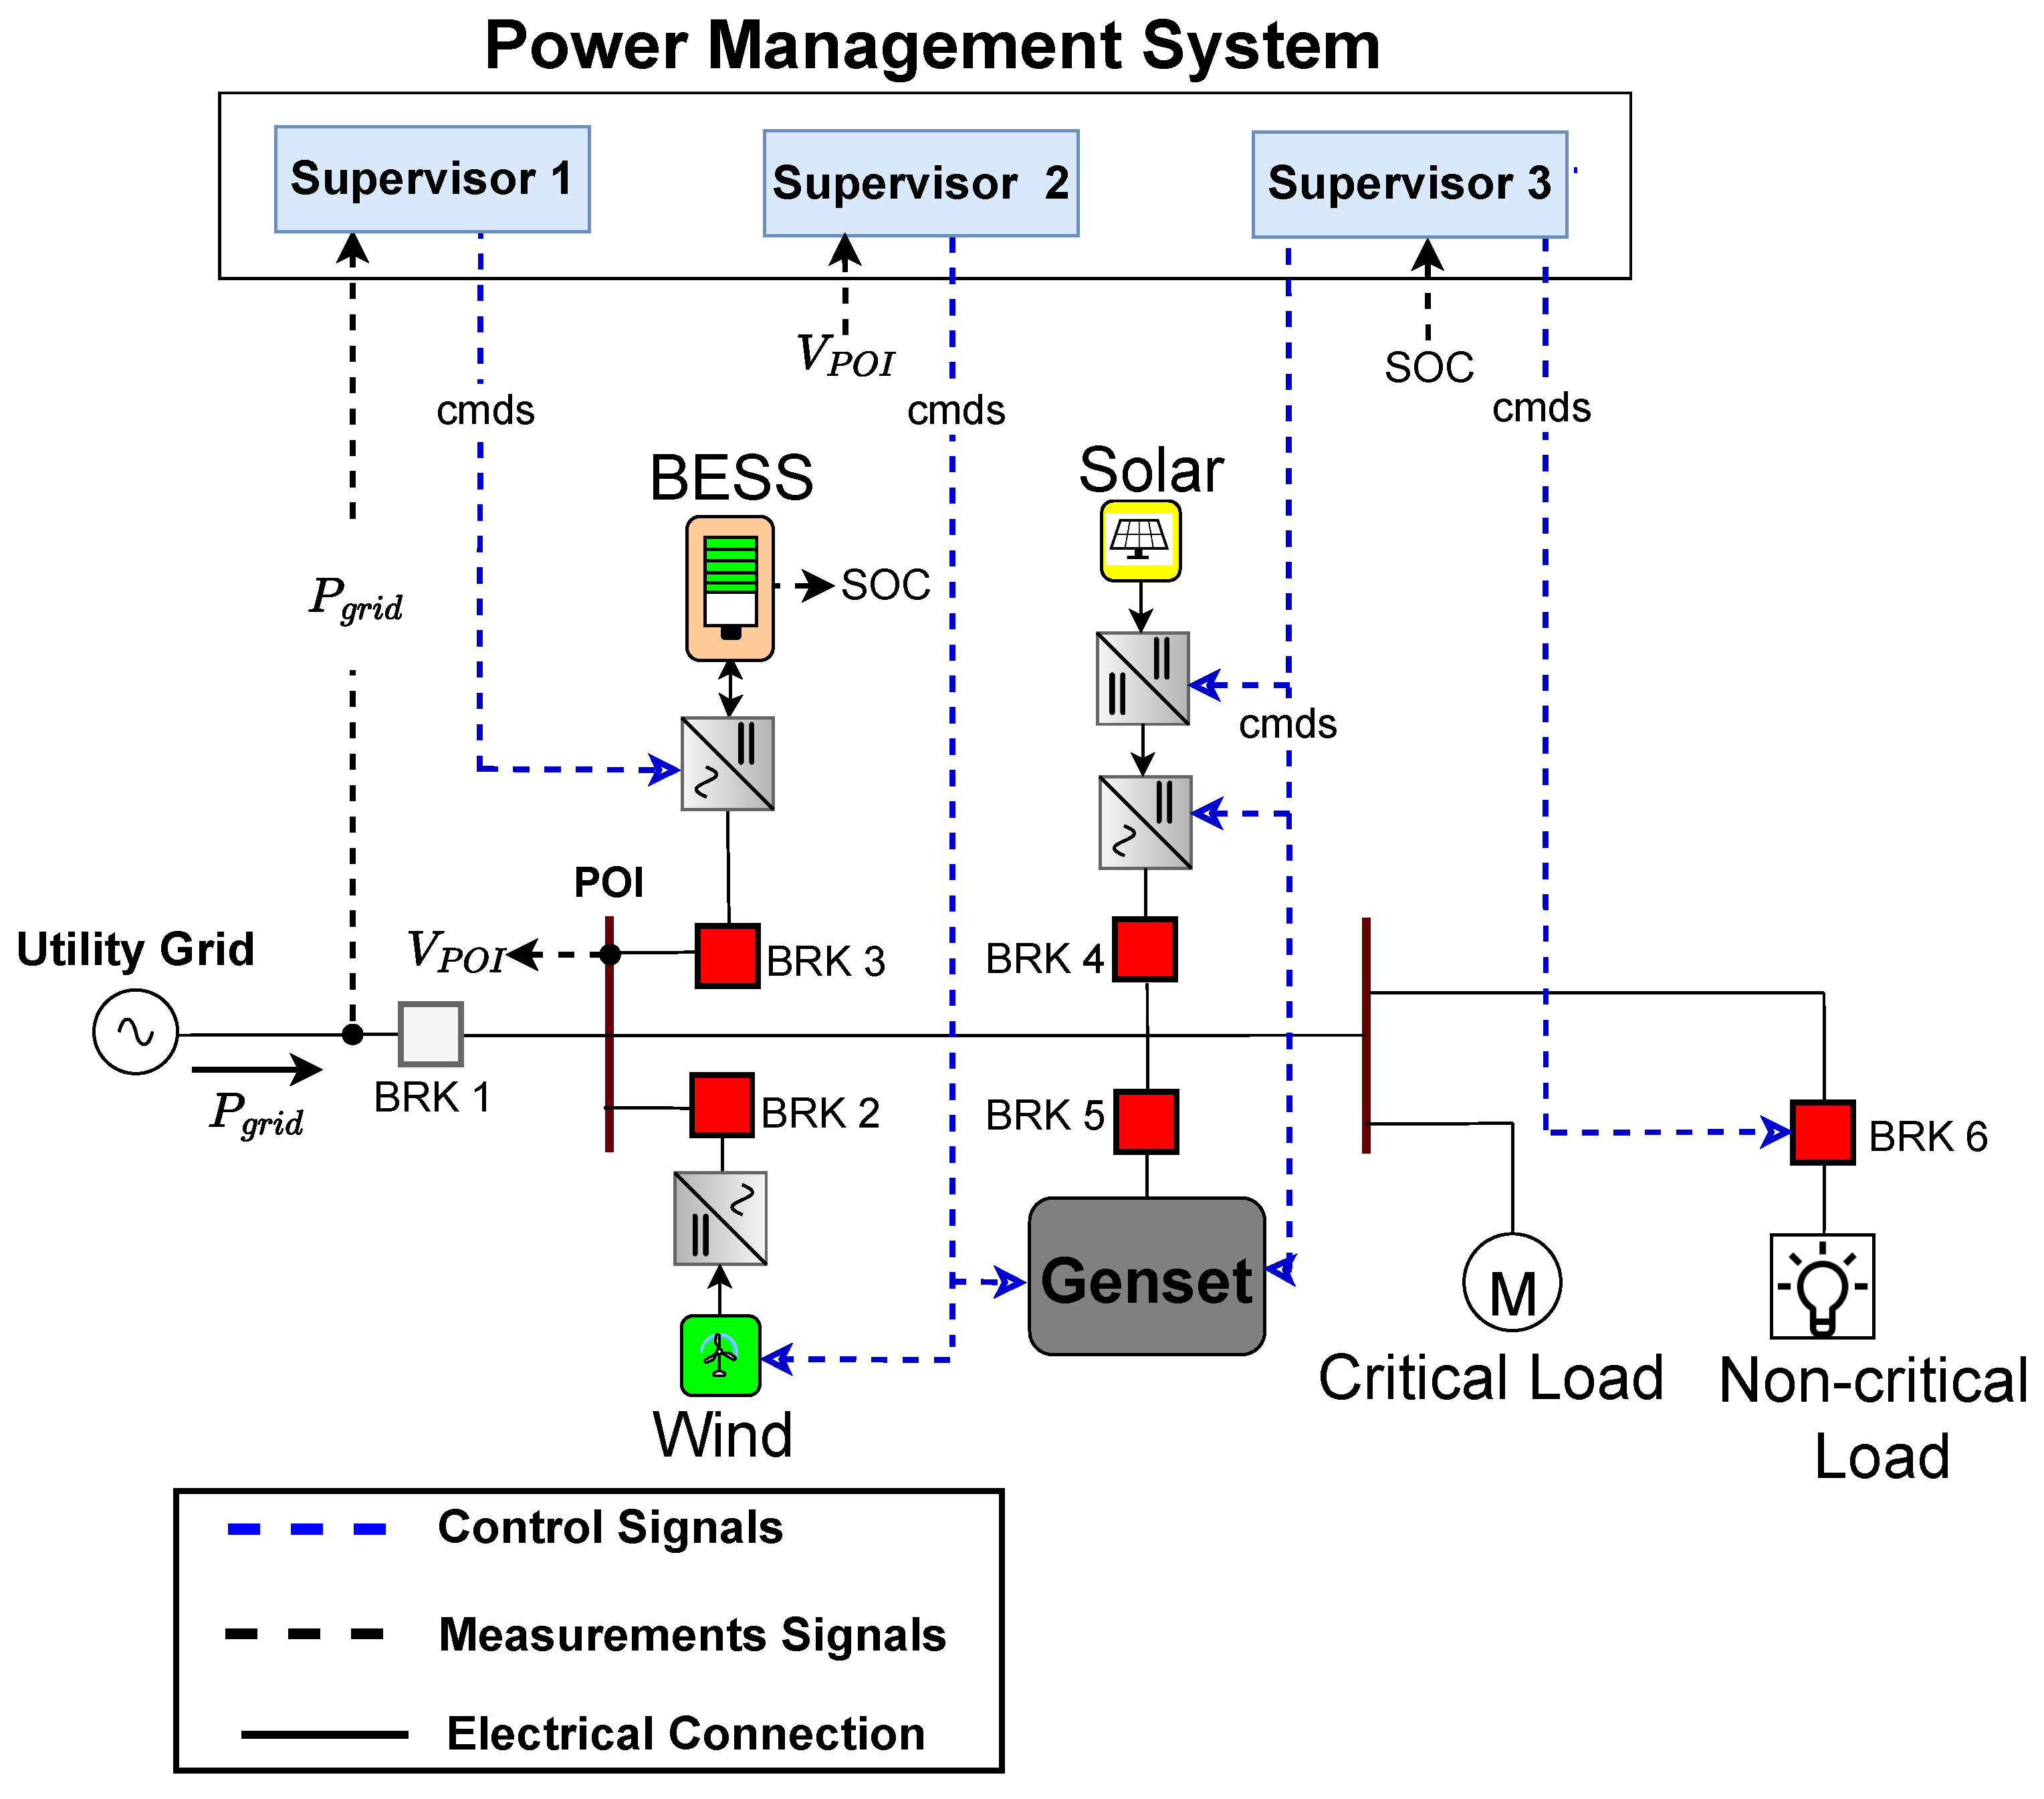
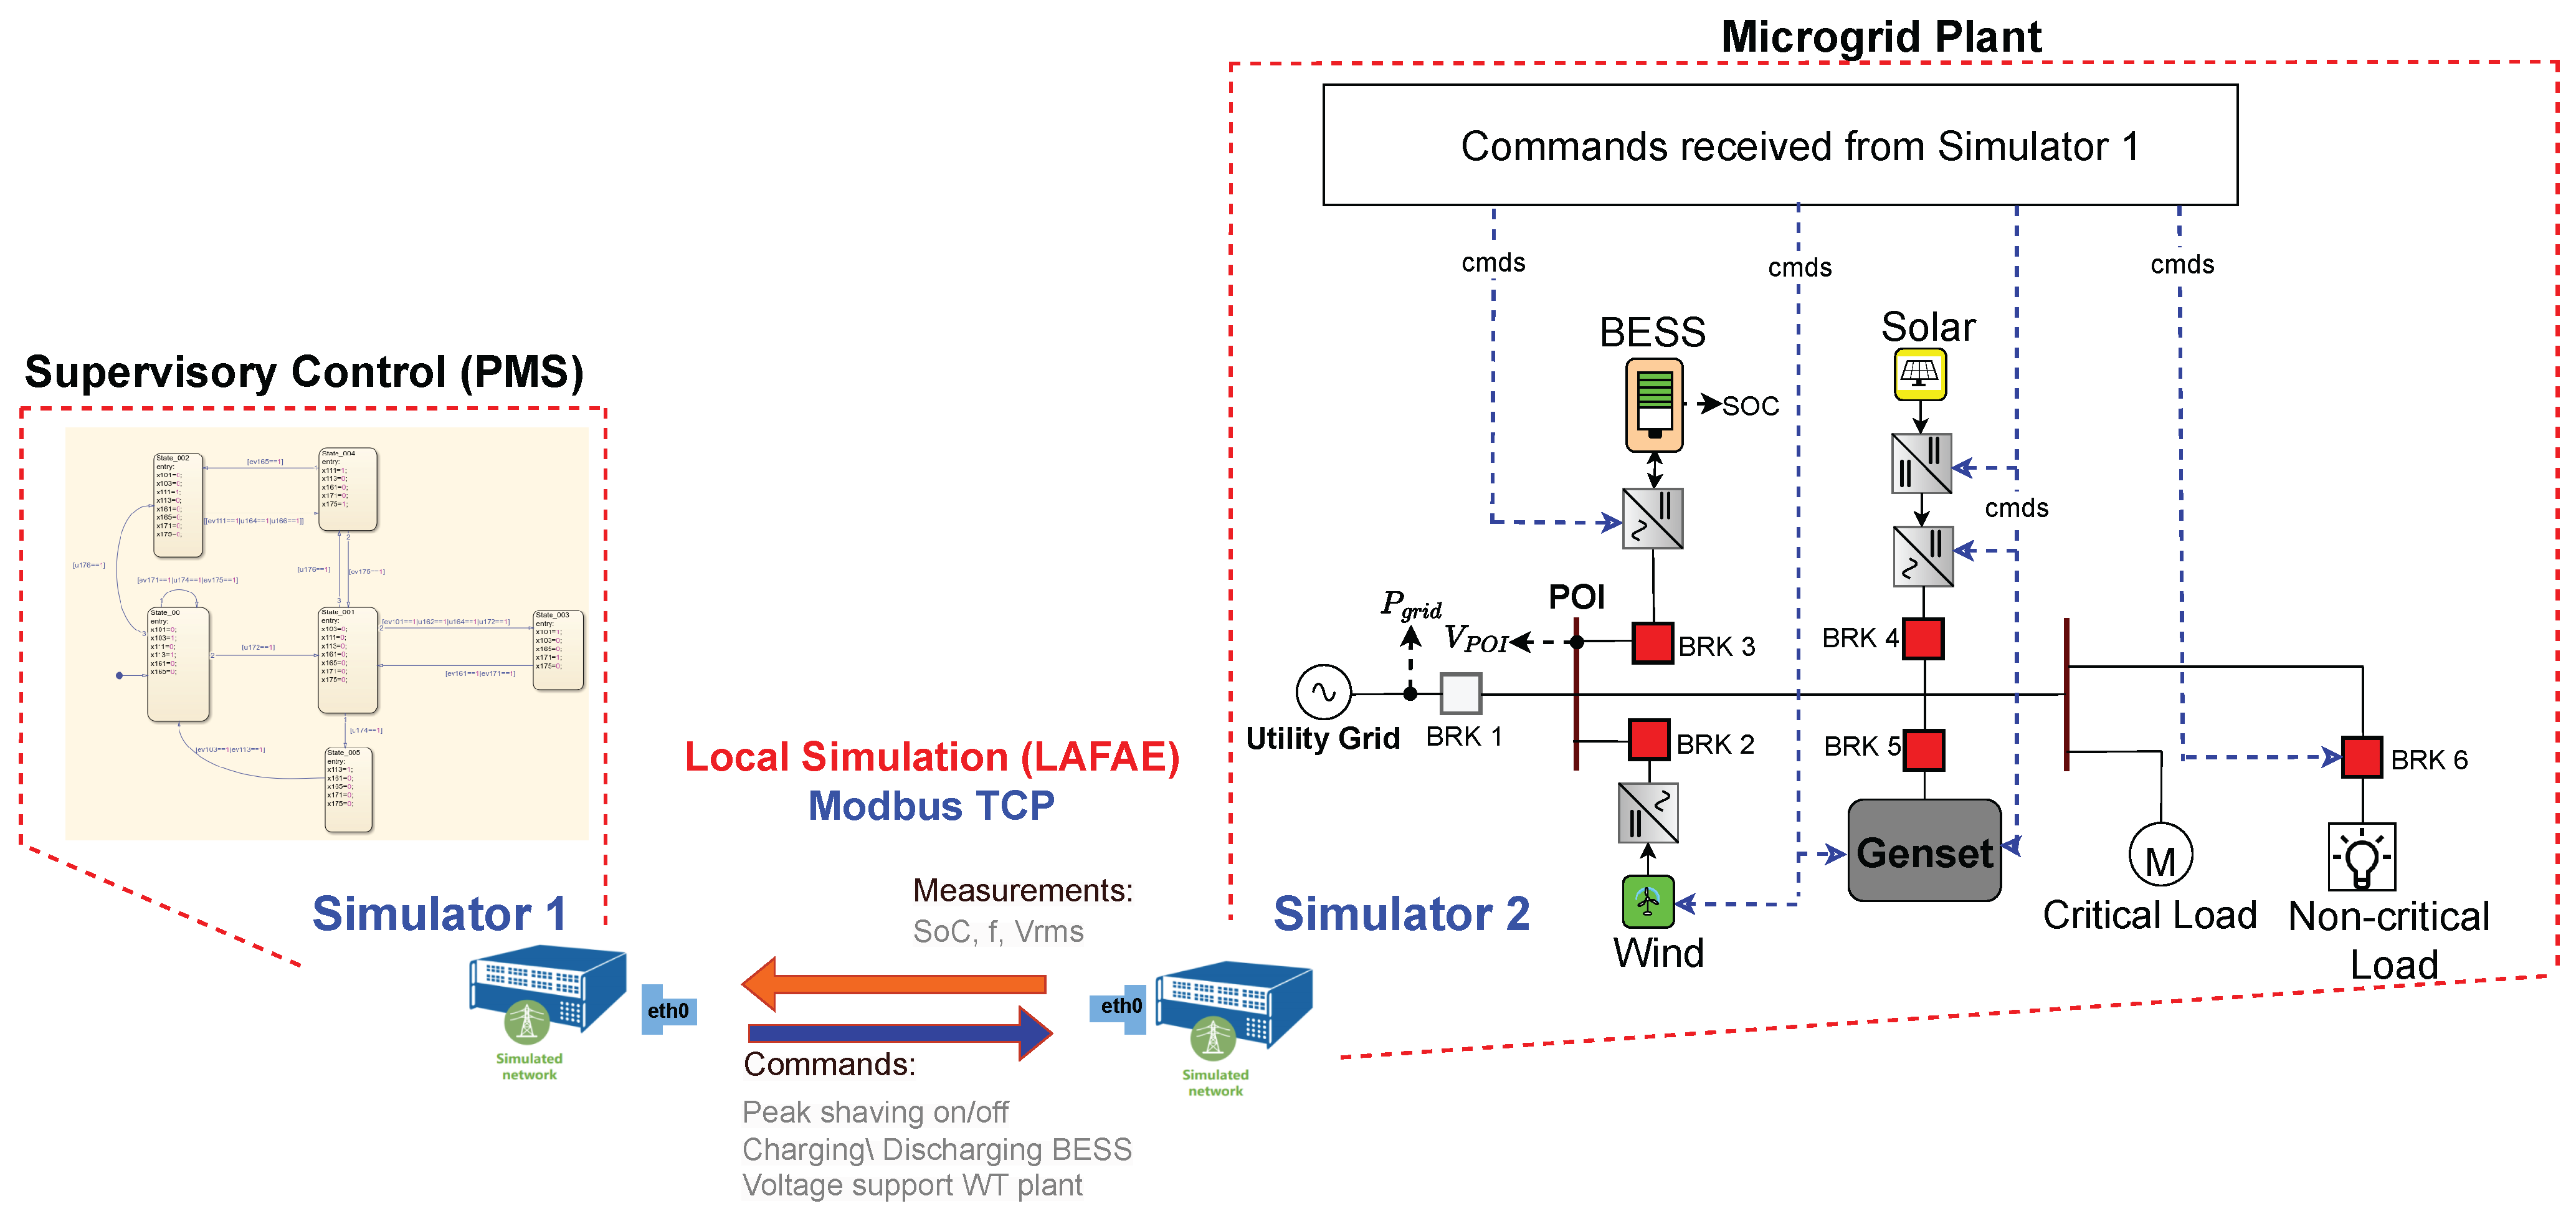
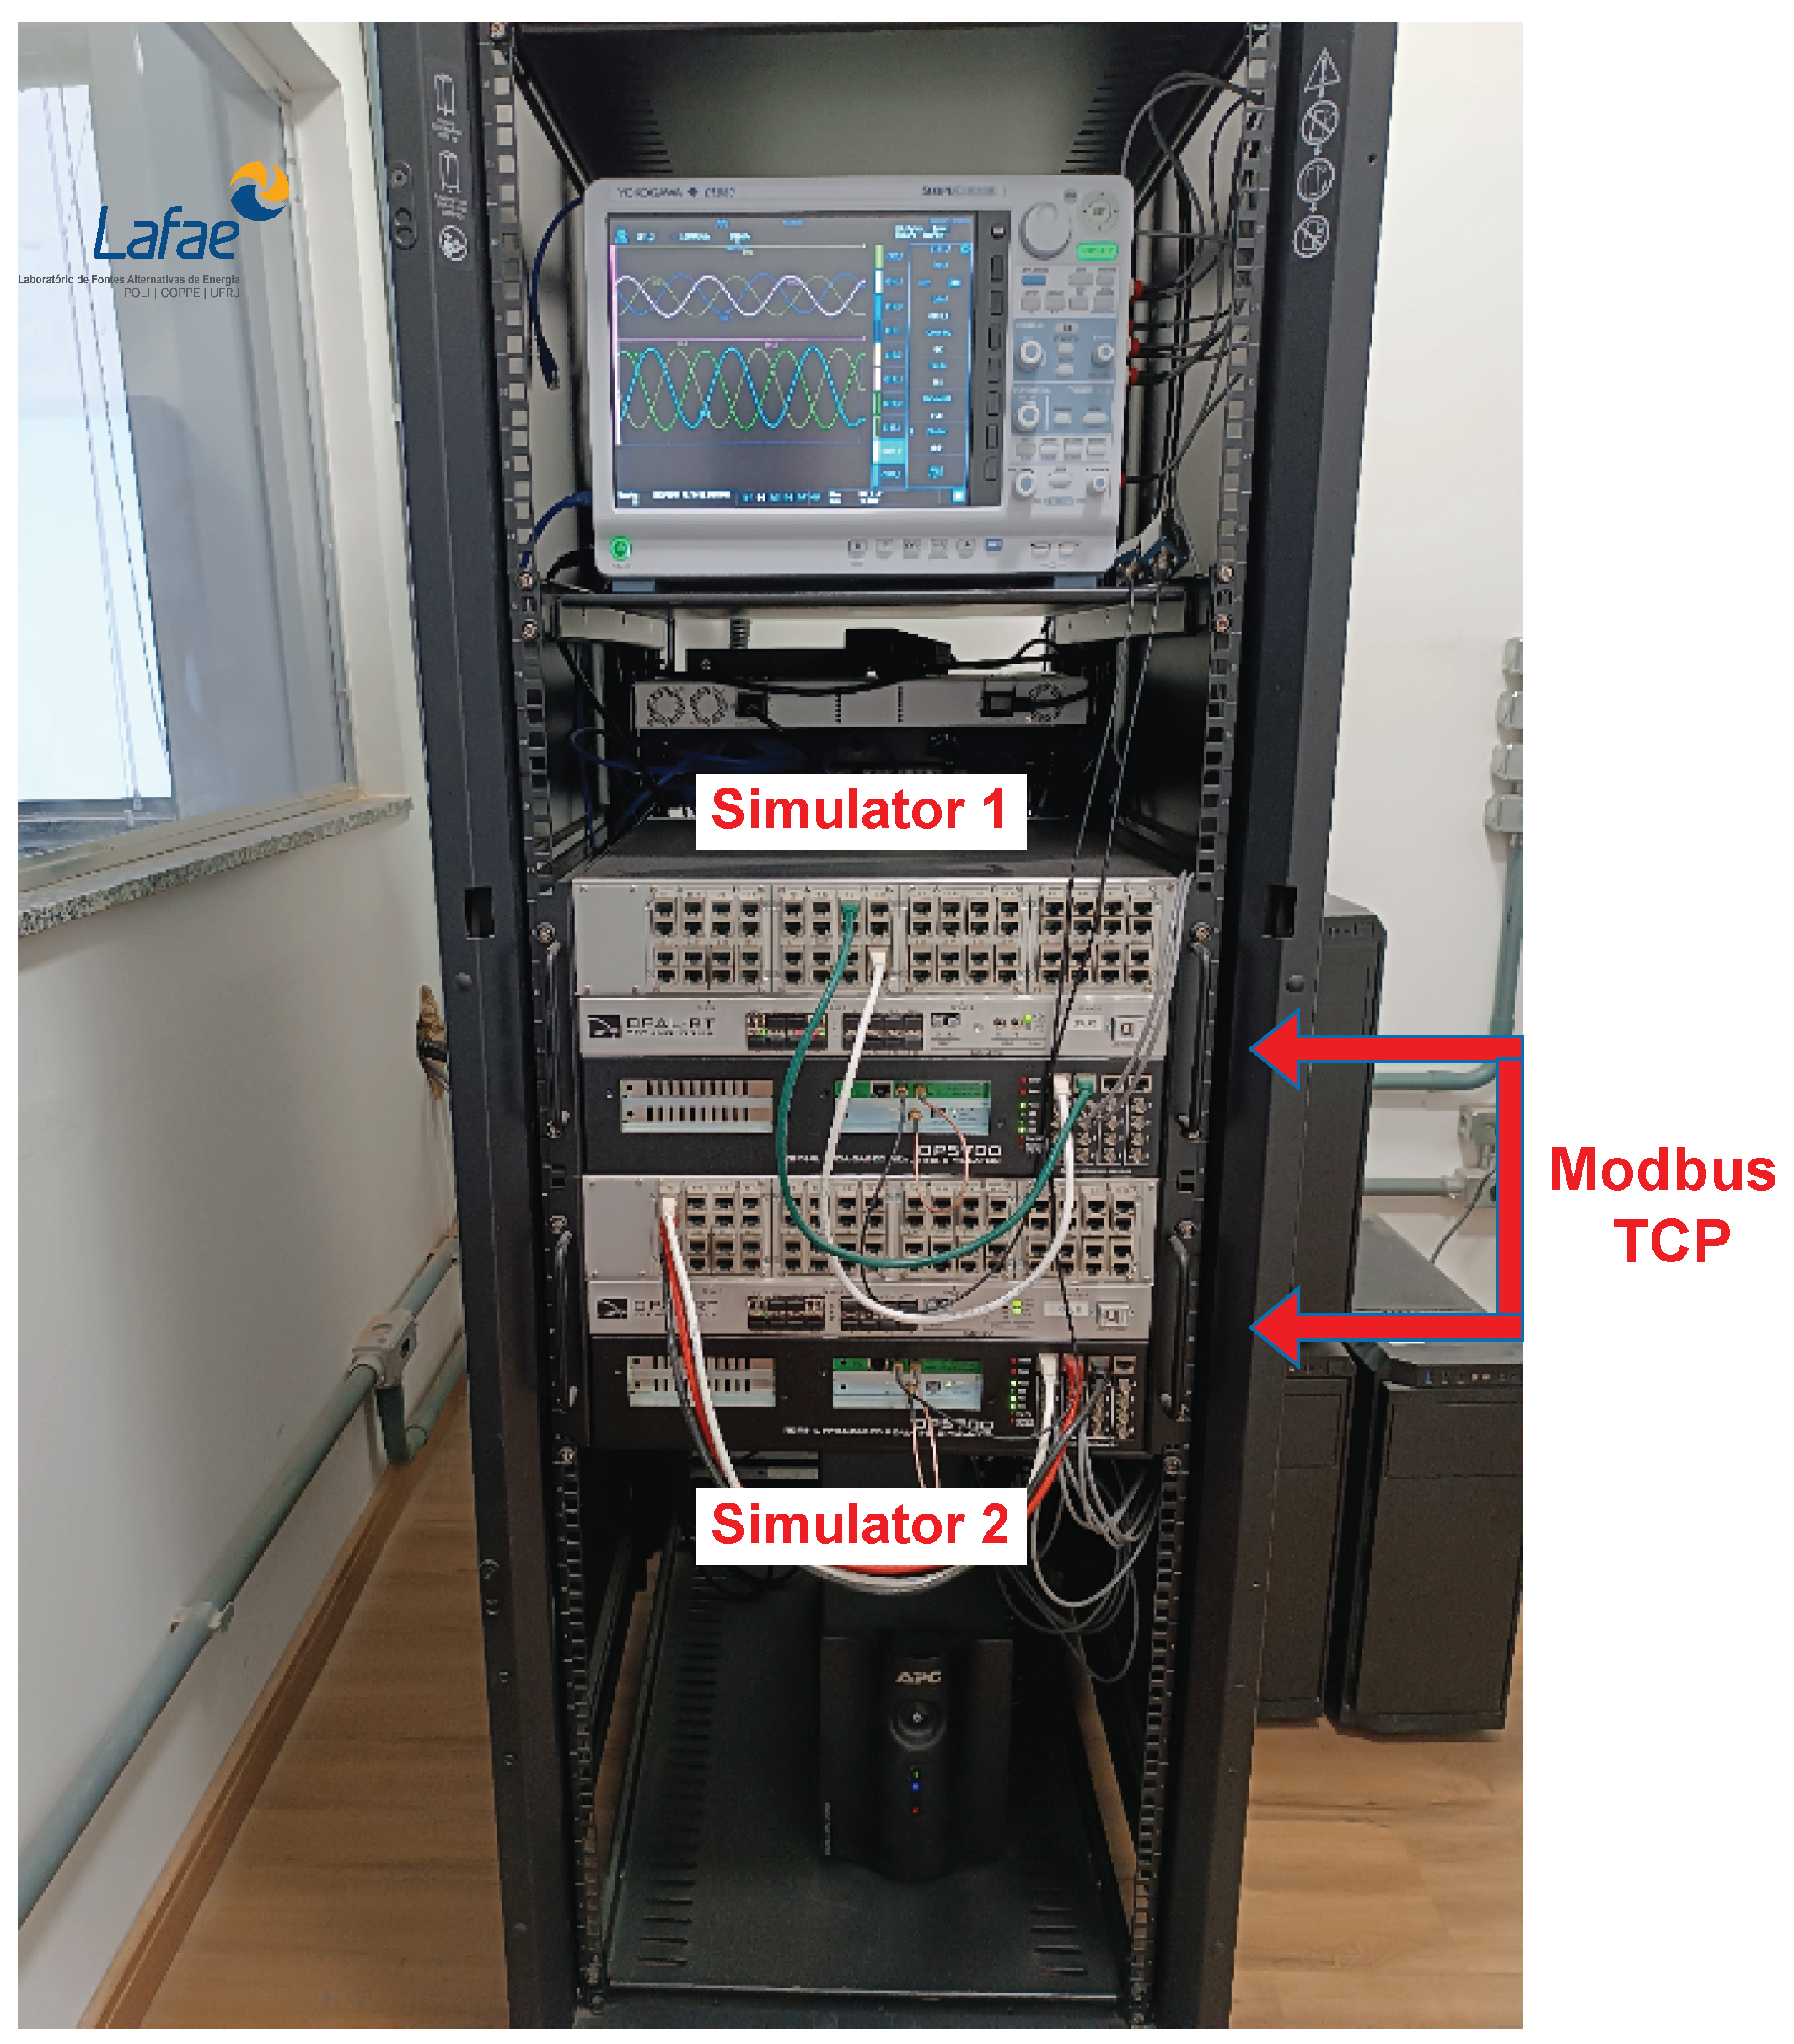
4. Framework Application Case Study
4.1. Case Study Description
4.2. Local Controllers, Breaker and Measurement Description
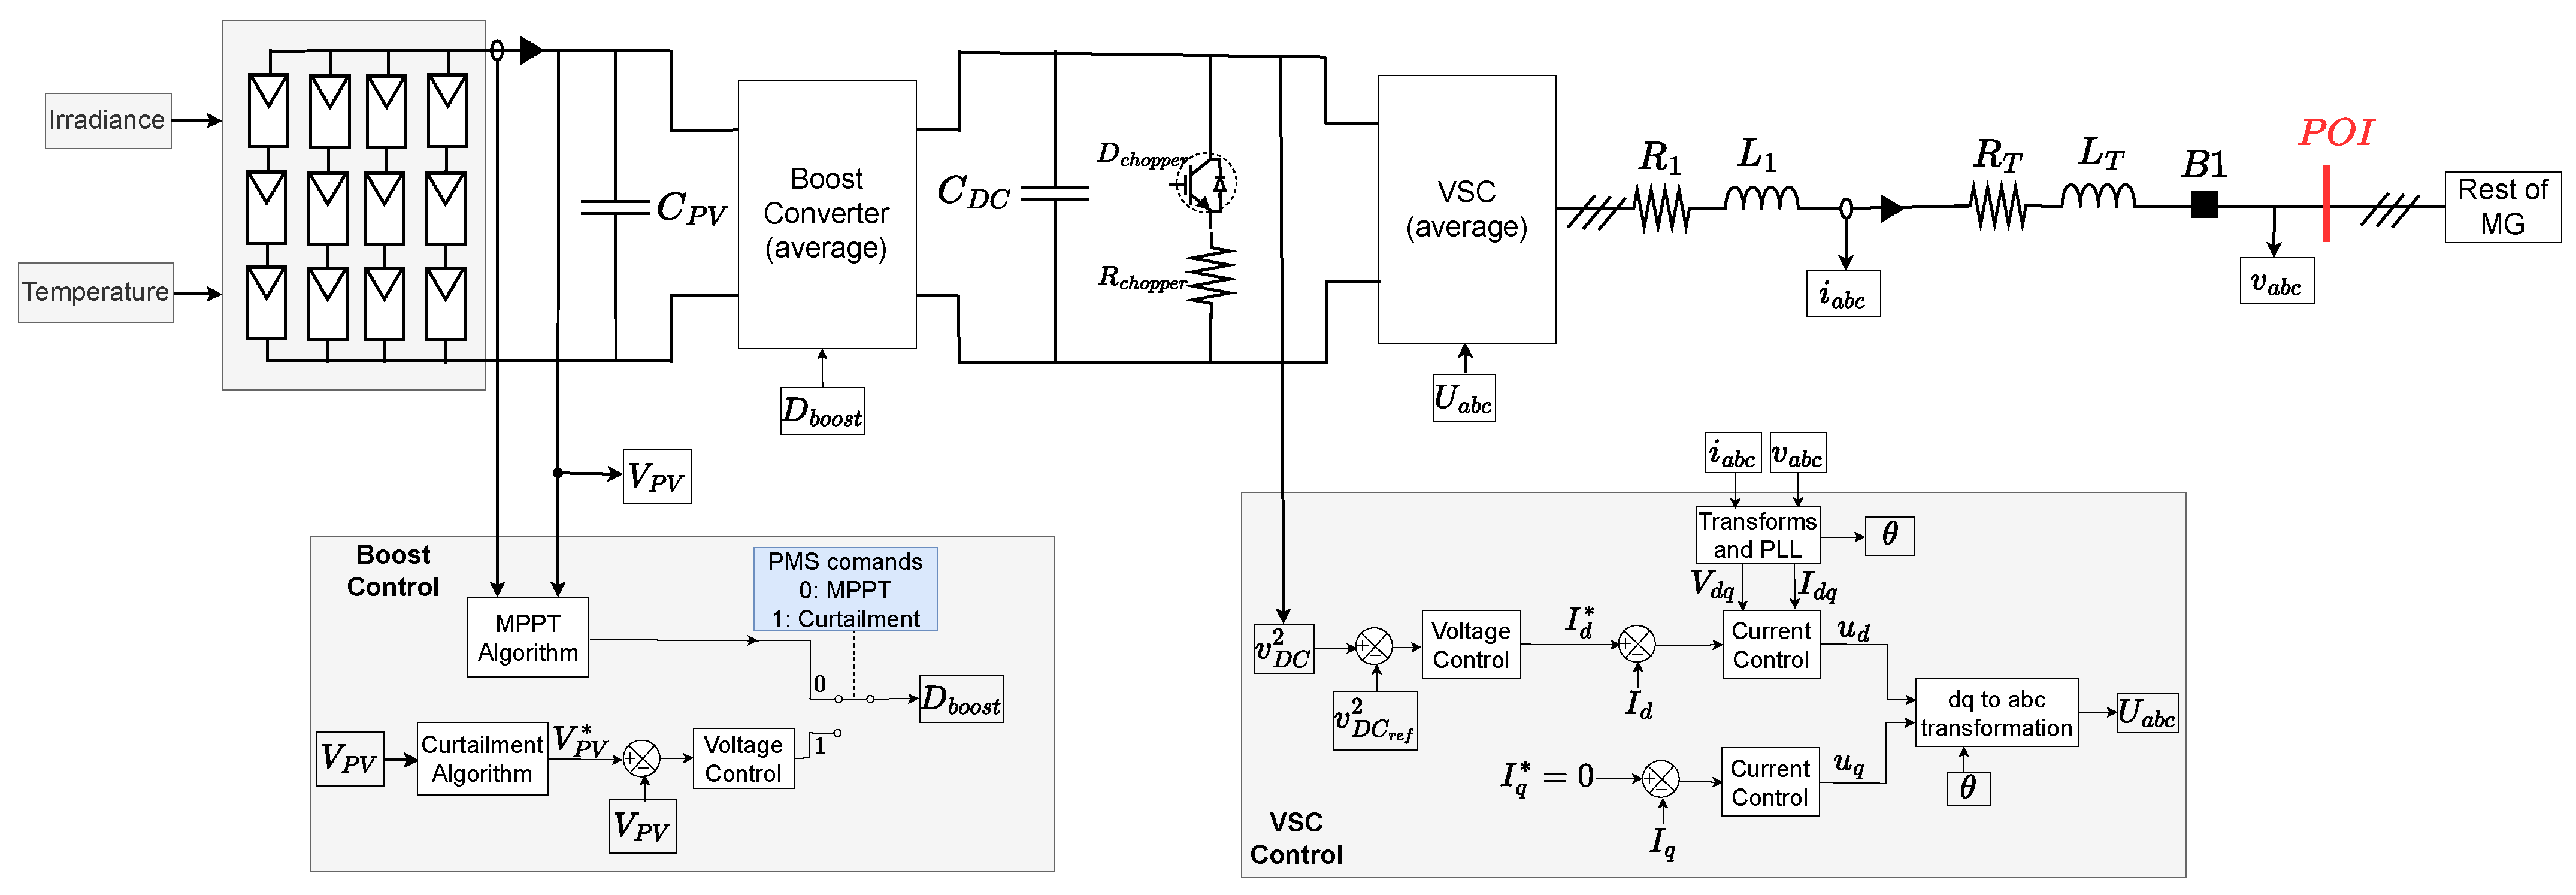
4.2.1. PV System
4.2.2. BESS Model
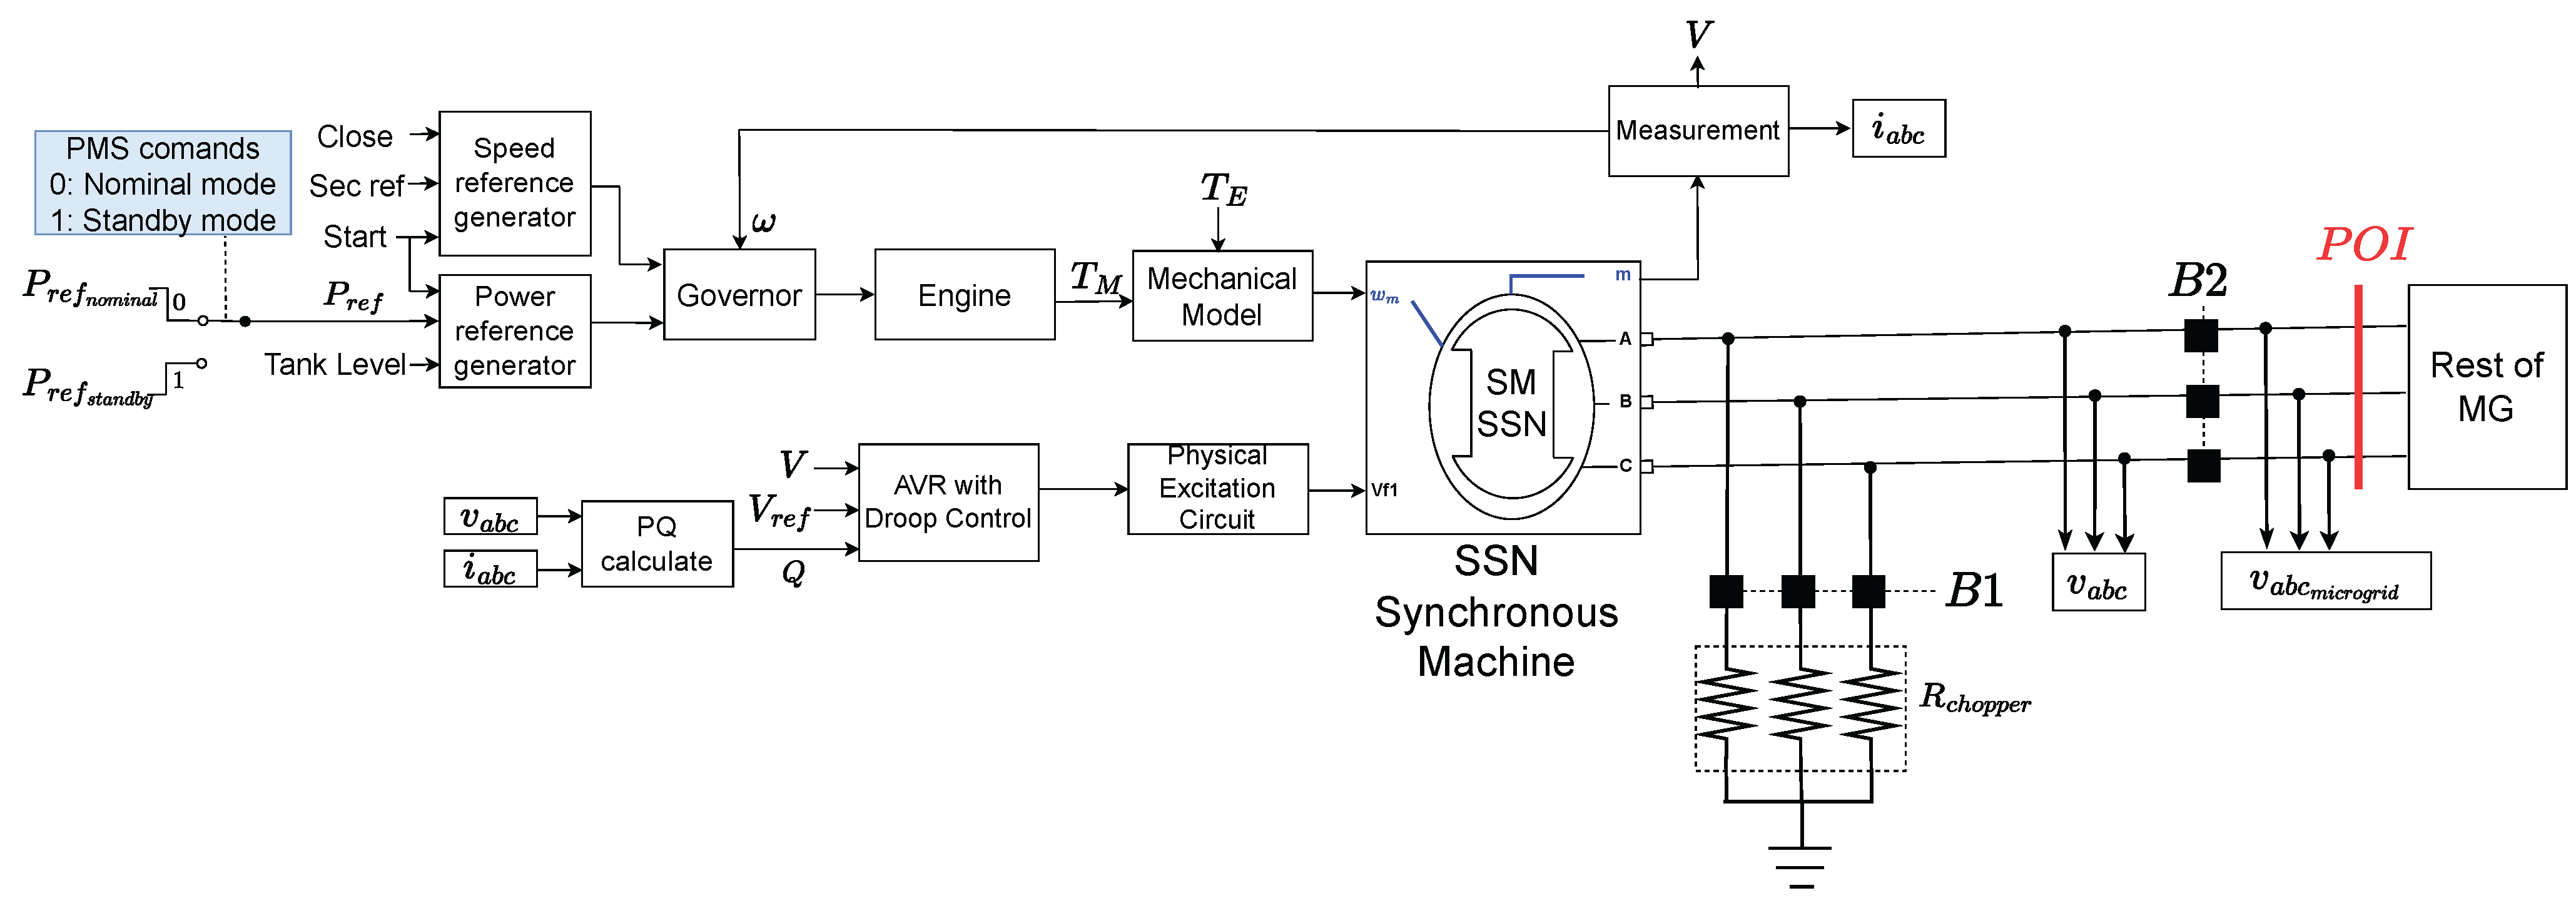
4.2.3. Genset
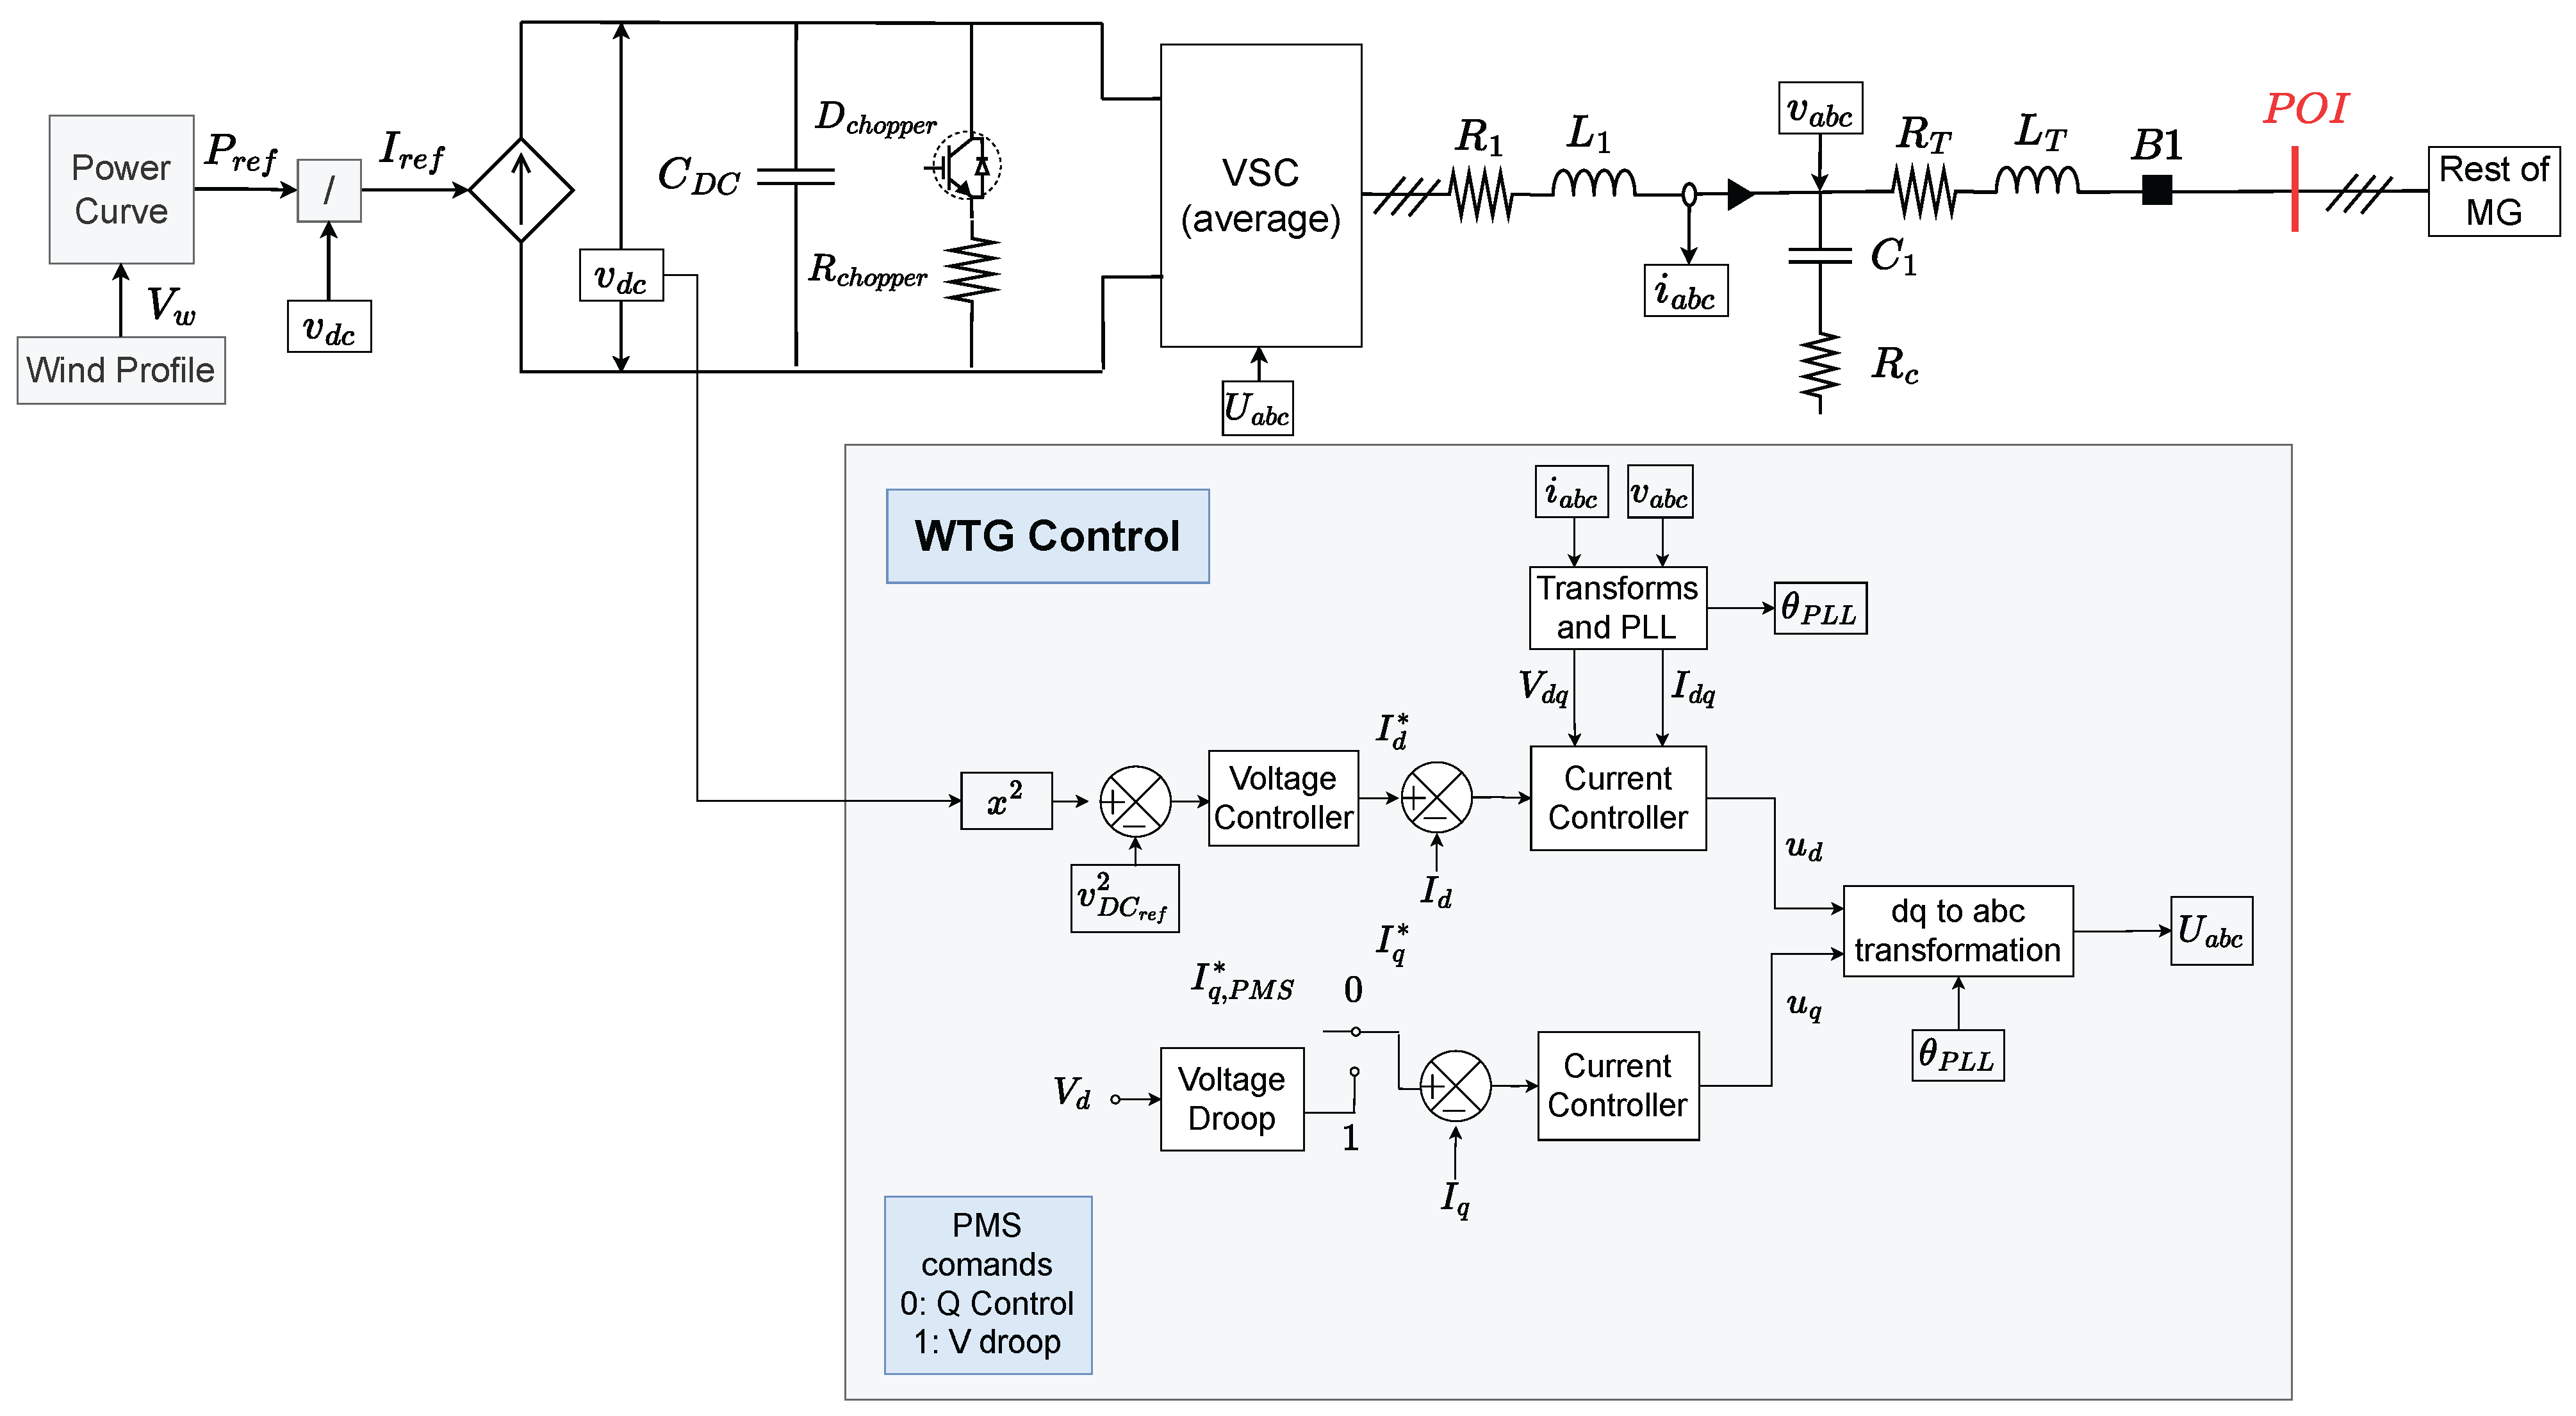
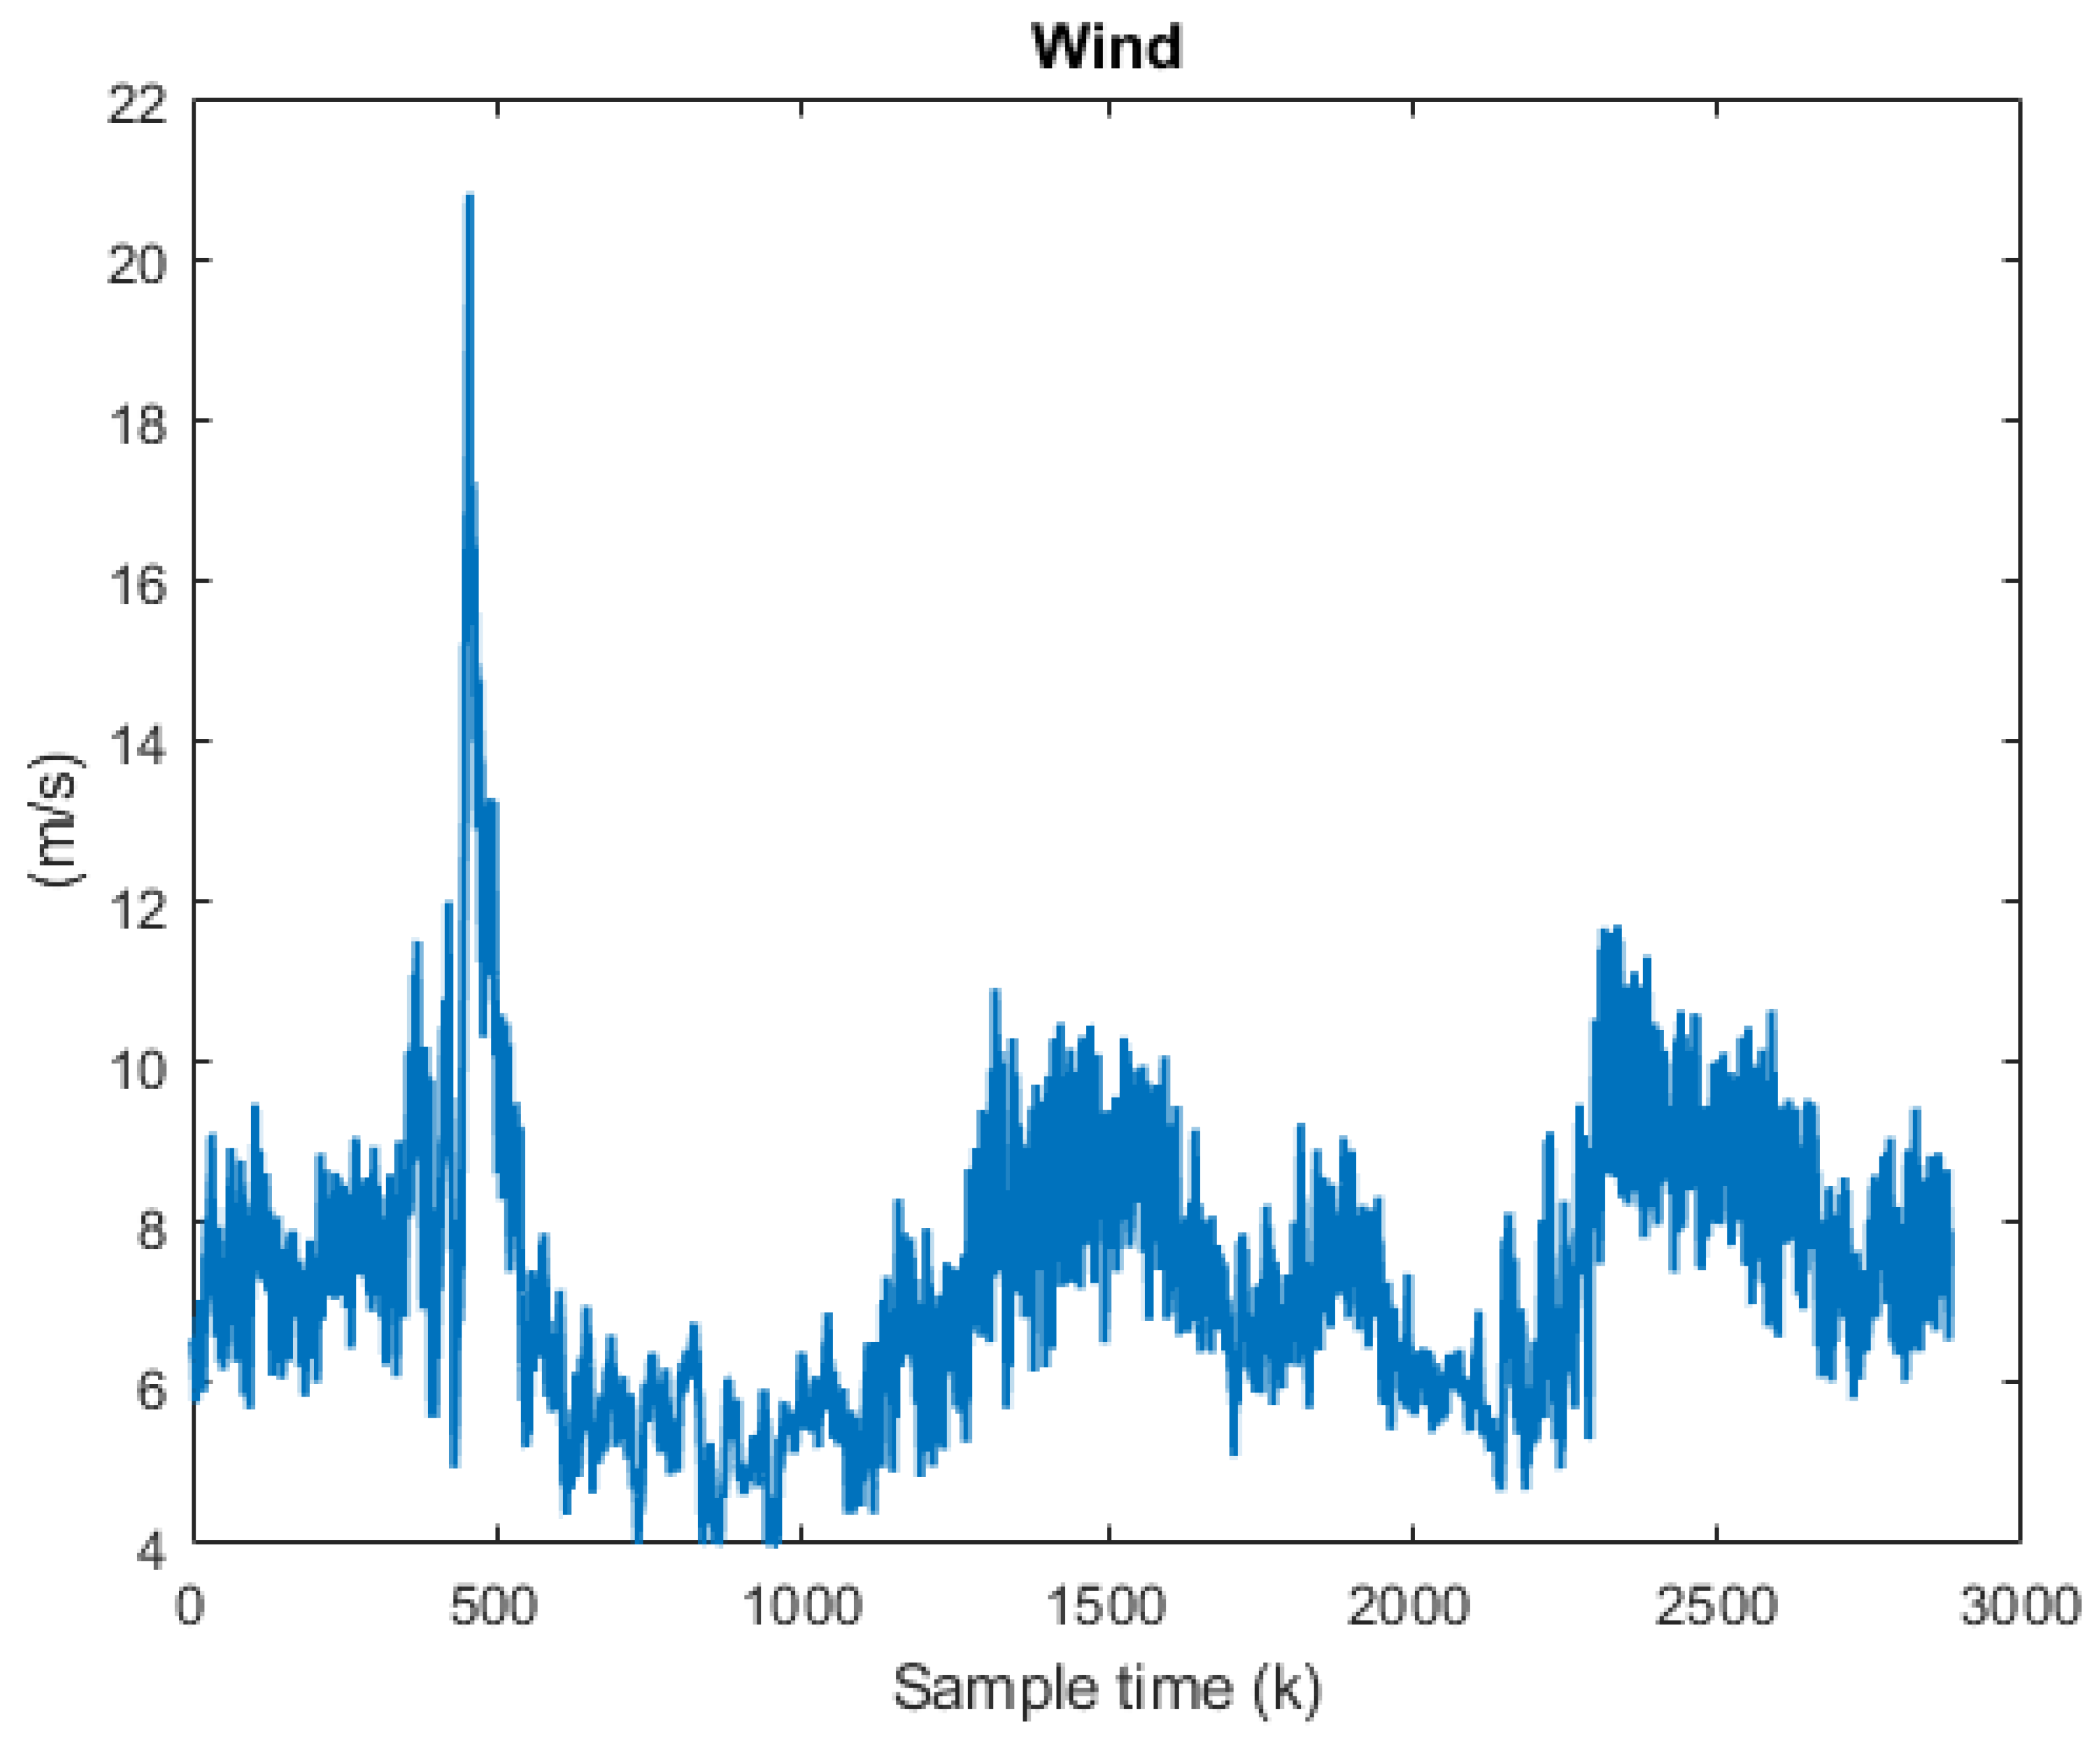
4.2.4. Wind Turbine System
4.2.5. Noncritical Load Breaker
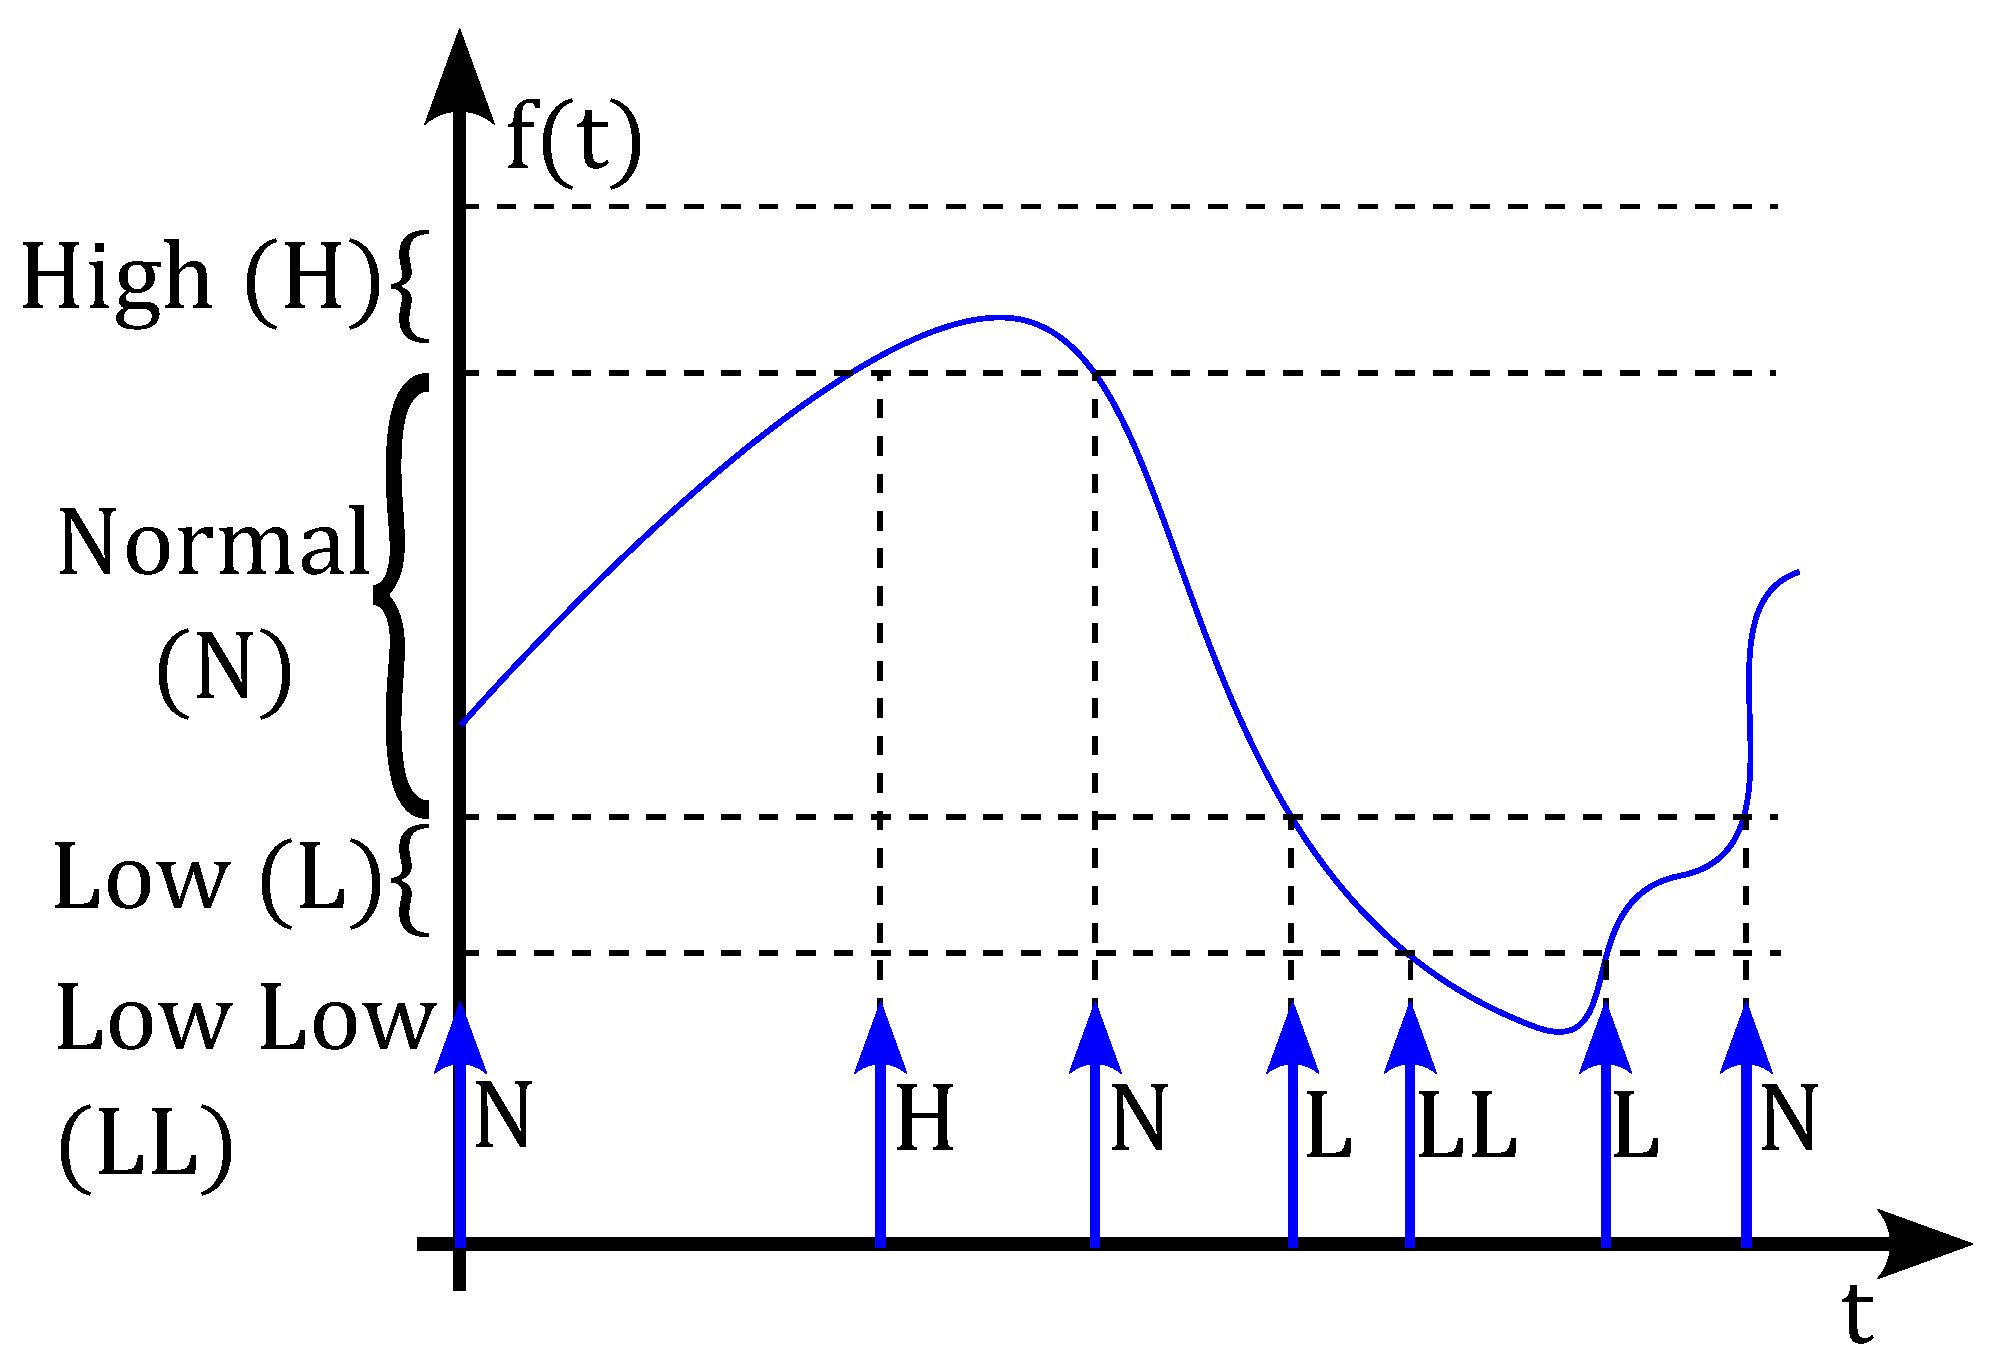
4.2.6. SOC, Power and Voltage Measurements

| Model | State | Events | Description |
|---|---|---|---|
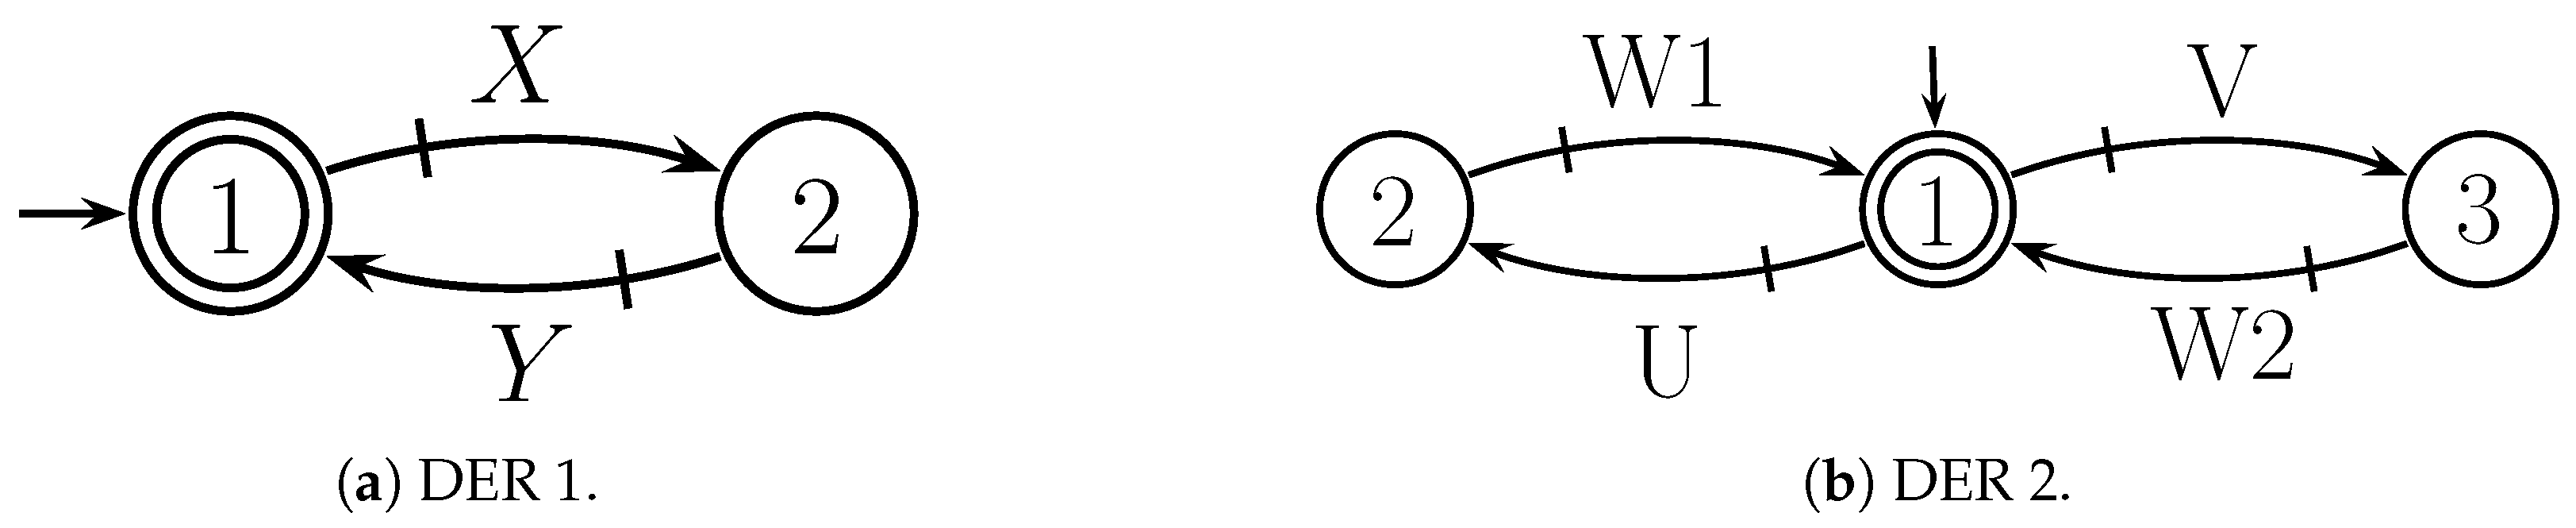
| G1: PV | 1: MPPT 2: Curtailment | X: Y: | The PV system can operate in MPPT mode (state 1) or in curtailment mode (state 2). The events are enabled or disabled by the supervisors, depending on the operation of the system. |
| G2: BESS Operation | 1: BESS Standby 2: BESS Charging 3: BESS Discharging | U: W1: V: W2: | Operation mode of BESS is represented by a three-state automaton with four events. The BESS operating model is designed for taking into account charging, discharging and standby mode without power injection. |
| G3: Genset | 1: Genset at standby mode 2: Genset at nominal mode | X: Y: | The Genset is modeled with two states and two events. Event represents the injection of its nominal ative power considering a power factor of , while event indicates that the generator have to inject its minimum power, depending on the voltage and frequency of the grid. |
| G4: WT | 1: WT at Constant Power Factor 2: WT at Support voltage | X: Y: | The WT system can operate as a P-Q bus (state 1) working in the MPPT control, and as a providing voltage support function (state 2). |
| G5: Noncritical load Breaker | 1: Load connected 2:Load disconnected | X: Y: | The breaker that disconnects nonessential loads is modeled with two states and two events. Where state 1 is noncritical load connected and state 2 load disconnected. |
| G6: Peak shaving command | 1: Disable Peak Shaving 2: Enable Peak Shaving | X: Y: | The peak shaving mode is activated or deactivated by command, to do this, it is modeled with two states and two events. |
| Model | State | Events | Description |
|---|---|---|---|
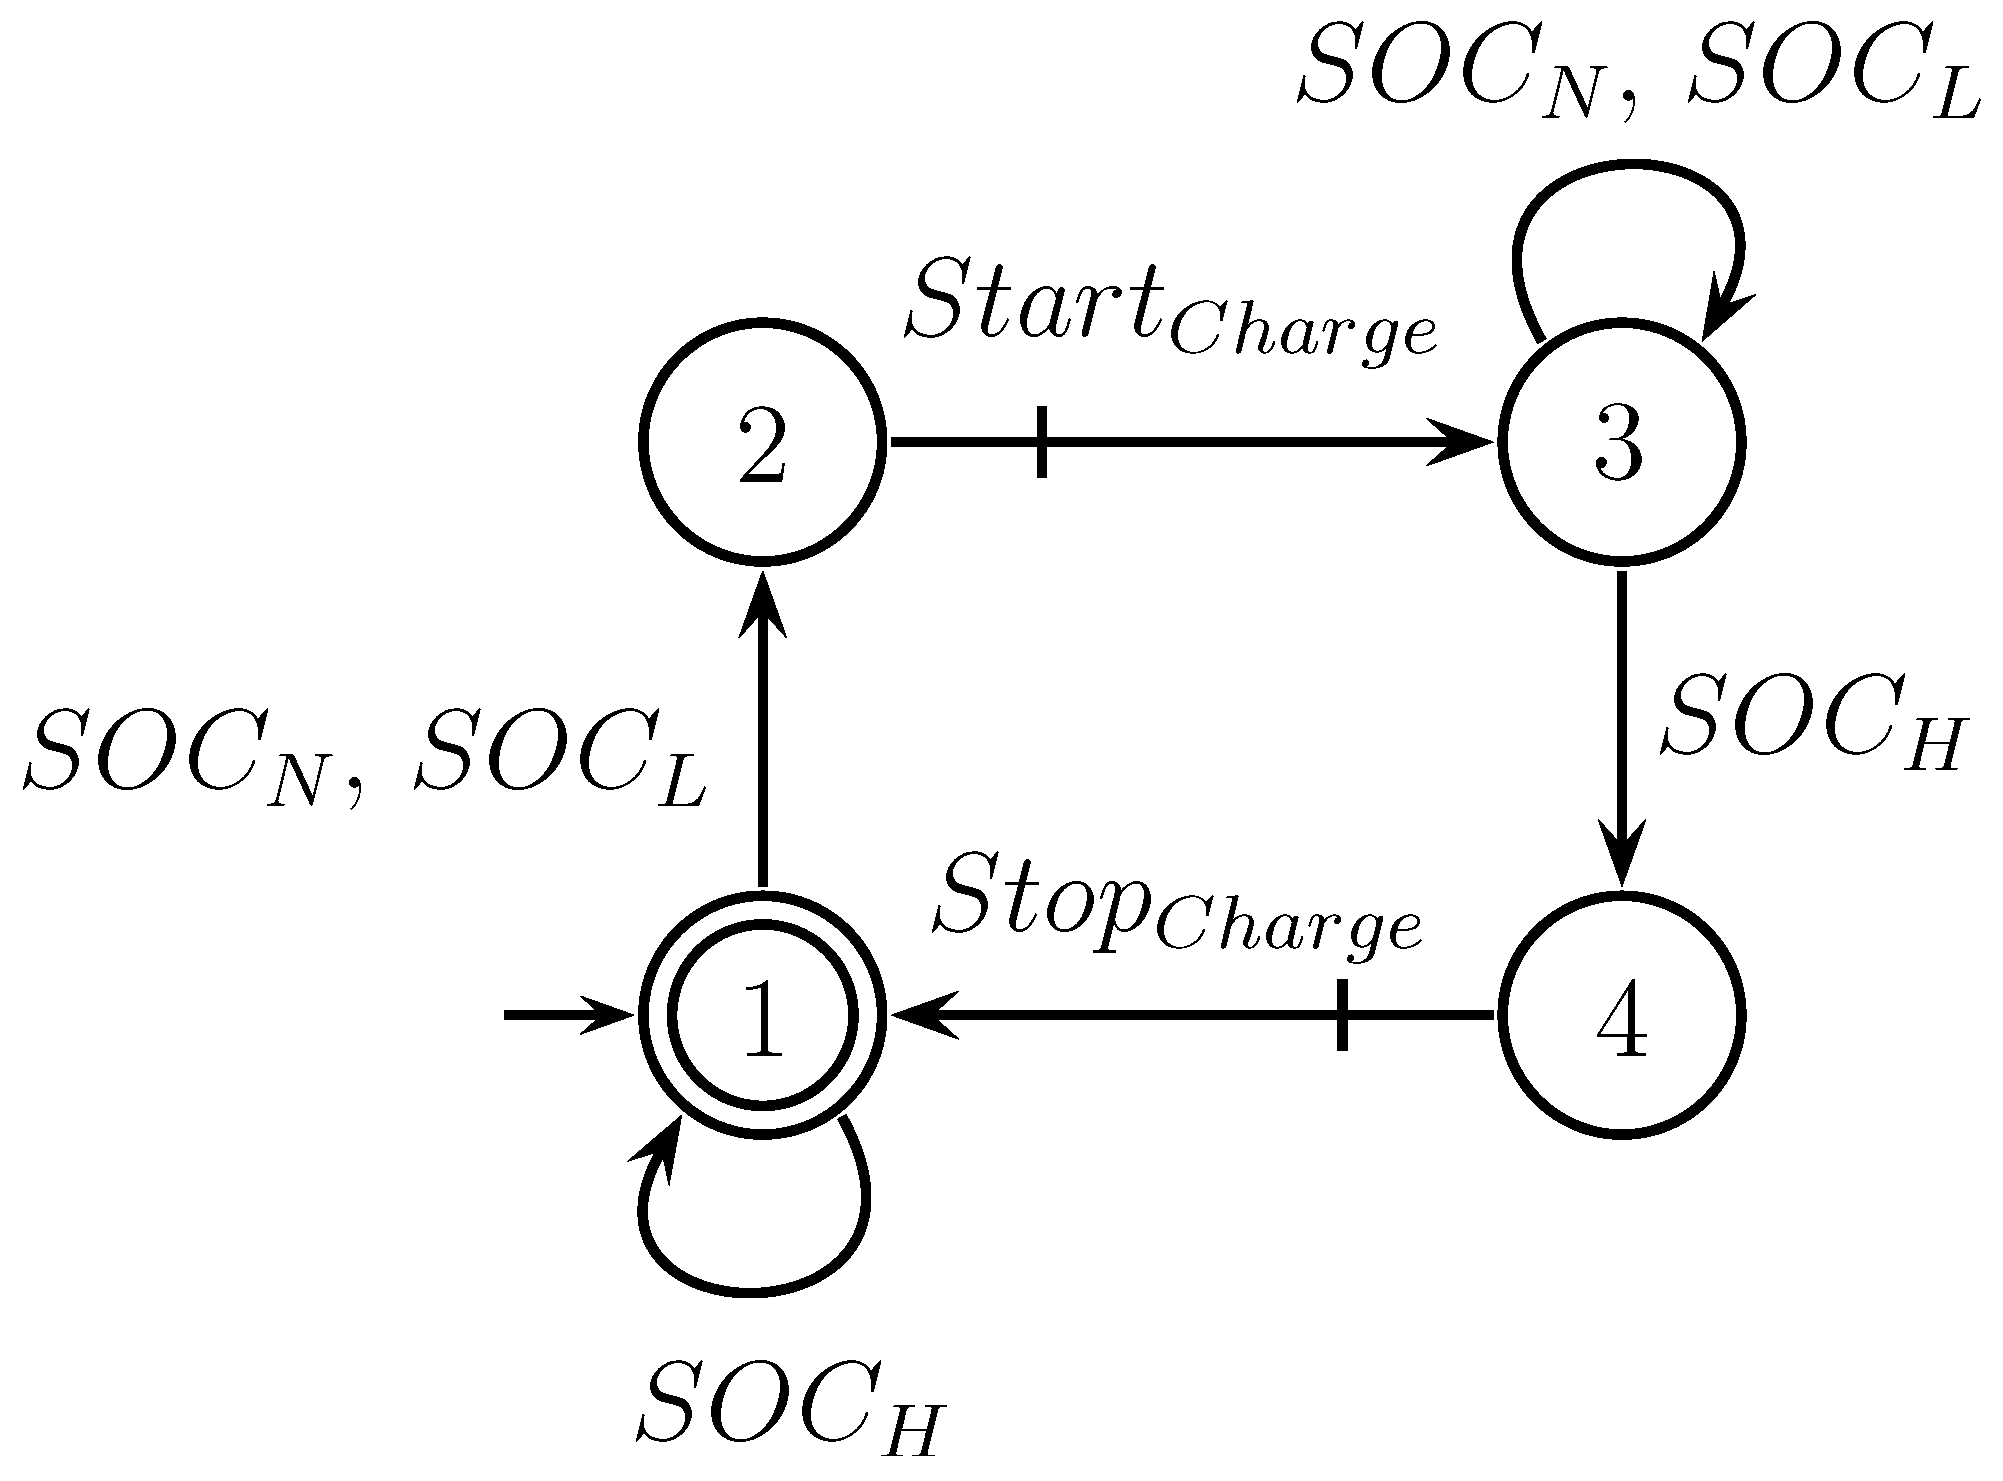
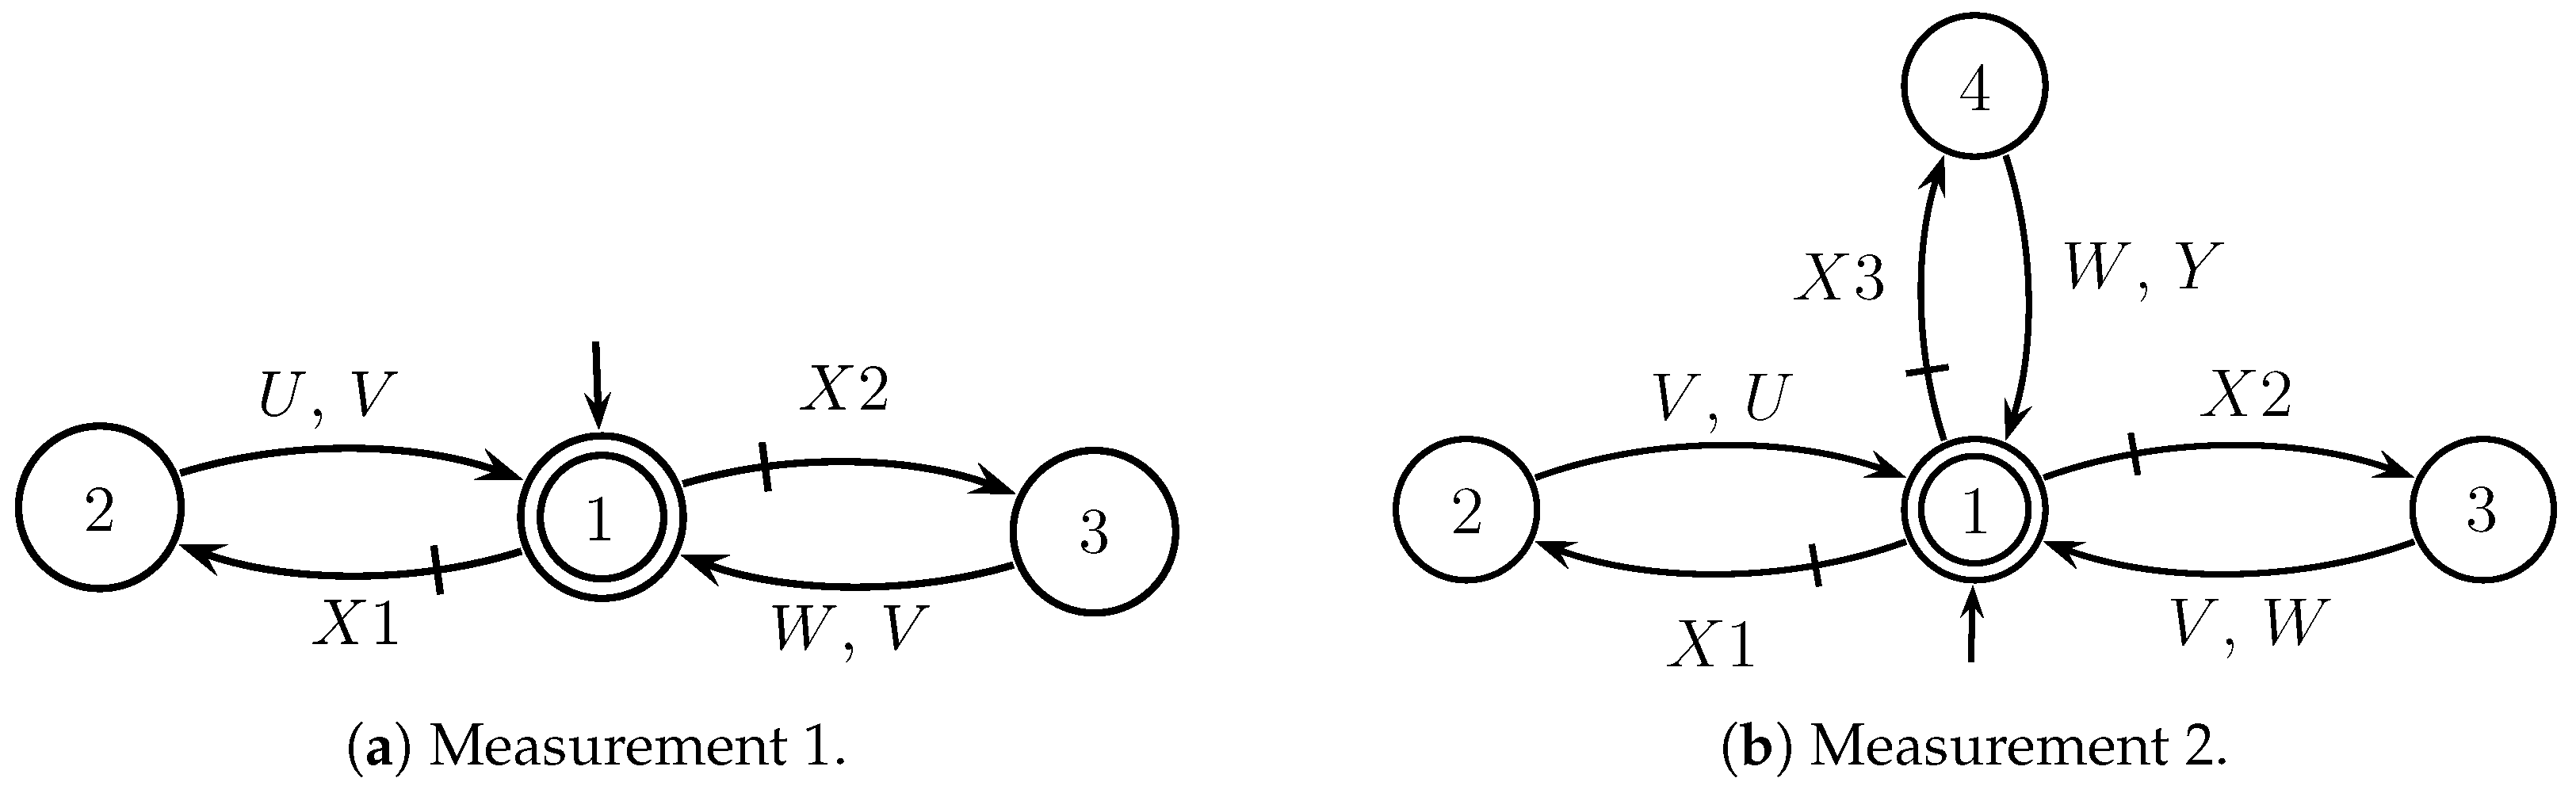
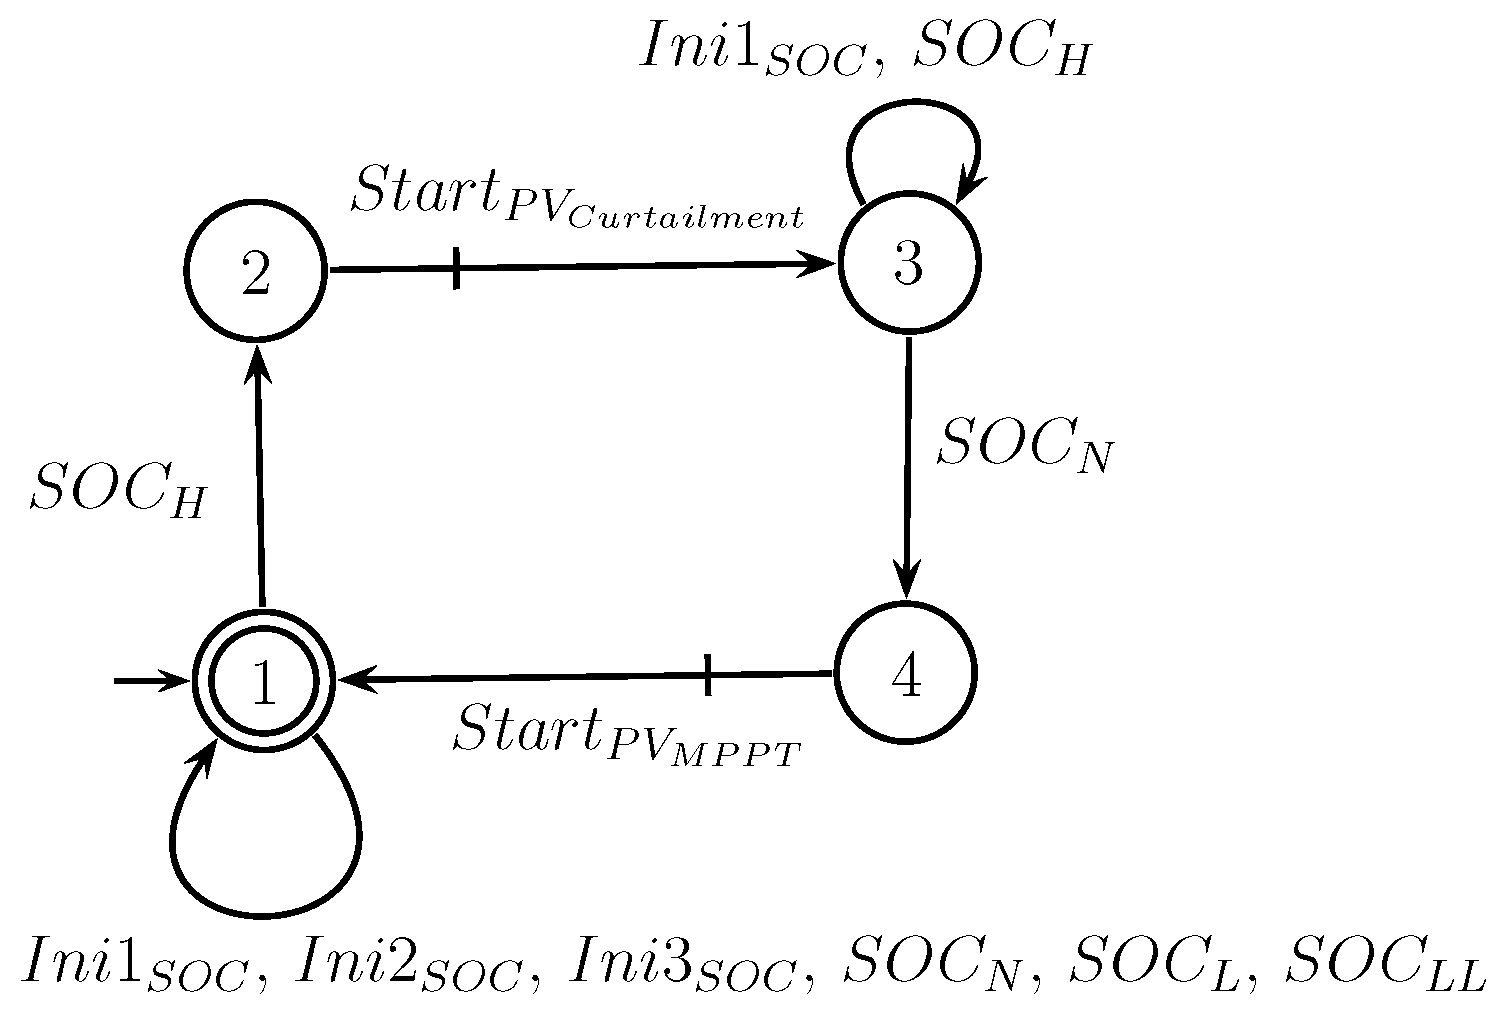
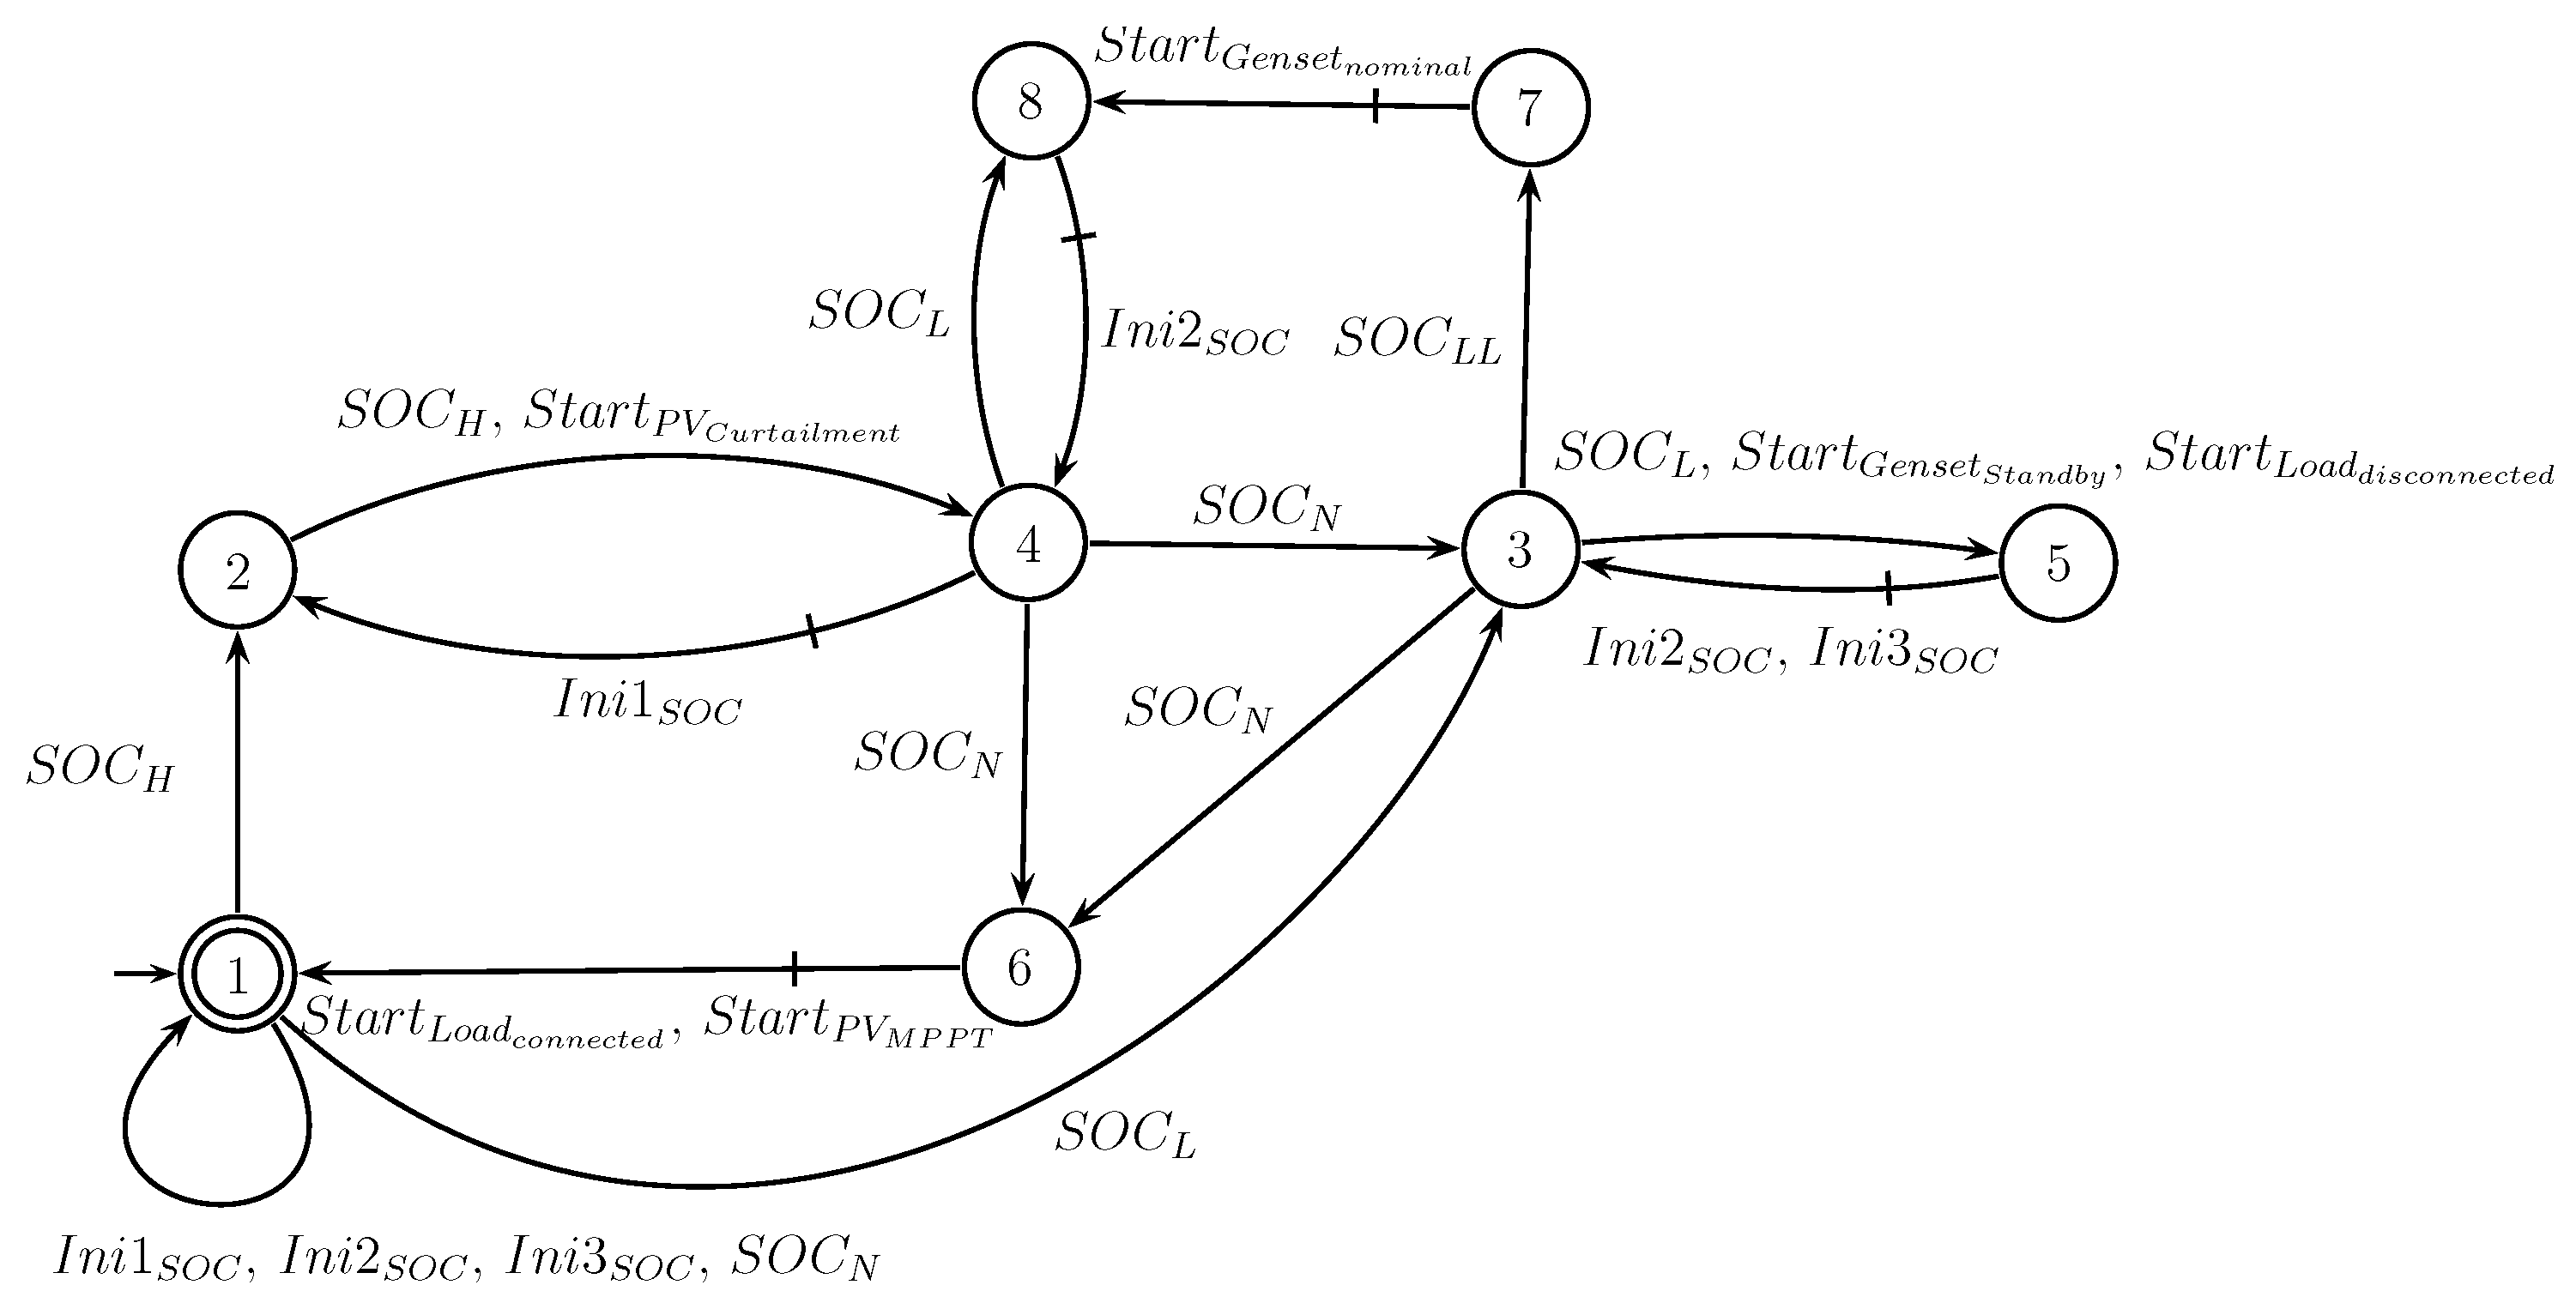
| G7: BMS | 1: SOC 2: SOC 3: SOC 4: SOC | X1,X2,X3: Initialization of BMS U: V: W: Y: | Monitoring the maximum and minimum SOC of the BESS: When the SOC is above , the PV goes into curtailment mode and when the SOC returns below , the PV returns into MPPT mode. If SOC is below , the noncritical load is disconnected. When the SOC drops below , the Genset must inject its nominal power. |
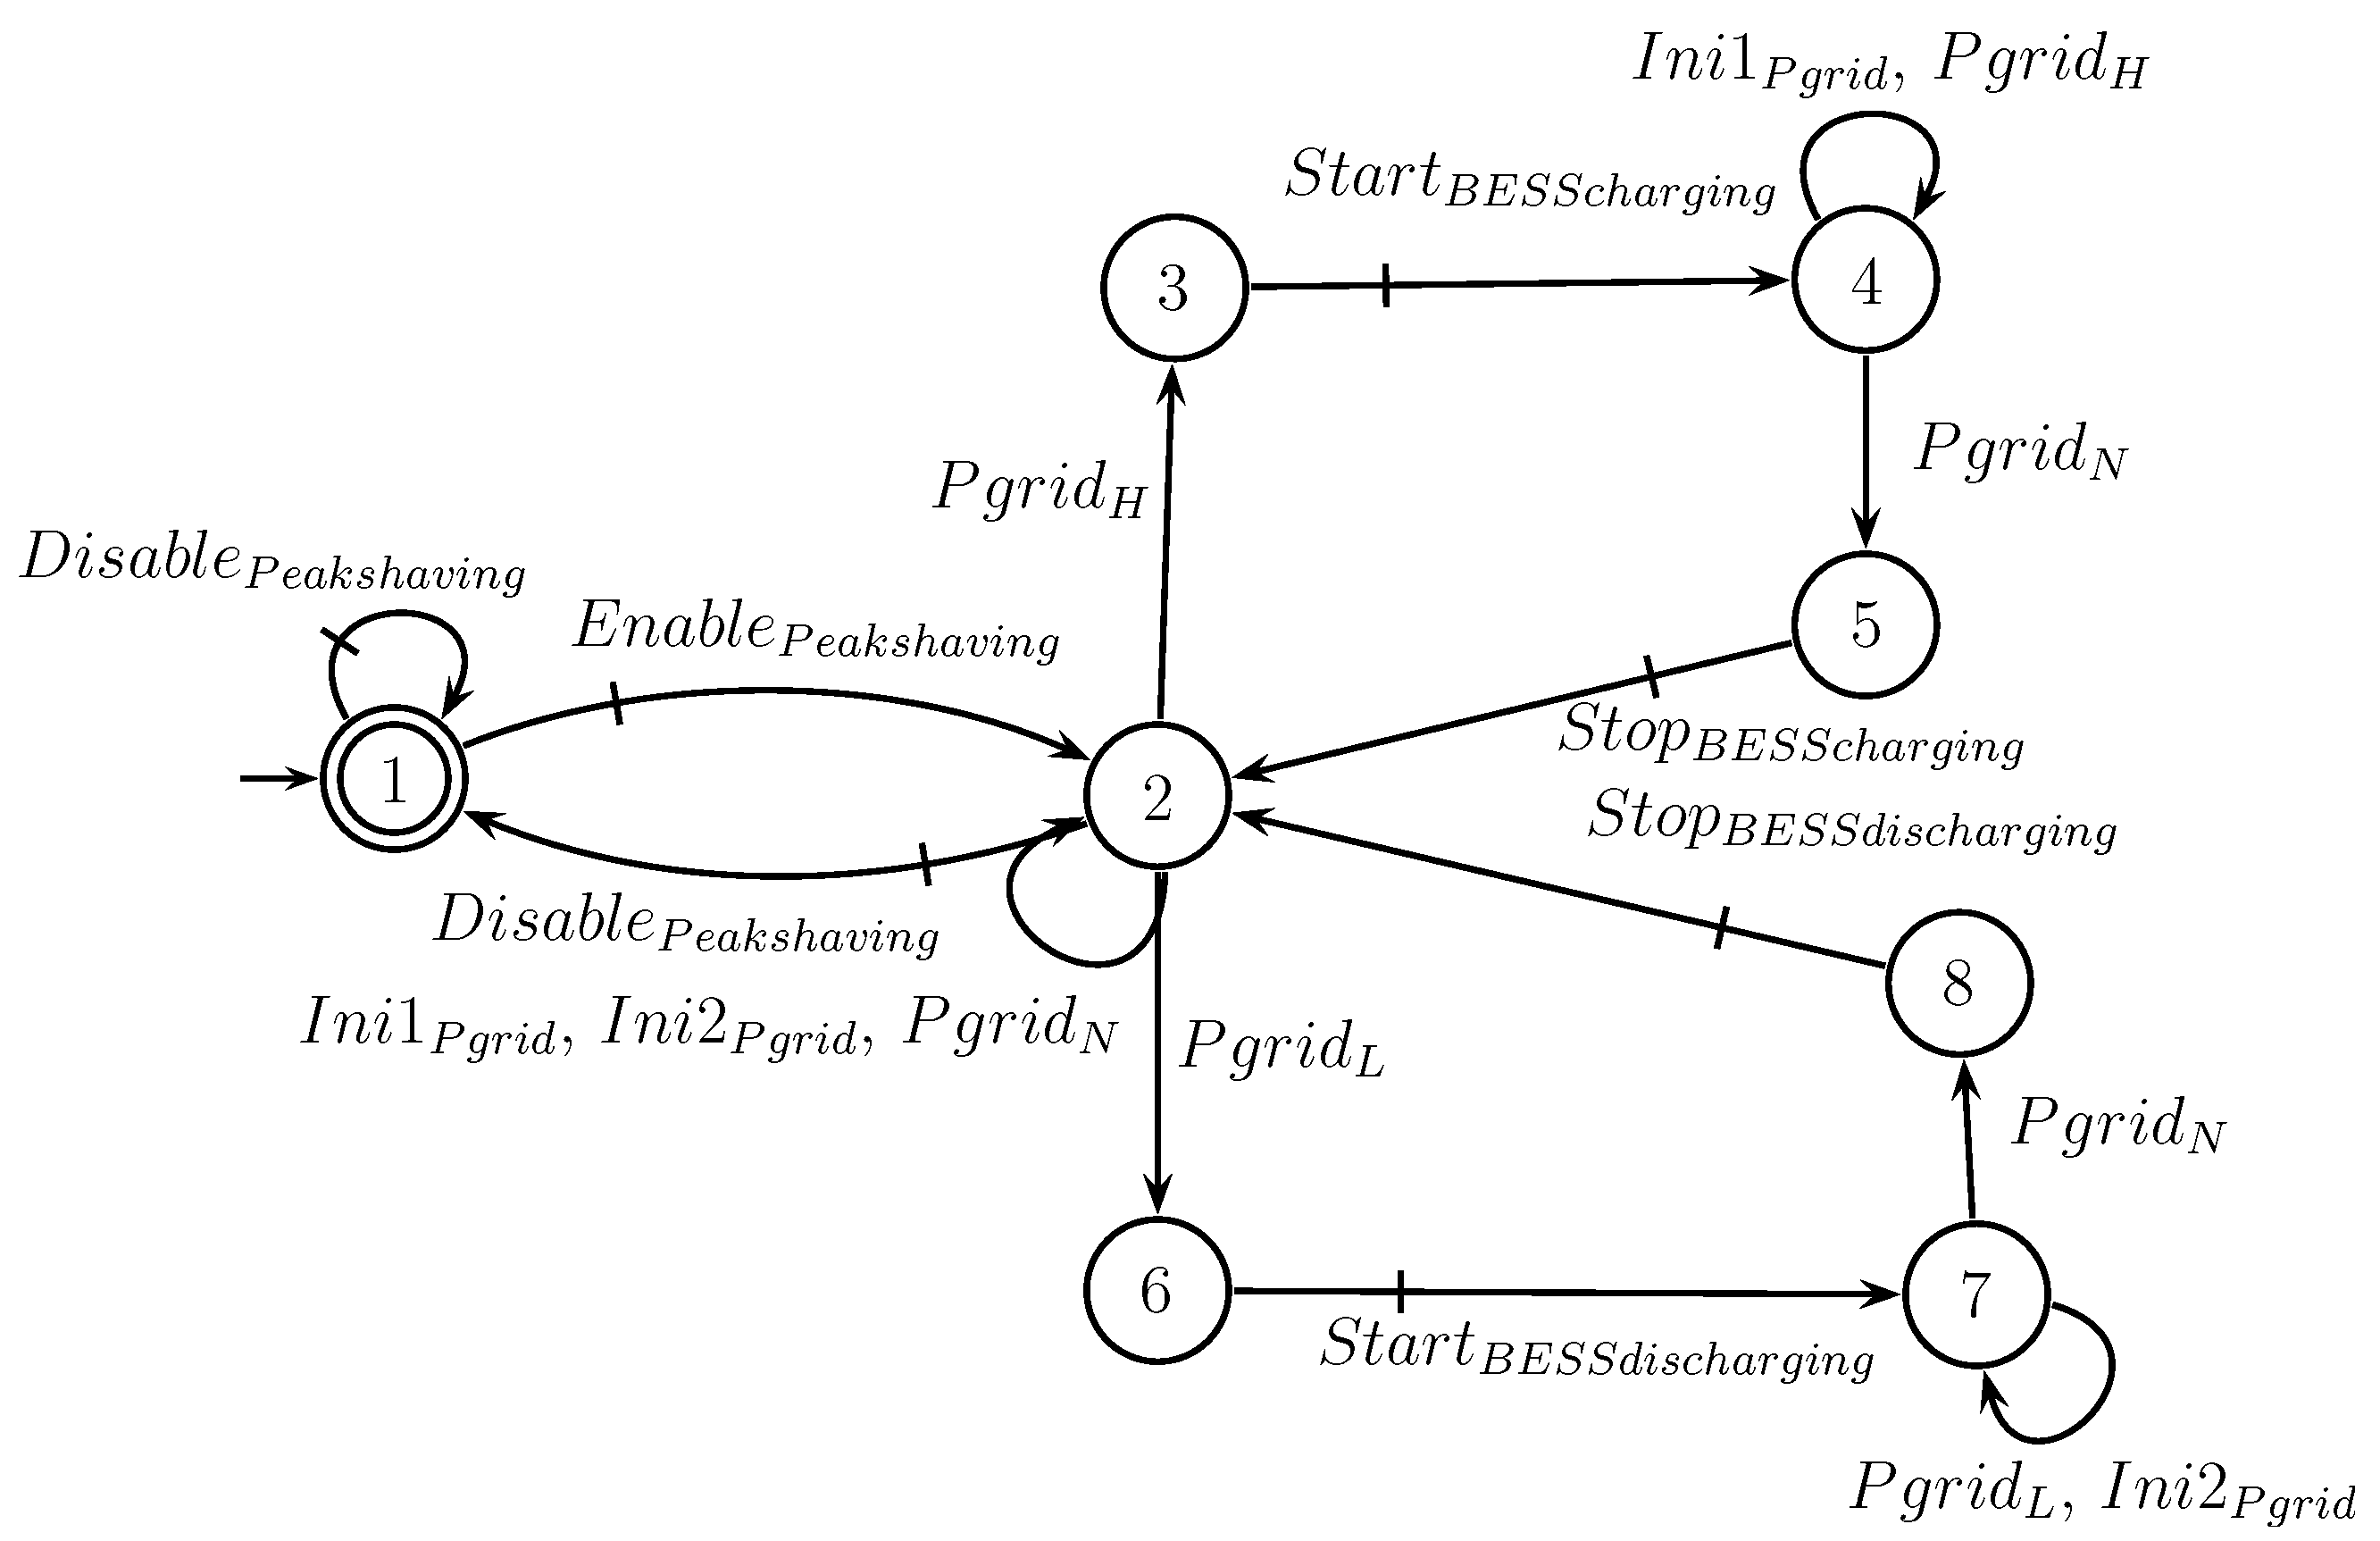
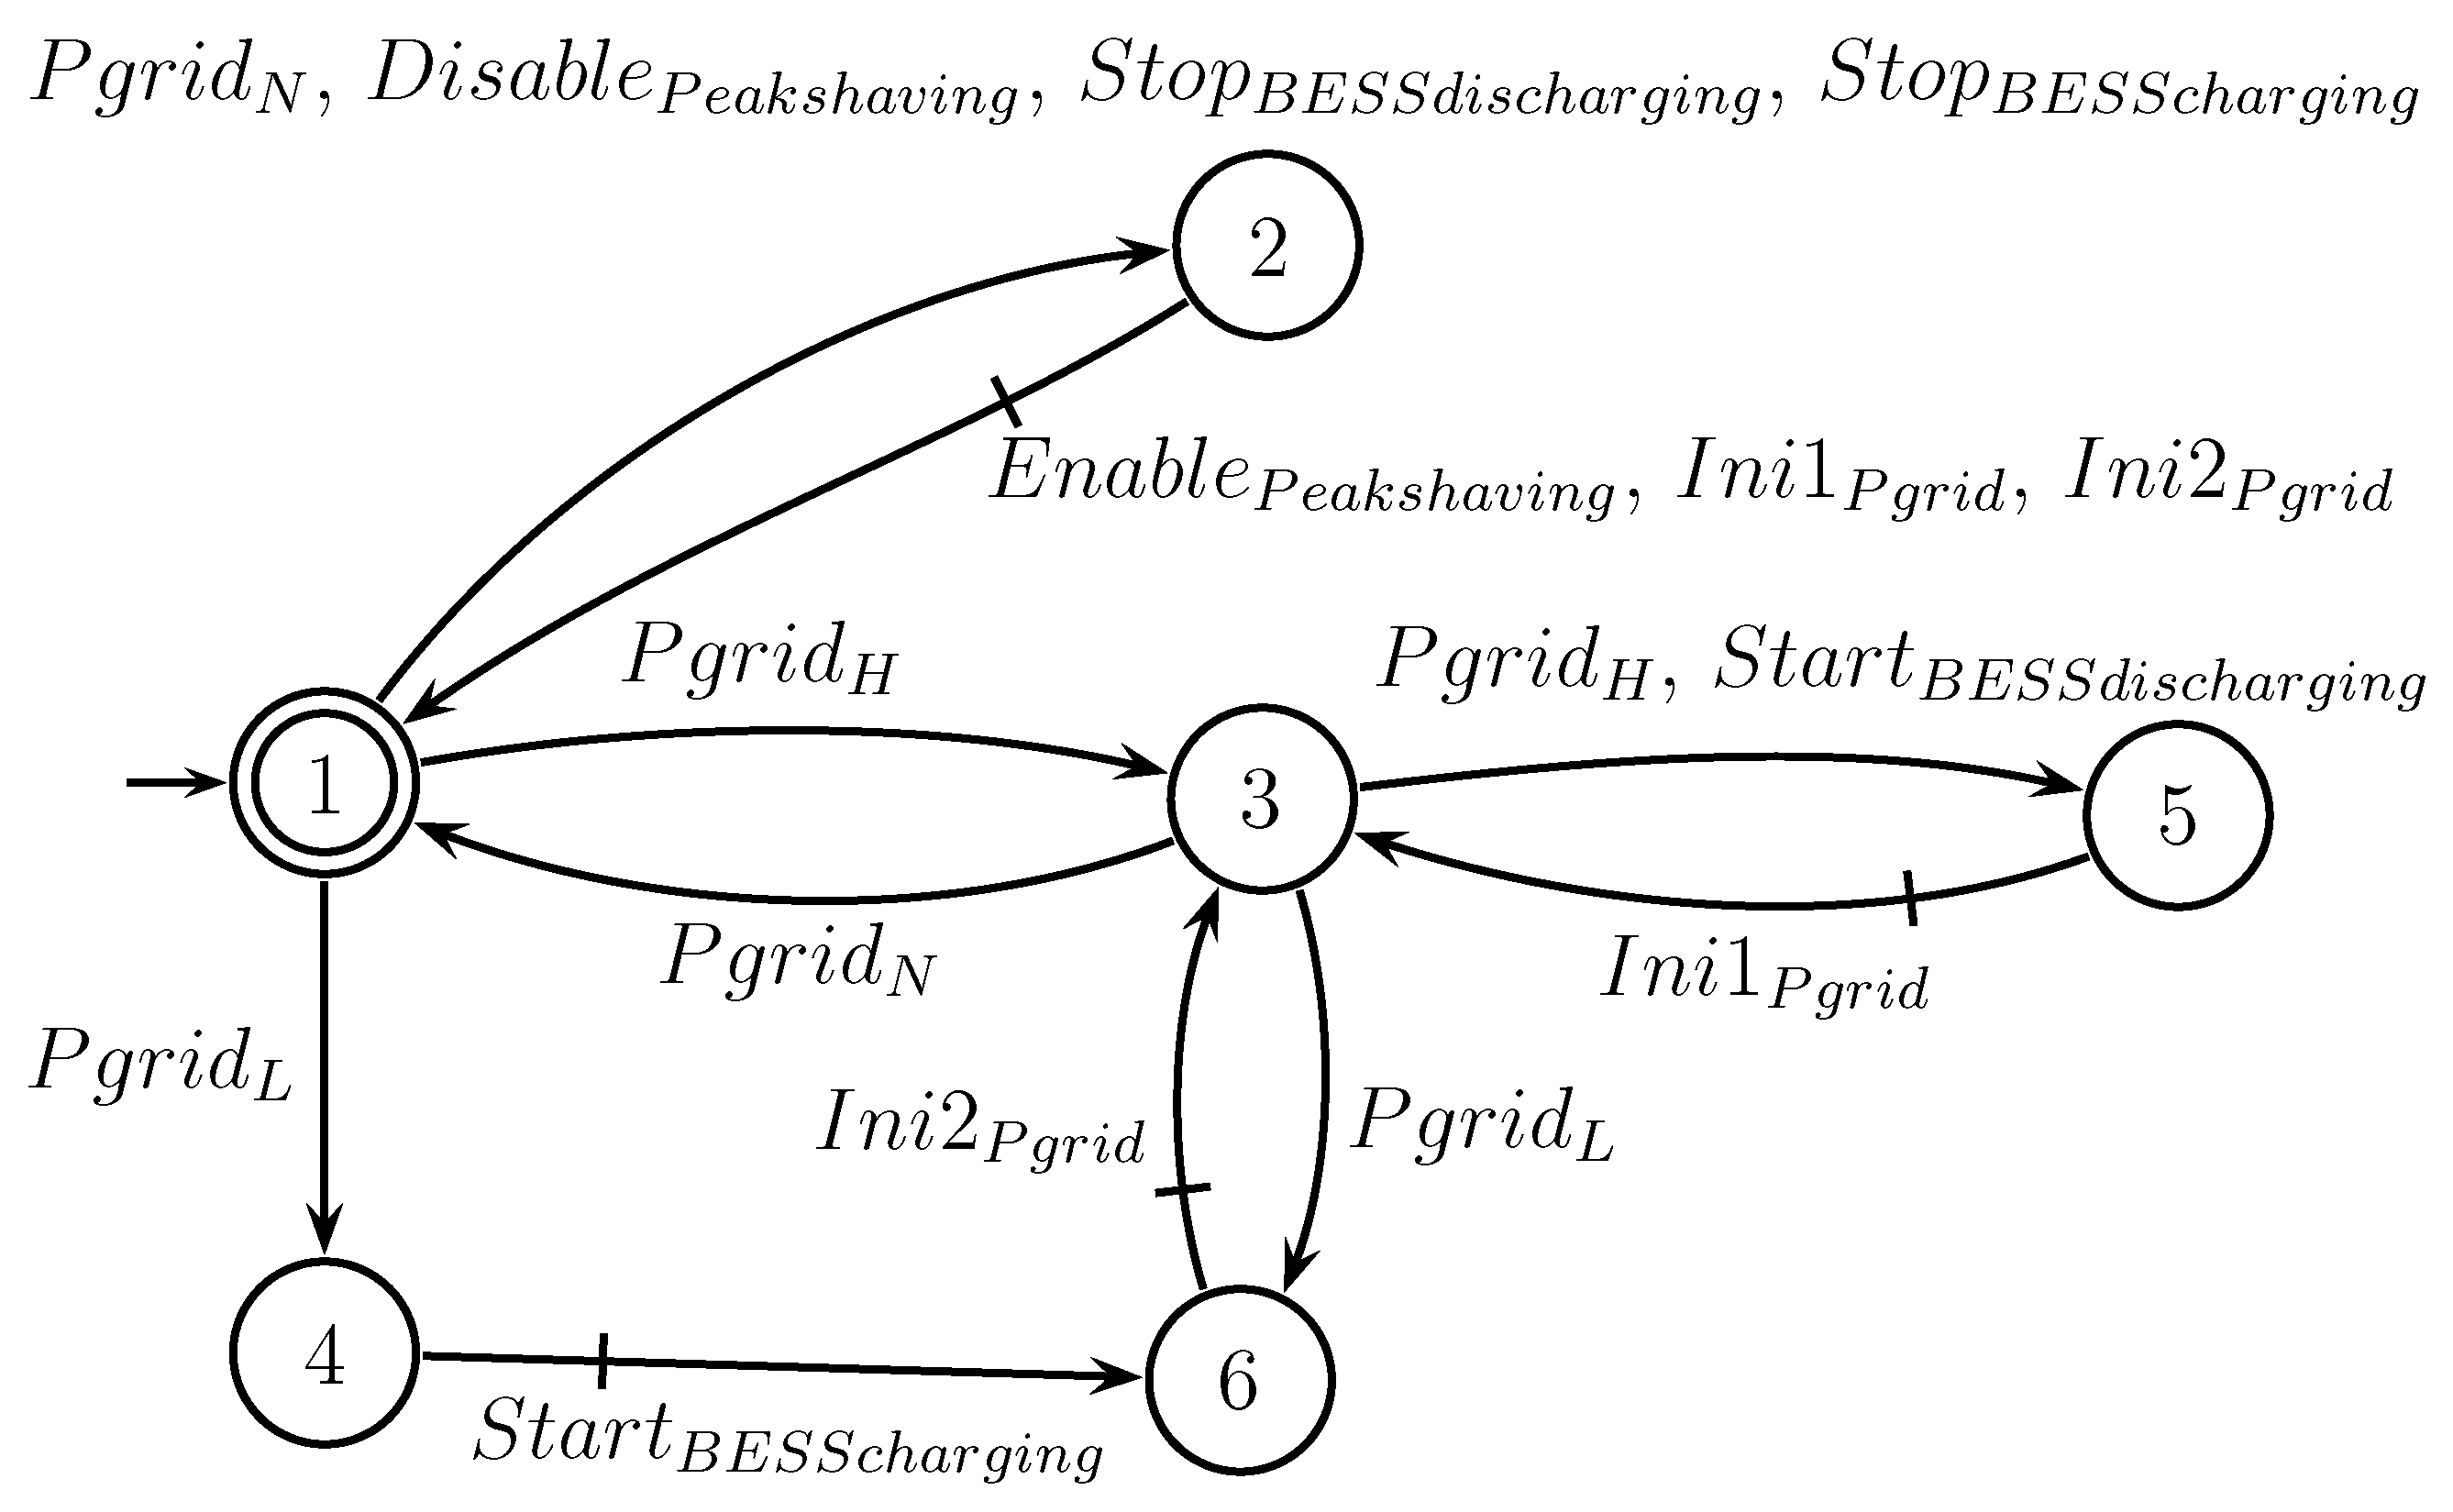
| G8: Pgrid | 1: 2: 3: | X1,X2: Initialization of Pgrid U: V: W: | Monitoring the grid’s active power: The grid’s power must not exceed the contracted value. If , the BESS goes into discharge mode. If , the BESS goes into charging mode. Otherwise, BESS is in stamdby mode. |
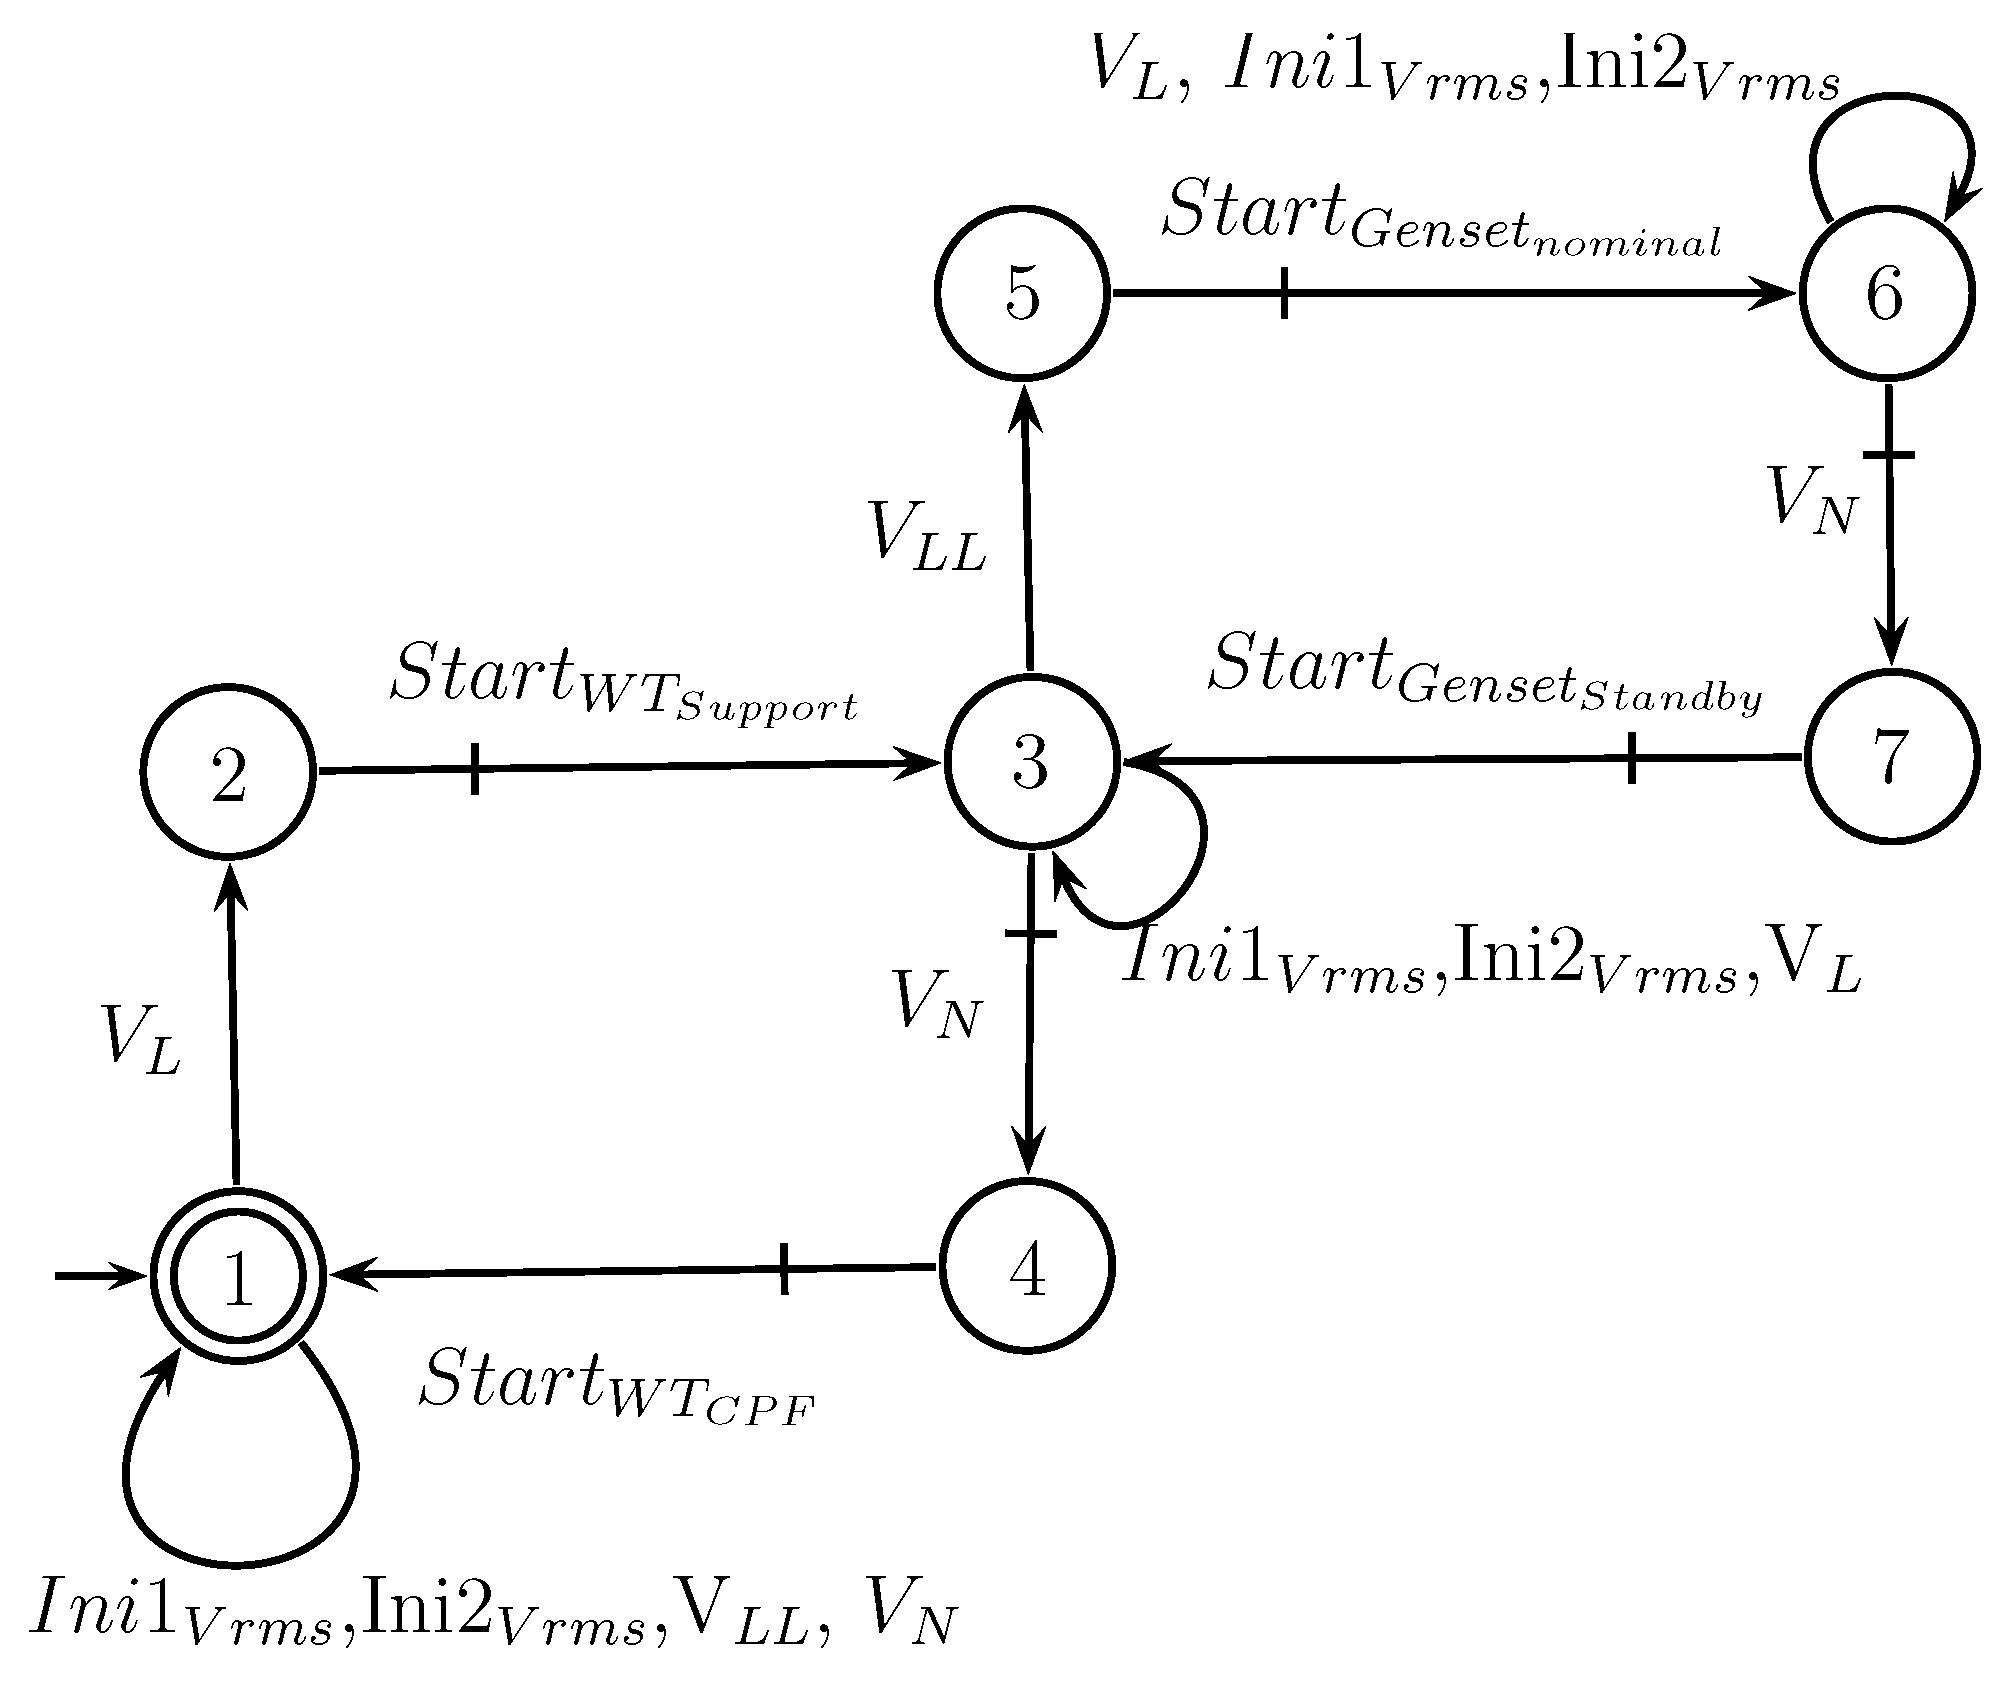
| G9: Vrms | 1: 2: 3: | ,: Initialization of U: V: W: V: | Monitoring the POI’s RMS voltage: The voltage must not drop below , as required by the grid code. To ensure this, the WT and genset provide voltage support. When the voltage (Vrms) at the POI is above , the WT remains in constant power factor mode. If the voltage drops below , the WT switches to voltage support mode. If the voltage drop persists, the Genset also comes into operation to provide additional voltage support. |
4.3. Discrete Event System Plant Modeling
4.4. Modeling of Control Specifications
4.4.1. Specification —High SOC Management
4.4.2. Specification —Low SOC Management
4.4.3. Specification —POI Voltage Support Function
4.4.4. Specification —Peak Shaving Function
4.5. PMS Supervisors Realization in MATLAB Stateflow
5. Simulation Results and Discussions
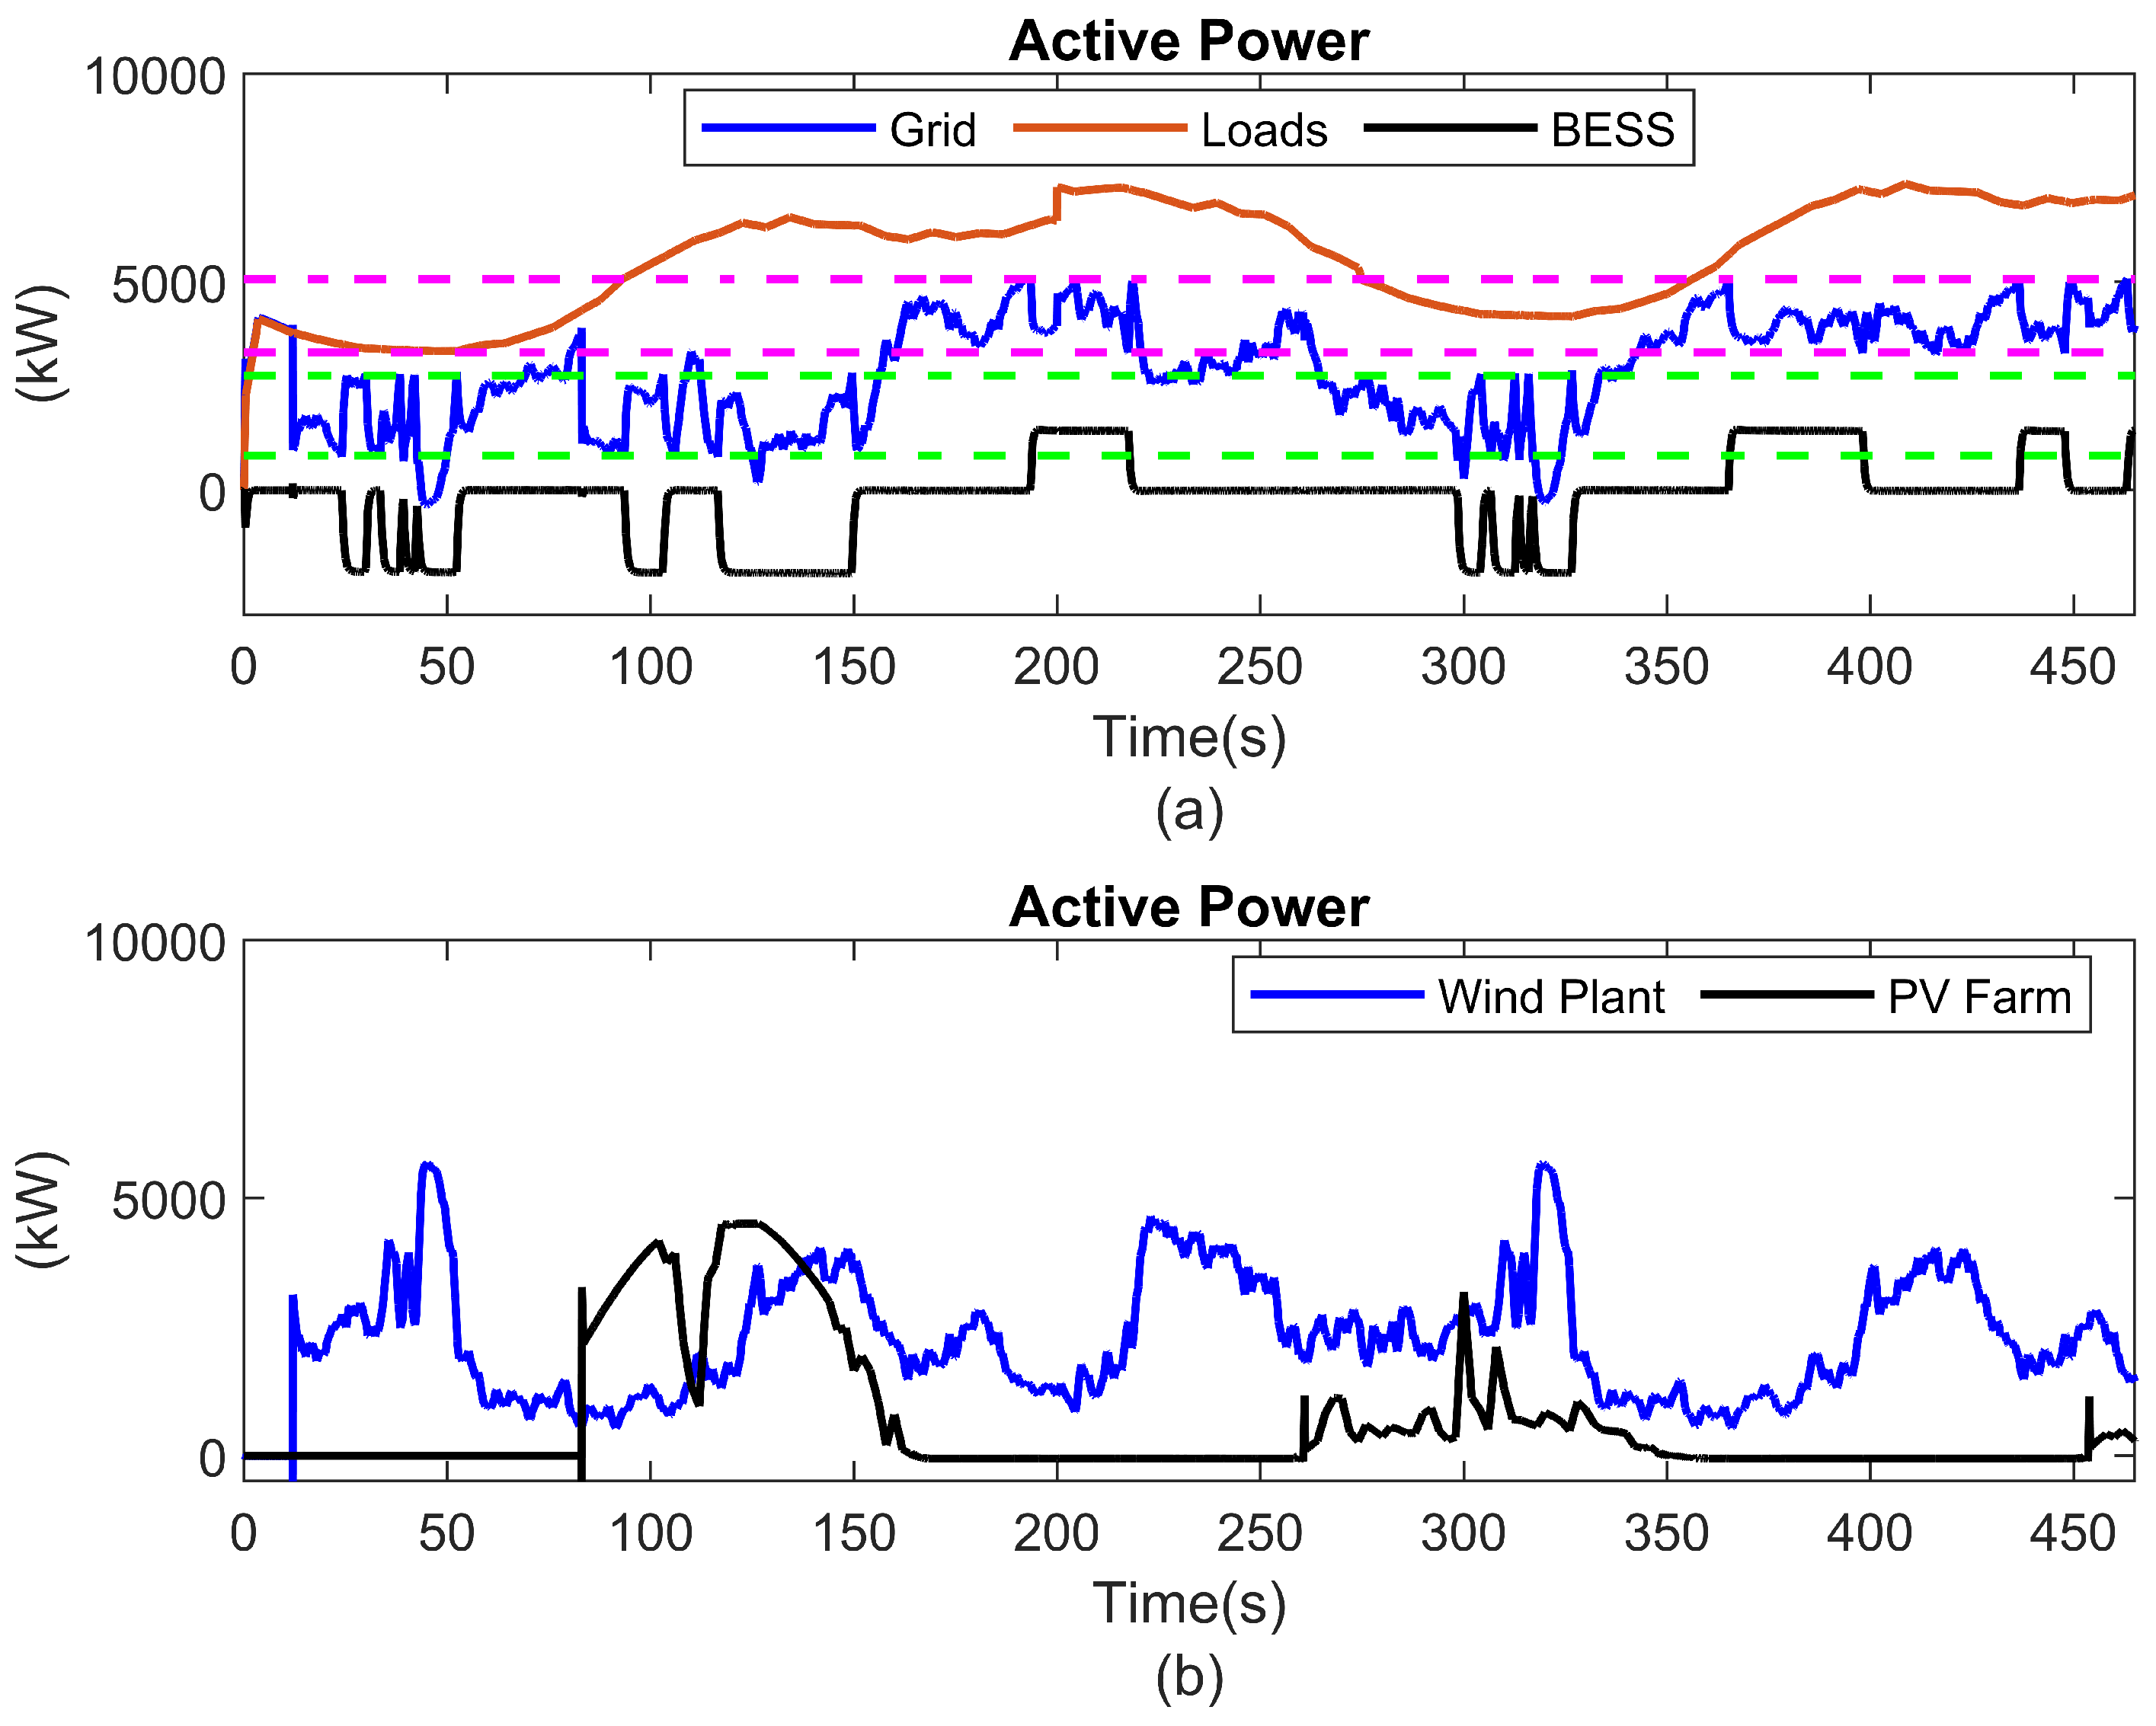
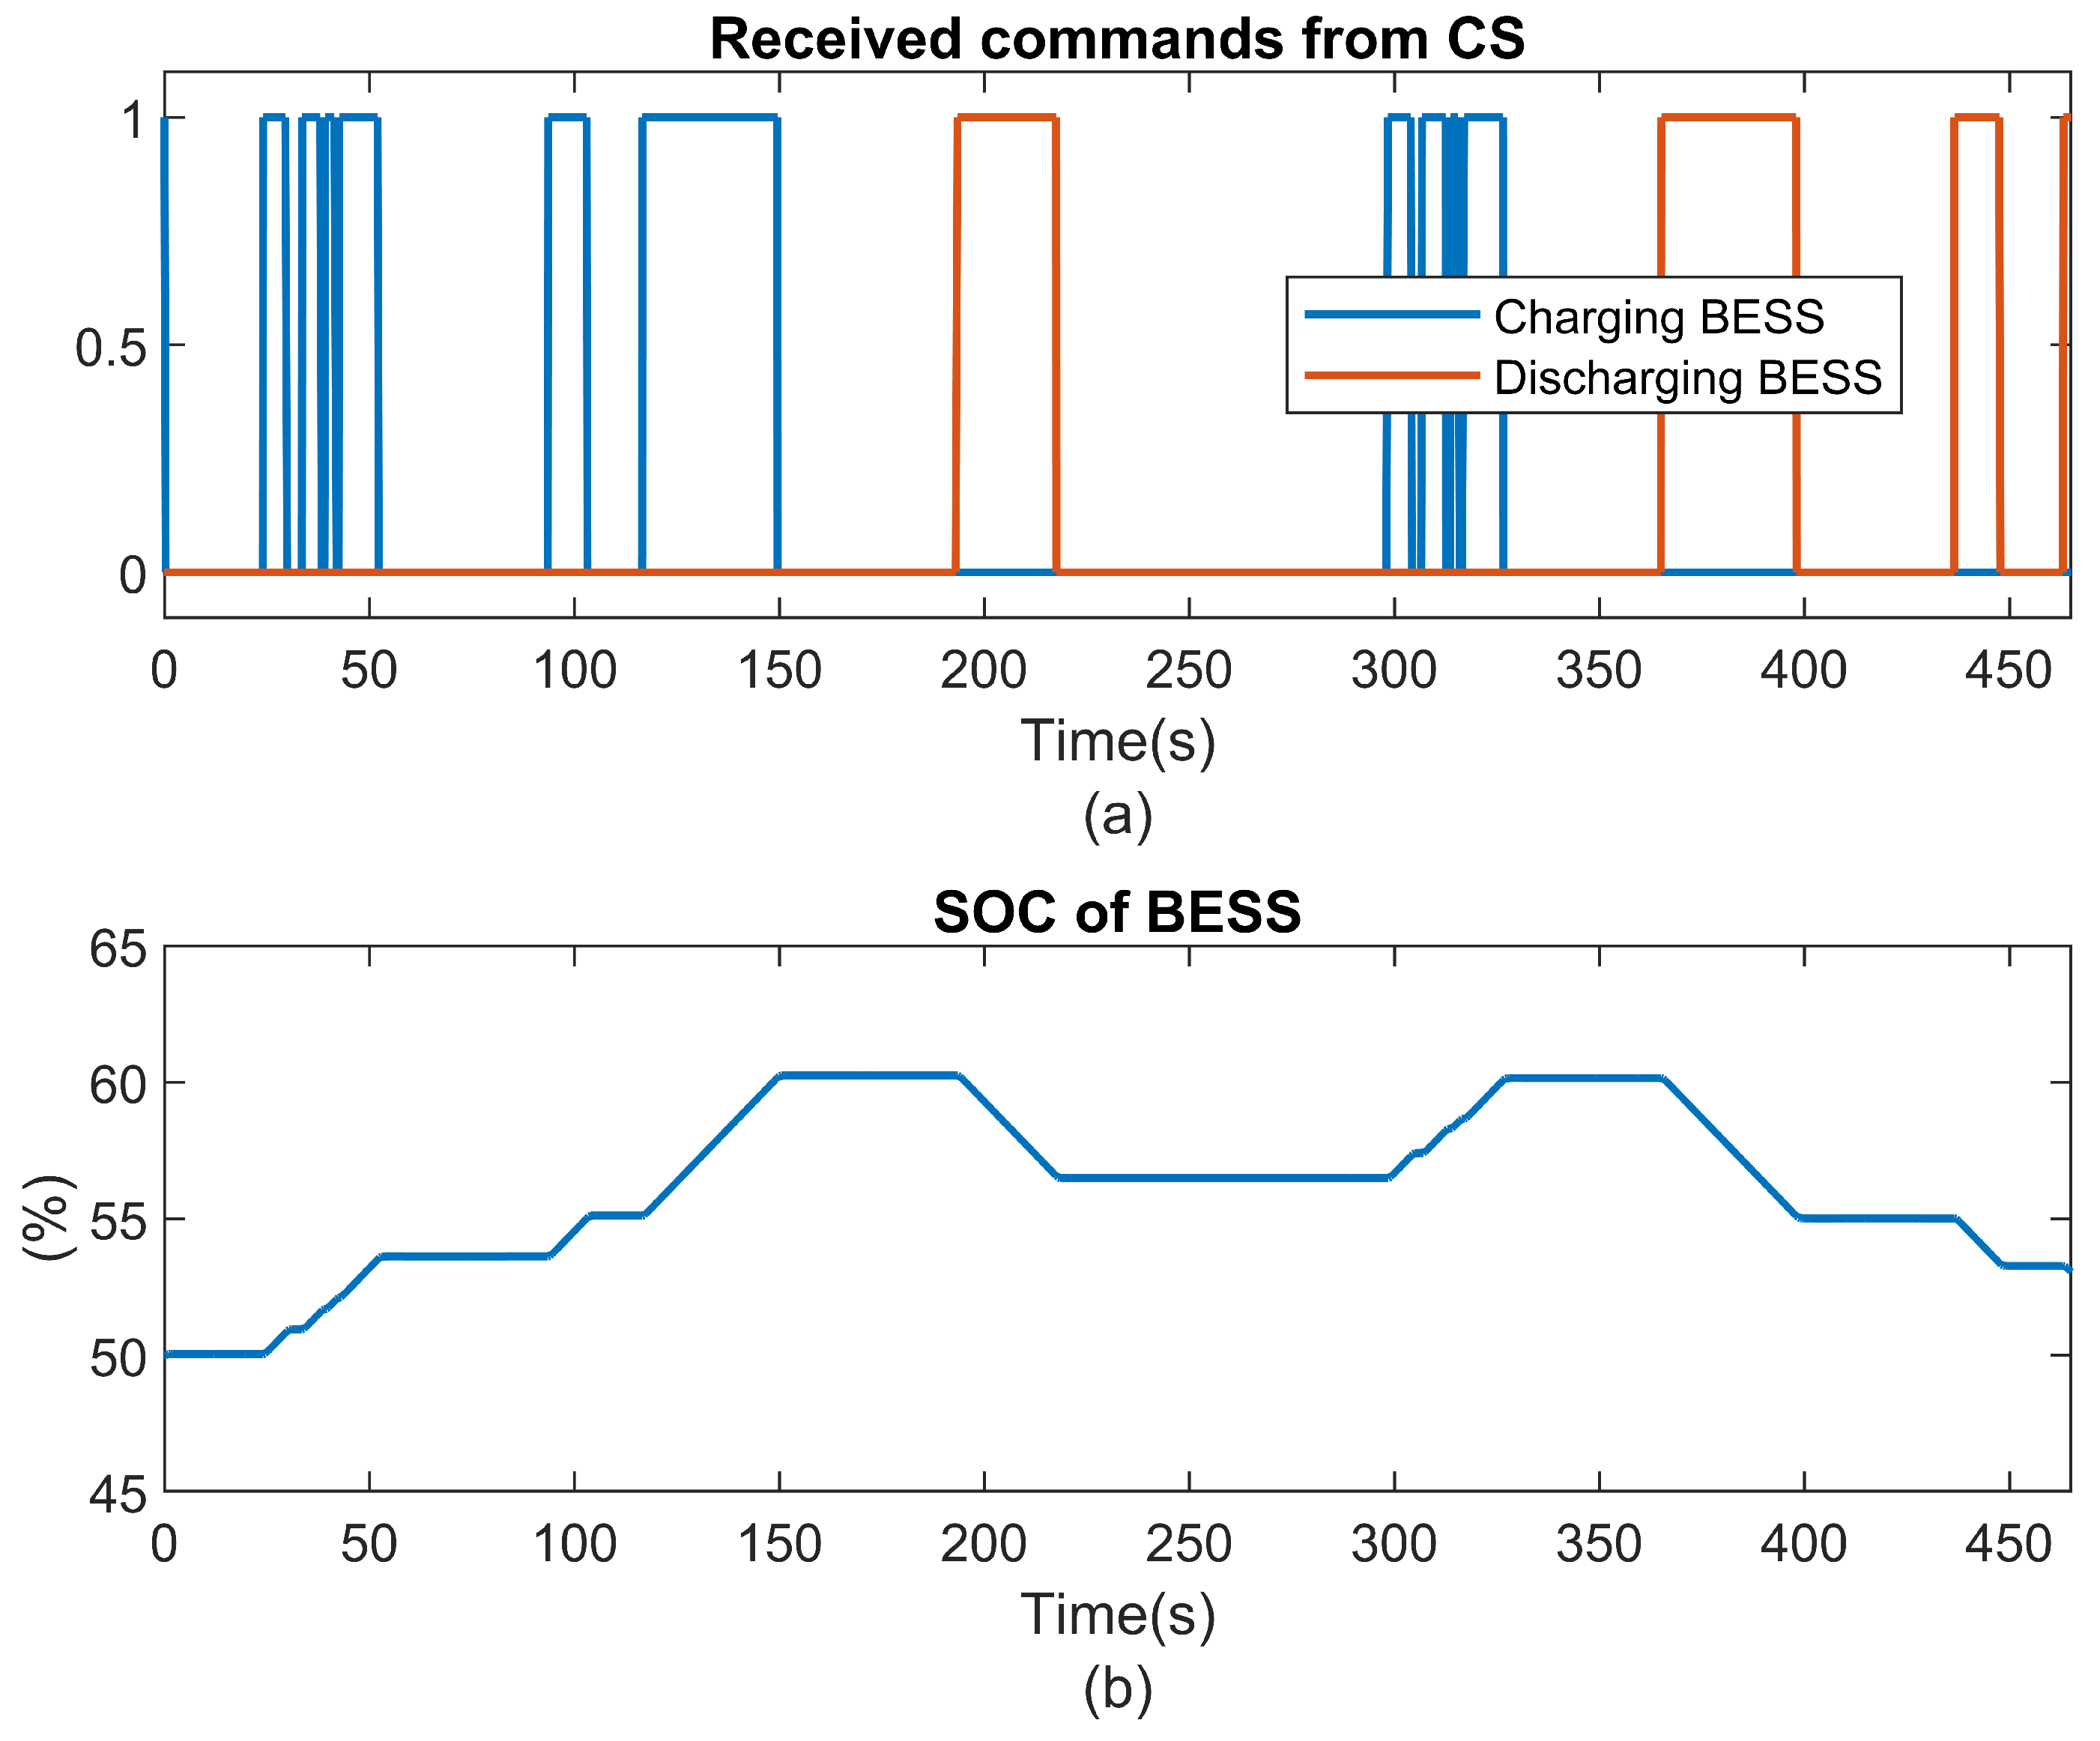
- Peak shaving: In this operating mode, the power supplied from the utility grid to the microgrid is restricted to the contracted power, without compromising the energy supplied to the loads. For this, the BESS is charged during low-demand periods, when electricity costs are lower. On the other hand, the BESS is discharged during periods of high demand.
- Islanded Operation: The microgrid should have the capability to provide power to the loads in isolated mode, ensuring adequate voltage and frequency levels. The transition from grid-connected to islanded operation can occur as either a planned or unintended event. In the event of islanding, at least one source within the microgrid must regulate the voltage at POI to its nominal value and establish a reference frequency that matches the nominal frequency of the utility grid.
- –
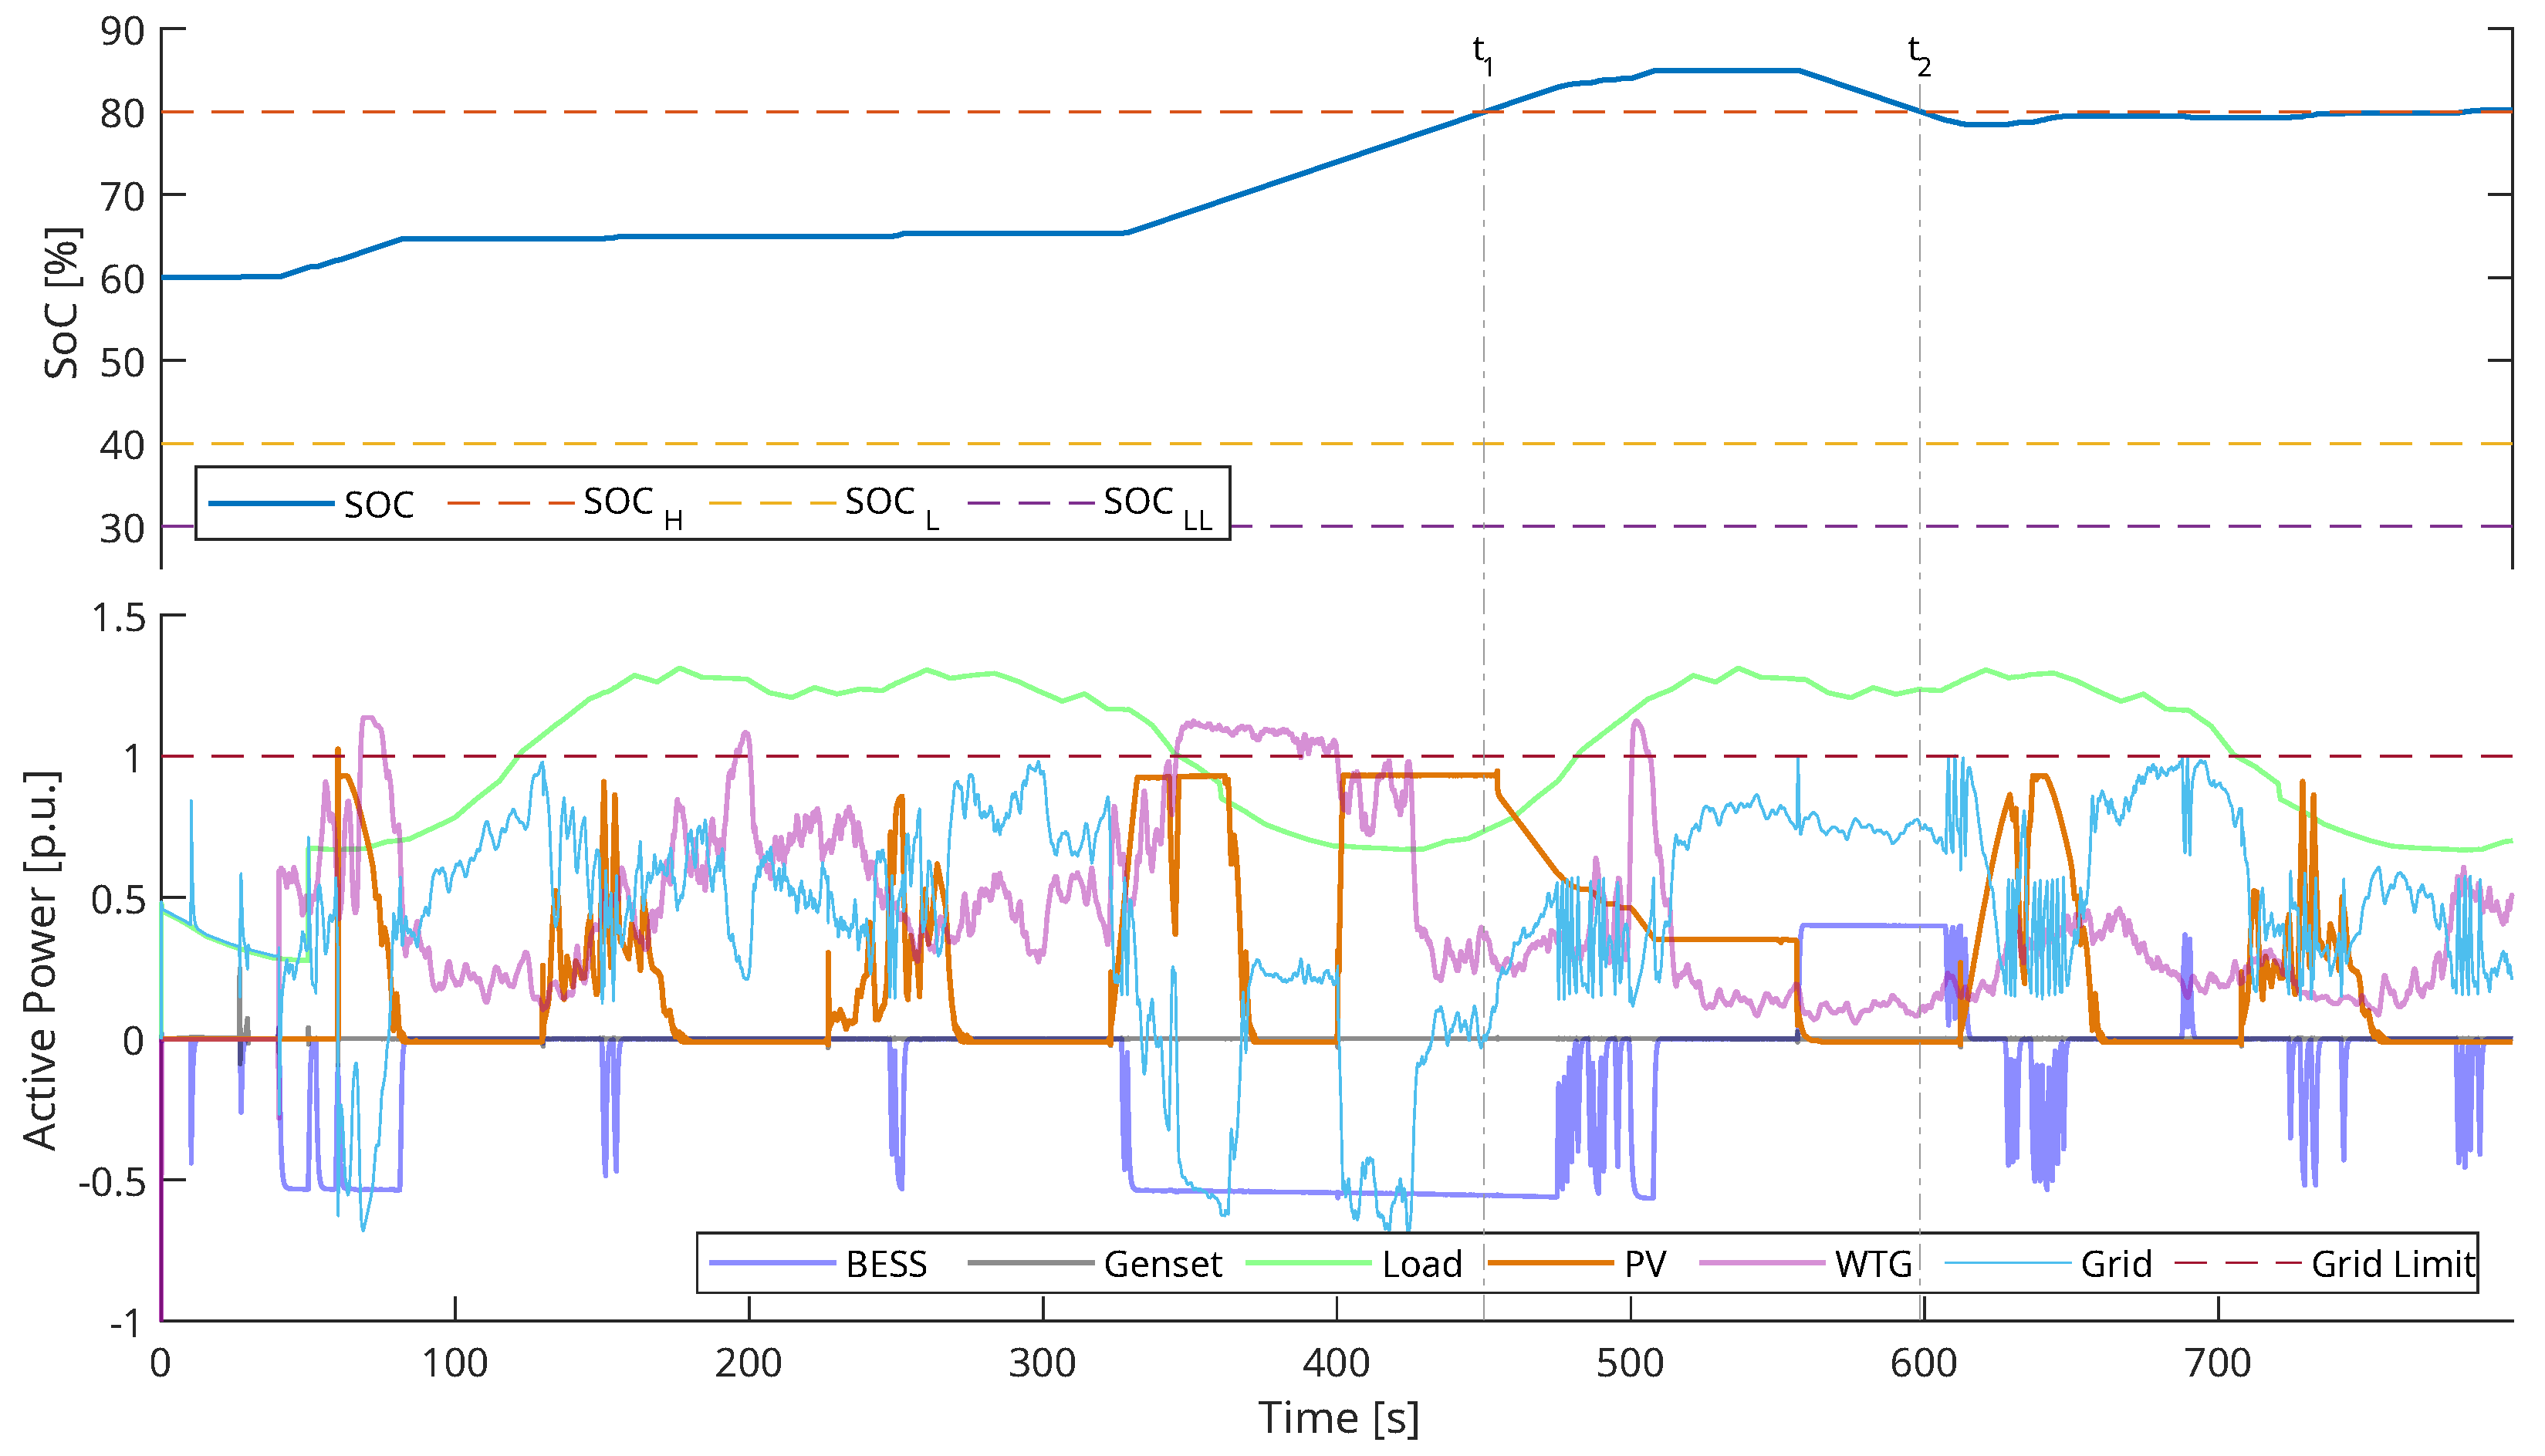
- Monitoring the voltage at the POI: The supervisors must ensure that the voltage is within the acceptable range of operation, sending operation commands to the different sources in the microgrid.
- –
- Monitoring the SOC of the BESS: In order to prolong the life of the battery, it is important that it operates in a quasi-linear charge and discharge mode. To this end, the supervisors change the operating modes of the BESS.
5.1. Grid-Connected OPERATION
5.1.1. Peak Shaving Under Normal Renewable Generation Conditions (Scenario (i))
5.1.2. Peak Shaving Under Low Renewable Generation Conditions (Scenario (ii))
5.1.3. Peak Shaving Under High Renewable Generation Conditions (Scenario (iii))
5.2. Islanded Operation
5.2.1. Low Renewable Generation Conditions (Scenario (iv))
5.2.2. High Renewable Generation Conditions (Scenario (v))
5.2.3. Voltage Support Operation Condition Scenario (vi)
6. Conclusions
Author Contributions
Funding
Data Availability Statement
Acknowledgments
Conflicts of Interest
Appendix A. Values Used to Compare PMS Signals
| Variable | Value | Base |
|---|---|---|
| 0.9 p.u. | 5000 [kW] | |
| 0.25 p.u. | 5000 [kW] | |
| 0.92 p.u. | 13.8 [kV] | |
| 0.85 p.u. | 13.8 [kV] | |
| 80% | ||
| 40% | ||
| 30% |
| Components | (kVA) | (kW) |
|---|---|---|
| PV system | 4800.0 | 4800.0 |
| Wind system | 5700.0 | 5415.0 |
| BESS | 8400.0 | 8400.0 |
| Genset | 5960.0 | 5364.0 |
| Total Generation Power | 24,860.0 | 23,979.0 |
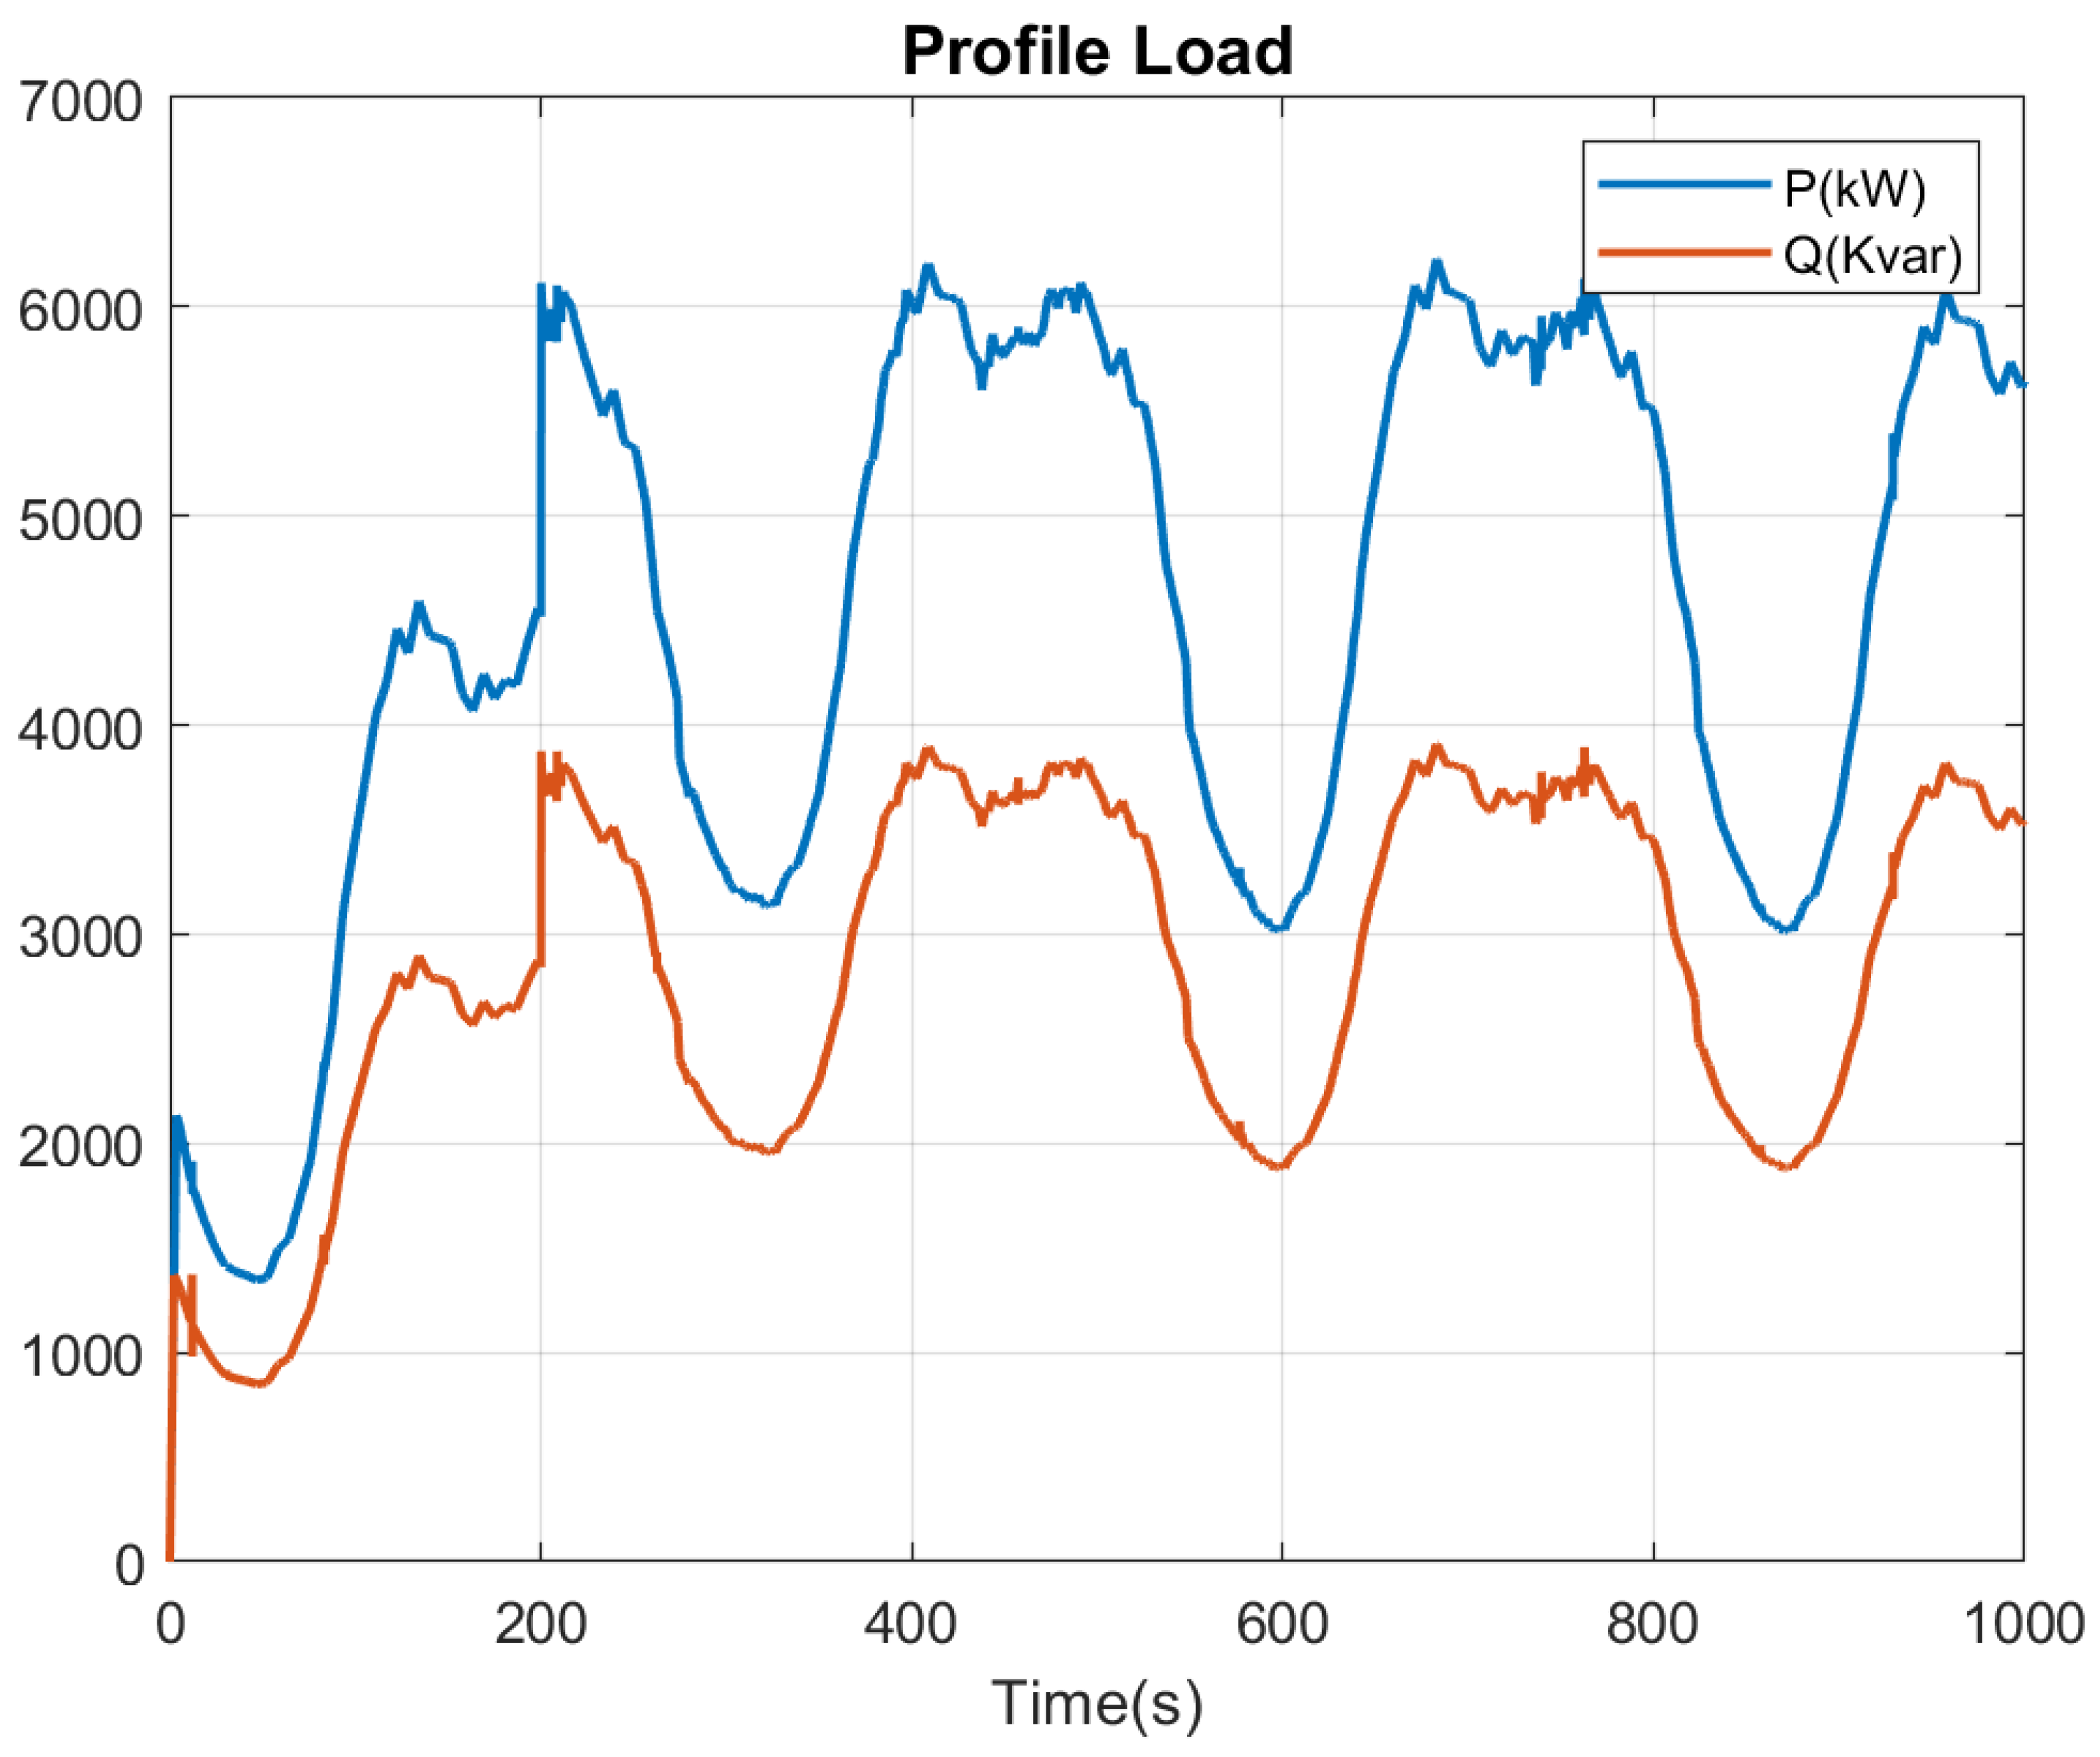
| Load | (kVA) | (kW) |
| Critical maximum | 5420.0 | 4607.0 |
| Critical minimum | 1591.0 | 1352.0 |
| Critical average | 1000.0 | 850.0 |
| Noncritical | 2000.0 | 2000.0 |
References
- Ritchie, H.; Roser, M.; Rosado, P. Electricity Production by Source, World. 2022. [Google Scholar]
- Hirsch, A.; Parag, Y.; Guerrero, J. Microgrids: A review of technologies, key drivers, and outstanding issues. Renew. Sustain. Energy Rev. 2018, 90, 402–411. [Google Scholar] [CrossRef]
- Cagnano, A.; De Tuglie, E.; Mancarella, P. Microgrids: Overview and guidelines for practical implementations and operation. Appl. Energy 2020, 258, 114039. [Google Scholar] [CrossRef]
- Olivares, D.E.; Mehrizi-Sani, A.; Etemadi, A.H.; Cañizares, C.A.; Iravani, R.; Kazerani, M.; Hajimiragha, A.H.; Gomis-Bellmunt, O.; Saeedifard, M.; Palma-Behnke, R.; et al. Trends in microgrid control. IEEE Trans. Smart Grid 2014, 5, 1905–1919. [Google Scholar] [CrossRef]
- Meng, L.; Sanseverino, E.R.; Luna, A.; Dragicevic, T.; Vasquez, J.C.; Guerrero, J.M. Microgrid supervisory controllers and energy management systems: A literature review. Renew. Sustain. Energy Rev. 2016, 60, 1263–1273. [Google Scholar] [CrossRef]
- Zahraoui, Y.; Alhamrouni, I.; Mekhilef, S.; Basir Khan, M.R.; Seyedmahmoudian, M.; Stojcevski, A.; Horan, B. Energy management system in microgrids: A comprehensive review. Sustainability 2021, 13, 10492. [Google Scholar] [CrossRef]
- Vuddanti, S.; Salkuti, S.R. Review of energy management system approaches in microgrids. Energies 2021, 14, 5459. [Google Scholar] [CrossRef]
- Ahmad, S.; Shafiullah, M.; Ahmed, C.B.; Alowaifeer, M. A review of microgrid energy management and control strategies. IEEE Access 2023, 11, 21729–21757. [Google Scholar] [CrossRef]
- Colson, C.M.; Nehrir, M.H. A review of challenges to real-time power management of microgrids. In Proceedings of the 2009 IEEE Power & Energy Society General Meeting, Calgary, AB, Canada, 26–30 July 2009; pp. 1–8. [Google Scholar]
- Yang, N.; Paire, D.; Gao, F.; Miraoui, A. Power management strategies for microgrid-A short review. In Proceedings of the 2013 IEEE Industry Applications Society Annual Meeting, Orlando, FL, USA, 6–11 October 2013; pp. 1–9. [Google Scholar]
- Jamal, S.; Tan, N.M.; Pasupuleti, J. A review of energy management and power management systems for microgrid and nanogrid applications. Sustainability 2021, 13, 10331. [Google Scholar] [CrossRef]
- El Barkouki, B.; Laamim, M.; Ouassaid, M.; Mahir, O.; Rochd, A. Real-time supervisory control strategy for a grid-connected microgrid using hardware-in-the-loop simulation. Comput. Electr. Eng. 2025, 124, 110419. [Google Scholar] [CrossRef]
- Garcia-Torres, F.; Zafra-Cabeza, A.; Silva, C.; Grieu, S.; Darure, T.; Estanqueiro, A. Model predictive control for microgrid functionalities: Review and future challenges. Energies 2021, 14, 1296. [Google Scholar] [CrossRef]
- Joshal, K.S.; Gupta, N. Microgrids with model predictive control: A critical review. Energies 2023, 16, 4851. [Google Scholar] [CrossRef]
- Meydani, A.; Shahinzadeh, H.; Nafisi, H.; Gharehpetian, G.B. Optimizing Microgrid Energy Management: Metaheuristic versus Conventional Techniques. In Proceedings of the 2024 11th Iranian Conference on Renewable Energy and Distribution Generation (ICREDG), Yazd, Iran, 6–7 March 2024; Volume 11, pp. 1–15. [Google Scholar]
- Farrokhabadi, M.; Solanki, B.V.; Canizares, C.A.; Bhattacharya, K.; Koenig, S.; Sauter, P.S.; Leibfried, T.; Hohmann, S. Energy Storage in Microgrids: Compensating for Generation and Demand Fluctuations While Providing Ancillary Services. IEEE Power Energy Mag. 2017, 15, 81–91. [Google Scholar] [CrossRef]
- Chen, M.; Xiao, X.; Guerrero, J.M. Secondary restoration control of islanded microgrids with a decentralized event-triggered strategy. IEEE Trans. Ind. Inform. 2017, 14, 3870–3880. [Google Scholar] [CrossRef]
- Diaz, N.L.; Luna, A.C.; Vasquez, J.C.; Guerrero, J.M. Centralized control architecture for coordination of distributed renewable generation and energy storage in islanded AC microgrids. IEEE Trans. Power Electron. 2016, 32, 5202–5213. [Google Scholar] [CrossRef]
- Karimi, Y.; Oraee, H.; Golsorkhi, M.S.; Guerrero, J.M. Decentralized method for load sharing and power management in a PV/battery hybrid source islanded microgrid. IEEE Trans. Power Electron. 2016, 32, 3525–3535. [Google Scholar] [CrossRef]
- Lu, X.; Zhou, M.; Ammari, A.C.; Ji, J. Hybrid Petri nets for modeling and analysis of microgrid systems. IEEE/CAA J. Autom. Sin. 2016, 3, 349–356. [Google Scholar] [CrossRef]
- Ghasaei, A.; Zhang, Z.J.; Wonham, W.M.; Iravani, R. A Discrete-Event Supervisory Control for the AC Microgrid. IEEE Trans. Power Deliv. 2020, 36, 663–675. [Google Scholar] [CrossRef]
- Liu, X.; Zhao, M.; Wei, Z.; Lu, M. The energy management and economic optimization scheduling of microgrid based on Colored Petri net and Quantum-PSO algorithm. Sustain. Energy Technol. Assess. 2022, 53, 102670. [Google Scholar] [CrossRef]
- Mishra, J.; Behera, P.K.; Pattnaik, M.; Babu, B.C. A multi-agent Petri net model power management strategy for wind–solar-battery driven DC microgrid. Sustain. Energy Technol. Assess. 2023, 55, 102859. [Google Scholar] [CrossRef]
- Jirdehi, M.A.; Tabar, V.S.; Ghassemzadeh, S.; Tohidi, S. Different aspects of microgrid management: A comprehensive review. J. Energy Storage 2020, 30, 101457. [Google Scholar] [CrossRef]
- Saleh, M.; Esa, Y.; Mohamed, A. Centralized control for DC microgrid using finite state machine. In Proceedings of the 2017 IEEE Power & Energy Society Innovative Smart Grid Technologies Conference (ISGT), Torino, Italy, 26–29 September 2017; pp. 1–5. [Google Scholar]
- Bhaduri, R.; Rahul Saravana, G.; Vaskar, C. Supervisory controller for power management of microgrid using hybrid technique. Trans. Electr. Electron. Mater. 2020, 21, 30–47. [Google Scholar] [CrossRef]
- Sugumar, G.; Selvamuthukumaran, R.; Novak, M.; Dragicevic, T. Supervisory energy-management systems for microgrids: Modeling and formal verification. IEEE Ind. Electron. Mag. 2019, 13, 26–37. [Google Scholar] [CrossRef]
- Ramadge, P.J.; Wonham, W.M. Supervisory control of a class of discrete event processes. SIAM J. Control Optim. 1987, 25, 206–230. [Google Scholar] [CrossRef]
- Cassandras, C.G.; Lafortune, S. Introduction to Discrete Event Systems; Springer: Berlin/Heidelberg, Germany, 2008. [Google Scholar]
- Wonham, W.M.; Cai, K. Supervisory Control of Discrete-Event Systems; Springer International Publishing: Berlin/Heidelberg, Germany, 2019. [Google Scholar]
- Kharrazi, A.; Mishra, Y.; Sreeram, V. Discrete-event systems supervisory control for a custom power park. IEEE Trans. Smart Grid 2017, 10, 483–492. [Google Scholar] [CrossRef]
- Romero-Rodríguez, M.; Delpoux, R.; Piétrac, L.; Dai, J.; Benchaib, A.; Niel, E. An implementation method for the supervisory control of time-driven systems applied to high-voltage direct current transmission grids. Control Eng. Pract. 2019, 82, 97–107. [Google Scholar] [CrossRef]
- Mahfouz, M.M.; Iravani, R. A supervisory control for resilient operation of the battery-enabled DC fast charging station and the grid. IEEE Trans. Power Deliv. 2020, 36, 2532–2541. [Google Scholar] [CrossRef]
- Mahfouz, M.; Iravani, R. Autonomous Operation of the DC Fast-Charging Station. IEEE Trans. Ind. Electron. 2021, 69, 3787–3797. [Google Scholar] [CrossRef]
- Su, R.; Wonham, W. Supervisor Reduction for Discrete-Event Systems. Discret. Event Dyn. Syst. 2004, 14, 31–53. [Google Scholar] [CrossRef]
- Manitoba Hydro International Ltd. Photovoltaic Example: Written for PSCAD v4.6; Revision 1; Manitoba Hydro International Ltd.: Winnipeg, MB, Canada, 2018. [Google Scholar]
- Yazdani, A.; Iravani, R. Voltage-Sourced Converters in Power Systems: Modeling, Control, and Applications; John Wiley & Sons: Hoboken, NJ, USA, 2010. [Google Scholar]
- Wu, D.; Tang, F.; Dragicevic, T.; Vasquez, J.C.; Guerrero, J.M. Autonomous Active Power Control for Islanded AC Microgrids With Photovoltaic Generation and Energy Storage System. IEEE Trans. Energy Convers. 2014, 29, 882–892. [Google Scholar] [CrossRef]
- Zhong, Q.C.; Weiss, G. Synchronverters: Inverters That Mimic Synchronous Generators. IEEE Trans. Ind. Electron. 2011, 58, 1259–1267. [Google Scholar] [CrossRef]
- Nguyen, P.L.; Zhong, Q.C.; Blaabjerg, F.; Guerrero, J.M. Synchronverter-based operation of STATCOM to Mimic Synchronous Condensers. In Proceedings of the 2012 7th IEEE Conference on Industrial Electronics and Applications (ICIEA), Singapore, 18–20 July 2012; pp. 942–947. [Google Scholar]
- Zhong, Q.C.; Nguyen, P.L.; Ma, Z.; Sheng, W. Self-Synchronized Synchronverters: Inverters Without a Dedicated Synchronization Unit. IEEE Trans. Power Electron. 2014, 29, 617–630. [Google Scholar] [CrossRef]
- Wang, Y.; Wen, M.; Chen, Y. A simplified model of Type-4 wind turbine for short-circuit currents simulation analysis. IET Gener. Transm. Distrib. 2022, 16, 3036–3049. [Google Scholar] [CrossRef]
- Hackathon—SEPOC 2021. Available online: https://2021.sepoc.com.br/hackathon/ (accessed on 11 June 2023).
- 1547-2018; IEEE Standard for Interconnection and Interoperability of Distributed Energy Resources with Associated Electric Power Systems Interfaces. IEEE: Piscataway, NJ, USA, 2018.


| Study | Methodology | Multi-Mode Operation | Scalability | Experimental Validation | Implementation Guide |
|---|---|---|---|---|---|
| [18,26] | Heuristic/Rule-Based | Partial | Low | No | No |
| [19,22,23,25] | Petri Nets/Automata | Limited | Medium | No | Partial |
| [31] | SCT (CPP) | No | High | No | Partial |
| [32] | SCT (HVDC) | Not applicable | High | No | Limited |
| [33,34] | SCT (DCFC station) | Not applicable | High | Yes | No |
| [21] | SCT (microgrids) | No | High | Yes | No |
| This Work | SCT (microgrids) | Yes | High | Yes | Yes (step-by-step) |
| State: | Disable Events |
|---|---|
| 1: | , |
| 2: | , , |
| 3: | |
| 4: |
Disclaimer/Publisher’s Note: The statements, opinions and data contained in all publications are solely those of the individual author(s) and contributor(s) and not of MDPI and/or the editor(s). MDPI and/or the editor(s) disclaim responsibility for any injury to people or property resulting from any ideas, methods, instructions or products referred to in the content. |
© 2025 by the authors. Licensee MDPI, Basel, Switzerland. This article is an open access article distributed under the terms and conditions of the Creative Commons Attribution (CC BY) license (https://creativecommons.org/licenses/by/4.0/).
Share and Cite
Erazo Huera, P.C.; de Paula, T.B.; do Amaral, J.M.T.; Tuxi, T.M.; Viana, G.S.; van Emmerik, E.L.; Dias, R.F.S. A Discrete-Event Based Power Management System Framework for AC Microgrids. Energies 2025, 18, 3964. https://doi.org/10.3390/en18153964
Erazo Huera PC, de Paula TB, do Amaral JMT, Tuxi TM, Viana GS, van Emmerik EL, Dias RFS. A Discrete-Event Based Power Management System Framework for AC Microgrids. Energies. 2025; 18(15):3964. https://doi.org/10.3390/en18153964
Chicago/Turabian StyleErazo Huera, Paolo C., Thamiris B. de Paula, João M. T. do Amaral, Thiago M. Tuxi, Gustavo S. Viana, Emanuel L. van Emmerik, and Robson F. S. Dias. 2025. "A Discrete-Event Based Power Management System Framework for AC Microgrids" Energies 18, no. 15: 3964. https://doi.org/10.3390/en18153964
APA StyleErazo Huera, P. C., de Paula, T. B., do Amaral, J. M. T., Tuxi, T. M., Viana, G. S., van Emmerik, E. L., & Dias, R. F. S. (2025). A Discrete-Event Based Power Management System Framework for AC Microgrids. Energies, 18(15), 3964. https://doi.org/10.3390/en18153964