2. Methodology and Modeling
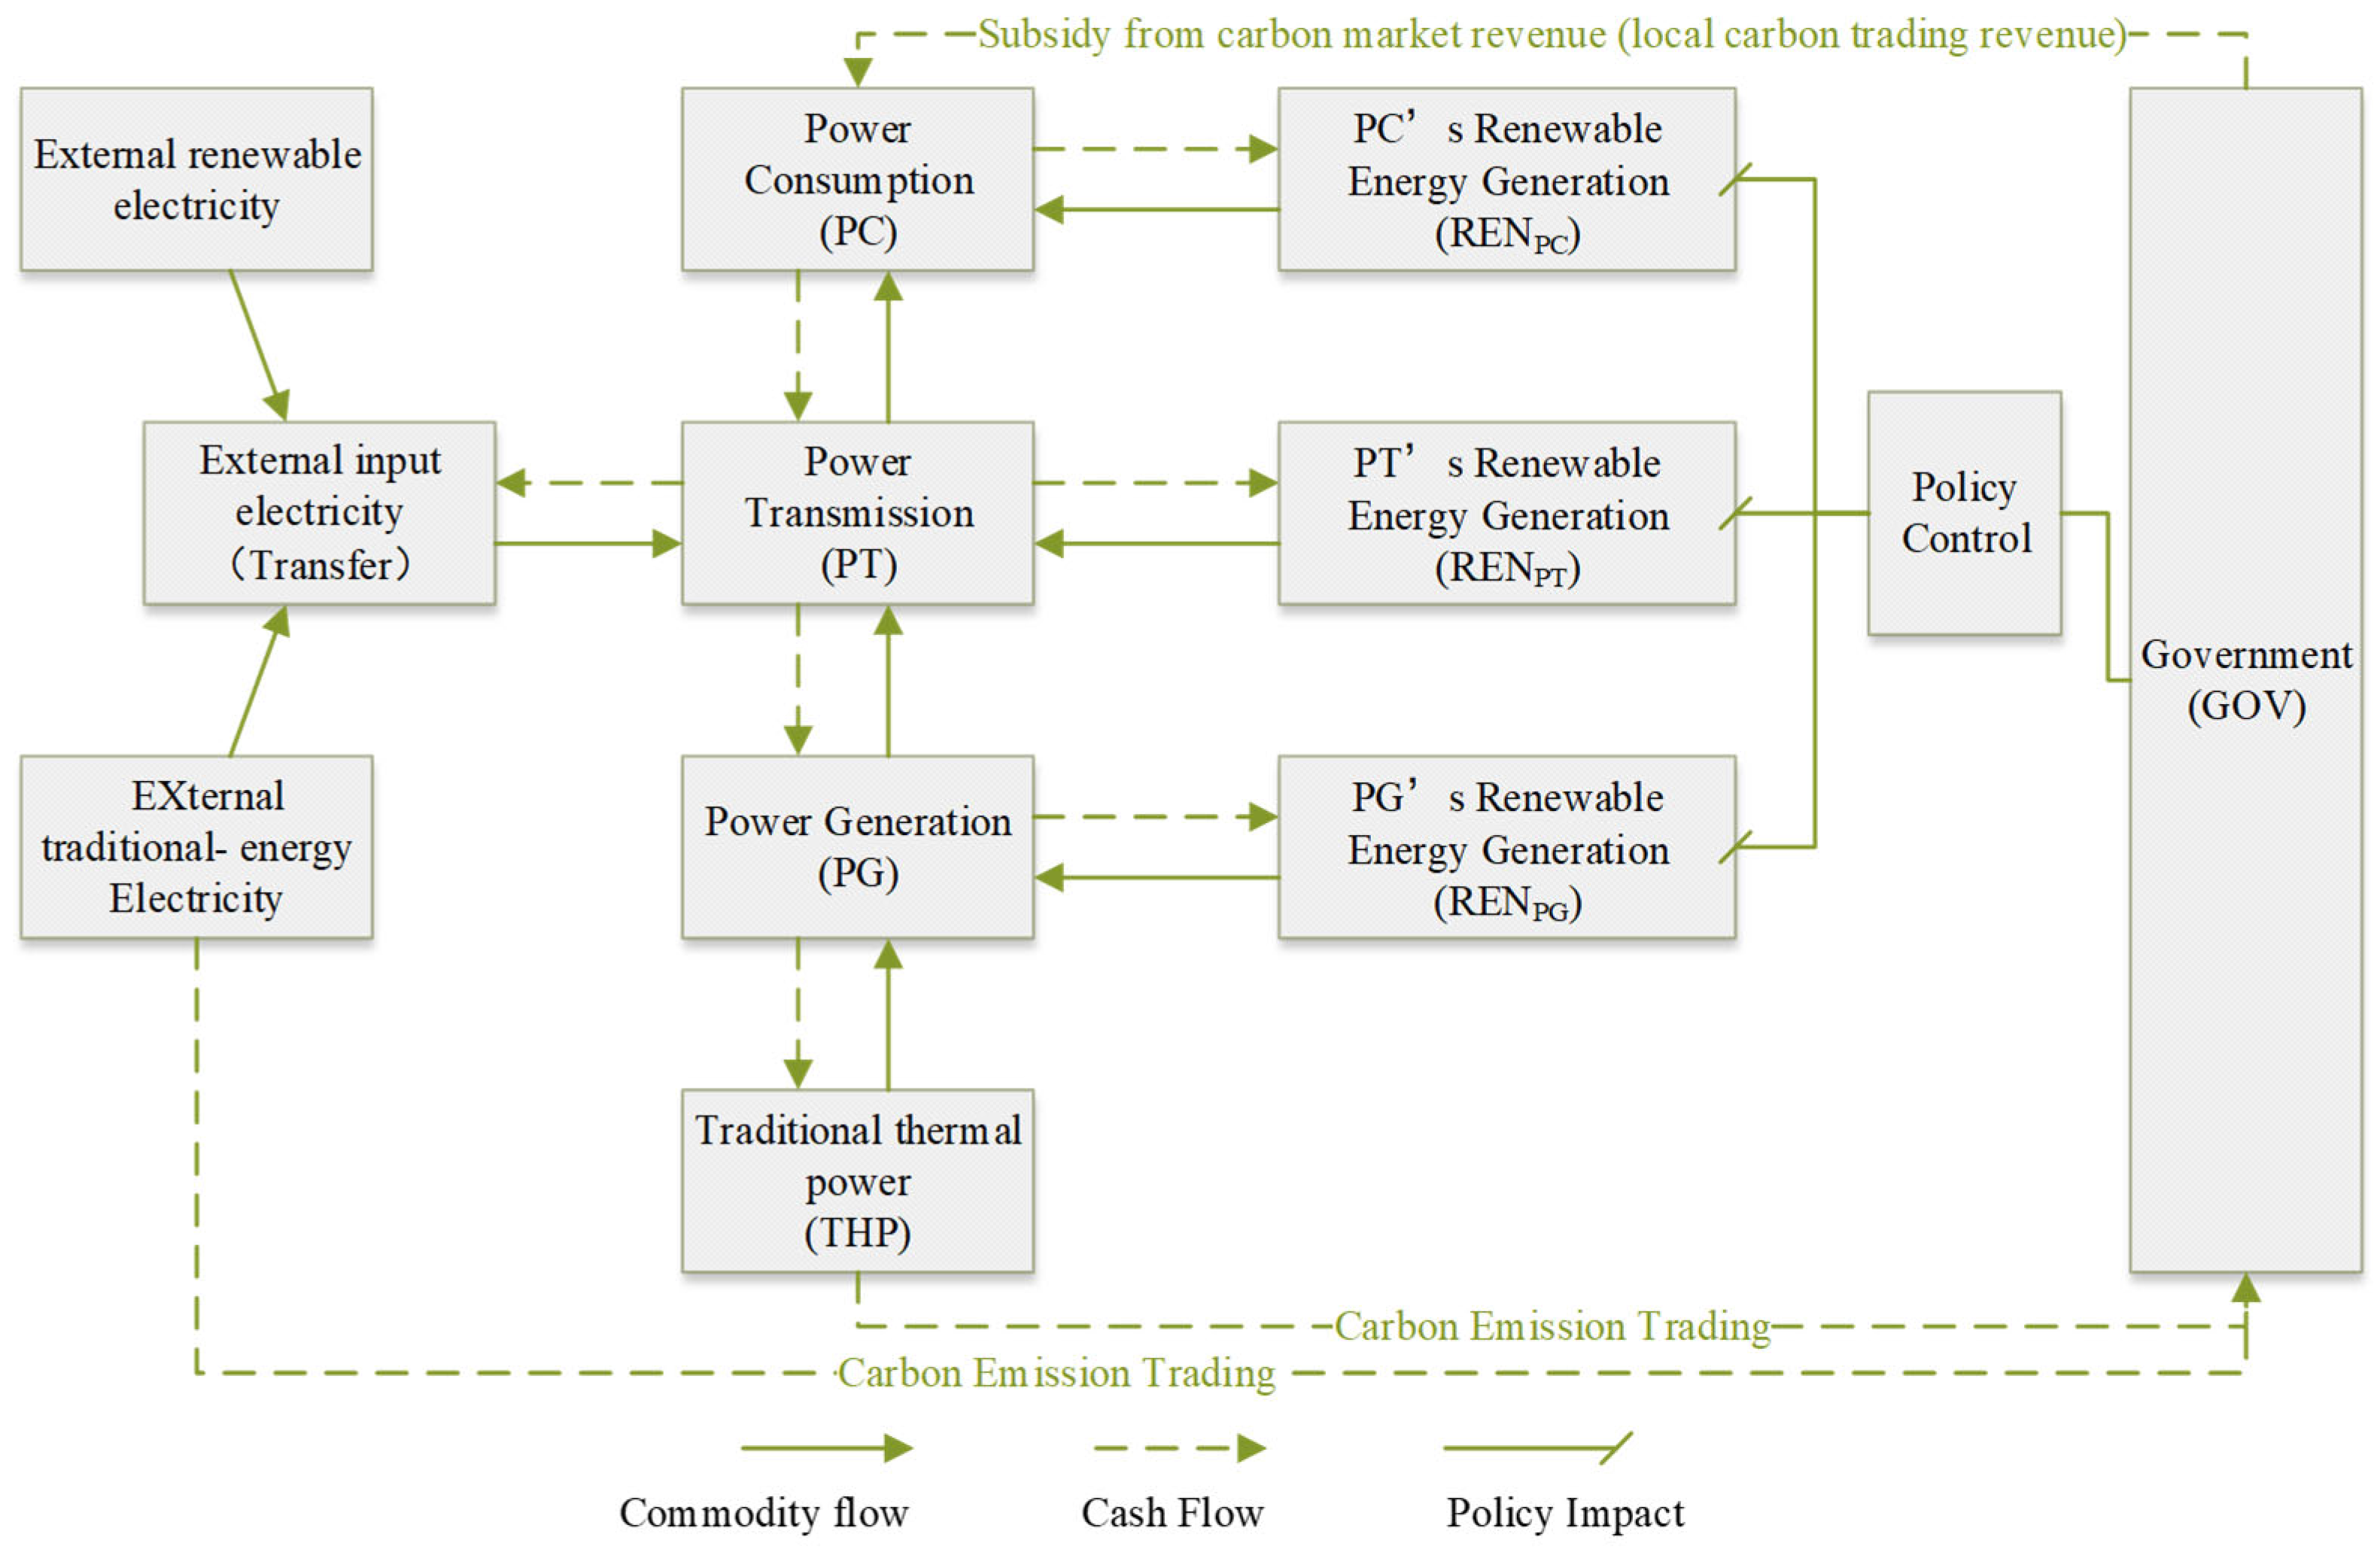
This paper aims to examine the fundamental relationships in renewable energy development among the consumption side, transmission side, and generation side (
Figure 1) and to construct a general equilibrium model for renewable energy investors under the constraints of dual carbon goals.
This paper embeds the carbon price as the core exogenous variable into the equilibrium model to simulate the impact of the carbon trading market on the investment entities. Specifically:
Exogenous Setting: The carbon price is determined by the government quota allocation mechanism and market supply and demand, and is not affected by the short-term decision-making of the investment body, so it is regarded as an exogenous parameter in the model (exogenous parameter);
Impact transmission mechanism: Changes in carbon prices affect the decisions of the main entities through the following paths:
- -
Generation side: The carbon trading cost term ( in Formula (3)) directly increases the cost of traditional energy;
- -
Transmission side: The carbon cost is transmitted to the purchase cost through the grid connection price (Formula (13));
- -
Consumption side: The government transfers the carbon revenue to users (Formula (14)), changing the electricity consumption constraints.
Section 4 quantifies the marginal effect of exogenous shocks by setting carbon price scenarios of CNY 50/100/150/250 per ton.
Overall, this model takes into account the differences between traditional energy and renewable energy, the impact of carbon emission costs, as well as supply–demand relationships and user autonomy. It provides a theoretical framework to guide the development of the power industry.
Additionally, this model incorporates the role of the government in the carbon emissions trading market. Carbon emissions trading implies that the government imposes higher carbon emission costs on traditional energy sources as a form of regulation. According to this model’s framework, the government can use revenues from the carbon market to subsidize users, offsetting the additional costs caused by increased total carbon costs and reduced demand. These subsidies can reduce the financial burden on users, encourage the adoption of renewable energy, and ultimately promote the development of renewable energy.
By constructing a general equilibrium model for renewable energy investors, this paper integrates the interactions and conflicts of interest among the government, transmission companies, and electricity consumers. This model provides a deeper understanding of the complexities involved in renewable energy investment decisions and the government’s role in carbon emissions trading. Moreover, by optimizing this model, more effective renewable energy investment policies can be formulated, fostering the development of renewable energy and achieving environmental goals.
2.1. Generation Side
In this model, the decision-making behavior of power generation enterprises is one of the core links in the low-carbon transformation of the energy system, which requires a comprehensive analysis combining the carbon trading mechanism and energy substitution relationships. Specifically, as the source of energy production, the investment and power generation strategies of power generation enterprises are directly affected by carbon prices, energy costs, and policy orientations, and they need to balance between traditional thermal power and renewable energy power generation.
The core goal of power generation enterprises is to maximize profits, in the process of which they need to cope with both the pressure of carbon emission costs and the economics of energy substitution. Fluctuations in carbon trading prices will directly change the marginal cost of thermal power. When carbon prices rise, thermal power faces higher carbon costs due to its high carbon emission intensity, and its willingness to generate electricity is suppressed. In contrast, renewable energy, with almost no carbon emissions, has a more competitive advantage under the incentive of carbon price signals, prompting power generation enterprises to increase investment in renewable energy.
This paper assumes that power generation enterprises can decide what type of electricity to provide to power transmission enterprises based on market demand and cost considerations and flexibly choose between traditional power generation and renewable energy power generation to meet power generation needs. This study constructs a power generation side model with the goal of maximizing profits, focusing on analyzing the impact of carbon prices on the power generation structure of thermal power and renewable energy. Specifically:
Here, represents the profit of power generation enterprises; denotes the on-grid electricity price faced by these enterprises (assuming that under the dual-carbon goals, renewable energy has achieved grid parity, and according to the optimal decision-making of the power system, the price of thermal power generation should equal that of renewable energy generation), and stands for the on-grid electricity volume of power generation enterprises. Furthermore, represents the on-grid price of thermal power; is the on-grid electricity volume of thermal power; is the on-grid price of renewable energy on the generation side; is the on-grid electricity volume of renewable energy on the generation side, and accounts for the carbon market cost of conventional energy on the generation side.
For a typical power generation company, its total electricity output is modeled as a production function based on traditional power generation and renewable energy generation. This paper assumes that the cost structure of power generation companies follows a more generalized Constant Elasticity of Substitution (CES) function. The CES function takes traditional power generation and renewable energy generation as input factors, combining them into total electricity output based on their respective weights and the elasticity of substitution.
This model, incorporating the Constant Elasticity of Substitution (CES) function, can effectively describe the power generation capacity of generation companies to a certain extent. In practical applications, the model can be used to plan production and make decisions based on factors such as market demand and prices, aiming to maximize profits and optimize energy utilization efficiency. Specifically:
Here, is the scale coefficient of the function; is the share coefficient, and is the elasticity of substitution parameter. These coefficients play a crucial role in describing the production function of power generation enterprises and the interrelationships between input factors.
The scale coefficient measures the sensitivity of total output to the scale effects of all input factors. Specifically, represents the rate of change in total output relative to changes in all input factors. For instance, if , it indicates that total output is more sensitive to changes in input factors, meaning that the total output of power generation enterprises exhibits greater fluctuations in response to variations in input factors. Conversely, if , it suggests that total output is less sensitive to changes in input factors.
The share coefficient represents the proportion of different input factors (traditional power generation and renewable energy generation) in the total output. A higher indicates that a particular input factor contributes more significantly to the total output. For example, if , it means that traditional power generation and renewable energy generation have equal shares in the total output. If , it implies that renewable energy generation has a smaller share in the total output, while traditional power generation has a larger share.
The substitution elasticity parameter quantifies the degree of substitutability between different input factors. Specifically, determines the relative substitutability between traditional power generation and renewable energy generation, with . When approaches 1, it indicates a higher degree of substitutability between traditional and renewable energy generation, meaning that an increase in renewable energy generation can effectively replace traditional energy generation. Conversely, when is smaller, it reflects a lower degree of substitutability between traditional and renewable energy generation.
These coefficients play a crucial role in the CES function, significantly influencing power generation enterprises’ production planning and decision-making processes. By adjusting the values of these coefficients, power generation enterprises can optimize the utilization ratio of different energy sources to adapt to market demands and cost pressures, thereby achieving the goals of maximizing profits and improving energy utilization efficiency.
In the carbon market, to encourage the reduction in greenhouse gas emissions, the government allocates a certain amount of carbon emission allowances to each enterprise. These allowances can be viewed as a free permit for emitting a specific amount of carbon dioxide. However, if a company’s actual carbon dioxide emissions exceed its allocated free allowances, it must purchase additional allowances to cover the excess emissions. The cost of acquiring these additional allowances is determined by the carbon trading price.
The carbon trading price is determined by market supply and demand dynamics, as well as government regulations on carbon emission policies. If the supply of carbon emission allowances remains stable while demand is low, the carbon trading price is likely to be relatively low. Conversely, if the supply of allowances is insufficient or demand is high, the carbon trading price may rise significantly.
Taking this into account, this paper assumes that carbon trading costs refer to the amount of carbon dioxide emissions generated by thermal power companies during power generation, minus the free carbon emission allowances they receive in the carbon market, with the remainder being the amount payable based on the carbon trading price. This assumption aims to incorporate the economic impact of carbon emissions on thermal power companies and integrate it into the profit maximization model of power generation companies.
represents the carbon market cost, where denotes the carbon emissions per unit of electricity generated, also referred to as the carbon emission factor for thermal power enterprises. indicates the initial carbon emission allowances allocated to the enterprise for free, and represents the unit carbon trading price.
At this point, a local equilibrium model with two constraints has been constructed, which only considers the optimal decision-making of the generation side. To optimize this model, the Lagrangian equation is constructed to derive the demand functions for traditional and renewable energy by power generation companies. This approach enables a more precise determination of the demand for various energy sources, thereby achieving the goal of profit maximization. The constructed Lagrangian equation is as follows:
and represent the Lagrange multipliers. By taking the partial derivatives of the Lagrange equation with respect to , and , as well as and , and setting them equal to zero, the boundary conditions for the optimal solution can be derived.
By eliminating the multipliers through substitution and simplification, the demand function for
with respect to
,
,
,
can be obtained as follows:
Similarly, the demand function for
with respect to
,
, and
can be obtained as follows:
By solving the system of constraints and the two demand functions derived from the above equations, we can obtain the optimal decision for the power generation sector.
2.2. Transmission Side
When determining power procurement strategies, transmission companies need to consider their own resource and technological advantages. They should comprehensively evaluate the pros and cons of purchasing electricity versus building their own renewable energy generation facilities based on demand conditions. This approach aims to achieve the dual objectives of economic benefits and sustainable development.
Specifically, to maximize the profits of transmission companies, the following factors should be considered: electricity procurement costs, electricity sales revenue, and renewable energy generation costs.
Electricity Procurement Costs: Transmission companies must account for the costs of purchasing electricity, whether through agreements with power generation companies or market transactions. These costs should also factor in transmission losses and the volume of electricity transmitted (Due to the positive correlation between the amount of electricity transmission and the line loss. Because line loss usually does not directly affect the optimal decision of renewable energy investment and power generation, but it will affect the profit of manufacturers. Line loss refers to the energy loss caused by wire impedance, electrical equipment loss, and environmental factors during power transmission. Even though line loss is a practical problem in the power transmission process, in some models we can ignore it, especially when looking for the optimal decision. However, this paper does not directly measure the line loss, but implicitly couples the line loss rate through the CES function. The core is that in the CES production function, transmission firms obtain less electricity QPG from power plants and self-produced renewable electricity QREN_PT than they sell QPT. The missing part is the line loss. The line loss parameters are reflected by α_PT, the calibration after the model is substituted into the actual data). Procurement costs have a direct impact on the profitability of transmission companies.
Electricity Sales Revenue: Transmission companies generate revenue by delivering electricity to large-scale consumers or distributing it to end consumers. This revenue depends on the selling price, which is determined by agreements with consumers or prevailing market prices. Thus, sales revenue is a critical component of the profit equation.
Renewable Energy Generation Costs: For transmission companies that build their own renewable energy facilities, generation costs must also be considered. These include construction and operational expenses, costs of accessing renewable resources, equipment depreciation, and maintenance.
In summary, the profit maximization of transmission companies can be achieved by calculating the difference between electricity sales revenue and the combined costs of electricity procurement and renewable energy generation. Balancing these factors and identifying an optimal business model and operational strategy will enhance the profitability and sustainability of transmission companies.
Specifically, the profit maximization function for the transmission enterprise is
Here, we introduce some symbols to represent different variables. First, we denote the transmission enterprise’s profit as , where represents the transmission enterprise’s selling electricity price, and represents the transmission enterprise’s electricity sales volume. For the power generation enterprise, denotes the electricity price of the power generation enterprise, and denotes the electricity sales volume of the power generation enterprise, as defined in the previous section. Additionally, and represent the transmission enterprise’s renewable energy generation price and the transmission enterprise’s renewable energy generation volume, respectively.
In practical applications, the transmission enterprise’s own renewable energy generation cost can be used as an indicator for . This is because renewable energy generation on the transmission side is typically part of the transmission enterprise’s operations, which can directly supply its own renewable energy generation to power users. Therefore, can directly represent the transmission enterprise’s renewable energy generation cost.
Considering the optimization objective, transmission companies can optimize their procurement and generation strategies under the given constraints to maximize profits and achieve more sustainable development in the renewable energy sector. The specific constraints are similar to those for power generation companies.
For a typical transmission company, the total amount of electricity transmitted is a production function based on the electricity purchased from power generation companies and the renewable energy generation on the transmission side. This paper assumes that the transmission company’s costs follow a general CES function. The CES function takes electricity purchased from generation companies and renewable energy generation on the transmission side as input factors.
This CES function model can effectively describe the transmission capacity of transmission companies to a certain extent. In practical applications, this model can be used for production planning and decision-making, considering factors such as market demand and prices, with the goal of maximizing profits and optimizing energy utilization efficiency. Specifically:
The scale coefficient , share coefficients , , , and substitution elasticity parameter have similar meanings to the corresponding parameters on the generation side, and, thus, will not be explained here.
At this point, this paper has developed a profit-maximization local equilibrium model with constraints. This model focuses exclusively on the optimal decision-making on the transmission side. To optimize this model, this paper uses the Lagrangian equation method to derive the demand functions for electricity procurement and renewable energy generation by transmission companies. The constructed Lagrangian equation is as follows:
where
is the Lagrange multiplier. By taking the partial derivatives of the Lagrangian function with respect to
,
,
, and
, and also with respect to θ\thetaθ, and setting them equal to zero, the boundary conditions for the optimal solution can be obtained.
By using the elimination method for the equations, substituting, eliminating the multipliers, and simplifying, the demand function for
with respect to
,
and
can be derived.
Similarly, the demand function for
with respect to
,
and
can be derived.
Similarly, the demand function for
with respect to
,
and
can be derived.
The demand functions for renewable energy generation, electricity procurement from the generation side, and external electricity in this model reflect the power supply options and cost factors that transmission companies consider during the decision-making process.
The renewable energy generation demand function describes the factors that the transmission company considers when selecting renewable energy generation methods. This function can be expressed as , where represents the demand for renewable energy by the transmission company. By optimizing this demand function, the transmission company can determine an appropriate renewable energy generation strategy to maximize economic benefits.
The demand function for purchasing electricity from the generation side describes the decision-making process of the transmission company when buying electricity. This function can be expressed as , where represents the electricity sale price of the transmission company; represents the electricity sale volume, and represents the generation-side feed-in tariff. By optimizing this demand function, the transmission company can determine an appropriate purchasing strategy to reduce procurement costs and support profit maximization.
Finally, the demand function for purchasing external electricity describes the decision-making process of the transmission company when acquiring electricity from outside sources. This function can be expressed as , where represents the electricity sale price of the transmission company; represents the electricity sale volume, and represents the price of external electricity.
2.3. Consumption Side
In the electricity supply model, the behavior of energy consumers is crucial, as they will make investment decisions based on energy prices, policies, and the feasibility of renewable energy. The acceptance of renewable energy by consumers will be influenced by factors such as the economic benefits, environmental benefits, and reliability of supply. By understanding the behavior and strategies of energy consumers, it will be easier to predict changes in market demand and consumption patterns, providing valuable insights for power system planners and policymakers.
The overall utility of energy consumers comes from the electricity purchased and the self-invested renewable energy generation. It is assumed that the utility of electricity enterprises follows a general CES (Constant Elasticity of Substitution) function. The CES function takes the purchased electricity from the transmission company and the self-generated renewable energy on the consumption side as input factors. Based on the values of weights and substitution elasticity, the two are combined to form total utility. Specifically:
In this model, the total utility of the electricity user is denoted as , and the scale effect parameter can be set to 1, as it does not affect the renewable energy investment decisions. The share coefficients and substitution elasticity parameter have similar meanings to the corresponding parameters on the generation side, and, thus, will not be explained here.
For electricity consumers, this paper assumes that the constraint they face is a relatively fixed electricity cost (usually restrictive, as electricity consumers need to bear other costs outside the model in addition to electricity costs). This means that when making electricity consumption decisions, users need to consider both the cost of purchasing electricity and the cost of self-built power generation to minimize the total electricity cost. The total electricity cost consists of two components: the cost of purchasing electricity from transmission companies and the cost of self-built renewable energy generation.
Additionally, it should be noted that the cost of carbon trading has already been reflected in the electricity transmission price. Consumers have comprehensively considered these factors in their electricity usage decisions to minimize the total electricity cost while meeting their electricity demand. This approach helps to promote the development of renewable energy and achieve a balance between economic benefits and environmental sustainability. Specifically:
can be understood as the overall constraint, where represents the average electricity price, and represents the total electricity consumption. refers to the electricity sale price from the grid side, and is the corresponding amount of electricity sold. represents the unit generation cost of distributed renewable energy on the consumption side, and is the corresponding generation amount. In practical applications, the renewable energy generation cost of the electricity-consuming enterprise itself can be used as the measure for , since consumption-side renewable energy generation typically belongs to the electricity-consuming enterprise itself. This portion of electricity demand can be directly met by the enterprise’s own renewable energy generation. Therefore, can be directly represented as the renewable energy generation cost of the electricity-consuming enterprise.
At this point, we have constructed a local equilibrium model with utility maximization. This model only considers the optimal decision-making on the consumption side. To optimize this model, we can employ the method of constructing a Lagrange equation to solve for the demand functions for self-generated renewable energy and purchased electricity. In this study, we adopt a monotonic transformation form of the CES utility function, which does not alter the shape of the indifference curves and, thus, does not affect optimal consumption choices. The Lagrange equation constructed thereafter is as follows:
In this context, is the Lagrange multiplier. To solve the Lagrange equation, we take the partial derivatives of and , as well as , and set them equal to zero. This gives us the boundary conditions for the optimal solution. By eliminating the multiplier through substitution, simplification, and rearrangement of the equations, we can derive the demand function for as a function of ,, and :
By using the elimination method for the equations, substituting, eliminating the multipliers, and simplifying, the demand function for
with respect to
,
and
can be derived.
Similarly, the demand function for
with respect to
,
,
and
can be derived.
The demand functions for renewable energy generation and electricity purchased from the transmission side in this model reflect the electricity consumers’ considerations of supply options and cost factors during the decision-making process.
First, the demand function for renewable energy generation describes the factors that electricity consumers consider when choosing renewable energy generation methods. This function can be expressed as , where represents the electricity consumer’s demand for renewable energy. By optimizing this demand function, electricity consumers can determine an appropriate renewable energy generation strategy to maximize their benefits.
Secondly, the demand function for electricity purchased from the transmission side describes the decision-making process of electricity consumers in purchasing electricity. This function can be expressed as , where represents the electricity sales price of the transmission company; denotes the total electricity consumption of the electricity consumer, and is the average electricity cost for the consumer. By optimizing this demand function, electricity consumers can determine an appropriate electricity purchasing strategy to reduce procurement costs and support their goal of profit maximization.
In summary, the demand functions for renewable energy generation and purchased electricity essentially reflect the economic and cost factors considered by electricity consumers when formulating their electricity supply strategies. By optimizing these functions, electricity consumers can develop optimal self-investment generation and electricity-purchasing strategies to achieve the dual goals of maximizing utility and promoting sustainable development.
2.4. Government Side
The government functions as an institutional designer and market facilitator within the carbon trading framework, rather than an exogenous entity imposing unilateral mechanisms. This role aligns with global carbon market paradigms (e.g., EU ETS, California Cap-and-Trade), where governments establish rules and incentive structures, while market forces determine carbon price dynamics. Key functions include the following parameters:
- (1)
Institutional Infrastructure:
Governments define emission caps, allocation rules (e.g., free allowances vs. auctions), and compliance mechanisms. These parameters are embedded in the model as policy levers (e.g., initial allowance allocation ), reflecting institutional choices rather than exogenous shocks;
- (2)
Revenue Recycling Mechanism:
Carbon market revenues (
) are redistributed to mitigate distributional impacts, consistent with tax-neutrality principles. For example,
where
denotes Transfer Payment, and
represents the recycling rate—a policy variable adjustable to regional priorities (e.g., subsidizing consumers or renewable investments). This design accommodates heterogeneous fiscal strategies across markets (e.g., China’s sectoral subsidies vs. EU’s innovation funds);
- (3)
Dynamic Policy Adjustment:
Governments may introduce time-varying constraints to simulate policy evolution:
Such constraints capture adaptive policy making observed in mature carbon markets (e.g., UK’s carbon price support).
In the above analysis, the equilibrium carbon price () emerges from market interactions (supply–demand balance in allowances), not government decree. Regulatory interventions (e.g., supply adjustments) are modeled as comparative statics.
This indicates that the model possesses cross-market applicability. By treating government actions as parametric choices (e.g., , ), this framework generalizes to diverse institutional contexts.
This section mainly discusses China’s carbon market mechanism.
Based on the above analysis, we assume that the government, constrained by its dual carbon goals, will implement a carbon emissions trading mechanism. This mechanism will impose higher costs on the consumption of traditional energy sources, referred to as carbon emissions trading costs, while simultaneously generating revenue for the government through the carbon trading system. According to the principle of tax neutrality in economics, we assume that the government reallocates all revenue generated by carbon pricing to subsidize the energy consumption side, i.e., the electricity-using enterprises in this model. This aims to support the development of renewable energy while mitigating economic losses. The government’s transfer payments will influence the decision-making of electricity-using enterprises, thus altering their constraints as described, specifically:
Clearly,
; thus,
. This indicates that, under the consideration of government transfer payments, the total electricity consumption on the consumption side will exceed the scenario without transfer payments. The new demand function can be rewritten as
In the CES function, the substitution elasticity parameter satisfies , and . Given , it can be proven that and under the premise that government transfer payments are greater than and , without government transfer payments. This demonstrates that transfer payments promote both renewable and traditional energy consumption, which reflects the income effect in economics.
Furthermore, we can assume that the government provides varying levels of support for renewable energy investments across the generation, transmission, and consumption sectors. Since the generation and transmission sectors are relatively centralized in renewable energy production, while the consumption sector primarily involves distributed renewable energy production, their generation costs differ. This differentiation may lead the government to formulate policies with distinct orientations.
In this model, we can assume that government-supported enterprises face lower costs or are permitted to invest in renewable energy. For renewable energy generation not supported by the government, we can impose restrictive conditions by setting their corresponding constraints (of course, it is not necessary to add these constraints, but we can add individual equations or even none in different research needs) to zero. For example, the following three equations represent the constraints that need to be added to the overall decision equation system when the government restricts renewable energy generation in the generation, transmission, and consumption sectors, respectively:
2.5. Participate in Overall Decision Making
By simultaneously solving the equations from the above subsections, we can comprehensively consider the strategic interactions among different stakeholders, including the generation, transmission, consumption sectors, and the government. This allows us to study the overall game behavior and strategies, and further explore the game outcomes and the distribution of benefits among participants.
In addition, this paper assumes that there are certain constraints on the total amount of renewable energy. For example, the total amount of renewable energy for power generation, transmission, and consumption must not exceed the overall constraint. Such constraint settings help us focus on the economic benefits of power generation between different entities. The following are the renewable energy constraints:
Here, represents the set of different renewable energy investment entities, and , represents the overall constraint.
Through the analysis of the general equilibrium model, we can obtain the strategic choices and benefit distribution among various participants in renewable energy investments. The government can formulate more effective policy measures based on the model results to promote the development and adoption of renewable energy. Meanwhile, other participants, such as power generation companies, transmission companies, and electricity consumers, can also optimize their respective decisions and actions according to the model outcomes to maximize their benefits.
In summary, studying the general equilibrium model can help us better understand the relationships and interactions among renewable energy investment entities, thereby providing scientific support for policymakers to formulate effective policies and for participants to devise optimized strategies.
2.6. Price Endogenization and Market Equilibrium
In the equilibrium model, electricity prices, as the core price signal, should be endogenously determined within the market equilibrium process. This paper abandons the traditional exogenous setting of electricity prices and constructs a dynamic iterative algorithm to achieve endogenous determination of electricity prices.
2.6.1. Market Clearing Conditions
The equilibrium prices (generation-side on-grid price) and (transmission-side selling price) are determined by solving the following excess demand system:
- (1)
Generation Market Clearing:
where
—the supply function of the grid-connected electricity provided by power generation enterprises—is derived from Formulas (5) and (6).
—the demand function for electricity by the transmission company for the power generation company—is given by Formula (10).
- (2)
Transmission Market Clearing:
where
—the electricity demand function of power users for the electricity supply from transmission enterprises—incorporates government transfers:
2.6.2. Dynamic Price Adjustment Algorithm
We implement Walrasian tâtonnement to solve the nonlinear system:
Parameters:
- -
Convergence thresholds: ;
- -
Price adjustment speeds: , (calibrated to Zhejiang’s elasticity data);
- -
Initial values: CNY/kWh, CNY/kWh.
2.6.3. Convergence Validation (Zhejiang Case, )
Table 4 demonstrates rapid convergence within 5 iterations.The fifth iteration met the convergence requirement because the excess electricity demands (
and
) decreased to minimal levels (0.5 GWh and 0.4 GWh, respectively), and the maximum price change
was only 0.0002. This indicates that the electricity market reached near-equilibrium: the generation-side and transmission-side prices (
and
) stabilized at 0.4348 CNY/kWh and 0.6077 CNY/kWh with negligible further adjustments, satisfying the model’s termination criteria. Furthermore, during the process of achieving equilibrium,
and
increased by 4.7% and 2.1% respectively.
2.6.4. Carbon Price Pass-Through Effects
Under the endogenous electricity price system, the transmission path of the carbon price shock is significant:
(***
p < 0.01, *
p < 0.05; fixed-effects model on Zhejiang 2017–2022 panel data)
The endogenized prices reveal that carbon price increases induce larger (↑ 30.2% at CNY 250/ton) and (↑ 17.4%) adjustments compared with exogenous models. And renewable generation rises by 2.89% (vs. 0.55% exogenously) due to sharper price incentives.
The above analysis endogenizes the price through the market clearing conditions (, ). The data from Zhejiang Province is only used for initialization and iteration. It verifies that the price converges to the equilibrium point driven by the model, thereby making the research conclusion more persuasive.
3. Case Study of Zhejiang Province
3.1. Electricity Consumption in Zhejiang Province
This study uses actual data from Zhejiang Province for a case analysis, aiming to explore its renewable energy transition strategies in the process of achieving the dual carbon goals. Zhejiang Province was selected as the research object mainly for the following reasons:
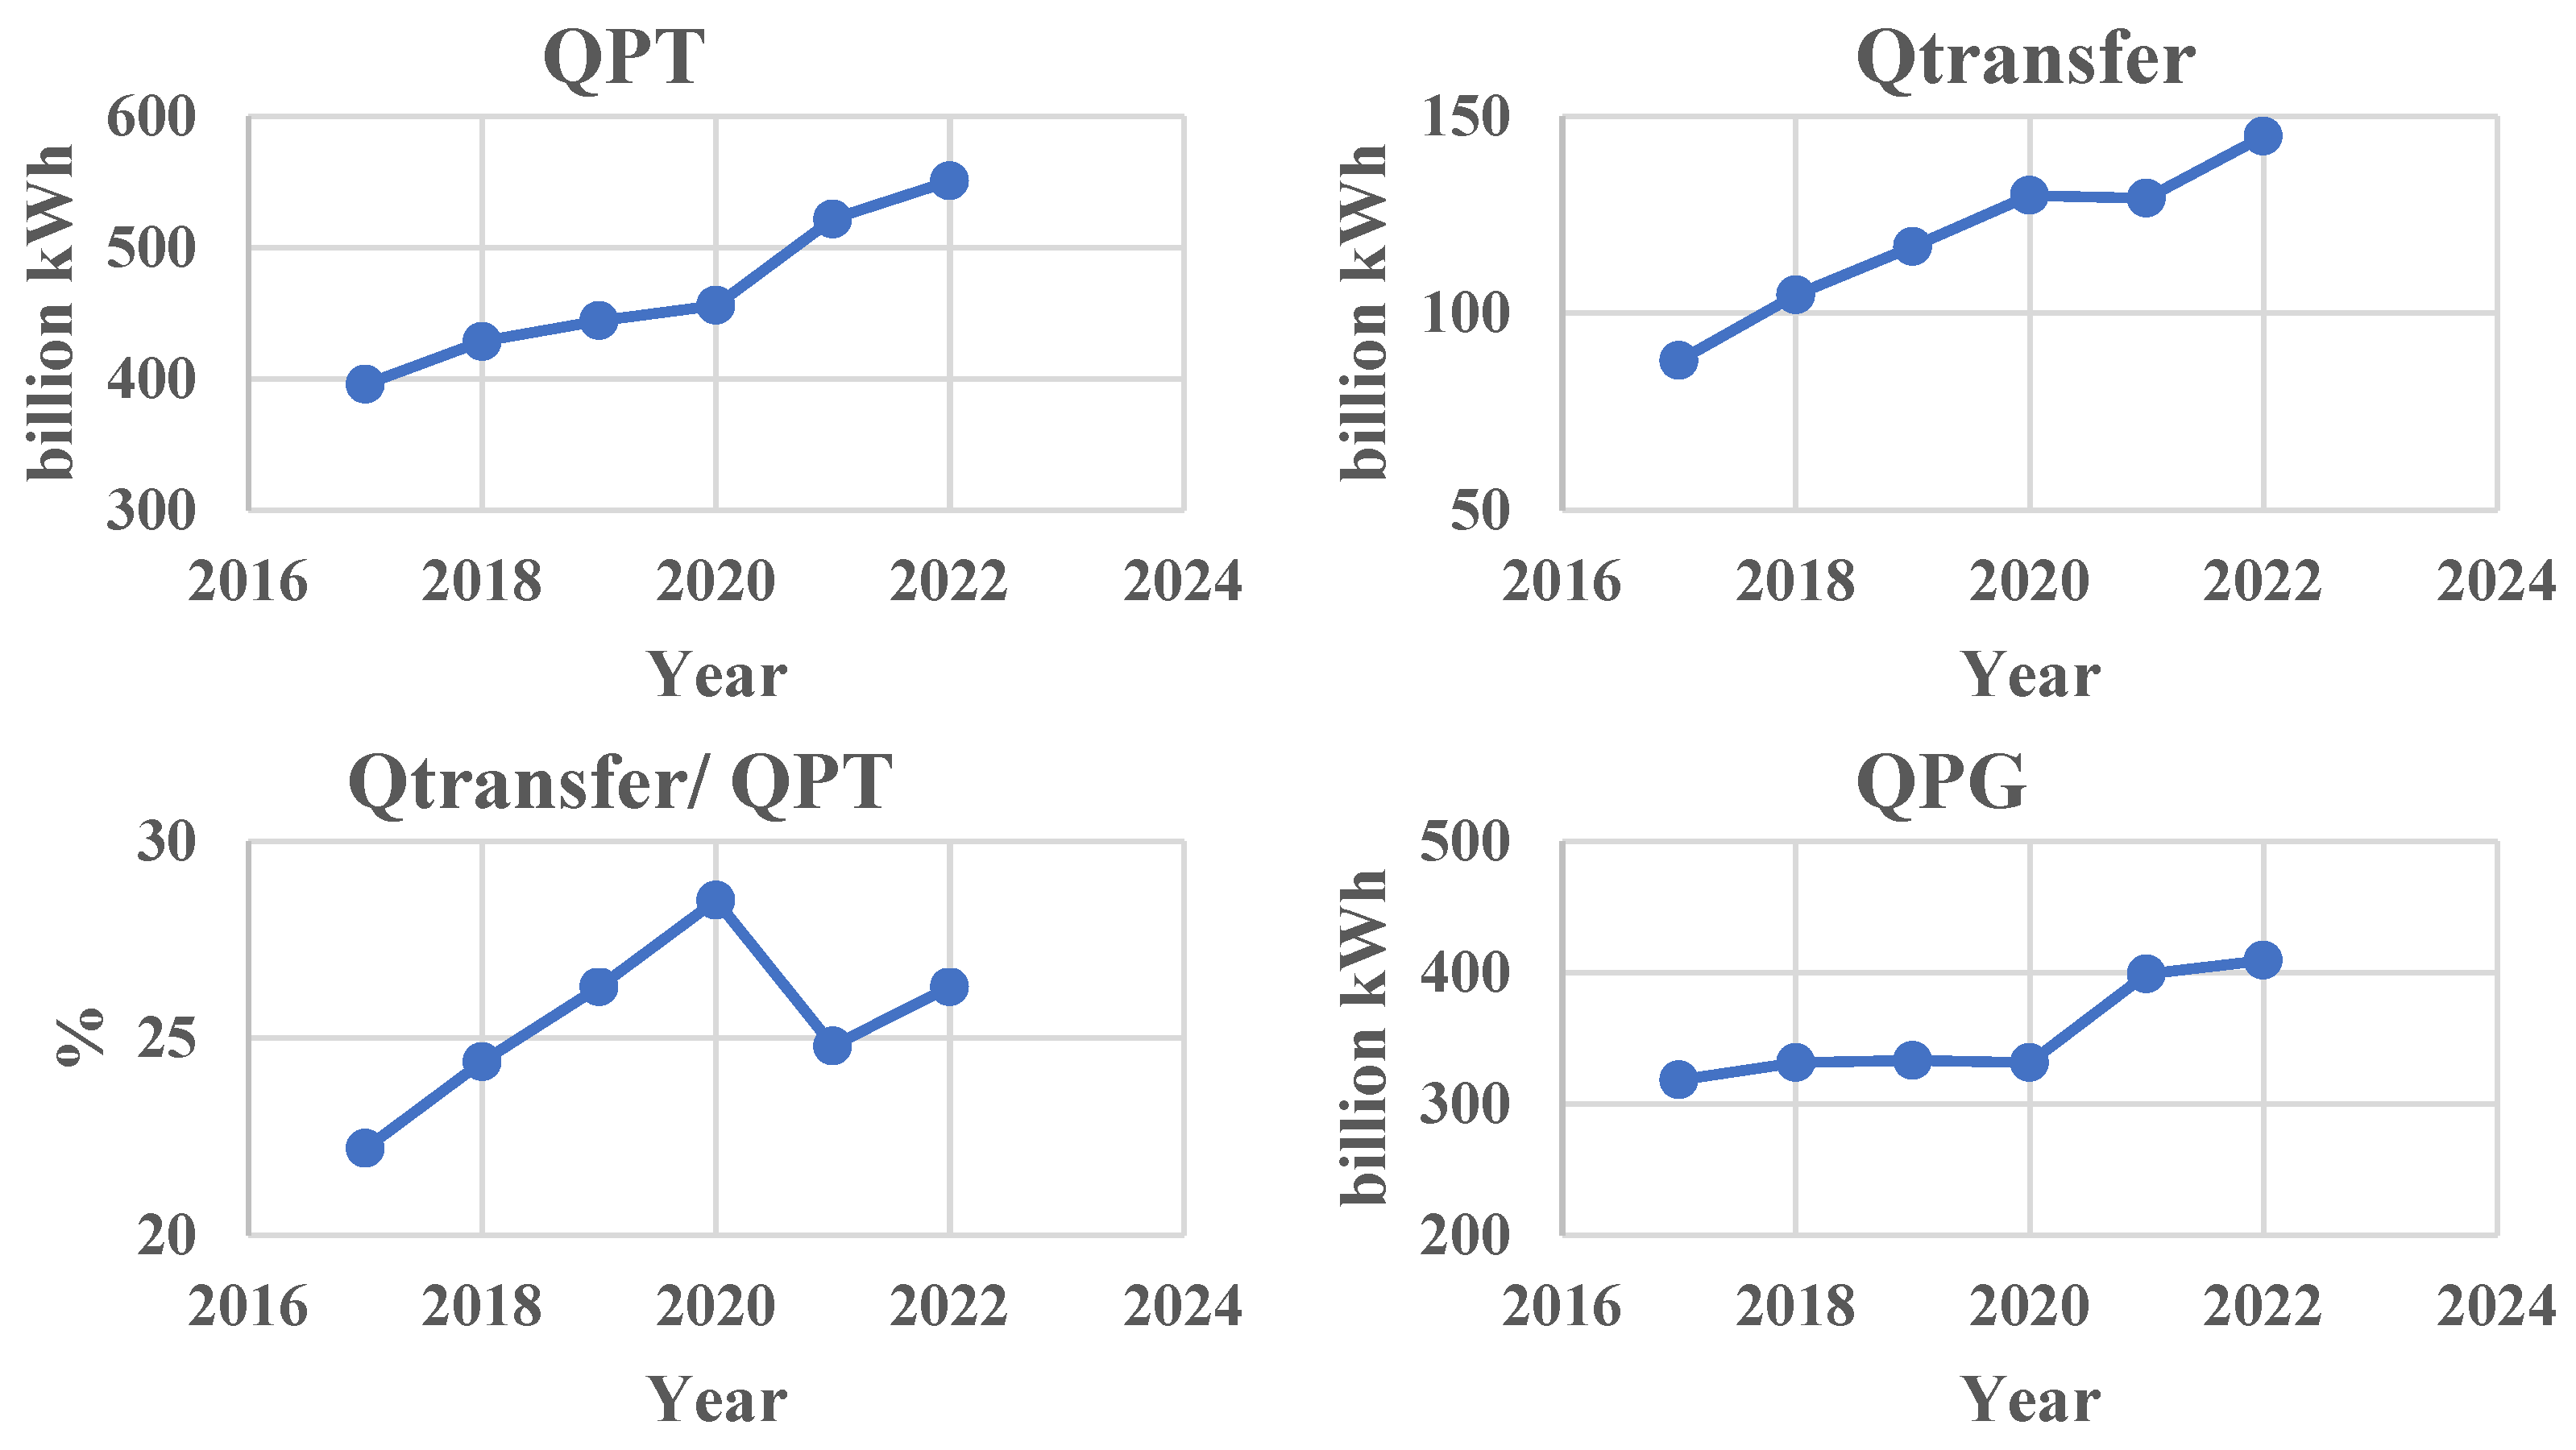
First, Zhejiang Province’s representativeness in achieving dual carbon goals makes it an ideal case for studying renewable energy transition. As one of China’s major electricity-consuming provinces, Zhejiang’s electricity consumption reached 619.2 billion kilowatt-hours in 2023, reflecting a year-on-year growth of 6.78%. Particularly in the manufacturing sector, electricity consumption increased to approximately 345 billion kilowatt-hours, with an 8.74% growth rate. This significant increase highlights the province’s active trend in industrial upgrading, especially in high-tech and high-value-added fields such as photovoltaic equipment production.
Despite being an economic powerhouse in China, Zhejiang has a relatively low energy self-sufficiency rate and heavily depends on imported clean energy. In 2022, the province generated 435 billion kilowatt-hours of electricity locally, while importing 161.5 billion kilowatt-hours from other provinces, with net power imports accounting for approximately 25% of its total electricity consumption. This imported electricity is primarily transmitted through ultra-high voltage (UHV) AC and DC hybrid technologies from neighboring provinces and regions, making Zhejiang a typical beneficiary of the West–East Electricity Transmission Project. Faced with the dual pressures of carbon emission reduction and energy structure adjustment, Zhejiang Province has demonstrated how policies and market mechanisms can drive renewable energy investment, a topic explored in depth in this study.
Second, the electricity consumption structure and data availability in Zhejiang Province provide a solid foundation for this study. The province relies heavily on thermal power generation while continuously increasing efforts to promote renewable energy, offering a reliable basis for modeling the behaviors of renewable energy investment entities. In 2022, Zhejiang’s thermal power generation reached 306.2 billion kilowatt-hours, while renewable energy generation amounted to 128.7 billion kilowatt-hours, accounting for approximately 29.6% of the province’s total electricity generation. Utilizing this real-world data enables the simulation of how different carbon emissions trading prices affect investment strategies, thereby ensuring the scientific robustness and practical relevance of the research findings.
Finally, Zhejiang Province boasts abundant wind and solar energy resources, coupled with its advantageous location along China’s eastern coast, which positions it as having immense potential for exploring large-scale clean energy utilization. By deeply analyzing Zhejiang’s energy transition pathways, valuable insights can be provided to other regions, while also offering robust data support for achieving the nation’s dual carbon goals. This study comprehensively considers Zhejiang’s energy demand, energy structure, policy environment, and renewable energy development potential, aiming to provide scientific evidence and strategic recommendations for energy transition under the dual carbon objectives.
3.2. Data and Sources
The selection of the research period (2017–2022) was based on the following considerations:
- (1)
Policy Continuity: Since 2017, Zhejiang Province has been piloting a provincial carbon market. After the launch of the national carbon market in 2021, a “dual-track parallel” mechanism was formed, providing a unique sample for analyzing the impact of policy transition periods;
- (2)
Data Completeness: This period covers the critical stage of Zhejiang’s energy structure transformation (
Figure 2), with the installed capacity of renewable energy increasing by 156% and the dependence on thermal power decreasing by 12%. It can fully reflect the dynamic changes in investment layout;
- (3)
Stability Requirements: Long-term data (6 years) can reduce estimation deviations caused by policy lags and enhance the reliability of model calibration (see
Table 1,
Table 2 and
Table 3).
Using the model above, this section simulates the decision-making problem of renewable energy investment entities under the dual-carbon goal constraints, taking Zhejiang Province’s actual data from 2017 to 2022 as an example. The main data used in this study and their sources can be found in
Table 1,
Table 2 and
Table 3.
Furthermore, to examine the impact of the COVID-19 pandemic on the results, we conducted a time-series regression as follows:
- (1)
Pre-Pandemic: 2017–2019;
- (2)
Pandemic: 2020–2021 (periods of significant disruption and recovery);
- (3)
Post-Pandemic (Early): 2022 (acknowledging ongoing effects, but major lockdowns eased in China).
The potential impact of this pandemic will be discussed in the concluding part of
Section 3.3.
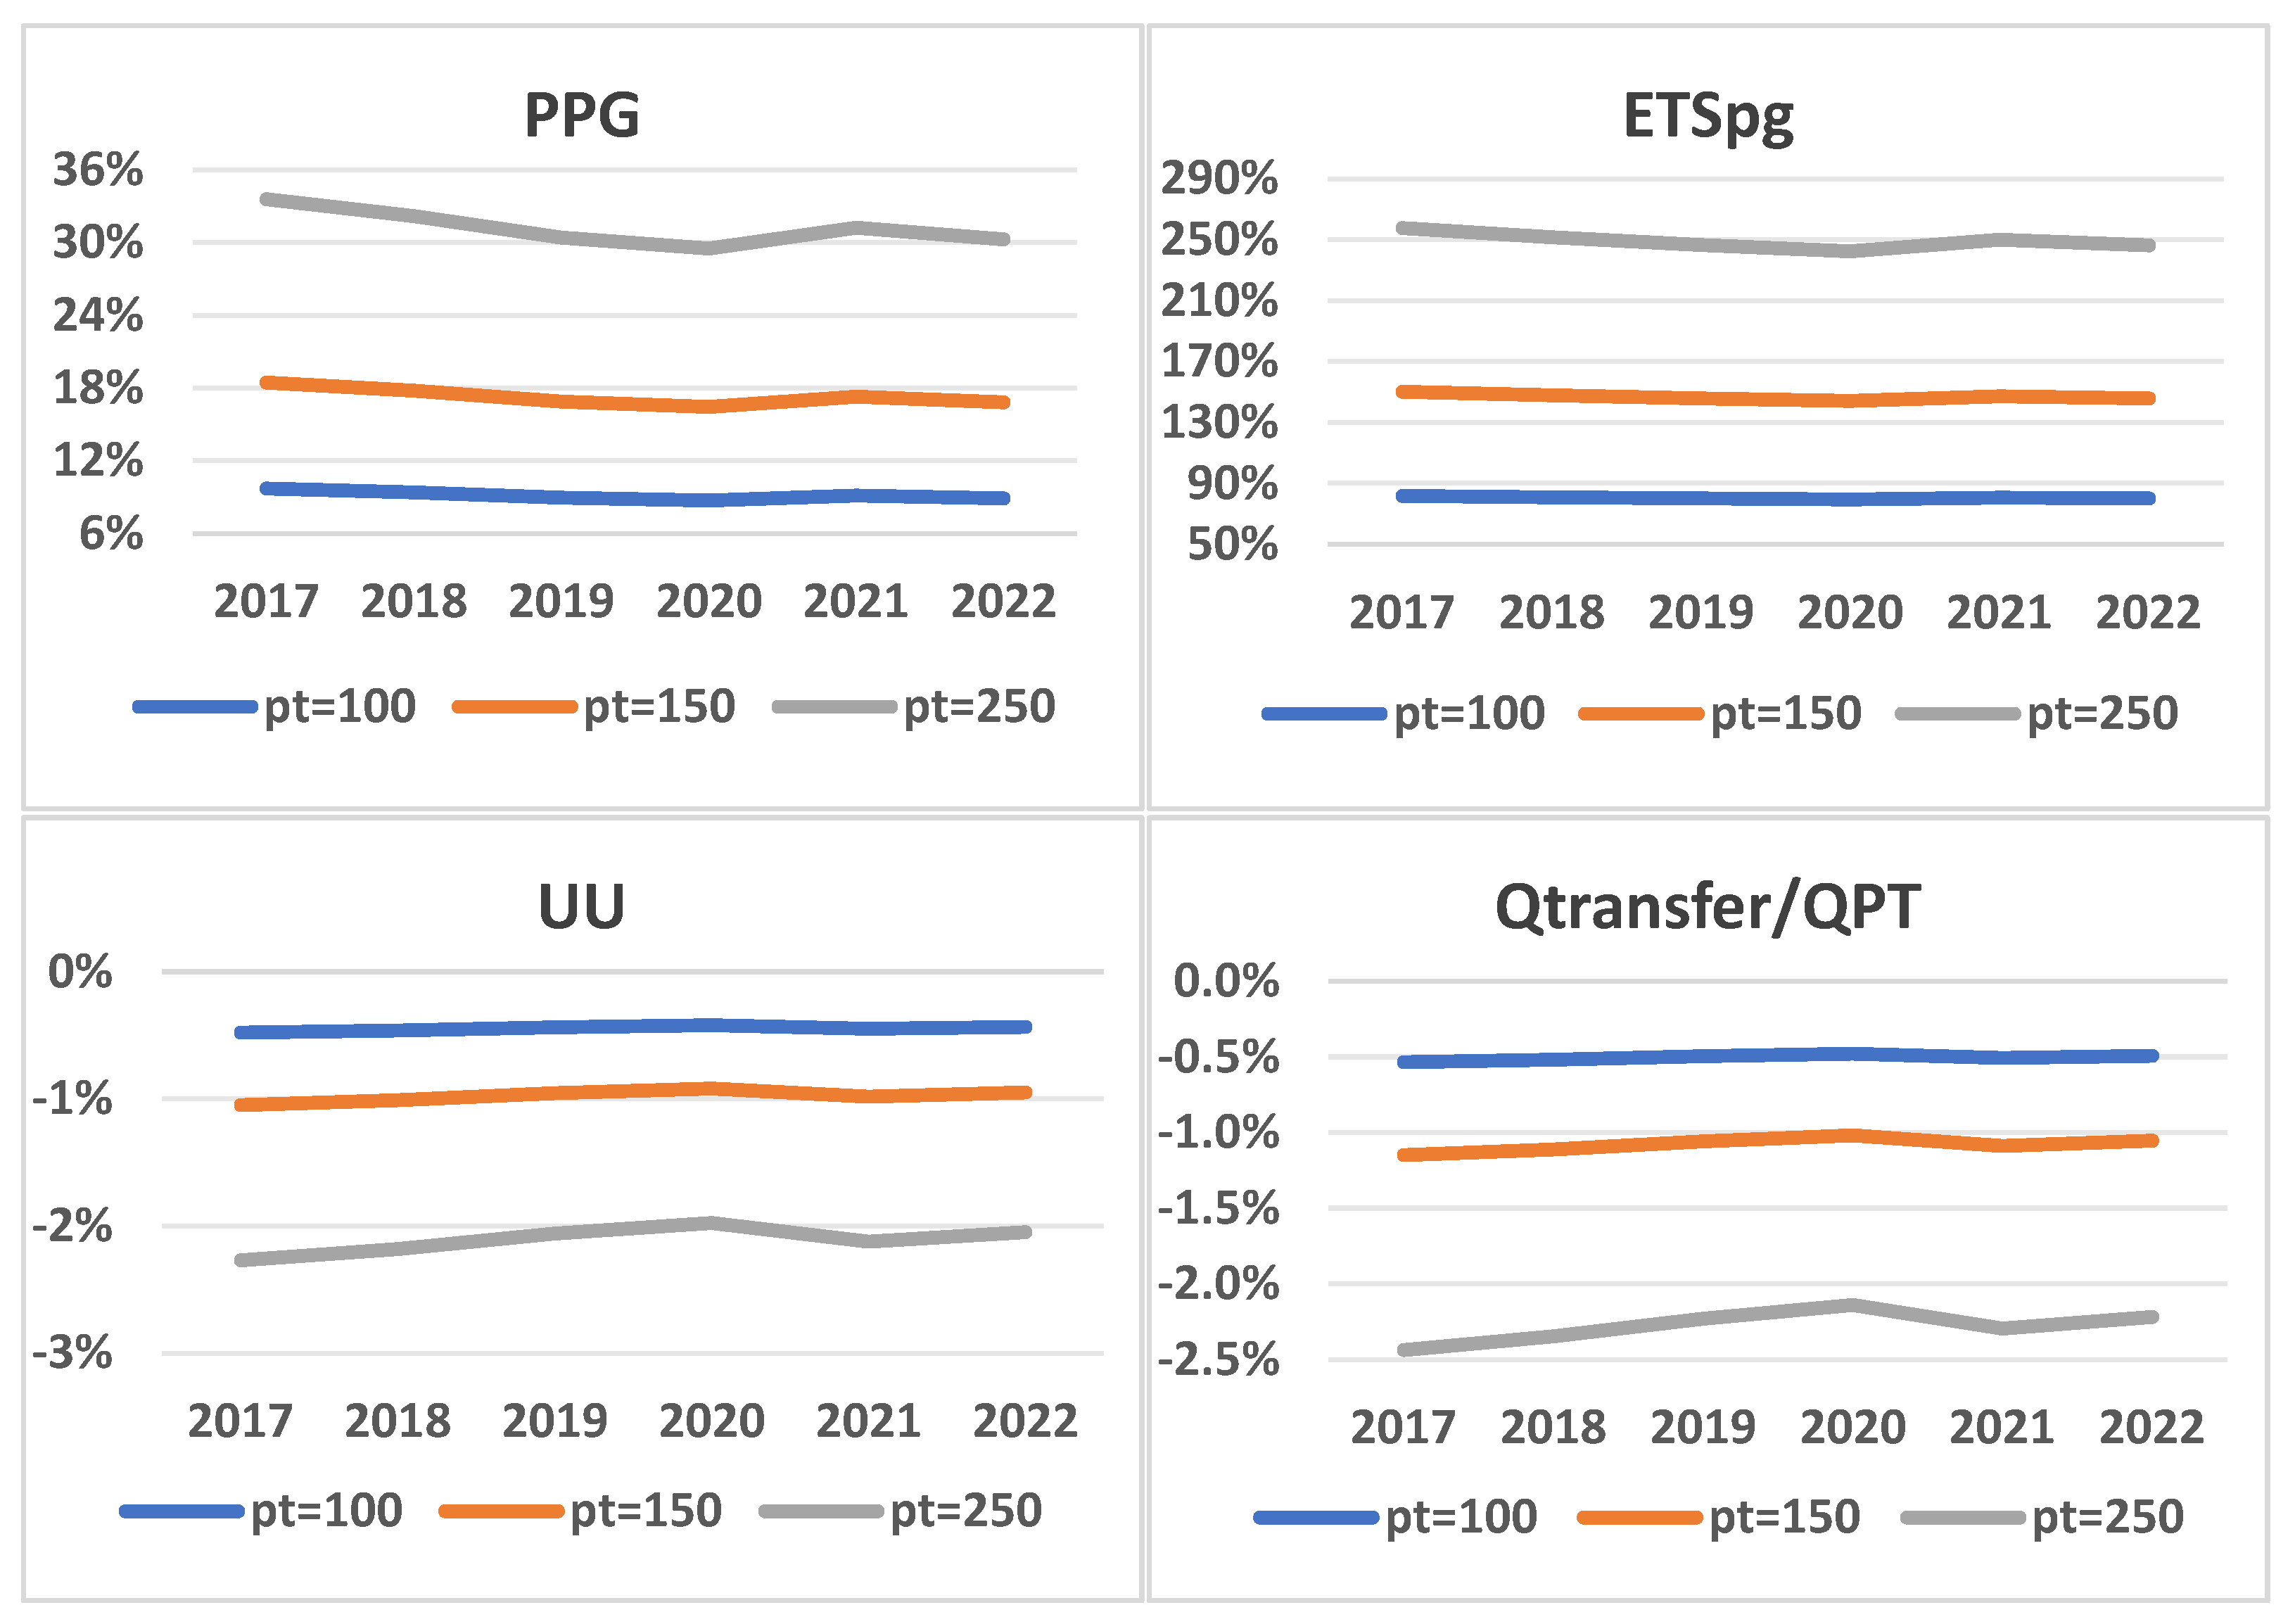
3.3. Simulation Results
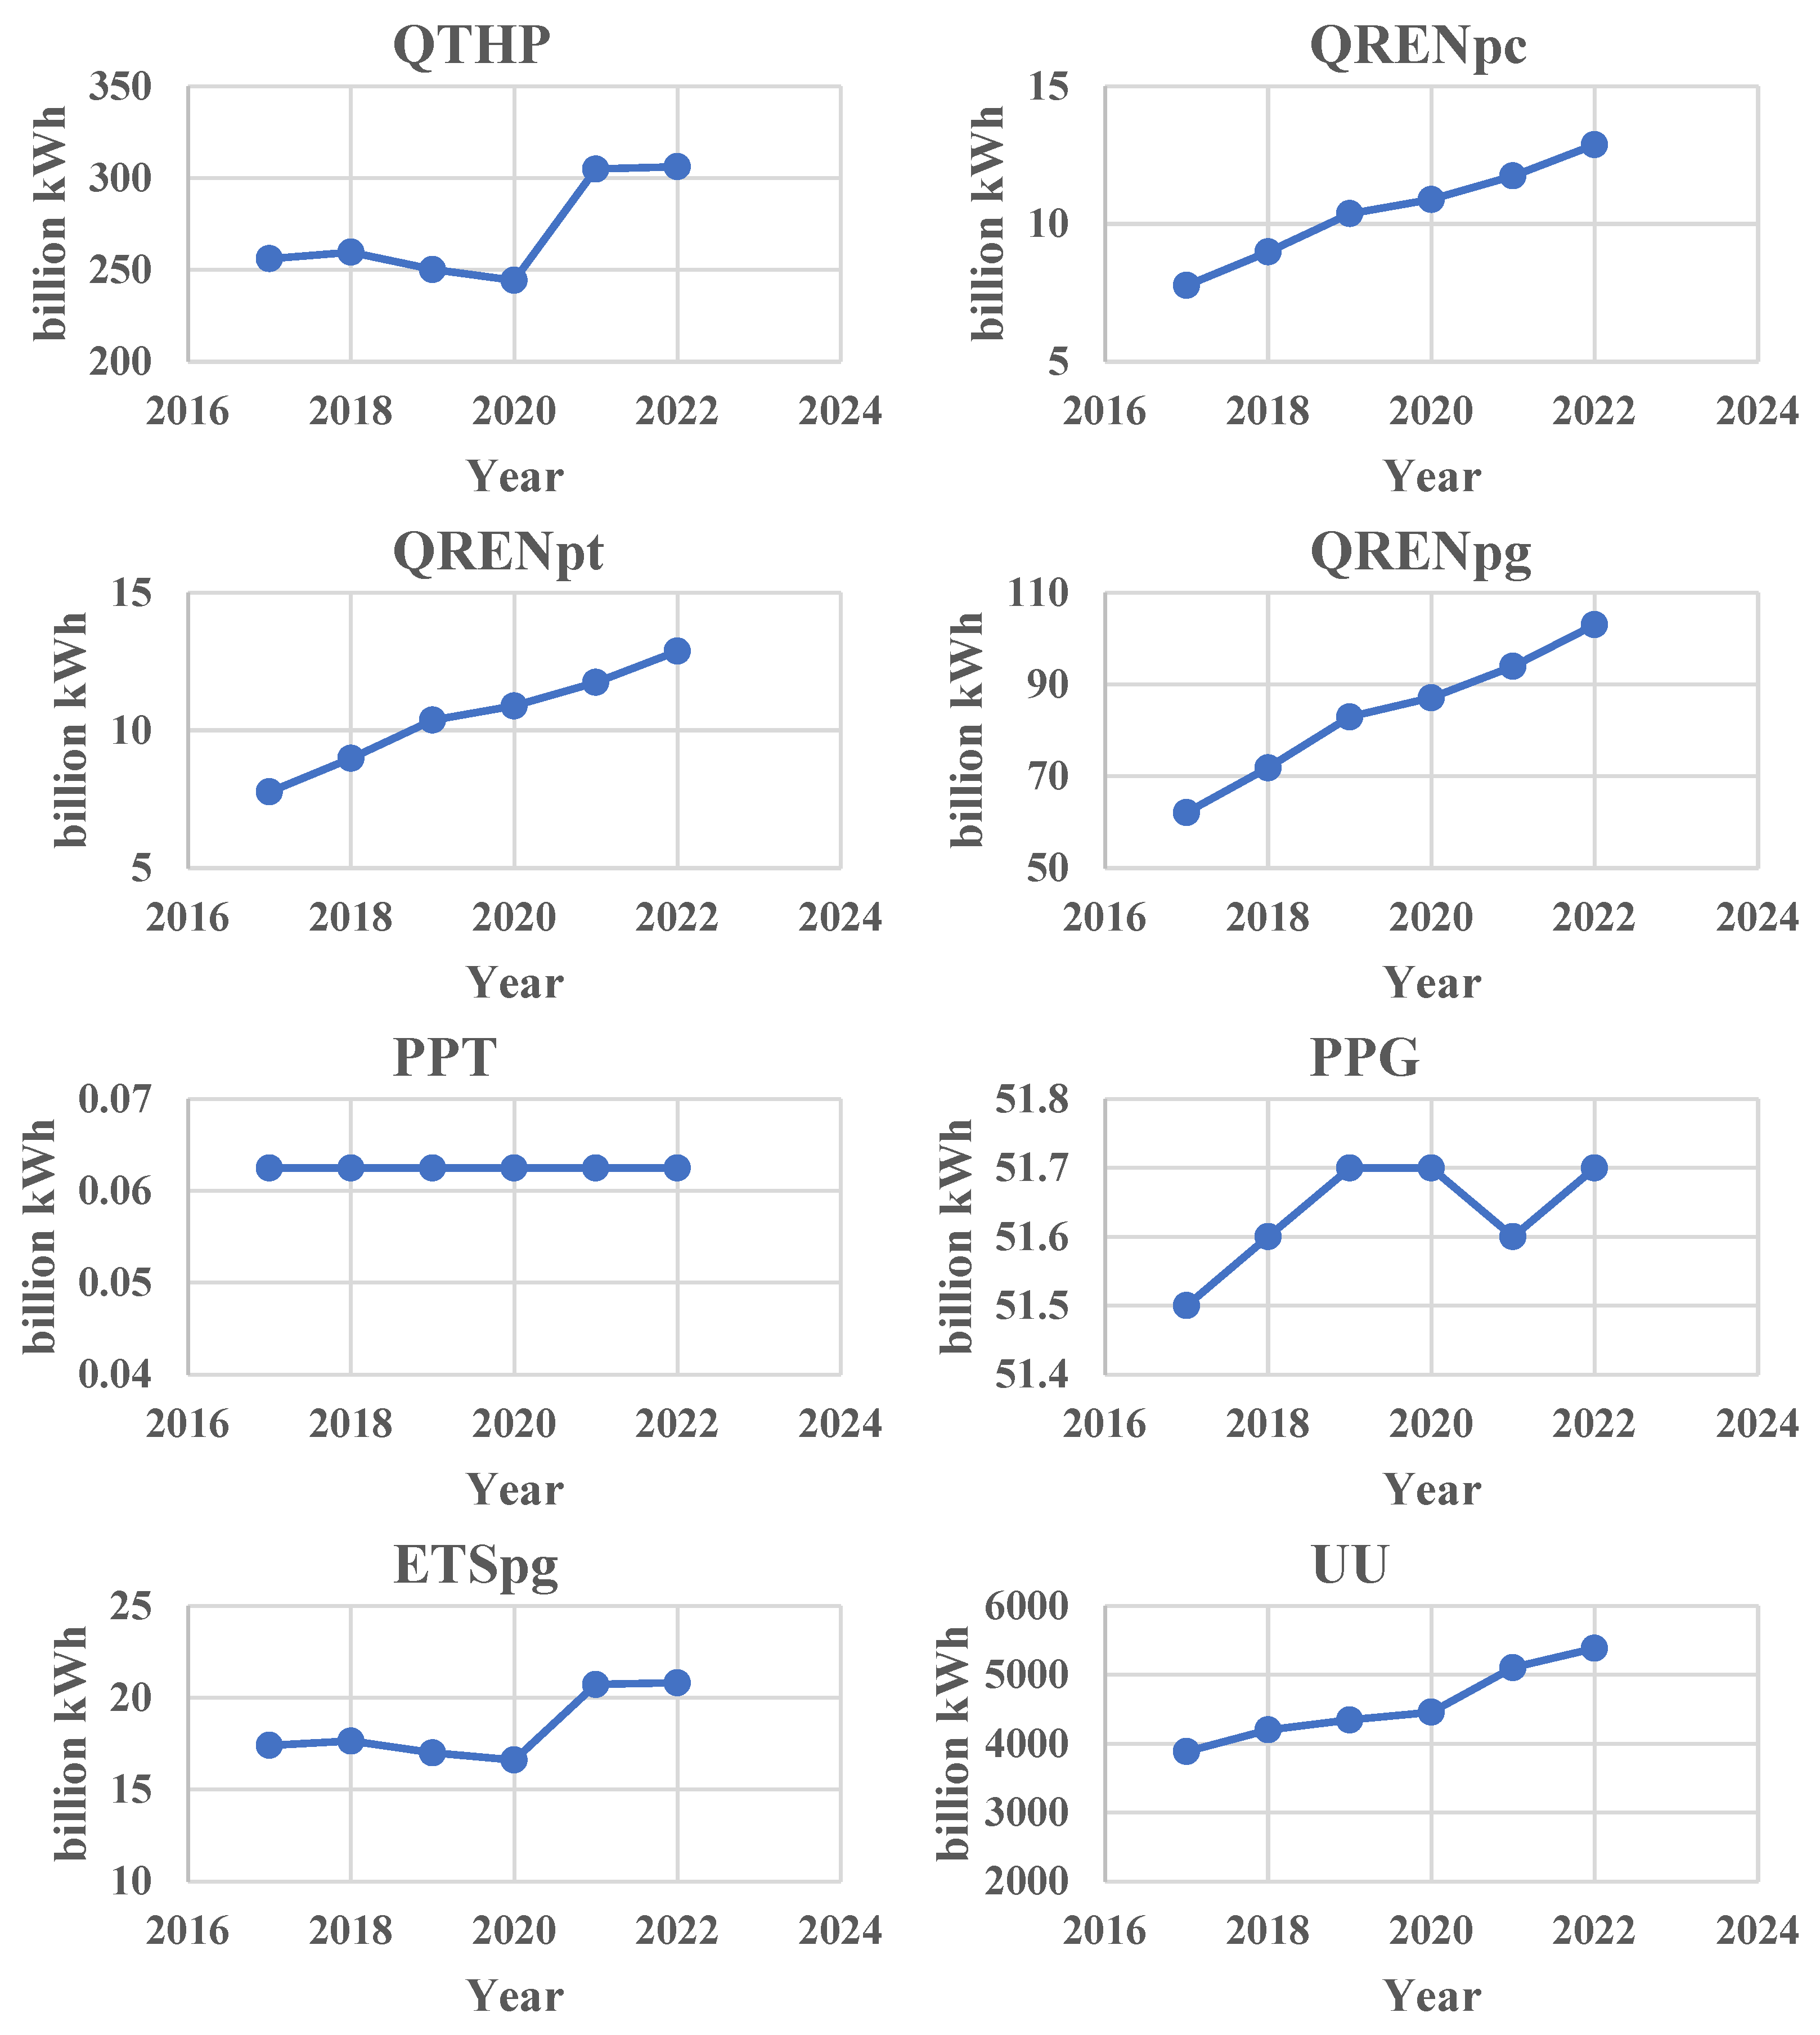
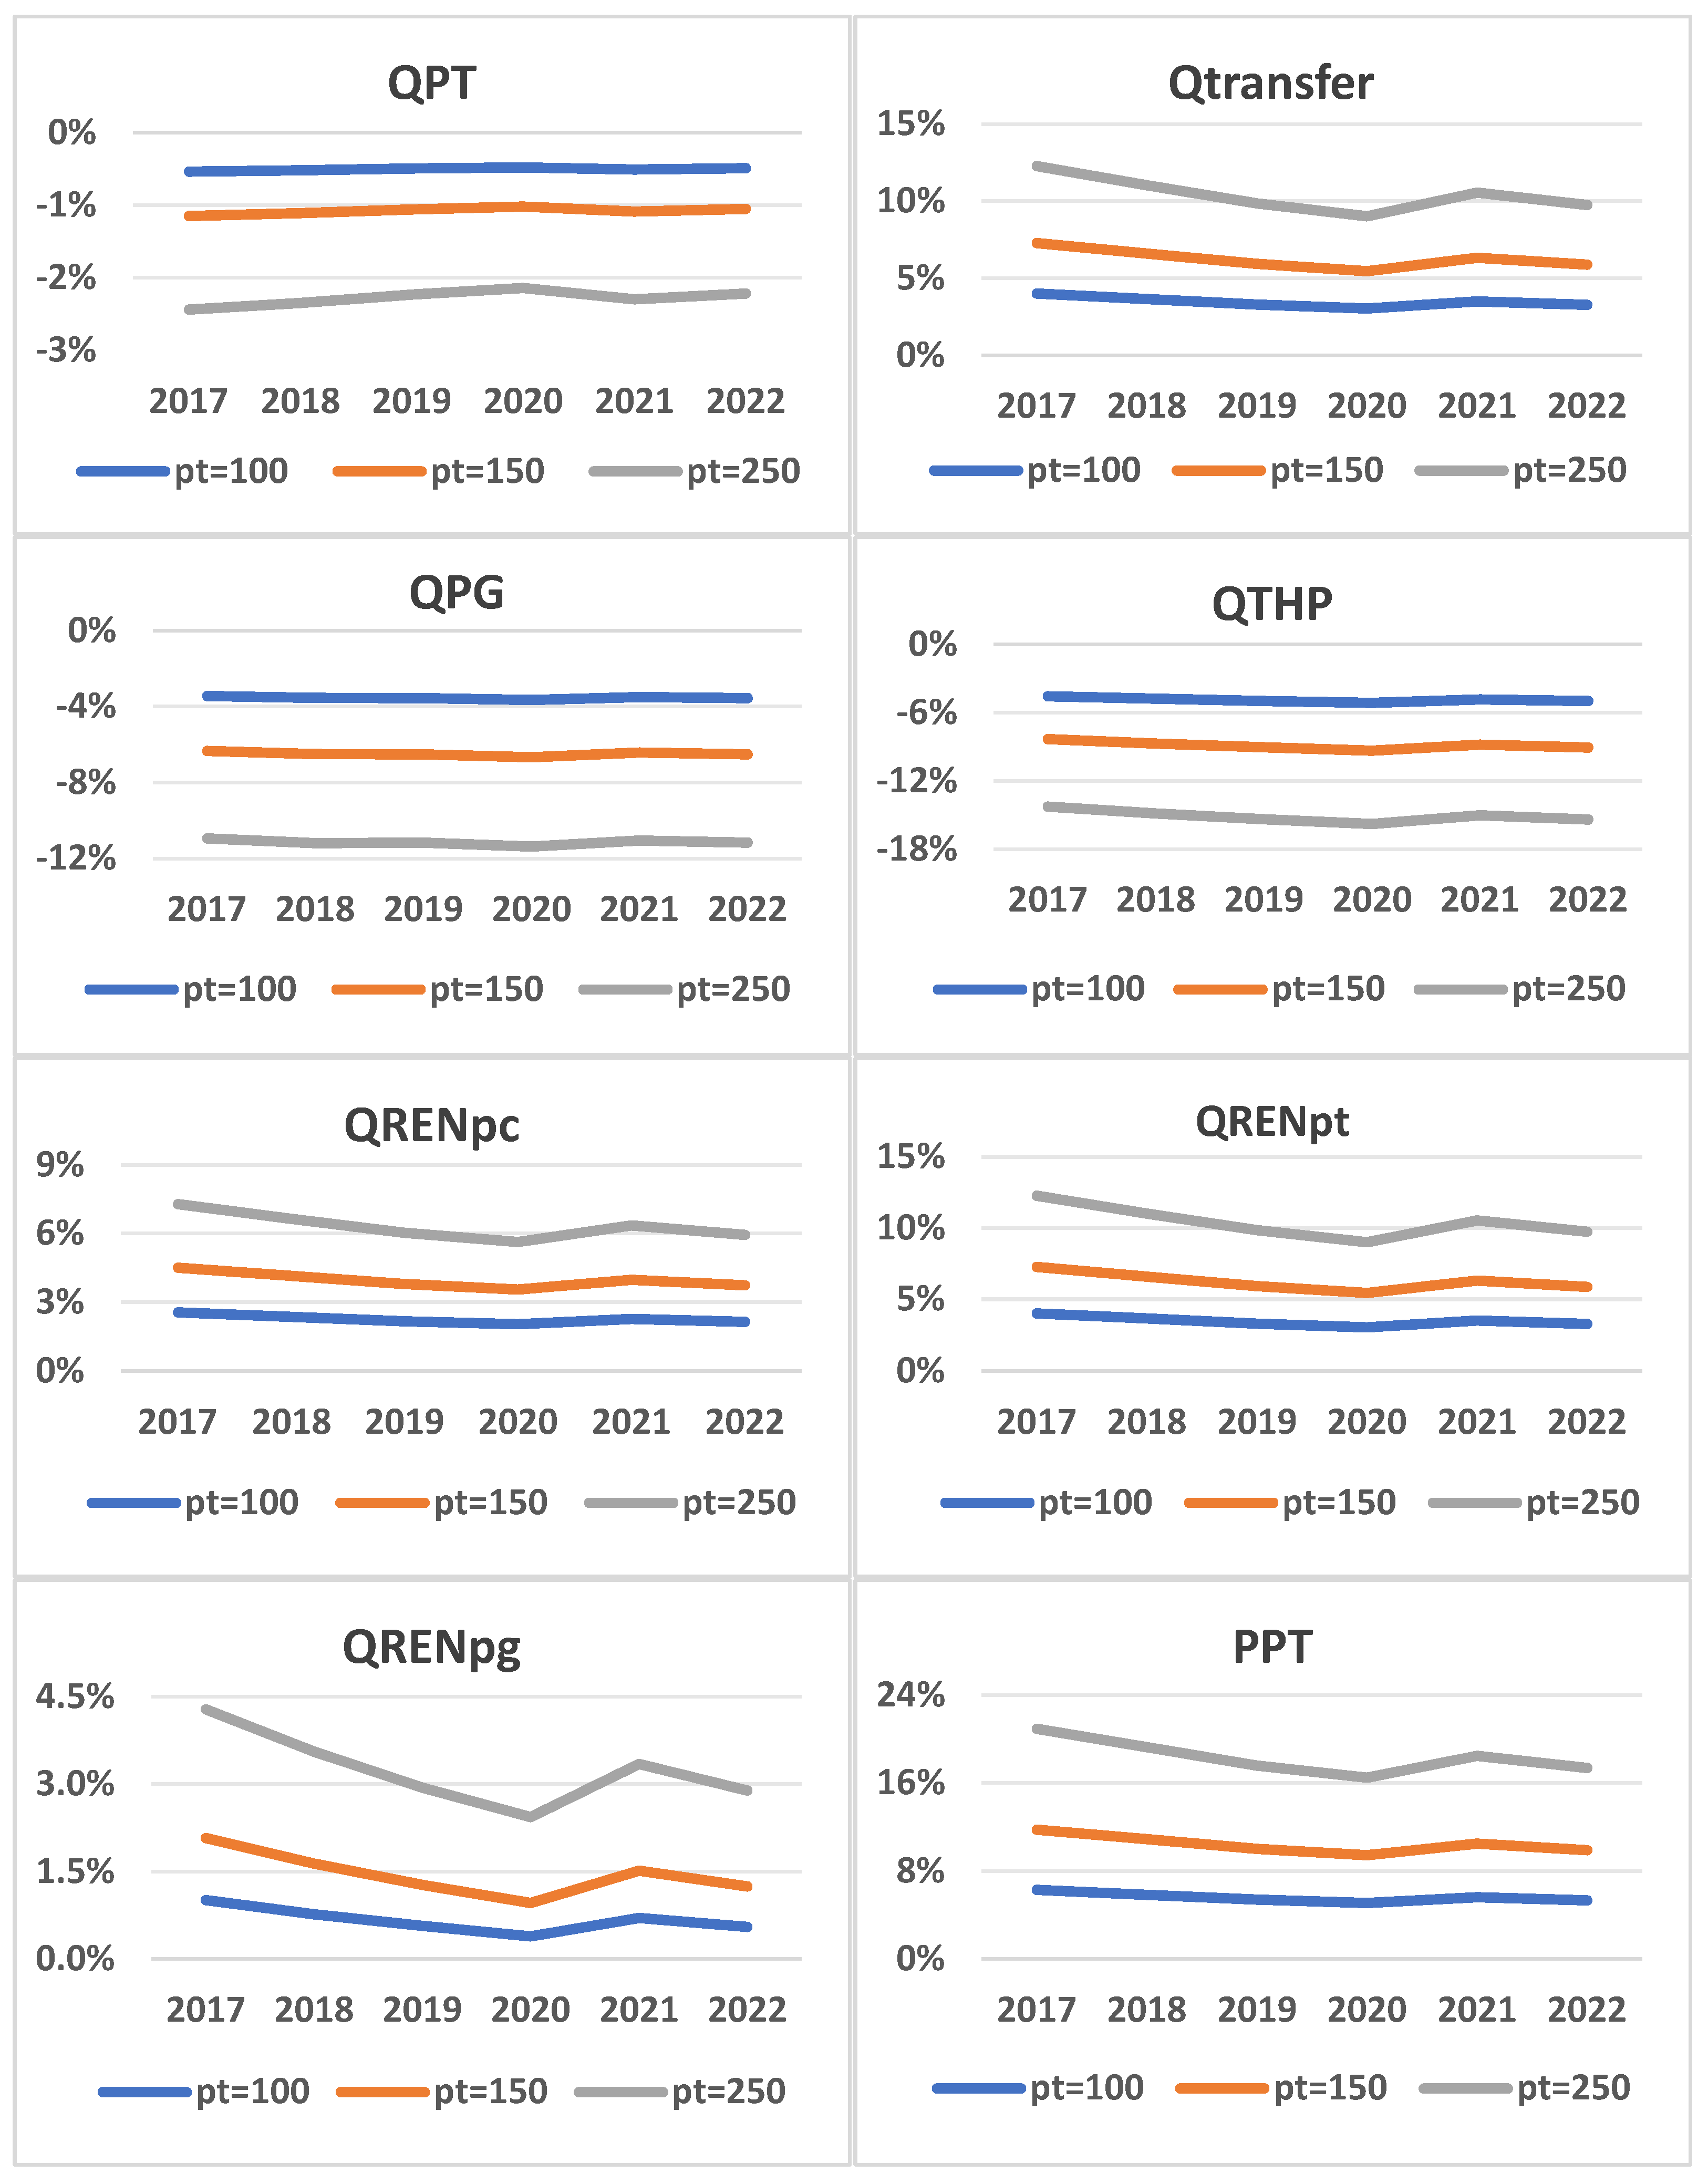
Based on the current data, this study calibrated the model to solve for exogenous parameters and simulated the changes in renewable energy generation and other data for various renewable energy investors as the carbon emissions trading price increased from CNY 50 to CNY 100, 150, and 250/ton. Detailed results are presented in
Figure 3.
In terms of power generation, overall, when the carbon emissions trading price increases, the online electricity quantity provided by power generation enterprises will decrease, and the reduction will become more pronounced as the carbon price rises. The online electricity price for power generation enterprises will also increase, with the increase becoming more significant as the carbon price increases.
From the perspective of the power generation structure, the decrease in thermal power generation is more evident, but the online electricity volume of renewable energy increases as the carbon price rises. For example, using the simulated data for 2022, when the carbon emissions trading price increases from CNY 50 to CNY 100, 150, and 250/ton, the online electricity volume of power generation enterprises decreases by 3.56%, 6.51%, and 11.17%, while the online electricity price rises by 8.91%, 16.81%, and 30.24%. The thermal power generation decreases by 4.98%, 9.06%, and 15.39%, and the renewable energy online electricity volume increases by 0.55%, 1.24%, and 2.89%.
This is because the increase in carbon prices leads to higher carbon trading costs for power generation enterprises. Thermal power generation faces greater carbon emission pressure, and under the same electricity supply, the revenue obtained from providing each unit of electricity decreases. The income effect brought about by the rising carbon price causes a decrease in the online electricity provided by power generation enterprises, with the impact being particularly evident for thermal power. However, due to the substitution effect of renewable energy generation, the online electricity quantity provided by power generation enterprises increases as the carbon price rises, though the increase is smaller than the decrease in thermal power generation. This is because renewable energy generation on the power generation side involves network losses, and its benefits are not significant in high carbon price scenarios.
It is also noteworthy that when the carbon price increases from CNY 50/ton to CNY 100, 150, and 250/ton, the carbon trading costs borne by power generation enterprises will rise by 80.09%, 145.63%, and 246.07%, respectively. This is because the increase in carbon trading costs is not greater than the increase in carbon price, which includes the effects of both income and substitution effects.
Comparing the power generation situation of power generation enterprises under different carbon price scenarios across different years, the overall trend of these variables remains consistent. It can be concluded that as the carbon price rises, the power generation volume of power generation enterprises is significantly suppressed, while at the same time, the renewable energy generation volume increases.
In terms of transmission, overall, as the carbon emissions trading price increases, the sales volume of transmission enterprises decreases, with the reduction degree increasing as the carbon price rises. The sales price of electricity from transmission enterprises will also increase, and the extent of the increase will be proportional to the rise in carbon price. For example, using the 2022 simulation data, when the carbon emissions trading price increases from CNY 50 to CNY 100, 150, and 250/ton, the transmission enterprises’ sales volume decreases by 0.49%, 1.05%, and 2.22%, while the electricity sales price increases by 5.32%, 9.89%, and 17.37%, respectively. The renewable energy generation and external electricity sales increase by 3.25%, 5.86%, and 9.74%, respectively.
The reason for this is that the increase in carbon price leads to a reduction in the amount of electricity fed into the grid by power generation enterprises and an increase in the grid electricity price. This, in turn, raises the cost for transmission enterprises to purchase electricity from local power generation companies, and the resulting income effect causes transmission enterprises to reduce the supply of electricity. However, due to the substitution effect of renewable energy generation and external clean energy generation, as the carbon price rises, transmission enterprises’ renewable energy and external electricity purchases increase.
By comparing the electricity transmission situation of transmission enterprises under different carbon price scenarios across different years, the overall trend of these variables remains consistent. It is evident that as the carbon price increases, the transmission volume of transmission enterprises will decrease. However, under the same constraints, the renewable energy electricity and external electricity purchased by transmission enterprises will increase. This is because both of these sources typically come from clean energy generation, which faces relatively low carbon cost pressure.
In terms of electricity consumption, generally, when the carbon price increases, the overall utility on the demand side will decrease under the same electricity consumption constraint. The extent of the decrease will increase with the rising carbon price. Additionally, the renewable energy generation on the demand side will increase, and the increase will be more pronounced as the carbon price rises. Taking the simulated data from 2022 as an example, when the carbon price increases from CNY 50 to CNY 100, 150, and 250/ton, the overall utility on the demand side decreases by 0.44%, 0.95%, and 2.05%, respectively, while the renewable energy generation on the demand side increases by 2.12%, 3.73%, and 5.93%.
The reason for this is that the rise in carbon prices leads to a decrease in the electricity sold by the transmission companies, which reduces the total electricity purchased by the demand side, thus decreasing the utility. At the same time, due to the increase in the electricity price from transmission companies, under the substitution effect, the renewable energy generation on the demand side increases, which leads to an increase in the utility of the demand side. However, when considering both effects, the substitution effect is smaller than the income effect, and ultimately, the overall utility on the demand side decreases.
Comparing the electricity consumption data of the demand side under different carbon price scenarios for various years, the overall trend remains consistent. It can be concluded that when the carbon price increases, the total utility of electricity consumers decreases, while renewable energy generation increases.
Finally, combining the data from
Table 1 and
Table 2, it can be observed that during the 2017–2022 period, when the share of electricity imported from outside Zhejiang Province was small, the deployment of renewable energy by local entities was more sensitive to carbon prices. However, as the share of electricity imported from outside Zhejiang increased, the impact of carbon prices on local renewable energy generation became smaller; the carbon market cost pressure on power generation enterprises was reduced, and the total utility of the electricity demand side decreased less. According to the simulated data, the net electricity import from outside Zhejiang Province has been increasing year by year from 2017 to 2022, and its share of the electricity sold by transmission enterprises has steadily increased, peaking at 28.5% in 2020 and then decreasing. When the carbon price increased from CNY 50 to CNY 100 per ton, the renewable energy generation of the generation, transmission, and consumption sectors showed a downward trend, reaching the lowest values in 2020 at 0.39%, 3.03%, and 2.02%, respectively. The carbon market cost pressure on traditional energy for power generation enterprises also reached its lowest point at 80.67%, and the total utility reduction for the demand side also reached its minimum value of 0.42% in 2020. When the carbon price further increased to CNY 150 per ton or CNY 250 per ton, the overall trends of these variables remained consistent.
To examine the impact of the COVID-19 pandemic on the results, we conducted a time-series regression. Findings from the Robustness Check are as follows:
- (1)
Directional Consistent: The core qualitative findings regarding the direction of the impact of carbon prices (simulated increases) on different entities held across all sub-periods. The heterogeneity across entities remained evident;
- (2)
Magnitude Variation: We observed some variation in the magnitude of the simulated effects, particularly during the peak pandemic year (2020). For example, the simulated suppression of thermal generation and overall generation output in response to carbon price increases was slightly less pronounced in 2020 compared to other years. This could be attributed to lower overall energy demand volatility during lockdowns or government interventions stabilizing the system. The increase in consumption-side renewable energy deployment was slightly stronger in 2021–2022;
- (3)
Resilience of Core Mechanism: Importantly, the fundamental mechanism of the carbon price acting through the model proved robust. The exogenous carbon price shock () still exerted its predicted influence on costs and decisions, even during the pandemic, although the starting point (baseline demand, costs) might have shifted.
The pandemic represents an exogenous shock to the energy system, but our model focuses on the marginal effect of the carbon price shock within the given context of each year (including pandemic years). The results demonstrate the resilience of the carbon price signal as a driver of renewable investment decisions even under significant external stress.


