Article

Mitigation of Reverse Power Flows in a Distribution Network by Power-to-Hydrogen Plant †

1
Department of Engineering, University of Palermo, 90128 Palermo, Italy
2
Department of Electrical Engineering, Faculty of Engineering, University of Malta, 2080 Msida, Malta
*
Author to whom correspondence should be addressed.
This article is a revised and expanded version of a paper entitled “Renewable Hydrogen Production from Reverse Power Flows in the Maltese Medium Voltage Distribution Network”, presented at the 9th International Conference on Clean Electrical Power (ICCEP), held from 24 to 26 June 2025 in Villasimius, Sardinia, Italy.
Energies 2025, 18(15), 3931; https://doi.org/10.3390/en18153931
Submission received: 18 June 2025 / Revised: 15 July 2025 / Accepted: 19 July 2025 / Published: 23 July 2025
(This article belongs to the Special Issue Advances in Hydrogen Energy IV)

Abstract

The increase in power generation facilities from nonprogrammable renewable sources is posing several challenges for the management of electrical systems, due to phenomena such as congestion and reverse power flows. In mitigating these phenomena, Power-to-Gas plants can make an important contribution. In this paper, a linear optimisation study is presented for the sizing of a Power-to-Hydrogen plant consisting of a PEM electrolyser, a hydrogen storage system composed of multiple compressed hydrogen tanks, and a fuel cell for the eventual reconversion of hydrogen to electricity. The plant was sized with the objective of minimising reverse power flows in a medium-voltage distribution network characterised by a high presence of photovoltaic systems, considering economic aspects such as investment costs and the revenue obtainable from the sale of hydrogen and excess energy generated by the photovoltaic systems. The study also assessed the impact that the electrolysis plant has on the power grid in terms of power losses. The results obtained showed that by installing a 737 kW electrolyser, the annual reverse power flows are reduced by 81.61%, while also reducing losses in the transformer and feeders supplying the ring network in question by 17.32% and 29.25%, respectively, on the day with the highest reverse power flows.

1. Introduction

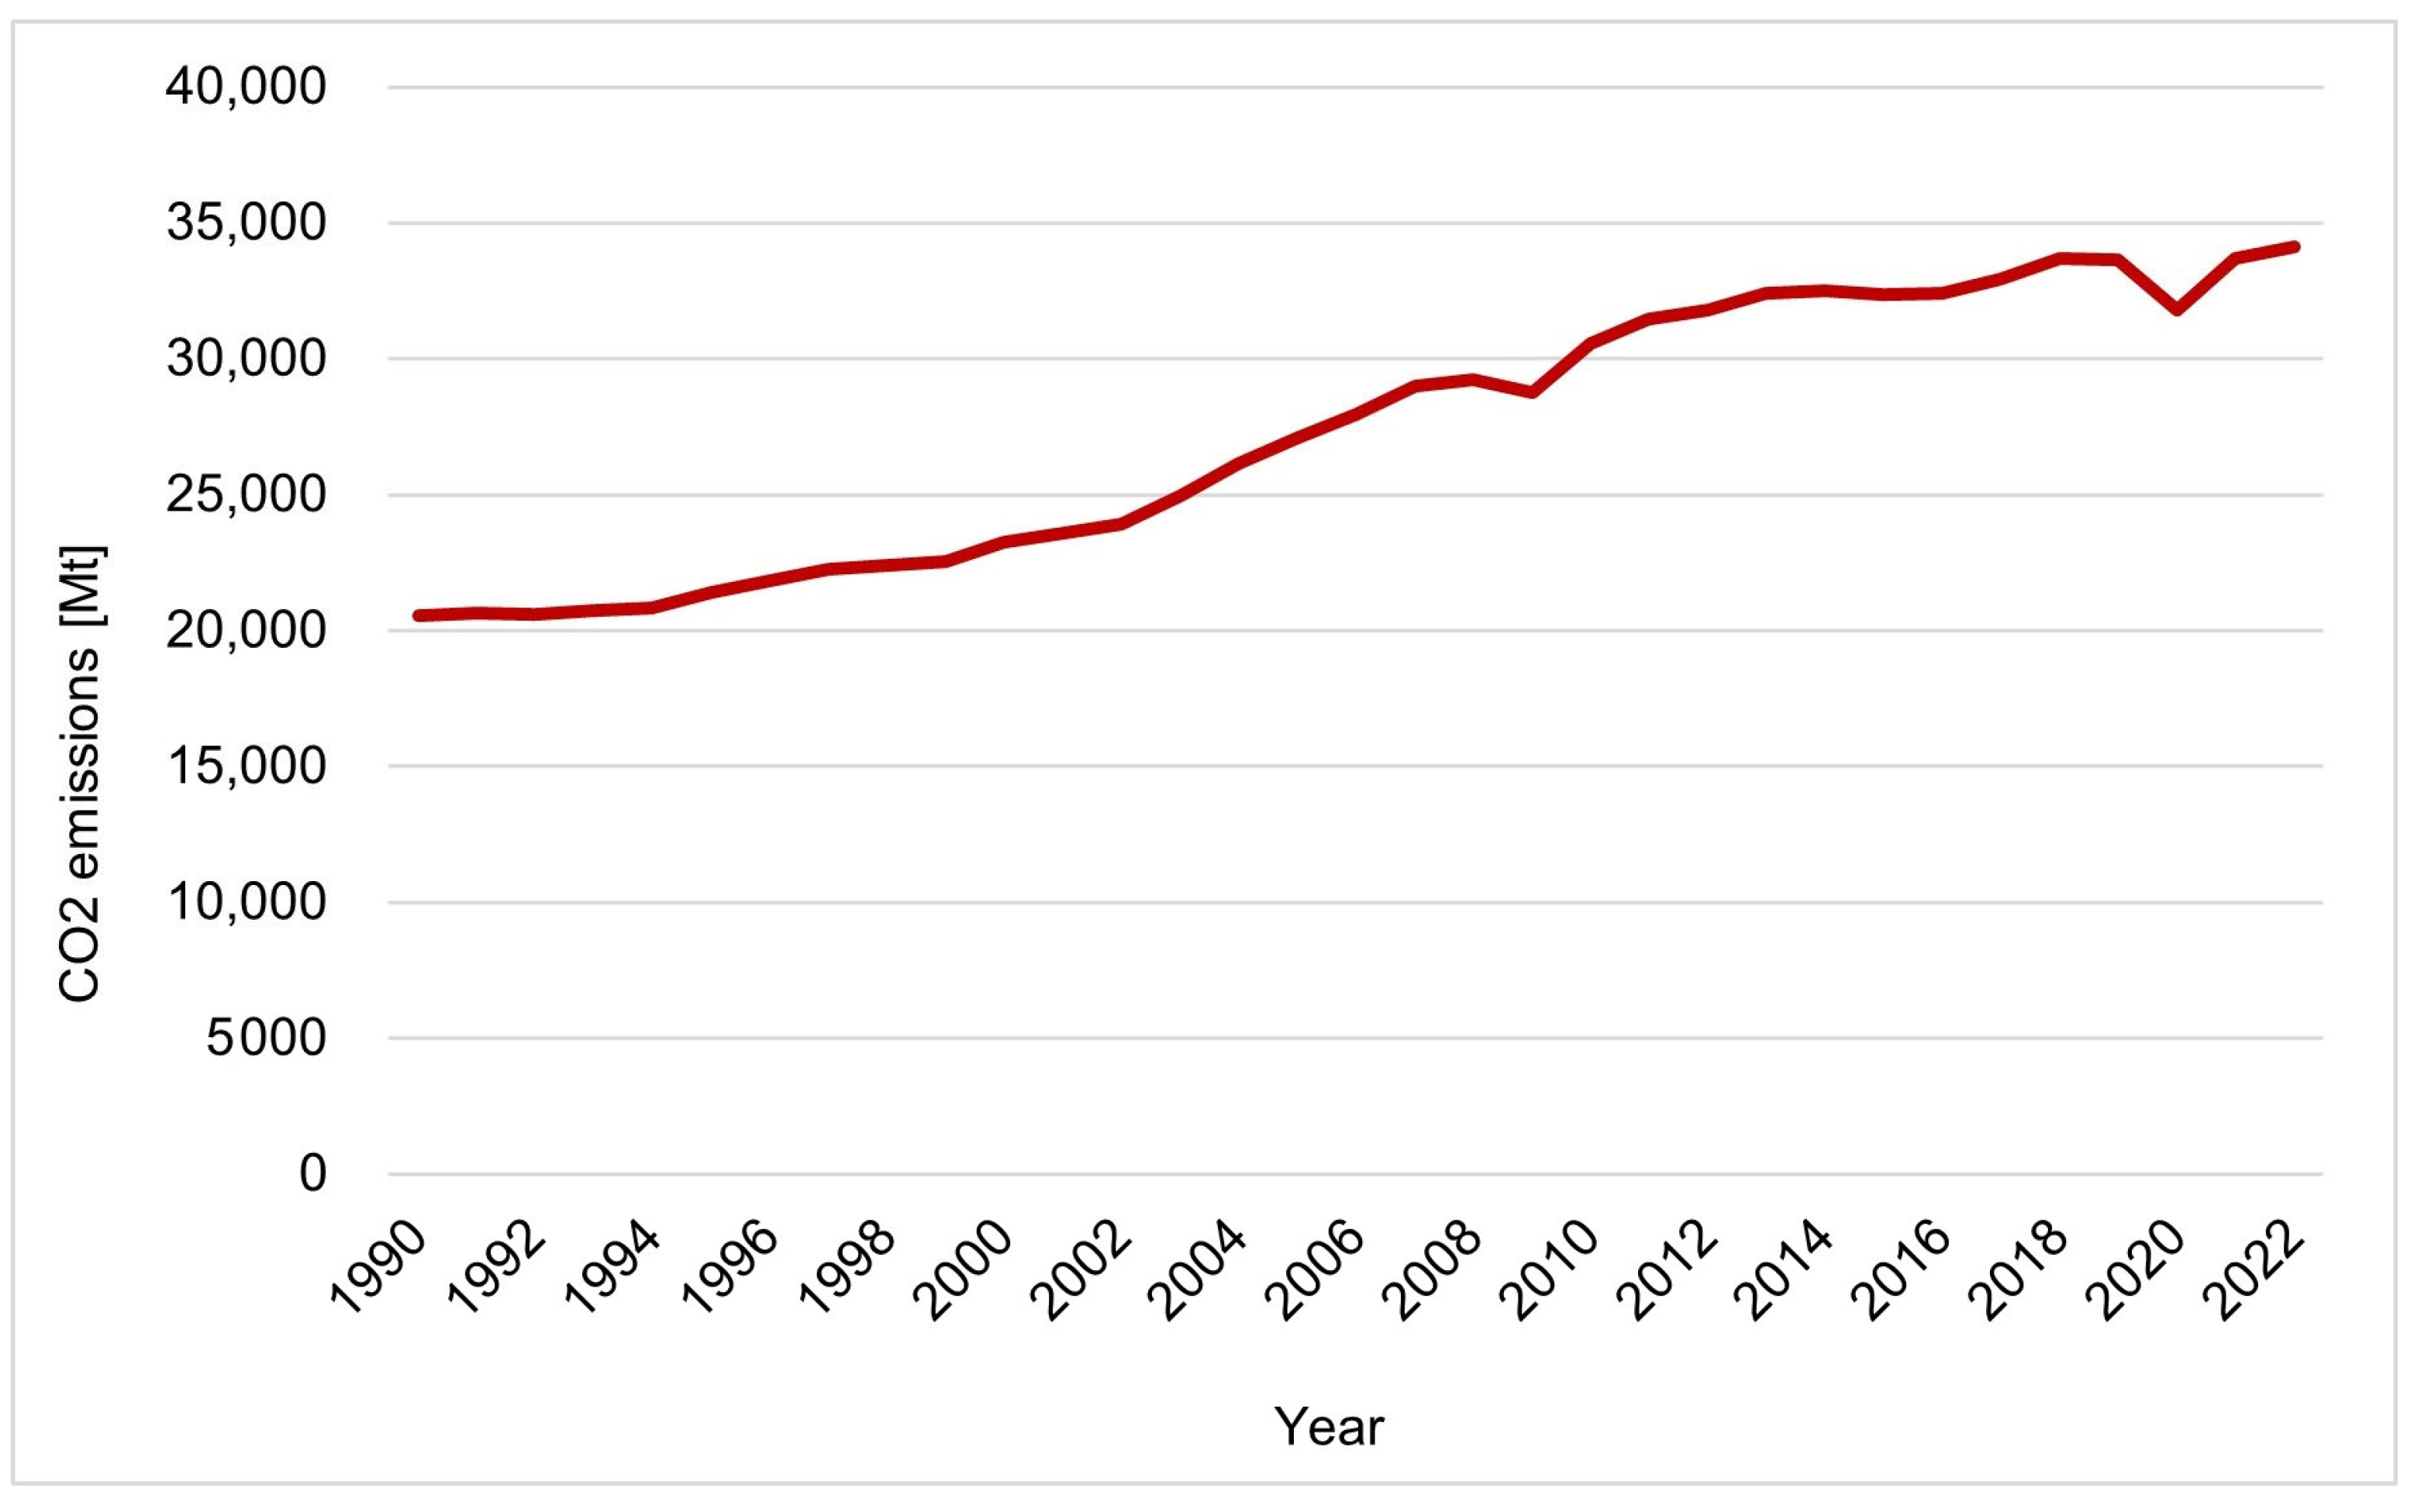
Since the industrial revolution, there has been a continuous increase in greenhouse gas emissions that have led to a rise in the global average temperature, with increasingly dramatic consequences for the environment. Much of the emissions are associated with energy production. Detailed in Figure 1 is the trend in global carbon dioxide emissions related to fuel use between 1990 and 2022 according to IEA data [1]: after a slight decline in 2009, due to the economic crisis, and a more pronounced decline in 2020 due to the pandemic, emissions have returned to growth, reaching nearly 35,000 megatons in 2022.
For this reason, international strategies that aim to combat climate change through decarbonization processes have been defined over the years. The European Union, in particular, in accordance with the Paris Agreement, is committed, through its Green Deal initiatives, to cutting greenhouse gas emissions by at least 55% below pre-industrial levels by 2030 and achieving the goal of climate neutrality, or zero net carbon emissions, by 2050 [2].
In order to achieve the set goals, more and more is being invested in the construction of new renewable energy generation facilities. As reported in [3], 2024 was the year of the largest increase in global renewable energy capacity to date, with the addition of 585 GW of renewables, expanding the renewable energy stock by 15.1%. The fastest growth was seen in solar and wind power plants: solar power accounted for more than 75% of renewable additions, with a record 452 GW added during the year, while wind power contributed 113 GW. These renewable sources, however, are highly random, which poses major challenges for the optimal management of the energy obtained from them. Indeed, it often happens that energy is produced at instants when users do not need it or simply cannot be fed into the grid due to local congestion problems, resulting in the need to resort to curtailment. In addition, the presence of distributed generation from non-programmable sources can result in the reversal of power flows in grid branches, affecting the sensitivity and selectivity of protections [4], as well as the voltage, transmission and distribution losses, and temperature of transformers. In mitigating these phenomena, Power-to-Gas technologies can help [5], complementing the classical battery storage technologies typically employed. Among the various Power-to-Gas technologies available, the focus in recent years has particularly been on Power-to-Hydrogen plants, mainly because of the many uses of hydrogen, which, in addition to being an excellent fuel, can also be used as a raw material for various production processes (in refining, glass production, ceramics, steel and more).
In the recent study reported in [6], the authors proposed and analysed possible distributed generation systems for power supply on the island of Rum, an island in Scotland not connected to the national grid that currently has a power supply system consisting of two hydroelectric generators, a backup diesel generator, and a battery storage system with an integrated inverter. The authors proposed several cases, including one in which a hydrogen production and storage subsystem flanks the classic battery storage system, and another case in which a hydrogen system replaces the batteries entirely, in both cases providing for the installation of wind and photovoltaic renewable sources to replace the current diesel generator, thus reducing the environmental impact.
The hydrogen storage considered consists of a PEM electrolyser, a compressed hydrogen tank, and a diesel generator converted to hydrogen. The electrolyser was chosen such that the maximum excess production for each scenario is converted to hydrogen. An economic analysis was conducted for each case considered, considering the capital expenditures (CAPEX), expected operating and maintenance costs (OPEX) and replacement costs associated with the various system components, based on their typical life cycle, considering a 20-year time window. For each case, the total life cycle cost (TLCC) and the levelized cost of energy (LCOE) were calculated.
The results obtained by the authors showed that the proposed hydrogen system can represent a sustainable solution even from an economic point of view, despite the current high investment expenses, leading to a completely renewable energy mix to meet the electricity demand of the considered island, with a lower LCOE than that of the current energy system. In addition, the TLCC of the case where the hydrogen storage system entirely replaces battery storage was found to be 13% lower than that of the case where both forms of storage are present, as the battery system incurs higher operating expenses due to its replacement, which must occur every 10 years. From this, the authors concluded that hydrogen generation and storage can be an economical means of stand-alone clean energy storage for island power systems.
The presence of power-to-hydrogen plants, however, can also be very useful for grid-connected systems. This is the case of the Terni medium-voltage distribution grid. A case study was conducted in [7], where the authors proposed the installation of hydrogen systems consisting of fuel cells, electrolysers and compressed hydrogen storage. The aim was to enhance the energy performance of the distribution grid and facilitate the integration of distributed generation. Through an optimisation algorithm, the optimal size and placement of such systems were identified, achieving a high rate of self-consumed excess renewable energy of 38.7% and a decrease in reverse energy flows of 14.8%. The sizing problem was solved through an optimisation procedure based on the micro genetic algorithm, which is adequate for solving problems with complex and nonlinear data, setting as the goal the identification of the minimum sizes of the fuel cell, electrolyser and hydrogen storage system such that a specific Key Performance Indicator value can be achieved. The problem of location, on the other hand, has been solved by means of Key Selection Indicators, which are indicators related to the efficient operation of hydrogen systems that enable the selection of the most suitable energy districts to host them.
In [8], the authors showed the impact that a Power-to-Gas plant can have on two electrical systems, one rural and one semi-urban, for different penetration rates of renewable sources. The plant considered consists of an alkaline electrolyser, a tank and a methanation unit to which hydrogen can be sent for the production of synthetic natural gas. To determine the network node where the plant should be installed and the size of the plant, the authors applied the Simulated Annealing method, considering the minimisation of reverse power flows, overvoltages and overcurrents as objective functions. The results achieved are significant, with a reduction in reverse power flows in the range of 78–100%, depending on the network topology and penetration of renewable sources, alleviating or eliminating overcurrent and/or overvoltage problems. However, the study did not consider the investment costs during the plant design phase, nor other local uses of hydrogen besides methanation.
In a case study reported in [9], instead, reverse power flows generated by a grid-connected photovoltaic system were fully converted to hydrogen to power a fleet of fuel cell vehicles, leading, however, to the hydrogen produced having a higher storage size than the sizes obtained in cases where the electrolyser operates more continuously due to other electricity supplies.
Sizing power-to-hydrogen plants to maximise the energy yield from renewable sources, as proposed in [6,9], could therefore be uneconomical. For this reason, it would be better to use optimisation studies, as performed in [7,10]. In the latter paper, in particular, a linear mathematical model of an energy hub was employed, which allows great flexibility in modelling with a low computational time. The model was developed in the MATLAB R2023b environment to determine the optimal size of the components of two storage systems, one hydrogen and one battery, such as to minimise the curtailment of renewable energy, which is necessary in some cases to avoid the emergence of congestion in the transmission grid. In addition, the sizes of the two systems were optimised in order to find the most economical solution.
The adoption of energy systems of this type, based on the energy hub concept, is widespread in the literature because they allow for a number of advantages: first, the reliability of the energy supply can be increased because it is no longer completely dependent on a single grid; second, such a system allows, through linear equations, the optimisation of the supply itself according to certain criteria such as, for example, the cost, emissions and availability of the various carriers; and, finally, it allows, as in this case, to facilitate the integration of non-programmable renewable energy sources due to the presence of conversion and storage elements [11,12,13].
In the study presented in this paper, the same mathematical model proposed in [
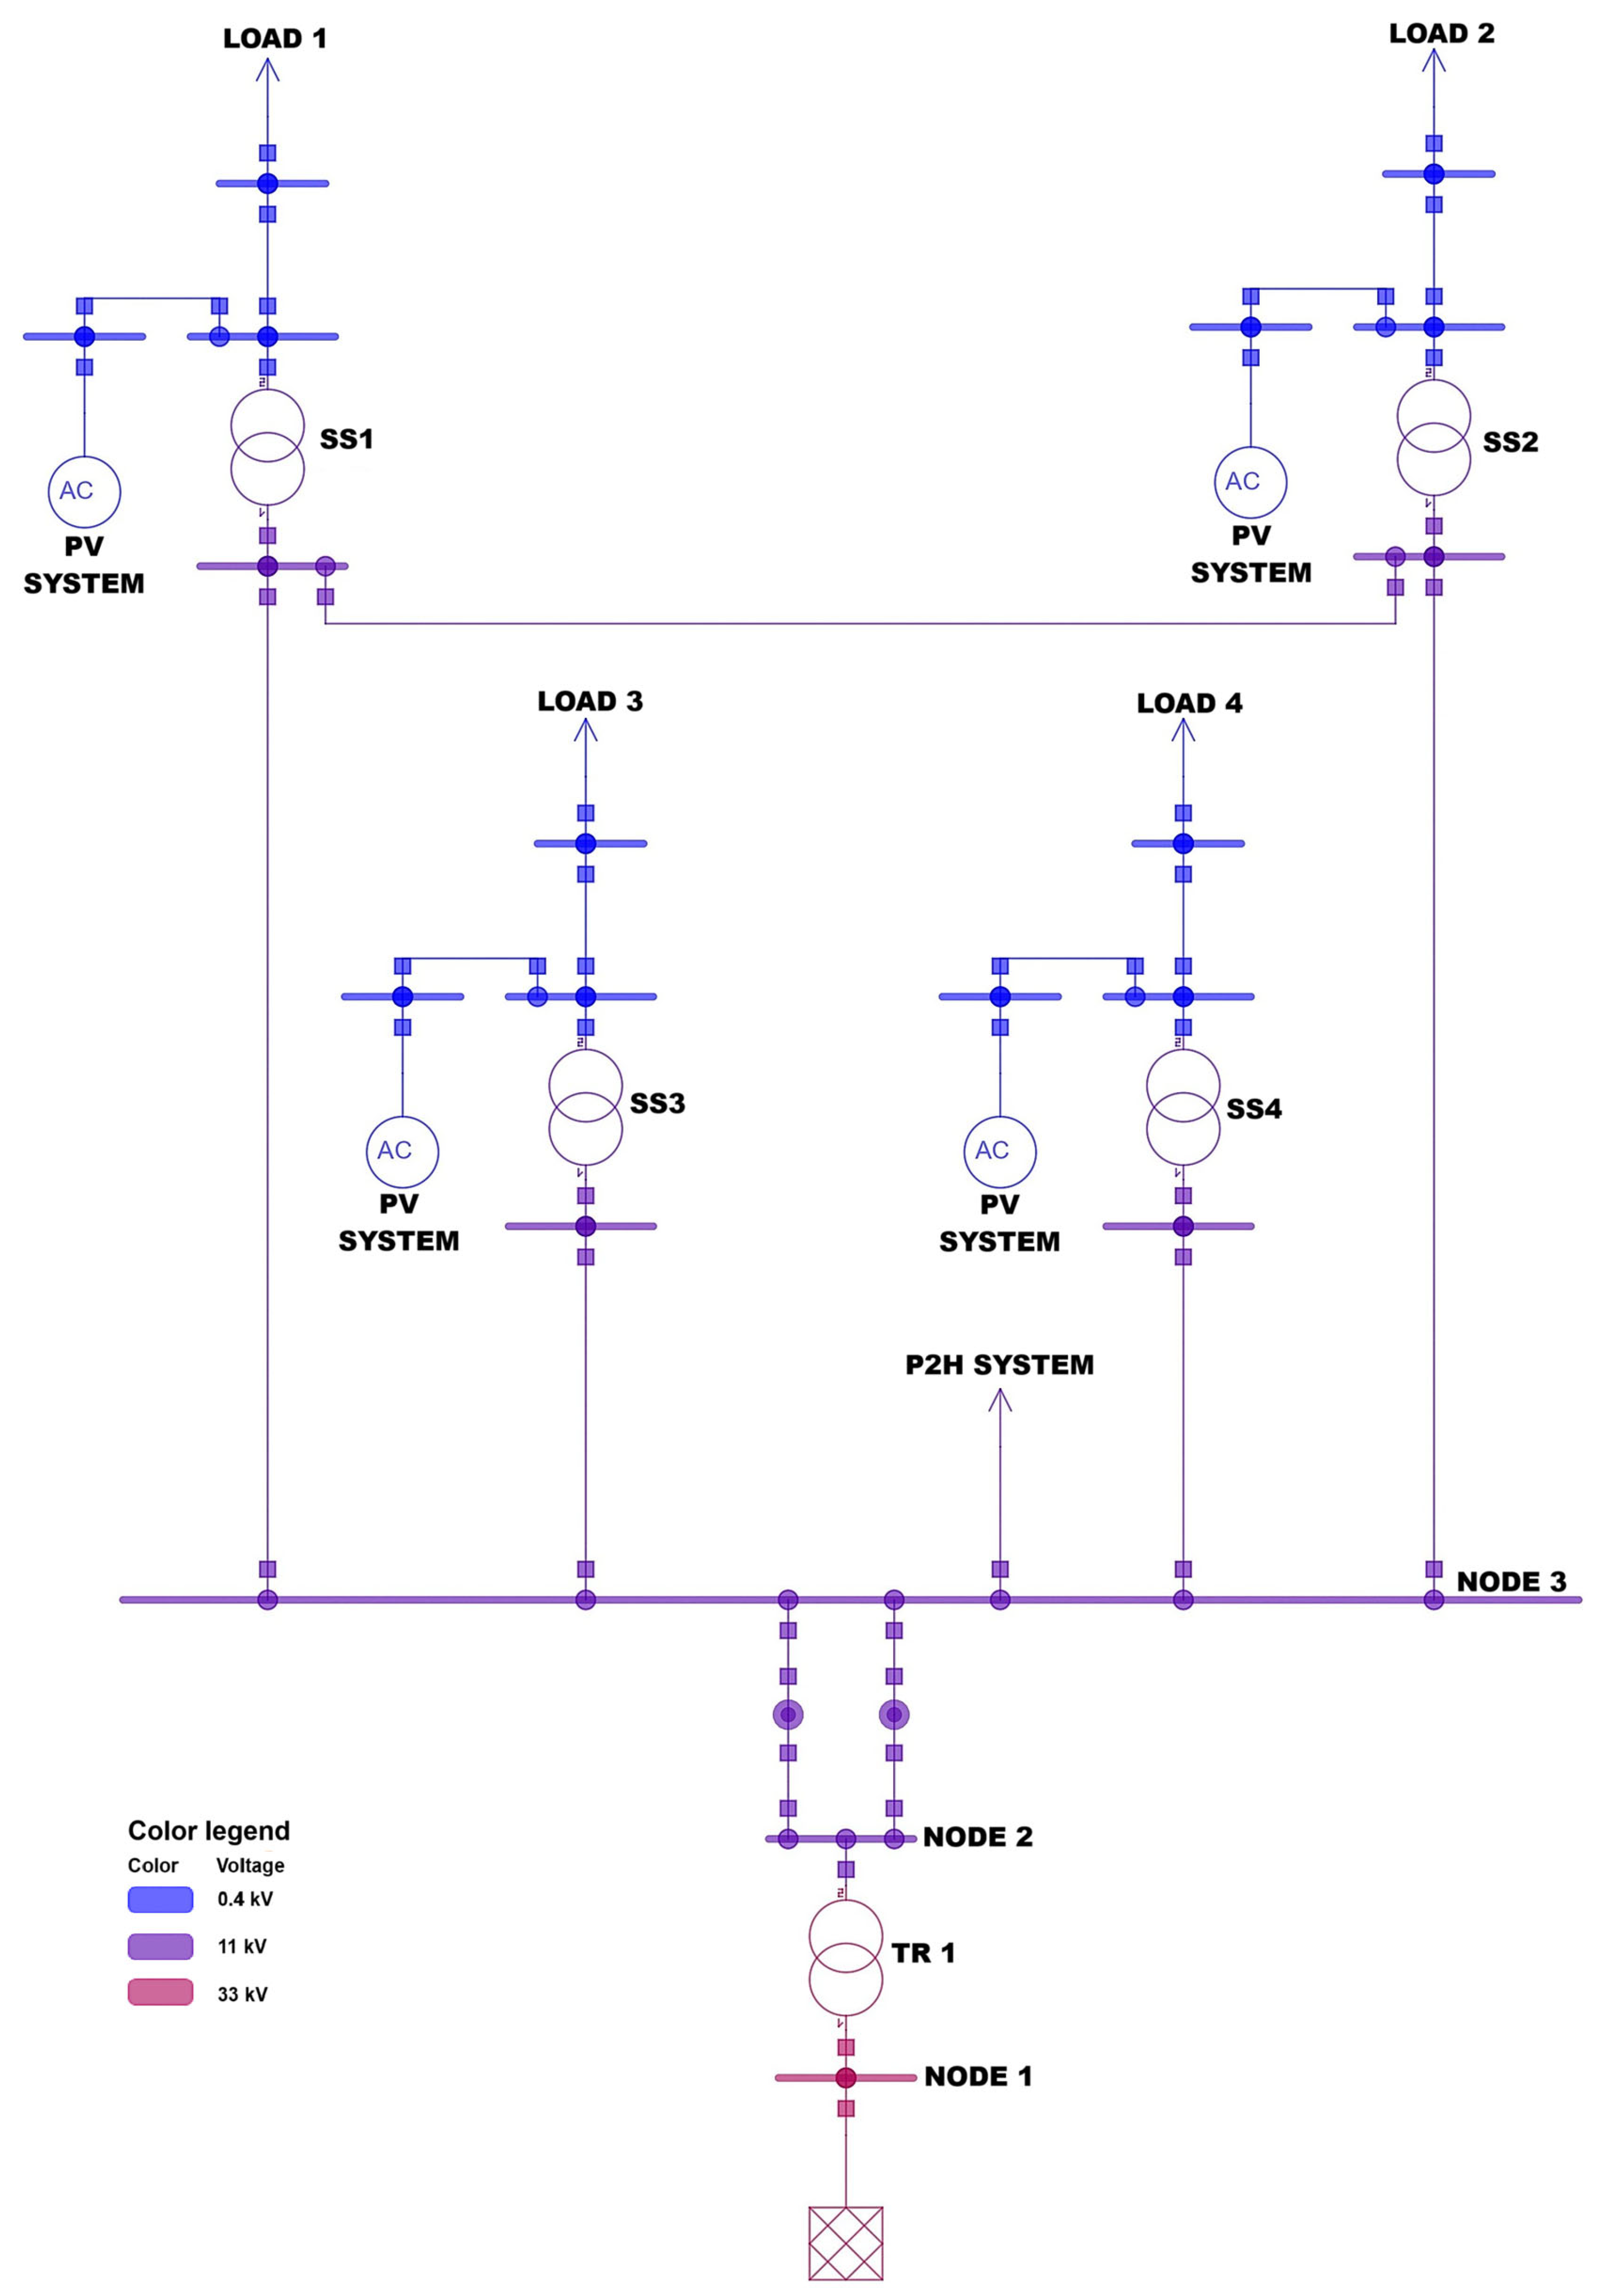
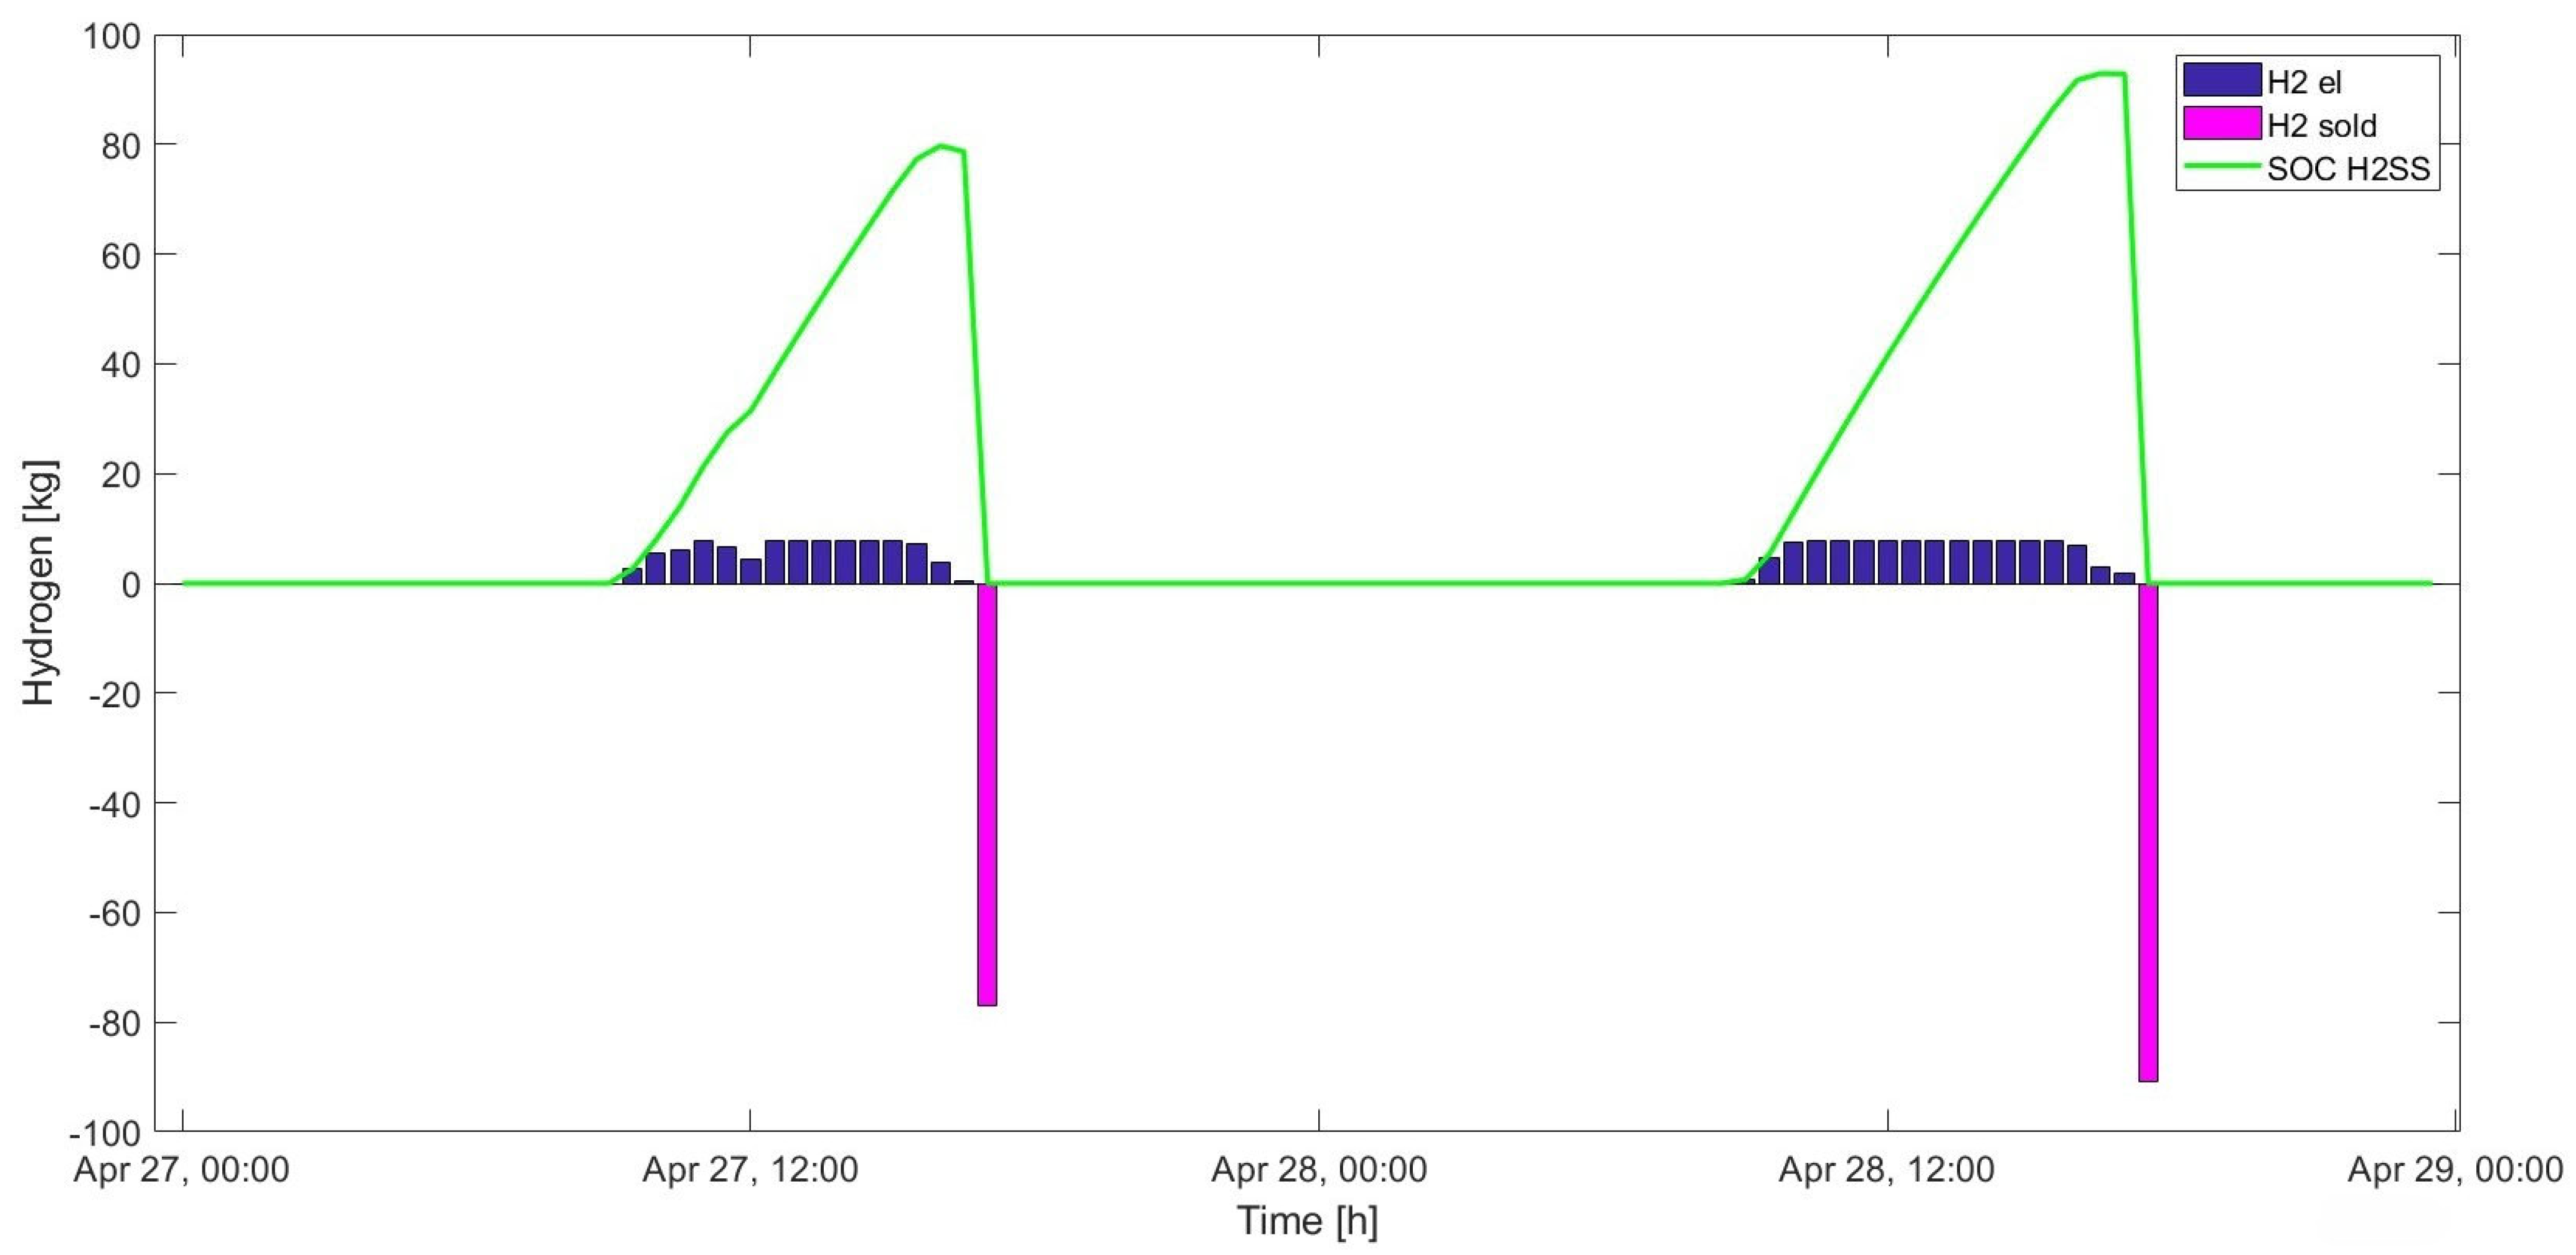
10] has been adopted, incorporating aspects such as the operational flexibility of the electrolysers and the possibility of selling the hydrogen produced. Specifically, the network under study is a medium-voltage industrial distribution network located in Malta that is subjected to reverse power flows deriving from the photovoltaic plants connected to it. To minimise the reverse energy flow, the installation of a Power-to-Hydrogen plant consisting of a PEM electrolyser, a gaseous hydrogen storage system and a fuel cell has been considered. Compared to studies found in the literature, this article proposes a sizing algorithm for the Power-to-Hydrogen system that not only minimises reverse power flows but also limits investment costs, while considering the revenues obtained from the sale of the hydrogen produced and the excess energy generated by photovoltaic systems. The study presented in this article also evaluates the benefits to the grid in terms of losses and voltage profiles, through load flow calculations performed using time series of real load and generation data from existing photovoltaic plants connected to the grid and the load profile of the Power-to-Hydrogen plant obtained from the optimisation algorithm. Below, in Section 2, the methodology and data used are presented in detail, both for the optimisation study and for the impact assessment on the grid; Section 3 presents the results obtained; finally, Section 4 discusses the results and conclusions.

2. Materials and Methods

2.1. Power-to-Hydrogen Plant Sizing

As anticipated in the introduction, the power distribution network considered in this study is a medium-voltage industrial distribution network located on the island of Malta. Specifically, it is a ring network, characterised by a nominal voltage of 11 kV, to which two photovoltaic plants of 1 MWp each are currently connected. However, to account for planned expansions, a total PV capacity of 4 MWp was considered in this study. For this scenario, by using load and power generation data from the existing PV plants collected every thirty minutes via smart metres connected to the grid for the period October 2023 to October 2024, the annual net load diagram shown in Figure 2 was developed. In detail, the energy consumption data were downloaded from the electricity billing meter provided by E-distribuzione (Rome, Italy), while for the production data of the photovoltaic systems, generated by Sungrow SG110CX model PV inverters, the iSolarCloud platform, provided by Sungrow itself (Hefei, China), was used.
As can be observed from Figure 2, there are several times of the year in which the net load demand takes on negative values, since PV production exceeds local demand, giving rise to reverse power flows. An installation of a Power-to-Hydrogen system (P2H system) consisting of an electrolyser, a compressed hydrogen storage system and a fuel cell for the eventual conversion of hydrogen to electricity was considered to minimise reverse power flow. The presence of the fuel cell would allow the plant to operate in a similar way to a battery storage system, which has already been evaluated for the Maltese grid in previous studies [14].
To determine the optimal size of the plant components, we used the energy hub model shown in Figure 3 and reported in [15], with a different model of hydrogen gas storage. The difference in this work is the fact that modular hydrogen storage with tanks of 5 kg is considered to make the gas commercialization more suitable for the context of the island of Malta. Indeed, the island has an economy based mainly on the tertiary sector; there are no large industries or refineries where hydrogen can be used, so there will be no need for mass hydrogen storage and sale, to be transported by tanker trucks. Instead, the potential future uses of hydrogen in Malta are in the residential and transportation sectors, for which smaller tanks are more appropriate.
The power-flow-balancing equation for the energy hub adopted in this study is as follows:
E i n t E R P F t + E P V t + E f c t = E d e m t + E e l ( t )
where
  • E i n ( t ) is electricity drawn from the grid;
  • E R P F ( t ) is the energy associated with reverse power flows;
  • E P V t is the total electricity produced by photovoltaic systems;
  • E f c ( t ) is the electricity obtained from the fuel cell;
  • E d e m ( t ) is the electricity demand of users;
  • E e l ( t ) is the electricity that feeds the electrolyser;
The difference between demand and PV energy production is the net load demand, which is the known term of the equation.
For hydrogen, the following balancing equation can be written:
H 2   o u t t = H 2   f c t + H 2   s o l d t  
in which
  • H 2   o u t t is the flow of hydrogen out of the storage system;
  • H 2   f c t is the flow of hydrogen sent to the fuel cell to be converted back into electricity;
  • H 2   s o l d t is the flow of hydrogen that is sold.
For each component of the energy hub there are, in addition, equality and inequality constraints to describe their behaviour as given below.

2.1.1. Electrolyzer

The electrolysis technology chosen for the case study is Proton Exchange Membrane (PEM) technology. This type of electrolyser, while costing more for the same efficiency (50–68%) than alkaline electrolysers, has the advantage of a wider operating spectrum. While the lower operating limit for alkaline electrolysers is, in fact, equal to 20% of their rated capacity, PEM technology can go as low as 5%; furthermore, a PEM electrolyser can operate beyond its rated capacity (up to 130% [16]), which is not possible for alkaline electrolysers [17].
These characteristics, together with slightly higher ramp rates than alkaline technology [17], make PEM electrolysers particularly suitable for coupling with intermittent power sources such as renewable ones. In this regard, PEM technology has been shown to be able to withstand even extreme ramp events by being able to respond to a power change of +80% and −100% within 1 s [18], so transients can be neglected. This aspect fits well with the type of mathematical model used in this study for the optimal sizing of the P2H system, which is based on the concept of energy hub. In fact, for solving energy hub optimisation problems, the simplifying assumption of considering the system to be in a steady state, which is reached after all transients have died out, is commonly assumed [11].
Furthermore, although the efficiency of an electrolyser is not entirely constant, especially in the long term due to degradation phenomena, in this study it is assumed to be constant. This simplification, inherent in the concept of an energy hub, is already well established in the literature and allows the mathematical model to remain linear [11,19].
The equality and inequality constraints that describe the electrical behaviour of the electrolyser are as follows:
  H 2   e l ( t ) = E e l   ( t ) ·   k e l e   e h 2
E e l   ( t ) 1.3 · S e l · 0.5
where
  • H 2   e l ( t ) is the flow of hydrogen produced by the electrolyser [kg];
  • k e l e   e h 2 is the conversion efficiency of the electrolysis process [kg/kWh];
  • S e l is the size of the electrolyser to be determined [kW].
The operating limit of the electrolyser was obtained in Equation (4) by multiplying the size by 1.3, as it can operate up to 130% of its capacity, and by 0.5 to change the data from kW to kWh because the load data provided were logged every half hour.

2.1.2. Hydrogen Storage System

The storage system considered consists of several tanks with a capacity of 5 kg of hydrogen each. For such a system, we have the following constraints:
S O C H 2 S S t + 1 = S O C H 2 S S t · 1 H 2   l o s s + H 2   e l t + 1 · k c h H 2   o u t t + 1 k d i s c h
S O C H 2 S S 1 = S O C H 2 S S ( T )  
H 2   e l   ( t ) δ c h ( t ) · Q c h
H 2   o u t t δ d i s c h t · Q d i s c h
δ c h t + δ d i s c h t 1  
S O C H 2 S S t n H 2 S S · 5   k g
H 2   e l t n H 2 S S · 5   k g    
    H 2   o u t t n H 2 S S · 5   k g
where
  • S O C H 2 S S ( t ) is the state of charge of the storage system [kg];
  • δ c h ( t ) is a variable that takes unit value when the storage system is charging, 0 when it is not charging;
  • δ d i s c h ( t ) is a variable that takes unit value when the storage system is discharging, 0 when it is not discharging;
  • Q c h and Q d i s c h are finite upper limits to the hydrogen entering and leaving the tanks;
  • n H 2 S S is the number of 5 kg tanks that make up the storage system.

2.1.3. Fuel Cell

The constraints describing the operation of the fuel cell are as follows:
    E   f c ( t ) = H 2   f c   ( t ) ·   k f c   h 2 e
    E   f c ( t ) S f c   · 0.5
where
  • k f c   h 2 e is the conversion efficiency [kWh/kg];
  • S f c is the size of the fuel cell [kW].
Similar to the electrolyser, to obtain the upper limit of the electrical energy produced by the fuel cell, the size, expressed in kW, was multiplied by 0.5.

2.1.4. Objective Functions

The optimisation problem was solved first based on a single objective function, which is the minimization of inverse power flows (Equation (15)).
m i n t = 1 T E R P F ( t )
Subsequently, a multi-objective optimisation calculation was performed, considering economic aspects such as the investment costs for the P2H system and the revenue obtainable from the sale of hydrogen and excess energy produced by the photovoltaic plants. Costs were determined through the following equation:
t = 1 T E i n t · C E H 2   s o l d t · R e v H 2 E R P F t · R e v E + C C A P E X   e l · S e l + C C A P E X   H 2 S S · n H 2 S S · 5   +   C C A P E X   f c · S f c
where
  • T is the end of the period considered (October 2023–October 2024);
  • C E is the cost of electricity [EUR/kWh];
  • R e v H 2 is selling price of hydrogen produced [EUR/kg];
  • R e v E is selling price of excess energy produced by PV plants;
  • C C A P E X   e l is the electrolyser purchase cost [EUR/kW];
  • C C A P E X   H 2 S S is the hydrogen storage system purchase cost [EUR/kg];
  • C C A P E X   f c is the fuel cell purchase cost [EUR/kW];
For the multi-objective optimisation, the scalarization technique, already used in similar studies [19], was adopted, which consists of transforming a multi-objective optimisation problem into a single-objective optimisation problem by normalising the objective functions and minimising their weighted sum.
To reach a technical-economic compromise, equal weight (50%) was assigned to both functions. As for the normalisation factors, however, these were chosen equal to 106 for the function that minimises costs and 105 for the function that minimises reverse power flows; these values are equal to the order of magnitude of costs, in euros, and the order of magnitude of energy, in kWh, associated with annual reverse power flows, respectively.
All equations and inequalities describing the operation of the various components of the energy hub and the energy and mass flows, as well as the objective functions, are linear. This ensures the uniqueness of the optimal solutions found [19], while reducing computational complexity [10], unlike nonlinear models. Furthermore, given the presence of integer variables, such as the binary variables necessary to represent the actual operation of the compressed hydrogen storage system and synthesis variables such as the number of hydrogen tanks and the sizes of the electrolyser and fuel cell, the model adopted is of the MILP (Mixed Integer Linear Programming) type.
The equality and inequality constraints of the model just described were implemented in matrix form in a MATLAB code:
A e q · x = b e q
A · x b
where
  • A e q is the matrix that contains the coefficients of the equations;
  • x is the vector that contains the unknowns of the problem;
  • b e q is the vector that contains the known terms of the equations;
  • A is the matrix that contains the coefficients of the inequality constraints;
  • b is the vector that contains the known terms of the inequality constraints;
The problem variables, contained in the vector x that is obtained as the output of the optimisation code, are given below:
x = E i n t ,   E R P F t , E e l t , S O C H 2 S S t , H 2   o u t t , H 2   f c t , H 2   s o l d t , δ c h t , δ d i s c h t , S e l , n H 2 S S , S f c
In the MATLAB code, two vectors containing the lower and upper limits for the different variables of the problem were defined; the lower limits were set to 0 and the upper limits to infinity, with the exception of the variables δ c h and δ d i s c h , for which the upper limit is unitary. Furthermore, because the purpose of the P2H system in this case is only to reduce reverse power flows, without taking additional electricity from the grid for hydrogen production, the energy currently needed to meet end-user demand Ein 0 was set as the upper limit to the input electricity Ein. The ‘intlinprog’ function available in MATLAB was used to solve the optimisation problem, as it is compatible with MILP mathematical models such as the one adopted in this study.
Below, in Table 1, are the values of all the coefficients seen so far in the equations and inequalities employed in the optimisation code.

2.2. Impact on the Grid

To determine the impact that the previously sized P2H system has on the power grid under study, the grid model, shown in Figure 4, was implemented in NEPLAN 360 software. The ring distribution network at a voltage of 11 kV is connected to the 33 kV main grid via a transformer of 5 MVA (TR 1), the parameters of which are given in Table 2.
The ring network is connected to the transformer by two parallel cables. Each cable consists of the junction of two cables of different types, the data of which are given in Table 3.
The cables that make up the ring are characterised by a resistance of 0.168 Ω/km, a reactance of 0.0809 Ω/km, a capacitance of 0.8004 μF/km, and a maximum rated current of 300 A. Table 4 shows the lengths of the various sections.
Each substation has a transformer whose characteristics are shown in Table 5.
PV systems are connected to substation transformers through three parallel cables, the characteristics of which are shown below, in Table 6.
Finally, the loads powered by the four substations are connected to them via 50-metre-long line cables, whose parameters are the same as those of the cables connecting the photovoltaic systems to the substations, except for the number of cables in parallel, which are shown in Table 7.
Photovoltaic systems were implemented in NEPLAN as AC disperse generators, fixing the value of active power produced. They were assumed as PQ elements, as in the case of loads. The 33 kV external grid, on the other hand, was assumed as the SL node (slack node), i.e., as a reference node.
Load flow calculations were performed using the Load Flow Time Simulation module, which uses measured time series of load and generation profiles [24]. The load and generation profiles of the photovoltaic systems imported into the software are those obtained from data measured by the smart metres connected to them, while the load profile of the P2H system is that obtained by the optimisation algorithm.

3. Results

3.1. Optimisation Algorithm Results

3.1.1. Single Objective Optimisation

The results obtained in terms of component size, in the case of the single-objective optimisation that minimises reverse power flows, are shown in Table 8, in which the CAPEX associated with the various plant components are also reported.
The obtained solution allows reverse power flows to be cancelled out, converting them into 5389.14 kg of hydrogen, of which 83.47% is sold, while 16.53% is fed back to network through the fuel cell.
The investment cost is very high, amounting to more than EUR 4.5 million. The breakdown of investment costs for the components, in percentage terms, is shown in Figure 5.
As can be seen, the largest investment is required for the electrolyser, followed by the fuel cell, which accounts for more than a quarter of the investment.
However, the simulation results show that the fuel cell provides a total of 9.49 MWh over the entire period considered, covering only 0.04% of the user’s energy needs. Therefore, its installation does not seem to be very convenient, both from an economic and technical point of view.

3.1.2. Multi Objective Optimisation

The obtained solution, in terms of component sizes and related CAPEX for the multi-objective optimisation case, is shown in Table 9.
The solution found in this case makes it possible to reduce reverse energy flows by 81.61%, from the current estimated 336.82 MWh to 61.94 MWh, while at the same time producing 4398 kg of green hydrogen in the year considered. Electricity taken from the grid, on the other hand, remains unchanged, since the optimal techno-economic trade-off solution does not include the installation of a fuel cell to cover part of the demand. The investment, in this case, amounts to EUR 1.38 million, which is almost entirely attributed to the electrolyser, as shown in Figure 6.
Figure 7 and Figure 8 show the state of charge of hydrogen storage and the flows of hydrogen into and out of the storage for the entire year under consideration, respectively. A detailed plot of this data for two typical days is shown in Figure 9.
As can be seen from Figure 9, hydrogen is produced and stored during the day, when the reverse power flows occur, and then sold at the end of the day. It can be used in combination with methane in the island’s power plant turbines, reducing dependence on imported natural gas, or in the transport sector, with a view to a future hydrogen-powered mobility scenario. If the fuel produced exceeds local demand, it could potentially be exported to Sicily, using the hydrogen-ready natural gas pipeline that the Maltese government plans to build between Malta and Gela [25].
Finally, Figure 10 compares the full-year reverse power flows in the scenario without the P2H system and in the optimised scenario with the P2H system. The same comparison for two typical days is shown in detail in Figure 11.
It can be observed that the P2H system manages to half the reverse power peaks in both days.

3.2. Impact on the Grid Results

The plant sized through the multi-objective optimisation was used to assess the impact it has on the network. Load flow calculations were performed for the day when the maximum reverse power flows were observed.
The energy losses in the system without the P2H system during the day amount to 1.24 MWh. In the scenario where the P2H system is present, however, the losses amount to 1.18 MWh, i.e., 4.66% less.
The portion of the network that is affected by the presence of the electrolyser is between Node 1 and Node 3, where excess power flows would be completely reversed in the absence of the electrolyser. Figure 12 and Figure 13 below show the active power losses in the two feeders that supply the ring network, located between Node 2 and Node 3, and the active power losses in the upstream transformer, which connects the 11 kV network to the external 33 kV network.
The presence of the P2H system allows, on the day considered, a reduction in energy losses in the ring network feeders of 29.25% and in the upstream transformer of 17.32%, thanks to the lower amount of reverse power flows passing through them.
In terms of the voltage profiles in nodes 2 and 3, the improvements are those shown in Figure 14 and Figure 15, respectively.
Although excess production by photovoltaic systems does not cause an excessive increase in voltage at the nodes compared to the nominal value of 11 kV, the installation of the Power-to-Hydrogen system still allows for a reduction in voltage peaks throughout the day.

4. Discussion of Results and Conclusions

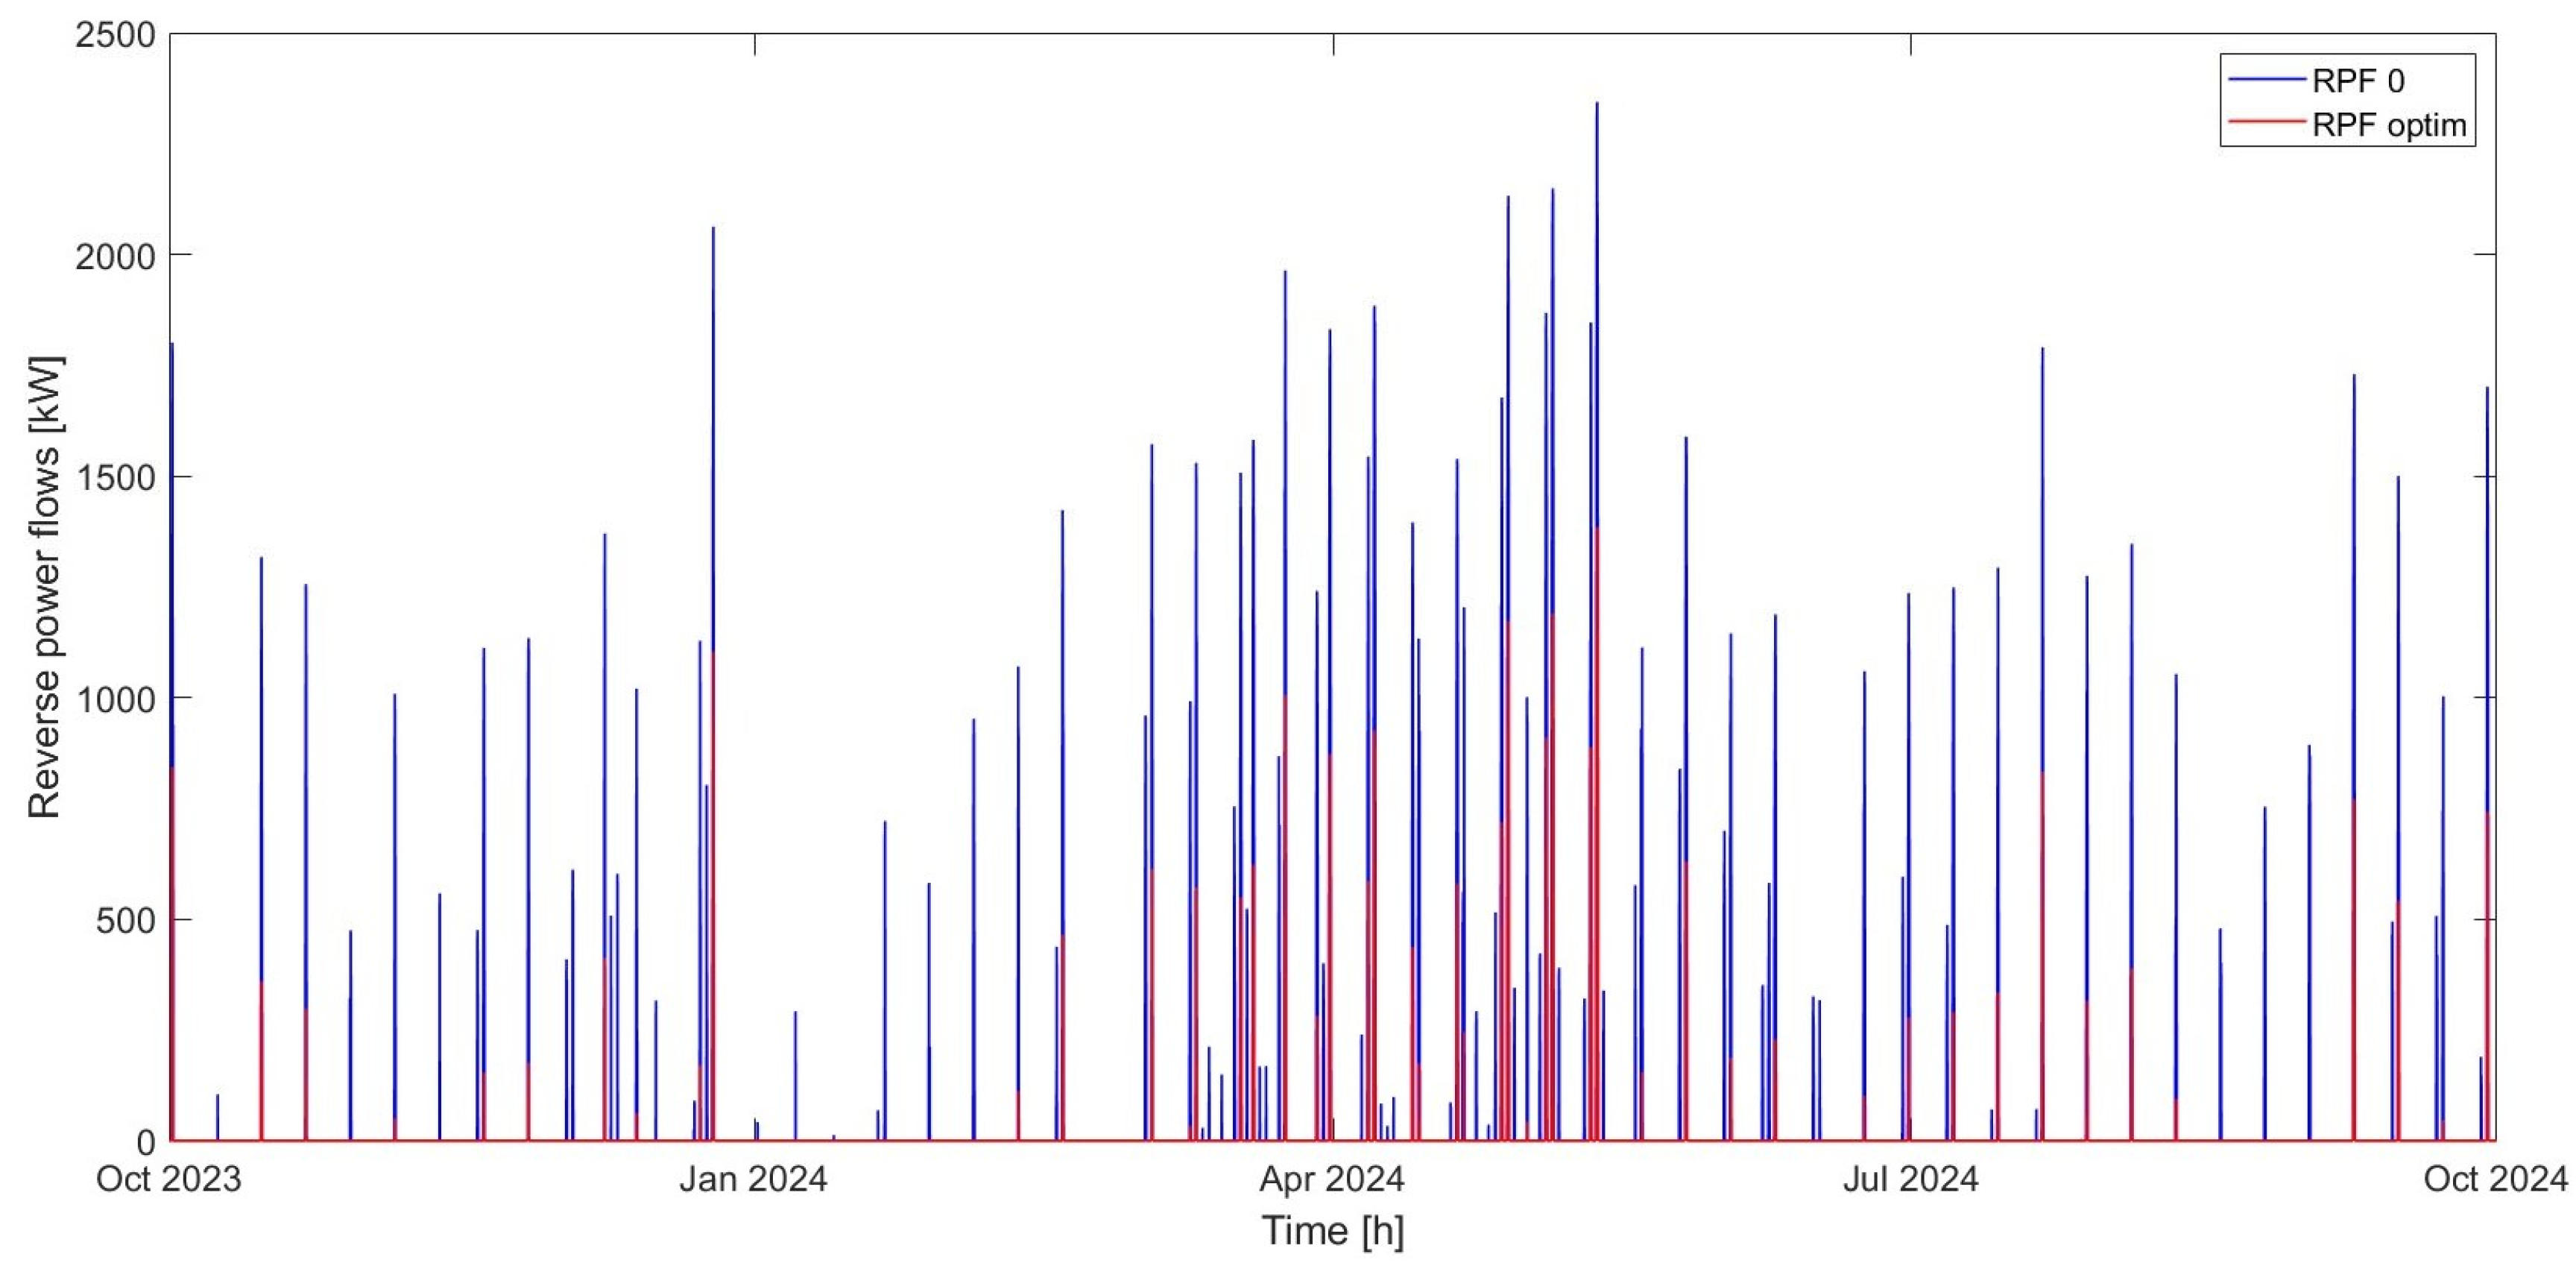
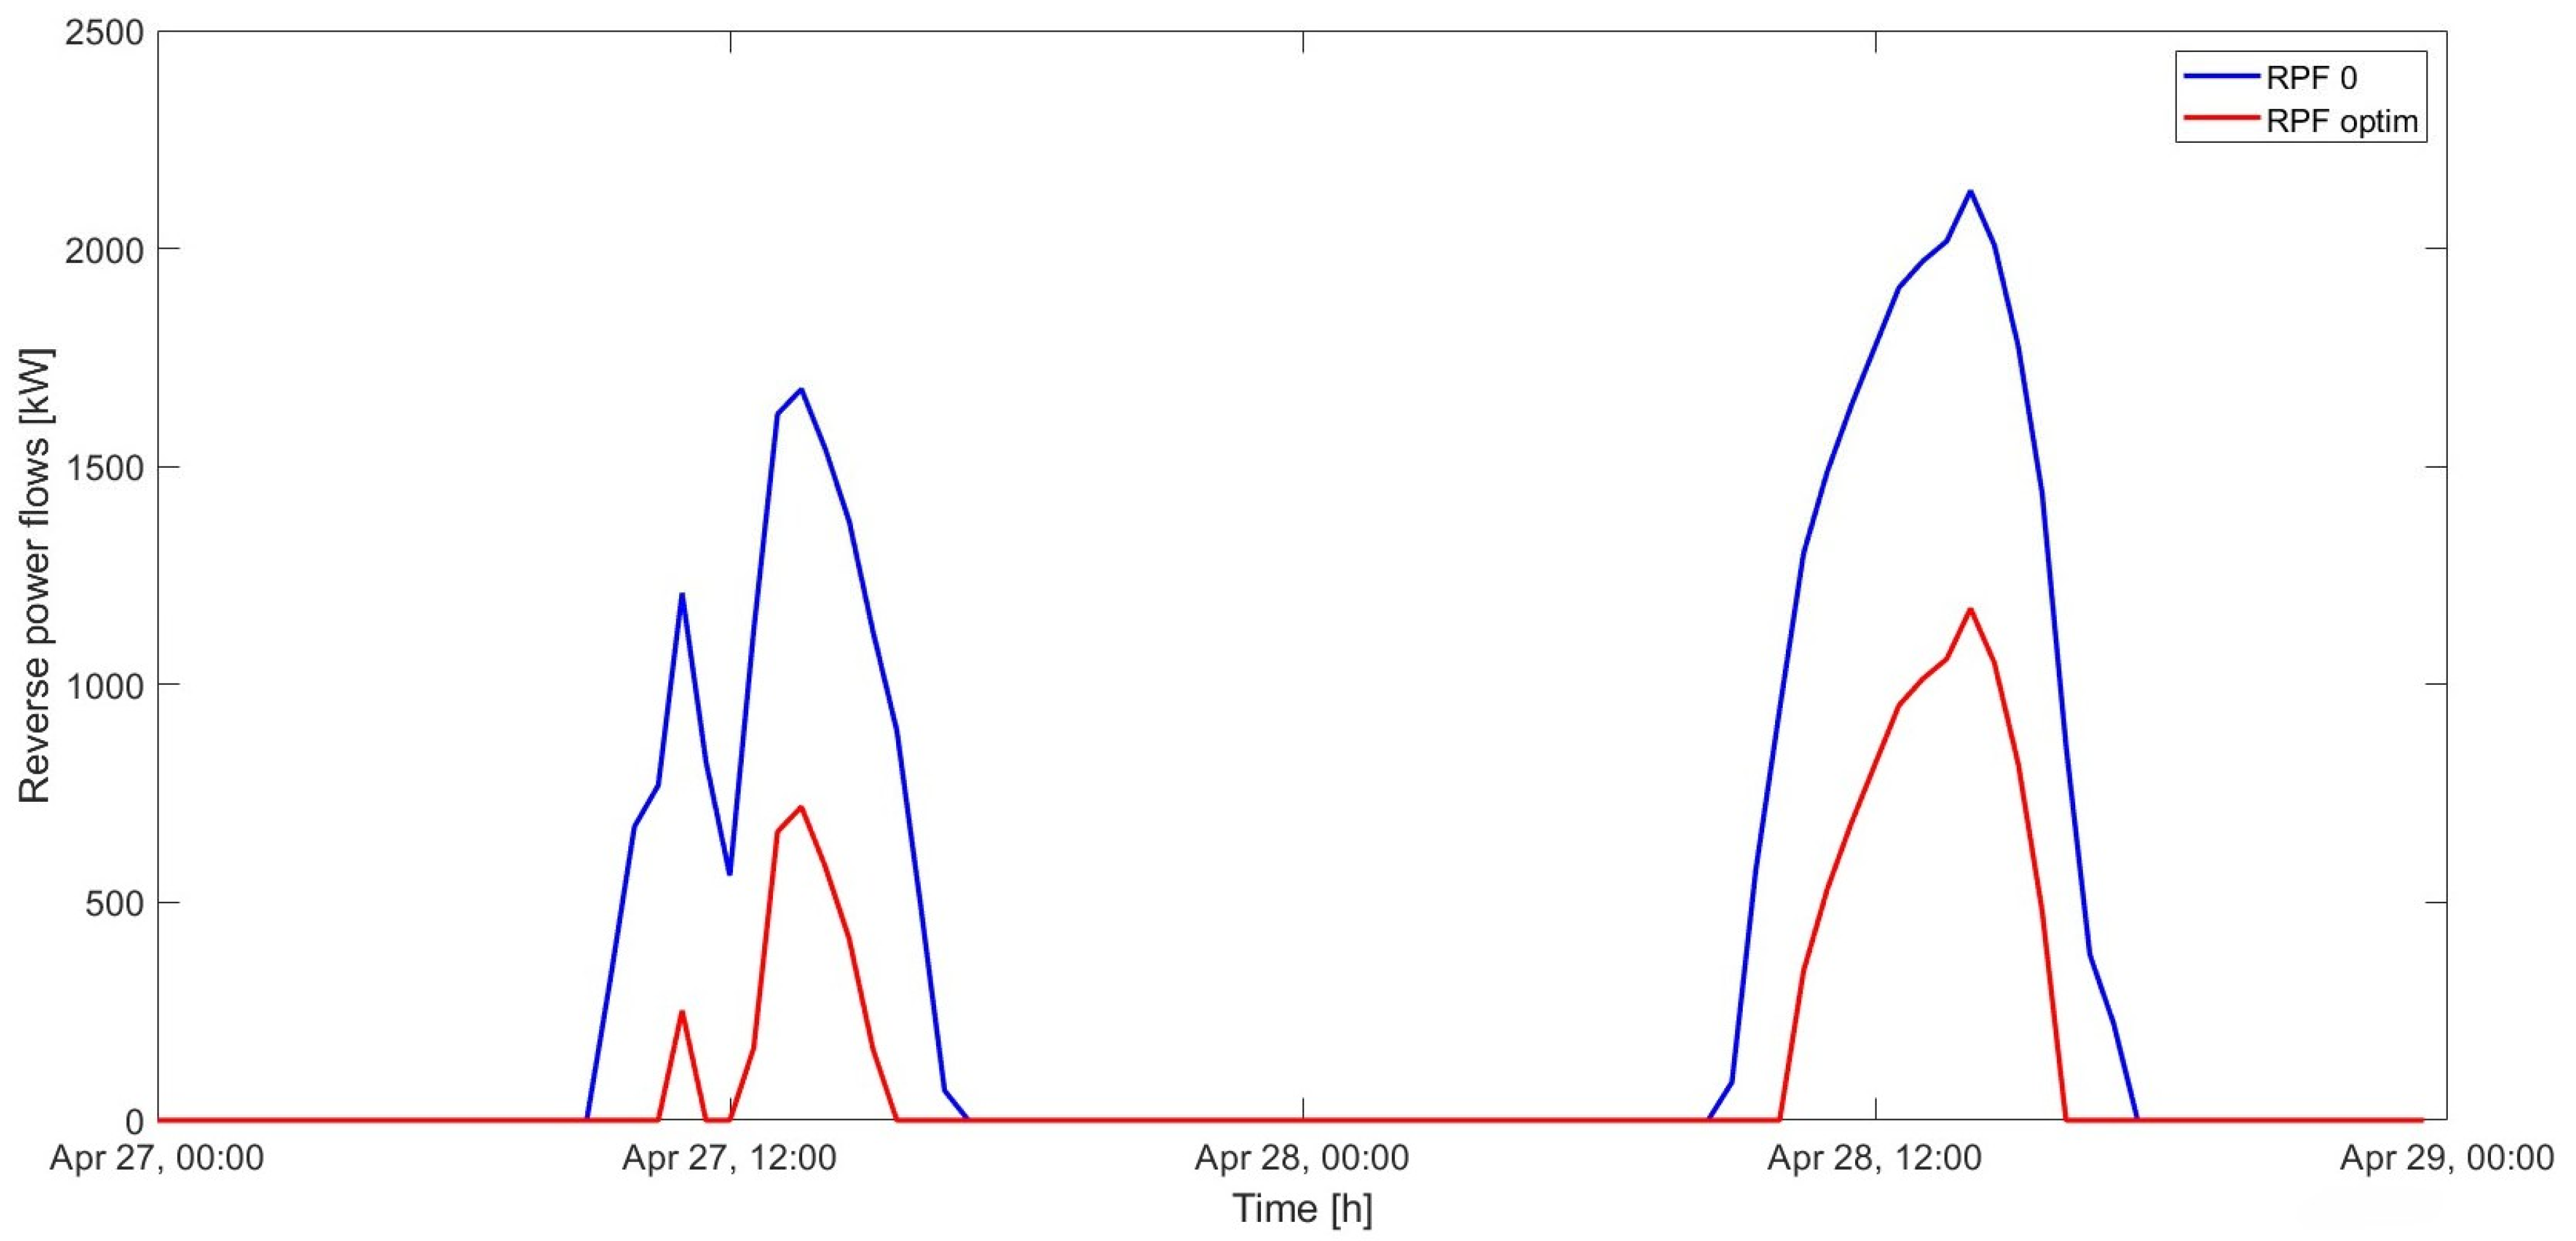
The increase in the installation of electricity generation plants using non-programmable renewable sources is causing a significant challenge for the proper management of networks, including reverse power flows, which can lead to voltage increases, transformer overheating, and malfunctions in line protection systems. This study shares the findings from a case study conducted on a 11 kV medium-voltage industrial grid in Malta, which will be subject to the expansion of the photovoltaic plants currently installed. After evaluating the reverse power flows that will occur because of these expansions, this study proposes an optimal sizing method for a Power-to-Hydrogen plant that will exploit the excess energy produced by photovoltaic plants to produce green hydrogen, while also providing support to the grid.
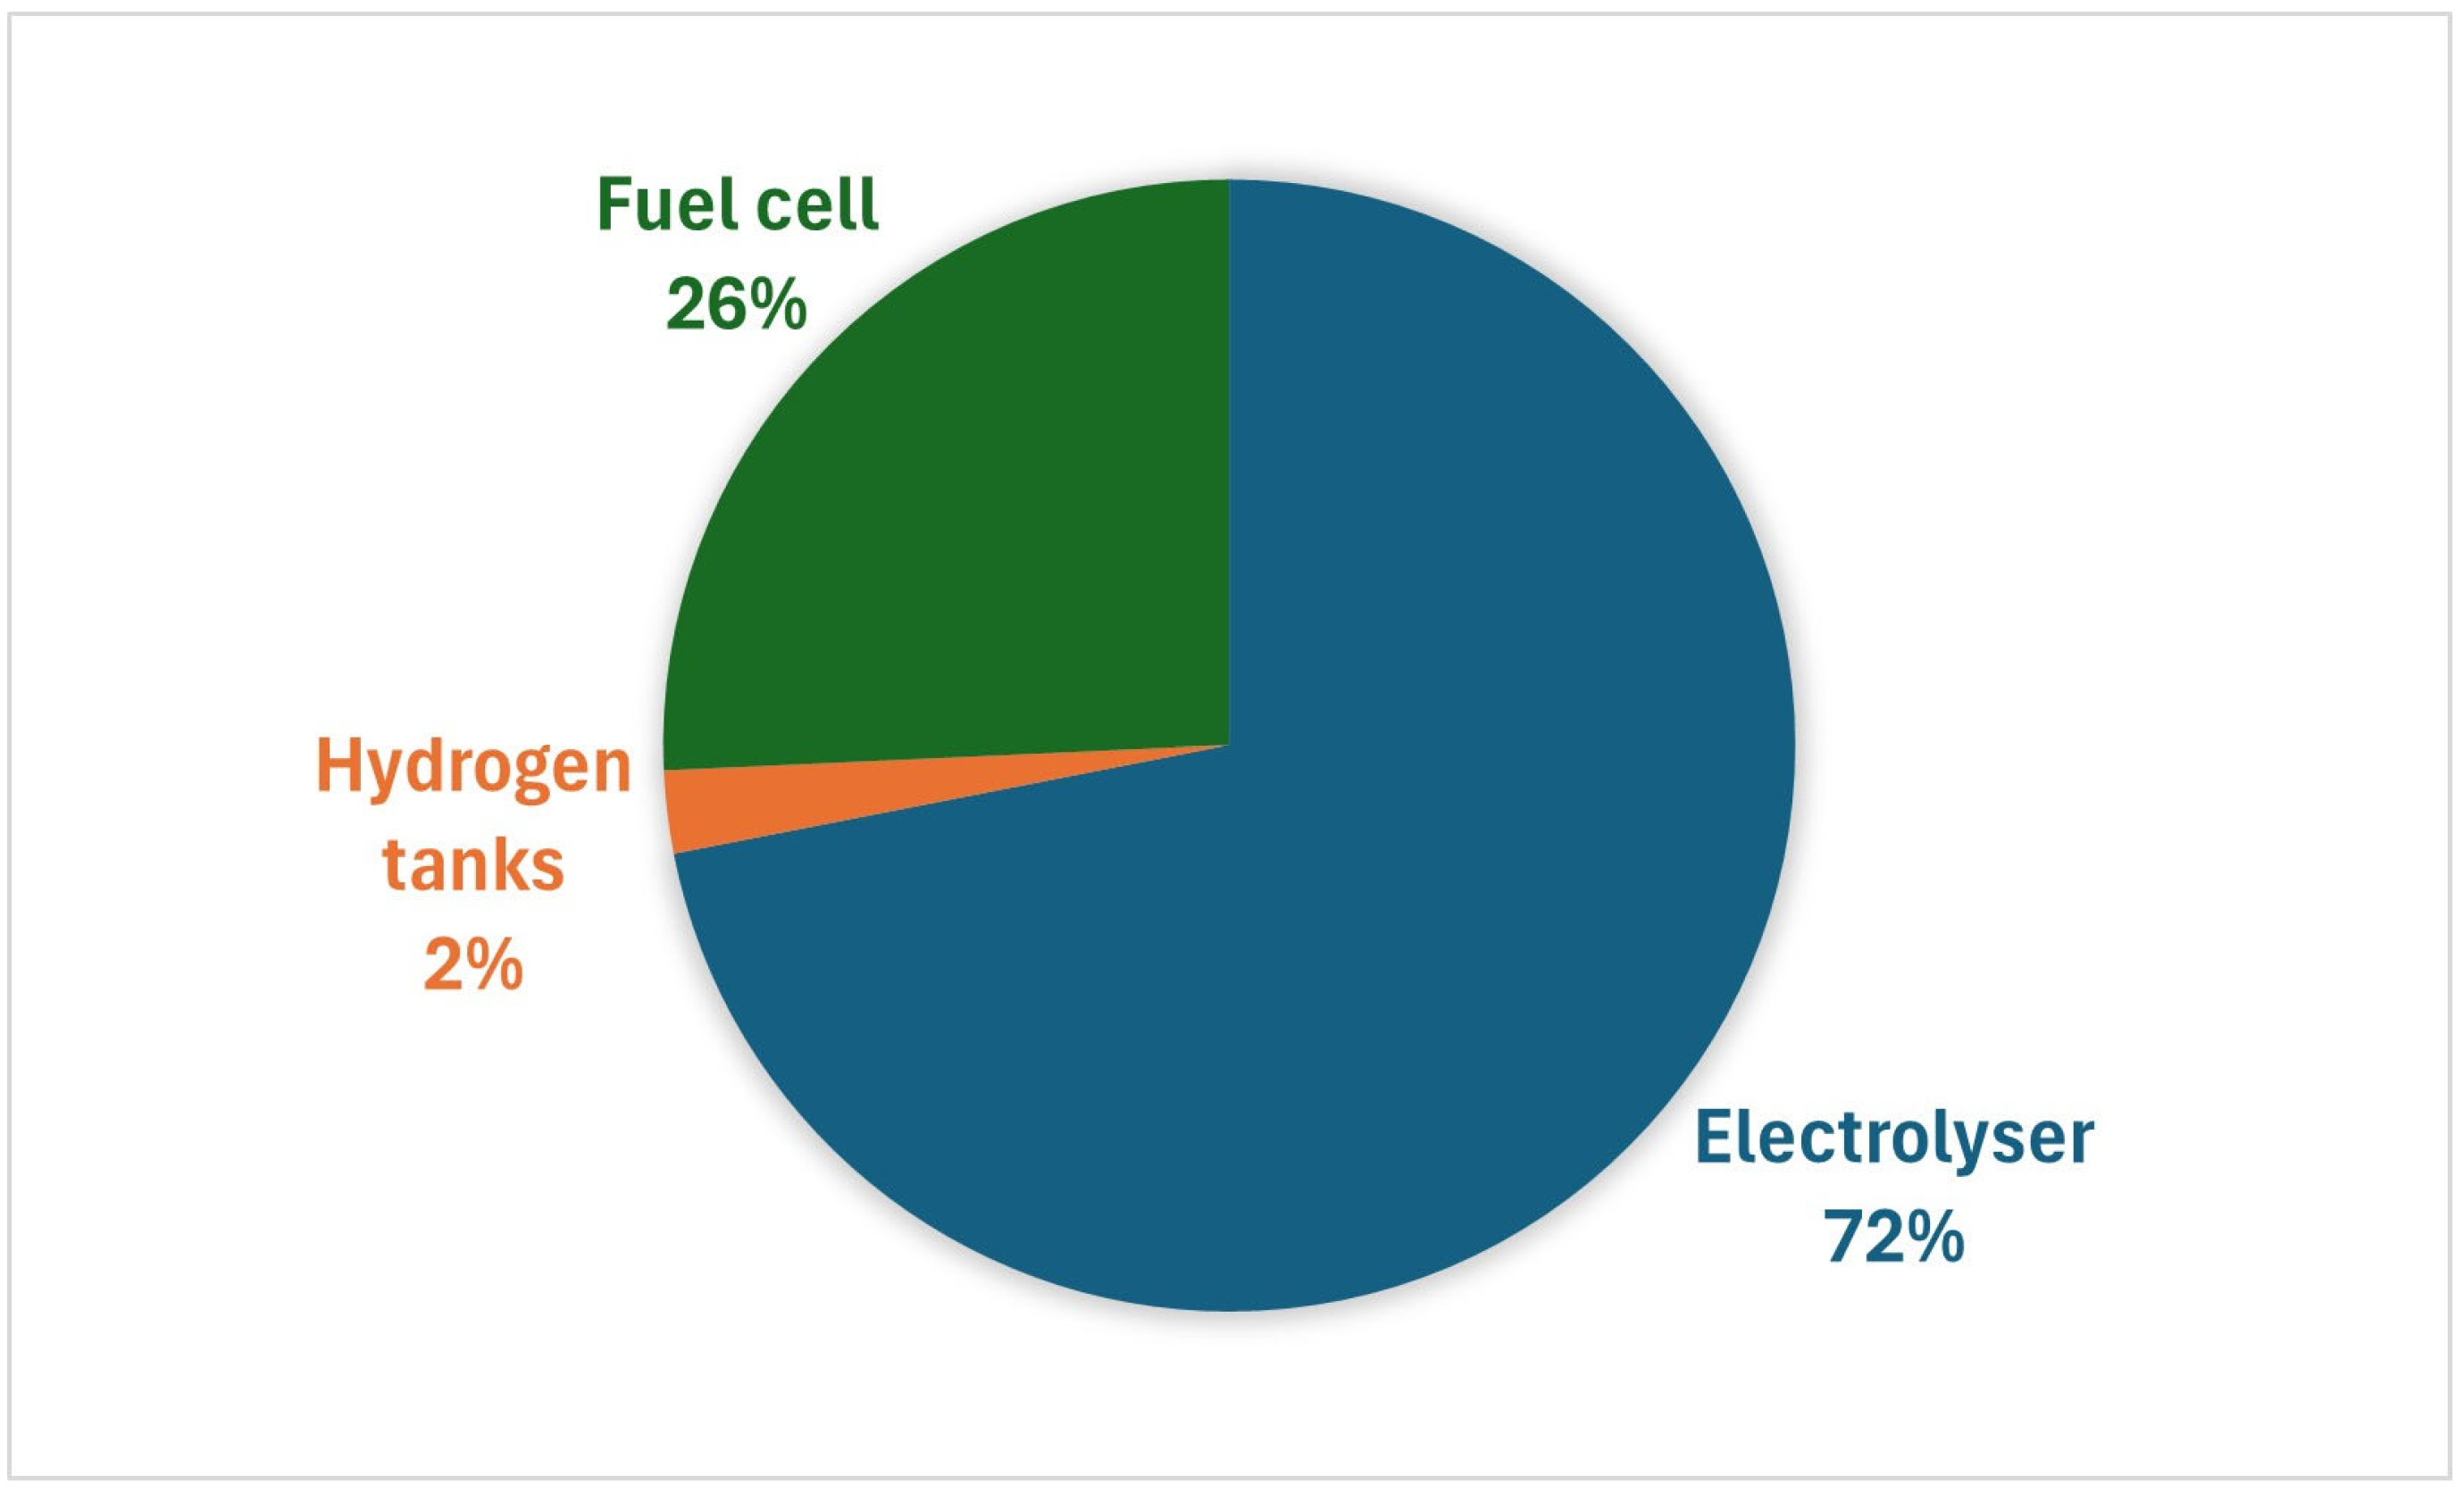
The plant was initially sized by solving a single-objective optimisation problem, which aims to minimise reverse power flows. This solution allows the excess energy to be totally converted into hydrogen, but involves excessive expenditure, especially for the installation of the fuel cell, which will only provide 0.04% of the energy required on site by users. Its integration is therefore not very convenient, both from a technical and economic point of view. The Power-to-Hydrogen system was therefore redesigned using a multi-objective optimisation code, with the aim of finding a technical–economic compromise. Both optimisation problems were solved in MATLAB.
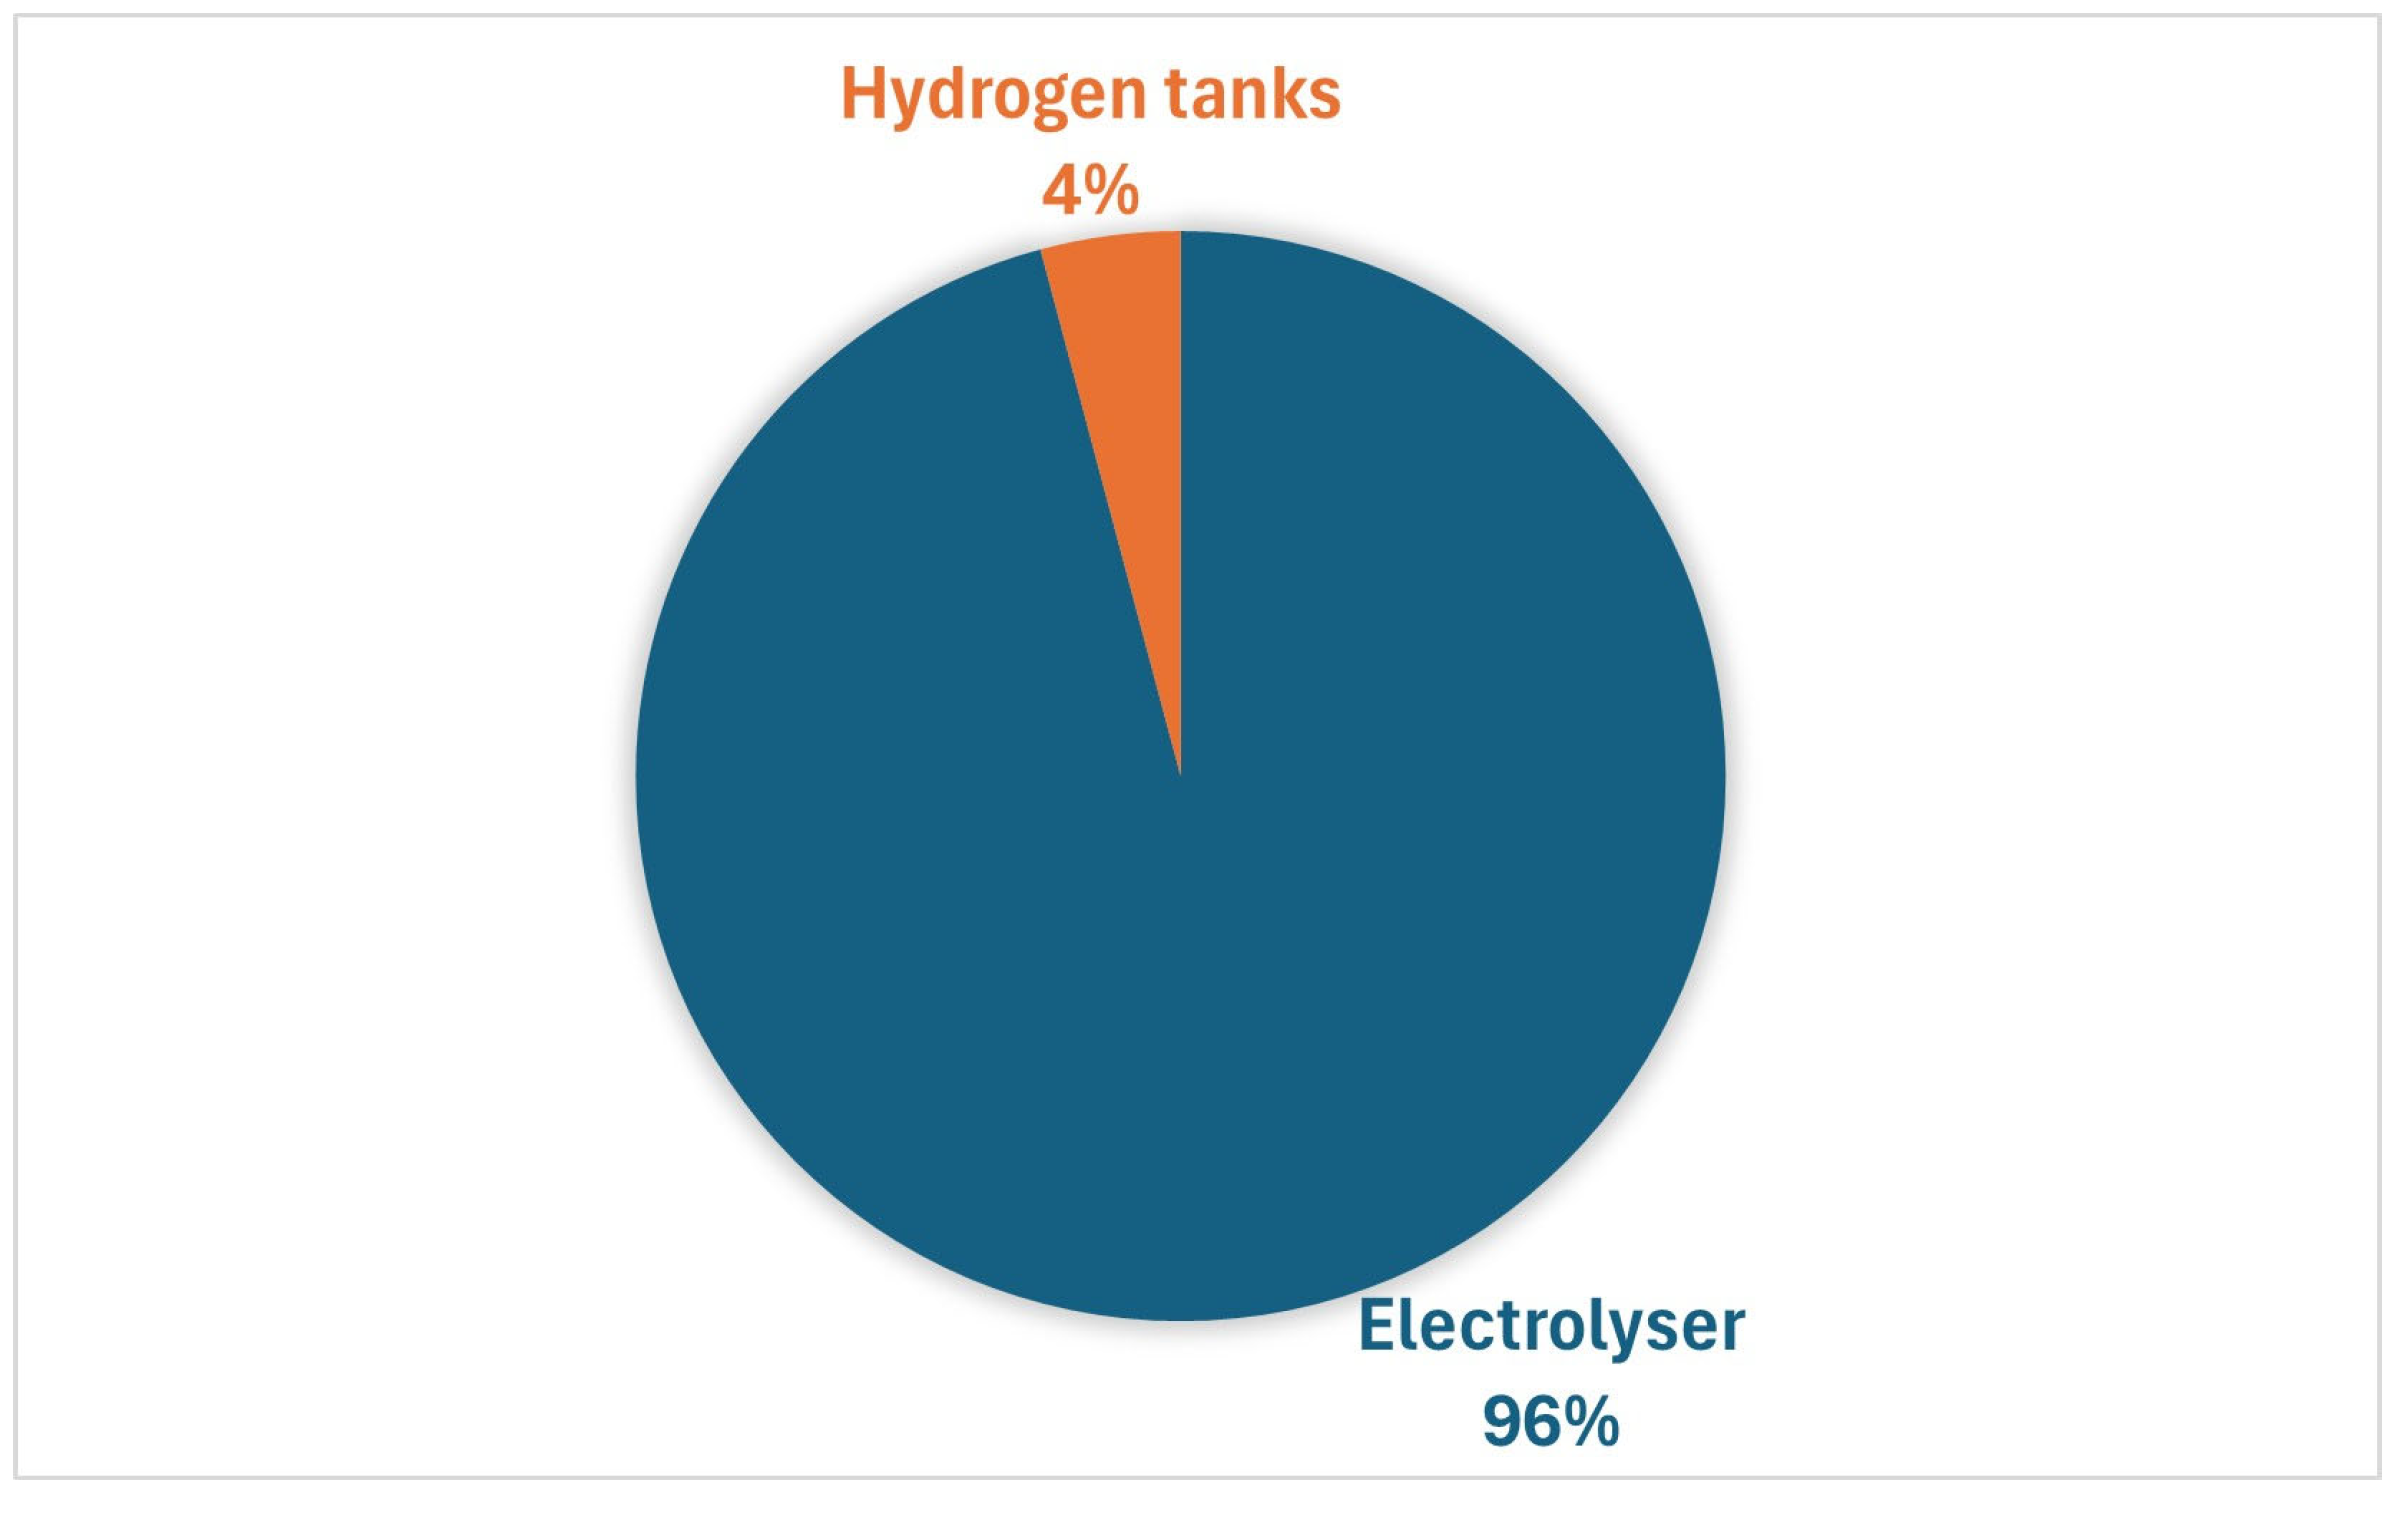
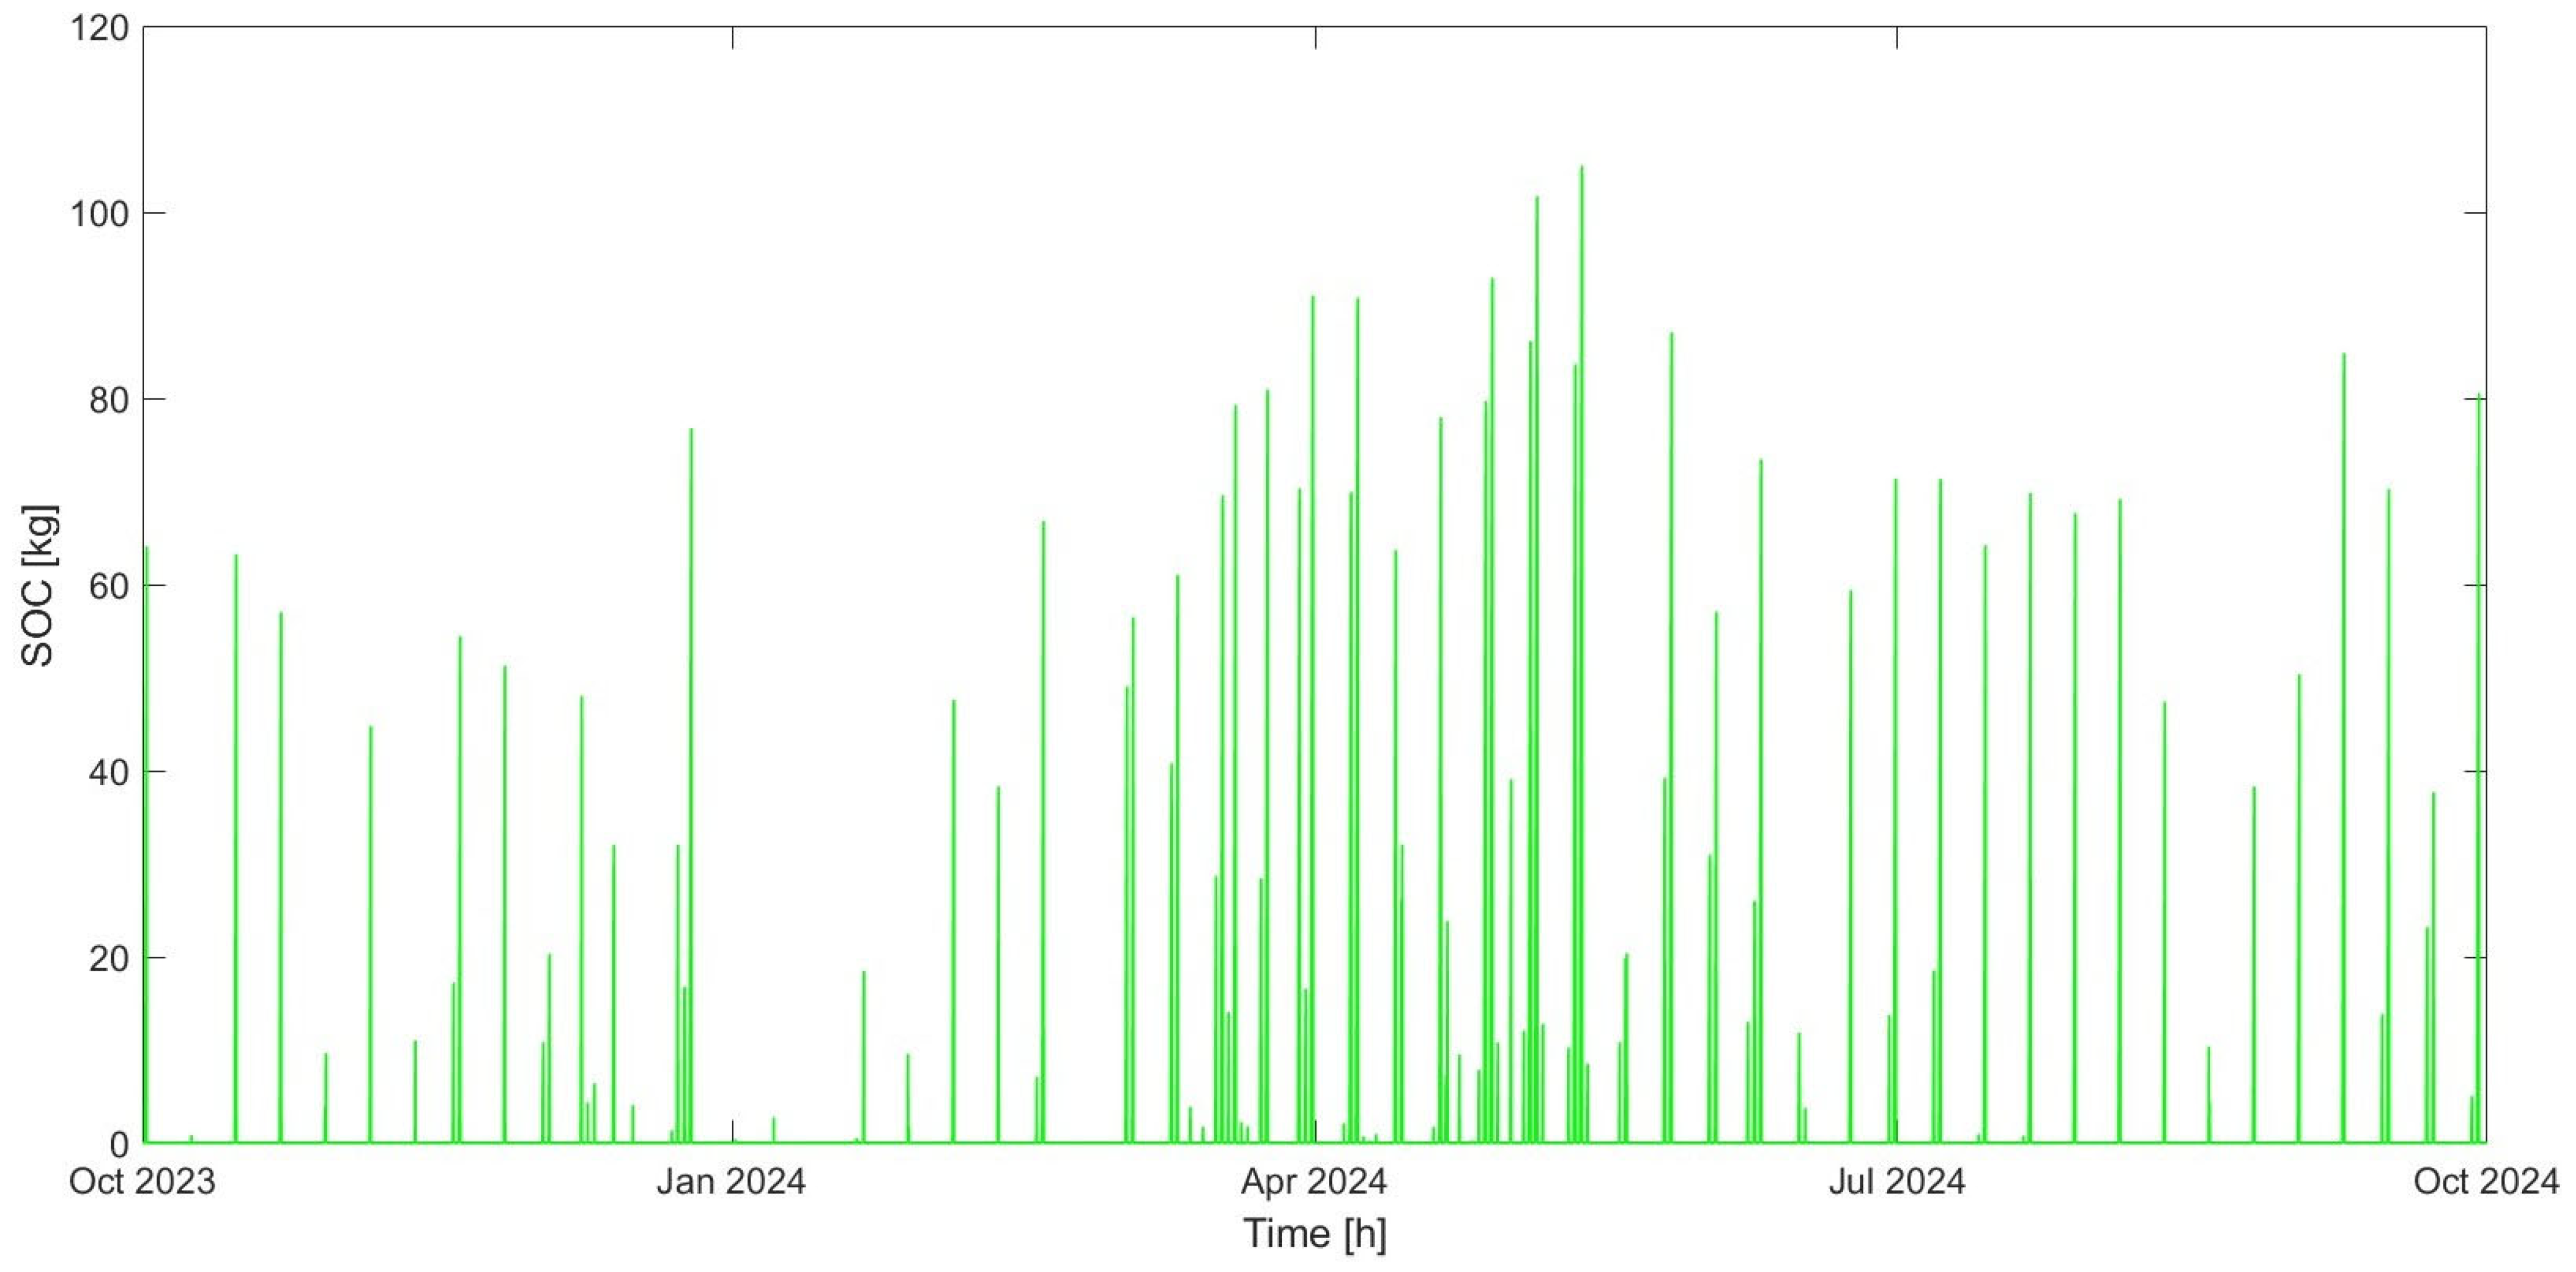
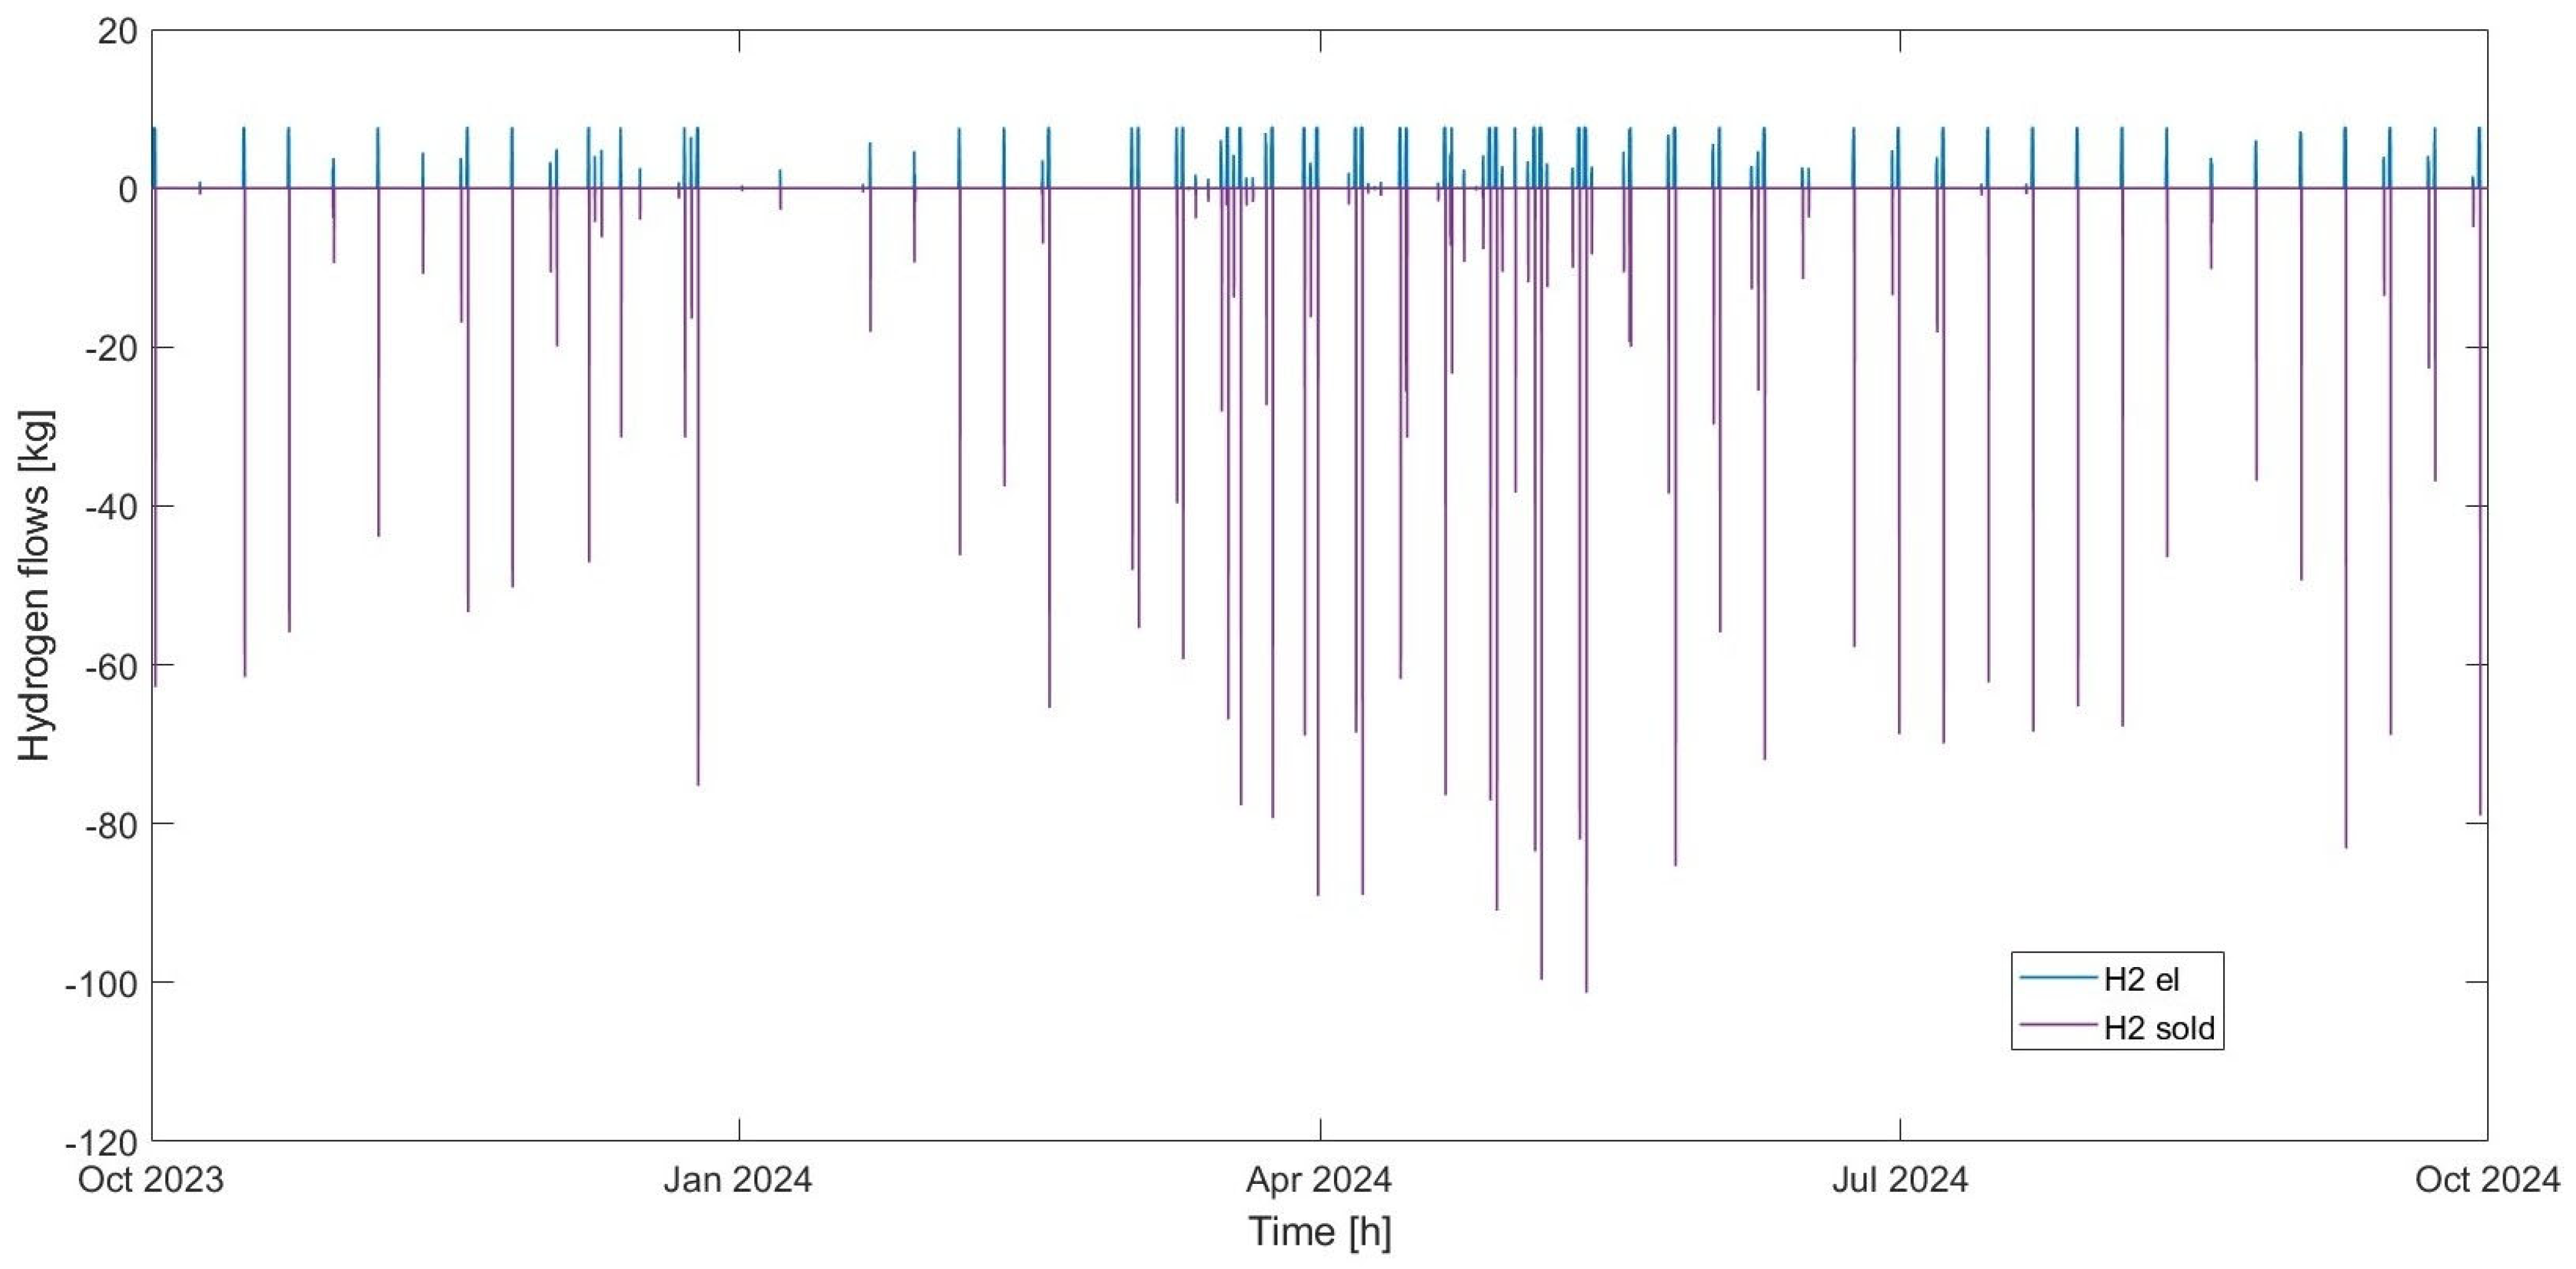
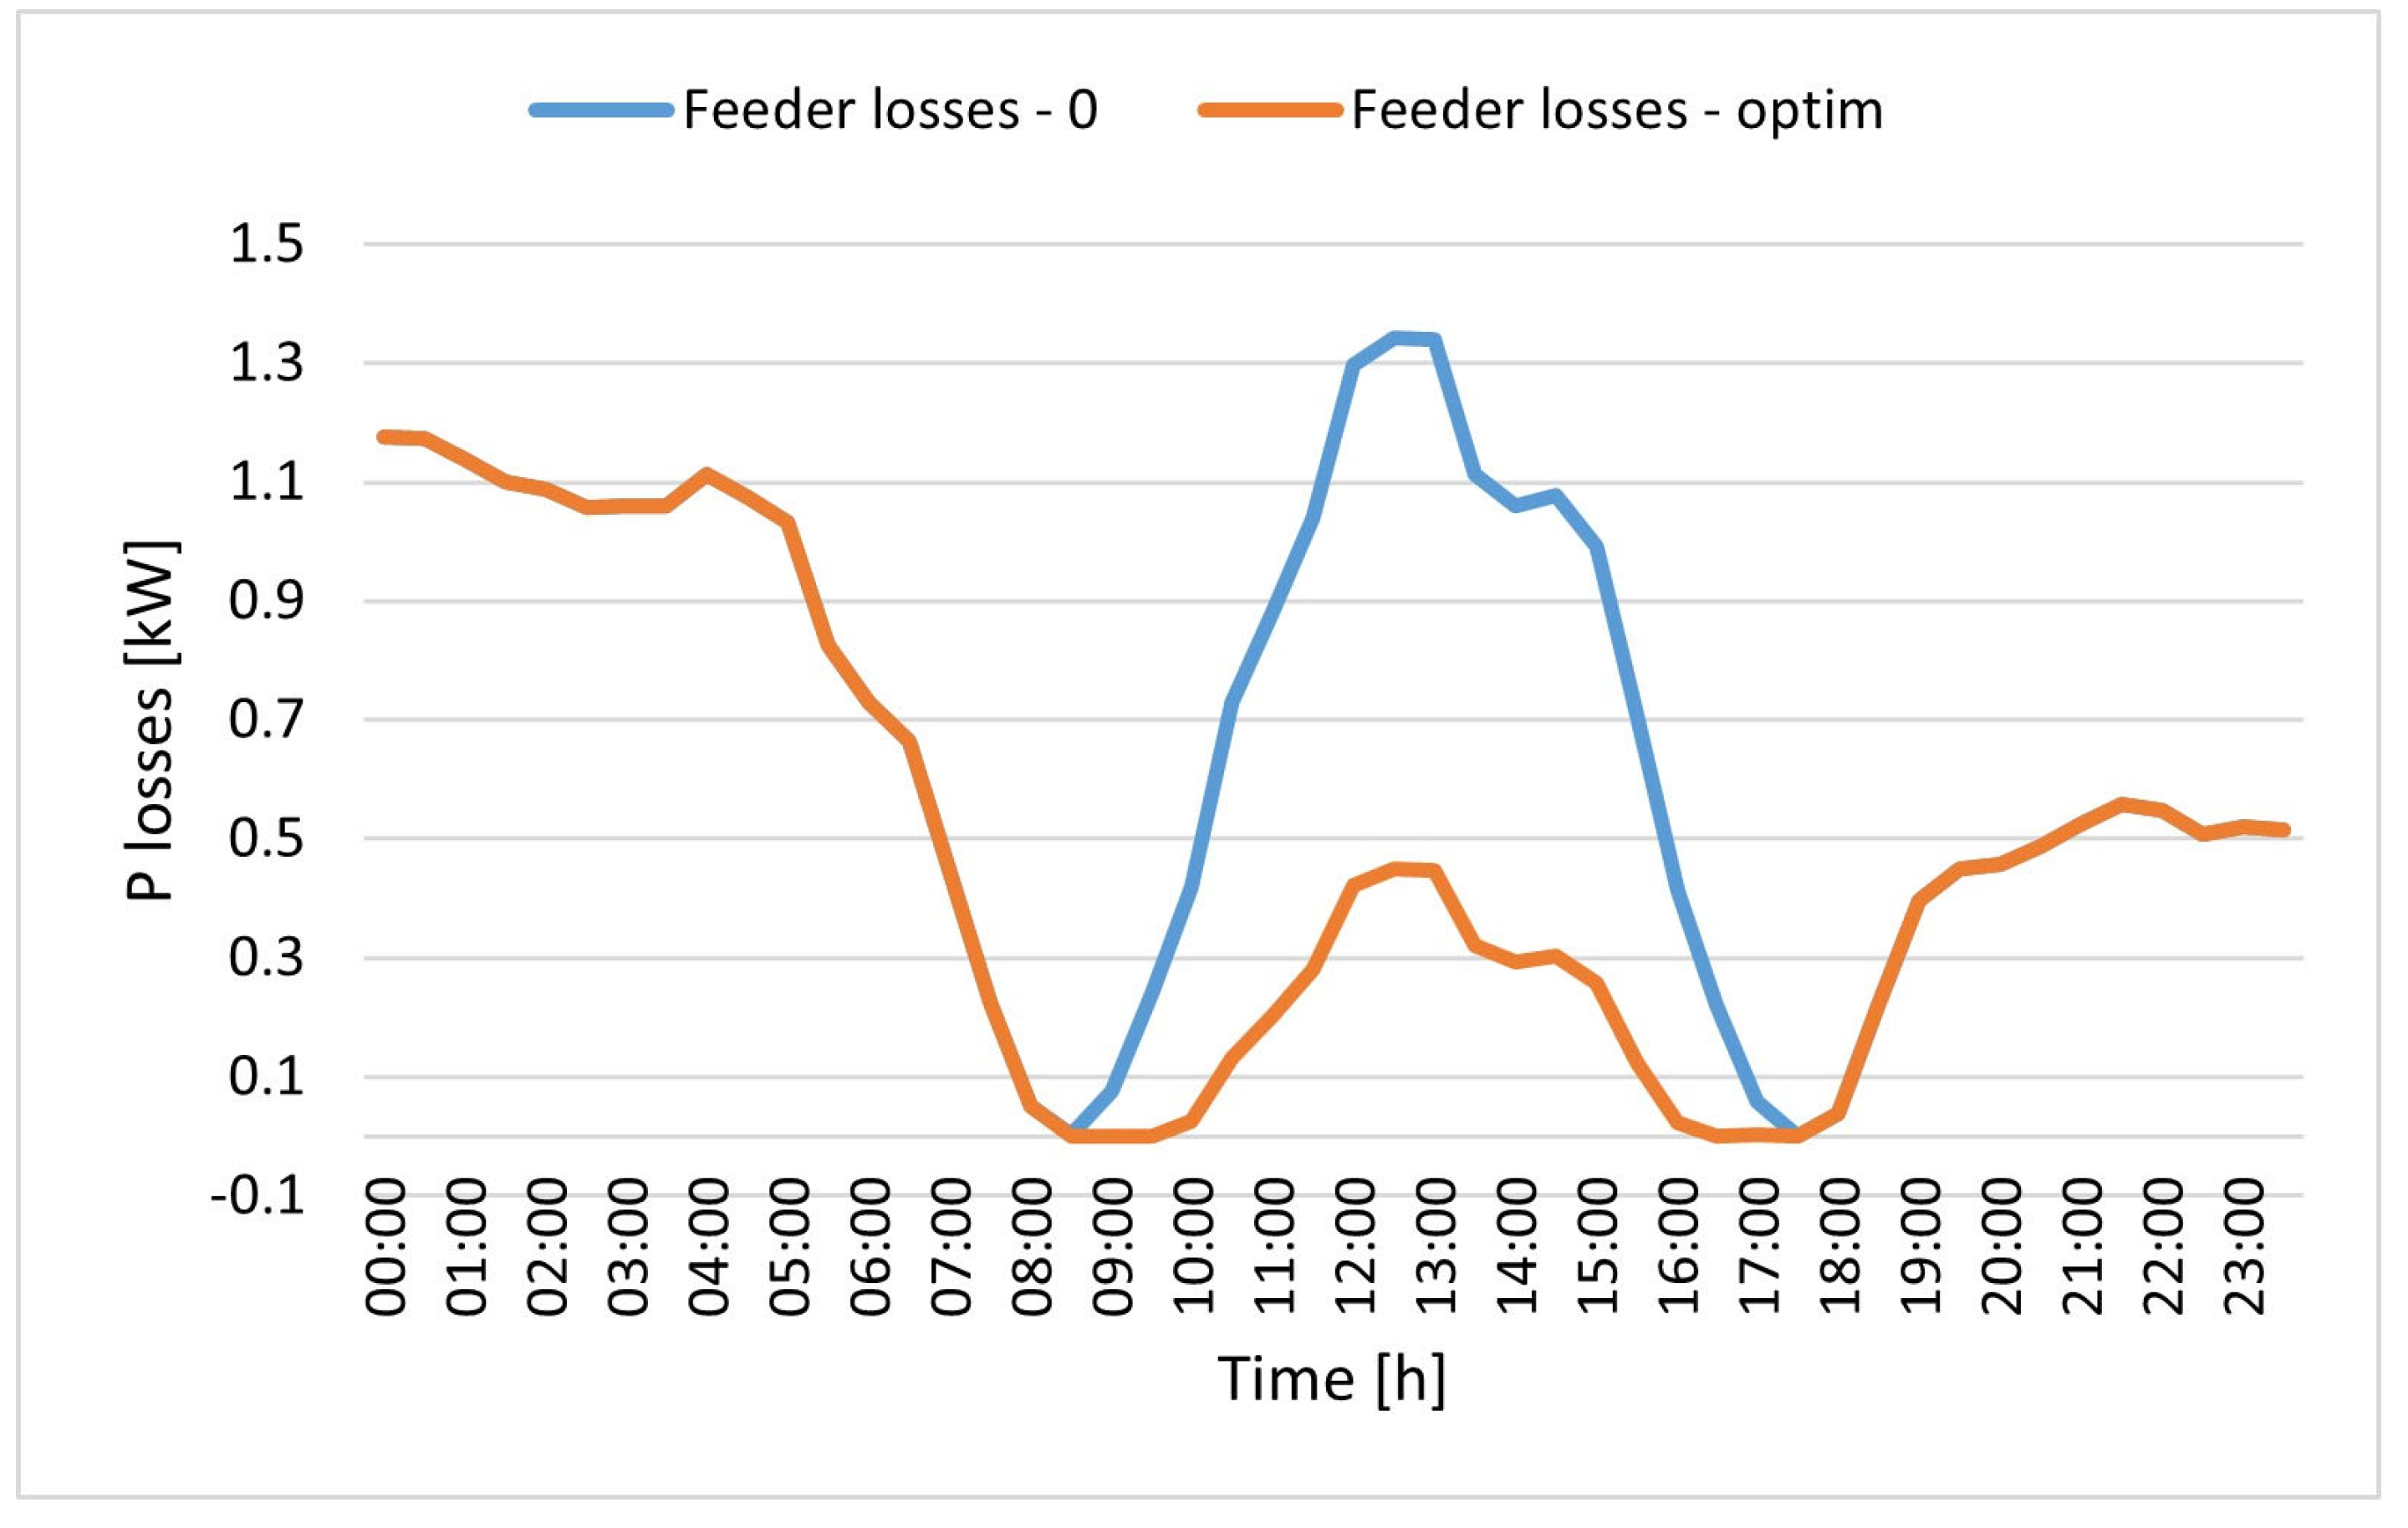
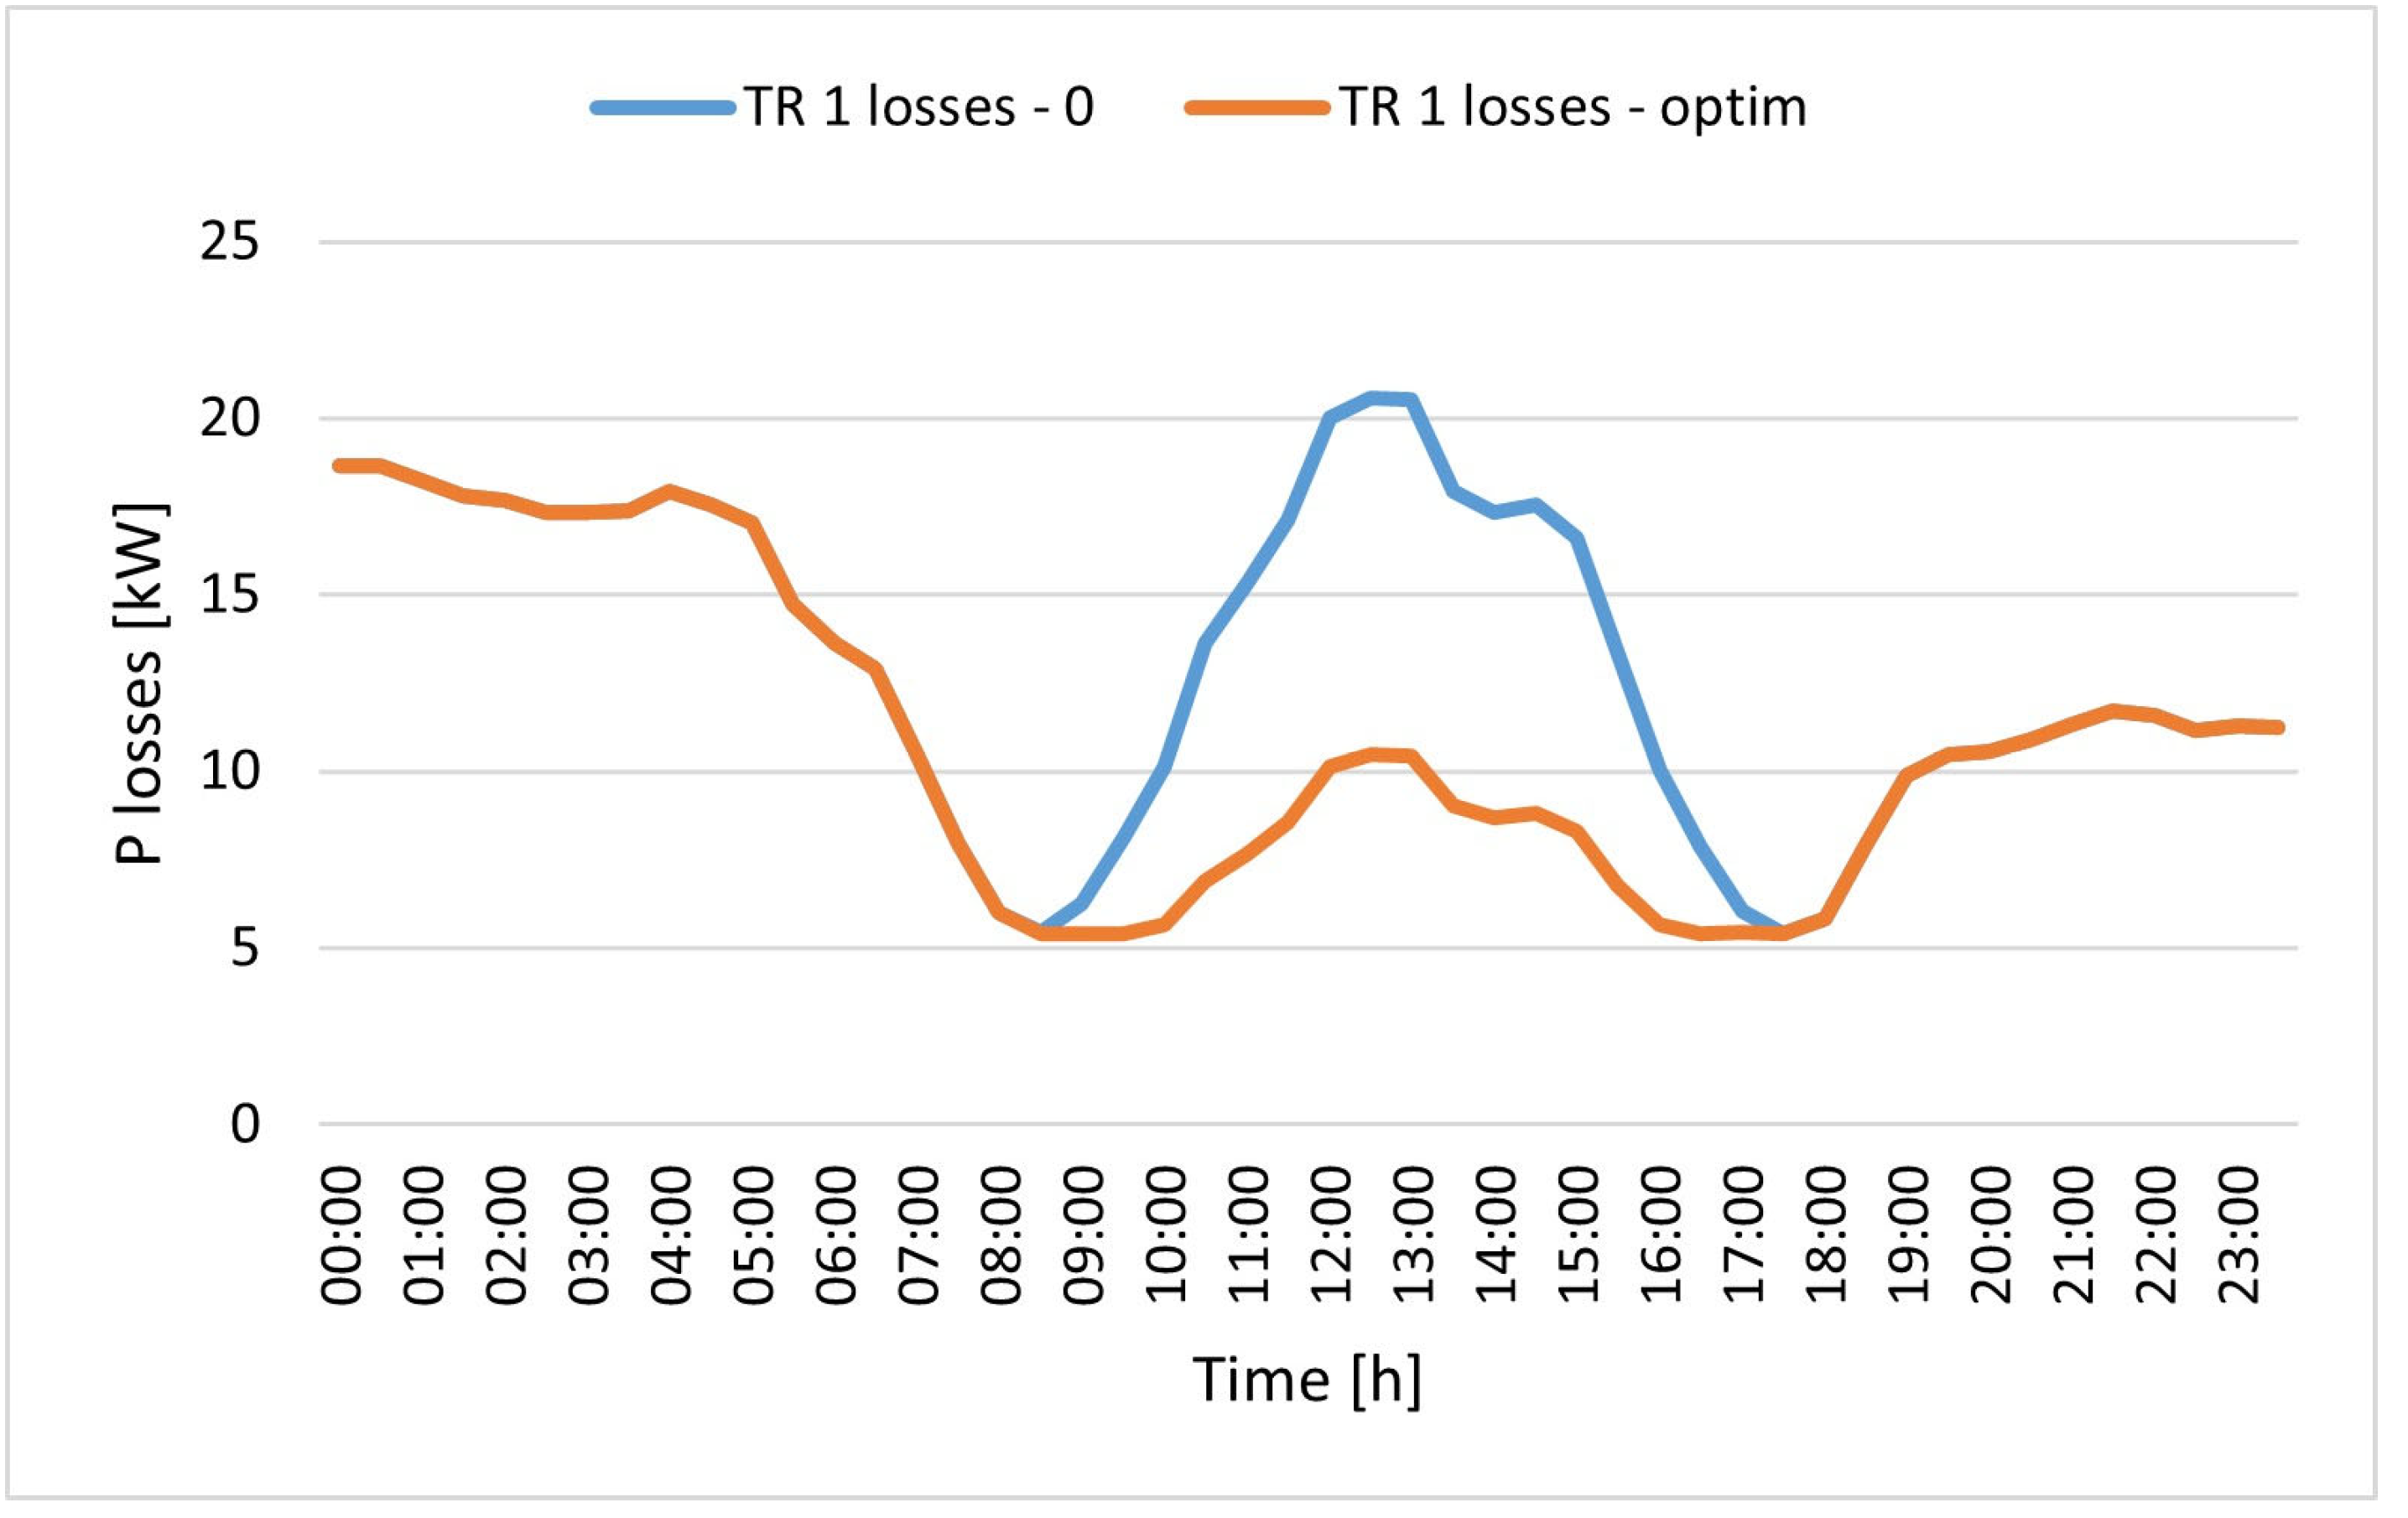
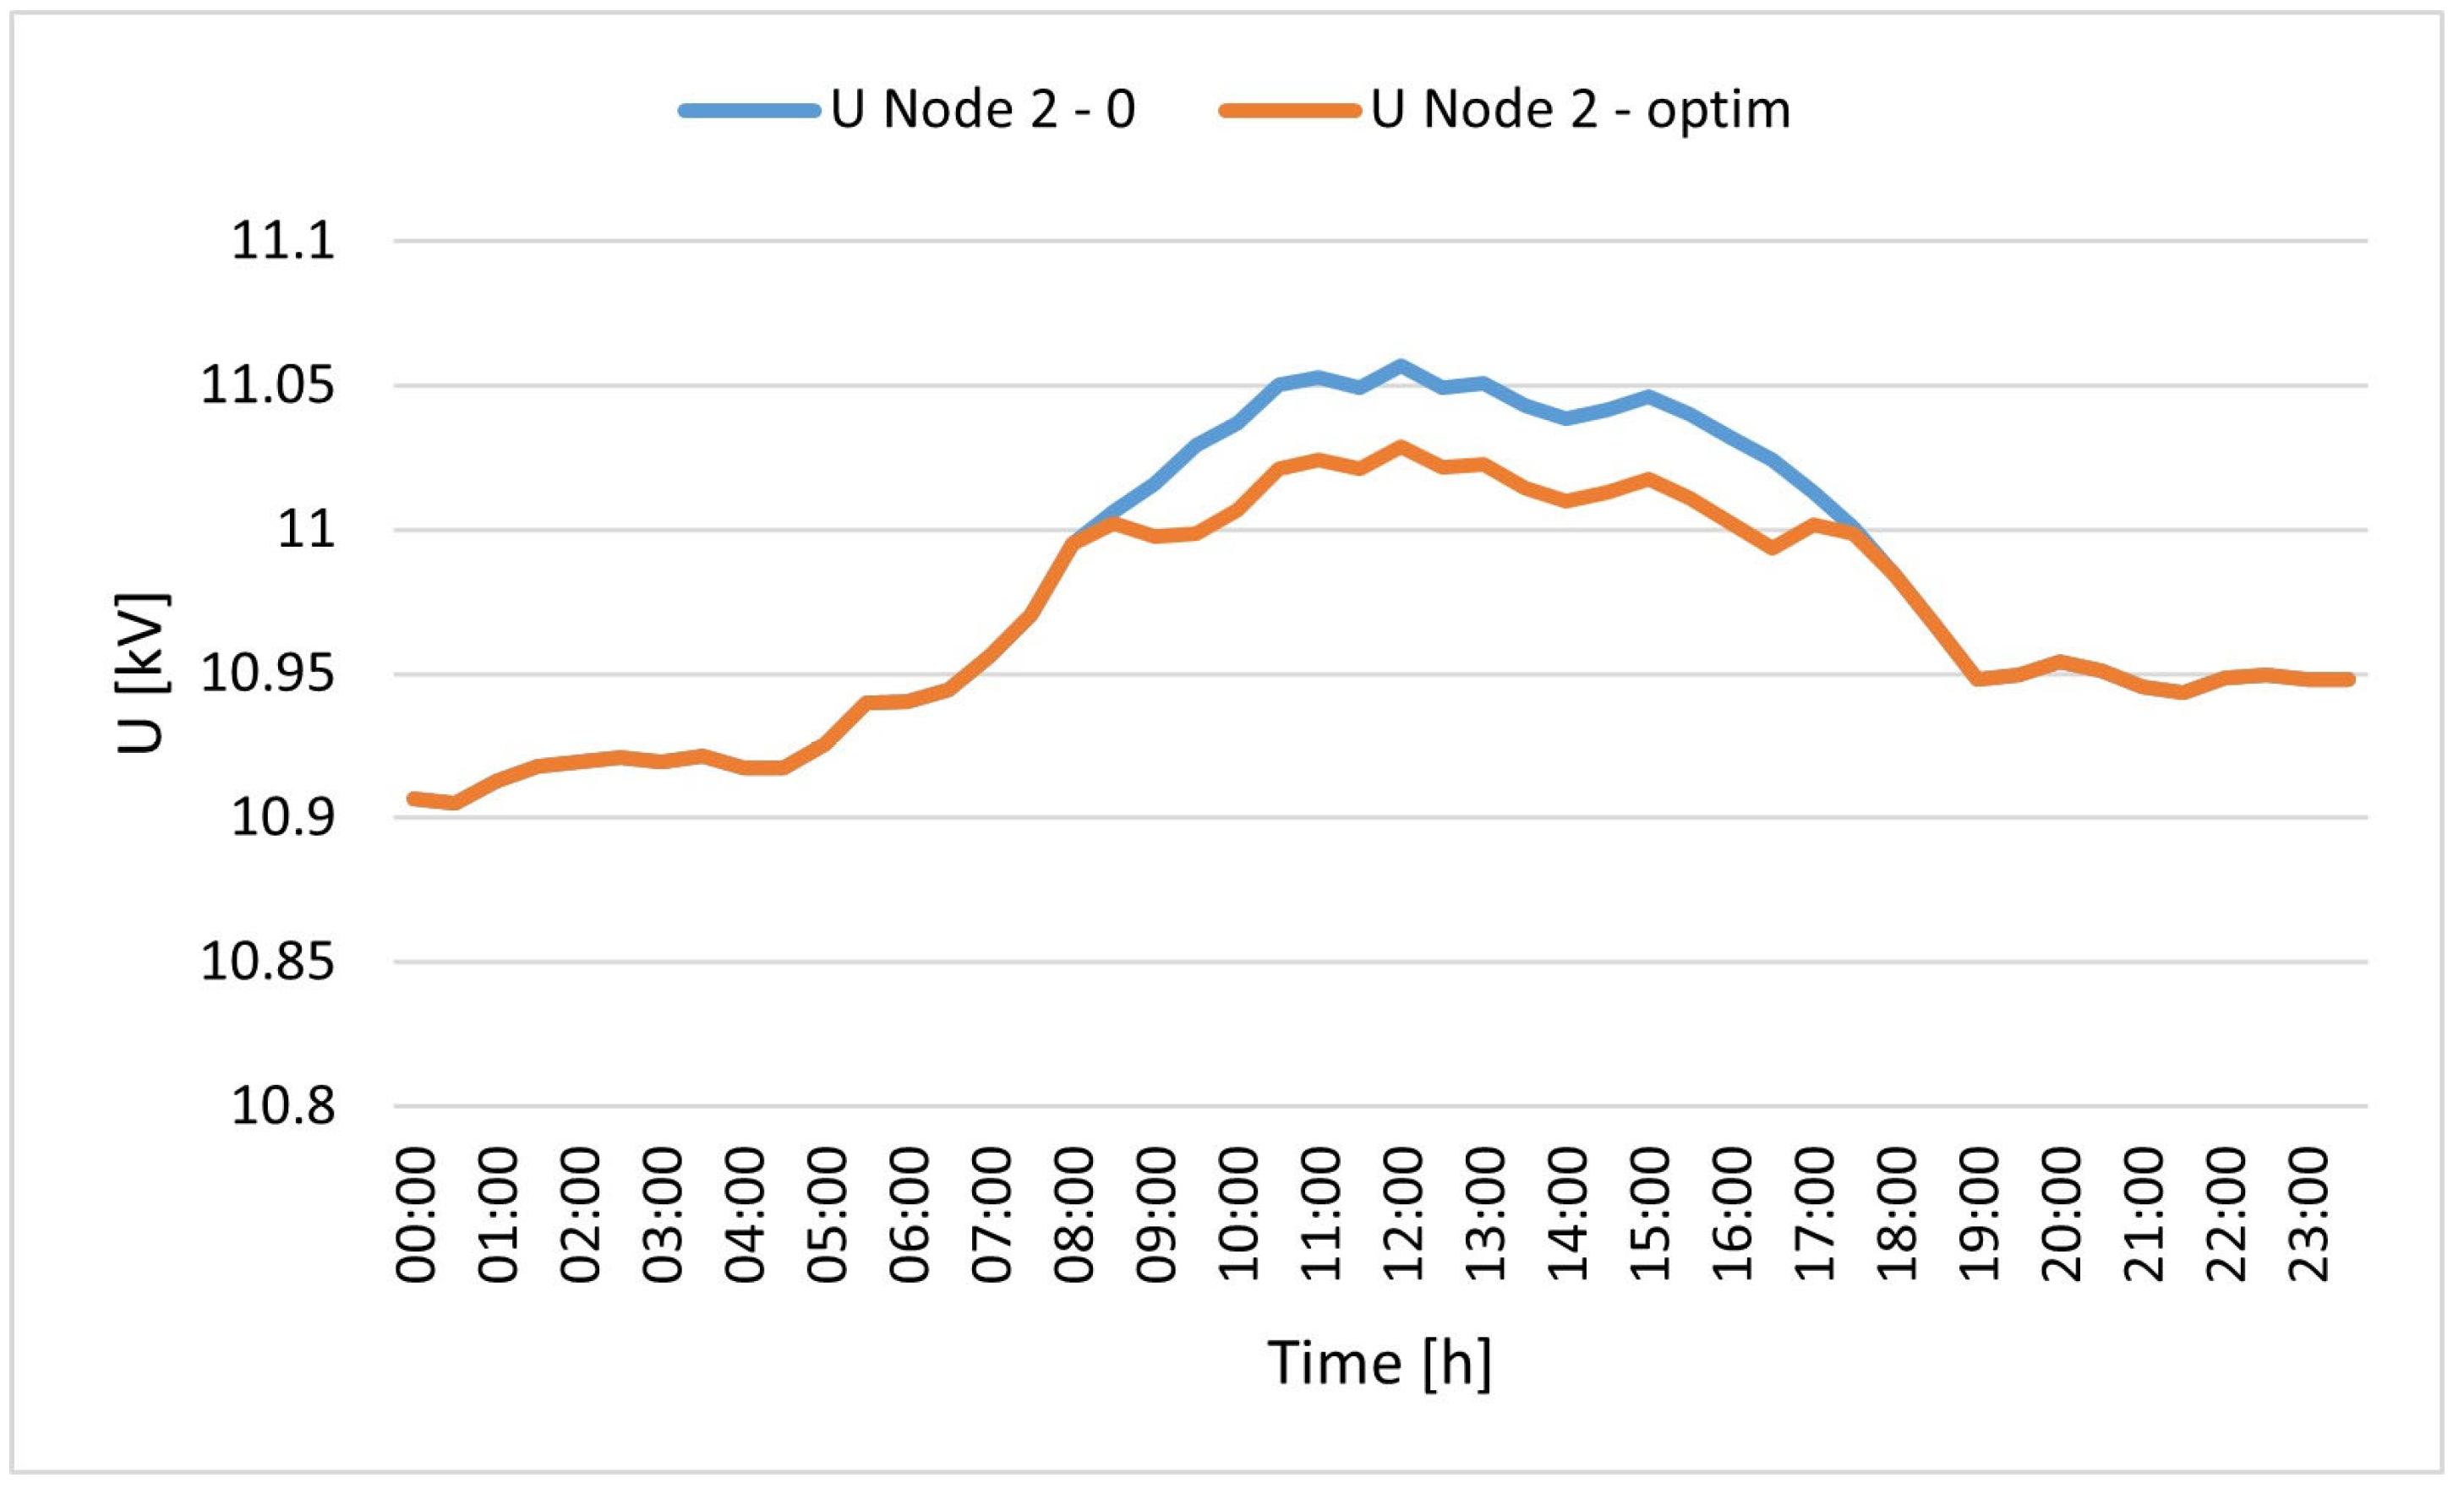
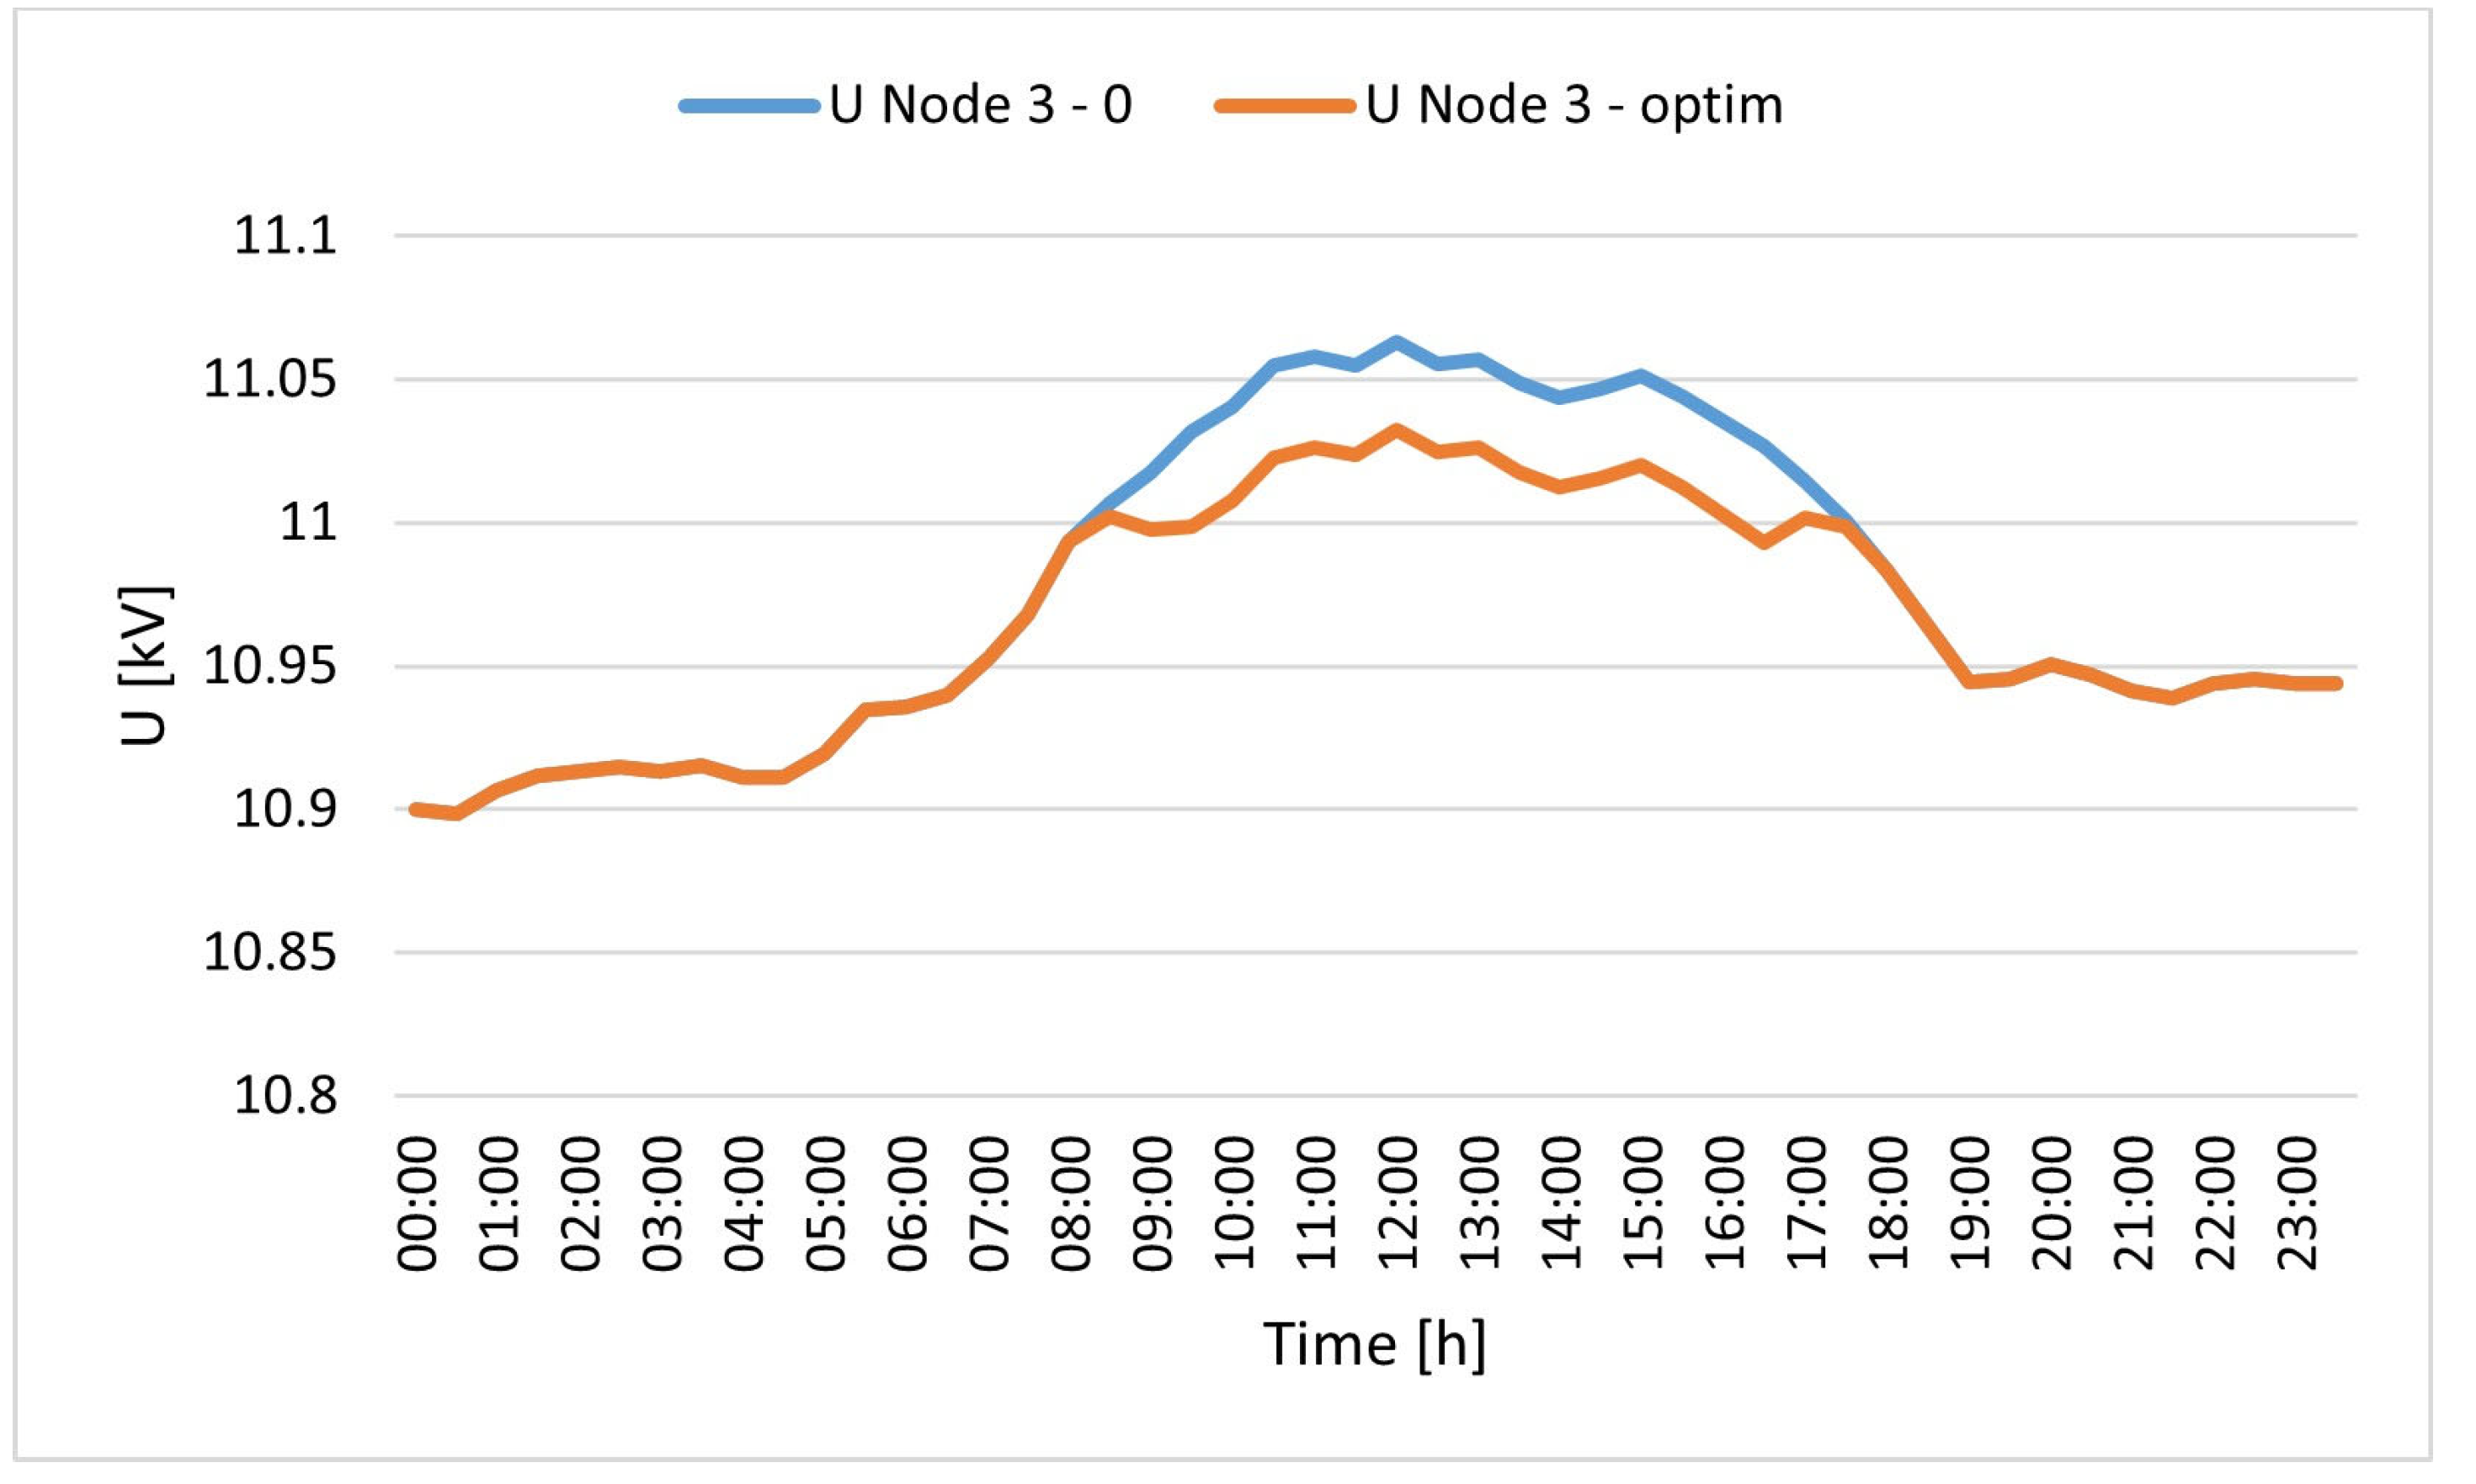
The optimal solution consists of installing a 737 kW electrolysis system and a 105 kg hydrogen storage system, without any fuel cells. The hydrogen produced, amounting to over 4 tons per year, is then sold in its entirety, while reverse power flows are reduced by 81.61% compared to the scenario without an electrolysis plant. The percentage reduction in annual reverse power flows achieved is within the range of 78–100% found in similar case studies in the literature. Additional benefits to the electrical grid resulting from the installation of the plant were evaluated using NEPLAN software, which performed load flow calculations. The results obtained showed that the presence of the electrolysis plant reduces energy losses in the feeders supplying the 11 kV industrial grid by over 29% and losses in the upstream transformer by over 17% during the day when reverse power flow values are at their highest.
This study has thus provided an alternative to traditional battery storage systems, which have already been evaluated in previous studies, offering a twofold benefit: supporting the electricity grid and producing a fuel with zero environmental impact that can be used in various sectors, thereby increasing the energy independence of the island of Malta.

Author Contributions

Conceptualization, F.M., J.L., A.M., S.R. and C.S.S.; methodology, F.M., J.L., A.M., S.R. and C.S.S.; software, S.R.; formal analysis, J.L., A.M., S.R. and C.S.S.; investigation, J.L., A.M., S.R. and C.S.S.; resources, J.L., A.M., S.R. and C.S.S.; data curation, S.R.; writing—original draft preparation, S.R.; writing—review and editing, F.M., J.L., A.M., S.R. and C.S.S.; visualization, F.M., J.L., A.M., S.R. and C.S.S.; supervision, F.M., J.L., A.M. and C.S.S. All authors have read and agreed to the published version of the manuscript.

Funding

This research was partially funded by the National Recovery and Resilience Plan (NRRP), Mission 4 Component 2 Investment 3.3; DM 352 Dottorati innovativi che rispondono ai fabbisogni di innovazione delle imprese—funded by the European Union—NextGenerationEU-CUP-B76E22000150005-DOT1320917 and from the Malta Council for Science and Technology (MCST) and the Ministry for Science and Technology of the People’s Republic of China (MOST), through the SINO-MALTA Fund 2023 Call (Science and Technology Cooperation). Grant agreement: SINOMALTA-2023-03.

Data Availability Statement

The data presented in this study are available on request from the corresponding author.

Conflicts of Interest

The authors declare no conflicts of interest.

References

  1. IEA—International Energy Agency. Available online: https://www.iea.org/data-and-statistics (accessed on 9 April 2025).
  2. European Green Deal—Consilium. Available online: https://www.consilium.europa.eu/en/policies/green-deal/ (accessed on 11 February 2025).
  3. IRENA. Renewable Capacity Statistics 2025; International Renewable Energy Agency: Masdar City, United Arab Emirates, 2025; ISBN 978-92-9260-652-7. [Google Scholar]
  4. Graditi, G.; Favuzza, S. Il Sistema Della Generazione Distribuita. Problematiche Di Connessione al Sistema Elettrico. Serv. A Rete 2009, 2, 101–106. [Google Scholar]
  5. Khani, H.; El-Taweel, N.; Farag, H.E.Z. Real-Time Optimal Management of Reverse Power Flow in Integrated Power and Gas Distribution Grids under Large Renewable Power Penetration. IET Gener. Transm. Distrib. 2018, 12, 2325–2331. [Google Scholar] [CrossRef]
  6. Williams, L.; Wang, Y. A Distributed Renewable Power System with Hydrogen Generation and Storage for an Island. Appl. Energy 2024, 358, 122500. [Google Scholar] [CrossRef]
  7. Bragatto, T.; Carere, F.; Cresta, M.; Gatta, F.M.; Geri, A.; Lanza, V.; Maccioni, M.; Paulucci, M. Location and Sizing of Hydrogen Based Systems in Distribution Network for Renewable Energy Integration. Electr. Power Syst. Res. 2022, 205, 107741. [Google Scholar] [CrossRef]
  8. Mazza, A.; Salomone, F.; Arrigo, F.; Bensaid, S.; Bompard, E.; Chicco, G. Impact of Power-to-Gas on Distribution Systems with Large Renewable Energy Penetration. Energy Convers. Manag. X 2020, 7, 100053. [Google Scholar] [CrossRef]
  9. Bucarelli, M.A.; Carere, F.; Bragatto, T.; Santori, F. Exploiting RES for Hydrogen Mobility: A New Scenario for the Company’s Fleet Management. In Proceedings of the 2021 12th International Renewable Energy Congress, IREC 2021, Hammamet, Tunisia, 26–28 October 2021. [Google Scholar] [CrossRef]
  10. Di Carlo, S.; Genna, A.; Massaro, F.; Montana, F.; Sanseverino, E.R. Optimizing Renewable Power Management in Transmission Congestion. An Energy Hub Model Using Hydrogen Storage. In Proceedings of the 21st IEEE International Conference on Environment and Electrical Engineering and 2021 5th IEEE Industrial and Commercial Power System Europe, EEEIC/I and CPS Europe 2021—Proceedings, Bari, Italy, 7–10 September 2021; Institute of Electrical and Electronics Engineers Inc.: Piscataway, NJ, USA, 2021. [Google Scholar]
  11. Geidl, M.; Koeppel, G.; Favre-Perrod, P.; Klöckl, B.; Andersson, G.; Fröhlich, K. The Energy Hub—A Powerful Concept for Future Energy Systems. Third Annu. Carnegie Mellon Conf. Electr. Ind. 2007, 13, 14. [Google Scholar]
  12. Mohammadi, M.; Noorollahi, Y.; Mohammadi-ivatloo, B.; Yousefi, H. Energy Hub: From a Model to a Concept—A Review. Renew. Sustain. Energy Rev. 2017, 80, 1512–1527. [Google Scholar] [CrossRef]
  13. Zidan, A.; Gabbar, H.A. Optimal Scheduling of Energy Hubs in Interconnected Multi Energy Systems. In Proceedings of the 2016 IEEE Smart Energy Grid Engineering (SEGE), Oshawa, ON, Canada, 21–24 August 2016. [Google Scholar]
  14. Micallef, A.; Staines, C.S.; Cassar, A. Utility-Scale Storage Integration in the Maltese Medium-Voltage Distribution Network. Energies 2022, 15, 2724. [Google Scholar] [CrossRef]
  15. Gallo, P.; Licari, J.; Massaro, F.; Micallef, A.; Ruffino, S.; Spiteri Staines, C. Renewable Hydrogen Production from Reverse Power Flows in the Maltese Medium Voltage Distribution Network. In Proceedings of the 2025 International Conference on Clean Electrical Power (ICCEP), Sardinia, Italy, 24–26 June 2025. [Google Scholar]
  16. Chatenet, M.; Pollet, B.G.; Dekel, D.R.; Dionigi, F.; Deseure, J.; Millet, P.; Braatz, R.D.; Bazant, M.Z.; Eikerling, M.; Staffell, I.; et al. Water Electrolysis: From Textbook Knowledge to the Latest Scientific Strategies and Industrial Developments. Chem. Soc. Rev. 2022, 51, 4583–4762. [Google Scholar] [CrossRef] [PubMed]
  17. Martinez Lopez, V.A.; Ziar, H.; Haverkort, J.W.; Zeman, M.; Isabella, O. Dynamic Operation of Water Electrolyzers: A Review for Applications in Photovoltaic Systems Integration. Renew. Sustain. Energy Rev. 2023, 182, 113407. [Google Scholar] [CrossRef]
  18. Stansberry, J.M.; Brouwer, J. Experimental Dynamic Dispatch of a 60 KW Proton Exchange Membrane Electrolyzer in Power-to-Gas Application. Int. J. Hydrogen Energy 2020, 45, 9305–9316. [Google Scholar] [CrossRef]
  19. Massaro, F.; Di Silvestre, M.L.; Ferraro, M.; Montana, F.; Riva Sanseverino, E.; Ruffino, S. Energy Hub Model for the Massive Adoption of Hydrogen in Power Systems. Energies 2024, 17, 4422. [Google Scholar] [CrossRef]
  20. Statistics|Eurostat. Available online: https://ec.europa.eu/eurostat/databrowser/view/nrg_pc_205__custom_15074233/default/table?lang=en (accessed on 19 January 2025).
  21. Krishnan, S.; Koning, V.; Theodorus de Groot, M.; de Groot, A.; Mendoza, P.G.; Junginger, M.; Kramer, G.J. Present and Future Cost of Alkaline and PEM Electrolyser Stacks. Int. J. Hydrogen Energy 2023, 48, 32313–32330. [Google Scholar] [CrossRef]
  22. Tebibel, H. Methodology for Multi-Objective Optimization of Wind Turbine/Battery/Electrolyzer System for Decentralized Clean Hydrogen Production Using an Adapted Power Management Strategy for Low Wind Speed Conditions. Energy Convers. Manag. 2021, 238, 114125. [Google Scholar] [CrossRef]
  23. International Energy Agency (IEA). Global Hydrogen Review 2024; International Energy Agency: Paris, France, 2024. [Google Scholar]
  24. NEPLAN. Loadflow Time Simulation. Available online: https://neplan.ch/description/energy-loss-calculation-2/ (accessed on 10 June 2025).
  25. Malta’s National Energy and Climate Plan. Available online: https://energywateragency.gov.mt/wp-content/uploads/2025/01/MT-%E2%80%93-FINAL-UPDATED-NECP-2021-2030-English.pdf (accessed on 12 July 2025).
Figure 1. Global greenhouse gas emissions from fuel combustion [1].
Energies 18 03931 g001
Figure 2. Net load diagram of the case study.
Energies 18 03931 g002
Figure 3. Energy hub model used to represent and appropriately size the P2H system.
Energies 18 03931 g003
Figure 4. Grid model implemented in NEPLAN.
Energies 18 03931 g004
Figure 5. Percentage allocation of CAPEX for the case of single-objective optimisation.
Energies 18 03931 g005
Figure 6. Percentage allocation of CAPEX for the case of multi-objective optimisation.
Energies 18 03931 g006
Figure 7. State of charge of the hydrogen storage system over time.
Energies 18 03931 g007
Figure 8. Hydrogen flows in input and output of the storage system over time.
Energies 18 03931 g008
Figure 9. Hydrogen inflows and outflows and state of charge of the storage system over the course of two typical days.
Energies 18 03931 g009
Figure 10. Reverse power flows in the initial scenario without P2H system, in blue, and in the case with optimised P2H system, in red.
Energies 18 03931 g010
Figure 11. Reverse power flows in the initial scenario (in blue) and the optimised scenario (in red) on two typical days.
Energies 18 03931 g011
Figure 12. Power losses in the ring network power supplies in the initial scenario (in blue) and in the optimised scenario with P2H system (in orange) during the critical day considered.
Energies 18 03931 g012
Figure 13. Power losses in the 33 kV/11 kV transformer supplying the ring network in the initial scenario (in blue) and in the optimised scenario with P2H system (in orange) during the critical day considered.
Energies 18 03931 g013
Figure 14. Voltage profile in Node 2 in the initial scenario (in blue) and in the optimised scenario with P2H system (in orange) during the critical day considered.
Energies 18 03931 g014
Figure 15. Voltage profile in Node 3 in the initial scenario (in blue) and in the optimised scenario with P2H system (in orange) during the critical day considered.
Energies 18 03931 g015
Table 1. Coefficient values.
CoefficientValue
k e l e   e h 2 0.016 [kg/kWh] [10]
H 2   l o s s 0.02 [10]
k c h 1 [10]
k d i s c h 1 [10]
Q c h 104
Q d i s c h 104
k f c   h 2 e 12.23 [kWh/kg] [10]
C E 0.12 EUR/kWh [20]
R e v H 2 7.95 EUR/kg *
R e v E 0.10 EUR/kWh
C C A P E X   e l 1800 EUR/kW [21]
C C A P E X   H 2 S S 546.25 EUR/kg [22]
C C A P E X   f c 1532.44 EUR /kW [19]
* The selling price of hydrogen assumed in this study was calculated as the average cost of green hydrogen produced from solar photovoltaics in 2023 reported in [23], converted into euros.
Table 2. TR 1 transformer parameters.
ParameterMeaningValue
Un1Nominal voltage of the primary winding node33 kV
Un2Nominal voltage of the secondary winding node11 kV
SrRated power5 MVA
Ukr(1)%Rated positive sequence short-circuit voltage7%
URr(1)%Rated positive sequence copper losses of winding 1 and 2 in % with respect to Sr1.5%
X/RRatio between reactance and resistance4.56
UsetTarget set voltage97%
VGVector groupDyn1
I0%Open circuit current0.48%
PfeIron core losses5.4 kW
Table 3. Data of the ring network supply cables.
TypeLengthResistanceReactanceCapacitanceMaximum Rated Current
240Cu PILC680 m0.0921 Ω/km0.0784 Ω/km0.9005 μF/km435 A
240Cu XLPE single cores22 m0.0754 Ω/km0.1099 Ω/km0.455 μF/km520 A
Table 4. Length of the ring cables.
LineLength
SS1-Node 3375 m
SS1–SS250 m
SS2-Node 3230 m
SS3-Node 3215 m
SS4-Node 340 m
Table 5. Parameters of the transformers present in SS1, SS2, SS3 and SS4.
ParameterMeaningValue
Un1Nominal voltage of the primary winding node11 kV
Un2Nominal voltage of the secondary winding node0.4 kV
SrRated power1.6 MVA
Ukr(1)%Rated positive sequence short-circuit voltage6%
URr(1)%Rated positive sequence copper losses of winding 1 and 2 in % with respect to Sr1.6%
X/RRatio between reactance and resistance3.61
UsetTarget set voltage97%
VGVector groupDyn11
I0%Open circuit current0.5%
PfeIron core losses2.2 kW
Table 6. Parameters of cables connecting PV systems to transformers.
LengthCable Cross-SectionResistanceReactanceMaximum Rated CurrentNo of Parallel Cables
50 m300 sqmm0.175 Ω/km0.125 Ω/km600 A3
Table 7. Number of parallel cables supplying the loads output from the four substations.
CableNo of Parallel Cables
SS1-Load 13
SS2-Load 23
SS3-Load 38
SS4-Load 46
Table 8. Optimal component sizes and related costs in the case of single-objective optimisation.
ComponentSizeCAPEX
Electrolyser1803 kWEUR 3,245,400.00
Hydrogen storage system195 kg (5 kg × 39 tanks)EUR 106,518.75
Fuel cell757 kWEUR 1,160,057.08
Total investmentEUR 4,511,975.83
Table 9. Optimal component sizes and related costs in the case of multi-objective optimisation.
ComponentSizeCAPEX
Electrolyser737 kWEUR 1,326,600.00
Hydrogen storage system105 kg (5 kg × 21 tanks)EUR 57,356.25
Fuel cell--
Total investmentEUR 1,383,956.25
Disclaimer/Publisher’s Note: The statements, opinions and data contained in all publications are solely those of the individual author(s) and contributor(s) and not of MDPI and/or the editor(s). MDPI and/or the editor(s) disclaim responsibility for any injury to people or property resulting from any ideas, methods, instructions or products referred to in the content.

