Article

Performance Degradation of Ground Source Heat Pump Systems Under Ground Temperature Disturbance: A TRNSYS-Based Simulation Study

School of Energy and Power Engineering, Jiangsu University of Science and Technology, Zhenjiang 212100, China
*
Author to whom correspondence should be addressed.
Energies 2025, 18(15), 3909; https://doi.org/10.3390/en18153909
Submission received: 3 June 2025 / Revised: 20 July 2025 / Accepted: 21 July 2025 / Published: 22 July 2025
(This article belongs to the Section B: Energy and Environment)

Abstract

Ground temperature (GT) variation significantly affects the energy performance of ground source heat pump (GSHP) systems. Both long-term thermal accumulation and short-term dynamic responses contribute to the degradation of the coefficient of performance (COP), especially under cooling-dominated conditions. This study develops a mechanism-based TRNSYS simulation that integrates building loads, subsurface heat transfer, and dynamic heat pump operation. A 20-year case study in Shanghai reveals long-term performance degradation driven by thermal boundary shifts. Results show that GT increases by over 12 °C during the simulation period, accompanied by a progressive increase in ΔT by approximately 0.20 K and a consistent decline in COP. A near-linear inverse relationship is observed, with COP decreasing by approximately 0.038 for every 1 °C increase in GT. In addition, ΔT is identified as a key intermediary linking subsurface thermal disturbance to efficiency loss. A multi-scale response framework is established to capture both annual degradation and daily operational shifts along the Load–GT–ΔT–COP pathway. This study provides a quantitative explanation of the thermal degradation process and offers theoretical guidance for performance forecasting, operational threshold design, and thermal regulation in GSHP systems.

1. Introduction

Improving building energy efficiency is a critical strategy for reducing carbon emissions amid global climate goals and energy transition efforts [1]. GSHP systems, which utilize shallow geothermal energy, have gained broad adoption in green buildings due to their operational stability and high energy efficiency [2]. Under standard conditions, the COP of GSHP systems typically ranges from 3.5 to 5.0, surpassing that of air-source systems [3,4]. These systems are widely applied in residential, commercial, and public buildings [5,6].
The long-term performance of GSHP systems depends heavily on the thermal stability of the GT field [7]. Under cooling-dominated conditions or suboptimal control strategies, thermal imbalance can lead to progressive subsurface heat accumulation. This, in turn, narrows ΔT between the circulating fluid and the ground, resulting in a gradual decline in COP [8,9]. Previous studies have demonstrated that underground heat buildup compresses ΔT and reduces system efficiency, particularly in cooling-intensive environments [10,11].
To address the long-term performance degradation of GSHP systems caused by ground temperature accumulation, various thermal regulation strategies have been developed. In Mediterranean and subtropical regions dominated by cooling demand, field studies have demonstrated that sustained underground heat buildup alters the subsurface thermal boundary, resulting in a reduced ΔT between the circulating fluid and the ground. This ΔT compression directly weakens the instantaneous heat transfer rate, thereby increasing compressor workload and reducing overall system efficiency [6,7,12,13]. For instance, Cho and Shin [13] reported that controlling variable water flow rates can effectively stabilize ΔT and mitigate long-term thermal imbalance in hybrid GSHP systems. Yuan et al. [14] analyzed the long-term operational performance of a solar-assisted, medium-depth GSHP system and identified seasonal COP fluctuation patterns associated with thermal imbalance. Gamage et al. [15] proposed a cost-effective three-dimensional transient simulation model for U-tube heat exchangers, providing a practical approximation of subsurface thermal dynamics under varying operational conditions. However, most regulation and structure-oriented studies treat ΔT as a boundary outcome rather than a mediating link in the internal degradation process. The causal pathway from GT accumulation to ΔT compression and subsequent COP decline remains largely unestablished, which forms the core focus of the present investigation.
Beyond boundary-oriented regulation strategies, increasing research attention has been directed toward the long-term performance dynamics of GSHP systems. Wang et al. [16] analyzed decade-scale variations in measured COP data from a public building in northern China and attributed the observed performance degradation to cumulative subsurface heat accumulation. Gebhardt et al. [17] conducted multi-year monitoring of borehole field temperatures and quantified both the rate and extent of ground thermal accumulation. In Japan, Mohammadzadeh Bina et al. [18] developed a climate-driven simulation model capable of predicting long-term COP decline under various operation profiles. From a performance modeling perspective, Lan et al. [19] proposed a nonlinear regression framework for cooling tower-assisted GSHP systems, identifying multiple external variables influencing efficiency. Xie et al. [20] integrated multi-step load forecasting into hybrid system control, thereby enhancing real-time operational adaptability. While these studies have provided valuable insights into efficiency trends and control strategies, most of them focus on external performance indicators or predictive metrics, without establishing the internal causal mechanism linking ground temperature accumulation, ΔT compression, and COP degradation. Although these contributions form an important foundation for system evaluation and optimization, a unified framework that systematically links load imbalance, ground temperature rise, ΔT reduction, and COP loss has not yet been established. This study addresses this gap.
In contrast, the present study develops a physics-informed simulation framework based on TRNSYS, which couples dynamic building loads, subsurface temperature evolution, and operational system response. A causal degradation pathway, Load–GT–ΔT–COP, is formulated to represent both long-term performance deterioration and short-cycle regulatory behavior. This framework facilitates a mechanistic interpretation of system degradation under evolving thermal boundaries and provides a modeling perspective distinct from empirical regression or black-box prediction methods. By intentionally excluding groundwater flow and assuming homogeneous soil properties, this study isolates the role of building load imbalance and boundary compression in governing GSHP performance degradation.
Despite substantial progress, four key limitations remain: (1) Most studies focus on short-term fluctuations, lacking insight into long-term GT–COP coupling over multi-year operation; (2) Few integrate building loads, ground heat boundaries, and system performance into a dynamic model; (3) Many rely on single-variable regressions without full causal pathway characterization across Load–GT–ΔT–COP; (4) Most case studies are from cold or arid zones, limiting applicability to hot summer and cold winter climates like eastern China.
Accordingly, the primary scientific objective of this study is to clarify the causal mechanism through which long-term GT evolution influences the performance of GSHP systems. Instead of relying solely on statistical correlations between COP and time, a physically grounded response pathway is constructed to trace how load imbalance leads to subsurface heat accumulation, compresses ΔT, and ultimately reduces system efficiency.
Based on a TRNSYS-based simulation of a typical office building in Shanghai over a 20-year operation period, the major contributions of this work are as follows:
(1)
A multi-scale response framework is developed to characterize both long-term GT–COP coupling and short-cycle system dynamics;
(2)
A quantitative degradation coefficient is established, indicating that each 1 °C increase in GT results in an average COP decline of approximately 0.038;
(3)
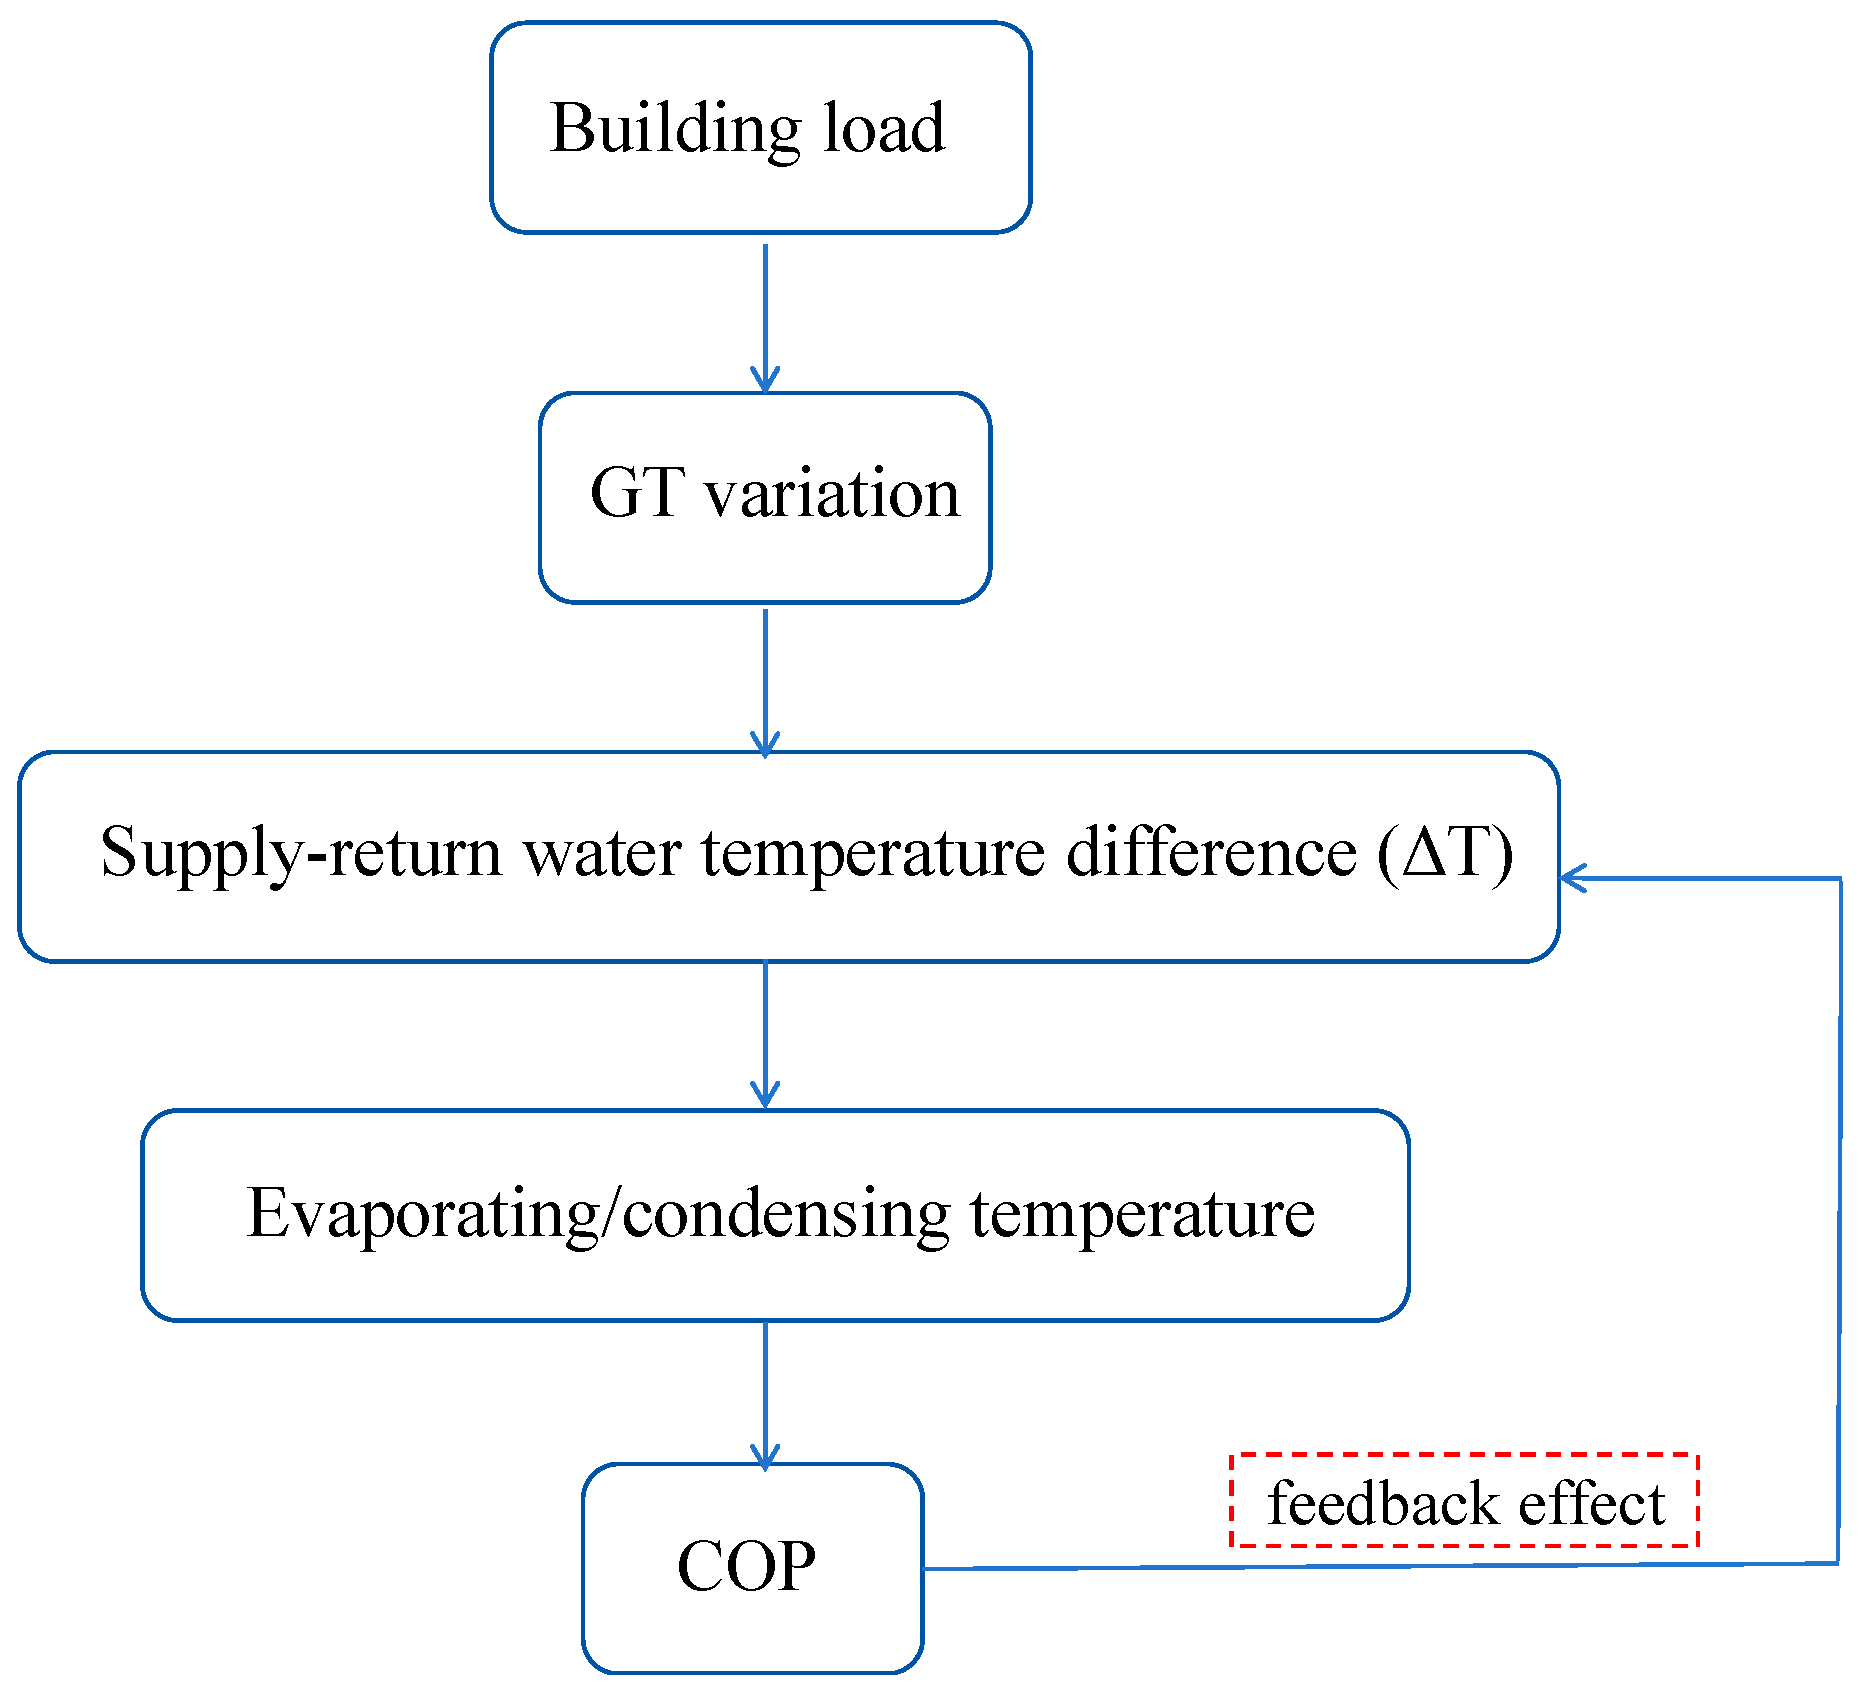
ΔT is identified as a mediating variable in the Load–GT–ΔT–COP pathway. This relationship is validated through analysis of long-term performance trends and short-cycle system responses, revealing that thermal boundary shifts progressively diminish system efficiency.

2. Materials and Methods

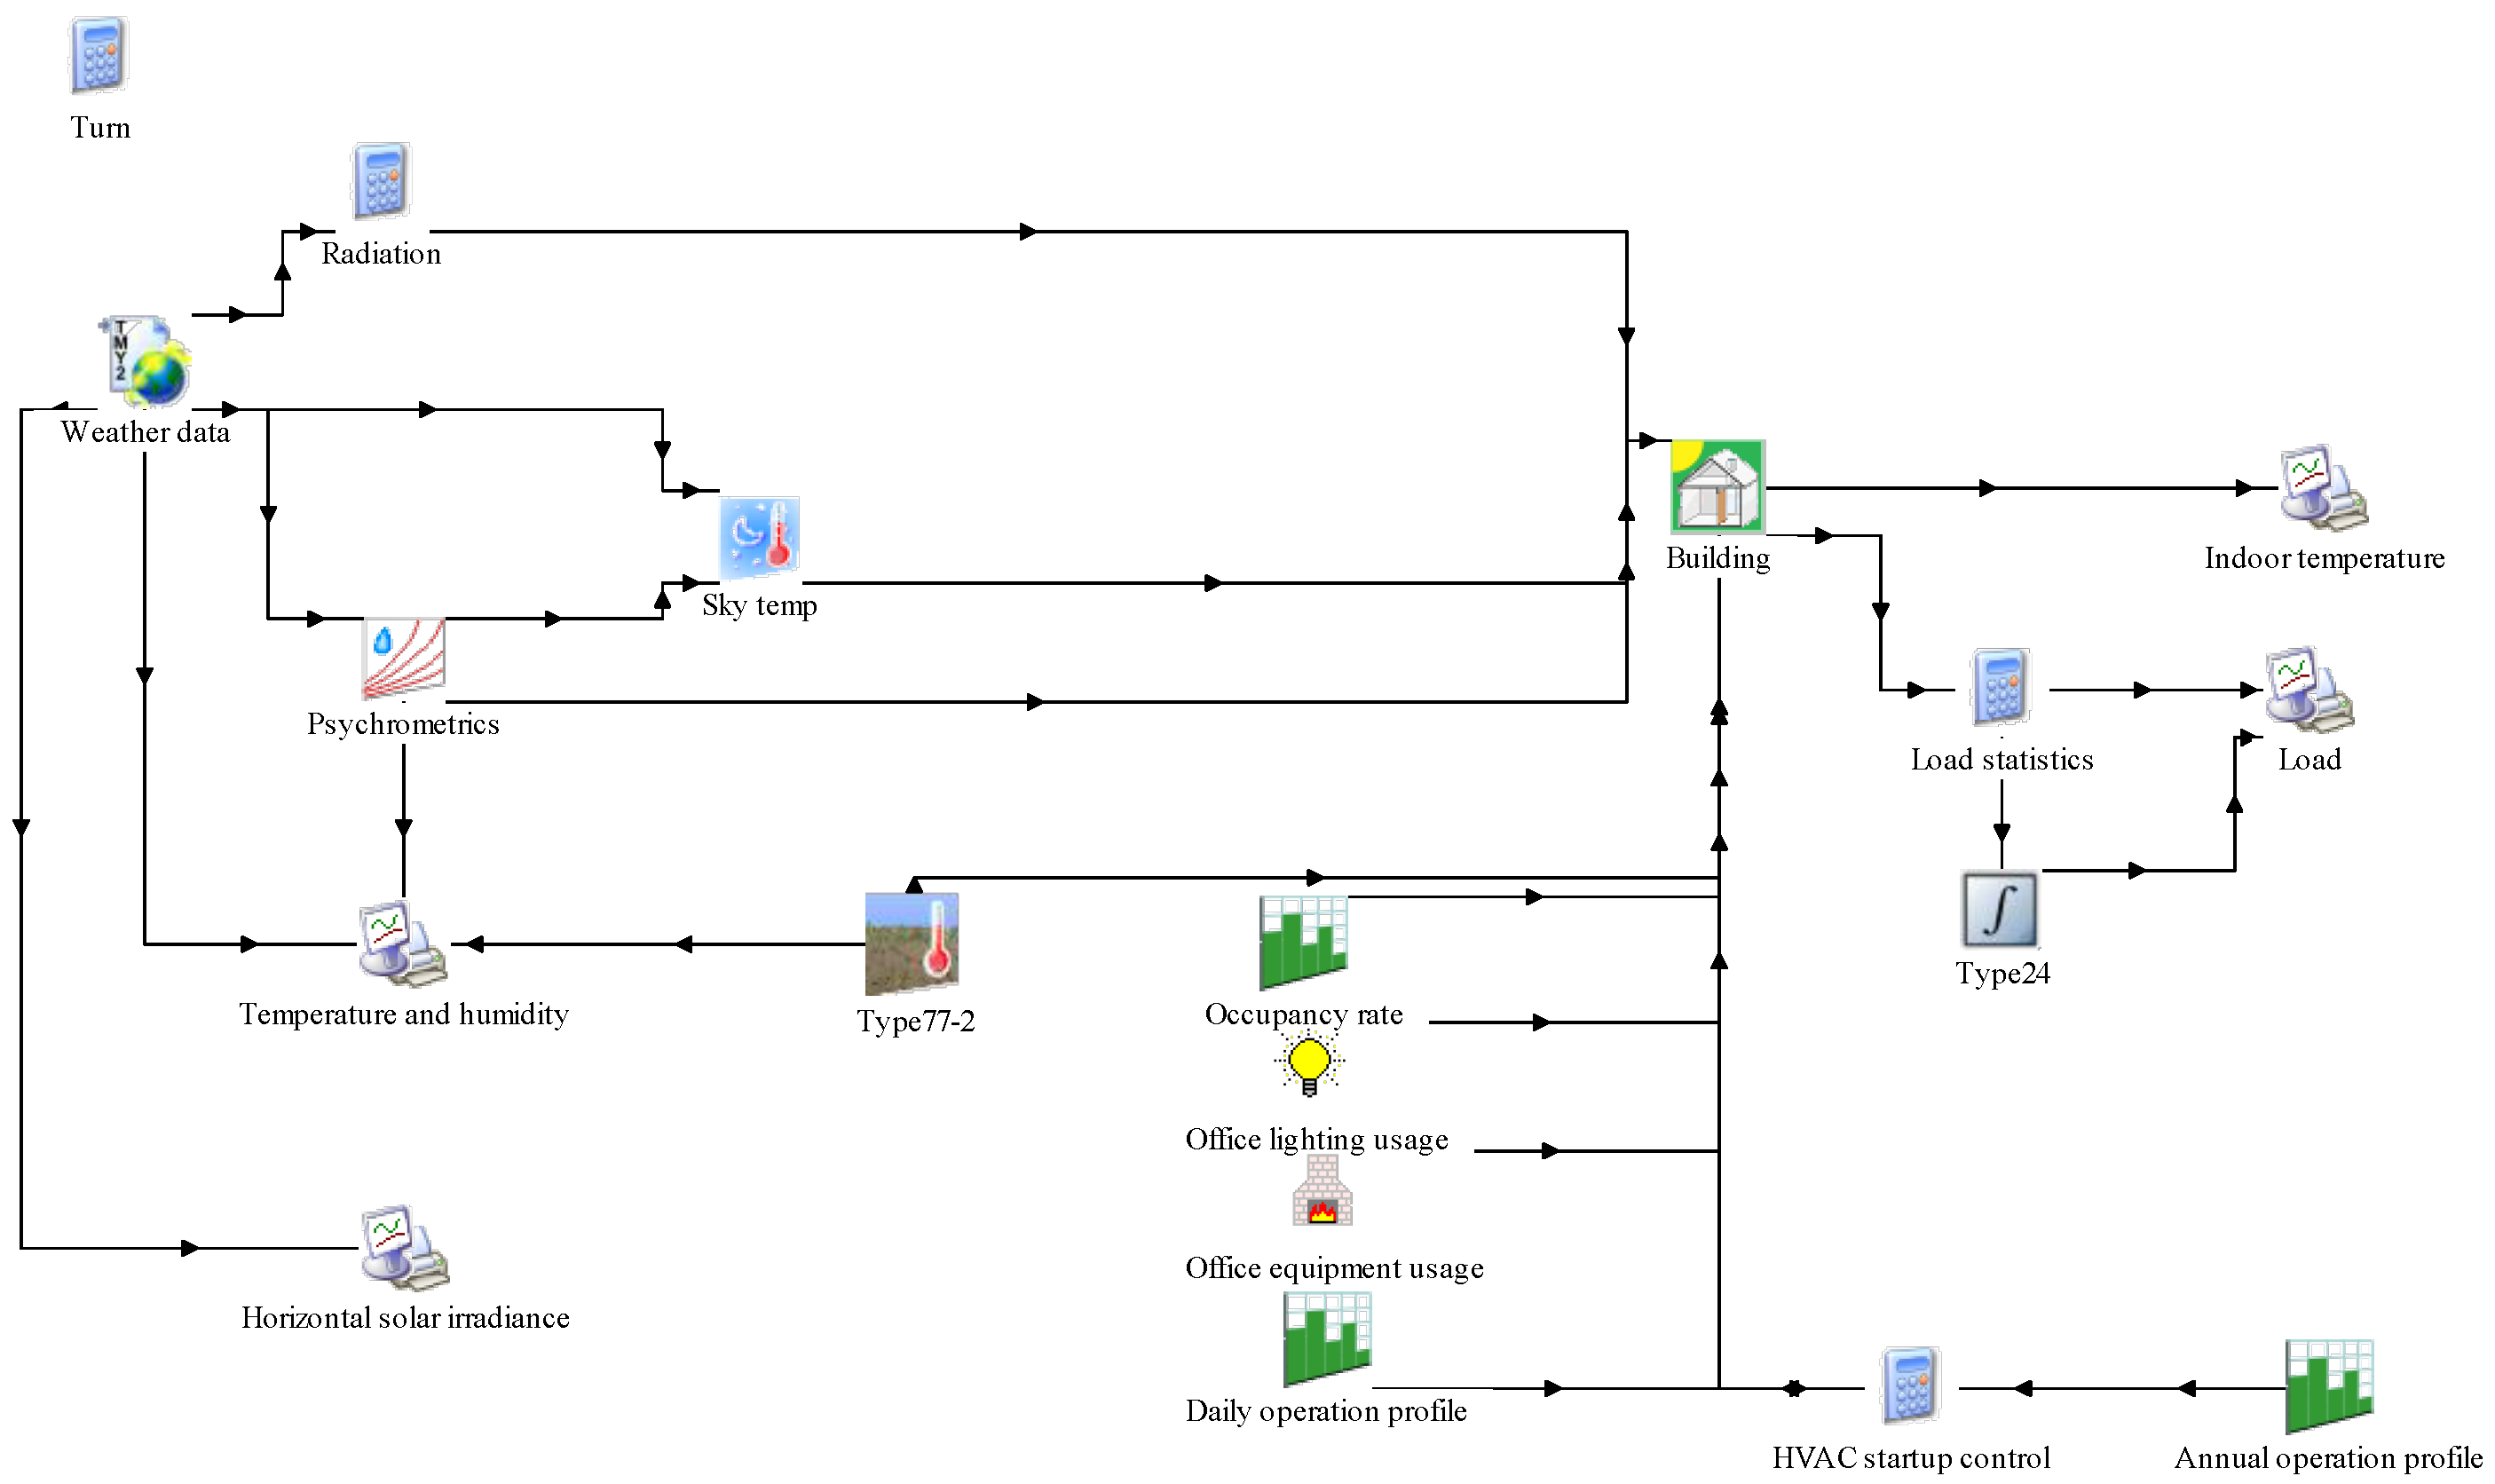
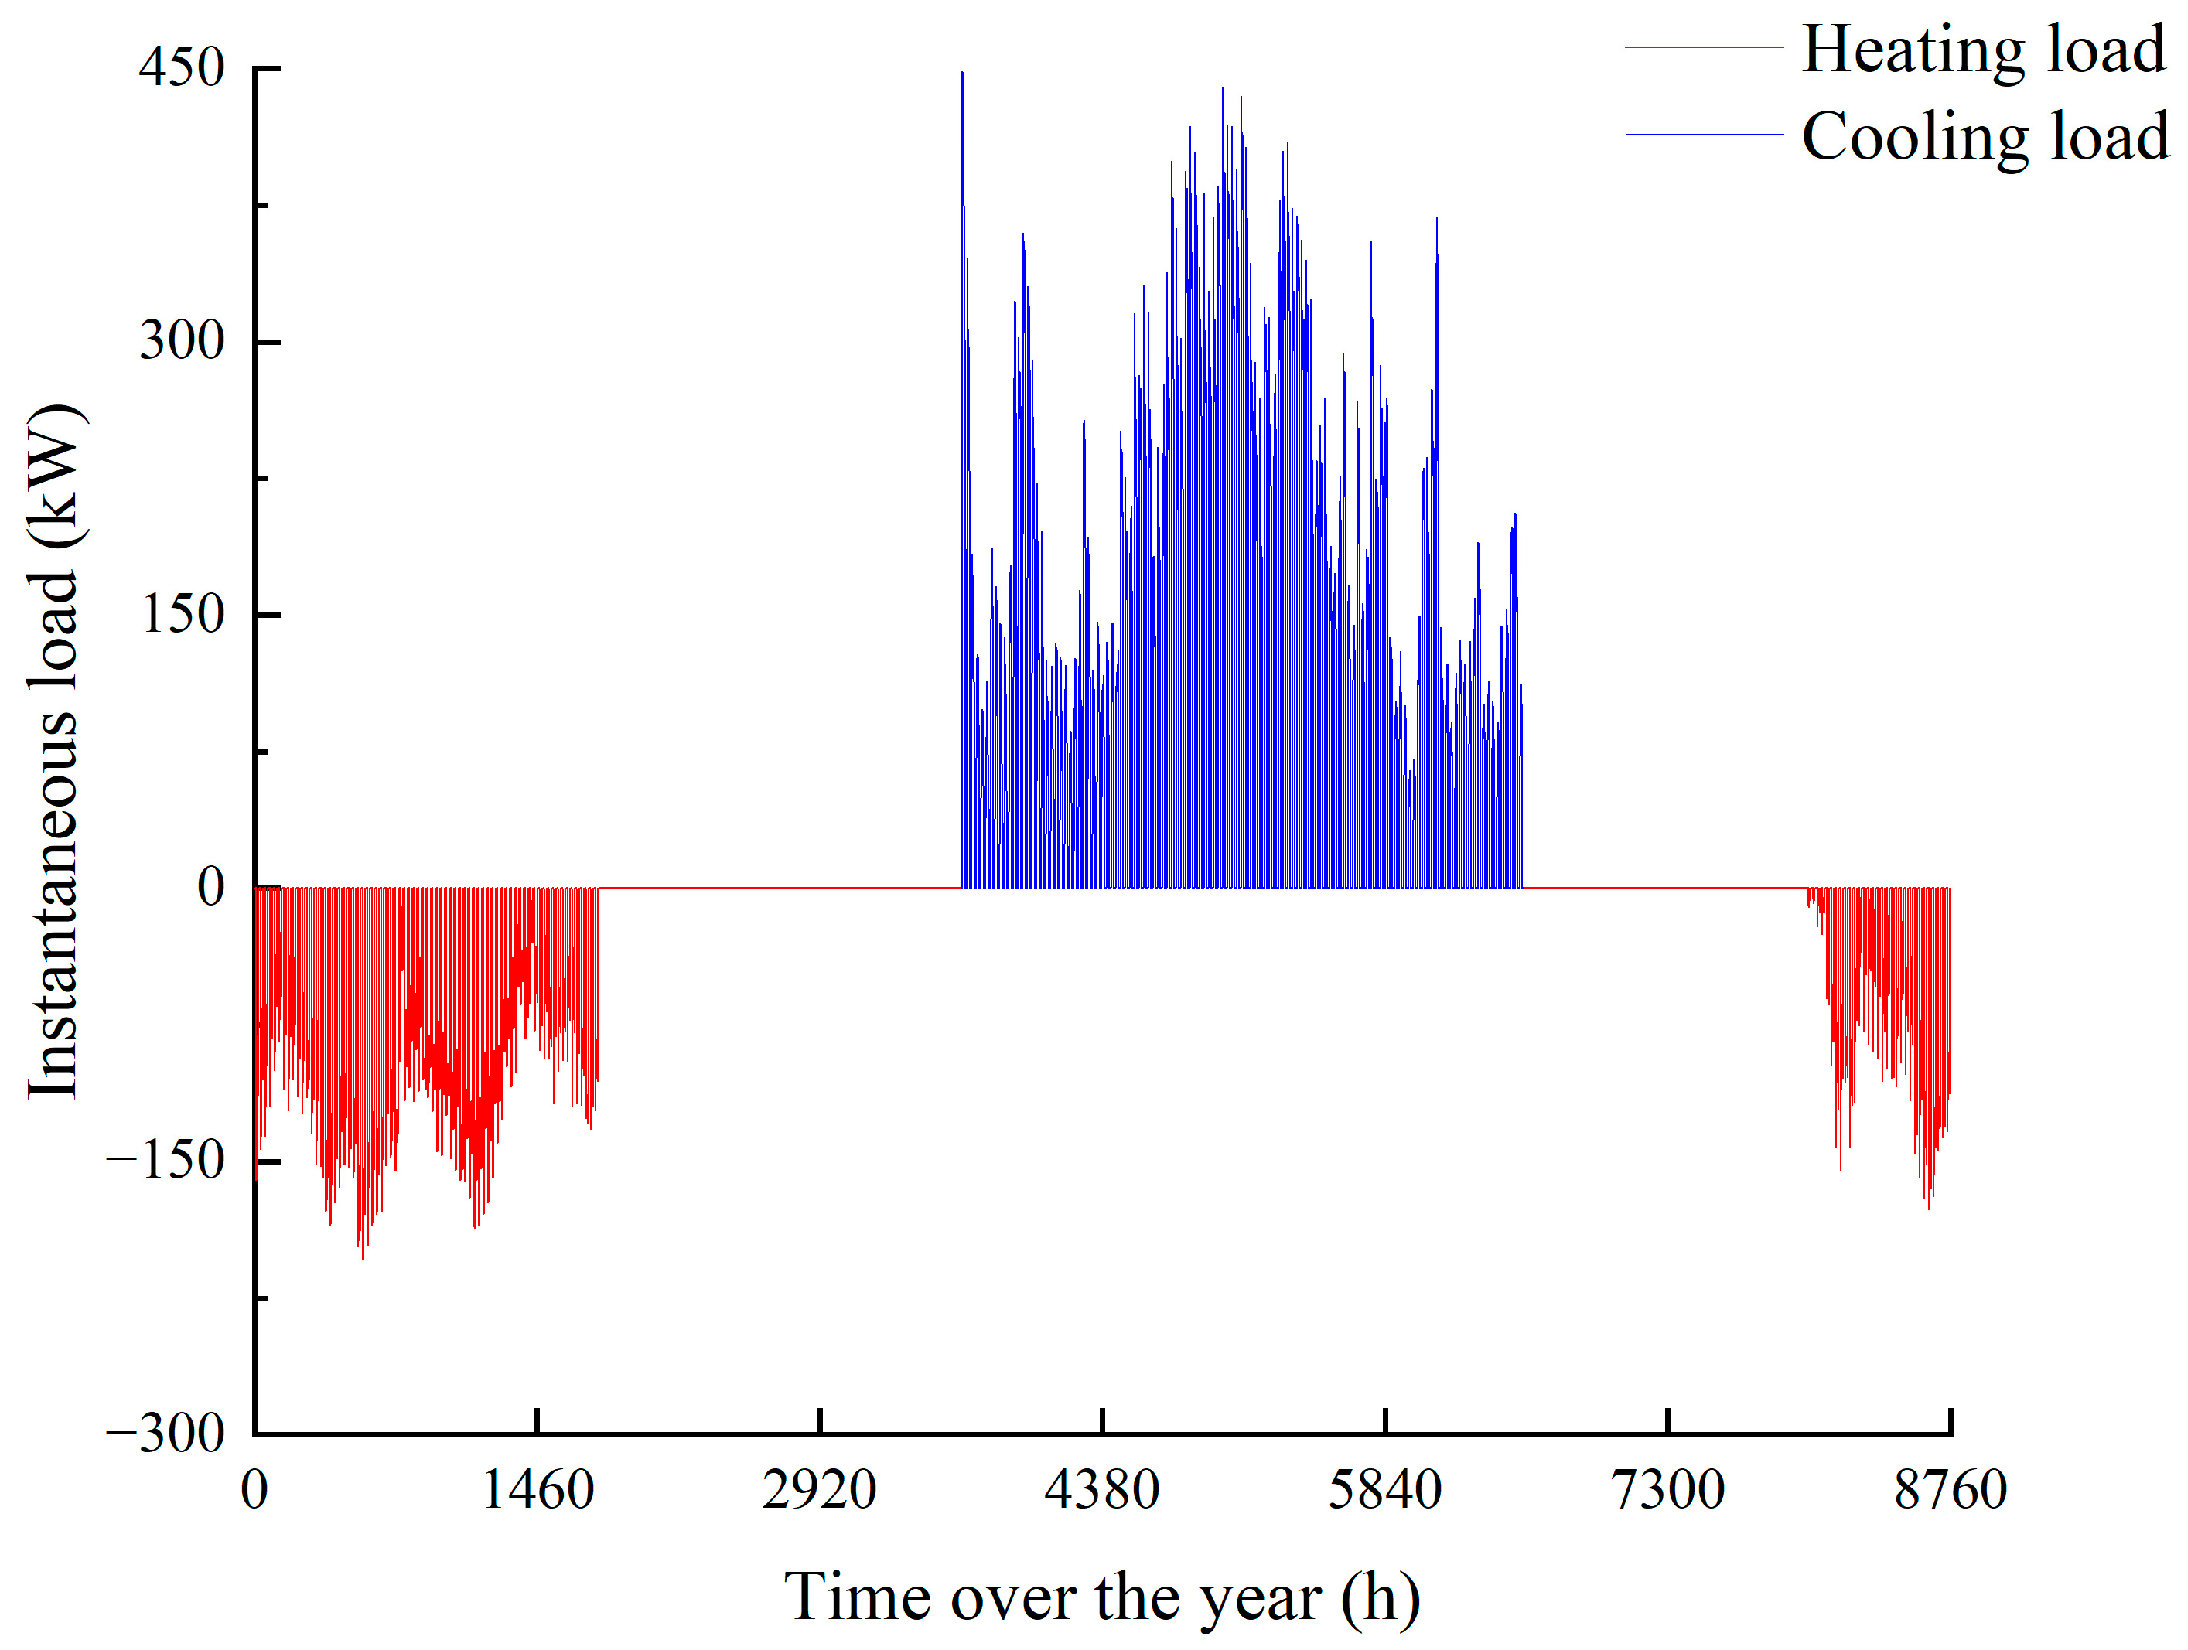
2.1. Building Description and Load Simulation

The case study focuses on a typical public office building located in Shanghai, with a total floor area of approximately 4990 m2. A GSHP system provides year-round space heating and cooling. The building primarily accommodates office work and meetings and operates from 08:00 to 20:00 on weekdays. The load profile reflects the typical energy-use pattern of buildings in hot summer and cold winter (HSCW) climate zones.
The sustained summer cooling demand in such regions often exceeds winter heating requirements, making them particularly susceptible to subsurface thermal imbalance when GSHP systems are applied. Accordingly, the selected site is consistent with the study’s focus on cooling-dominated degradation mechanisms.
Thermal performance parameters of the building envelope are based on the national energy efficiency standard (GB 50189-2015) [21]. The heat transfer coefficients for external windows, walls, ground floor, and roof are 2.2, 0.6, 0.3, and 0.4 W/(m2·K), respectively. Window-to-wall ratios are specified by orientation, including 0.22 for the east and west facades, 0.24 for the north, and 0.45 for the south, reflecting common design practices for office buildings in HSCW climate zones. Infiltration was modeled dynamically using the LEAKY profile, with an air change rate of 1.0 ACH when the HVAC system is off and 0 ACH when it is on. The GSHP system operates seasonally, with cooling active from June 1 to September 30 (hours 3649–6552) and heating from December 1 to March 15 (hours 0–1776 and 8017–8760). Indoor design conditions and internal loads are summarized in Table 1.
Hourly outdoor conditions were derived from the Typical Meteorological Year (TMY) dataset for Shanghai, generated using Meteonorm. This dataset includes 8760 hourly records of dry-bulb temperature, solar radiation, wind speed, and other climatic parameters and was used for building load and system performance simulation.
Hourly heating and cooling loads were calculated using TRNSYS, incorporating the above envelope parameters and climate inputs. Figure 1 and Figure 2 illustrate the load model schematic and the annual variation in load.
Cooling demand occurs primarily between June and September (hours 3639–6552), peaking at approximately 450 kW with strong variability. Heating demand is concentrated from December to mid-March (hours 1–1776 and 8017–8760), peaking at around 205 kW. The total annual cooling and heating loads are 303,924 kWh and 125,170 kWh, respectively, yielding a cooling-to-heating load ratio of 2.43.

2.2. Model Construction and Configuration

The GSHP system was modeled using TRNSYS 18, enabling a dynamic simulation of building loads, ground temperature response, and heat pump performance. The model configuration is shown in Figure 3.
The simulation uses the following components: heat pump unit (Type225), ground heat exchanger (Type557), fluid pumps (Type110), thermal load (Type682), and control logic (New Equation). Building thermal loads were dynamically calculated within TRNSYS based on predefined envelope parameters and meteorological inputs. The boundary conditions were applied using TMY data for Shanghai, formatted as a .tm2 file.
Several rated values were assigned as initial inputs for key simulation components. For instance, the nominal COP values for the heat pump module (Type225) were set to 4.0 in heating mode and 4.8 in cooling mode, corresponding to standard design conditions. However, these values were not held constant during simulation; instead, the COP was dynamically recalculated throughout the simulation period based on prevailing thermal conditions and real-time operating states.
Additional thermophysical parameters are described below:
  • Heating: evaporator inlet at 10 °C, condenser supply/return at 40/45 °C;
  • Cooling: condenser inlet at 25 °C, evaporator supply/return at 12/7 °C;
  • Water specific heat: 4.19 kJ/(kg·K).
The ground heat exchanger was modeled as a vertical borehole field consisting of uniformly spaced single U-tube boreholes. All materials were assigned constant thermal properties, and spatial homogeneity was assumed for the surrounding soil. The initial ground temperature was set to 17.4 °C, corresponding to the annual average air temperature in Shanghai, as derived from the Meteonorm TMY dataset. This climate-based initialization ensures that subsequent thermal evolution is governed solely by system operation, eliminating the influence of background climatic drift. Key geometric and thermophysical parameters are summarized in Table 2.
Variable-speed pumps operate separately for ground and load loops in summer and winter. Summer flow rates are 102.44 m3/h and 84.78 m3/h, with 11.96 kW and 9.90 kW power. Winter flow rates are 32.83 m3/h and 35.02 m3/h, with 3.83 kW and 4.09 kW power. Segmented control was used to reflect typical part-load operation.

2.3. Theoretical Framework of Ground–COP Coupling

To interpret how GT evolution affects system performance, a theoretical framework is established incorporating unsteady heat conduction theory, heat transfer formulation, and thermodynamic performance models.
(1)
Transient Ground Thermal Response
During long-term GSHP operation, continuous heat injection or extraction induces temperature drift in the subsurface. Assuming the soil is homogeneous and isotropic, the radial temperature distribution T r , t around a borehole can be approximated by the analytical solution to the transient heat conduction equation:
T r , t = T 0 + q 4 π λ E i r 2 4 α t ,
where
  • T 0 : initial undisturbed ground temperature (°C);
  • q : heat input per unit borehole length (W/m);
  • λ : soil thermal conductivity (W/m·K);
  • α : thermal diffusivity of soil (m2/s);
  • E i : exponential integral function.
This Equation (1) [22] characterizes the spatial decay and temporal accumulation of ground thermal disturbance. In TRNSYS, Type557 applies this logic using borehole configuration and thermal parameters.
(2)
Heat Transfer and ΔT–COP Linkage
COP of the heat pump is defined as:
C O P = Q W ,
where
  • Q : useful heat transfer (kW);
  • W : electrical input to the compressor (kW).
The heat transfer Q can also be calculated from:
Q = m ˙ c p T i n T o u t ,
Alternatively, from a heat exchanger viewpoint:
Q = U A Δ T ,
where
  • U : overall heat transfer coefficient (W/m2·K);
  • A : effective heat exchange area (m2);
  • Δ T : temperature difference between fluid inlet and outlet on the ground side.
As GT increases, T i n rises while T o u t is less responsive, expanding ΔT but also increasing thermal resistance, which ultimately shifts the heat pump’s evaporation/condensation temperatures.
(3)
Multi-Level Response Pathway: GT–ΔT–COP
To support the physical interpretation of how GT affects system efficiency, a simplified thermodynamic relationship is introduced. This formulation is not embedded within the TRNSYS simulation framework but serves as a conceptual model to elucidate the causal chain linking thermal boundary variation to performance degradation.
For idealized performance, COP can be approximated using the following Carnot-based expression:
C O P T c T c T e ,
where
  • T c : condenser temperature (K);
  • T e : evaporator temperature (K).
The use of absolute temperature (K) in this context preserves thermodynamic validity and ensures consistency with the ideal cycle formulation. For practical modeling and simulation, all temperatures including ground temperature ( T g ) and ΔT are expressed in degrees Celsius.
T e is further related to the ground temperature and heat exchange temperature difference:
T e T g Δ T ,
These expressions conceptually demonstrate that as GT ( T g ) increases due to thermal accumulation, the evaporator temperature T e also rises. This reduces the temperature lift T c T e , thereby lowering the COP. Although this simplified model does not capture dynamic system control or non-idealities, it illustrates the directional influence of GT and ΔT on efficiency, supporting the degradation pathway established in the simulation results.

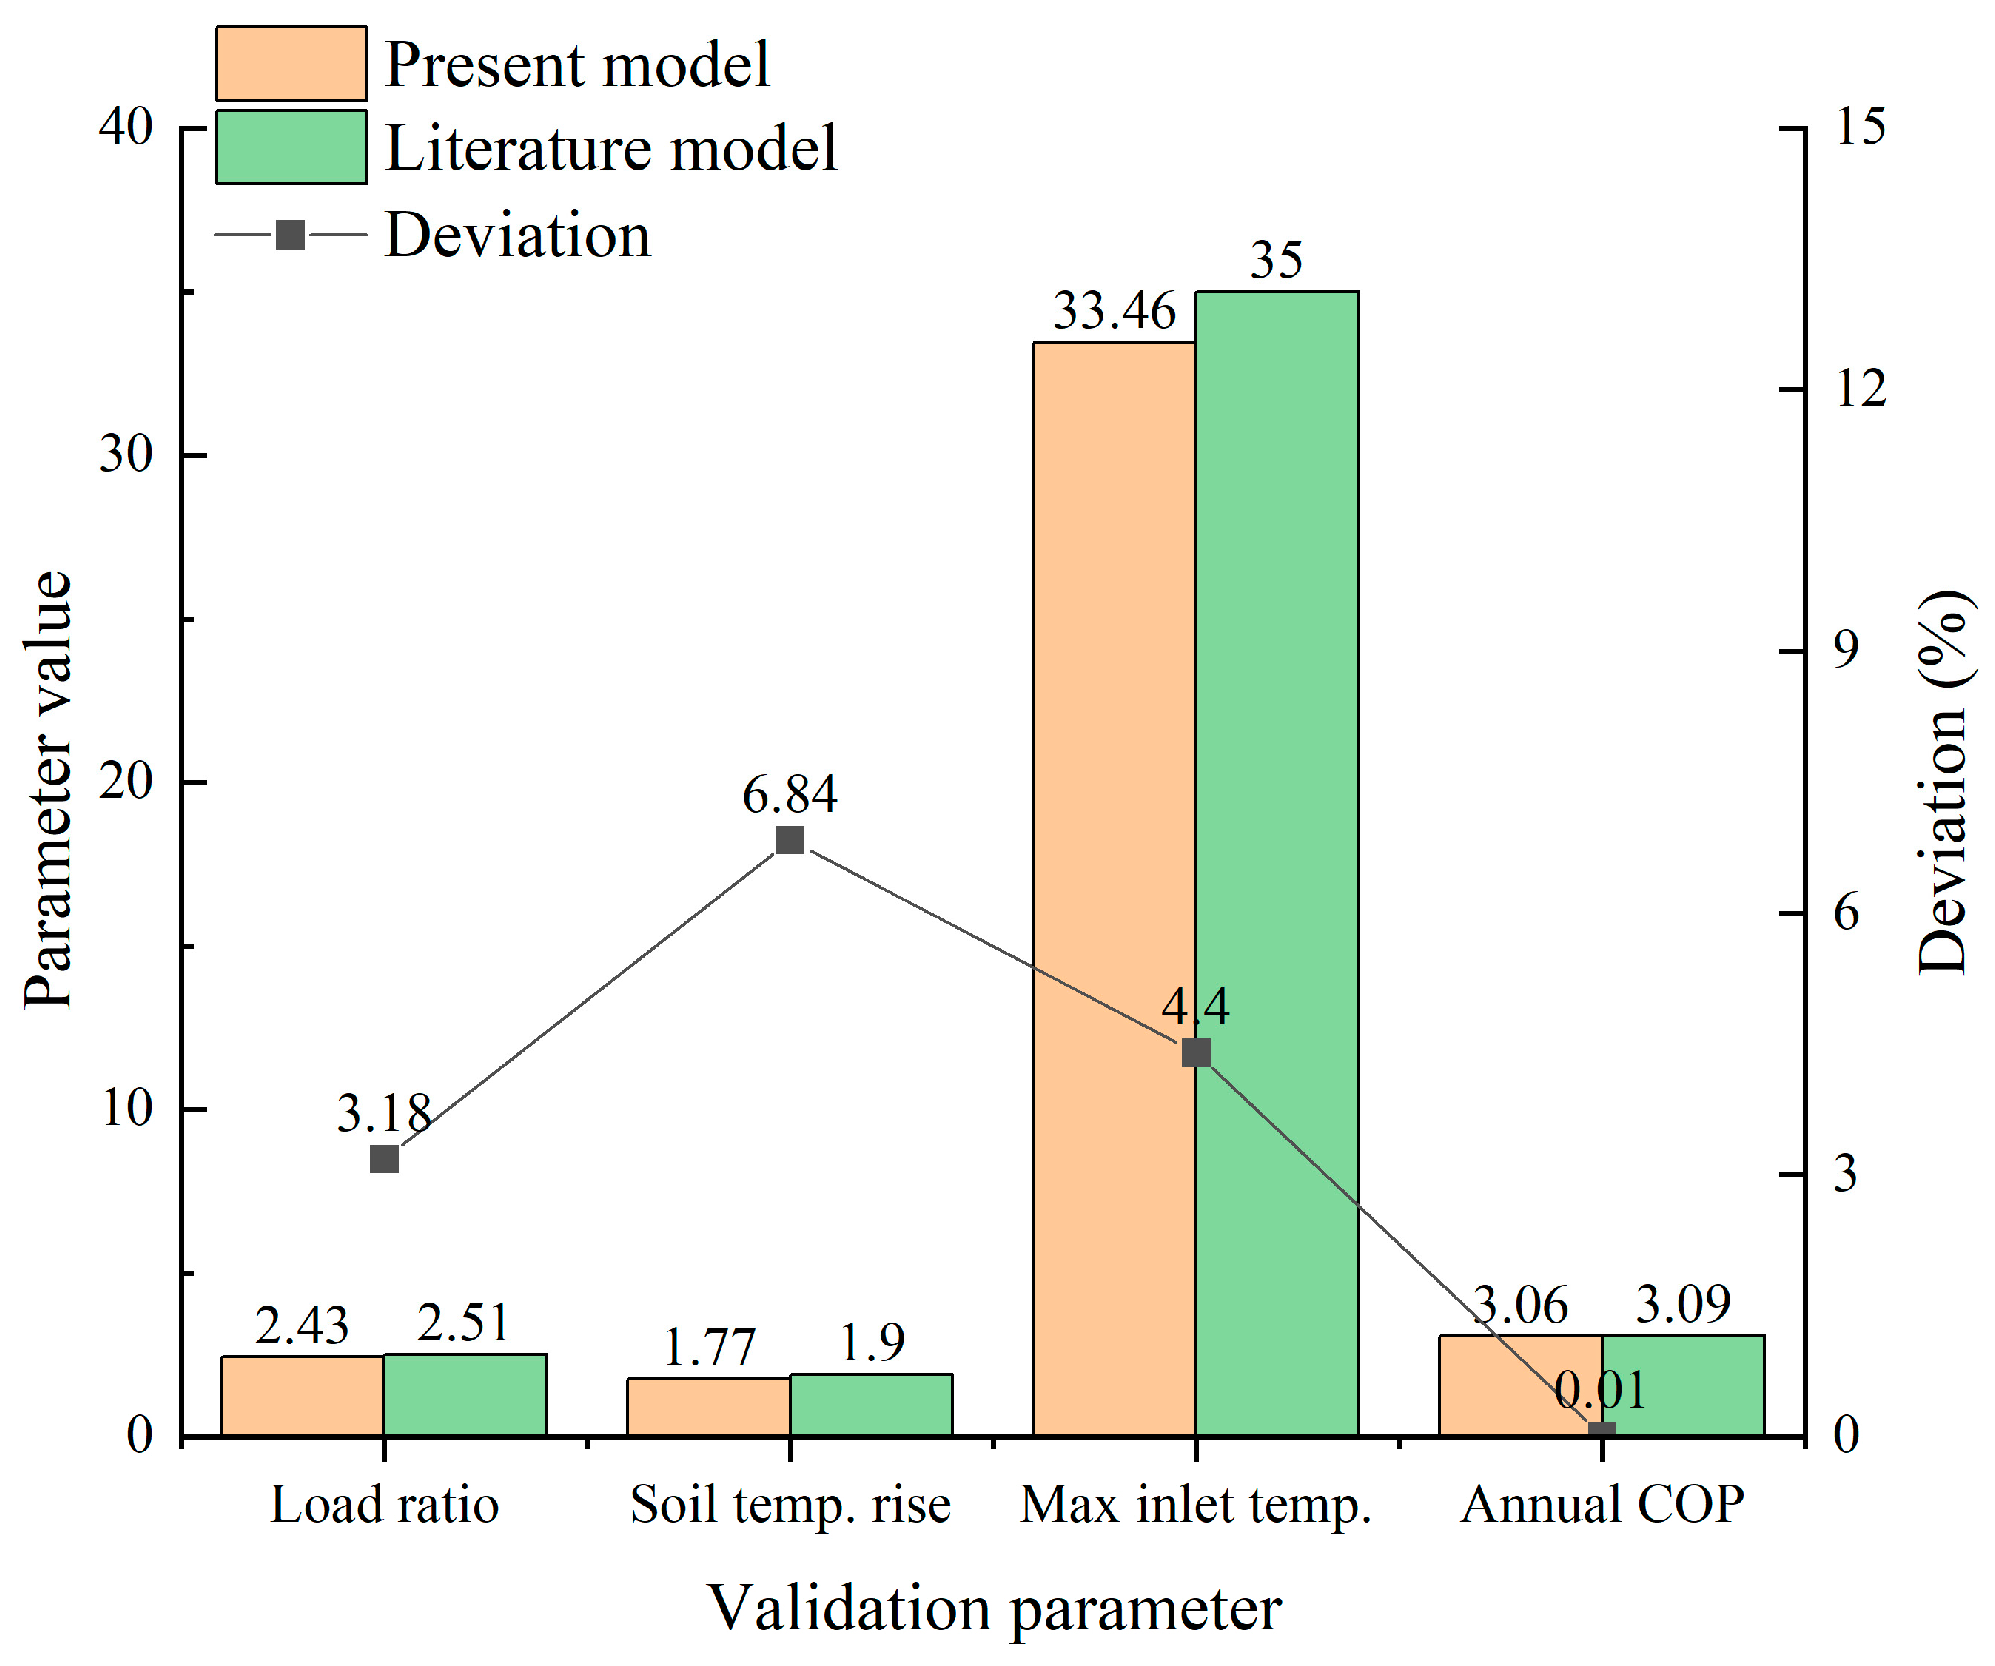
2.4. Model Validation

Model validation was performed using a published GSHP case study from Shanghai [23], and the comparison results are illustrated in Figure 4. Key indicators compared include the following:
  • Annual cooling-to-heating load ratio: simulated 2.43 vs. 2.51 (error: 3.19%);
  • Ground temperature rise: 1.77 K vs. 1.90 K (error: 6.84%);
  • Maximum inlet water temperature: 33.46 °C vs. 35.00 °C (error: 4.40%);
  • Annual average COP: 3.06 vs. 3.09 (error: 0.97%).
Figure 4. Comparison between simulation results and literature data for key thermal parameters.
Energies 18 03909 g004
All relative errors are within 10%, indicating the model reliably reflects real-world thermal behavior under similar conditions. Assumptions include homogeneous soil, no groundwater flow, constant load structure, and no auxiliary systems. While these simplify the simulation, they allow isolation of ground temperature effects.
In addition, the long-term ground temperature evolution in the simulation closely aligns with literature-reported trends under comparable boundary conditions, supporting the credibility of the model in reflecting realistic thermal accumulation effects.

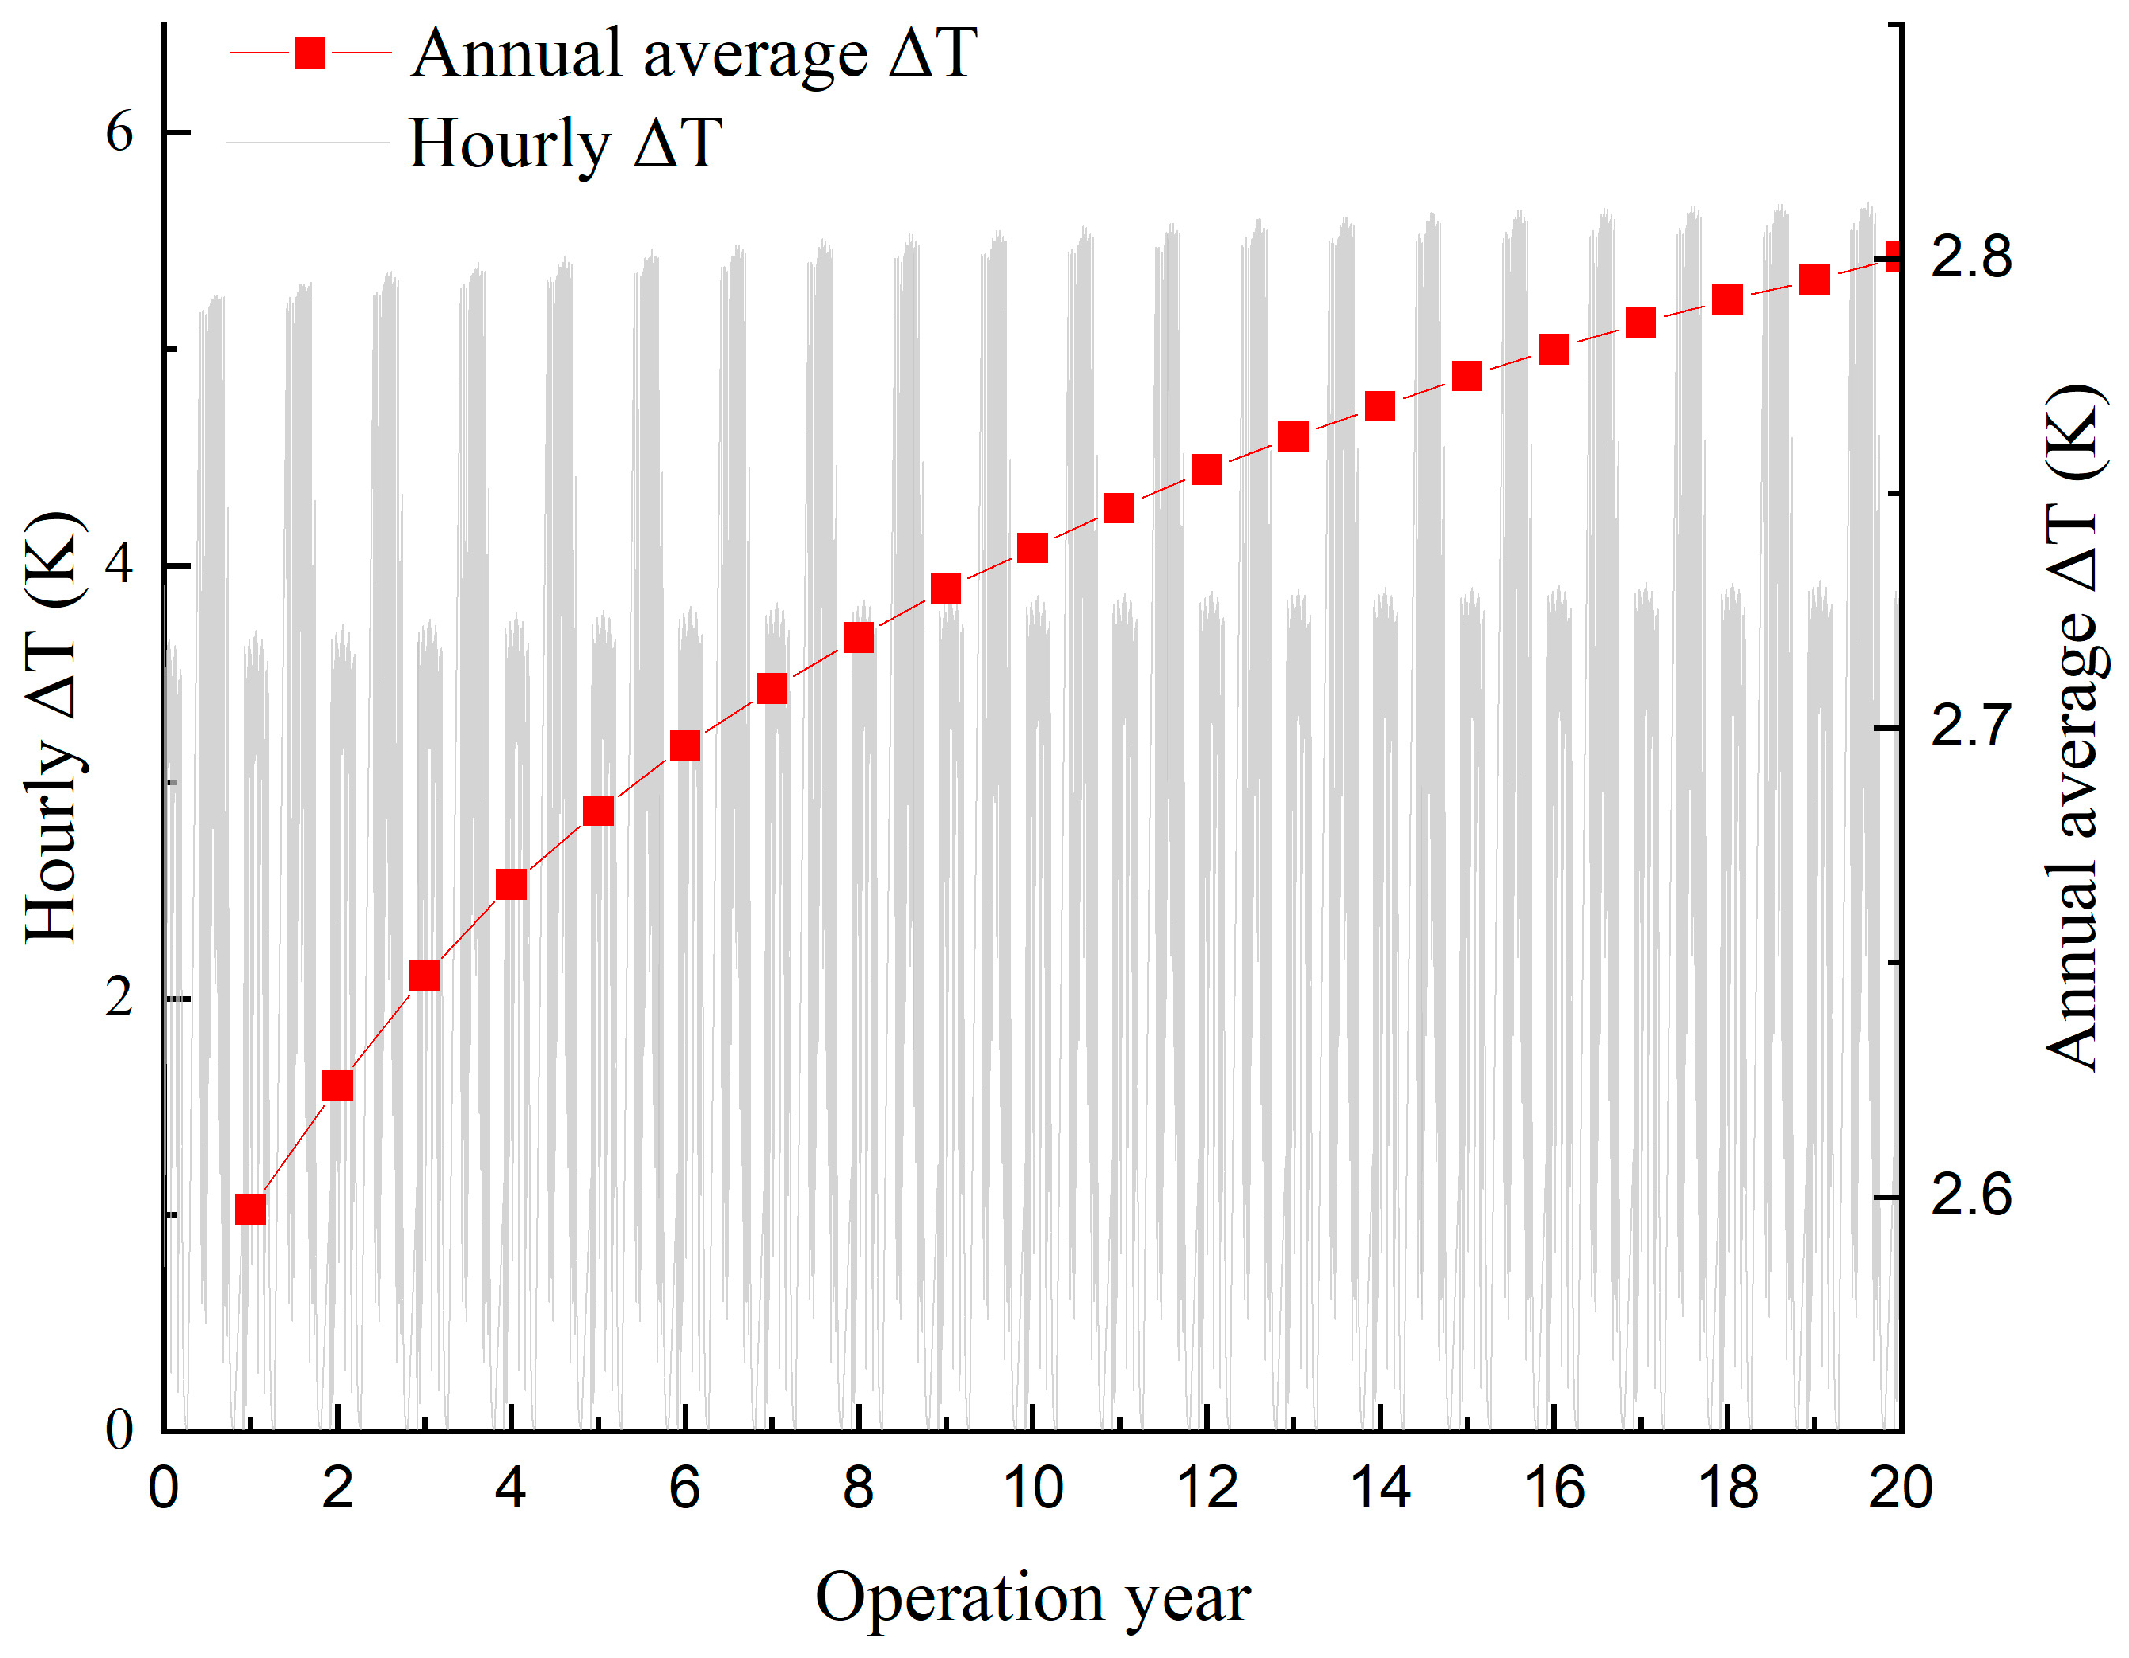
3. Results and Discussion

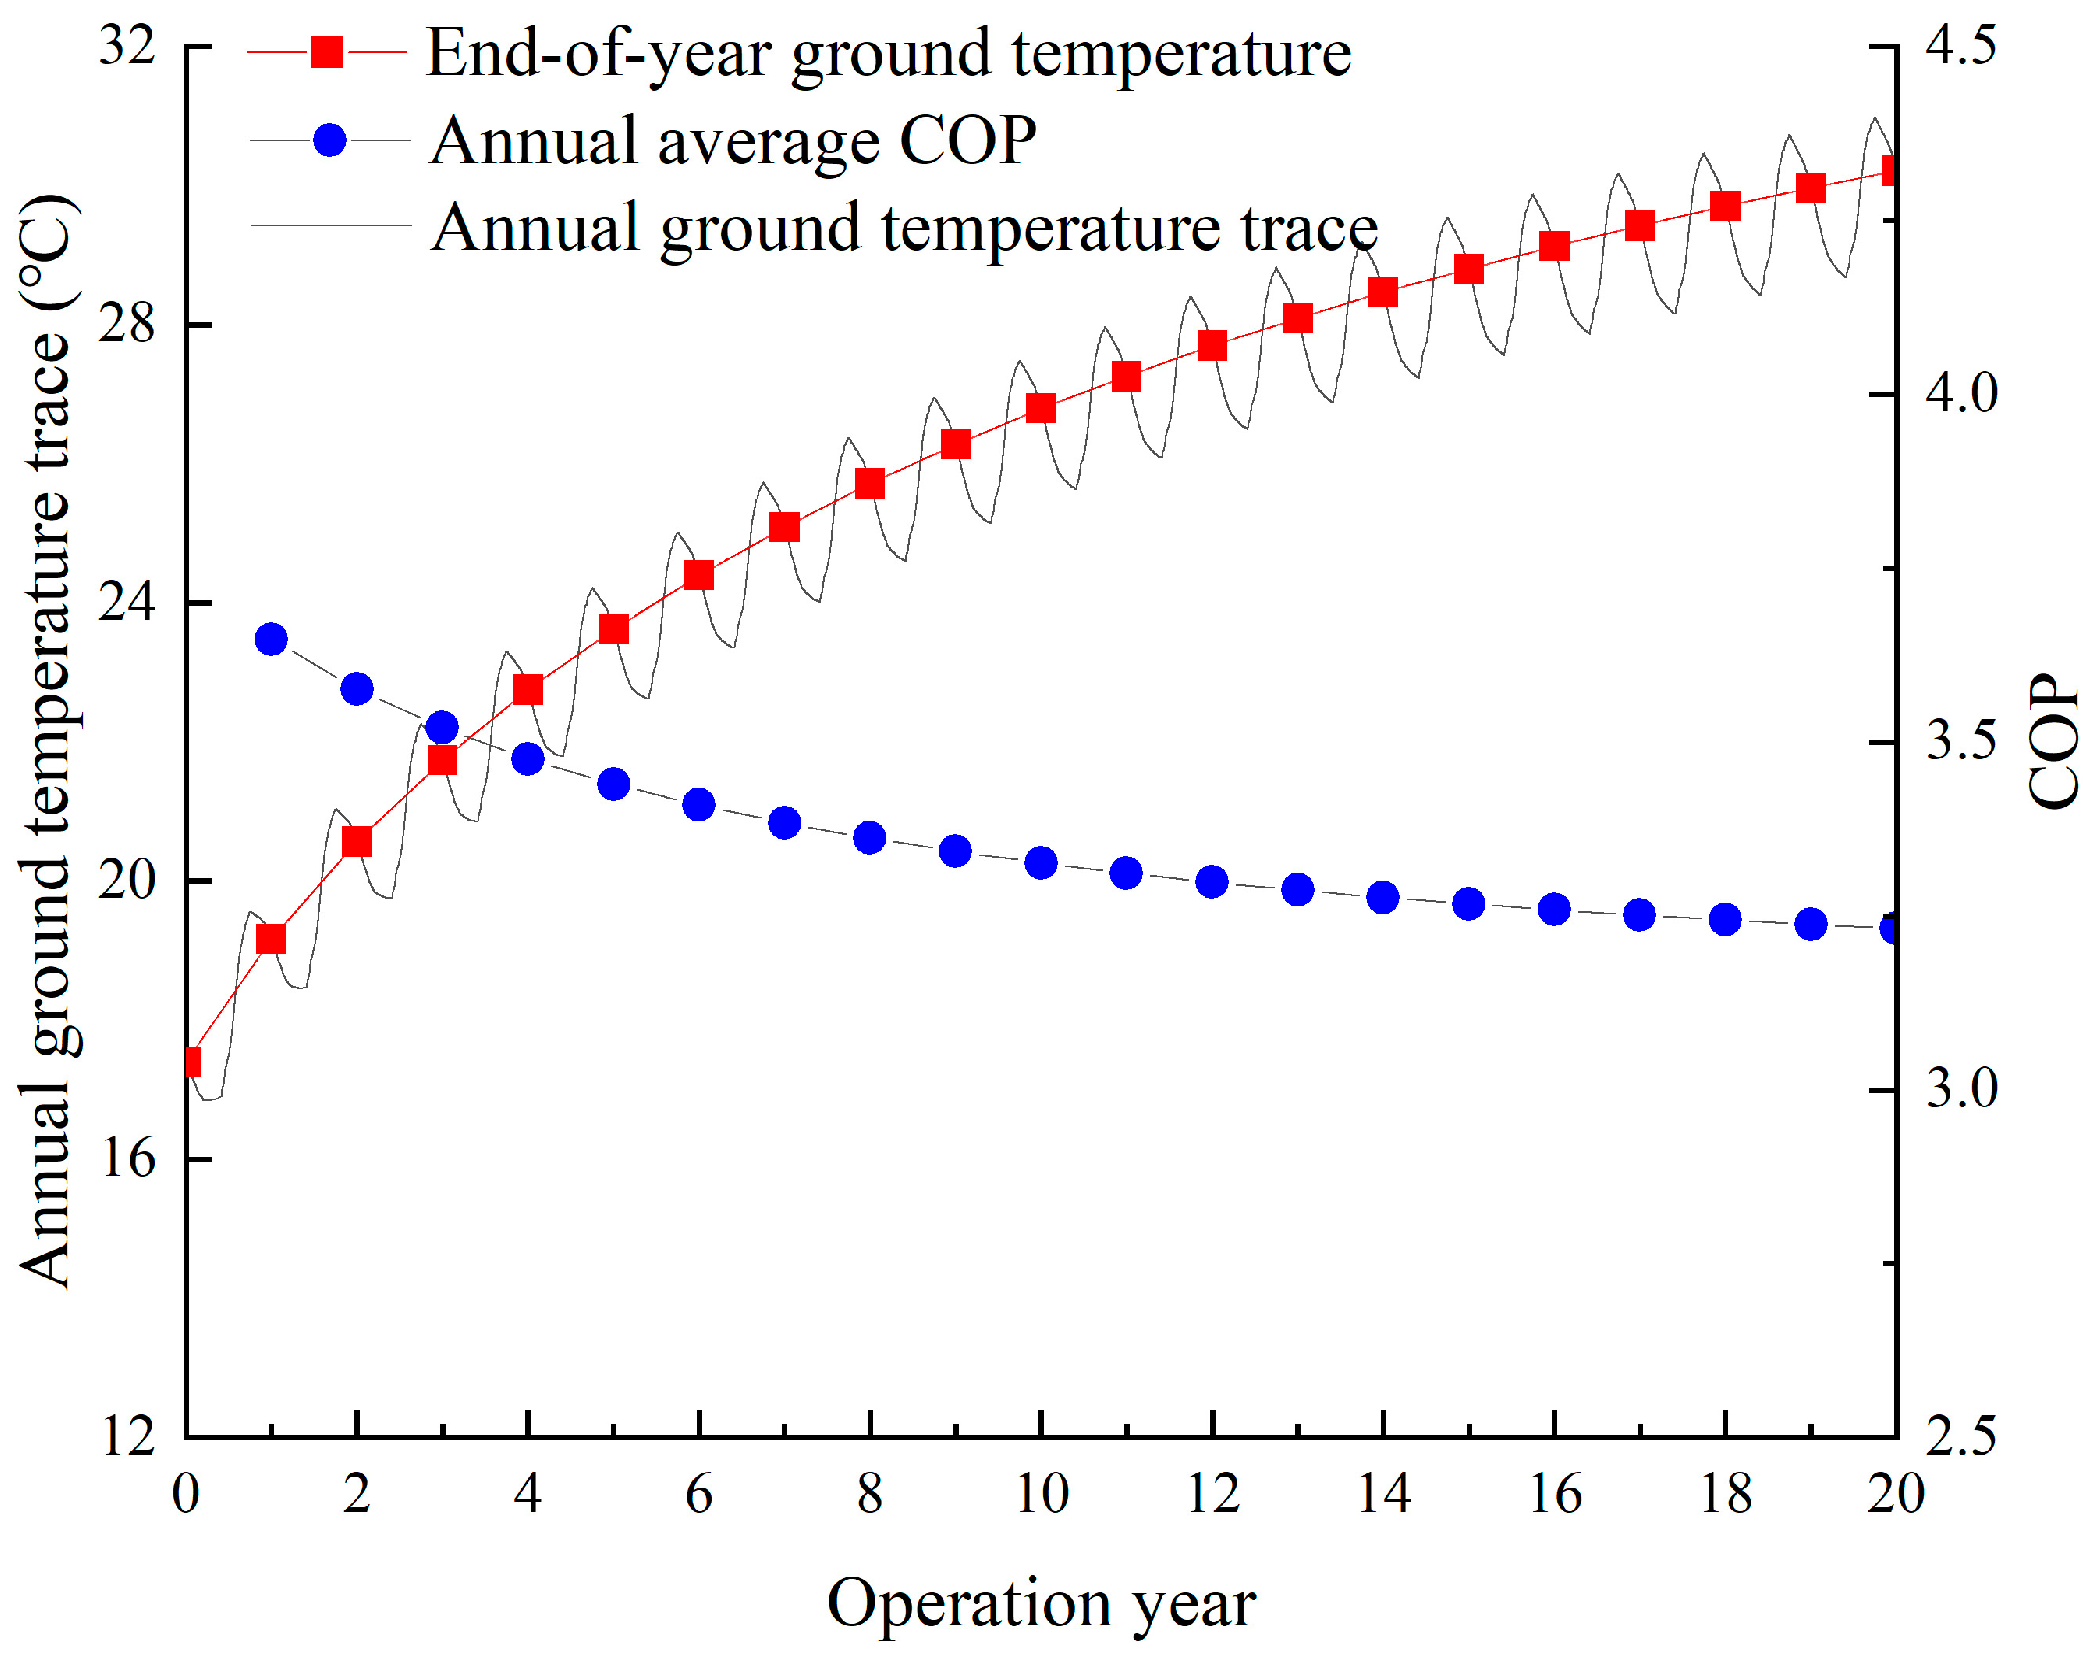
3.1. Annual-Scale Coupling Between Ground Temperature and COP

Continuous operation of GSHP systems alters subsurface thermal conditions, particularly under cooling-dominated load structures. To assess the long-term impact of GT evolution on system performance, this section analyzes a 20-year simulation. Year-end GT and the corresponding annual average COP are extracted to evaluate their coupling behavior.
Figure 5 shows the progression of GT and COP over two decades. The red line represents year-end ground temperature near the boreholes, the blue line denotes annual average COP, and the gray line traces the hourly GT profile. GT increases rapidly in the early years—from 19.17 °C in Year 1 to 22.75 °C by Year 5—averaging over 0.7 °C per year. Afterward, the rate slows to about 0.4 °C annually, reaching 30.21 °C by Year 20. This trend illustrates an initial phase of rapid heat accumulation, followed by a slower diffusion-dominated process.
In parallel, the system’s COP declines steadily, from 3.64 in Year 1 to 3.32 in Year 10, and further to 3.23 in Year 20. The close correspondence between rising GT and falling COP suggests that continuous heat accumulation degrades heat exchange boundaries, leading to a progressive loss in system efficiency.
This trend highlights a direct suppressive effect of GT on performance. As ground temperature rises, the temperature difference between the heat pump’s inlet and outlet narrows, reducing the effective heat transfer. The soil’s high thermal inertia delays recovery, reinforcing the degradation in later years. These results reveal a sequential causal chain: load imbalance induces ground thermal accumulation, which alters the boundary condition and weakens system efficiency.
Figure 6 presents a linear regression summarizing the simulated relationship between year-end GT and annual average COP over the 20-year simulation period. GT is expressed in Kelvin. As GT increases from 292.32 K to 303.36 K, the COP correspondingly decreases from 3.65 to 3.23. The fitted regression equation is provided in Equation (7):
C O P = 0.03625 T g + 14.20642 ,
This regression quantifies the rate of performance degradation associated with long-term ground temperature rise and provides a numerical representation of the trend identified in Figure 5. The results reflect that elevated ground temperature increases the return water temperature, narrows the effective heat exchange margin (ΔT), and shifts the compressor operating conditions toward reduced efficiency. While the regression does not account for all transient effects, it serves as a reference for evaluating degradation rates and comparing sensitivity across system configurations.
Figure 6. Linear regression between annual average COP and year-end ground temperature (in Kelvin).
Energies 18 03909 g006
These results are based on model scenarios with fixed daily loads, homogeneous soil properties, and no auxiliary regulation. In practical applications, operational variability and site-specific factors may affect the magnitude and timing of thermal feedback.
Figure 7 presents the hourly and annual average evolution of ΔT, defined as the temperature difference between inlet and outlet water on the ground side. Hourly fluctuations are shown in gray; annual averages are plotted in red.
The annual average ΔT increases from 2.60 K in Year 1 to 2.74 K in Year 10 and reaches 2.80 K by Year 20, with an average increment of approximately 0.01 K per year. While the annual changes are modest, the trend is consistent, with more rapid variation in the early years.
As an indicator of ground-side heat transfer intensity, ΔT reflects the changing thermal resistance at the soil–fluid interface. With rising GT, the inlet water temperature increases, but the outlet temperature responds more slowly due to the limited thermal conductivity of soil. This asymmetry widens ΔT, indicating that the system must operate under a larger temperature difference to maintain the same heat transfer rate. The increase in ΔT, therefore, serves as an indirect signal of declining heat exchange capacity.
Importantly, the synchronized trends of ΔT increase and COP decline suggest that efficiency degradation arises not only from thermodynamic cycle changes, but also from the evolving condition of the underground heat exchange boundary. The consistent timing of ΔT peaks across years confirms that the control logic and load structure remained unchanged and that the ΔT trend is governed primarily by subsurface thermal evolution.
In conclusion, ΔT functions not merely as a response variable, but as a measurable expression of boundary deterioration. Its growth reinforces the causal chain whereby rising GT increases thermal resistance, expands ΔT, and ultimately reduces COP. This behavior is consistent with the fundamental principle of heat transfer: as effective thermal conductance declines over time, the system is forced to operate under larger temperature differentials to sustain heat exchange, thereby increasing compressor energy consumption and accelerating COP degradation. This explanation is aligned with the thermodynamic formulation introduced in Section 2.3 (2), where COP decline is attributed to a combination of reduced UA values and increased ΔT due to long-term ground-side resistance buildup.

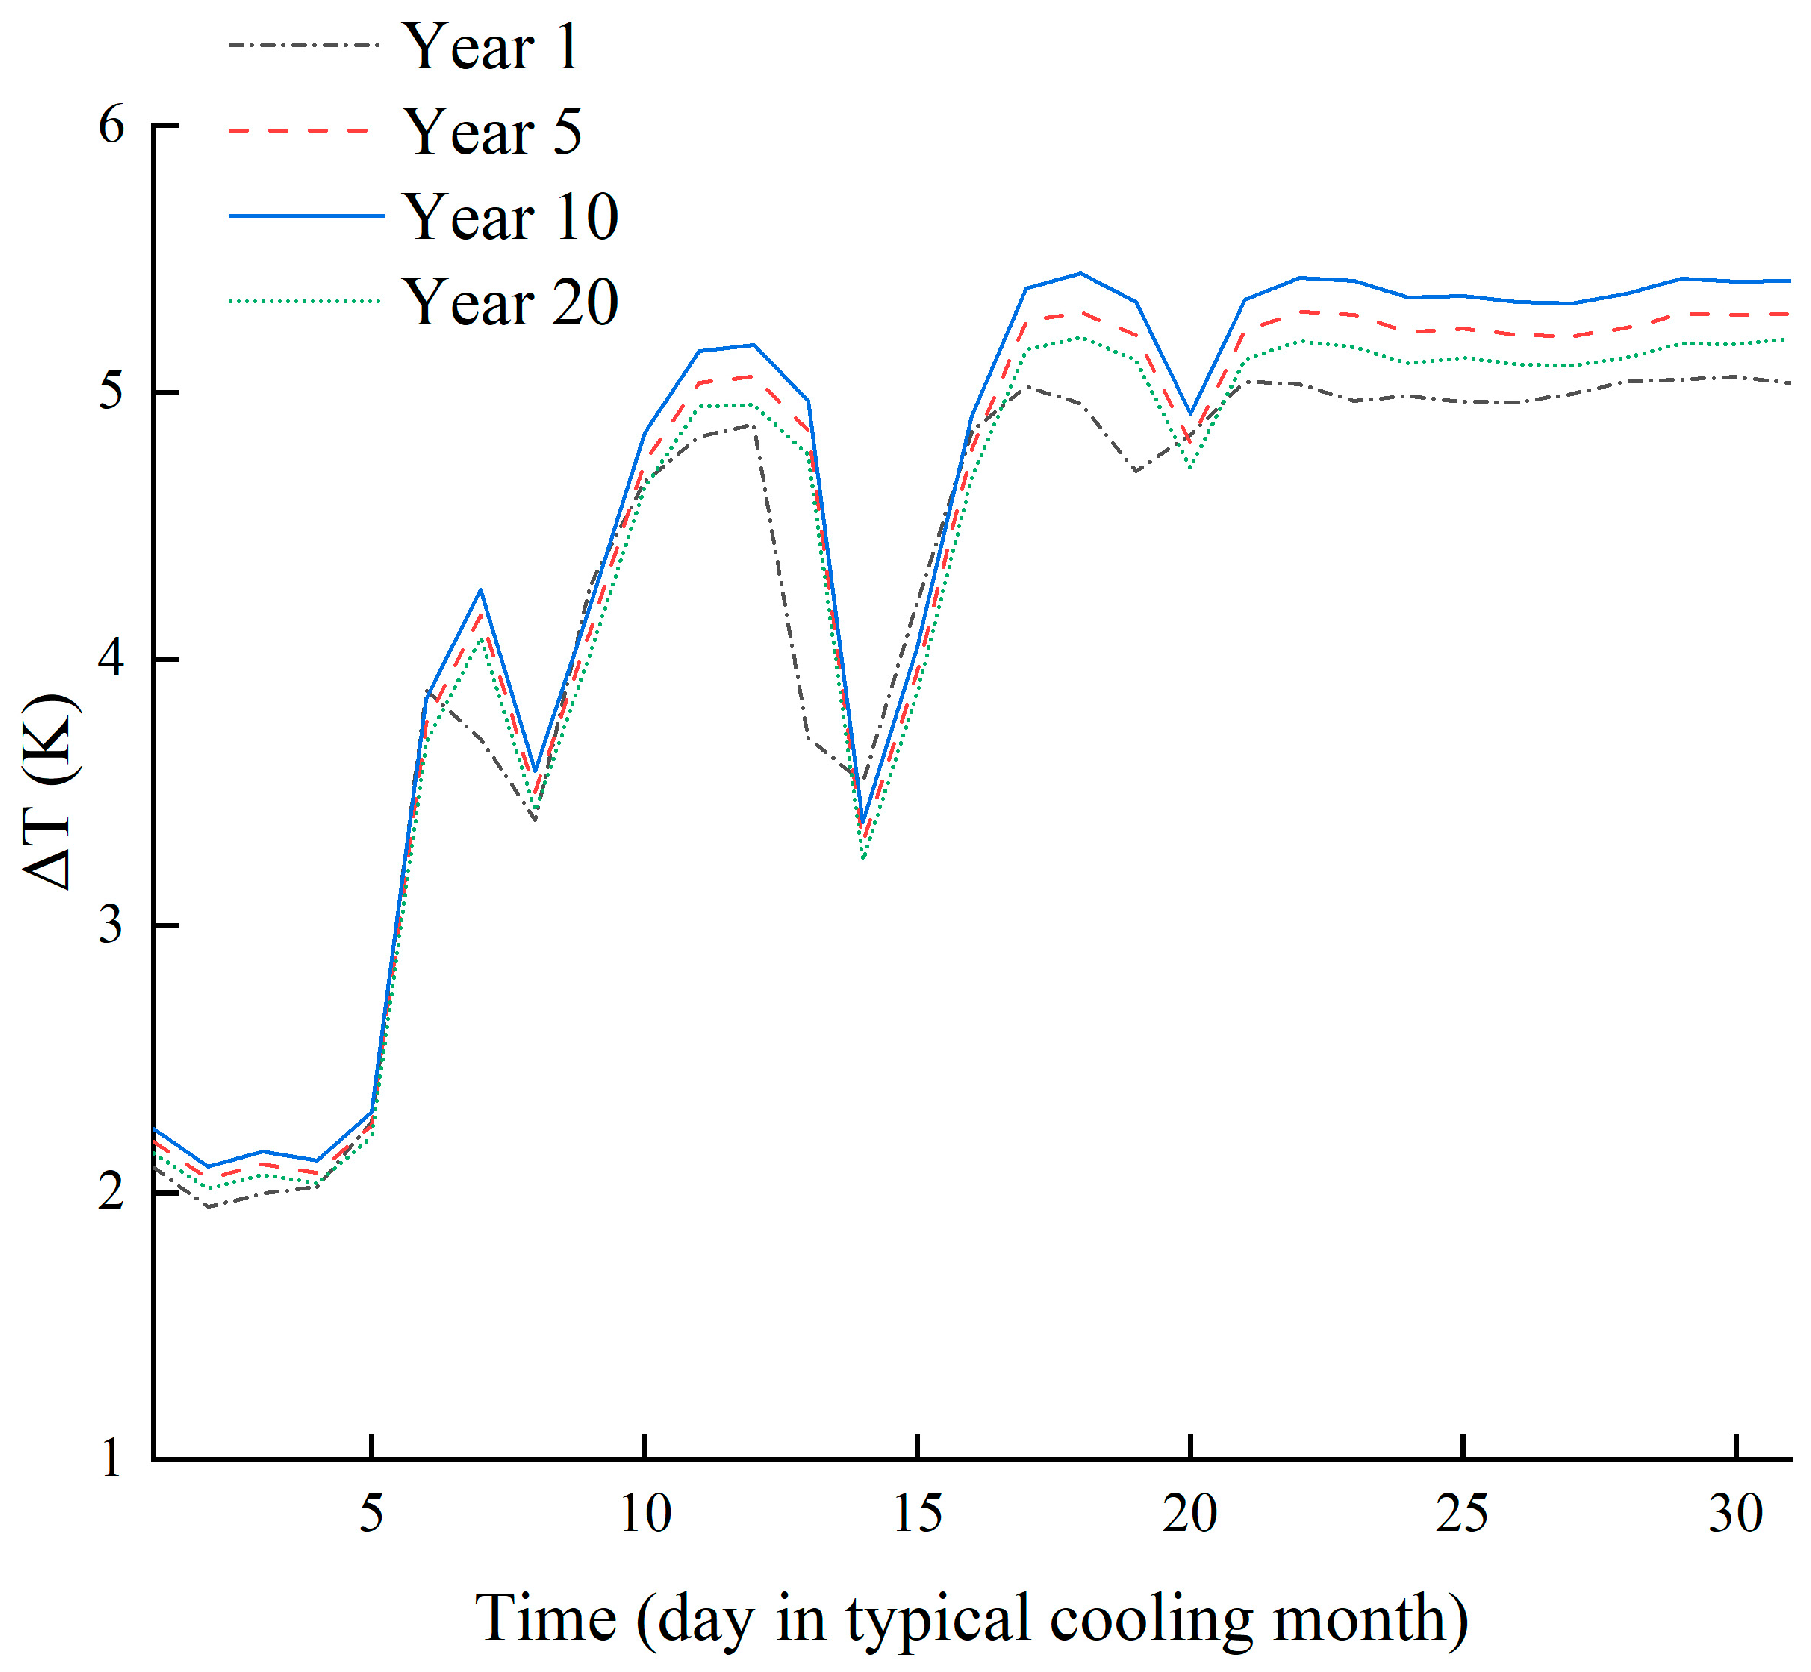
3.2. Short-Term Operational Comparison Across Typical Years

To further explore how long-term GT evolution influences short-term system dynamics, this section compares typical summer operation months from Year 1, Year 10, and Year 20. The focus lies on GT, ΔT, and COP under comparable external load conditions, revealing how variations in subsurface heat exchange boundaries affect monthly-scale performance. These observations serve as a micro-scale validation of the annual degradation trends discussed previously.
Each typical month was selected from early July during a sustained high-temperature period to ensure consistent boundary conditions and system loads. The analysis centers on ΔT fluctuation patterns, daily COP trajectories, and the system’s adaptive response to thermal stress. A sequential response logic is established: extended operation induces thermal disturbance, which in turn alters boundary resistance and drives efficiency changes.
Figure 8 presents scatter plots of COP as a function of ground-side ΔT during typical cooling weeks in Years 1, 10, and 20. In this analysis, ΔT is treated as the independent variable, representing the thermal boundary condition, while COP serves as the dependent variable, indicating the system’s energy performance response.
In Year 1, COP values range from 4.0 to 4.8, with ΔT distributed over a relatively wide interval. The scatter exhibits a distinct inverse correlation with a pronounced slope, suggesting strong heat exchange capability and high regulatory flexibility. In comparison, the point distributions in Years 10 and 20 shift downward and become increasingly compact. By Year 20, most data points cluster within a narrow band of elevated ΔT and reduced COP, indicating a transition to a boundary-constrained regime with limited performance adjustability.
Despite unchanged external thermal loads, the system compensates for declining subsurface thermal conductivity by operating under higher ΔT conditions. According to classical heat transfer theory, when effective thermal conductance (UA) deteriorates, a greater ΔT is required to maintain the same heat flux. However, this compensatory behavior results in elevated compression ratios and further COP degradation.
Across all three years, a negative correlation between ΔT and COP is consistently observed. However, the response slope flattens over time, implying a diminished sensitivity of COP to ΔT variation as ground thermal conditions degrade. The increasingly compressed scatter bands illustrate a reduction in dynamic response range and reflect long-term entrapment within a narrow operational state space.
The observed decrease in both slope and scatter range reflects a progressive loss of regulatory elasticity. This trend is indicative of a quasi-linearized response regime driven by elevated thermal inertia, wherein the marginal effect of ΔT on heat transfer continues to decline under constrained boundary conditions. As the ground approaches saturation, further increases in ΔT yield diminishing returns in heat exchange, resulting in performance entrapment within a narrow efficiency band.
These findings underscore the dual role of ΔT—as both an indicator of heat transfer intensity and a proxy for subsurface thermal degradation. The evolving COP–ΔT relationship supports the degradation pathway previously introduced, wherein long-term ground temperature accumulation leads to ΔT compression and reduced energy performance. The figure thus links the long-term trend to short-term operational manifestations.
Figure 9 illustrates the daily average ΔT trends during a typical cooling month in Years 1, 5, 10, and 20. All curves exhibit consistent intra-month fluctuations, with pronounced peaks observed around days 5–12 and 25–30. This pattern confirms that the building load profile and control logic remained unchanged across simulation years, thereby isolating the observed differences in ΔT as a result of ground temperature evolution.
Over time, the ΔT curve shifts progressively upward. In Year 1, ΔT remains relatively low, with peak values below 5.5 K, indicating strong ground-side responsiveness and a sufficient thermal margin. By Year 5, the entire curve rises modestly, while Years 10 and 20 show increasingly elevated and flattened trends, particularly during high-load intervals. This sequential increase reflects the growing thermal resistance in the ground and the narrowing temperature difference required to maintain stable heat exchange.
Moreover, the rate of ΔT increase slows noticeably in later years. While the rise from Year 1 to Year 5 is comparable to that between Years 10 and 20, the overall trend suggests that the system is approaching a thermal saturation point, where further ΔT expansion becomes increasingly constrained.
The addition of Year 5 helps reveal the transitional behavior between early and late operational states. Rather than an abrupt shift, the system undergoes a gradual transition from a load-responsive regime to a boundary-constrained condition. As the ground temperature rises, ΔT becomes less adjustable, and the system adopts more restrictive regulation strategies to prevent thermal overshoot. These include narrower control bands, reduced modulation flexibility, and constrained compressor staging.
By Year 20, the system operates in a high-resistance state, where ΔT adjustments are confined within a limited range. While short-term adaptability is retained, its effectiveness diminishes under thermally saturated conditions. This trend confirms that long-term subsurface thermal accumulation compresses the system’s regulation capacity and transitions it toward a constraint-limited operational paradigm.

3.3. Coupling Mechanism and Causal Pathway Between Ground Temperature, Load, and COP

Building on the preceding analysis of long-term evolution and short-term operation, this section systematically summarizes the coupling mechanism between ground temperature disturbance, building load, and heat pump COP. A physical response framework of Load–GT–COP is proposed to clarify the underlying cause-effect structure governing performance degradation. Unlike conventional studies that focus solely on GT–COP regression correlations, the proposed pathway model highlights the dominant role of load imbalance as the disturbance source and positions ΔT as a key bridging variable in the transmission process. This structure provides a more comprehensive understanding of how operational conditions drive efficiency variation.
Over time, imbalanced heating and cooling loads accumulate in the subsurface environment, inducing progressive thermal disturbance that raises the ground temperature and gradually alters the heat exchange boundary. Elevated GT reduces the available temperature differential for heat transfer, compressing the effective ΔT and triggering a sustained decline in system COP. At the annual scale, GT and COP exhibit a consistent negative correlation. At the daily scale, regulatory flexibility decreases, and the system shifts from load-driven to boundary-limited operation.
To further clarify the internal causal links, a generalized response pathway was constructed based on the observed mechanisms under both cooling and heating seasons. The framework, illustrated in Figure 10, identifies three sequential processes that characterize the system’s dynamic response under typical conditions.
The pathway includes the following three stages:
Load-Driven Activation: Building heating or cooling loads serve as external inputs, directly determining the on/off status and intensity of system operation. As load increases, system runtime and fluid circulation rise, leading to greater heat exchange demand over time and initiating sustained operation.
Thermal Source Response: Enhanced heat exchange leads to intensified heat extraction or injection, disturbing the ground temperature field. This disturbance is captured through changes in inlet temperature and ΔT, serving as the primary transmission channel from load input to COP variation.
Efficiency Feedback: Variations in ΔT alter the evaporation or condensation temperature, thereby shifting the compressor pressure ratio and ultimately affecting COP. This thermodynamic relationship aligns with the conceptual formulation introduced in Section 2.3 (3), wherein a reduction in ΔT—driven by elevated ground temperature—results in a lower evaporation temperature or a higher condensation temperature. These changes increase the compression ratio and subsequently reduce COP. This feedback process manifests at short time scales and is influenced by both ground temperature conditions and the system’s regulatory capacity.
The arrows in Figure 10 indicate the directional relationships between variables, reflecting the internal feedback structure of the system under typical operating conditions. This pathway not only reveals the underlying coupling mechanism but also lays the theoretical foundation for the subsequent analysis of path divergence, sensitivity identification, and boundary optimization strategies.
From a systems perspective, the GSHP can be interpreted as a nonlinear dynamic system governed by thermal load input, boundary resistance modulation, and efficiency output. Within this structure, ΔT serves as a critical state variable bridging external disturbance and internal feedback, exhibiting both a transmission and regulation role. This highlights the system’s characteristic state-feedback behavior and the importance of boundary coupling in long-term performance dynamics.

4. Conclusions

Over a 20-year simulation period, the GSHP system exhibits a measurable decline in performance due to continuous ground heat accumulation. The annual average COP decreases from 3.64 in Year 1 to 3.32 in Year 10, and further to 3.23 in Year 20, corresponding to a total efficiency loss of 11.3%. Concurrently, the end-of-year GT increases from 19.17 °C to 30.21 °C, indicating a progressive shift in the subsurface thermal boundary.
The long-term degradation trend is quantified by a linear regression between year-end GT and annual average COP, yielding the following relationship:
C O P = 0.03625 T g + 14.20642
Based on a regression using Tg expressed in Kelvin, the results indicate that each 1 °C increase in ground temperature corresponds to an average COP decrease of approximately 0.038 under continuous operation. This confirms that rising thermal boundaries directly impair system efficiency over time. The ΔT increase also shows signs of slowing in later years, suggesting that the system enters a thermally saturated state where further performance degradation proceeds at a diminished rate.
Beyond annual performance indicators, the simulation also validates a causal degradation pathway linking external loads to internal efficiency decline. The system operates under a multi-step mechanism: persistent cooling-dominated load imbalance gradually increases subsurface ground temperature; this temperature rise reduces the ground-side heat transfer potential, compressing ΔT between the circulating fluid and the ground; the resulting ΔT reduction weakens the instantaneous heat exchange rate and ultimately leads to a decrease in COP. In this context, ΔT functions as a mediating variable that transmits the effect of ground temperature evolution to system-level performance decline. The proposed Load–GT–ΔT–COP degradation chain is consistently observed across both long-term, year-based simulations and short-term operational dynamics during typical cooling weeks, demonstrating the structural robustness of the underlying mechanism.
The current model adopts several simplifying assumptions, such as treating the soil as homogeneous, excluding groundwater flow, and maintaining fixed building load profiles throughout the simulation. These idealized boundary conditions are intended to isolate the time-dependent trajectory of system degradation and allow for the extraction of a stable relationship between ground temperature and COP over a multi-year operational period. The regression coefficient obtained from this simulation therefore represents a conservative estimate of performance loss under continuously accumulating thermal stress. In real-world applications, effects such as lateral heat dissipation through heterogeneous soil conditions and temporal variation in building loads may mitigate long-term efficiency degradation. Future studies should incorporate coupled hydrothermal models, dynamically varying load conditions, and adaptive operational strategies to enhance the accuracy and applicability of predictions. Nevertheless, the present modeling framework captures the core physical mechanisms that drive performance decline in ground-source heat pump systems and provides a reliable foundation for evaluating thermal imbalance risks and long-term system behavior. These factors suggest that the derived regression slope of −0.038 per °C represents an upper-bound estimate under idealized constraints. In real systems, groundwater flow may dissipate heat laterally and reduce the rate of GT accumulation, while seasonal or intermittent loads could interrupt continuous heat buildup. Both effects may attenuate the strength of long-term degradation and flatten the COP decline trajectory. To enhance the interpretive power and practical relevance of the findings, future work should quantitatively evaluate these effects under coupled hydrothermal and variable load scenarios.

Author Contributions

Conceptualization, Y.H.; methodology, Y.H.; simulation, Y.H.; writing—original draft preparation, Y.H.; writing—review and editing, Z.Z. and M.S. All authors have read and agreed to the published version of the manuscript.

Funding

This research received no external funding.

Data Availability Statement

The data presented in this study are available on request from the corresponding author. The data are not publicly available because they were generated using TRNSYS simulation models and contain configuration files that are specific to the research project.

Acknowledgments

During the preparation of this manuscript, the author used ChatGPT-4 (OpenAI, 2024) for language editing and grammar checking. The author has reviewed and edited the output and takes full responsibility for the content of this publication.

Conflicts of Interest

The authors declare no conflict of interest.

Abbreviations

The following abbreviations are used in this manuscript:
GTGround temperature
GSHPGround source heat pump
COPCoefficient of performance
ΔTHeat exchange temperature difference on the ground source side
HSCWHot summer and cold winter
TMYTypical Meteorological Year

References

  1. Hepbasli, A.; Kalinci, Y. A Review of Heat Pump Water Heating Systems. Renew. Sustain. Energy Rev. 2009, 13, 1211–1229. [Google Scholar] [CrossRef]
  2. Kavanaugh, S.P.; Rafferty, K. Ground-Source Heat Pumps: Design of Geothermal Systems for Commercial and Institutional Buildings; ASHRAE: Atlanta, GA, USA, 1997. [Google Scholar]
  3. Lund, J.W.; Toth, A.N. Direct Utilization of Geothermal Energy 2020 Worldwide Review. Geothermics 2021, 90, 101915. [Google Scholar] [CrossRef]
  4. Christodoulides, P.; Christou, C.; Aresti, L.; Stylianou, I.I.; Florides, G.A. Operation Performance of a Ground Source Heat Pump System in the Mediterranean Climate Zone: First Results. Energy Effic. 2025, 18, 21. [Google Scholar] [CrossRef]
  5. Chanchayanon, T.; Chaiprakaikeow, S.; Jotisankasa, A.; Inazumi, S. Enhancing Smart City Energy Efficiency with Ground Source Heat Pump Systems and Integrated Energy Piles. Smart Cities 2024, 7, 3547–3586. [Google Scholar] [CrossRef]
  6. Zhao, Z.; Shen, R.; Feng, W.; Zhang, Y.; Zhang, Y. Soil Thermal Balance Analysis for a Ground Source Heat Pump System in a Hot-Summer and Cold-Winter Region. Energies 2018, 11, 1206. [Google Scholar] [CrossRef]
  7. Choi, W.; Ooka, R.; Nam, Y. Impact of Long-Term Operation of Ground-Source Heat Pump on Subsurface Thermal State in Urban Areas. Sustain. Cities Soc. 2018, 38, 429–439. [Google Scholar] [CrossRef]
  8. Kim, S.K.; Lee, Y. Evaluation of Ground Temperature Changes by the Operation of the Geothermal Heat Pump System and Climate Change in Korea. Water 2020, 12, 2931. [Google Scholar] [CrossRef]
  9. Chiasson, A.D.; Rees, S.J.; Spitler, J.D. A Preliminary Assessment of the Effects of Groundwater Flow on Closed-Loop Ground Source Heat Pump Systems. ASHRAE Trans. 2000, 106, 380–393. [Google Scholar]
  10. Xu, L.; Pu, L.; Zhang, S.; Li, Y. Hybrid Ground Source Heat Pump System for Overcoming Soil Thermal Imbalance: A Review. Sustain. Energy Technol. Assess. 2021, 44, 101098. [Google Scholar] [CrossRef]
  11. Sagia, Z.; Rakopoulos, C.; Kakaras, E. Cooling Dominated Hybrid Ground Source Heat Pump System Application. Appl. Energy 2012, 94, 41–47. [Google Scholar] [CrossRef]
  12. Salhein, K.; Kobus, C.; Zohdy, M. Control of Heat Transfer in a Vertical Ground Heat Exchanger for a Geothermal Heat Pump System. Energies 2022, 15, 5300. [Google Scholar] [CrossRef]
  13. Cho, Y.H.; Shin, J.H. A Variable Water Flow Rate Control Method of Hybrid Geothermal Heat Pump Systems. Renew. Energy 2024, 214, 120456. [Google Scholar] [CrossRef]
  14. Yuan, T.; Zhuang, Z.; Yu, M. Study on Long-Term Operation Characteristics of the Medium-Deep Ground Source Heat Pump System with Solar Heat Storage. Appl. Therm. Eng. 2024, 225, 120266. [Google Scholar] [CrossRef]
  15. Gamage, K.; Chung, J.; Pathirana, W.P.M.R.; Harbor, D.J.; Jo, W.; Jeem, A.; Chung, J. A Cost-Effective 3D Finite Element Model for Predicting Transient Heat Transfer in U-Tube Ground Heat Exchangers. In Proceedings of the 2024 Global Energy Conference (GEC), Batman, Turkey, 4–6 December 2024; IEEE: New York, NY, USA. [Google Scholar] [CrossRef]
  16. Wang, P.; Wang, Y.; Gao, W.; Xu, T.; Wei, X.; Shi, C.; Qi, Z.; Bai, L. Uncovering the Efficiency and Performance of Ground-Source Heat Pumps in Cold Regions: A Case Study of a Public Building in Northern China. Buildings 2023, 13, 1564. [Google Scholar] [CrossRef]
  17. Gebhardt, H.; Mohammadi, H.S.; Ebert, A. High-Resolution Monitoring and Simulation of the Temperatures in a Borehole Heat Exchanger Field over Multiple Years. In Proceedings of the International Ground Source Heat Pump Association Conference, Montreal, QC, Canada, 28–30 May 2024. [Google Scholar] [CrossRef]
  18. Mohammadzadeh Bina, S.; Fujii, H.; Kosukegawa, H.; Inagaki, F. A Predictive Model of Long-Term Performance Assessment of Ground Source Heat Pump (GSHP) Systems in Japanese Regions. Geothermics 2024, 119, 102955. [Google Scholar] [CrossRef]
  19. Lan, T.; Hu, R.; Tang, Q.; Han, M.; Wu, S.; Liu, G. A Multivariate Nonlinear Regression Prediction Model for the Performance of Cooling Tower Assisted Ground Source Heat Pump System. Energy Convers. Manag. 2025, 325, 119333. [Google Scholar] [CrossRef]
  20. Xie, Y.; Hu, P.; Peng, D.; Zhu, N.; Lei, F. Development of a Group Control Strategy Based on Multi-Step Load Forecasting and Its Application in Hybrid Ground Source Heat Pump. Energy 2023, 273, 127196. [Google Scholar] [CrossRef]
  21. GB 50189-2015; Design Standard for Energy Efficiency of Public Buildings. China Architecture & Building Press: Beijing, China, 2015.
  22. Hellström, G. Ground Heat Storage: Thermal Analyses of Duct Storage Systems. Ph.D. Thesis, Department of Mathematical Physics, University of Lund, Lund, Sweden, 24 May 1991. [Google Scholar]
  23. Liu, Z.; Li, Y.; Xu, W.; Yin, H.; Gao, J.; Jin, G.; Lun, L.; Jin, G. Performance and feasibility study of hybrid ground source heat pump system assisted with cooling tower for one office building based on one Shanghai case. Energy 2019, 173, 28–37. [Google Scholar] [CrossRef]
Figure 1. Schematic of the building load model.
Energies 18 03909 g001
Figure 2. Annual hourly variation in cooling and heating loads.
Energies 18 03909 g002
Figure 3. Schematic of the GSHP system simulation model.
Energies 18 03909 g003
Figure 5. Long-term evolution of ground temperature and annual average COP over 20 years of operation.
Energies 18 03909 g005
Figure 7. Hourly and annual average evolution of ΔT over 20 years of system operation.
Energies 18 03909 g007
Figure 8. Scatter plots of COP versus ΔT during typical cooling weeks in Years 1, 10, and 20.
Energies 18 03909 g008
Figure 9. Comparison of daily average ΔT trends during a typical cooling month in Years 1, 5, 10, and 20.
Energies 18 03909 g009
Figure 10. Causal pathway diagram of a typical GSHP operation.
Energies 18 03909 g010
Table 1. Indoor design parameters.
ParameterValueUnit
Summer indoor temperature26°C
Summer indoor humidity40%
Winter indoor temperature20°C
Winter indoor humidity- 1%
Occupant density0.125person/m2
Fresh air supply per person30m3/(h·person)
Equipment power density15W/m2
Lighting power density9W/m2
1 Not specified in the design documentation.
Table 2. Design specifications and thermal properties of the ground heat exchanger.
ParameterValueUnit
Number of boreholes90-
Borehole depth100m
Borehole diameter120mm
Borehole spacing6m
Pipe inner/outer diameter26/32mm
Pipe thermal conductivity0.44W/m2
Grout thermal conductivity2.1W/m2
Soil thermal conductivity2.6W/m2
Soil volumetric heat capacity3100kJ/(m3·K)
Disclaimer/Publisher’s Note: The statements, opinions and data contained in all publications are solely those of the individual author(s) and contributor(s) and not of MDPI and/or the editor(s). MDPI and/or the editor(s) disclaim responsibility for any injury to people or property resulting from any ideas, methods, instructions or products referred to in the content.

