
Turning Construction, Renovation, and Demolition (CRD) Wood Waste into Biochar: A Scalable and Sustainable Solution for Energy and Environmental Applications


Abstract
1. Introduction
2. Materials and Methods
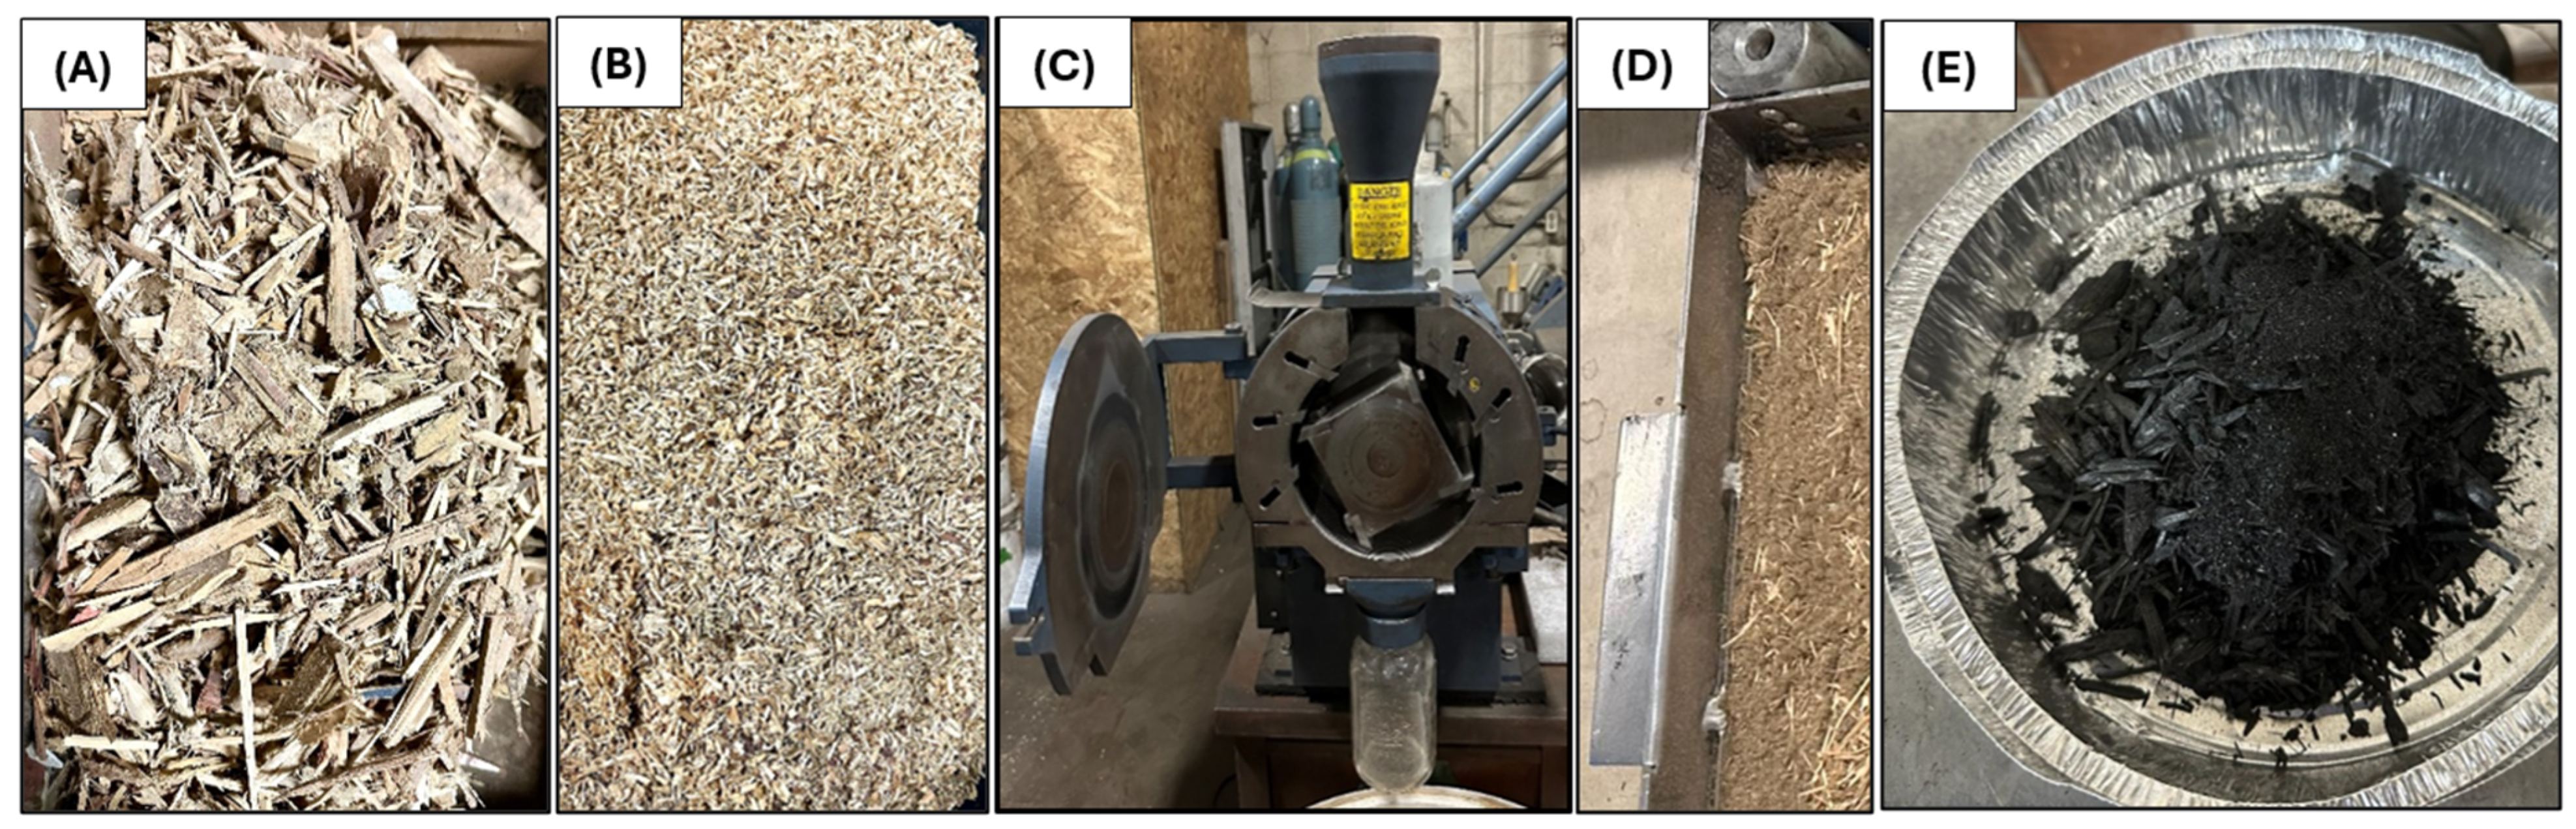
2.1. Sample Preparation
2.2. Slow Pyrolysis Setup and Design of Experiments
2.3. Physicochemical and Morphological Characterization of Biochar
3. Results and Discussion
3.1. CRD Wood Pyrolysis in Horizontal Tube Furnace Reactor
3.1.1. Physicochemical Characterization
Effect of Particle Size on Biomass Thermal Decomposition and Biochar Properties
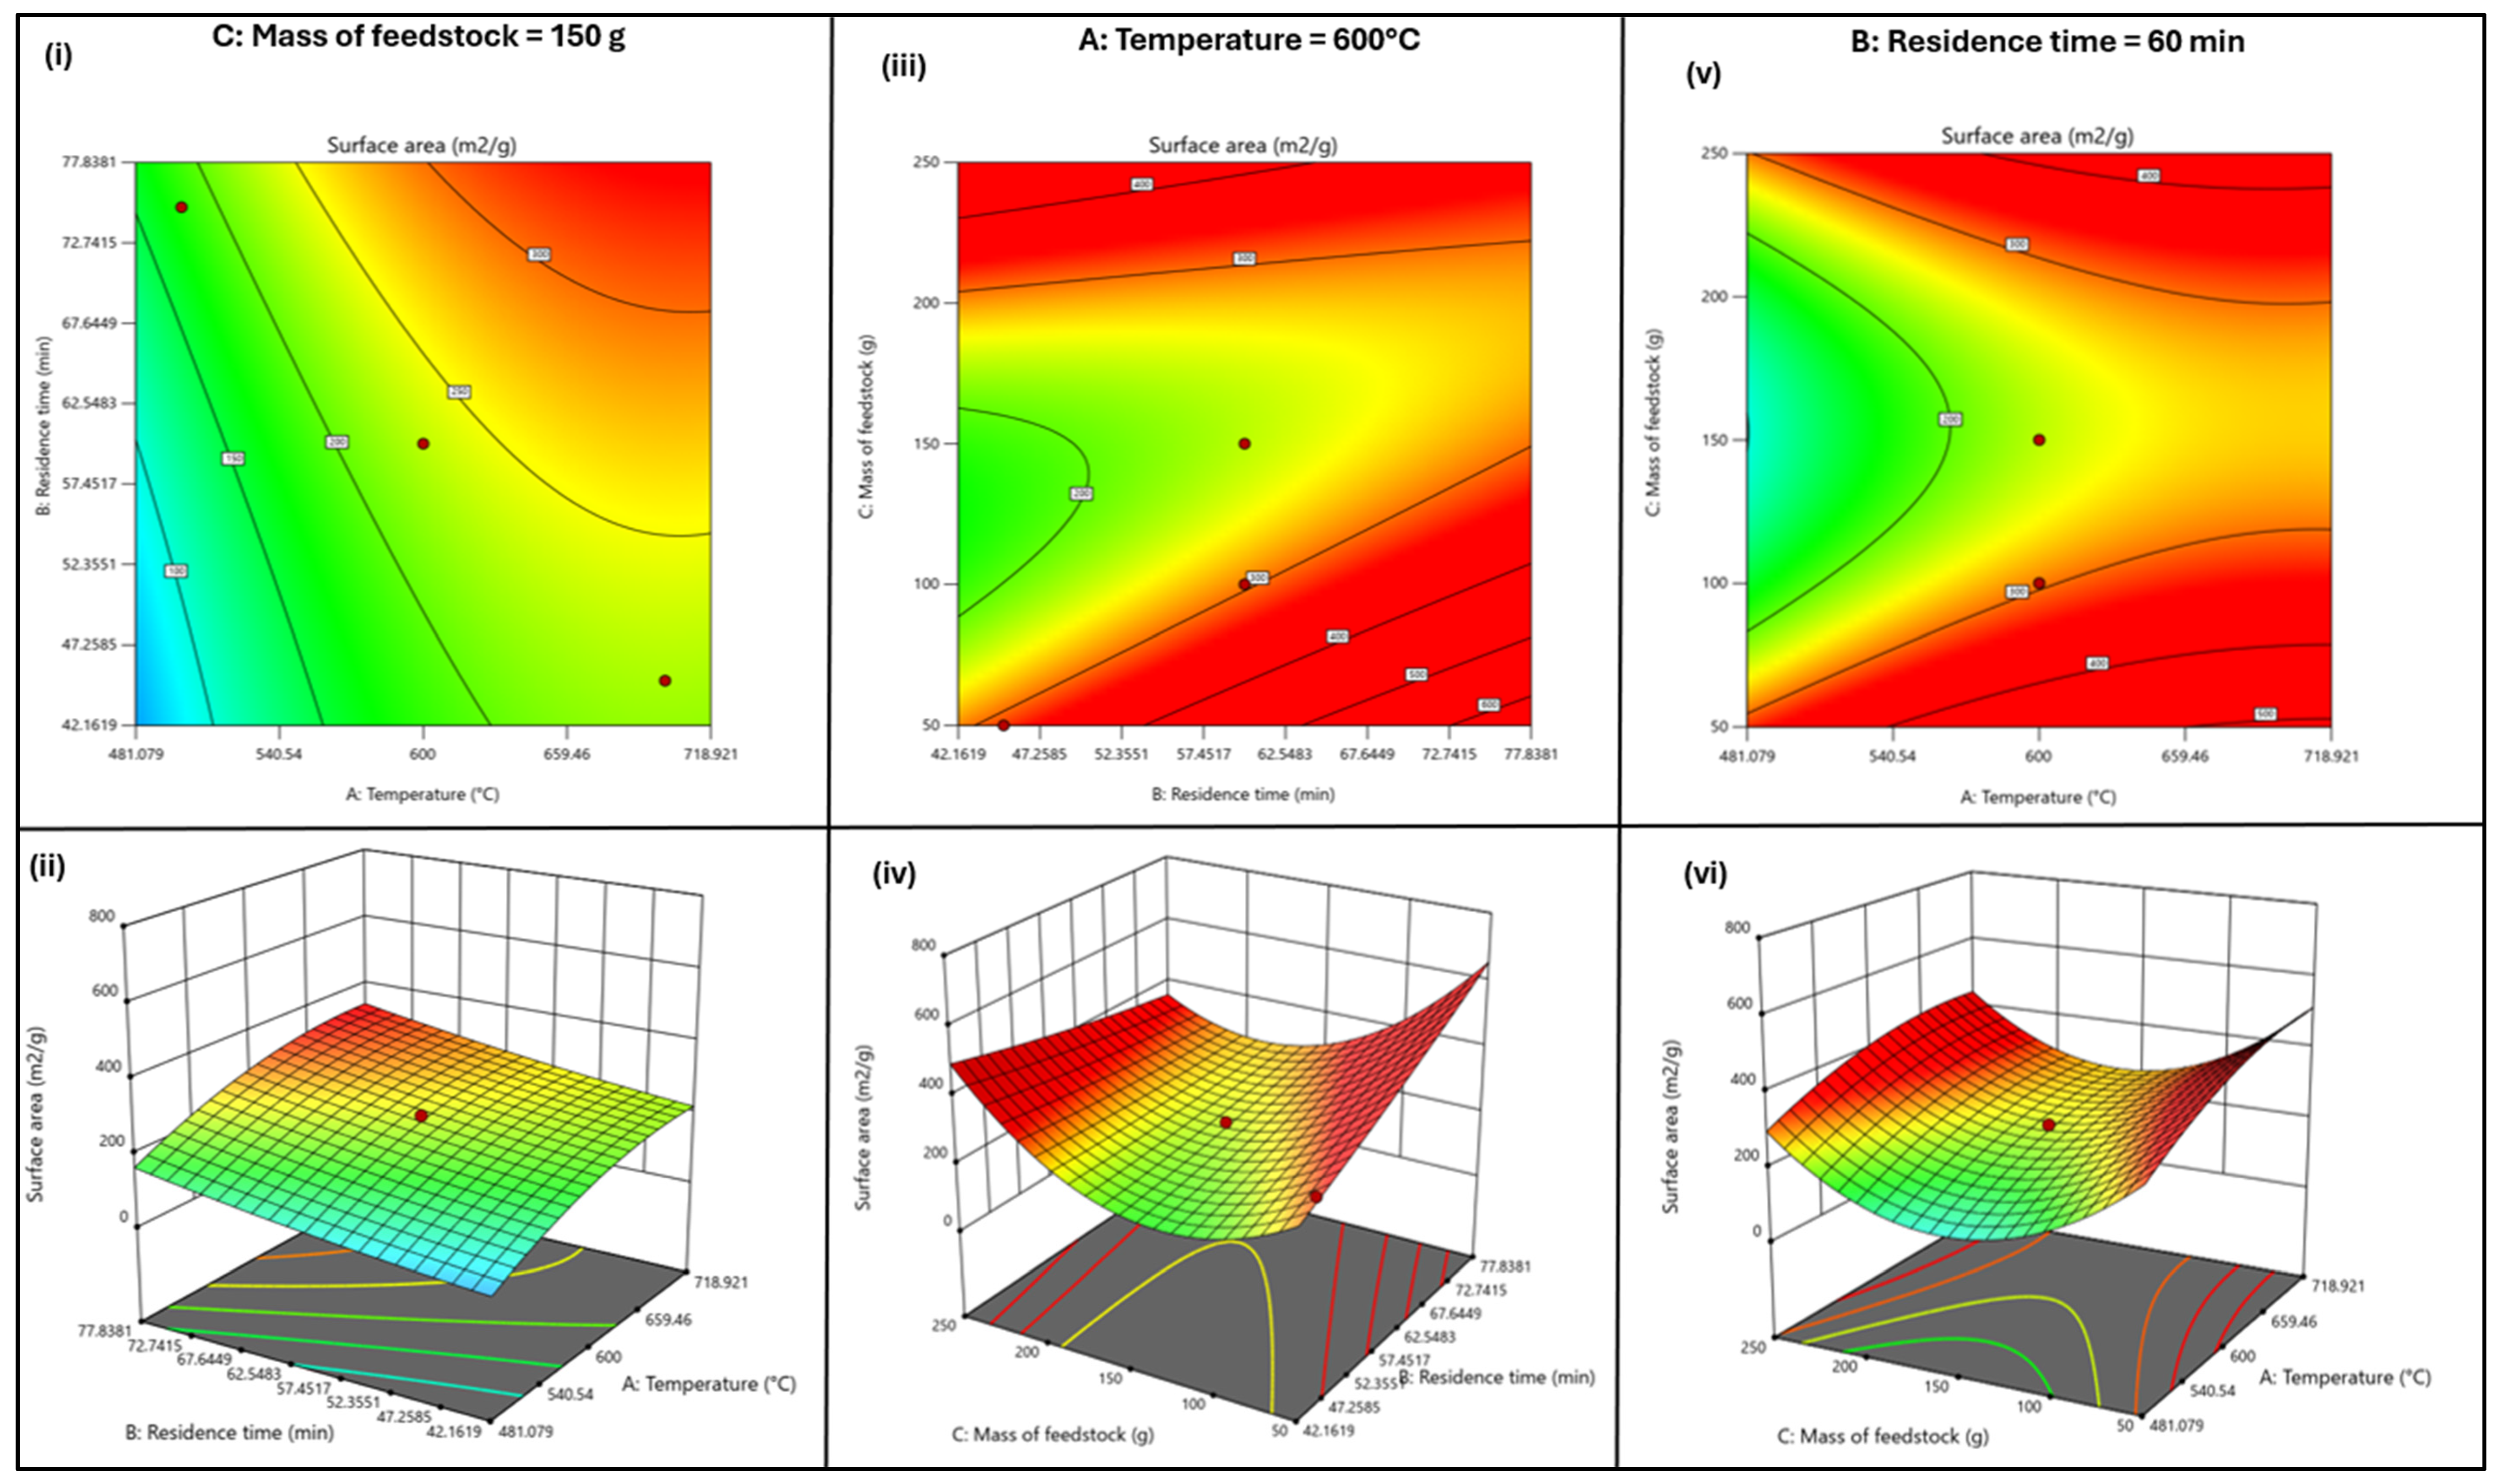
3.1.2. Evaluating the Robustness of the RSM Model—Statistical Analysis, Contour/3-D Plots, and Predicted Versus Actual Value Distribution

3.1.3. Other Characterizations
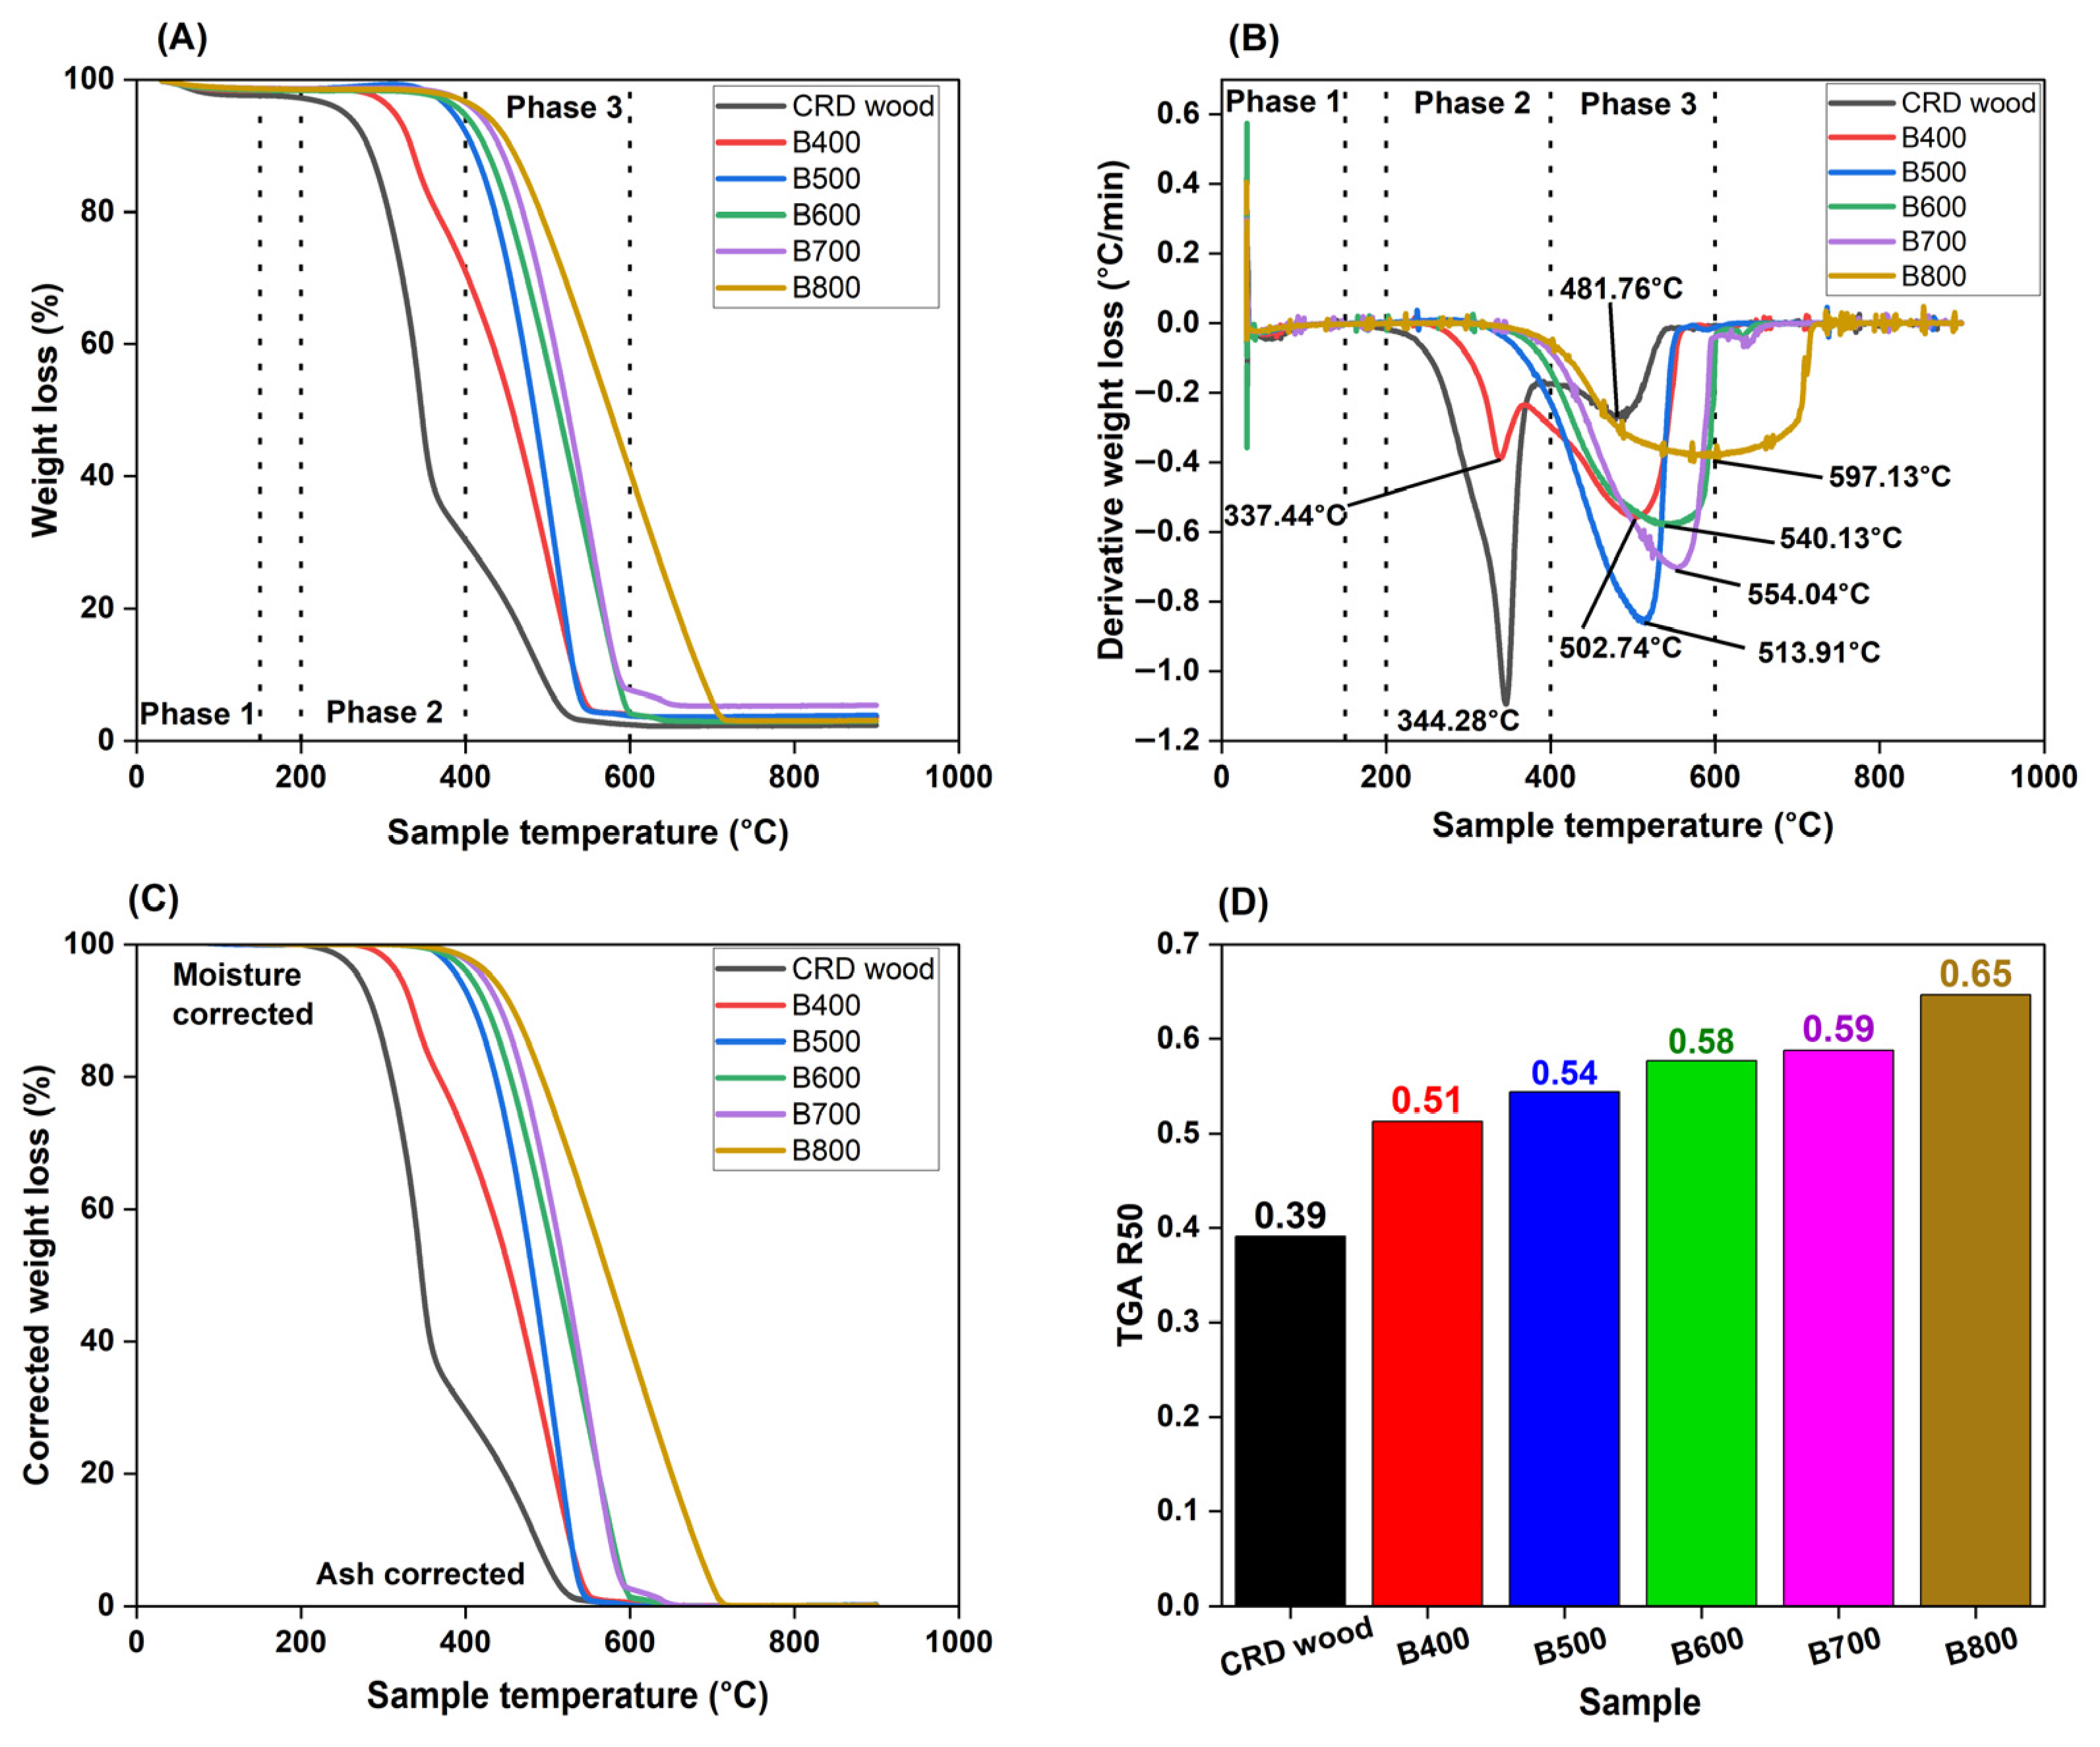
Thermogravimetric Analysis (TGA)
TGA R50
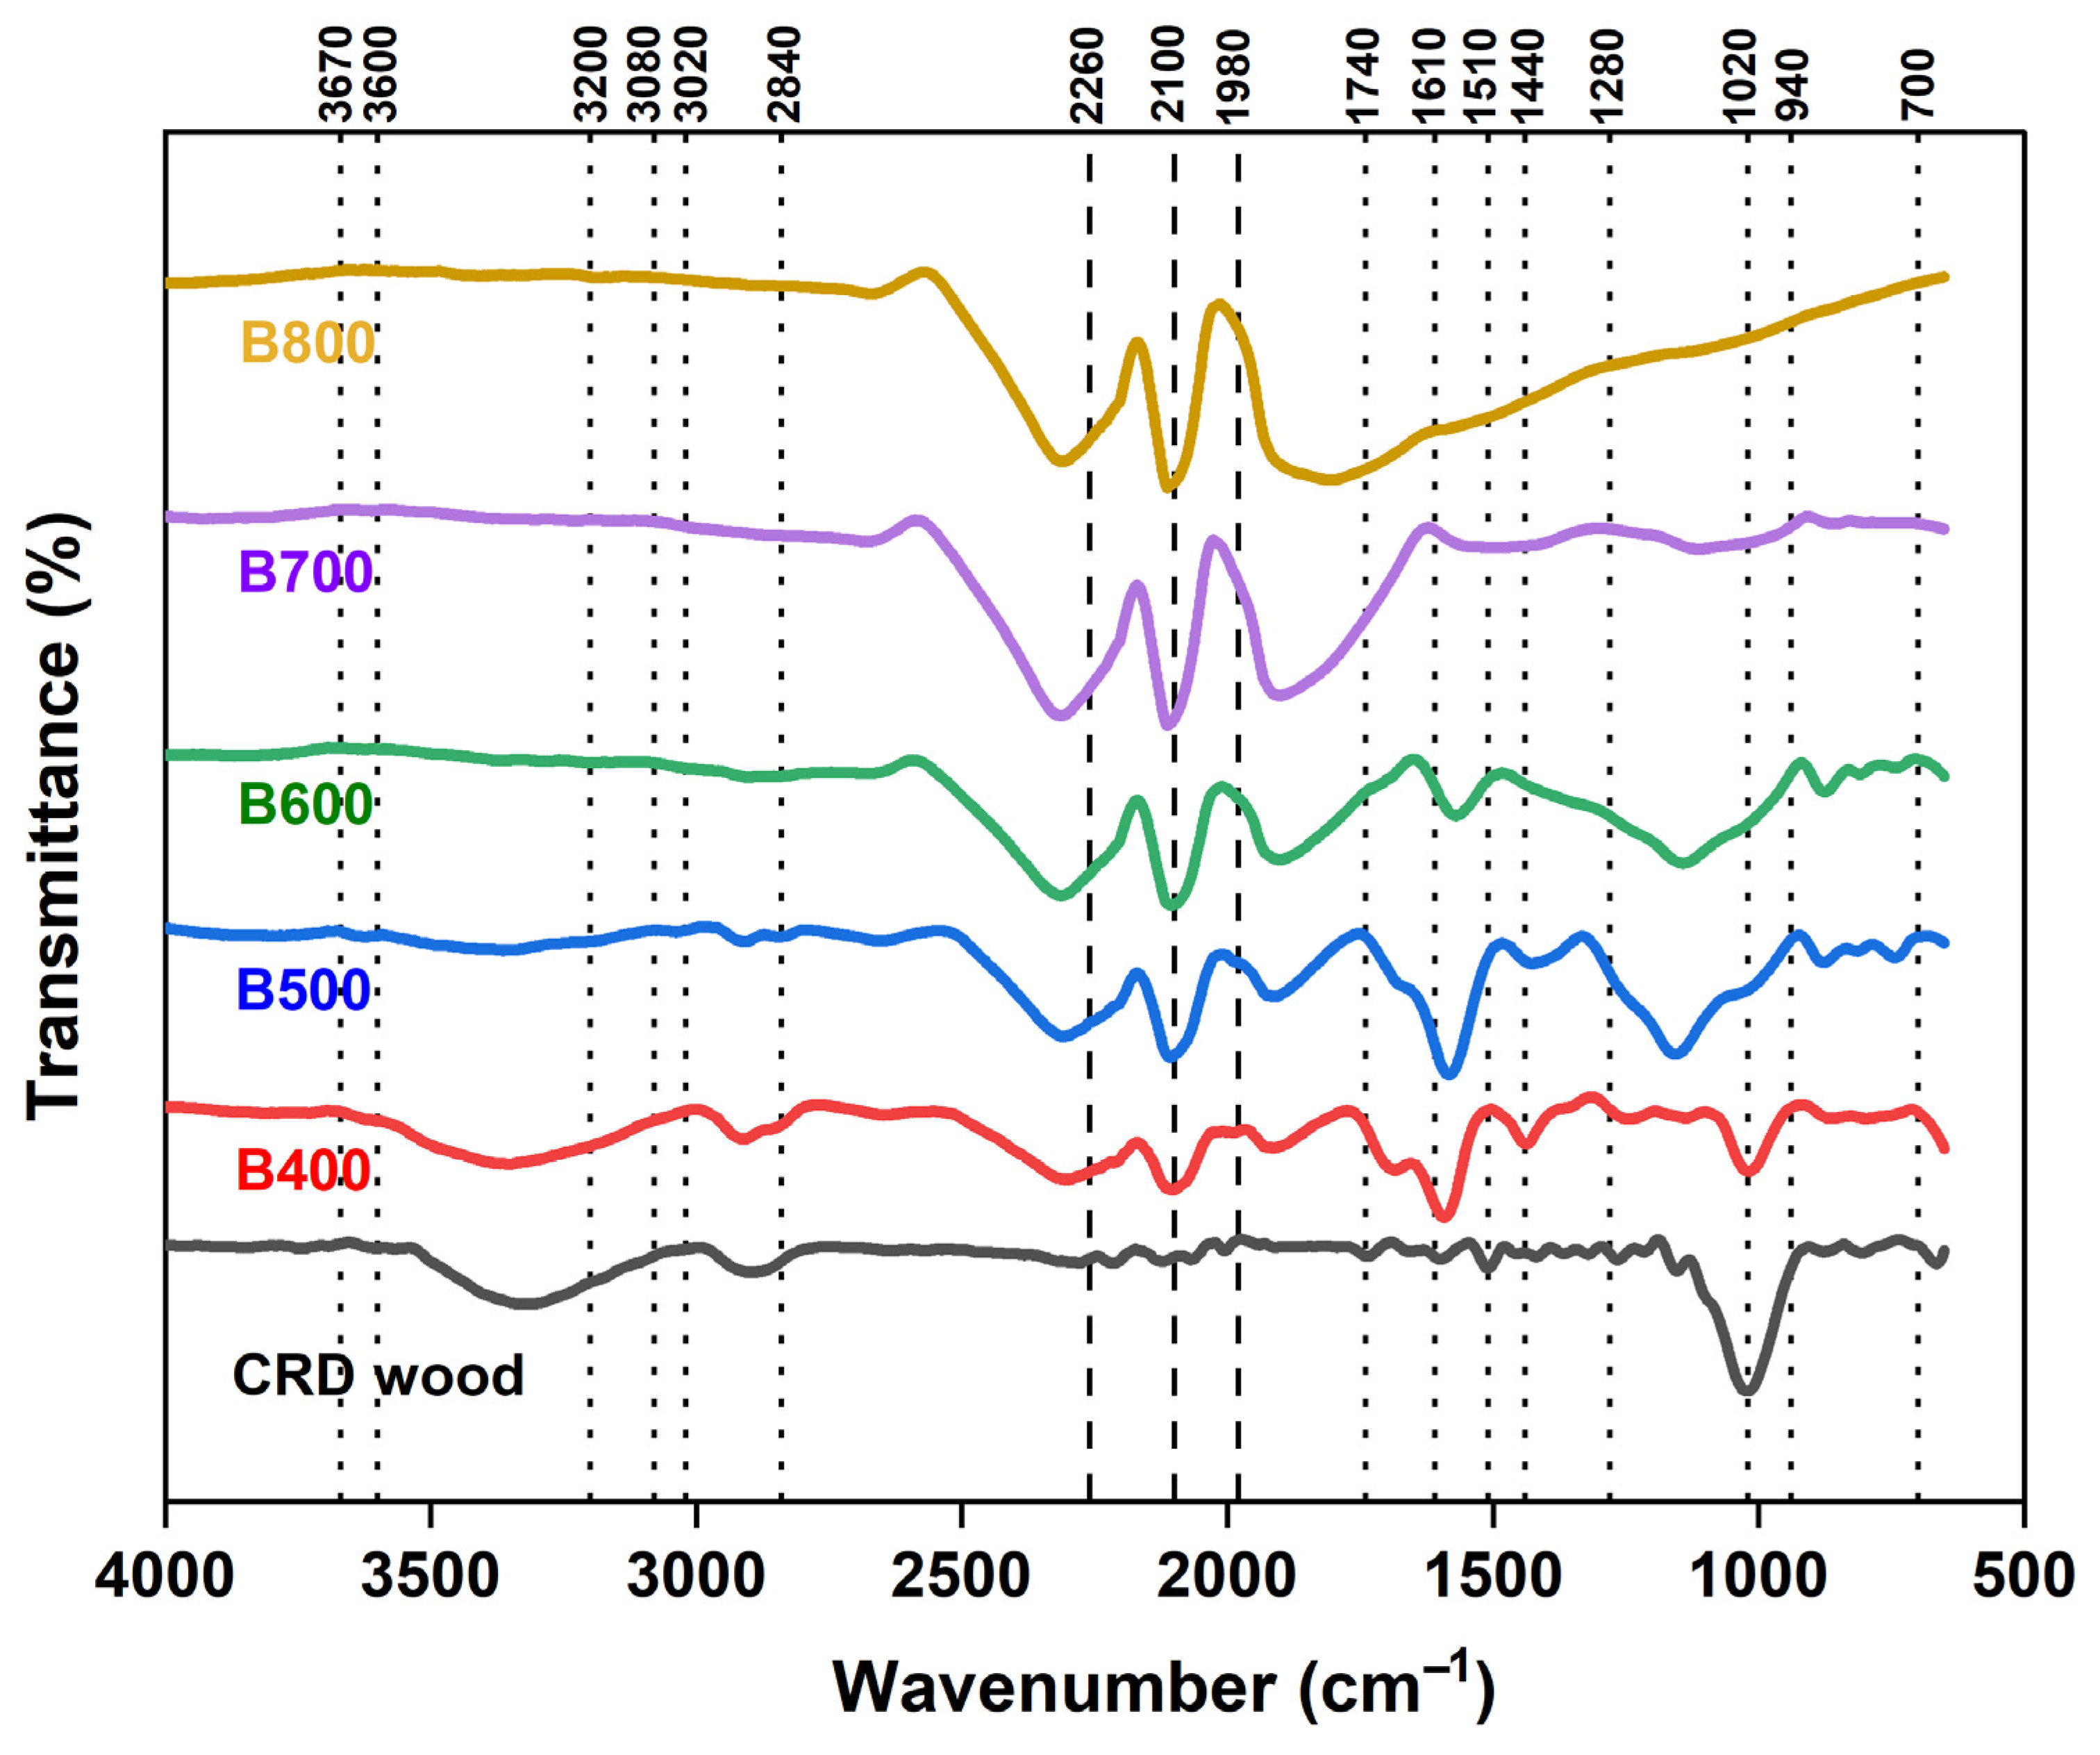
FTIR Spectroscopy
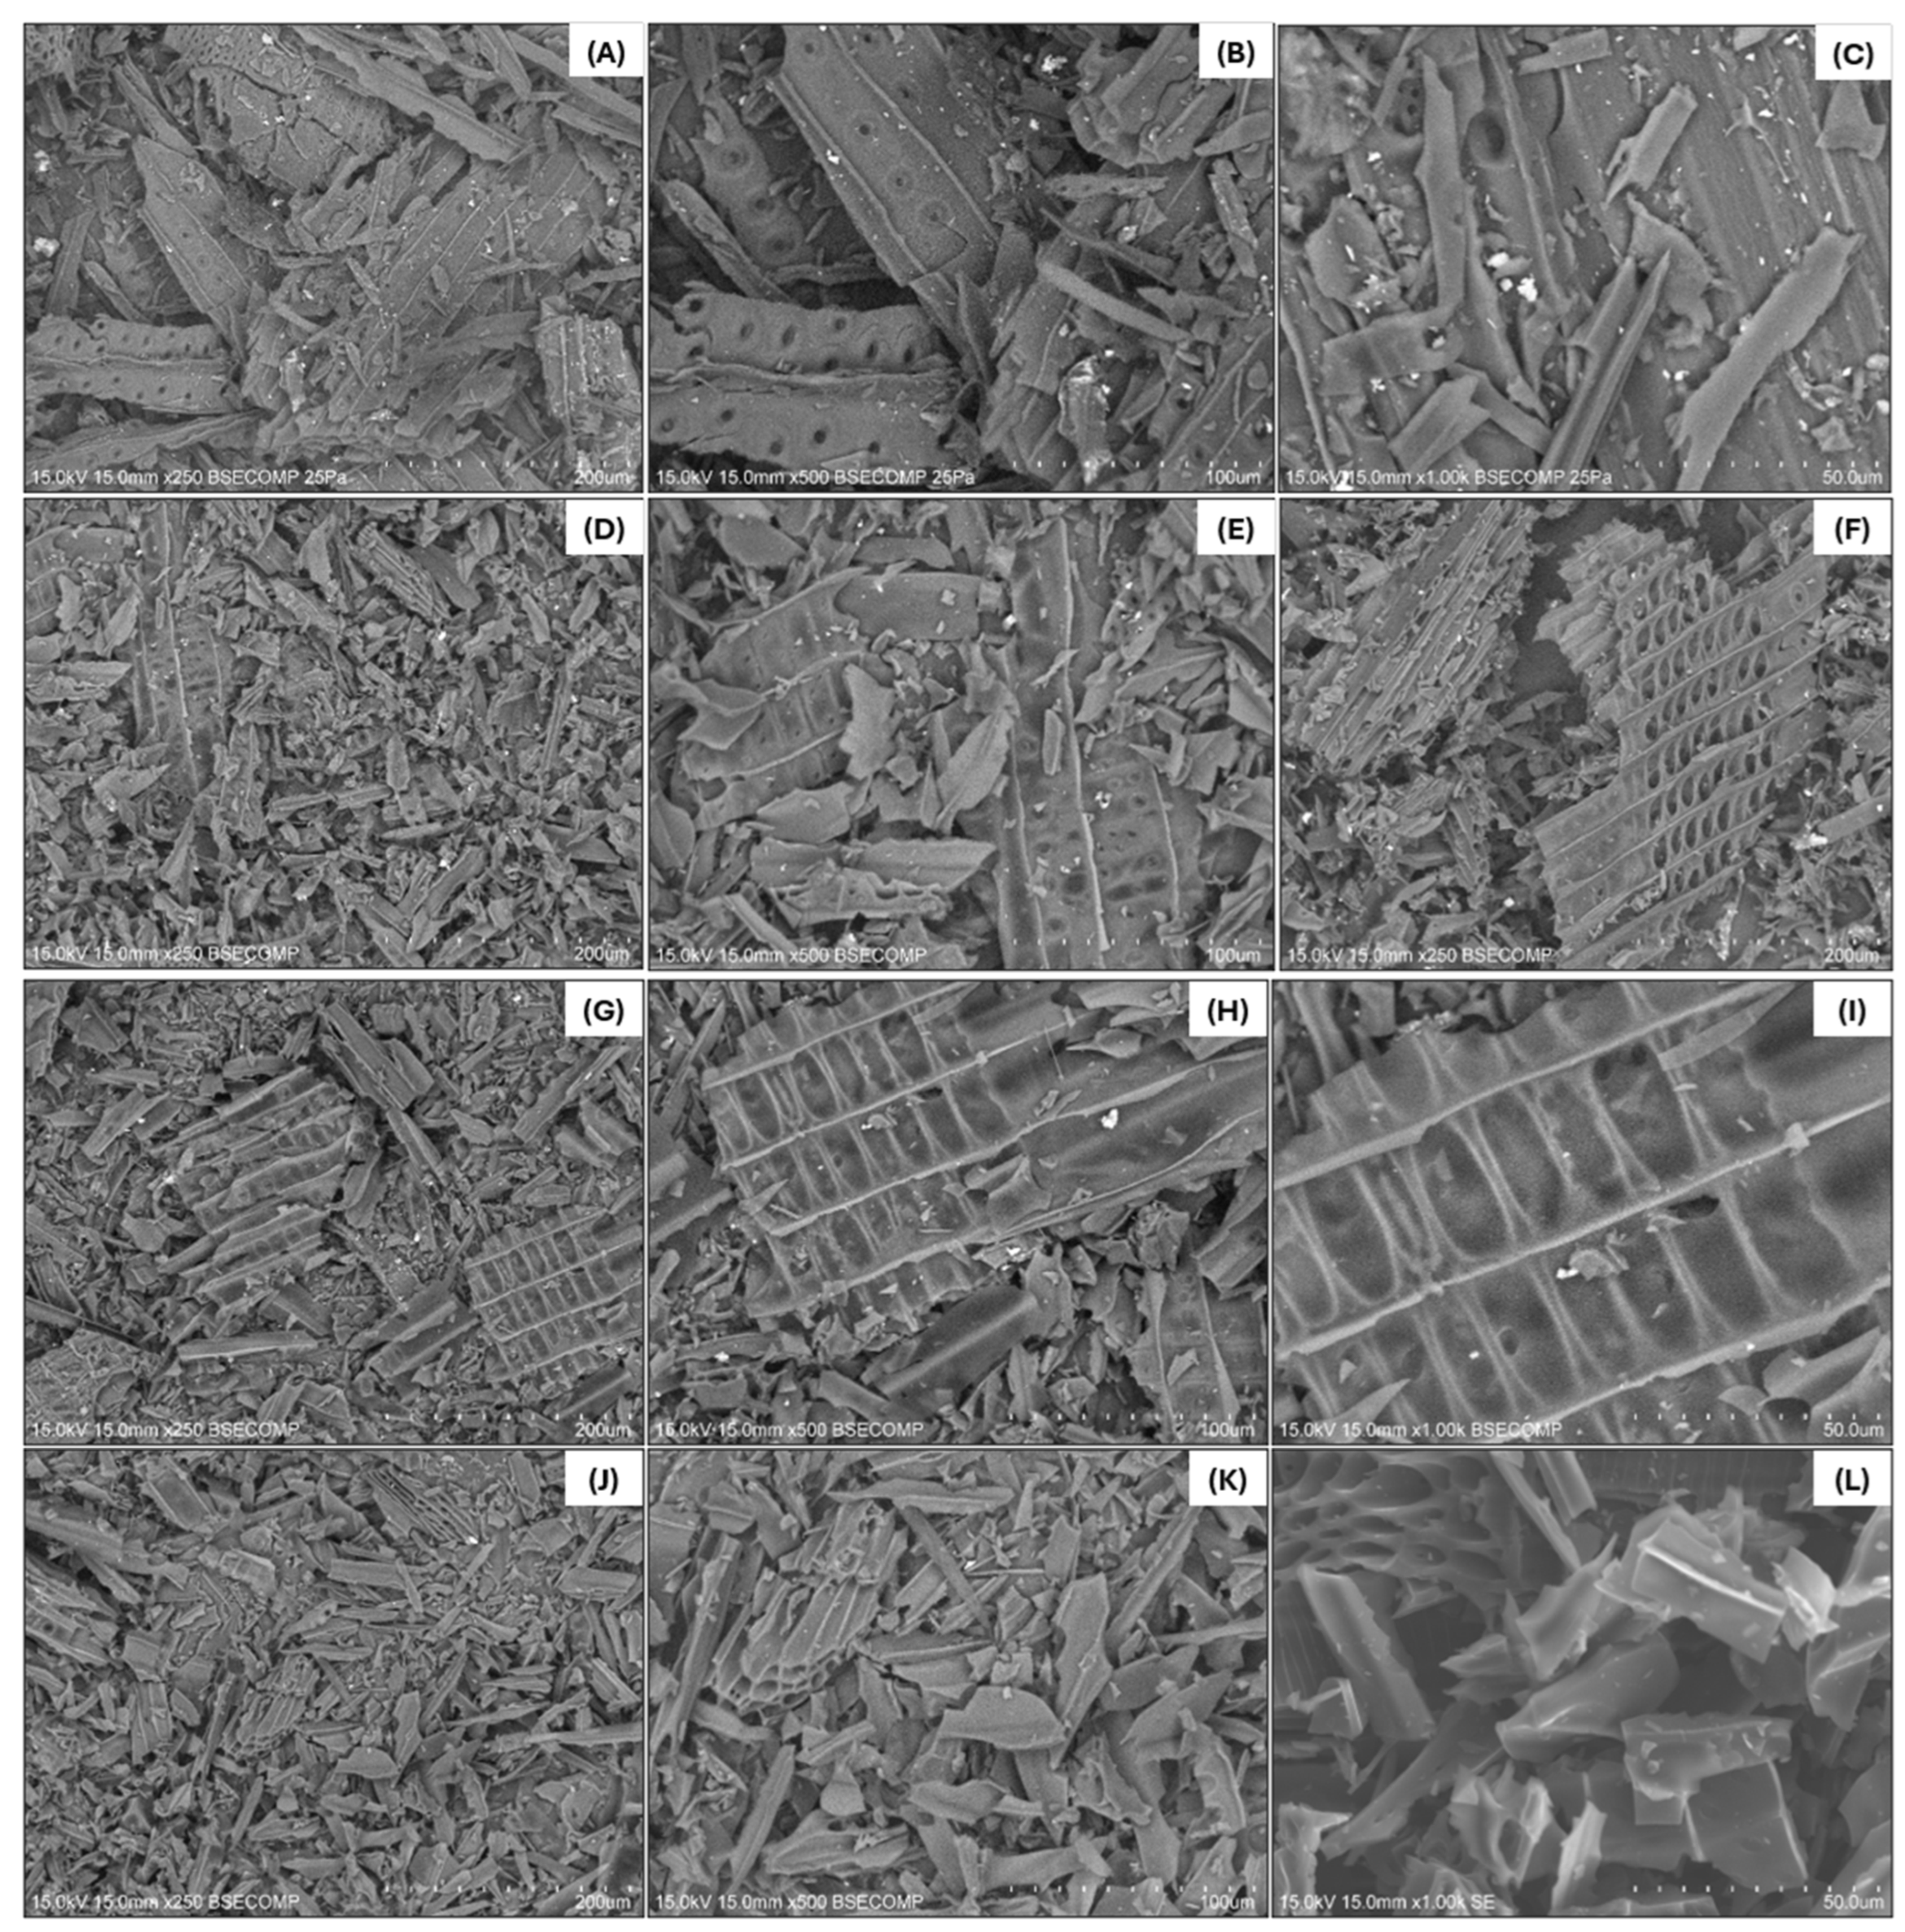
SEM-EDX Spectroscopy
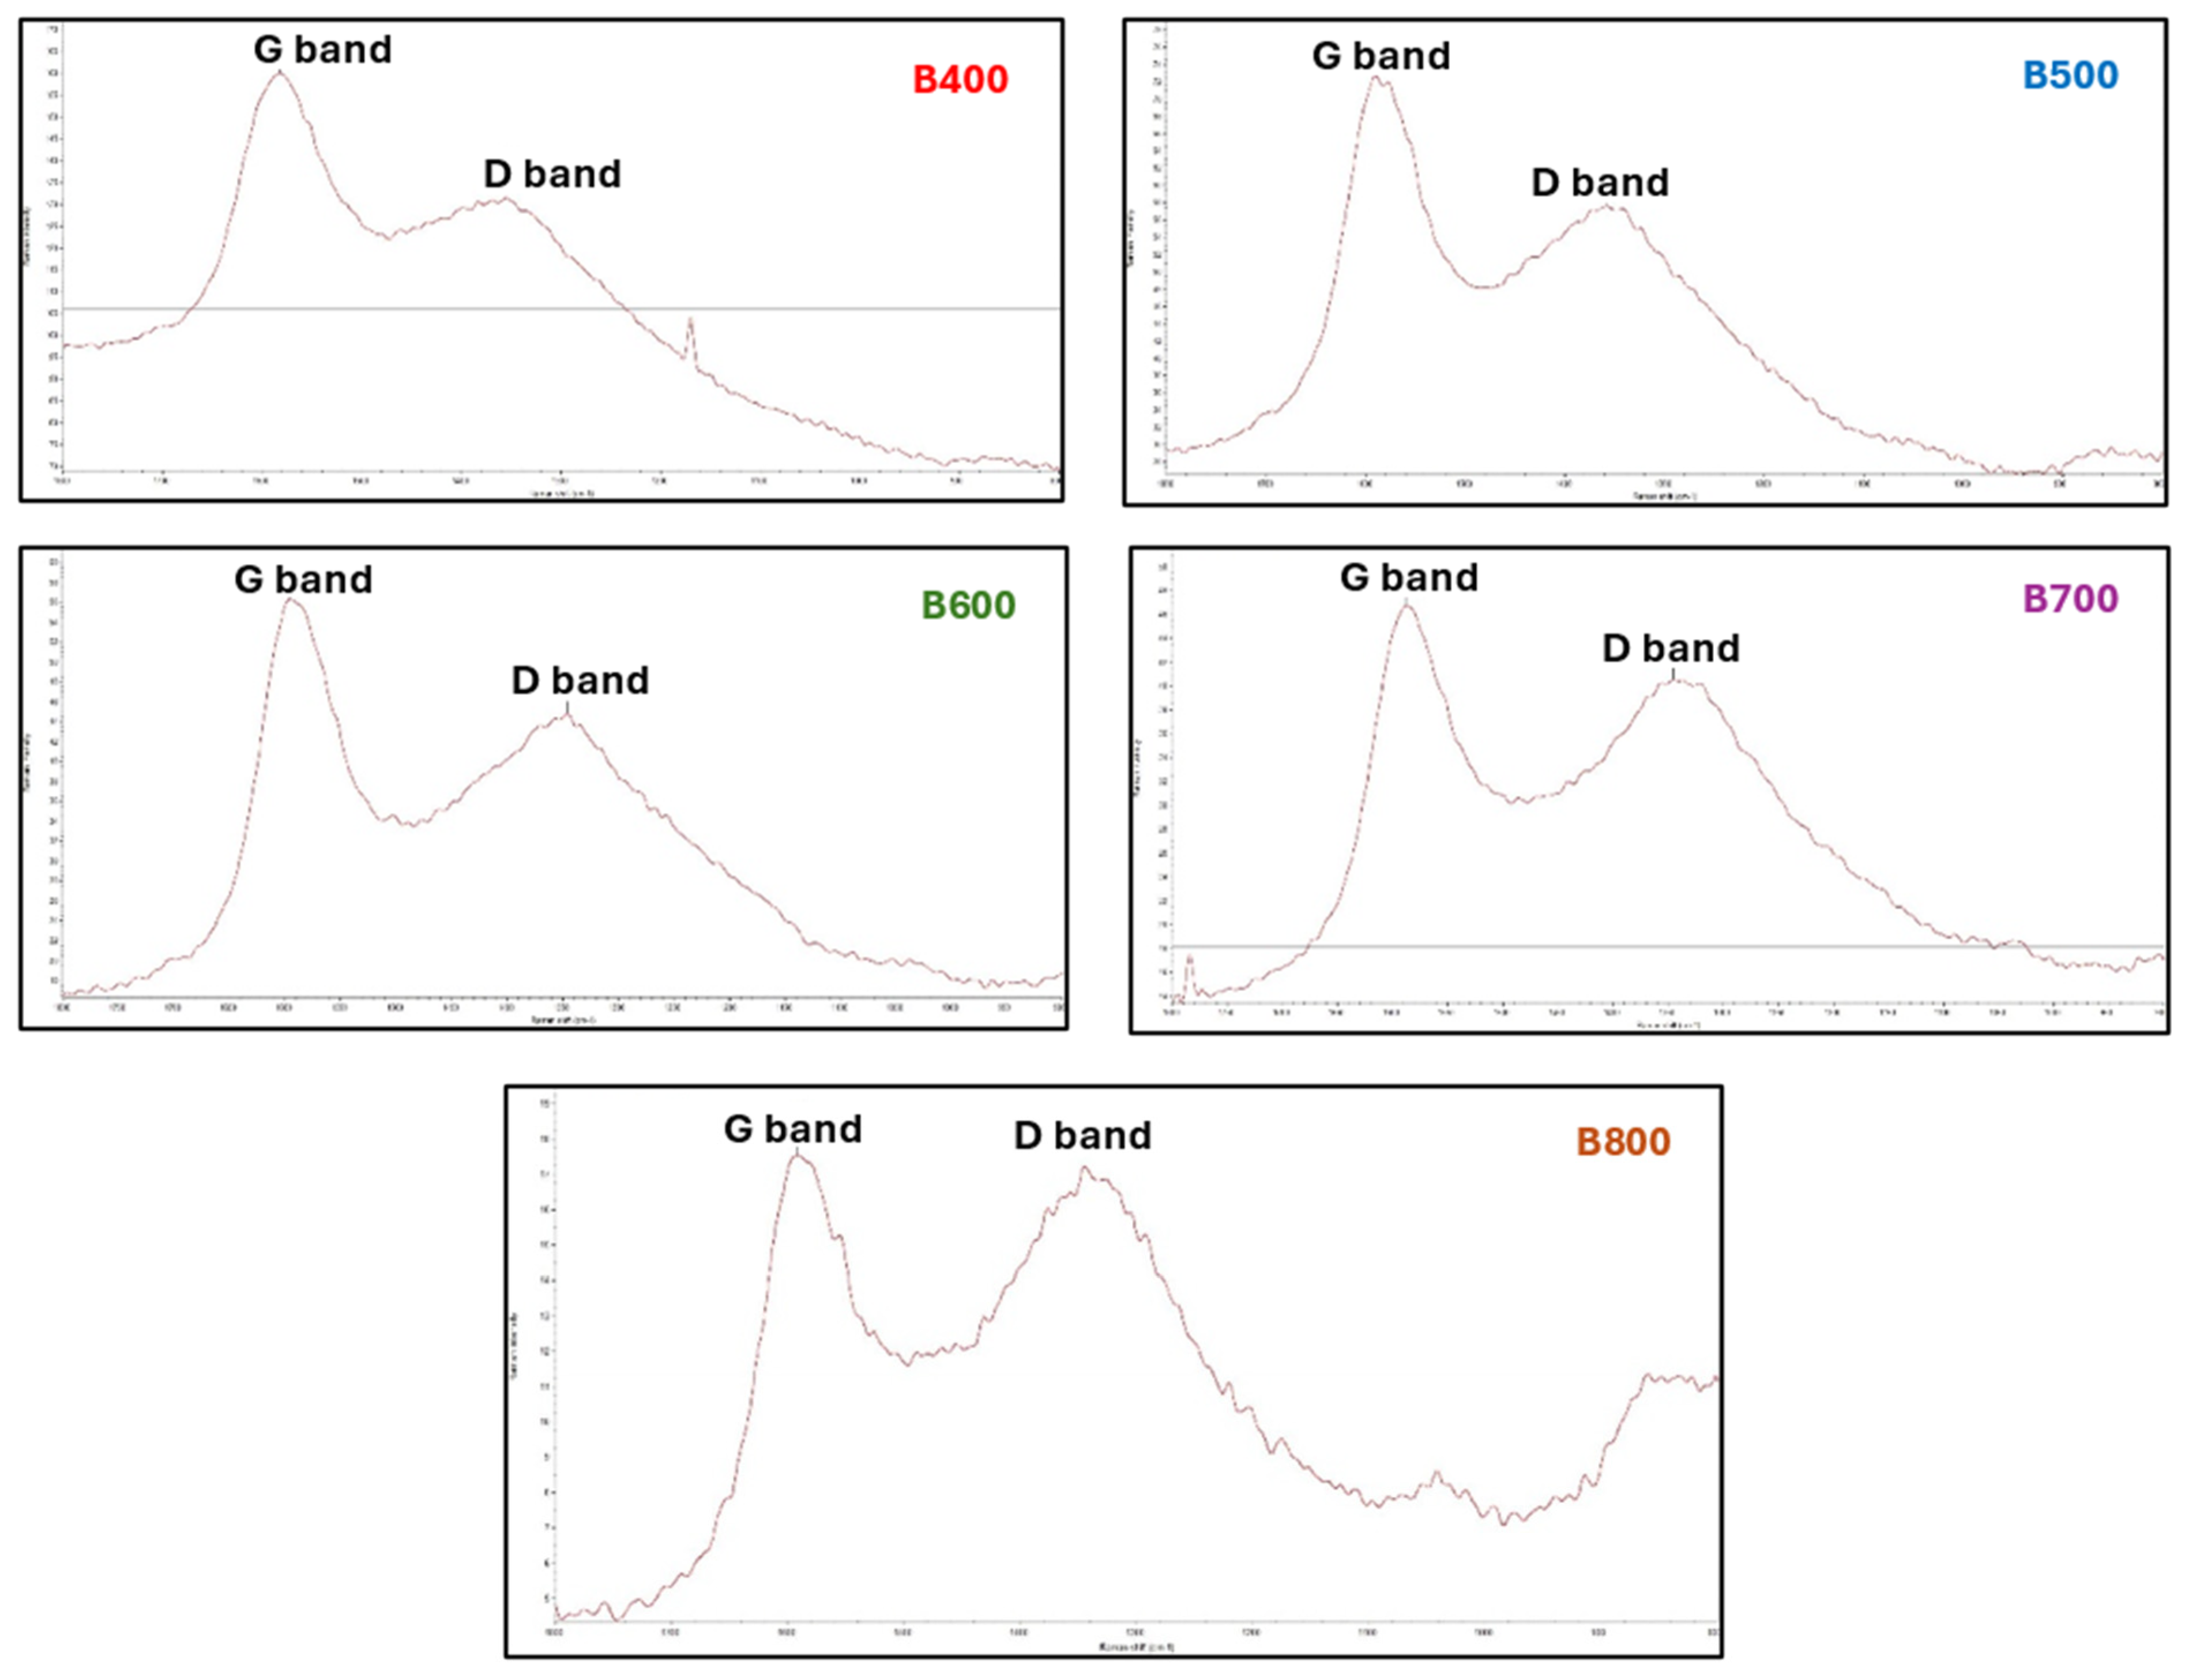
Raman Spectroscopy
Metal Content
3.1.4. Choosing a Potential Adsorbent Material for Dye Removal Tests from Contaminated Water—B600
3.2. CRD Wood Pyrolysis in Horizontal Rotary Retort-Furnace Reactor—Scale-Up from Horizontal Tube Furnace Reactor
3.3. The Effect of Feedstock Composition and Pyrolysis Process Parameters on Biochar Properties—Comparison to Similar Works
3.4. Methyl Orange Batch Adsorption Experiments—An Application for CRD Wood Biochar (B600) from the DOE
3.4.1. Adsorption Standard Determination
3.4.2. Batch Adsorption Experiments
3.4.3. Optimization of Adsorption Parameters and Results
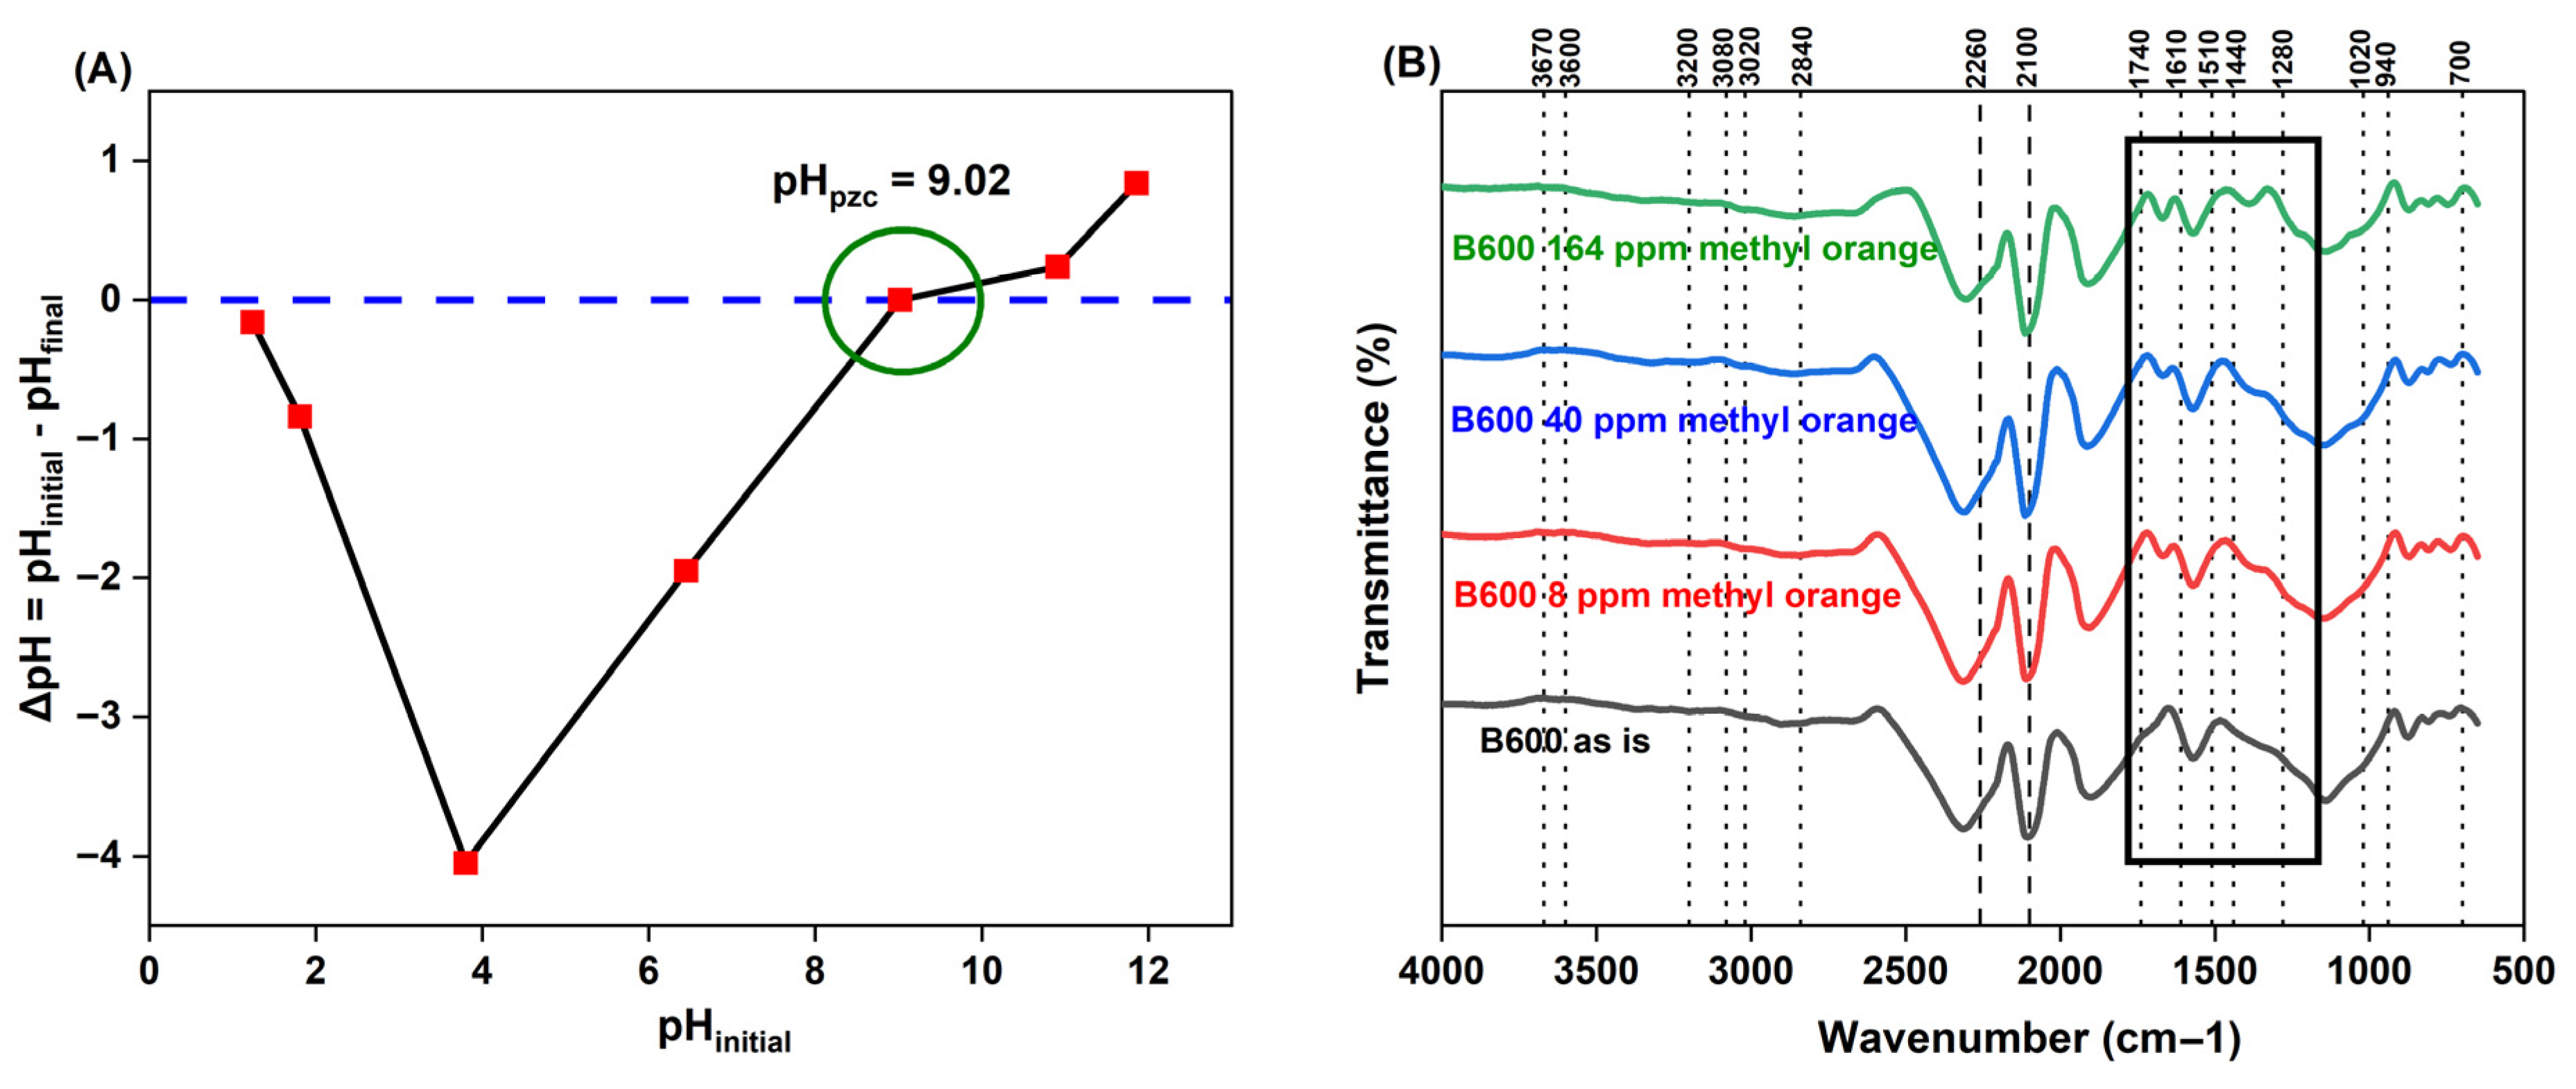
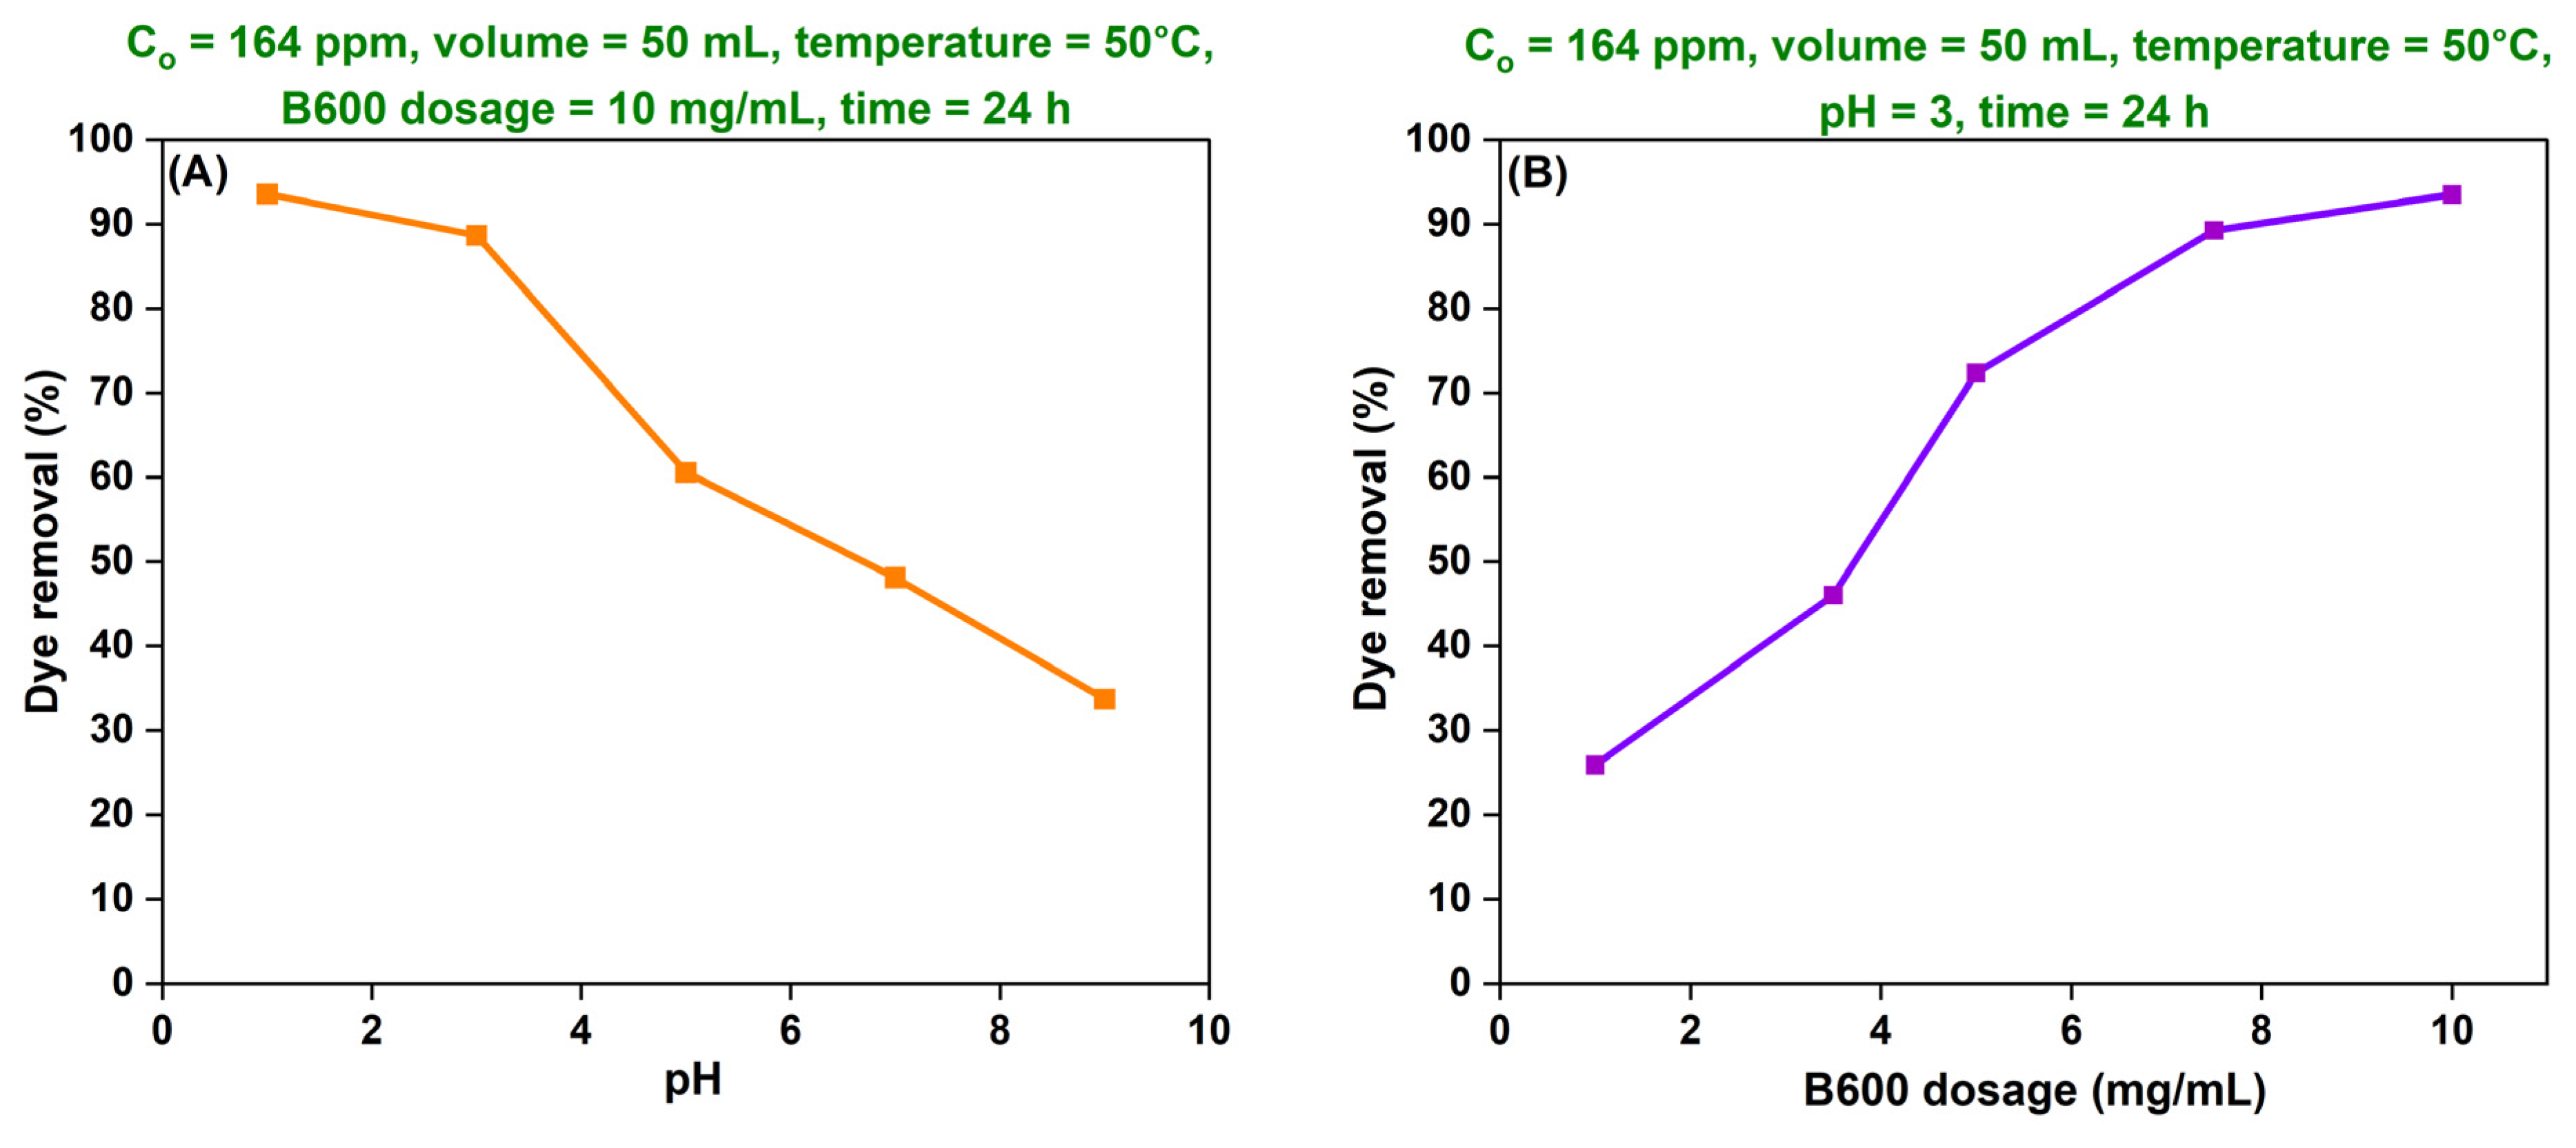
(A) Effect of pH
Confirming Changes to B600 Surface Chemical Composition Post-pH Modification
(B) Effect of Adsorbent Dosage
(C) Effect of Initial Dye Concentration—Adsorption Isotherms
(D) Effect of Adsorption Duration—Adsorption Kinetics
(E) Effect of Temperature—Adsorption Thermodynamics
3.4.4. Adsorption Mechanism and Theory
4. Conclusions
Supplementary Materials
Author Contributions
Funding
Data Availability Statement
Conflicts of Interest
References
- Robey, N.M.; Solo-Gabriele, H.M.; Jones, A.S.; Marini, J.; Townsend, T.G. Metals content of recycled construction and demolition wood before and after implementation of best management practices. Environ. Pollut. 2018, 242, 1198–1205. [Google Scholar] [CrossRef] [PubMed]
- Al-Rumaihi, A.; Shahbaz, M.; Mckay, G.; Mackey, H.; Al-Ansari, T. A review of pyrolysis technologies and feedstock: A blending approach for plastic and biomass towards optimum biochar yield. Renew. Sustain. Energy Rev. 2022, 167, 112715. [Google Scholar] [CrossRef]
- Li, W.; Dang, Q.; Brown, R.C.; Laird, D.; Wright, M.M. The impacts of biomass properties on pyrolysis yields, economic and environmental performance of the pyrolysis-bioenergy-biochar platform to carbon negative energy. Bioresour. Technol. 2017, 241, 959–968. [Google Scholar] [CrossRef] [PubMed]
- Sivaranjanee, R.; Kumar, P.S.; Chitra, B.; Rangasamy, G. A critical review on biochar for the removal of toxic pollutants from water environment. Chemosphere 2024, 360, 142382. [Google Scholar] [CrossRef] [PubMed]
- Ayaz, M.; Feizienė, D.; Tilvikienė, V.; Akhtar, K.; Stulpinaitė, U.; Iqbal, R. Biochar role in the sustainability of agriculture and environment. Sustainability 2021, 13, 1330. [Google Scholar] [CrossRef]
- Malińska, K.; Dróżdż, D.; Postawa, P.; Stachowiak, T. Biochar—A Filler in “Bioplastics” for Horticultural Applications. Materials 2024, 17, 6208. [Google Scholar] [CrossRef] [PubMed]
- Ahuja, V.; Palai, A.K.; Kumar, A.; Patel, A.K.; Farooque, A.A.; Yang, Y.-H.; Bhatia, S.K. Biochar: Empowering the future of energy production and storage. J. Anal. Appl. Pyrolysis 2024, 177, 106370. [Google Scholar] [CrossRef]
- Anand, A.; Gautam, S.; Ram, L.C. Feedstock and pyrolysis conditions affect suitability of biochar for various sustainable energy and environmental applications. J. Anal. Appl. Pyrolysis 2023, 170, 105881. [Google Scholar] [CrossRef]
- Ghorbani, M.; Amirahmadi, E.; Neugschwandtner, R.W.; Konvalina, P.; Kopecký, M.; Moudrý, J.; Perná, K.; Murindangabo, Y.T. The impact of pyrolysis temperature on biochar properties and its effects on soil hydrological properties. Sustainability 2022, 14, 14722. [Google Scholar] [CrossRef]
- Nan, H.; Yin, J.; Yang, F.; Luo, Y.; Zhao, L.; Cao, X. Pyrolysis temperature-dependent carbon retention and stability of biochar with participation of calcium: Implications to carbon sequestration. Environ. Pollut. 2021, 287, 117566. [Google Scholar] [CrossRef] [PubMed]
- Bolan, S.; Hou, D.; Wang, L.; Hale, L.; Egamberdieva, D.; Tammeorg, P.; Li, R.; Wang, B.; Xu, J.; Wang, T.; et al. The potential of biochar as a microbial carrier for agricultural and environmental applications. Sci. Total Environ. 2023, 886, 163968. [Google Scholar] [CrossRef] [PubMed]
- Beljin, J.; Đukanović, N.; Anojčić, J.; Simetić, T.; Apostolović, T.; Mutić, S.; Maletić, S. Biochar in the Remediation of Organic Pollutants in Water: A Review of Polycyclic Aromatic Hydrocarbon and Pesticide Removal. Nanomaterials 2024, 15, 26. [Google Scholar] [CrossRef] [PubMed]
- Buffi, M.; Hurtig, O.; Prussi, M.; Scarlat, N.; Chiaramonti, D. Energy and GHG emissions assessment for biochar-enhanced advanced biofuels value chains. Energy Convers. Manag. 2024, 309, 118450. [Google Scholar] [CrossRef]
- Iwuozor, K.O.; Ighalo, J.O.; Emenike, E.C.; Ogunfowora, L.A.; Igwegbe, C.A. Adsorption of methyl orange: A review on adsorbent performance. Curr. Res. Green. Sustain. Chem. 2021, 4, 100179. [Google Scholar] [CrossRef]
- Serban, G.V.; Iancu, V.I.; Dinu, C.; Tenea, A.; Vasilache, N.; Cristea, I.; Niculescu, M.; Ionescu, I.; Chiriac, F.L. Removal efficiency and adsorption kinetics of methyl orange from wastewater by commercial activated carbon. Sustainability 2023, 15, 12939. [Google Scholar] [CrossRef]
- Lee, H.; Fiore, S.; Berruti, F. Adsorption of methyl orange and methylene blue on activated biocarbon derived from birchwood pellets. Biomass Bioenergy 2024, 191, 107446. [Google Scholar] [CrossRef]
- Jian, X.; Zhuang, X.; Li, B.; Xu, X.; Wei, Z.; Song, Y.; Jiang, E. Comparison of characterization and adsorption of biochars produced from hydrothermal carbonization and pyrolysis. Environ. Technol. Innov. 2018, 10, 27–35. [Google Scholar] [CrossRef]
- Cano, F.J.; Reyes-Vallejo, O.; Sánchez-Albores, R.M.; Sebastian, P.J.; Cruz-Salomón, A.; Hernández-Cruz, M.d.C.; Montejo-López, W.; Reyes, M.G.; Ramirez, R.d.P.S.; Torres-Ventura, H.H. Activated Biochar from Pineapple Crown Biomass: A High-Efficiency Adsorbent for Organic Dye Removal. Sustainability 2025, 17, 99. [Google Scholar] [CrossRef]
- Aziz, K.H.H.; Fatah, N.M.; Muhammad, K.T. Advancements in application of modified biochar as a green and low-cost adsorbent for wastewater remediation from organic dyes. R. Soc. Open Sci. 2024, 11, 232033. [Google Scholar] [CrossRef] [PubMed]
- Ramath, R.; Sukumaran, A.M.; Ramachandran, A.; Basheer, S.B. Methyl orange dye adsorption and degradation at low temperature using iron oxide-incorporated biochar derived from industrial by-products. Bioresour. Technol. Rep. 2023, 22, 101470. [Google Scholar] [CrossRef]
- Issaka, E.; Fapohunda, F.O.; Amu-Darko, J.N.O.; Yeboah, L.; Yakubu, S.; Varjani, S.; Ali, N.; Bilal, M. Biochar-based composites for remediation of polluted wastewater and soil environments: Challenges and prospects. Chemosphere 2022, 297, 134163. [Google Scholar] [CrossRef] [PubMed]
- Zhao, X.; Wang, J.; Zhu, G.; Zhang, S.; Wei, C.; Liu, C.; Cao, L.; Zhao, S.; Zhang, S. Efficient removal of high concentration dyes from water by functionalized in-situ N-doped porous biochar derived from waste antibiotic fermentation residue. Chemosphere 2024, 364, 143215. [Google Scholar] [CrossRef] [PubMed]
- Behera, A.K.; Shadangi, K.P.; Sarangi, P.K. Efficient removal of Rhodamine B dye using biochar as an adsorbent: Study the performance, kinetics, thermodynamics, adsorption isotherms and its reusability. Chemosphere 2024, 354, 141702. [Google Scholar] [CrossRef] [PubMed]
- Ganesan, A.; Rezazgui, O.; Langlois, S.; Boussabbeh, C.; Barnabé, S. Pyrolytic conversion of construction, renovation, and demolition (CRD) wood wastes in Québec to biochar: Production, characterization, and identifying relevant stability indices for carbon sequestration. Sci. Total Environ. 2025, 965, 178650. [Google Scholar] [CrossRef] [PubMed]
- Sangsuk, S.; Suebsiri, S.; Puakhom, P. The metal kiln with heat distribution pipes for high quality charcoal and wood vinegar production. Energy Sustain. Dev. 2018, 47, 149–157. [Google Scholar] [CrossRef]
- Channiwala, S.A.; Parikh, P.P. A unified correlation for estimating HHV of solid, liquid and gaseous fuels. Fuel 2002, 81, 1051–1063. [Google Scholar] [CrossRef]
- Khatibi, M.; Nahil, M.A.; Williams, P.T. Improving the Quality of Bio-oil Using the Interaction of Plastics and Biomass through Copyrolysis Coupled with Nonthermal Plasma Processing. Energy Fuels 2023, 38, 1240–1257. [Google Scholar] [CrossRef] [PubMed]
- Huff, M.D.; Marshall, S.; Saeed, H.A.; Lee, J.W. Surface oxygenation of biochar through ozonization for dramatically enhancing cation exchange capacity. Bioresour. Bioprocess. 2018, 5, 1–9. [Google Scholar] [CrossRef]
- Lehmann, J.; Rillig, M.C.; Thies, J.; Masiello, C.A.; Hockaday, W.C.; Crowley, D. Biochar effects on soil biota—A review. Soil. Biol. Biochem. 2011, 43, 1812–1836. [Google Scholar] [CrossRef]
- Nartey, O.D.; Zhao, B. Biochar preparation, characterization, and adsorptive capacity and its effect on bioavailability of contaminants: An overview. Adv. Mater. Sci. Eng. 2014, 2014, 715398. [Google Scholar] [CrossRef]
- Khater, E.-S.; Bahnasawy, A.; Hamouda, R.; Sabahy, A.; Abbas, W.; Morsy, O.M. Biochar production under different pyrolysis temperatures with different types of agricultural wastes. Sci. Rep. 2024, 14, 2625. [Google Scholar] [CrossRef] [PubMed]
- Li, J.; Sun, W.; Lichtfouse, E.; Maurer, C.; Liu, H. Life cycle assessment of biochar for sustainable agricultural application: A review. Sci. Total Environ. 2024, 951, 175448. [Google Scholar] [CrossRef] [PubMed]
- Dufourny, A.; Van De Steene, L.; Humbert, G.; Guibal, D.; Martin, L.; Blin, J. Influence of pyrolysis conditions and the nature of the wood on the quality of charcoal as a reducing agent. J. Anal. Appl. Pyrolysis 2019, 137, 1–13. [Google Scholar] [CrossRef]
- He, D.; Luo, Y.; Zhu, B. Feedstock and pyrolysis temperature influence biochar properties and its interactions with soil substances: Insights from a DFT calculation. Sci. Total Environ. 2024, 922, 171259. [Google Scholar] [CrossRef] [PubMed]
- Greco, G.; Videgain, M.; Di Stasi, C.; Pires, E.; Manyà, J.J. Importance of pyrolysis temperature and pressure in the concentration of polycyclic aromatic hydrocarbons in wood waste-derived biochars. J. Anal. Appl. Pyrolysis 2021, 159, 105337. [Google Scholar] [CrossRef]
- Alharbi, H.A.; Alotaibi, K.D.; El-Saeid, M.H.; Giesy, J.P. Polycyclic aromatic hydrocarbons (PAHs) and metals in diverse biochar products: Effect of feedstock type and pyrolysis temperature. Toxics 2023, 11, 96. [Google Scholar] [CrossRef] [PubMed]
- International Biochar Initiative. Standardized Product Definition and Product Testing Guidelines for Biochar That Is Used in Soil; International Biochar Initiative, 2015. [Google Scholar]
- Patel, M.R.; Panwar, N.L. Development, process optimization and assessment of sustainable mobile biochar kiln for agricultural use. J. Clean. Prod. 2024, 477, 143866. [Google Scholar] [CrossRef]
- Maziarka, P.; Kienzl, N.; Dieguez-Alonso, A.; Fierro, V.; Celzard, A.; Arauzo, P.J.; Hedin, N.; Prins, W.; Anca-Couce, A.; Manyà, J.J.; et al. Part 1─ Impact of pyrolysis temperature and wood particle length on vapor cracking and char porous texture in relation to the tailoring of char properties. Energy Fuels 2024, 38, 9751–9771. [Google Scholar] [CrossRef]
- Xu, C.; Wei, K.; Du, Z.; Ma, W. Effect of particle size on the properties of biomass gasification residue pellets used as a metallurgical-grade silicon reducing agent. Powder Technol. 2024, 435, 119406. [Google Scholar] [CrossRef]
- Bian, H.; Wang, M.; Huang, J.; Liang, R.; Du, J.; Fang, C.; Shen, C.; Man, Y.B.; Wong, M.H.; Shan, S.; et al. Large particle size boosting the engineering application potential of functional biochar in ammonia nitrogen and phosphorus removal from biogas slurry. J. Water Process Eng. 2024, 57, 104640. [Google Scholar] [CrossRef]
- Hu, R.; Li, C.; Hu, X.; Qiao, Y. Varied impacts of volatiles from pyrolysis of poplar wood, bark and leaves on property of coal char. J. Anal. Appl. Pyrolysis 2024, 178, 106389. [Google Scholar] [CrossRef]
- Saleem, M.; Baig, N. Production of bio-oil and bio-char from different biomass wastes. In IOP Conference Series: Materials Science and Engineering; IOP Publishing: Bristol, UK, 2018; Volume 458, p. 12021. [Google Scholar]
- Panizio, R.; Castro, C.; Pacheco, N.; Assis, A.C.; Longo, A.; Vilarinho, C.; Teixeira, J.C.; Brito, P.; Gonçalves, M.; Nobre, C. Investigation of biochars derived from waste lignocellulosic biomass and insulation electric cables: A comprehensive TGA and Macro-TGA analysis. Heliyon 2024, 10, e37882. [Google Scholar] [CrossRef] [PubMed]
- Pei, S.; Zhao, Y.; Li, W.; Qu, C.; Ren, Y.; Yang, Y.; Liu, J.; Wu, C. Critical impact of pyrolysis temperatures on biochars for peroxymonosulfate activation: Structural characteristics, degradation performance and mechanism. Chem. Eng. J. 2023, 477, 147274. [Google Scholar] [CrossRef]
- Kim, D.; Hadigheh, S.A.; Wei, Y. Unlocking biosolid pyrolysis: Towards tailored biochar with different surface properties. Mater. Today Sustain. 2024, 27, 100868. [Google Scholar] [CrossRef]
- Gonnella, G.; Ischia, G.; Fambri, L.; Fiori, L. Thermal analysis and kinetic modeling of pyrolysis and oxidation of hydrochars. Energies 2022, 15, 950. [Google Scholar] [CrossRef]
- Babu, K.K.B.S.; Nataraj, M.; Tayappa, M.; Vyas, Y.; Mishra, R.K.; Acharya, B. Production of biochar from waste biomass using slow pyrolysis: Studies of the effect of pyrolysis temperature and holding time on biochar yield and properties. Mater. Sci. Energy Technol. 2024, 7, 318–334. [Google Scholar] [CrossRef]
- Windeatt, J.H.; Ross, A.B.; Williams, P.T.; Forster, P.M.; Nahil, M.A.; Singh, S. Characteristics of biochars from crop residues: Potential for carbon sequestration and soil amendment. J. Environ. Manag. 2014, 146, 189–197. [Google Scholar] [CrossRef] [PubMed]
- Chen, M.; Sun, Y.; Peng, Y.; Han, Z.; Chen, G.; Chen, X.; Lu, S. Effect of low-carbon coal gangue on the stability and dissolved organic matter characteristics of co-pyrolysis biochar: Insights on pyrolysis temperatures and minerals. Carbon Res. 2025, 4, 19. [Google Scholar] [CrossRef]
- Handiso, B.; Pääkkönen, T.; Wilson, B.P. Effect of pyrolysis temperature on the physical and chemical characteristics of pine wood biochar. Waste Manag. Bull. 2024, 2, 281–287. [Google Scholar] [CrossRef]
- Nicholas, H.L.; Mabbett, I.; Apsey, H.; Robertson, I. Physico-chemical properties of waste derived biochar from community scale faecal sludge treatment plants. Gates Open Res. 2022, 6, 96. [Google Scholar] [CrossRef] [PubMed]
- McCall, M.A.; Watson, J.S.; Sephton, M.A. Predicting Stability of Barley Straw-Derived Biochars Using Fourier Transform Infrared Spectroscopy. ACS Sustain. Resour. Manag. 2024, 1, 1975–1983. [Google Scholar] [CrossRef] [PubMed]
- Matin, N.H.; Aydin, E. Reviewing the effect of pyrolysis temperature on the fourier-transform infrared spectra of biochars. Acta Hortic. Regiotect. 2022, 25, 160–173. [Google Scholar] [CrossRef]
- Zou, X.; Debiagi, P.; Amjed, M.A.; Zhai, M.; Faravelli, T. Impact of high-temperature biomass pyrolysis on biochar formation and composition. J. Anal. Appl. Pyrolysis 2024, 179, 106463. [Google Scholar] [CrossRef]
- Roshan, A.; Ghosh, D.; Maiti, S.K. How temperature affects biochar properties for application in coal mine spoils? A meta-analysis. Carbon Res. 2023, 2, 3. [Google Scholar] [CrossRef]
- Shaaban, A.; Se, S.-M.; Dimin, M.; Juoi, J.M.; Husin, M.H.M.; Mitan, N.M.M. Influence of heating temperature and holding time on biochars derived from rubber wood sawdust via slow pyrolysis. J. Anal. Appl. Pyrolysis 2014, 107, 31–39. [Google Scholar] [CrossRef]
- Świechowski, K.; Matyjewicz, B.; Telega, P.; Białowiec, A. The influence of low-temperature food waste biochars on anaerobic digestion of food waste. Materials 2022, 15, 945. [Google Scholar] [CrossRef] [PubMed]
- Dhar, S.A.; Sakib, T.U.; Hilary, L.N. Effects of pyrolysis temperature on production and physicochemical characterization of biochar derived from coconut fiber biomass through slow pyrolysis process. Biomass Conv. Bioref. 2022, 12, 2631–2647. [Google Scholar] [CrossRef]
- Salinas-Farran, L.; Mosonik, M.C.A.; Jervis, R.; Marathe, S.; Rau, C.; Volpe, R. Tracked evolution of single biochar particle’s morphology during pyrolysis in operando x-ray micro-computed tomography. Biochar 2024, 6, 86. [Google Scholar] [CrossRef]
- Das, O.; Mensah, R.A.; George, G.; Jiang, L.; Xu, Q.; Neisiany, R.E.; Umeki, K.; Tomal Jose, E.; Phounglamcheik, A.; Hedenqvist, M.S.; et al. Flammability and mechanical properties of biochars made in different pyrolysis reactors. Biomass Bioenergy 2021, 152, 106197. [Google Scholar] [CrossRef]
- Clarke, J.; Olea, M. The effect of temperature and treatment regime on the physical, chemical, and biological properties of poultry litter biochar. Reactions 2024, 5, 379–418. [Google Scholar] [CrossRef]
- Ma, X.; Zhou, B.; Budai, A.; Jeng, A.; Hao, X.; Wei, D.; Zhang, Y.; Rasse, D. Study of biochar properties by scanning electron microscope—Energy dispersive X-ray spectroscopy (SEM-EDX). Commun. Soil Sci. Plant Anal. 2016, 47, 593–601. [Google Scholar] [CrossRef]
- Nkomo, N.; Odindo, A.O.; Musazura, W.; Missengue, R. Optimising pyrolysis conditions for high-quality biochar production using black soldier fly larvae faecal-derived residue as feedstock. Heliyon 2021, 7, e07025. [Google Scholar] [CrossRef] [PubMed]
- Suárez-Hernández, L.; Ardila-A., A.N.; Barrera-Zapata, R. Morphological and physicochemical characterization of biochar produced by gasification of selected forestry species. Rev. Fac. Ing. 2017, 26, 123–130. [Google Scholar] [CrossRef]
- Sharma, T.; Ratner, A. Analysis and characterization of metallic nodules on biochar from single-stage downdraft gasification. Processes 2021, 9, 533. [Google Scholar] [CrossRef]
- Grimm, A.; Conrad, S.; Gentili, F.G.; Mikkola, J.-P.; Hu, T.; Lassi, U.; Silva, L.F.; Lima, E.C.; dos Reis, G.S. Highly efficient boron/sulfur-modified activated biochar for removal of reactive dyes from water: Kinetics, isotherms, thermodynamics, and regeneration studies. Colloids Surf. A Physicochem. Eng. Asp. 2025, 713, 136486. [Google Scholar] [CrossRef]
- Makowska, M.; Dziosa, K. Influence of different pyrolysis temperatures on chemical composition and graphite-like structure of biochar produced from biomass of green microalgae Chlorella sp. Environ. Technol. Innov. 2024, 35, 103667. [Google Scholar] [CrossRef]
- Senapati, S.; Giri, J.; Mallick, L.; Singha, D.; Bastia, T.K.; Rath, P.; Rana, M.K.; Panda, A.K. Rapid adsorption of industrial cationic dye pollutant using base-activated rice straw biochar: Performance, isotherm, kinetic and thermodynamic evaluation. Discov. Sustain. 2025, 6, 46. [Google Scholar] [CrossRef]
- Marmiroli, M.; Bonas, U.; Imperiale, D.; Lencioni, G.; Mussi, F.; Marmiroli, N.; Maestri, E. Structural and functional features of chars from different biomasses as potential plant amendments. Front. Plant Sci. 2018, 9, 1119. [Google Scholar] [CrossRef] [PubMed]
- Lin, G.; Wang, Y.; Wu, X.; Meng, J.; Ok, Y.S.; Wang, C.-H. Enhancing agricultural productivity with biochar: Evaluating feedstock and quality standards. Bioresour. Technol. Rep. 2025, 29, 102059. [Google Scholar] [CrossRef]
- Teweldebrihan, M.D.; Dinka, M.O. Methyl red adsorption from aqueous solution using Rumex Abyssinicus-derived biochar: Studies of kinetics and isotherm. Water 2024, 16, 2237. [Google Scholar] [CrossRef]
- Wu, L.; Liu, X.; Lv, G.; Zhu, R.; Tian, L.; Liu, M.; Li, Y.; Rao, W.; Liu, T.; Liao, L. Study on the adsorption properties of methyl orange by natural one-dimensional nano-mineral materials with different structures. Sci. Rep. 2021, 11, 10640. [Google Scholar] [CrossRef] [PubMed]
- Altıkat, A.; Alma, M.H.; Altıkat, A.; Bilgili, M.E.; Altıkat, S. A comprehensive study of biochar yield and quality concerning pyrolysis conditions: A multifaceted approach. Sustainability 2024, 16, 937. [Google Scholar] [CrossRef]
- Conz, R.F.; Abbruzzini, T.F.; de Andrade, C.A.; Milori, D.M.B.P.; Cerri, C.E.P. Effect of pyrolysis temperature and feedstock type on agricultural properties and stability of biochars. Agric. Sci. 2017, 8, 914–933. [Google Scholar] [CrossRef]
- Choudhary, T.K.; Khan, K.S.; Hussain, Q.; Ahmad, M.; Ashfaq, M. Feedstock-induced changes in composition and stability of biochar derived from different agricultural wastes. Arab. J. Geosci. 2019, 12, 1–13. [Google Scholar] [CrossRef]
- Yu, K.L.; Lau, B.F.; Show, P.L.; Ong, H.C.; Ling, T.C.; Chen, W.-H.; Ng, E.P.; Chang, J.-S. Recent developments on algal biochar production and characterization. Bioresour. Technol. 2017, 246, 2–11. [Google Scholar] [CrossRef] [PubMed]
- Rathnayake, N.; Patel, S.; Hakeem, I.G.; Pazferreiro, J.; Sharma, A.; Gupta, R.; Rees, C.; Bergmann, D.; Blackbeard, J.; Surapaneni, A.; et al. Co-pyrolysis of biosolids with lignocellulosic biomass: Effect of feedstock on product yield and composition. Process Saf. Environ. Prot. 2023, 173, 75–87. [Google Scholar] [CrossRef]
- Crombie, K.; Mašek, O.; Sohi, S.P.; Brownsort, P.; Cross, A. The effect of pyrolysis conditions on biochar stability as determined by three methods. GCB Bioenergy 2013, 5, 122–131. [Google Scholar] [CrossRef]
- Chatterjee, R.; Sajjadi, B.; Chen, W.-Y.; Mattern, D.L.; Hammer, N.; Raman, V.; Dorris, A. Effect of pyrolysis temperature on physicochemical properties and acoustic-based amination of biochar for efficient CO2 adsorption. Front. Energy Res. 2020, 8, 85. [Google Scholar] [CrossRef]
- Antonangelo, J.A.; Zhang, H.; Sun, X.; Kumar, A. Physicochemical properties and morphology of biochars as affected by feedstock sources and pyrolysis temperatures. Biochar 2019, 1, 325–336. [Google Scholar] [CrossRef]
- Ferraro, G.; Pecori, G.; Rosi, L.; Bettucci, L.; Fratini, E.; Casini, D.; Rizzo, A.M.; Chiaramonti, D. Biochar from lab-scale pyrolysis: Influence of feedstock and operational temperature. Biomass Conv. Bioref. 2024, 14, 5901–5911. [Google Scholar] [CrossRef]
- Tomczyk, A.; Sokołowska, Z.; Boguta, P. Biochar physicochemical properties: Pyrolysis temperature and feedstock kind effects. Rev. Environ. Sci. Bio/Technol. 2020, 19, 191–215. [Google Scholar] [CrossRef]
- Mukherjee, A.; Patra, B.R.; Podder, J.; Dalai, A.K. Synthesis of biochar from lignocellulosic biomass for diverse industrial applications and energy harvesting: Effects of pyrolysis conditions on the physicochemical properties of biochar. Front. Mater. 2022, 9, 870184. [Google Scholar] [CrossRef]
- Venkatesh, G.; Gopinath, K.A.; Reddy, K.S.; Reddy, B.S.; Prabhakar, M.; Srinivasarao, C.; Kumari, V.V.; Singh, V.K. Characterization of biochar derived from crop residues for soil amendment, carbon sequestration and energy use. Sustainability 2022, 14, 2295. [Google Scholar] [CrossRef]
- Cimò, G.; Kucerik, J.; Berns, A.E.; Schaumann, G.E.; Alonzo, G.; Conte, P. Effect of heating time and temperature on the chemical characteristics of biochar from poultry manure. J. Agric. Food Chem. 2014, 62, 1912–1918. [Google Scholar] [CrossRef] [PubMed]
- Kumar, N.V.; Sawargaonkar, G.; Rani, C.S.; Pasumarthi, R.; Kale, S.; Prakash, T.R.; Triveni, S.; Singh, A.; Davala, M.S.; Khopade, R.; et al. Harnessing the potential of pigeonpea and maize feedstock biochar for carbon sequestration, energy generation, and environmental sustainability. Bioresour. Bioprocess. 2024, 11, 5. [Google Scholar] [CrossRef] [PubMed]
- Mariyam, S.; Alherbawi, M.; Pradhan, S.; Al-Ansari, T.; McKay, G. Biochar yield prediction using response surface methodology: Effect of fixed carbon and pyrolysis operating conditions. Biomass Conv. Bioref. 2024, 14, 28879–28892. [Google Scholar] [CrossRef]
- Ronsse, F.; Van Hecke, S.; Dickinson, D.; Prins, W. Production and characterization of slow pyrolysis biochar: Influence of feedstock type and pyrolysis conditions. GCB Bioenergy 2013, 5, 104–115. [Google Scholar] [CrossRef]
- Patel, S.; Kundu, S.; Halder, P.; Veluswamy, G.; Pramanik, B.; Paz-Ferreiro, J.; Surapaneni, A.; Shah, K. Slow pyrolysis of biosolids in a bubbling fluidised bed reactor using biochar, activated char and lime. J. Anal. Appl. Pyrolysis 2019, 144, 104697. [Google Scholar] [CrossRef]
- Nair, R.R.; Kißling, P.A.; Schaate, A.; Marchanka, A.; Shamsuyeva, M.; Behrens, P.; Weichgrebe, D. The influence of sample mass (scaling effect) on the synthesis and structure of non-graphitizing carbon (biochar) during the analytical pyrolysis of biomass. RSC Adv. 2023, 13, 13526–13539. [Google Scholar] [CrossRef] [PubMed]
- Zhang, K.; Zhang, K.; Li, Y.; Kang, Q.; Wang, Y.; Wang, J.; Yang, K.; Mao, J. Easily Pyrolyzable Biomass Components Significantly Affect the Physicochemical Properties and Water-Holding Capacity of the Pyrolyzed Biochar. Agriculture 2023, 13, 2053. [Google Scholar] [CrossRef]
- Xiong, Z.; Huanhuan, Z.; Jing, W.; Wei, C.; Yingquan, C.; Gao, X.; Haiping, Y.; Hanping, C. Physicochemical and adsorption properties of biochar from biomass-based pyrolytic polygeneration: Effects of biomass species and temperature. Biochar 2021, 3, 657–670. [Google Scholar] [CrossRef]
- Kalina, M.; Sovova, S.; Svec, J.; Trudicova, M.; Hajzler, J.; Kubikova, L.; Enev, V. The effect of pyrolysis temperature and the source biomass on the properties of biochar produced for the agronomical applications as the soil conditioner. Materials 2022, 15, 8855. [Google Scholar] [CrossRef] [PubMed]
- Aichour, A.; Zaghouane-Boudiaf, H.; Khodja, H.D. Highly removal of anionic dye from aqueous medium using a promising biochar derived from date palm petioles: Characterization, adsorption properties and reuse studies. Arab. J. Chem. 2022, 15, 103542. [Google Scholar] [CrossRef]
- Muema, F.M.; Richardson, Y.; Keita, A.; Sawadogo, M. An interdisciplinary overview on biochar production engineering and its agronomic applications. Biomass Bioenergy 2024, 190, 107416. [Google Scholar] [CrossRef]
- Ghani, U.; Jiang, W.; Hina, K.; Idrees, A.; Iqbal, M.; Ibrahim, M.; Saeed, R.; Irshad, M.K.; Aslam, I. Adsorption of methyl orange and Cr (VI) onto poultry manure-derived biochar from aqueous solution. Front. Environ. Sci. 2022, 10, 887425. [Google Scholar] [CrossRef]
- Islam, M.S.; Roy, H.; Afrose, S. Phosphoric acid surface modified Moringa oleifera leaves biochar for the sequestration of methyl orange from aqueous solution: Characterizations, isotherm, and kinetics analysis. Remediat. J. 2022, 32, 281–298. [Google Scholar] [CrossRef]
- Loc, N.X.; Tuyen, P.T.T.; Mai, L.C.; Phuong, D.T.M. Chitosan-modified biochar and unmodified biochar for methyl orange: Adsorption characteristics and mechanism exploration. Toxics 2022, 10, 500. [Google Scholar] [CrossRef] [PubMed]
- Chen, G.; Yin, Y.; Zhang, X.; Qian, A.; Pan, X.; Liu, F.; Li, R. Enhanced Adsorption of Methyl Orange from Aqueous Phase Using Chitosan–Palmer Amaranth Biochar Composite Microspheres. Molecules 2024, 29, 1836. [Google Scholar] [CrossRef] [PubMed]
- Akl, M.A.; Serage, A.A. Chitosan impregnated sugarcane bagasse biochar for removal of anionic dyes from wastewater. Sci. Rep. 2024, 14, 27097. [Google Scholar] [CrossRef] [PubMed]
- Lu, Y.; Chen, J.; Bai, Y.; Gao, J.; Peng, M. Adsorption properties of methyl orange in water by sheep manure biochar. Pol. J. Environ. Stud. 2019, 28, 3791–3797. [Google Scholar] [CrossRef]
- Nizam, N.U.M.; Hanafiah, M.M.; Mahmoudi, E.; Halim, A.A.; Mohammad, A.W. The removal of anionic and cationic dyes from an aqueous solution using biomass-based activated carbon. Sci. Rep. 2021, 11, 1–17. [Google Scholar] [CrossRef] [PubMed]
- Praveen, S.; Jegan, J.; Pushpa, T.B.; Gokulan, R.; Bulgariu, L. Biochar for removal of dyes in contaminated water: An overview. Biochar 2022, 4, 10. [Google Scholar] [CrossRef]
- Bassareh, H.; Karamzadeh, M.; Movahedirad, S. Synthesis and characterization of cost-effective and high-efficiency biochar for the adsorption of Pb2+ from wastewater. Sci. Rep. 2023, 13, 15608. [Google Scholar] [CrossRef] [PubMed]
- Jameel, R.; Lashari, S.; Sharif, M.N.; Javaid, S.; Alam, K.; Mahmood, F.; Ahmad, W.; Kokab, A. Effective Sequestration of Acid Orange-7 Dye from Wastewater by using Ricinus Communis Biochar along with Zinc Oxide Nanocomposites. Indus J. Biosci. Res. 2024, 2, 1214–1222. [Google Scholar] [CrossRef]
- Eleryan, A.; Güner, E.K.; Hassaan, M.; El-Nemr, M.A.; Ragab, S.; El Nemr, A. Mandarin biochar-CO-TETA was utilized for Acid Red 73 dye adsorption from water, and its isotherm and kinetic studies were investigated. Sci. Rep. 2024, 14, 13021. [Google Scholar] [CrossRef] [PubMed]
- Eleryan, A.; Hassaan, M.; Nazir, M.A.; Shah, S.S.A.; Ragab, S.; El Nemr, A. Isothermal and kinetic screening of methyl red and methyl orange dyes adsorption from water by Delonix regia biochar-sulfur oxide (DRB-SO). Sci. Rep. 2024, 14, 13585. [Google Scholar] [CrossRef] [PubMed]
- Nirmaladevi, S.; Palanisamy, N. A comparative study of the removal of cationic and anionic dyes from aqueous solutions using biochar as an adsorbent. Desalination Water Treat. 2020, 175, 282–292. [Google Scholar] [CrossRef]
- Kaya, N.; Uzun, Z.Y.; Altuncan, C.; Uzun, H. Adsorption of Congo red from aqueous solution onto KOH-activated biochar produced via pyrolysis of pine cone and modeling of the process using artificial neural network. Biomass Conv. Bioref. 2022, 12, 5293–5315. [Google Scholar] [CrossRef]
- Priyanka; Vashisht, D.; Ibhadon, A.O.; Mehta, S.K.; Taylor, M.J. Enhanced wastewater remediation using mesoporous activated wheat straw biochars: A dye removal perspective. ACS Sustain. Resour. Manag. 2024, 1, 355–367. [Google Scholar] [CrossRef]
- Jadhav, S.K.; Thorat, S.R. Adsorption of azo dyes using biochar prepared from regional crop waste material. Biosci. Biotechnol. Res. Asia 2022, 19, 141–151. [Google Scholar] [CrossRef]
- Güleç, F.; Williams, O.; Kostas, E.T.; Samson, A.; Stevens, L.A.; Lester, E. A comprehensive comparative study on methylene blue removal from aqueous solution using biochars produced from rapeseed, whitewood, and seaweed via different thermal conversion technologies. Fuel 2022, 330, 125428. [Google Scholar] [CrossRef]
- Agboola, O.D.; Benson, N.U. Physisorption and chemisorption mechanisms influencing micro (nano) plastics-organic chemical contaminants interactions: A review. Front. Environ. Sci. 2021, 9, 678574. [Google Scholar] [CrossRef]
- Wang, J.; Guo, X. Adsorption isotherm models: Classification, physical meaning, application and solving method. Chemosphere 2020, 258, 127279. [Google Scholar] [CrossRef] [PubMed]
- Mahajan, T.; Paikaray, S.; Mahajan, P. Applicability of the equilibrium adsorption isotherms and the statistical tools on to them: A case study for the adsorption of fluoride onto Mg-Fe-CO3 LDH. J. Phys. Conf. Ser. 2023, 2603, 12056. [Google Scholar] [CrossRef]
- Acharya, A.; Jeppu, G.; Girish, C.R.; Prabhu, B.; Murty, V.R.; Martis, A.S.; Ramesh, S. Adsorption of arsenic and fluoride: Modeling of single and competitive adsorption systems. Heliyon 2024, 10, e31967. [Google Scholar] [CrossRef] [PubMed]
- Hou, Y.; Liang, Y.; Hu, H.; Tao, Y.; Zhou, J.; Cai, J. Facile preparation of multi-porous biochar from lotus biomass for methyl orange removal: Kinetics, isotherms, and regeneration studies. Bioresour. Technol. 2021, 329, 124877. [Google Scholar] [CrossRef] [PubMed]
- Meroufel, B.; Benali, O.; Benyahia, M.; Benmoussa, Y.; Zenasni, M.A. Adsorptive removal of anionic dye from aqueous solutions by Algerian kaolin: Characteristics, isotherm, kinetic and thermodynamic studies. J. Mater. Environ. Sci. 2013, 4, 482–491. [Google Scholar]
- Raza, A.; Mahmoud, M.; Alafnan, S.; Arif, M.; Kirmani, F.U.D.; Kamal, M.S.; Murtaza, M.; Rana, A. Role of high-density brines in reservoir development stages: A review. Energy Geosci. 2024, 5, 100304. [Google Scholar] [CrossRef]
- Tcheka, C.; Conradie, M.M.; Assinale, V.A.; Conradie, J. Mesoporous biochar derived from Egyptian doum palm (Hyphaene thebaica) shells as low-cost and biodegradable adsorbent for the removal of methyl orange dye: Characterization, kinetic and adsorption mechanism. Chem. Phys. Impact 2024, 8, 100446. [Google Scholar] [CrossRef]
- Hassaan, M.A.; Yılmaz, M.; Helal, M.; El-Nemr, M.A.; Ragab, S.; El Nemr, A. Isotherm and kinetic investigations of sawdust-based biochar modified by ammonia to remove methylene blue from water. Sci. Rep. 2023, 13, 12724. [Google Scholar] [CrossRef] [PubMed]
- Wei, X.; Miao, J.; Lv, Z.; Wan, X.; Zhang, N.; Zhang, R.; Peng, S. Phosphate adsorption onto an Al-Ti bimetal oxide composite in neutral aqueous solution: Performance and thermodynamics. Appl. Sci. 2022, 12, 2309. [Google Scholar] [CrossRef]
- Guo, X.; Liu, A.; Lu, J.; Niu, X.; Jiang, M.; Ma, Y.; Liu, X.; Li, M. Adsorption mechanism of hexavalent chromium on biochar: Kinetic, thermodynamic, and characterization studies. ACS Omega 2020, 5, 27323–27331. [Google Scholar] [CrossRef] [PubMed]
- Abdu, M.; Babaee, S.; Worku, A.; Msagati, T.A.M.; Nure, J.F. The development of Giant reed biochar for adsorption of Basic Blue 41 and Eriochrome Black T. azo dyes from wastewater. Sci. Rep. 2024, 14, 18320. [Google Scholar] [CrossRef] [PubMed]
- Van Hien, N.; Valsami-Jones, E.; Vinh, N.C.; Phu, T.T.; Tam, N.T.T.; Lynch, I. Effectiveness of different biochar in aqueous zinc removal: Correlation with physicochemical characteristics. Bioresour. Technol. Rep. 2020, 11, 100466. [Google Scholar] [CrossRef]
- Shafiq, M.; Alazba, A.A.; Amin, M.T. Kinetic and isotherm studies of Ni2+ and Pb2+ adsorption from synthetic wastewater using Eucalyptus camdulensis—Derived biochar. Sustainability 2021, 13, 3785. [Google Scholar] [CrossRef]
- Daffalla, S.; Da’na, E.; Taha, A.; El-Aassar, M.R. Synthesis of a Novel Magnetic Biochar from Lemon Peels via Impregnation-Pyrolysis for the Removal of Methyl Orange from Wastewater. Magnetochemistry 2024, 10, 95. [Google Scholar] [CrossRef]
- Wang, Z.; Li, J.; Liu, G.; Li, C. Biochar obtained from alkaline earth metal-treated mushroom residue: Thermal behavior and methyl orange adsorption capability. J. Environ. Manag. 2024, 351, 119669. [Google Scholar] [CrossRef] [PubMed]
- Maiti, P.; Mangsatabam, M.; Chatterjee, A.; Siddiqi, H.; Mishra, A.; Meikap, B.C. In-situ synthesis of efficient ZnCl2 doped pyrolyzed biochar for adsorptive remediation of organic dyes: Performance evaluation, mass transfer and mechanism. Sep. Purif. Technol. 2024, 329, 125096. [Google Scholar] [CrossRef]
- Diaz-Uribe, C.; Ortiz, J.; Duran, F.; Vallejo, W.; Fals, J. Methyl Orange Adsorption on Biochar Obtained from Prosopis juliflora Waste: Thermodynamic and Kinetic Study. ChemEngineering 2023, 7, 114. [Google Scholar] [CrossRef]
- Lingamdinne, L.P.; Angaru, G.K.R.; Pal, C.A.; Koduru, J.R.; Karri, R.R.; Mubarak, N.M.; Chang, Y.-Y. Insights into kinetics, thermodynamics, and mechanisms of chemically activated sunflower stem biochar for removal of phenol and bisphenol-A from wastewater. Sci. Rep. 2024, 14, 4267. [Google Scholar] [CrossRef] [PubMed]
- Jain, M.; Khan, S.A.; Sahoo, A.; Dubey, P.; Pant, K.K.; Ziora, Z.M.; Blaskovich, M.A. Statistical evaluation of cow-dung derived activated biochar for phenol adsorption: Adsorption isotherms, kinetics, and thermodynamic studies. Bioresour. Technol. 2022, 352, 127030. [Google Scholar] [CrossRef] [PubMed]
- Hanoon, M.A.; Ahmed, M.J. Adsorption of methyl orange from wastewater by using biochar. Iraqi J. Chem. Pet. Eng. 2019, 20, 23–29. [Google Scholar] [CrossRef]
- Azim, E.A.; Samy, M.; Hanafy, M.; Mahanna, H. Novel mint-stalks derived biochar for the adsorption of methylene blue dye: Effect of operating parameters, adsorption mechanism, kinetics, isotherms, and thermodynamics. J. Environ. Manag. 2024, 357, 120738. [Google Scholar] [CrossRef] [PubMed]
- Ding, W.; Habineza, A.; Zeng, X.; Yan, Z.; Yan, J.; Yang, G. Adsorption of Methylene blue and Methyl orange on nano zero-valent iron (nZVI) coated biochar: Column adsorption experiments. Desalination Water Treat. 2022, 260, 169–178. [Google Scholar] [CrossRef]
- Shi, Y.-Y.; Shan, R.; Yuan, H.-R. Effects and mechanisms of methyl orange removal from aqueous solutions by modified rice shell biochar. Huan Jing Ke Xue Huanjing Kexue 2019, 40, 2783–2792. [Google Scholar] [PubMed]
- Zubair, M.; Mu’azu, N.D.; Jarrah, N.; Blaisi, N.I.; Aziz, H.A.; Al-Harthi, M.A. Adsorption behavior and mechanism of methylene blue, crystal violet, eriochrome black T, and methyl orange dyes onto biochar-derived date palm fronds waste produced at different pyrolysis conditions. Water Air Soil Pollut. 2020, 231, 1–19. [Google Scholar] [CrossRef]
- Aladeokin, O.; Fletcher, A. A novel activated carbon material from peanut shells for the removal of methyl orange and methylene blue dyes from wastewater: Kinetics, isotherms and mechanism. Adsorpt. Sci. Technol. 2024, 42, 02636174241256843. [Google Scholar] [CrossRef]


| Coded Independent Variable | Actual Independent Variable | Coded and Actual Values for the Five Levels | ||||
|---|---|---|---|---|---|---|
| −α (Lowest) | −1 (Low) | 0 (Mid-Point) | 1 (High) | α (Highest) | ||
| A | Pyrolysis temperature (°C) | 400 | 500 | 600 | 700 | 800 |
| B | BRT (min) | 30 | 45 | 60 | 75 | 90 |
| C | Mass of feedstock (g) | 50 | 100 | 150 | 200 | 250 |
| Run | Independent Variables for RSM | Elemental Parameters | Porosity | Biochar Output | Proximate Parameters | Thermal and Chemical Stability Indices | ||||||||||||
|---|---|---|---|---|---|---|---|---|---|---|---|---|---|---|---|---|---|---|
| TGA | Van-Krevelen | Carbon Strength | ||||||||||||||||
| A: Temperature (°C) | B: BRT (min) | C: Mass of Feedstock (g) | N (wt%) | C (wt%) | H (wt%) | S (wt%) | O (wt%) | BET Surface Area (m2/g) | Micropore Volume (cm3/g) | Yield (%) | VC (wt%DB) | FC (wt%DB) | Ash (wt%DB) | R50 | H/C | O/C | TSF (%) | |
| CRD wood | N.A | N.A | N.A | 0.990 | 49.880 | 6.123 | 0.101 | 41.736 | N.A | N.A | N.A | 83.480 | 15.350 | 1.170 | 0.391 | 1.473 | 0.628 | 15.534 |
| 1 (B400) | 400 | 60 | 100 | 0.780 | 65.320 | 4.293 | 0.442 | 26.145 | 4.238 | 0.002 | 57.800 | 26.384 | 70.596 | 3.020 | 0.513 | 0.789 | 0.300 | 73.271 |
| 2 | 600 | 90 | 200 | 0.670 | 86.180 | 2.193 | 0.210 | 7.417 | 308.703 | 0.139 | 21.800 | 15.748 | 80.922 | 3.330 | 0.570 | 0.305 | 0.065 | 86.061 |
| 3 | 600 | 30 | 200 | 1.070 | 83.660 | 2.329 | 0.213 | 6.288 | 309.032 | 0.132 | 20.700 | 17.427 | 76.133 | 6.440 | 0.568 | 0.334 | 0.056 | 80.501 |
| 4 (B500) | 500 | 75 | 200 | 0.630 | 79.430 | 2.933 | 0.177 | 13.110 | 195.278 | 0.095 | 26.900 | 25.837 | 70.443 | 3.720 | 0.544 | 0.443 | 0.124 | 73.169 |
| 5 | 600 | 60 | 100 | 0.910 | 82.370 | 2.391 | 0.241 | 8.578 | 255.854 | 0.123 | 21.300 | 18.473 | 76.017 | 5.510 | 0.603 | 0.348 | 0.078 | 80.132 |
| 6 | 500 | 75 | 150 | 0.870 | 78.340 | 2.910 | 0.180 | 13.840 | 179.077 | 0.090 | 26.400 | 24.312 | 71.828 | 3.860 | 0.561 | 0.446 | 0.132 | 74.783 |
| 7 | 500 | 90 | 150 | 0.720 | 77.600 | 2.746 | 0.218 | 12.546 | 260.562 | 0.114 | 26.500 | 24.247 | 69.583 | 6.170 | 0.545 | 0.425 | 0.121 | 72.452 |
| 8 | 600 | 45 | 50 | 0.700 | 86.720 | 2.034 | 0.123 | 5.613 | 334.887 | 0.149 | 19.200 | 14.132 | 81.058 | 4.810 | 0.632 | 0.281 | 0.049 | 86.794 |
| 9 | 700 | 90 | 200 | 0.940 | 88.760 | 1.379 | 0.205 | 4.026 | 315.809 | 0.148 | 23.300 | 12.151 | 83.159 | 4.690 | 0.587 | 0.186 | 0.034 | 90.002 |
| 10 (B800) | 800 | 75 | 200 | 0.890 | 91.740 | 0.870 | 0.168 | 2.232 | 299.554 | 0.146 | 21.100 | 9.169 | 86.731 | 4.100 | 0.647 | 0.114 | 0.018 | 96.191 |
| 11 (B700) | 700 | 75 | 200 | 0.950 | 88.340 | 1.413 | 0.253 | 2.914 | 293.195 | 0.138 | 23.600 | 11.640 | 82.230 | 6.130 | 0.588 | 0.192 | 0.025 | 89.295 |
| 12 | 500 | 90 | 250 | 0.510 | 82.000 | 2.825 | 0.151 | 11.344 | 229.033 | 0.108 | 26.600 | 23.857 | 72.973 | 3.170 | 0.546 | 0.413 | 0.104 | 76.032 |
| 13 (B600) | 600 | 90 | 250 | 0.430 | 87.510 | 2.209 | 0.123 | 6.168 | 323.776 | 0.145 | 21.900 | 15.037 | 81.403 | 3.560 | 0.577 | 0.303 | 0.053 | 86.817 |
| 14 | 700 | 45 | 150 | 1.630 | 85.880 | 1.352 | 0.332 | 2.136 | 217.947 | 0.118 | 25.200 | 13.903 | 77.427 | 8.670 | 0.638 | 0.189 | 0.019 | 82.996 |
| 15 | 400 | 90 | 200 | 1.000 | 73.770 | 3.351 | 0.151 | 17.598 | 4.034 | 0.002 | 31.200 | 32.542 | 63.328 | 4.130 | 0.534 | 0.545 | 0.179 | 65.274 |
| 16 | 600 | 60 | 150 | 1.140 | 72.180 | 1.786 | 0.215 | 2.649 | 247.457 | 0.112 | 25.600 | 22.723 | 55.247 | 22.030 | 0.647 | 0.297 | 0.028 | 57.678 |
| Response Variable | A | B | C | AB | AC | BC | A2 | B2 | C2 | Intercept | Model Type | Fit (R2) | Lack of Fit |
|---|---|---|---|---|---|---|---|---|---|---|---|---|---|
| BET surface area (m2/g) | 84.6827 | 57.4696 | −23.4390 | 4.2486 | −12.0859 | −125.5880 | −46.6398 | 10.6473 | 209.0550 | 230.5000 | Quadratic | 0.9724 | Insignificant |
| p-value | 0.0010 | 0.0194 | 0.3150 | 0.8474 | 0.7916 | 0.0230 | 0.0034 | 0.2764 | 0.0119 | ||||
| Micropore volume (cm3/g) | 0.0425 | 0.0240 | −0.0086 | −0.0006 | −0.0061 | −0.0478 | −0.0203 | 0.0016 | 0.0806 | 0.1130 | Quadratic | 0.9753 | Insignificant |
| p-value | 0.0004 | 0.0214 | 0.3844 | 0.9532 | 0.7546 | 0.0358 | 0.0031 | 0.6873 | 0.0184 | ||||
| H/C | −0.2017 | −0.0224 | 0.0303 | −0.0075 | 0.1497 | 0.0153 | 0.3136 | Two-factor interaction | 0.9769 | Insignificant | |||
| p-value | <0.0001 | 0.1099 | 0.1850 | 0.7145 | 0.0038 | 0.4522 | |||||||
| O/C | −0.0829 | −0.0040 | 0.0121 | −0.0162 | 0.1069 | 0.0112 | 0.0613 | Two-factor interaction | 0.9326 | Insignificant | |||
| p-value | <0.0001 | 0.6894 | 0.4763 | 0.3198 | 0.0059 | 0.4779 |
| Sample | Al | Ba | Ca | Cd | Co | Cr | Cu | Fe | K | Mg | Mn | Mo | Na | Ni | Pb | V | Zn | Total | AAEM | AAEM |
|---|---|---|---|---|---|---|---|---|---|---|---|---|---|---|---|---|---|---|---|---|
| mg/kg | mg/kg | mg/kg | mg/kg | mg/kg | mg/kg | mg/kg | mg/kg | mg/kg | mg/kg | mg/kg | mg/kg | mg/kg | mg/kg | mg/kg | mg/kg | mg/kg | mg/kg | mg/kg | % | |
| CRD wood | 12,043 | 1165 | 149,284 | 2 | 69 | 86 | 613 | 16,086 | 38,043 | 17,566 | 5587 | 24 | 37,685 | 5 | 561 | 21 | 1389 | 280,229 | 243,742 | 86.98 |
| B400 | 7707 | 1949 | 163,961 | 2 | 58 | 79 | 5777 | 15,546 | 49,507 | 17,794 | 6799 | 21 | 37,901 | 41 | 381 | 17 | 1484 | 309,026 | 271,113 | 87.73 |
| B500 | 4273 | 1554 | 143,017 | 4 | 57 | 112 | 300 | 8861 | 36,641 | 15,503 | 7649 | <2 | 44,478 | 17 | 450 | 11 | 1924 | 264,852 | 241,194 | 91.07 |
| B600 | 3505 | 1834 | 165,480 | 11 | 51 | 179 | 237 | 11,898 | 68,529 | 20,299 | 7576 | <2 | 41,471 | 92 | 296 | 13 | 1038 | 322,507 | 297,612 | 92.28 |
| B700 | 8856 | 1900 | 161,627 | 9 | 39 | 179 | 231 | 10,387 | 38,942 | 15,529 | 3883 | 11 | 23,800 | 104 | 210 | 24 | 1316 | 268,940 | 241,797 | 89.91 |
| B800 | 9680 | 3889 | 167,379 | 14 | 60 | 318 | 2297 | 16,699 | 44,660 | 20,019 | 8303 | 19 | 26,990 | 82 | 225 | 27 | 76 | 300,738 | 262,938 | 87.43 |
| IBI (low) | 0.3 | 15 | 40 | 10 | 10 | 10 | 150 | |||||||||||||
| IBI (high) | 39 | 1200 | 6000 | 75 | 600 | 500 | 7400 |
| Sample | N (wt%) | C (wt%) | H (wt%) | S (wt%) | Ash (wt%DB) | O (wt%) | H/C | O/C | VC (wt%DB) | FC (wt%DB) | TSF (%) | Yield (%) |
|---|---|---|---|---|---|---|---|---|---|---|---|---|
| B400 | 0.650 | 78.380 | 2.887 | 0.184 | 2.640 | 15.259 | 0.442 | 0.146 | 26.739 | 70.621 | 72.536 | 37.700 |
| B500 | 0.380 | 80.580 | 2.489 | 0.089 | 4.120 | 12.342 | 0.371 | 0.115 | 23.451 | 72.429 | 75.541 | 32.100 |
| B600 | 1.150 | 81.690 | 2.410 | 0.372 | 4.050 | 10.328 | 0.354 | 0.095 | 17.992 | 77.958 | 81.249 | 29.500 |
| B700 | 0.580 | 83.790 | 2.149 | 0.114 | 5.970 | 7.397 | 0.308 | 0.066 | 14.858 | 79.172 | 84.199 | 27.900 |
| B800 | 0.740 | 85.610 | 2.042 | 0.133 | 5.820 | 5.655 | 0.286 | 0.050 | 12.613 | 81.567 | 86.608 | 26.200 |
| Average | Langmuir Isotherm | Freundlich Isotherm | Temkin Isotherm | ||||||||||
|---|---|---|---|---|---|---|---|---|---|---|---|---|---|
| qe,exp (mg/g) | qm (mg/g) | qe,cal (mg/g) | KL (L/mg) | RL | R2 | KF [(mg/g)(L/mg)1/n] | 1/n | qe,cal (mg/g) | R2 | B (J/mol) | KT (L/mg) | qe,cal (mg/g) | R2 |
| 5.52 | 5.00 | 3.56 | 3.33 | 0.002–0.036 from 164–8 mg/L | 0.94 | 2.92 | 0.50 | 5.15 | 0.97 | 2.25 | 8.79 | 5.52 | 0.59 |
| Dye Concentration | Pseudo-First-Order Kinetics | Pseudo-Second-Order Kinetics | Intra-Particle Diffusion Kinetics | ||||||
|---|---|---|---|---|---|---|---|---|---|
| qe (mg/g) | k1 (min−1) | R2 | qe (mg/g) | k2 (g/mg.min) | R2 | k3 (mg/g.min1/2) | C (mg/g) | R2 | |
| Linear fitting with linear regression | |||||||||
| 8 ppm | 0.194 | 0.004 | 0.978 | 0.748 | 0.158 | 1.000 | 0.010 | 0.583 | 0.983 |
| 164 ppm | 2.752 | 0.012 | 0.951 | 14.872 | 0.010 | 1.000 | 0.214 | 11.473 | 0.772 |
| Non-linear fitting with non-linear regression | |||||||||
| 8 ppm | 0.700 | 0.059 | 0.495 | 0.726 | 0.254 | 0.879 | 0.010 | 0.583 | 0.983 |
| 164 ppm | 14.107 | 0.056 | 0.517 | 14.716 | 0.011 | 0.890 | 0.214 | 11.473 | 0.772 |
| Kinetic Model | Co (ppm) | Average qe,exp (mg/g) | qe,cal (mg/g) | RMSE |
|---|---|---|---|---|
| Linear fitting with linear regression | ||||
| Pseudo-first-order | 8 | 0.812 | 0.194 | 0.234 |
| Pseudo-first-order | 164 | 14.630 | 2.752 | 4.489 |
| Pseudo-second-order | 8 | 0.812 | 0.748 | 0.024 |
| Pseudo-second-order | 164 | 14.630 | 14.872 | 0.091 |
| Intra-particle diffusion | 8 | 0.812 | 0.583 | 0.087 |
| Intra-particle diffusion | 164 | 14.630 | 11.473 | 1.193 |
| Non-linear fitting with non-linear regression | ||||
| Pseudo-first-order | 8 | 0.812 | 0.700 | 0.042 |
| Pseudo-first-order | 164 | 14.630 | 14.107 | 0.198 |
| Pseudo-second-order | 8 | 0.812 | 0.726 | 0.033 |
| Pseudo-second-order | 164 | 14.630 | 14.716 | 0.033 |
| Intra-particle diffusion | 8 | 0.812 | 0.583 | 0.087 |
| Intra-particle diffusion | 164 | 14.630 | 11.473 | 1.193 |
| Enthalpy | Entropy | Gibbs Free Energy | ||
|---|---|---|---|---|
| ΔH (KJ/mol) | ΔS (KJ/mol.K) | Temperature (K) | ΔG (KJ/mol) = ΔH-TΔS | ΔG (KJ/mol) = −RTlnkd |
| 144.153 | 0.460 | 293 | 9.419 | 8.376 |
| 303 | 4.823 | 5.437 | ||
| 313 | 0.227 | 2.488 | ||
| 323 | −4.369 | −6.207 | ||
Disclaimer/Publisher’s Note: The statements, opinions and data contained in all publications are solely those of the individual author(s) and contributor(s) and not of MDPI and/or the editor(s). MDPI and/or the editor(s) disclaim responsibility for any injury to people or property resulting from any ideas, methods, instructions or products referred to in the content. |
© 2025 by the authors. Licensee MDPI, Basel, Switzerland. This article is an open access article distributed under the terms and conditions of the Creative Commons Attribution (CC BY) license (https://creativecommons.org/licenses/by/4.0/).
Share and Cite
Ganesan, A.; Barnabé, S.; Bareha, Y.; Langlois, S.; Rezazgui, O.; Boussabbeh, C. Turning Construction, Renovation, and Demolition (CRD) Wood Waste into Biochar: A Scalable and Sustainable Solution for Energy and Environmental Applications. Energies 2025, 18, 3902. https://doi.org/10.3390/en18153902
Ganesan A, Barnabé S, Bareha Y, Langlois S, Rezazgui O, Boussabbeh C. Turning Construction, Renovation, and Demolition (CRD) Wood Waste into Biochar: A Scalable and Sustainable Solution for Energy and Environmental Applications. Energies. 2025; 18(15):3902. https://doi.org/10.3390/en18153902
Chicago/Turabian StyleGanesan, Aravind, Simon Barnabé, Younès Bareha, Simon Langlois, Olivier Rezazgui, and Cyrine Boussabbeh. 2025. "Turning Construction, Renovation, and Demolition (CRD) Wood Waste into Biochar: A Scalable and Sustainable Solution for Energy and Environmental Applications" Energies 18, no. 15: 3902. https://doi.org/10.3390/en18153902
APA StyleGanesan, A., Barnabé, S., Bareha, Y., Langlois, S., Rezazgui, O., & Boussabbeh, C. (2025). Turning Construction, Renovation, and Demolition (CRD) Wood Waste into Biochar: A Scalable and Sustainable Solution for Energy and Environmental Applications. Energies, 18(15), 3902. https://doi.org/10.3390/en18153902